12
1 ACADEMIC LEARNING COMPACTS (ALCS) Program of Accountancy - AY2016-17

1
ACADEMIC LEARNING COMPACTS (ALCS)
Program of Accountancy - AY2016-17

2
Program of Accountancy - AY2016-17
Academic Learning Compacts, Updates: AY 2016/2017
“… to ensure student achievement in undergraduate and graduate degree programs …”
Academic Program: PROGRAM OF ACCOUNTANCY UNDERGRADUATE LEARNING GOALS Person Responsible: GROVER KEARNS
Mission of POA: To provide an accounting education that prepares ethical and competent professionals for a diverse environment through classroom and interactive learning experiences, research, and service within a global economy. We strive to serve non-traditional and residential students and to continually enhance the quality of the program through faculty education, research and liaisons with external stakeholders.
These are the Discipline Specific Learning Goals for the Program of Accountancy, Kate Tiedemann College of Business AY 2016/2017
Content/Discipline Skills
Goals/Objectives
Means of Assessment/ Corroborating Evidence
Criteria for Success
Findings
Plan for Use of Findings in AY 2017/2018
Learning Goal: Students completing the bachelor’s degree majoring in Accounting will understand and be able to prepare operating budgets.
ACG 3341: Cost I (P. Gaukel). Fifteen multiple-choice exam questions on operational budgeting are used for the assessment. These are questions 1 through 14 and 34 on exam 2. The questions
Students will attain an average score of 70% on exam questions related to the assessment.
The average score on the multiple choice questions was 86.67%, indicating a strong understanding of this topic. There were no questions with a score of lower than 70%.
The overall scores and individual scores per question were very good; we will continue the current teaching techniques. It should be noted that based on the results from last year’s assessment (2016) we

3
include theory related questions related to operational budgeting as well as computations for revenues, cost of sales, direct materials, direct labor and manufacturing overhead, as well as variable costs/fixed costs.
reworded one question on the exam; results improved significantly from 33% to 70%. Additionally, we now include a more robust review of budgets before the exam. Both of these initiatives helped improve the scores to the current high levels.
Learning Goal: Students completing the bachelor’s degree majoring in Accounting will understand and be able to compute standard cost variances.
ACG 3341: Cost I. (P. Gaukel) Nineteen multiple-choice exam questions on standard costing variances are used for the assessment. These are questions 15 through 33 on exam 2. The questions include theory related questions related to standard cost variances as well as computations for flexible budget, price, efficiency and production volume variances.
Students will attain an average score of 70% on exam questions related to the assessment. Students will demonstrate that they are able to understand and can compute standard cost variances.
The average score on the multiple choice questions was 83.16%, indicating a strong understanding of this topic. Only one question scored low; question 33 scored 50%. This was a theory related variable cost question.
As a result of last year’s assessment (see 2016 2D) we emphasized overhead variances. Additional emphasis included a comprehensive review before the exam as well as more time in the classroom. The scores in this area rose significantly (questions 24 through 33).
Learning Goal: Students completing the bachelor’s degree majoring in Accounting
ACG 3401: Accounting Information Systems. (G. Kearns) Students will demonstrate that they are able to
Students will attain an average grade of least 70% on exam questions related to this assessment.
Student responses to the three questions were 1 – 83%, 2- 81%, and 3 – 89%.
Because performance was very high on this metric, a new metric will be chosen. DFDs are an integral part of

4
will be able to interpret IT documentation tools.
understand and interpret a data flow diagram. Three short answer questions regarding a DFD diagram for Sales Order Entry System.
documentation so it would be worthwhile adopting a new and more extensive measure of student comprehension.
Learning Goal: Our students will demonstrate the use of innovative and critical thinking decision-making skills in solving business decisions.
ACG 4642: Audit II. (C. Pacini) Students will demonstrate the ability to analyze, assess, and use information for the purpose of forming beliefs and determining action. Students read Peach Blossom Cologne Company, a case involving audit work-papers, confirmations, adjusting entries, various correspondence, etc. Students have to actually analyze accounting data and entries from numerous accounts to determine what, if any, adjusting entries, are necessary to have the balance per books equal the balance per audit.
Students will attain an average grade of least 70% on a case related to this assessment.
In a written case assessment students averaged a score of 85% using a three-part rubric.
This is a new metric and should be repeated in the future. Because the average score was high, a variation of this assignment might include more advanced material with greater emphasis on adjusting entries.
Learning Goal:
ACG 4632: Audit I. (J. Lin)
Seven multiple-choice exam questions on
The overall average score on the seven questions
Future class discussions in ACG 4632 will provide

5
Accounting students will be able to demonstrate knowledge of auditing concepts and solve audit-related problems.
Students will demonstrate that they understand the primary role of independent auditors and the primary objective of an independent financial statement audit, comprehend generally accepted auditing standards including auditor independence requirements, and are able to choose an appropriate audit report under different situations. Students will also demonstrate that they can differentiate the levels of assurances in various types of assurance services and identify various components of quality control policies and procedures of public accounting firms.
independent audit and other assurance services, principles underlying generally accepted auditing standards (GAAS), issuance of an appropriate auditor report under different situations, accounting firm’s quality control, and auditor independence requirements are used for the assessment. These questions include questions 2, 6, 8, 15, 20, 22, and 34 in exam 1 given during the semester.
was 89%. Furthermore, the average scores for individual assessment questions range from 71% to 100%. Therefore, students’ performance for all questions combined and individual questions exceed the threshold of success at 70%. Student performance improved substantially on questions 2 and 5, compared to assessment results done in spring 2016 when student performance failed short of the threshold of success. In this assessment, the lowest average score is for question no.4 on GAAS principles, indicating that the topic needs more coverage.
more coverage of the different categories of principles underlying generally accepted auditing standards (GAAS). Coverage of topics for questions 2 and 5 will be maintained at the current level, which is increased in this assessment period in response to the unsatisfactory assessment results last time.
6
Communication and Critical Thinking Skills were measured for all Kate Tiedemann College of Business students in our required
capstone course (GEB 4890) as follows:
Communication Skills:
Our students will produce quality oral presentations and written assignments.
OBJECTIVE 1: Students will demonstrate effective writing skills.
OBJECTIVE 2: Students will deliver effective oral presentations on a business topic.
MEASURE: Students will produce written analysis of a case study and make oral presentations in selected sections of GEB 4890. Both a written communication rubric and an oral communications rubric are used for scoring.
ADMINISTERED: SPRING 2017
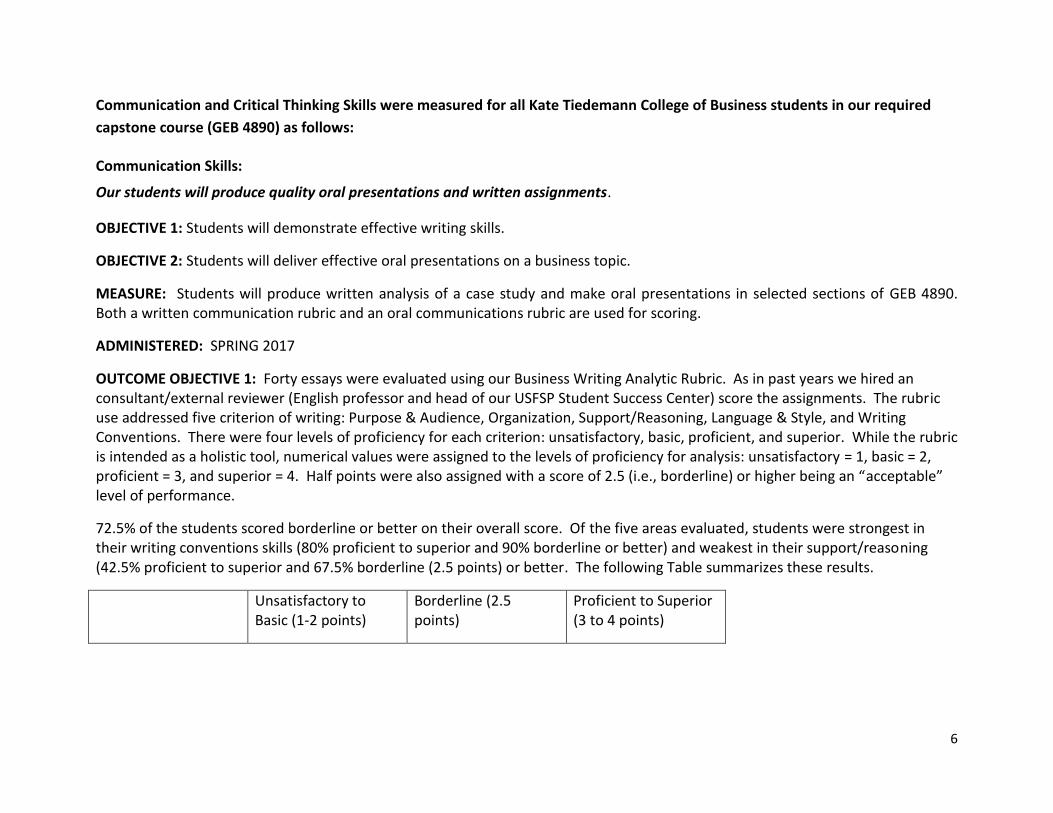
OUTCOME OBJECTIVE 1: Forty essays were evaluated using our Business Writing Analytic Rubric. As in past years we hired an consultant/external reviewer (English professor and head of our USFSP Student Success Center) score the assignments. The rubric use addressed five criterion of writing: Purpose & Audience, Organization, Support/Reasoning, Language & Style, and Writing Conventions. There were four levels of proficiency for each criterion: unsatisfactory, basic, proficient, and superior. While the rubric is intended as a holistic tool, numerical values were assigned to the levels of proficiency for analysis: unsatisfactory = 1, basic = 2, proficient = 3, and superior = 4. Half points were also assigned with a score of 2.5 (i.e., borderline) or higher being an “acceptable” level of performance.
72.5% of the students scored borderline or better on their overall score. Of the five areas evaluated, students were strongest in their writing conventions skills (80% proficient to superior and 90% borderline or better) and weakest in their support/reasoning (42.5% proficient to superior and 67.5% borderline (2.5 points) or better. The following Table summarizes these results.
Unsatisfactory to Basic (1-2 points)
Borderline (2.5 points)
Proficient to Superior (3 to 4 points)

7
Purpose & Audience 22.5% 20% 57.5%
Organization 10% 7.5% 75%
Support/Reasoning 32.5% 25% 42.5%
Language & Style 27.5% 20% 52.5%
Writing Conventions 10% 10% 80%
Overall Score 27.5% 27.5% 45%
The reviewer also noted the following:
“According to the syllabus for Spring 2017 GEB4890, this particular assignment was one of seven case studies that students analyzed. All seven case study analyses accounted for 10% of the overall grade. I am of the opinion that this particular assignment is not a wholly accurate representation of KTCOB student writing abilities. As each case analysis contributes less than 1.5% of the overall class grade, it is entirely feasible that students may not have put forth the effort and diligence in the assignment that they are truly capable of. One student added to the paper, in pen, “Sorry about the lack of detail and effort with this case. Been busy with work and family. This is not a good reflection of my abilities … it was rushed and last minute. Thanks.” To counter this point, however, the syllabus did state that “Some outcomes of this class may be utilized to assess student learning for purposes of SACS and AACSB International accreditation.” Whether this note held sway over students’ effort to produce quality work is undetermined, but students were made aware of the potentiality that any of their assignments could be used in an external assessment.”
ACTION TAKEN: While a greater emphasis has been placed on written communication in our undergraduate business program
about 25% of our students still score at an unsatisfactory level in written communication. More specifically, the following results
have been achieved over the past 6 years: 61% in 2011, 73% in 2012, 81% in 2013, 74 % in 2014, 73% in 2015 and 73% in 2016.
Due to the importance of this objective and since we have realized only limited improvements since our last review we will

8
continue to strive for improvements in the future. The Undergraduate Curriculum and Assessment Committee will again review
this Learning Goal carefully in the Fall 2017.
OUTCOME OBJECTIVE 2: Students in Dr. Geiger’s Spring 2017 GEB 4890 (capstone) classes were assessed on their ability to deliver an effective oral presentation on a business topic. The student presentations were rated on four traits: Content, Voice Quality and Pace, Mannerisms, and Use of Media. The results based on an Oral Communication Rubric, were as follows:
Content: 97% of all students scored “acceptable” or “outstanding.”
Voice Quality and Pace: 93% scored “acceptable” or “outstanding.”
Mannerisms: 93% of all students were rated “acceptable” or “outstanding”
Use of Media: 93% were rated either “acceptable” or “outstanding.”
Our expectation was that 80% of the students would rate either acceptable or outstanding in each of the four traits and that expectation was exceeded.
ACTION TAKEN: Due to the importance of this objective, we will continue to measure it in future terms.
Critical Thinking Skills:
Students will have the ability to use critical thinking and decision-making skills.
OBJECTIVE 1: Students will identify and prioritize key assumptions used in business decision-making scenarios.
MEASURE: Students were given a writing assignment in Dr Marlin’s GEB 4890 class and scored with a Critical Thinking Rubric consisting of three traits (identifies decision making scenario, identifies alternative courses of action, and analyzes alternatives and their consequences).

9
DATE ADMINISTERED: Spring 2017
OUTCOMES: 91.2% of all students were rated “acceptable” or “outstanding” on the first trait (identifies scenario). 88.2% of all students were rated “acceptable” or “outstanding” on the second trait (identifies alternative actions). 82.4% were rated “acceptable” or “outstanding” on the third trait (analyzes consequences). Our expectations were met on this objective.
ACTIONS TAKEN: We will continue to measure in the future using variations in the writing assignment to ensure consistency.
OBJECTIVE 2: Students will solve business problems using appropriate quantitative and analytical techniques.
MEASURE: Students will solve a two-way ANOVA problem and a Multiple Linear Regression Analysis problem on exams in the Business & Economic Statistics II course (QMB 3200). It is expected that students will score a 70% or higher grade in examining and solving these problems.
DATE ADMINISTERED: Fall 2016
EVALUATION TOOLS:
ANOVA Analysis - One-way and two-way ANOVA are taught in this course. A two-way ANOVA problem was assigned.
Multiple Linear Regression Analysis – Multiple linear regression along with appropriate tests for interaction and collinearity as well as quadratic and cubic regression are covered in this class. Two multiple linear regression and nonlinear regression problems were examined.
OUTCOMES: Scores were based on problems given to individual students on Exams 1 and 2. Between 80% and 92% of students scored either acceptable or outstanding on the 3-parts of the ANOVA problem (Exam 1) and between 80% and 96% scored acceptable/outstanding on the 6 parts of the regression problem (Exam 2).
ACTIONS TAKEN: Students continue to meet expectations in this area. We will continue to place a strong emphasis on helping the students “visualize” these types of problems and on how to use these techniques to solve business problems.

10
Analysis of Variance (ANOVA) : Summary
Date: FALL 2016
Rater: Dr John Gum Course: QMB 3200 Students: 70
TRAIT Unacceptable (-4 or more) Acceptable (-3 or less) Outstanding (no points
deducted)
Accept +
Outstanding
Test Factor A – provide proper null and
alternative hypothesis; if null is
rejected, perform post hoc analysis on
all combinations; make appropriate
recommendations based on findings.
10/50 = 20%
10/50 = 20%
30/50 = 60%
80%
Test Factor B- provide proper null and
alternative hypothesis; if null is
rejected, perform post hoc analysis;
make appropriate recommendations
9/50 = 18%
10/50 = 20%
31/50 = 62%
82%
Test for interaction between Factors A
& B; provide proper null and
alternative hypothesis; test using
alpha and sig (p values); make
recommendations
4/50 = 8%
6/50 = 12%
40/50 = 80%
92%
Multiple Linear Regression Analysis: Summary

11
TRAIT Unacceptable (-4 or more) Acceptable (-3 or less) Outstanding (no points
deducted)
Accept +
Outstanding
Test the Model – provide null and
alternate hypothesis; test using alpha
and p-value; reject or not; statistically
significant?
8/50 = 16%
5/50 = 10%
37/50 = 74%
84%
Test Independent Variables – provide
hypotheses for each independent
variable; test using alpha and p-values;
reject or not; statistically significant?
3/50 = 6%
7/50 = 14%
40/50 = 80%
94%
Estimated Regression Equation –
determine the equation from the SPSS
printout.
8/50 = 16%
3/50 = 6%
39/50 = 78%
84%
Slopes – Explain the slope for each
independent variable, how does a one
unit increase in the independent
variable effect the dependent variable
10/50 = 20%
4/50 = 8%
36/50 = 72%
80%
Adjusted R-square – explain what
percent of the variation in the
dependent variable is explained by the
independent variable
8/50 = 16%
6/50 = 12%
36/50 = 72%
84%

12
Test for Collinearity – check the VIF for
each independent variable, if greater
than 10 then remove and run the
regression again
2/50 = 4%
12/50 = 24%
36/50 = 72%
96%


