Page 1 of 31 Updated: July 25, 2017 THE SCHOOL DISTRICT OF LEE COUNTY Academic Plan Algebra 1 Honors (1200320) Adopted Instructional Materials: Houghton Mifflin Harcourt Algebra 1 1-1 Quantities & Modeling 2-1 Statistics 2-3 & 3-1 Exponential Relationships 3-4 & 4-1 Quadratic Equations & Modeling 1-2 Understanding Functions 2-2 Linear Systems & Special Functions 3-2 Polynomials FLORIDA STATEWIDE ASSESSMENT April 16–May 11, 2018 1-3 Linear Equations & Inequalities 2-3 & 3-1 Exponential Relationships 3-3 Quadratic Functions 4-2 Inverse Relationships 3-4 & 4-1 Quadratic Equations & Modeling Critical areas, called units, deepen and extend understanding of linear and exponential relationships by contrasting them with each other and by applying linear models to data that exhibit a linear trend, and students engage in methods for analyzing, solving, and using quadratic functions. The Standards for Mathematical Practice apply throughout each course, and prescribe that students experience mathematics as a coherent, useful, and logical subject that makes use of their ability to make sense of problem situations. Unit 1- Relationships Between Quantities and Reasoning with Equations: By the end of eighth grade students have learned to solve linear equations in one variable and have applied graphical and algebraic methods to analyze and solve systems of linear equations in two variables. This unit builds on these earlier experiences by asking students to analyze and explain the process of solving an equation. Students develop fluency writing, interpreting, and translating between various forms of linear equations and inequalities, and using them to solve problems. They master the solution of linear equations and apply related solution techniques and the laws of exponents to the creation and solution of simple exponential equations. All of this work is grounded on understanding quantities and on relationships between them. Unit 2- Linear and Exponential Relationships: In earlier grades, students define, evaluate, and compare functions, and use them to model relationships between quantities. In this unit, students will learn function notation and develop the concepts of domain and range. They explore many examples of functions, including sequences; they interpret functions given graphically, numerically, symbolically, and verbally, translate between representations, and understand the limitations of various representations. Students build on and informally extend their understanding of integer exponents to consider exponential functions. They compare and contrast linear and exponential functions, distinguishing between additive and multiplicative change. Students explore systems of equations and inequalities, and they find and interpret their solutions. They interpret arithmetic sequences as linear functions and geometric sequences as exponential functions. Unit 3- Descriptive Statistics: This unit builds upon students’ prior experiences with data, providing students with more formal means of assessing how a model fits data. Students use regression techniques to describe and approximate linear relationships between quantities. They use graphical representations and knowledge of the context to make judgments about the appropriateness of linear models. With linear models, they look at residuals to analyze the goodness of fit. Unit 4- Expressions and Equations: In this unit, students build on their knowledge from unit 2, where they extended the laws of exponents to rational exponents. Students apply this new understanding of number and strengthen their ability to see structure in and create quadratic and exponential expressions. They create and solve equations, inequalities, and systems of equations involving quadratic expressions. Unit 5- Quadratic Functions and Modeling: In this unit, students consider quadratic functions, comparing the key characteristics of quadratic functions to those of linear and exponential functions. They select from among these functions to model phenomena. Students learn to anticipate the graph of a quadratic function by interpreting various forms of quadratic expressions. In particular, they identify the real solutions of a quadratic equation as the zeros of a related quadratic function. Students expand their experience with functions to include more specialized functions—absolute value, step, and those that are piecewise-defined.
Critical areas, called units, deepen and extend understanding of linear and exponential relationships by contrasting them with each other and by applying linear models to data
that exhibit a linear trend, and students engage in methods for analyzing, solving, and using quadratic functions. The Standards for Mathematical Practice apply throughout
each course, and prescribe that students experience mathematics as a coherent, useful, and logical subject that makes use of their ability to make sense of problem situations.
Unit 1- Relationships Between Quantities and Reasoning with Equations: By the end of eighth grade students have learned to solve linear equations in one variable and
have applied graphical and algebraic methods to analyze and solve systems of linear equations in two variables. This unit builds on these earlier experiences by asking
students to analyze and explain the process of solving an equation. Students develop fluency writing, interpreting, and translating between various forms of linear equations
and inequalities, and using them to solve problems. They master the solution of linear equations and apply related solution techniques and the laws of exponents to the
creation and solution of simple exponential equations. All of this work is grounded on understanding quantities and on relationships between them.
Unit 2- Linear and Exponential Relationships: In earlier grades, students define, evaluate, and compare functions, and use them to model relationships between quantities.
In this unit, students will learn function notation and develop the concepts of domain and range. They explore many examples of functions, including sequences; they interpret
functions given graphically, numerically, symbolically, and verbally, translate between representations, and understand the limitations of various representations. Students
build on and informally extend their understanding of integer exponents to consider exponential functions. They compare and contrast linear and exponential functions,
distinguishing between additive and multiplicative change. Students explore systems of equations and inequalities, and they find and interpret their solutions. They interpret
arithmetic sequences as linear functions and geometric sequences as exponential functions.
Unit 3- Descriptive Statistics: This unit builds upon students’ prior experiences with data, providing students with more formal means of assessing how a model fits data.
Students use regression techniques to describe and approximate linear relationships between quantities. They use graphical representations and knowledge of the context to
make judgments about the appropriateness of linear models. With linear models, they look at residuals to analyze the goodness of fit.
Unit 4- Expressions and Equations: In this unit, students build on their knowledge from unit 2, where they extended the laws of exponents to rational exponents. Students
apply this new understanding of number and strengthen their ability to see structure in and create quadratic and exponential expressions. They create and solve equations,
inequalities, and systems of equations involving quadratic expressions.
Unit 5- Quadratic Functions and Modeling: In this unit, students consider quadratic functions, comparing the key characteristics of quadratic functions to those of linear
and exponential functions. They select from among these functions to model phenomena. Students learn to anticipate the graph of a quadratic function by interpreting various
forms of quadratic expressions. In particular, they identify the real solutions of a quadratic equation as the zeros of a related quadratic function. Students expand their
experience with functions to include more specialized functions—absolute value, step, and those that are piecewise-defined.
Additional Course Information Professional Development Helpful Websites
SKILLS TO MAINTAIN (Unit 1): Reinforce understanding of the properties of integer exponents. The initial experience with exponential expressions, equations, and functions involves integer exponents and builds on this understanding. FLUENCY RECOMMENDATIONS: Algebra I students become fluent in solving characteristic problems involving the analytic geometry of lines, such as writing down the equation of a line given a point and a slope. Such fluency can support them in solving less routine mathematical problems involving linearity, as well as in modeling linear phenomena (including modeling using systems of linear inequalities in two variables). A-APR.1- Fluency in adding, subtracting, and multiplying polynomials supports students throughout their work in Algebra, as well as in their symbolic work with functions. Manipulation can be more mindful when it is fluent. A-SSE.1b- Fluency in transforming expressions and chunking (seeing parts of an expression as a single object) is essential in factoring, completing the square, and other mindful algebraic calculations.
Build Relationships: Teach More Than ‘Just Math’
CPALMS MFAS Training
Formative Assessment Practices to Support Student Learning: Research shows that formative assessments have a significant impact on student learning gains. This article has links to four videos to demonstrate the clarify, elicit, interpret, act formative assessment practice.
Research around formative assessment shows that students make greater learning gains when they are accountable for their own learning and the learning of their peers. The video, Facilitating Peer Learning, is a good example of a math classroom where students are engaged with one another.
Five “Key Strategies” for Effective Formative Assessment
Asking Good Questions & Promoting Discourse (Part 1).
Teaching Channel: Videos and Best Practices https://www.teachingchannel.org/
Math Content Standards Suggested Literacy & English Language Standards MAFS.912.A-REI.1: Understand solving equations as a process of reasoning and explain the reasoning.
MAFS.912.A-REI.1.1: Explain each step in solving a simple equation as following from the equality of numbers asserted at the previous step, starting from the assumption that the original equation has a solution. Construct a viable argument to justify a solution method.
MAFS.912.A-REI.2: Solve equations and inequalities in one variable.
MAFS.912.A-REI.2.3: Solve linear equations and inequalities in one variable, including equations with coefficients represented by letters.
MAFS.912.N-Q.1: Reason quantitatively and use units to solve problems.
MAFS.912.N-Q.1.1: Use units as a way to understand problems and to guide the solution of multi-step problems; choose and interpret units consistently in formulas; choose and interpret the scale and the origin in graphs and data displays.
MAFS.912.N-Q.1.2: Define appropriate quantities for the purpose of descriptive modeling.
MAFS.912.N-Q.1.3: Choose a level of accuracy appropriate to limitations on measurement when reporting quantities.
MAFS.912.A-SSE.1: Interpret the structure of expressions.
MAFS.912.A-SSE.1.1: Interpret expressions that represent a quantity in terms of its
context.★ a. Interpret parts of an expression, such as terms, factors, and coefficients.
MAFS.912.A-CED.1: Create equations that describe numbers or relationships.
MAFS.912.A-CED.1.1: Create equations and inequalities in one variable and use them to solve problems. Include equations arising from linear and quadratic functions, and simple rational, absolute, and exponential functions.
MAFS.912.A-CED.1.3: Represent constraints by equations or inequalities, and by systems of equations and/or inequalities, and interpret solutions as viable or non-viable options in a modeling context.
MAFS.912.A-CED.1.4: Rearrange formulas to highlight a quantity of interest, using the same reasoning as in solving equations.
LAFS.910.WHST.3.9: Draw evidence from informational texts to support analysis, reflection, and research. ELD.K12.ELL.MA.1: English language learners communicate information, ideas and concepts necessary for academic success in the content area of Mathematics. ELD.K12.ELL.SI.1: English language learners communicate for social and instructional purposes within the school setting.
Suggested Mathematical Practice Standards MAFS.K12.MP.4.1: Model with mathematics.
What other ways could you use to model the situation mathematically?
What connections can you make between different representations of the situation?
MAFS.K12.MP.7.1: Look for and make use of structure.
How can you use what you know to explain why this works? What patterns do you see?
Math Content Standards Suggested Literacy & English Language Standards MAFS.912.F-IF.1: Understand the concept of a function and use function notation.
MAFS.912.F-IF.1.1: Understand that a function from one set (called the domain) to another set (called the range) assigns to each element of the domain exactly one element of the range. If 𝑓 is a function and 𝑥 is an element of its domain, then 𝑓(𝑥) denotes the output of f corresponding to the input 𝑥. The graph of 𝑓 is the graph of the equation 𝑦 = 𝑓(𝑥).
MAFS.912.F-IF.1.2: Use function notation, evaluate functions for inputs in their domains, and interpret statements that use function notation in terms of a context.
MAFS.912.F-IF.1.3: Recognize that sequences are functions, sometimes defined recursively, whose domain is a subset of the integers. For example, the Fibonacci sequence is defined recursively by f(0) = f(1) = 1, f(n+1) = f(n) + f(n-1) for n ≥ 1.
MAFS.912.F-IF.2: Interpret functions that arise in applications in terms of the context. MAFS.912.F-IF.2.4: For a function that models a relationship between two quantities,
interpret key features of graphs and tables in terms of the quantities, and sketch graphs showing key features given a verbal description of the relationship. Key features include: intercepts; intervals where the function is increasing, decreasing, positive, or negative; relative maximums and minimums; symmetries; end behavior; and periodicity.
MAFS.912.F-IF.2.5: Relate the domain of a function to its graph and, where applicable, to the quantitative relationship it describes. For example, if the function h(n) gives the number of person-hours it takes to assemble n engines in a factory, then the positive integers would be an appropriate domain for the function.
MAFS.912.F-LE.1: Construct and compare linear, quadratic, and exponential models and solve problems.
MAFS.912.F-LE.1.2: Construct linear and exponential functions, including arithmetic and geometric sequences, given a graph, a description of a relationship, or two input-output pairs (include reading these from a table).
MAFS.912.F-BF.1: Build a function that models a relationship between two quantities.
MAFS.912.F-BF.1.1: Write a function that describes a relationship between two quantities. a. Determine an explicit expression, a recursive process, or steps for calculation from
a context.
MAFS.912.F-BF.1.2: Write arithmetic and geometric sequences both recursively and with an explicit formula, use them to model situations, and translate between the two forms.
LAFS.910.SL.1.2: Integrate multiple sources of information presented in diverse media or formats (e.g., visually, quantitatively, orally) evaluating the credibility and accuracy of each source. ELD.K12.ELL.1.1: English language learners communicate for social and instructional purposes within the school setting.
Suggested Mathematical Practice Standards MAFS.K12.MP.7.1: Look for and make use of structure.
How can you apply what you know about linear equations to functions?
How do replacement sets relate to real world problems?
Math Content Standards Suggested Literacy & English Language Standards MAFS.912.F-LE.1: Construct and compare linear, quadratic, and exponential models and solve problems.
MAFS.912.F-LE.1.1: Distinguish between situations that can be modeled with linear functions and with exponential functions. a. Prove that linear functions grow by equal differences over equal intervals, and that
exponential functions grow by equal factors over equal intervals. b. Recognize situations in which one quantity changes at a constant rate per unit interval
relative to another.
MAFS.912.F-LE.1.2: Construct linear and exponential functions, including arithmetic and geometric sequences, given a graph, a description of a relationship, or two input-output pairs (include reading these from a table).
MAFS.912.F-LE.2: Interpret expressions for functions in terms of the situation they model.
MAFS.912.F-LE.2.5: Interpret the parameters in a linear or exponential function in terms of a context.
MAFS.912.F-IF.2: Interpret functions that arise in applications in terms of the context.
MAFS.912.F-IF.2.4: For a function that models a relationship between two quantities, interpret key features of graphs and tables in terms of the quantities, and sketch graphs showing key features given a verbal description of the relationship. Key features include: intercepts; intervals where the function is increasing, decreasing, positive, or negative; relative maximums and minimums; symmetries; end behavior; and periodicity.
MAFS.912.F-IF.2.5: Relate the domain of a function to its graph and, where applicable, to the quantitative relationship it describes. For example, if the function h(n) gives the number of person-hours it takes to assemble n engines in a factory, then the positive integers would be an appropriate domain for the function.
MAFS.912.F-IF.2.6: Calculate and interpret the average rate of change of a function (presented symbolically or as a table) over a specified interval. Estimate the rate of change from a graph.
MAFS.912.F-IF.3: Analyze functions using different representations.
MAFS.912.F-IF.3.7: Graph functions expressed symbolically and show key features of the graph, by hand in simple cases and using technology for more complicated cases. a. Graph linear and quadratic functions and show intercepts, maxima, and minima.
MAFS.912.F-IF.3.9: Compare properties of two functions each represented in a different way (algebraically, graphically, numerically in tables, or by verbal descriptions). For example, given a graph of one quadratic function and an algebraic expression for another, say which has the larger maximum.
MAFS.912.A-REI.4: Represent and solve equations and inequalities graphically.
MAFS.912.A-REI.4.10: Understand that the graph of an equation in two variables is the set of all its solutions plotted in the coordinate plane, often forming a curve (which could be a line).
LAFS.910.SL.1.3: Evaluate a speaker’s point of view, reasoning, and use of evidence and rhetoric, identifying any fallacious reasoning or exaggerated or distorted evidence. ELD.K12.ELL.AC.1: English language learners communicate information, ideas and concepts necessary for academic success in the content area of Mathematics.
Suggested Mathematical Practice Standards MAFS.K12.MP.2.1: Reason abstractly and quantitatively.
Do the domain and range matter when creating a graph?
What is an example of a situation that could be modeled with a linear function?
MAFS.K12.MP.3.1: Construct viable arguments and critique the reasoning of others.
Explain how to determine the intervals for a graph. Are the intervals you choose reasonable? How do you know?
MAFS.912.A-REI.4.11: Explain why the x-coordinates of the points where the graphs of the equations y = f(x) and y = g(x) intersect are the solutions of the equation f(x) = g(x); find the solutions approximately, e.g., using technology to graph the functions, make tables of values, or find successive approximations. Include cases where f(x) and/or g(x) are linear, polynomial, rational, absolute value, exponential, and logarithmic functions.
MAFS.912.A-REI.4.12: Graph the solutions to a linear inequality in two variables as a half-plane (excluding the boundary in the case of a strict inequality), and graph the solution set to a system of linear inequalities in two variables as the intersection of the corresponding half-planes.
MAFS.912.A-CED.1: Create equations that describe numbers or relationships
MAFS.912.A-CED.1.2: Create equations in two or more variables to represent relationships between quantities; graph equations on coordinate axes with labels and scales.
MAFS.912.A-CED.1.3: Represent constraints by equations or inequalities, and by systems of equations and/or inequalities, and interpret solutions as viable or non-viable options in a modeling context.
MAFS.912.F-BF.2: Build new functions from existing functions.
MAFS.912.F-BF.2.3: Identify the effect on the graph of replacing f(x) by f(x) + k, k f(x), f(kx), and f(x + k) for specific values of k (both positive and negative); find the value of k given the graphs. Experiment with cases and illustrate an explanation of the effects on the graph using technology. Include recognizing even and odd functions from their graphs and algebraic expressions for them.
MAFS.912.N-Q.1: Reason quantitatively and use units to solve problems.
MAFS.912.N-Q.1.1: Use units as a way to understand problems and to guide the solution of multi-step problems; choose and interpret units consistently in formulas; choose and interpret the scale and the origin in graphs and data displays.
MAFS.912.N-Q.1.2: Define appropriate quantities for the purpose of descriptive modeling. MAFS.912.S-ID.3: Interpret linear models.
MAFS.912.S-ID.3.7: Interpret the slope (rate of change) and the intercept (constant term) of a linear model in the context of the data.
Essential Outcome Question(s)
How can different forms of a linear function be used to solve a real-world problem?
Aligned Learning Goals District Adopted Materials
Supplemental Resources
Strategies for Differentiation
Recognize and describe linear functions as situations in which one quantity changes at a constant rate relative to another
Identify linear functions from tables, graphs, equations, and verbal descriptions
Identify and interpret intercepts for linear functions written as tables, graphs, equations, and verbal descriptions
Calculate and interpret the rate of change or slope over a specified interval for a function, using phrases such as for every, per, and each to relate the two quantities
Define solution of a linear equation and identify and describe possible solutions for given linear equations
Graph and write linear equations in standard form, slope-intercept form, and point-slope form using their respective key features
Graph linear equations of the form 𝑦 = 𝑎 or 𝑥 = 𝑎
Identify key features of functions, including intercepts, slope, continuous, discrete
Define parent graph and family of functions and build new functions of transformed graphs from parent graphs
Identify and explain in words the effect on the graph of replacing f(x) by f(x) + k, k f(x), f(kx), and f(x + k) for specific values of k (both positive and negative)
Identify changes in the parameters of a real-world solution for a linear equation that has been transformed
Compare properties of two linear functions given in different forms
Create linear equations, identify constraints, and interpret solutions as viable or not viable in the context of the problem
Graph linear inequalities in two variables and determine if a given coordinate is a solution
Videos 1 through 4
Section 4 Video 6
Representing Linear Functions – Words, Table, Graph, Equation
Math Content Standards Suggested Literacy & English Language Standards MAFS.912.S-ID.1: Summarize, represent, and interpret data on a single count or measurement variable.
LAFS.910.SL.2.4: Present information, findings, and supporting evidence clearly, concisely, and logically such that listeners can
MAFS.912.S-ID.1.1: Represent data with plots on the real number line (dot plots, histograms, and box plots).
MAFS.912.S-ID.1.2: Use statistics appropriate to the shape of the data distribution to compare center (median, mean) and spread (interquartile range, standard deviation) of two or more different data sets.
MAFS.912.S-ID.1.3: Interpret differences in shape, center, and spread in the context of the data sets, accounting for possible effects of extreme data points (outliers).
MAFS.912.S-ID.1.4: Use the mean and standard deviation of a data set to fit it to a normal distribution and to estimate population percentages. Recognize that there are data sets for which such a procedure is not appropriate. Use
MAFS.912.S-ID.2: Summarize, represent, and interpret data on two categorical and quantitative variables.
MAFS.912.S-ID.2.5: Summarize categorical data for two categories in two-way frequency tables. Interpret relative frequencies in the context of the data (including joint, marginal, and conditional relative frequencies). Recognize possible associations and trends in the data.
MAFS.912.S-ID.2.6: Represent data on two quantitative variables on a scatter plot, and describe how the variables are related. b. Informally assess the fit of a function by plotting and analyzing residuals. c. Fit a linear function for a scatter plot that suggests a linear association.
MAFS.912.S-ID.3: Interpret linear models.
MAFS.912.S-ID.3.7: Interpret the slope (rate of change) and the intercept (constant term) of a linear model in the context of the data.
MAFS.912.S-ID.3.8: Compute (using technology) and interpret the correlation coefficient of a linear fit.
MAFS.912.S-ID.3.9: Distinguish between correlation and causation.
follow the line of reasoning and the organization, development, substance, and style are appropriate to purpose, audience, and task. ELD.K12.ELL.1.1: English language learners communicate for social and instructional purposes within the school setting.
Suggested Mathematical Practice Standards MAFS.K12.MP.8.1: Look for and express regularity in repeated reasoning.
What generalizations can you make?
What is the fewest number of filled cells needed to complete a two-way frequency table? What helps you to be able to fill in missing cells?
Essential Outcome Question(s)
How are various statistical measures used to interpret data?
Aligned Learning Goals District Adopted Materials
Supplemental Resources
Strategies for Differentiation
Use vocabulary associated with statistical measures, including two-way tables, joint frequency, marginal frequency, relative frequency, conditional relative frequency, quantitative data, categorical data, mean, median, center, spread, standard deviation, quartiles, range, interquartile range, outlier, normal distribution, and standard deviation, when discussing data
Create two-way frequency tables to summarize categorical data
Look for trends and summarize categorical data in context displayed in two-way frequency tables
Interpret relative frequencies in the context of the data
Understand and explain the difference between a measure of center and measure of spread
Find mean, median, range, interquartile range, and standard deviation for a set of data and interpret each in context
Represent data sets on line plots, box plots, and histograms and describe data sets as symmetric, skewed left, or skewed right
Compare data sets using statistical measures and language
Identify and use normal distribution characteristics to interpret data sets
Use vocabulary associated with linear modeling, including two-way variable data, scatter plot, correlation, correlation coefficient, causation, line of fit, interpolation, extrapolation, residual, residual plot, linear regression, and least-squares line, when discussing two-way data
Create scatterplots of data and describe how the variables are related
Use the slope of a line to estimate correlation coefficients for scatterplots
Graph and write an equation for a line of fit for a set of data in a scatterplot and use interpolation or extrapolation to make predictions
Calculate and plot residuals to analyze the quality of the line of fit for a data set
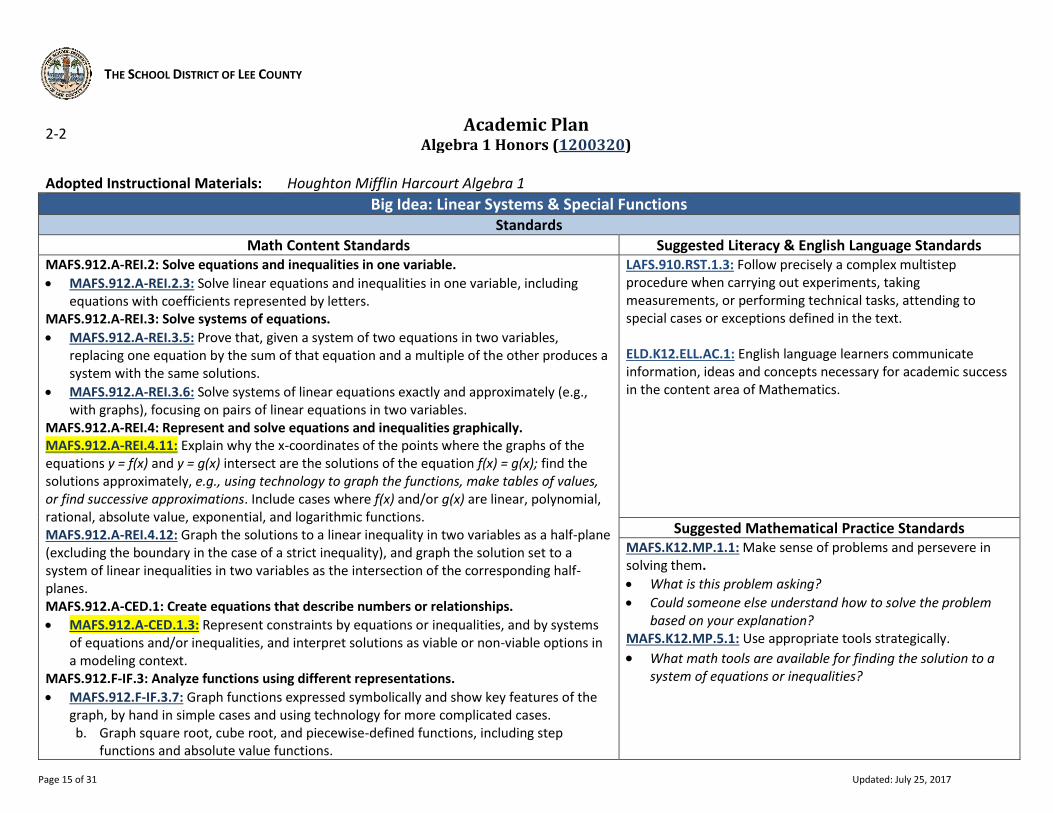
Big Idea: Linear Systems & Special Functions Standards
Math Content Standards Suggested Literacy & English Language Standards MAFS.912.A-REI.2: Solve equations and inequalities in one variable.
MAFS.912.A-REI.2.3: Solve linear equations and inequalities in one variable, including equations with coefficients represented by letters.
MAFS.912.A-REI.3: Solve systems of equations.
MAFS.912.A-REI.3.5: Prove that, given a system of two equations in two variables, replacing one equation by the sum of that equation and a multiple of the other produces a system with the same solutions.
MAFS.912.A-REI.3.6: Solve systems of linear equations exactly and approximately (e.g., with graphs), focusing on pairs of linear equations in two variables.
MAFS.912.A-REI.4: Represent and solve equations and inequalities graphically. MAFS.912.A-REI.4.11: Explain why the x-coordinates of the points where the graphs of the equations y = f(x) and y = g(x) intersect are the solutions of the equation f(x) = g(x); find the solutions approximately, e.g., using technology to graph the functions, make tables of values, or find successive approximations. Include cases where f(x) and/or g(x) are linear, polynomial, rational, absolute value, exponential, and logarithmic functions. MAFS.912.A-REI.4.12: Graph the solutions to a linear inequality in two variables as a half-plane (excluding the boundary in the case of a strict inequality), and graph the solution set to a system of linear inequalities in two variables as the intersection of the corresponding half-planes. MAFS.912.A-CED.1: Create equations that describe numbers or relationships.
MAFS.912.A-CED.1.3: Represent constraints by equations or inequalities, and by systems of equations and/or inequalities, and interpret solutions as viable or non-viable options in a modeling context.
MAFS.912.F-IF.3: Analyze functions using different representations.
MAFS.912.F-IF.3.7: Graph functions expressed symbolically and show key features of the graph, by hand in simple cases and using technology for more complicated cases. b. Graph square root, cube root, and piecewise-defined functions, including step
functions and absolute value functions.
LAFS.910.RST.1.3: Follow precisely a complex multistep procedure when carrying out experiments, taking measurements, or performing technical tasks, attending to special cases or exceptions defined in the text. ELD.K12.ELL.AC.1: English language learners communicate information, ideas and concepts necessary for academic success in the content area of Mathematics.
Suggested Mathematical Practice Standards MAFS.K12.MP.1.1: Make sense of problems and persevere in solving them.
What is this problem asking?
Could someone else understand how to solve the problem based on your explanation?
MAFS.K12.MP.5.1: Use appropriate tools strategically.
What math tools are available for finding the solution to a system of equations or inequalities?
MAFS.912.F-LE.2: Interpret expressions for functions in terms of the situation they model.
MAFS.912.F-LE.2.5: Interpret the parameters in a linear or exponential function in terms of a context.
MAFS.912.F-BF.1: Build a function that models a relationship between two quantities.
MAFS.912.F-BF.1.1: Write a function that describes a relationship between two quantities. b. Combine standard function types using arithmetic operations. For example, build a
function that models the temperature of a cooling body by adding a constant function to a decaying exponential, and relate these functions to the model.
MAFS.912.F-BF.2: Build new functions from existing functions.
MAFS.912.F-BF.2.3: Identify the effect on the graph of replacing f(x) by f(x) + k, k f(x), f(kx), and f(x + k) for specific values of k (both positive and negative); find the value of k given the graphs. Experiment with cases and illustrate an explanation of the effects on the graph using technology. Include recognizing even and odd functions from their graphs and algebraic expressions for them.
Essential Outcome Question(s)
When is using a system of equations more beneficial than using a single linear equation to model a real-world problem?
How do special functions, such as piecewise and absolute value, differ from linear functions? How are they alike?
Aligned Learning Goals District Adopted Materials
Supplemental Resources
Strategies for Differentiation
Write and solve systems of two linear equations using graphs, substitution, and by adding
Explain the difference between consistent and inconsistent systems of equations in terms of their number of solutions
Interpret the solution of a system of equations in context
Write and graph systems of two linear inequalities
Explain linear inequality boundaries in relation to their solution set and identify viable and nonviable solutions for systems of linear inequalities
Understand the parameters/constraints on a linear system of equations or inequalities when modeling real-world scenarios
Graph and evaluate piecewise functions, including step functions and greatest integer functions
Create piecewise functions from verbal descriptions or graphs
Graph the parent function for absolute value functions
Identify and explain in words the effect on the graph of an absolute value function when replacing f(x) by f(x) + k, k f(x), f(kx), and f(x + k) for specific values of k (both positive and negative)
Solve absolute value equations and inequalities graphically and algebraically and explain why there are two, one, or no solutions.
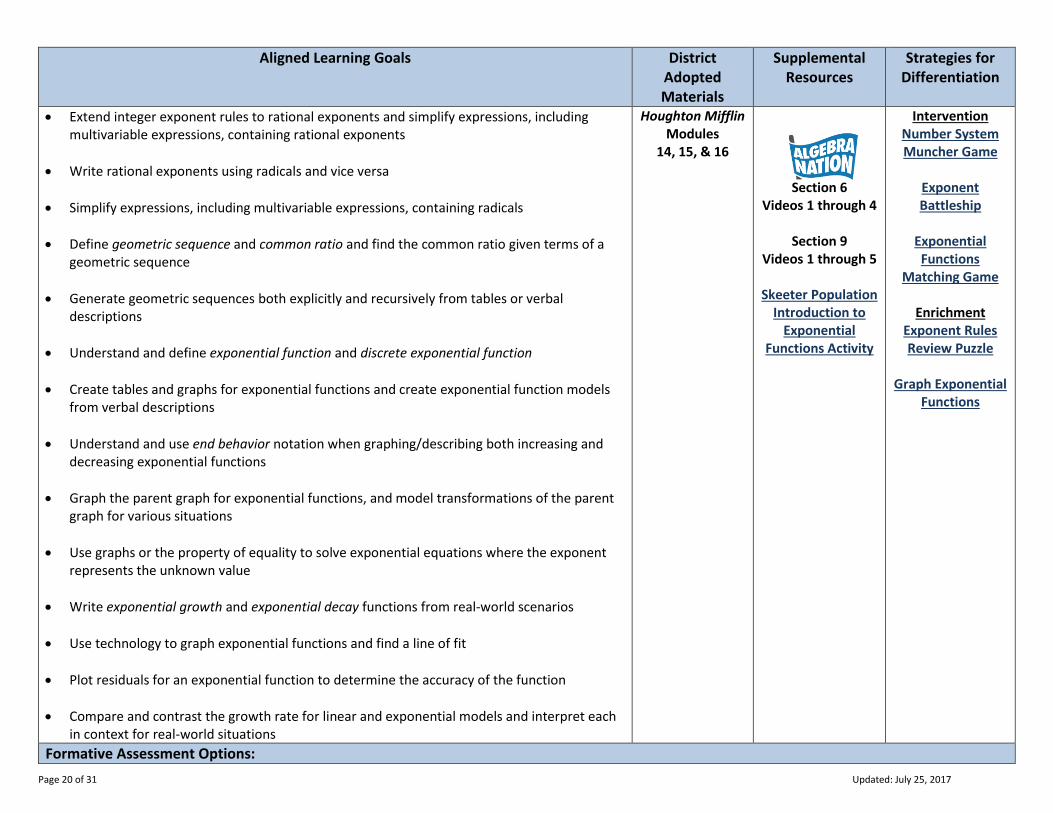
Math Content Standards Suggested Literacy & English Language Standards MAFS.912.N-RN.1: Extend the properties of exponents to rational exponents.
MAFS.912.N-RN.1.1: Explain how the definition of the meaning of rational exponents follows from extending the properties of integer exponents to those values, allowing for a notation for radicals in terms of rational exponents.
MAFS.912.N-RN.1.2: Rewrite expressions involving radicals and rational exponents using the properties of exponents.
MAFS.912.N-RN.2: Use properties of rational and irrational numbers.
MAFS.912.N-RN.2.3: Explain why the sum or product of two rational numbers is rational; that the sum of a rational number and an irrational number is irrational; and that the product of a nonzero rational number and an irrational number is irrational.
MAFS.912.F-LE.1: Construct and compare linear, quadratic, and exponential models and solve problems.
MAFS.912.F-LE.1.1: Distinguish between situations that can be modeled with linear functions and with exponential functions. c. Recognize situations in which a quantity grows or decays by a constant percent rate per
unit interval relative to another.
MAFS.912.F-LE.1.2: Construct linear and exponential functions, including arithmetic and geometric sequences, given a graph, a description of a relationship, or two input-output pairs (include reading these from a table).
MAFS.912.F-LE.1.3: Observe using graphs and tables that a quantity increasing exponentially eventually exceeds a quantity increasing linearly, quadratically, or (more generally) as a polynomial function.
MAFS.912.F-BF.1: Build a function that models a relationship between two quantities.
MAFS.912.F-BF.1.1: Write a function that describes a relationship between two quantities. a. Determine an explicit expression, a recursive process, or steps for calculation from a
context. MAFS.912.F-BF.2: Build new functions from existing functions.
LAFS.910.RST.2.4: Determine the meaning of symbols, key terms, and other domain-specific words and phrases as they are used in a specific scientific or technical context relevant to grades 9–10 texts and topics. ELD.K12.ELL.1.1: English language learners communicate for social and instructional purposes within the school setting.
Suggested Mathematical Practice Standards MAFS.K12.MP.1.1: Make sense of problems and persevere in solving them.
How can you use an easier form of the problem to help make sense of it?
MAFS.K12.MP.5.1: Use appropriate tools strategically.
Is using a calculator or mental math more appropriate for this situation?
MAFS.912.F-BF.2.3: Identify the effect on the graph of replacing f(x) by f(x) + k, k f(x), f(kx), and f(x + k) for specific values of k (both positive and negative); find the value of k given the graphs. Experiment with cases and illustrate an explanation of the effects on the graph using technology. Include recognizing even and odd functions from their graphs and algebraic expressions for them.
MAFS.912.F-IF.1: Understand the concept of a function and use function notation.
MAFS.912.F-IF.1.2: Use function notation, evaluate functions for inputs in their domains, and interpret statements that use function notation in terms of a context.
MAFS.912.F-IF.3: Analyze functions using different representations.
MAFS.912.F-IF.3.7: Graph functions expressed symbolically and show key features of the
graph, by hand in simple cases and using technology for more complicated cases. ★ e. Graph exponential and logarithmic functions, showing intercepts and end behavior, and
trigonometric functions, showing period, midline, and amplitude, and using phase shift.
MAFS.912.F-IF.3.8: Write a function defined by an expression in different but equivalent forms to reveal and explain different properties of the function. a. Use the properties of exponents to interpret expressions for exponential functions.
MAFS.912.F-IF.3.9: Compare properties of two functions each represented in a different way (algebraically, graphically, numerically in tables, or by verbal descriptions). For example, given a graph of one quadratic function and an algebraic expression for another, say which has the larger maximum.
MAFS.912.A-CED.1: Create equations that describe numbers or relationships.
MAFS.912.A-CED.1.1: Create equations and inequalities in one variable and use them to solve problems. Include equations arising from linear and quadratic functions, and simple rational, absolute, and exponential functions.
MAFS.912.A-SSE.2: Write expressions in equivalent forms to solve problems.
MAFS.912.A-SSE.2.4: Derive the formula for the sum of a finite geometric series (when the common ratio is not 1), and use the formula to solve problems. For example, calculate mortgage payments.
MAFS.912.S-ID.2: Summarize, represent, and interpret data on two categorical and quantitative variables.
MAFS.912.S-ID.2.6: Represent data on two quantitative variables on a scatter plot, and
describe how the variables are related. ★ a. Fit a function to the data; use functions fitted to data to solve problems in the context of
the data. Use given functions or choose a function suggested by the context. Emphasize linear, and exponential models.
Essential Outcome Question(s)
How does analyzing the structure of an expression or equation help you simplify and solve more complex problems?
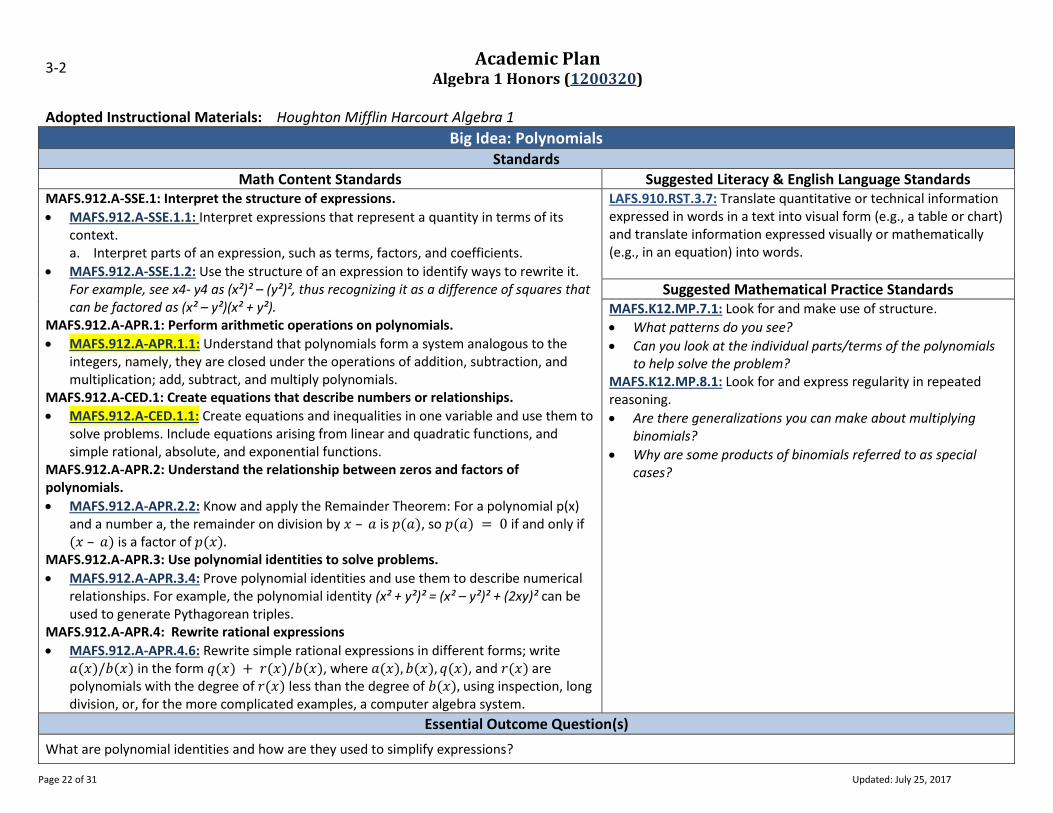
Math Content Standards Suggested Literacy & English Language Standards MAFS.912.A-SSE.1: Interpret the structure of expressions.
MAFS.912.A-SSE.1.1: Interpret expressions that represent a quantity in terms of its context. a. Interpret parts of an expression, such as terms, factors, and coefficients.
MAFS.912.A-SSE.1.2: Use the structure of an expression to identify ways to rewrite it. For example, see x4- y4 as (x²)² – (y²)², thus recognizing it as a difference of squares that can be factored as (x² – y²)(x² + y²).
MAFS.912.A-APR.1: Perform arithmetic operations on polynomials.
MAFS.912.A-APR.1.1: Understand that polynomials form a system analogous to the integers, namely, they are closed under the operations of addition, subtraction, and multiplication; add, subtract, and multiply polynomials.
MAFS.912.A-CED.1: Create equations that describe numbers or relationships.
MAFS.912.A-CED.1.1: Create equations and inequalities in one variable and use them to solve problems. Include equations arising from linear and quadratic functions, and simple rational, absolute, and exponential functions.
MAFS.912.A-APR.2: Understand the relationship between zeros and factors of polynomials.
MAFS.912.A-APR.2.2: Know and apply the Remainder Theorem: For a polynomial p(x) and a number a, the remainder on division by 𝑥 – 𝑎 is 𝑝(𝑎), so 𝑝(𝑎) = 0 if and only if (𝑥 – 𝑎) is a factor of 𝑝(𝑥).
MAFS.912.A-APR.3: Use polynomial identities to solve problems.
MAFS.912.A-APR.3.4: Prove polynomial identities and use them to describe numerical relationships. For example, the polynomial identity (x² + y²)² = (x² – y²)² + (2xy)² can be used to generate Pythagorean triples.
MAFS.912.A-APR.4: Rewrite rational expressions
MAFS.912.A-APR.4.6: Rewrite simple rational expressions in different forms; write 𝑎(𝑥)/𝑏(𝑥) in the form 𝑞(𝑥) + 𝑟(𝑥)/𝑏(𝑥), where 𝑎(𝑥), 𝑏(𝑥), 𝑞(𝑥), and 𝑟(𝑥) are polynomials with the degree of 𝑟(𝑥) less than the degree of 𝑏(𝑥), using inspection, long division, or, for the more complicated examples, a computer algebra system.
LAFS.910.RST.3.7: Translate quantitative or technical information expressed in words in a text into visual form (e.g., a table or chart) and translate information expressed visually or mathematically (e.g., in an equation) into words.
Suggested Mathematical Practice Standards MAFS.K12.MP.7.1: Look for and make use of structure.
What patterns do you see?
Can you look at the individual parts/terms of the polynomials to help solve the problem?
MAFS.K12.MP.8.1: Look for and express regularity in repeated reasoning.
Are there generalizations you can make about multiplying binomials?
Why are some products of binomials referred to as special cases?
Essential Outcome Question(s)
What are polynomial identities and how are they used to simplify expressions?
Math Content Standards Suggested Literacy & English Language Standards MAFS.912.F-BF.1: Build a function that models a relationship between two quantities.
MAFS.912.F-BF.1.1: Write a function that describes a relationship between two quantities.
MAFS.912.F-BF.2: Build new functions from existing functions.
MAFS.912.F-BF.2.3: Identify the effect on the graph of replacing f(x) by f(x) + k, k f(x), f(kx), and f(x + k) for specific values of k (both positive and negative); find the value of k given the graphs. Experiment with cases and illustrate an explanation of the effects on the graph using technology. Include recognizing even and odd functions from their graphs and algebraic expressions for them.
MAFS.912.F-IF.1: Understand the concept of a function and use function notation.
MAFS.912.F-IF.1.2: Use function notation, evaluate functions for inputs in their domains, and interpret statements that use function notation in terms of a context.
MAFS.912.F-IF.2: Interpret functions that arise in applications in terms of the context.
MAFS.912.F-IF.2.4: For a function that models a relationship between two quantities, interpret key features of graphs and tables in terms of the quantities, and sketch graphs showing key features given a verbal description of the relationship. Key features include: intercepts; intervals where the function is increasing, decreasing, positive, or negative; relative maximums and minimums; symmetries; end behavior; and periodicity.
MAFS.912.F-IF.3: Analyze functions using different representations.
MAFS.912.F-IF.3.7: Graph functions expressed symbolically and show key features of the graph, by hand in simple cases and using technology for more complicated cases. c. Graph polynomial functions, identifying zeros when suitable factorizations are
available, and showing end behavior.
MAFS.912.F-IF.3.8: Write a function defined by an expression in different but equivalent forms to reveal and explain different properties of the function.
MAFS.912.A-APR.2: Understand the relationship between zeros and factors of polynomials.
MAFS.912.A-APR.2.3: Identify zeros of polynomials when suitable factorizations are available, and use the zeros to construct a rough graph of the function defined by the polynomial.
MAFS.912.A-REI.2: Solve equations and inequalities in one variable.
MAFS.912.A-REI.2.4: Solve quadratic equations in one variable. a. Use the method of completing the square to transform any quadratic equation in 𝑥
into an equation of the form (𝑥 − 𝑝)2 = 𝑞 that has the same solutions. Derive the quadratic formula from this form.
LAFS.910.WHST.1.1: Write arguments focused on discipline-specific content. a. Introduce precise claim(s), distinguish the claim(s) from
alternate or opposing claims, and create an organization that establishes clear relationships among the claim(s), counterclaims, reasons, and evidence.
b. Develop claim(s) and counterclaims fairly, supplying data and evidence for each while pointing out the strengths and limitations of both claim(s) and counterclaims in a discipline-appropriate form and in a manner that anticipates the audience’s knowledge level and concerns.
c. Use words, phrases, and clauses to link the major sections of the text, create cohesion, and clarify the relationships between claim(s) and reasons, between reasons and evidence, and between claim(s) and counterclaims.
d. Establish and maintain a formal style and objective tone while attending to the norms and conventions of the discipline in which they are writing.
e. Provide a concluding statement or section that follows from or supports the argument presented.
Suggested Mathematical Practice Standards MAFS.K12.MP.4.1: Model with mathematics.
How does the graph of a quadratic function provide useful information for solving real-life problems?
MAFS.K12.MP.5.1: Use appropriate tools strategically.
What is another way to find the zeros of a quadratic? Is one way more useful than another? Why or why not?
b. Solve quadratic equations by inspection (e.g., for x² = 49), taking square roots, completing the square, the quadratic formula and factoring, as appropriate to the initial form of the equation. Recognize when the quadratic formula gives complex solutions and write them as a ± bi for real numbers a and b.
MAFS.912.A-SSE.1: Interpret the structure of expressions.
MAFS.912.A-SSE.1.2: Use the structure of an expression to identify ways to rewrite it. For example, see x4- y4 as (x²)² – (y²)², thus recognizing it as a difference of squares that can be factored as (x² – y²)(x² + y²).
MAFS.912.A-SSE.2: Write expressions in equivalent forms to solve problems.
MAFS.912.A-SSE.2.3: Choose and produce an equivalent form of an expression to reveal and explain properties of the quantity represented by the expression. a. Factor a quadratic expression to reveal the zeros of the function it defines. b. Complete the square in a quadratic expression to reveal the maximum or minimum
value of the function it defines.
Essential Outcome Question(s)
How does understanding key features and transformations help to write and graph quadratic functions?
Aligned Learning Goals District Adopted Materials
Supplemental Resources
Strategies for Differentiation
Understand, identify, and graph the parent function of a quadratic equation
Understand and use reflections to graph quadratic functions
Graph simple quadratic functions of the form 𝑦 = 𝑎𝑥2 when a > 1, and write quadratic functions for graphs of quadratic functions with a vertex of (0, 0)
Graph quadratic equations written in factored form, 𝑦 = (𝑥 + 2)(𝑥 + 3)
Identify and explain in words the effect on the graph of a quadratic function when replacing f(x) by f(x) + k, k f(x), f(kx), and f(x + k) for specific values of k (both positive and negative)
Identify and find key features of quadratic functions, including minimum, maximum, axis of symmetry, vertex, zeros, and intercepts
Identify quadratic equations in standard form and vertex form and be able to rewrite standard form in vertex form and vice versa
Write quadratic equations from graphs, tables, and verbal descriptions
Math Content Standards Suggested Literacy & English Language Standards MAFS.912.A-SSE.1: Interpret the structure of expressions.
MAFS.912.A-SSE.1.2: Use the structure of an expression to identify ways to rewrite it. For example, see x4- y4 as (x²)² – (y²)², thus recognizing it as a difference of squares that can be factored as (x² – y²)(x² + y²).
MAFS.912.A-SSE.2: Write expressions in equivalent forms to solve problems.
MAFS.912.A-SSE.2.3: Choose and produce an equivalent form of an expression to reveal and explain properties of the quantity represented by the expression. c. Factor a quadratic expression to reveal the zeros of the function it defines. d. Complete the square in a quadratic expression to reveal the maximum or minimum
value of the function it defines. MAFS.912.A-REI.2: Solve equations and inequalities in one variable.
MAFS.912.A-REI.2.4: Solve quadratic equations in one variable. a. Use the method of completing the square to transform any quadratic equation in 𝑥
into an equation of the form (𝑥 − 𝑝)2 = 𝑞 that has the same solutions. Derive the quadratic formula from this form.
b. Solve quadratic equations by inspection (e.g., for x² = 49), taking square roots, completing the square, the quadratic formula and factoring, as appropriate to the initial form of the equation. Recognize when the quadratic formula gives complex solutions and write them as a ± bi for real numbers a and b.
MAFS.912.A-REI.3: Solve systems of equations.
MAFS.912.A-REI.3.7: Solve a simple system consisting of a linear equation and a quadratic equation in two variables algebraically and graphically. For example, find the points of intersection between the line y = –3x and the circle x² + y² = 3.
MAFS.912.A-CED.1.2: Create equations that describe numbers or relationships
MAFS.912.A-CED.1.2: Create equations in two or more variables to represent relationships between quantities; graph equations on coordinate axes with labels and scales.
MAFS.912.F-LE.1: Construct and compare linear, quadratic, and exponential models and solve problems.
MAFS.912.F-LE.1.1: Distinguish between situations that can be modeled with linear functions and with exponential functions. b. Recognize situations in which one quantity changes at a constant rate per unit interval
relative to another.
LAFS.910.WHST.2.4: Produce clear and coherent writing in which the development, organization, and style are appropriate to task, purpose, and audience. ELD.K12.ELL.AC.1: English language learners communicate information, ideas and concepts necessary for academic success in the content area of Mathematics.
Suggested Mathematical Practice Standards MAFS.K12.MP.4.1: Model with mathematics.
How does the graph of a quadratic function provide useful information for solving real-life problems?
MAFS.K12.MP.5.1: Use appropriate tools strategically.
What is another way to find the zeros of a quadratic? Is one way more useful than another? Why or why not?
Essential Outcome Question(s)
Why do we use different methods to solve quadratic functions and how are these solutions related to the graph of the function?
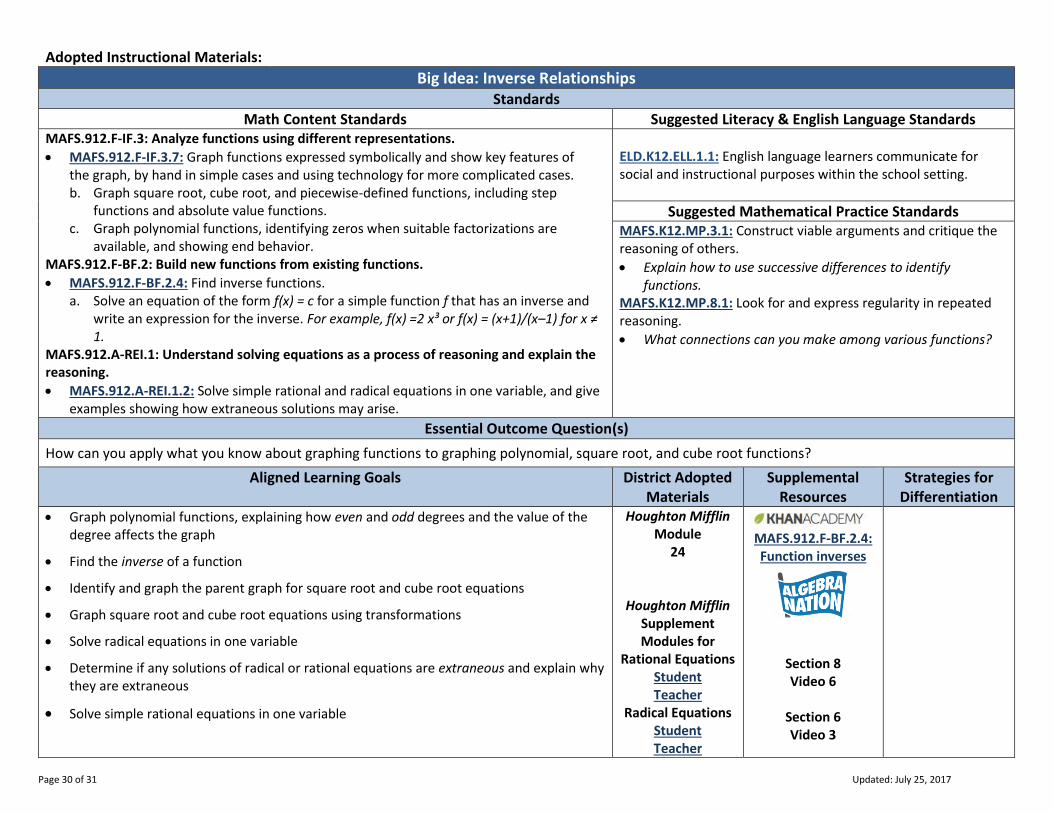
Math Content Standards Suggested Literacy & English Language Standards MAFS.912.F-IF.3: Analyze functions using different representations.
MAFS.912.F-IF.3.7: Graph functions expressed symbolically and show key features of the graph, by hand in simple cases and using technology for more complicated cases. b. Graph square root, cube root, and piecewise-defined functions, including step
functions and absolute value functions. c. Graph polynomial functions, identifying zeros when suitable factorizations are
available, and showing end behavior. MAFS.912.F-BF.2: Build new functions from existing functions.
MAFS.912.F-BF.2.4: Find inverse functions. a. Solve an equation of the form f(x) = c for a simple function f that has an inverse and
write an expression for the inverse. For example, f(x) =2 x³ or f(x) = (x+1)/(x–1) for x ≠ 1.
MAFS.912.A-REI.1: Understand solving equations as a process of reasoning and explain the reasoning.
MAFS.912.A-REI.1.2: Solve simple rational and radical equations in one variable, and give examples showing how extraneous solutions may arise.
ELD.K12.ELL.1.1: English language learners communicate for social and instructional purposes within the school setting.
Suggested Mathematical Practice Standards MAFS.K12.MP.3.1: Construct viable arguments and critique the reasoning of others.
Explain how to use successive differences to identify functions.
MAFS.K12.MP.8.1: Look for and express regularity in repeated reasoning.
What connections can you make among various functions?
Essential Outcome Question(s)
How can you apply what you know about graphing functions to graphing polynomial, square root, and cube root functions?
Aligned Learning Goals District Adopted Materials
Supplemental Resources
Strategies for Differentiation
Graph polynomial functions, explaining how even and odd degrees and the value of the degree affects the graph
Find the inverse of a function
Identify and graph the parent graph for square root and cube root equations
Graph square root and cube root equations using transformations
Solve radical equations in one variable
Determine if any solutions of radical or rational equations are extraneous and explain why they are extraneous