APPLICATION OF A MULTIPLEX ASSAY TO DETECT CHANGES IN ANTI-MALARIAL ANTIBODIES AT POPULATION LEVEL: A method to evaluate malaria control interventions in low endemic areas By: Laura Willen Master Thesis in partial fulfillment of the requirements for the degree Master in Biomedical Sciences Promotor: Prof. Dr. Marc Coosemans Copromotor: Dr. Didier Menard Supervisor: Dr. Lies Durnez Mentor: Karen Kerkhof Institute of Tropical Medicine Department of Biomedical Sciences – Unit of Medical Entomology Institut Pasteur du Cambodge Department of Biomedical Sciences – Unit of Molecular Epidemiology Academic Year 2013-2014 Faculty Pharmaceutical, Biomedical and Veterinary Sciences Biomedical Sciences
Transcript
APPLICATION OF A MULTIPLEX ASSAY TO DETECT CHANGES IN ANTI-MALARIAL ANTIBODIES AT POPULATION LEVEL:
A method to evaluate malaria control interventions in low endemic areas
By:
Laura Willen
Master Thesis in partial fulfillment of the requirements for the degree
Master in Biomedical Sciences
Promotor: Prof. Dr. Marc Coosemans Copromotor: Dr. Didier Menard Supervisor: Dr. Lies Durnez Mentor: Karen Kerkhof
Institute of Tropical Medicine Department of Biomedical Sciences – Unit of Medical Entomology Institut Pasteur du Cambodge Department of Biomedical Sciences – Unit of Molecular Epidemiology
Academic Year 2013-2014
Faculty Pharmaceutical, Biomedical and Veterinary Sciences
Biomedical Sciences
I
Acknowledgements First of all I would like to thank everyone who has helped me and supported me throughout my thesis, especially all my colleagues at the Institute of Tropical Medicine Antwerp (ITM) and Institut Pasteur du Cambodge (IPC). Special thanks go out to my supervisor Dr. Lies Durnez from the ITM, who has helped and supported me, revised my master thesis and provided me with useful comments and remarks to make me a more critical researcher. Furthermore, I would like to thank my mentor Karen Kerkhof from the ITM, who has helped me during the practical work at the IPC and supported me during the entire process, Sophalai Bin from the IPC for his help during the practical work at the IPC and Vincent Sluydts who has provided guidance for the statistical analyses in this thesis. Also, I would like to thank my promotor Prof. Dr. Marc Coosemans for the opportunities that he gave me and for his useful comments when reviewing my thesis, and my co-promotor Dr. Didier Menard for welcoming me in his lab. Finally, I would like to thank my family and friends who stood by me and supported me during the entire process and for their help during my stay in Cambodia.
Laura
II
Contributions to this thesis The National Centre for Parasitology, Entomology and Malaria Control and the ITM Antwerp performed the sample collection of the four surveys in the Ratanakiri province in Cambodia, and the Institut Pasteur du Cambodge performed all PCR analyses in a mobile laboratory. The literature research and the project proposal are performed by myself, under direct supervision of LD and corrected by LD and MC. The protocols used were written by KK. All the practical work at the Institut Pasteur du Cambodge is performed by myself, in collaboration with KK and SB, under supervision of DM. Determination of the cutoff value with the preprogrammed STATA software and further data entry and analysis of the results in R was done at the ITM by myself, under supervision of LD and VS. I performed the writing of the thesis, which was corrected by KK, LD, VS and MC. This work is part of a larger project on the evaluation of large use of tropical repellent in addition to insecticide treated nets in the control of malaria transmission (Bill & Melinda Gates Foundation)
MC Prof. Dr. Marc Coosemans, ITM Antwerp LD Dr. Lies Durnez, ITM Antwerp VC Dr. Vincent Sluydts, ITM Antwerp DM Dr. Didier Menard, Institut Pasteur du Cambodge, Phnom Penh KK Karen Kerkhof, ITM Antwerp SB Sophalai Bin, Institut Pasteur du Cambodge, Phnom Penh
III
Table of content Acknowledgements ..................................................................................................................... I
Contributions to this thesis ........................................................................................................ II
Table of content ........................................................................................................................ III
List of abbreviations .................................................................................................................. IV
Abstract ..................................................................................................................................... VI
Samenvatting ............................................................................................................................ VII
4.1 Comparison percentage positivity and seroprevalence between PCR positive and negative individuals ...................................................................................................... 18
4.2 Evaluation of fluctuation of antibodies ..................................................................... 25
4.3 Comparison seroprevalence and percentage positivity between control and intervention arm .......................................................................................................... 31
8.1 Annex I – Supplementary figures............................................................................... 52
V
List of abbreviations Abs Antibodies Ags Antigens AMA Apical membrane protein CNMCP Cambodian National Malaria Control Program CSP Circumsporozoite protein DBL Duffy binding-like family DBP Duffy antigen binding proteins EBA Erythrocyte binding antigens EBP Erythrocyte-binding proteins EDC 1-Ethyl-3-[dimethylaminopropyl]carbodiimide hydrochloride EIR Entomological inoculation rate ELISA Enzyme-linked immunosorbent assay EMP Erythrocyte membrane protein FOI Force of infection GEE Generalized estimating equation GLURP Glutamate-rich protein IFAT Immunofluorescence antibody testing IgG Immunoglobulin G IgM Immunoglobulin M IPC Institut Pasteur du Cambodge IRS Indoor residual spraying ITNs Insecticide treated nets LLINs Long lasting insecticidal nets LSA Liver stage antigen MFI Median fluorescent intensity MSP Merozoite surface protein OD Optical density PBS-CR Phosphate buffered saline – Charles River PCR Polymerase chain reaction PP Percentage positivity RBM Roll Back Malaria SALSA Sporozoite- and liver stage antigen SOP Standard operating procedure SR11.1 Sub-region antigen 11.1 STARP Sporozoite threonine- and asparagine- rich protein Sulfo-NHS N-hydroxysulfosuccinimide TRAP Thrombospondin-related anonymous protein WHA World Health Assembly
VI
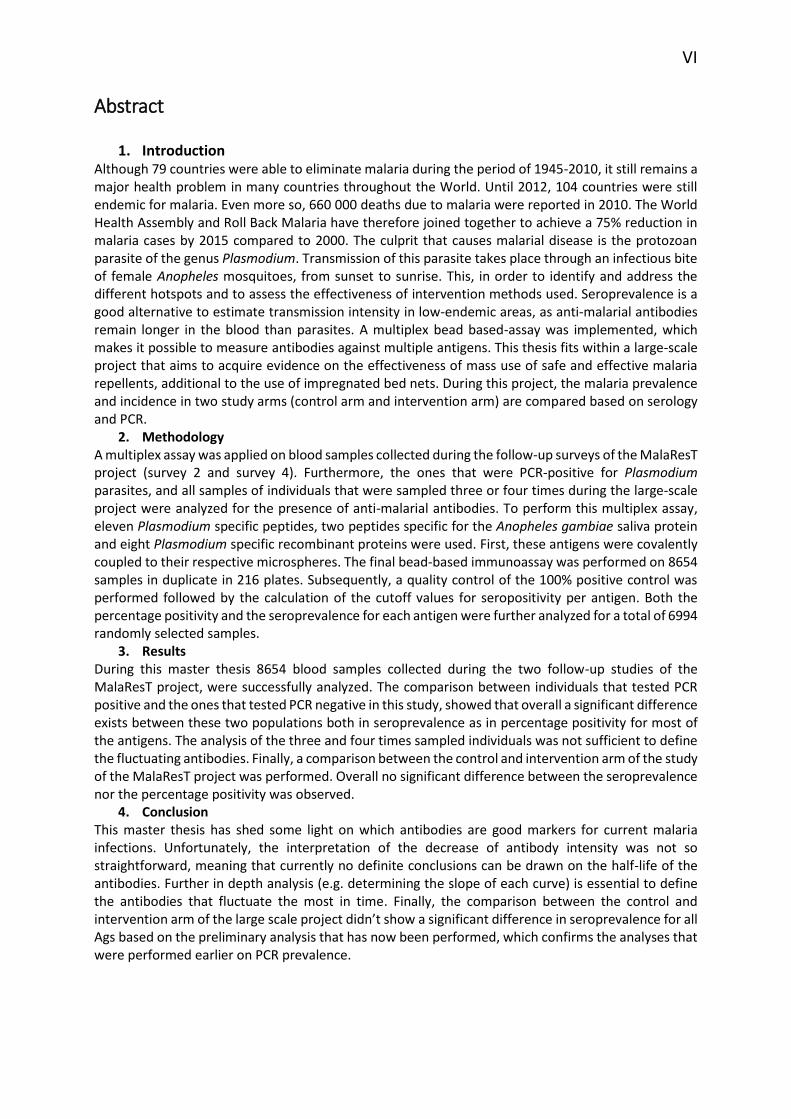
Abstract
1. Introduction Although 79 countries were able to eliminate malaria during the period of 1945-2010, it still remains a major health problem in many countries throughout the World. Until 2012, 104 countries were still endemic for malaria. Even more so, 660 000 deaths due to malaria were reported in 2010. The World Health Assembly and Roll Back Malaria have therefore joined together to achieve a 75% reduction in malaria cases by 2015 compared to 2000. The culprit that causes malarial disease is the protozoan parasite of the genus Plasmodium. Transmission of this parasite takes place through an infectious bite of female Anopheles mosquitoes, from sunset to sunrise. This, in order to identify and address the different hotspots and to assess the effectiveness of intervention methods used. Seroprevalence is a good alternative to estimate transmission intensity in low-endemic areas, as anti-malarial antibodies remain longer in the blood than parasites. A multiplex bead based-assay was implemented, which makes it possible to measure antibodies against multiple antigens. This thesis fits within a large-scale project that aims to acquire evidence on the effectiveness of mass use of safe and effective malaria repellents, additional to the use of impregnated bed nets. During this project, the malaria prevalence and incidence in two study arms (control arm and intervention arm) are compared based on serology and PCR.
2. Methodology A multiplex assay was applied on blood samples collected during the follow-up surveys of the MalaResT project (survey 2 and survey 4). Furthermore, the ones that were PCR-positive for Plasmodium parasites, and all samples of individuals that were sampled three or four times during the large-scale project were analyzed for the presence of anti-malarial antibodies. To perform this multiplex assay, eleven Plasmodium specific peptides, two peptides specific for the Anopheles gambiae saliva protein and eight Plasmodium specific recombinant proteins were used. First, these antigens were covalently coupled to their respective microspheres. The final bead-based immunoassay was performed on 8654 samples in duplicate in 216 plates. Subsequently, a quality control of the 100% positive control was performed followed by the calculation of the cutoff values for seropositivity per antigen. Both the percentage positivity and the seroprevalence for each antigen were further analyzed for a total of 6994 randomly selected samples.
3. Results During this master thesis 8654 blood samples collected during the two follow-up studies of the MalaResT project, were successfully analyzed. The comparison between individuals that tested PCR positive and the ones that tested PCR negative in this study, showed that overall a significant difference exists between these two populations both in seroprevalence as in percentage positivity for most of the antigens. The analysis of the three and four times sampled individuals was not sufficient to define the fluctuating antibodies. Finally, a comparison between the control and intervention arm of the study of the MalaResT project was performed. Overall no significant difference between the seroprevalence nor the percentage positivity was observed.
4. Conclusion This master thesis has shed some light on which antibodies are good markers for current malaria infections. Unfortunately, the interpretation of the decrease of antibody intensity was not so straightforward, meaning that currently no definite conclusions can be drawn on the half-life of the antibodies. Further in depth analysis (e.g. determining the slope of each curve) is essential to define the antibodies that fluctuate the most in time. Finally, the comparison between the control and intervention arm of the large scale project didn’t show a significant difference in seroprevalence for all Ags based on the preliminary analysis that has now been performed, which confirms the analyses that were performed earlier on PCR prevalence.
VII
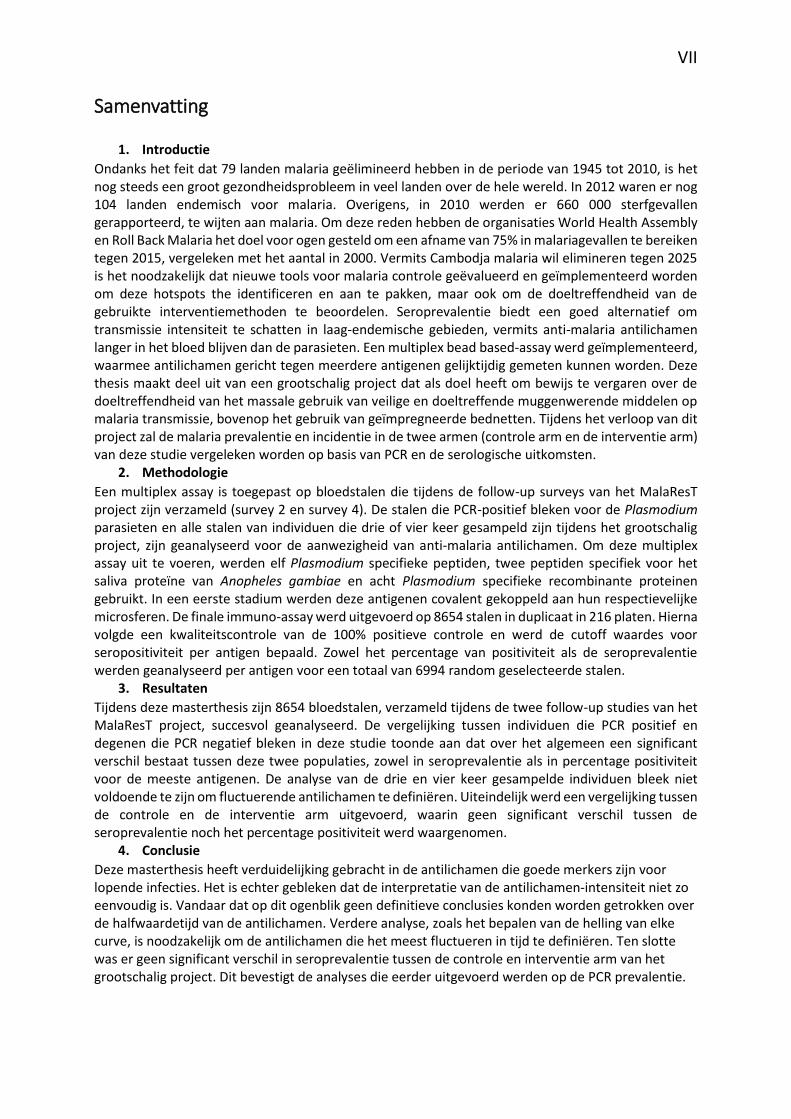
Samenvatting
1. Introductie
Ondanks het feit dat 79 landen malaria geëlimineerd hebben in de periode van 1945 tot 2010, is het nog steeds een groot gezondheidsprobleem in veel landen over de hele wereld. In 2012 waren er nog 104 landen endemisch voor malaria. Overigens, in 2010 werden er 660 000 sterfgevallen gerapporteerd, te wijten aan malaria. Om deze reden hebben de organisaties World Health Assembly en Roll Back Malaria het doel voor ogen gesteld om een afname van 75% in malariagevallen te bereiken tegen 2015, vergeleken met het aantal in 2000. Vermits Cambodja malaria wil elimineren tegen 2025 is het noodzakelijk dat nieuwe tools voor malaria controle geëvalueerd en geïmplementeerd worden om deze hotspots the identificeren en aan te pakken, maar ook om de doeltreffendheid van de gebruikte interventiemethoden te beoordelen. Seroprevalentie biedt een goed alternatief om transmissie intensiteit te schatten in laag-endemische gebieden, vermits anti-malaria antilichamen langer in het bloed blijven dan de parasieten. Een multiplex bead based-assay werd geïmplementeerd, waarmee antilichamen gericht tegen meerdere antigenen gelijktijdig gemeten kunnen worden. Deze thesis maakt deel uit van een grootschalig project dat als doel heeft om bewijs te vergaren over de doeltreffendheid van het massale gebruik van veilige en doeltreffende muggenwerende middelen op malaria transmissie, bovenop het gebruik van geïmpregneerde bednetten. Tijdens het verloop van dit project zal de malaria prevalentie en incidentie in de twee armen (controle arm en de interventie arm) van deze studie vergeleken worden op basis van PCR en de serologische uitkomsten.
2. Methodologie
Een multiplex assay is toegepast op bloedstalen die tijdens de follow-up surveys van het MalaResT project zijn verzameld (survey 2 en survey 4). De stalen die PCR-positief bleken voor de Plasmodium parasieten en alle stalen van individuen die drie of vier keer gesampeld zijn tijdens het grootschalig project, zijn geanalyseerd voor de aanwezigheid van anti-malaria antilichamen. Om deze multiplex assay uit te voeren, werden elf Plasmodium specifieke peptiden, twee peptiden specifiek voor het saliva proteïne van Anopheles gambiae en acht Plasmodium specifieke recombinante proteinen gebruikt. In een eerste stadium werden deze antigenen covalent gekoppeld aan hun respectievelijke microsferen. De finale immuno-assay werd uitgevoerd op 8654 stalen in duplicaat in 216 platen. Hierna volgde een kwaliteitscontrole van de 100% positieve controle en werd de cutoff waardes voor seropositiviteit per antigen bepaald. Zowel het percentage van positiviteit als de seroprevalentie werden geanalyseerd per antigen voor een totaal van 6994 random geselecteerde stalen.
3. Resultaten
Tijdens deze masterthesis zijn 8654 bloedstalen, verzameld tijdens de twee follow-up studies van het MalaResT project, succesvol geanalyseerd. De vergelijking tussen individuen die PCR positief en degenen die PCR negatief bleken in deze studie toonde aan dat over het algemeen een significant verschil bestaat tussen deze twee populaties, zowel in seroprevalentie als in percentage positiviteit voor de meeste antigenen. De analyse van de drie en vier keer gesampelde individuen bleek niet voldoende te zijn om fluctuerende antilichamen te definiëren. Uiteindelijk werd een vergelijking tussen de controle en de interventie arm uitgevoerd, waarin geen significant verschil tussen de seroprevalentie noch het percentage positiviteit werd waargenomen.
4. Conclusie
Deze masterthesis heeft verduidelijking gebracht in de antilichamen die goede merkers zijn voor lopende infecties. Het is echter gebleken dat de interpretatie van de antilichamen-intensiteit niet zo eenvoudig is. Vandaar dat op dit ogenblik geen definitieve conclusies konden worden getrokken over de halfwaardetijd van de antilichamen. Verdere analyse, zoals het bepalen van de helling van elke curve, is noodzakelijk om de antilichamen die het meest fluctueren in tijd te definiëren. Ten slotte was er geen significant verschil in seroprevalentie tussen de controle en interventie arm van het grootschalig project. Dit bevestigt de analyses die eerder uitgevoerd werden op de PCR prevalentie.
I n t r o d u c t i o n P a g e | 1
1 Introduction In the following paragraphs, I will give an overview of the malaria burden in the world and more specifically in the Western Pacific Region and Cambodia. Furthermore, the aspect of serology is discussed, as the aim of this thesis is to eventually be able to assess the effectiveness of the used repellent in the study based on serological parameters.
1.1 Malaria in general Malaria is a parasitic disease that is very common in the animal kingdom, it is present in reptiles, birds, rodents, and primates [1]. The protozoa of the genus Plasmodium are the causative organisms of a malaria infection. Human infections with this parasite can originate from one of the following five Plasmodium species: Plasmodium falciparum, Plasmodium vivax, Plasmodium ovale, Plasmodium malariae, and Plasmodium knowlesi [2]. Among these Plasmodium species, P. falciparum is by far the most dangerous one, accounting for the vast majority of deaths [1]. P. vivax still causes significant symptoms, but compared with P. falciparum it is less dangerous. P. ovale and P. vivax both have a latent hypnozoite phase, which can cause relapses, however most often these latent malaria infections involve P. malariae [1]. Furthermore, P. knowlesi is a Plasmodium species that normally causes malaria amongst monkeys, but can also cause infection in humans [2]. Transmission of malaria occurs exclusively through the bites of the Anopheles mosquitoes [3]. Only around 70-80 of the more than 400 anopheline species are good vectors [2]. A distinction has to be made between stable and unstable transmission in countries where malaria infection is present. In case there is a constant, year-round infection, one uses the term stable transmission to indicate that malaria transmission seems to be continuous throughout the year and from one year to the next [1]. On the contrary, areas of unstable transmission show a low, erratic or focal transmission of malaria and fluctuations from year to year in the incidence of the parasite exist [1, 2]. When in these areas changes in environmental, economic or social conditions emerge together with a breakdown in malaria control and prevention, low or moderate epidemics can arise [2]. Malaria was once prevalent throughout much of the inhabited world. Nonetheless, the USA, Europe and Russia were able to eliminate it [2]. A lot of effort has been put into the control and elimination of malaria in malaria-endemic areas. These efforts date back to the 19th century [4]. During the first half of the 20th century, 178 countries had endemic malaria [4]. Despite the large-scale efforts to eliminate malaria throughout this period, not much progress was achieved. This was largely due to the disruption by World War I and II [4]. However after this period, from 1945 to 2010, a total of 79 countries were able to eliminate malaria [4]. Based on these results, the idea of eliminating malaria in more endemic countries arose. This is referred to as ‘Shrinking the malaria map’ [4]. According to the World Health Organization, countries can be grouped in four program phases: the control phase, pre-elimination phase, elimination phase, and finally the phase in which the country prevents re-introduction of malaria [4], which is illustrated in Figure 1. Most of the countries in the malaria elimination phase, already have large malaria-free areas, whereas in the rest of the country the transmission and incidence of malaria are low [4, 5]. In addition, parasite reservoirs seem to linger in these countries in small geographical areas, also called hotspots [6]. The reported malaria cases in these countries are demographically clustered according to social, behavioural, and geographical features. These clusters are also referred to as hot-populations (hot-pops) [6]. This changing epidemiology is important to consider when a country is going for malaria elimination.
I n t r o d u c t i o n P a g e | 2
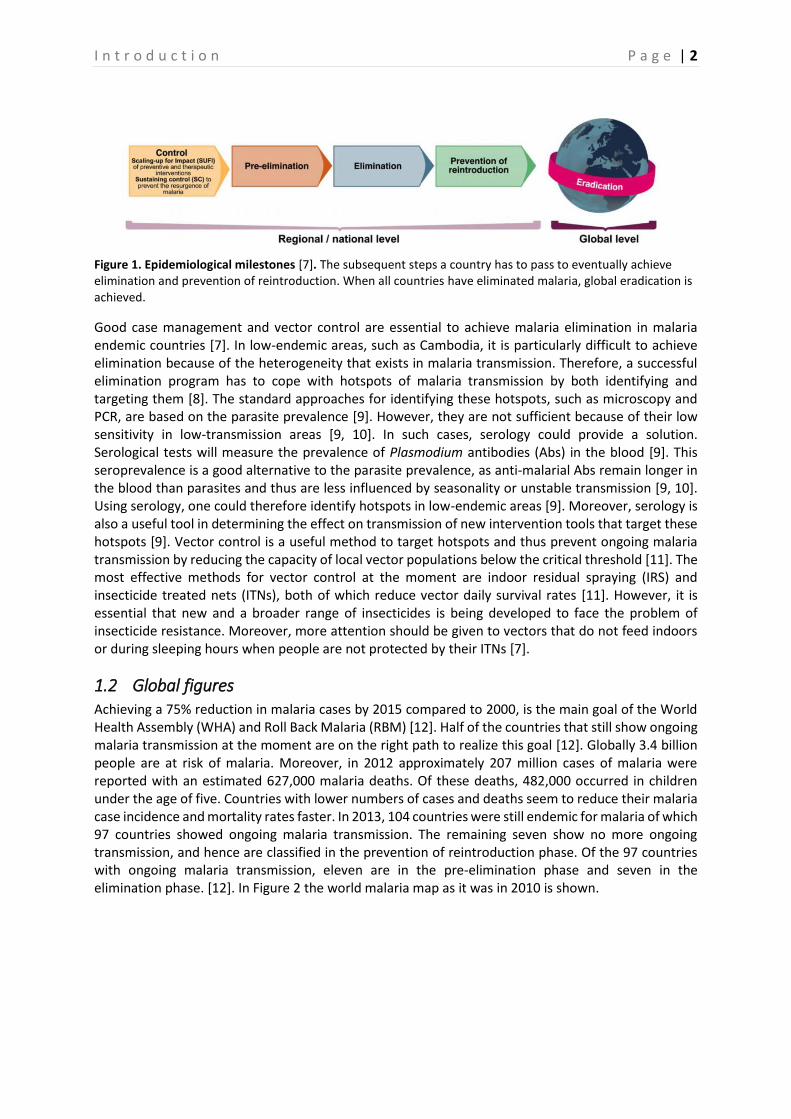
Figure 1. Epidemiological milestones [7]. The subsequent steps a country has to pass to eventually achieve elimination and prevention of reintroduction. When all countries have eliminated malaria, global eradication is achieved.
Good case management and vector control are essential to achieve malaria elimination in malaria endemic countries [7]. In low-endemic areas, such as Cambodia, it is particularly difficult to achieve elimination because of the heterogeneity that exists in malaria transmission. Therefore, a successful elimination program has to cope with hotspots of malaria transmission by both identifying and targeting them [8]. The standard approaches for identifying these hotspots, such as microscopy and PCR, are based on the parasite prevalence [9]. However, they are not sufficient because of their low sensitivity in low-transmission areas [9, 10]. In such cases, serology could provide a solution. Serological tests will measure the prevalence of Plasmodium antibodies (Abs) in the blood [9]. This seroprevalence is a good alternative to the parasite prevalence, as anti-malarial Abs remain longer in the blood than parasites and thus are less influenced by seasonality or unstable transmission [9, 10]. Using serology, one could therefore identify hotspots in low-endemic areas [9]. Moreover, serology is also a useful tool in determining the effect on transmission of new intervention tools that target these hotspots [9]. Vector control is a useful method to target hotspots and thus prevent ongoing malaria transmission by reducing the capacity of local vector populations below the critical threshold [11]. The most effective methods for vector control at the moment are indoor residual spraying (IRS) and insecticide treated nets (ITNs), both of which reduce vector daily survival rates [11]. However, it is essential that new and a broader range of insecticides is being developed to face the problem of insecticide resistance. Moreover, more attention should be given to vectors that do not feed indoors or during sleeping hours when people are not protected by their ITNs [7].
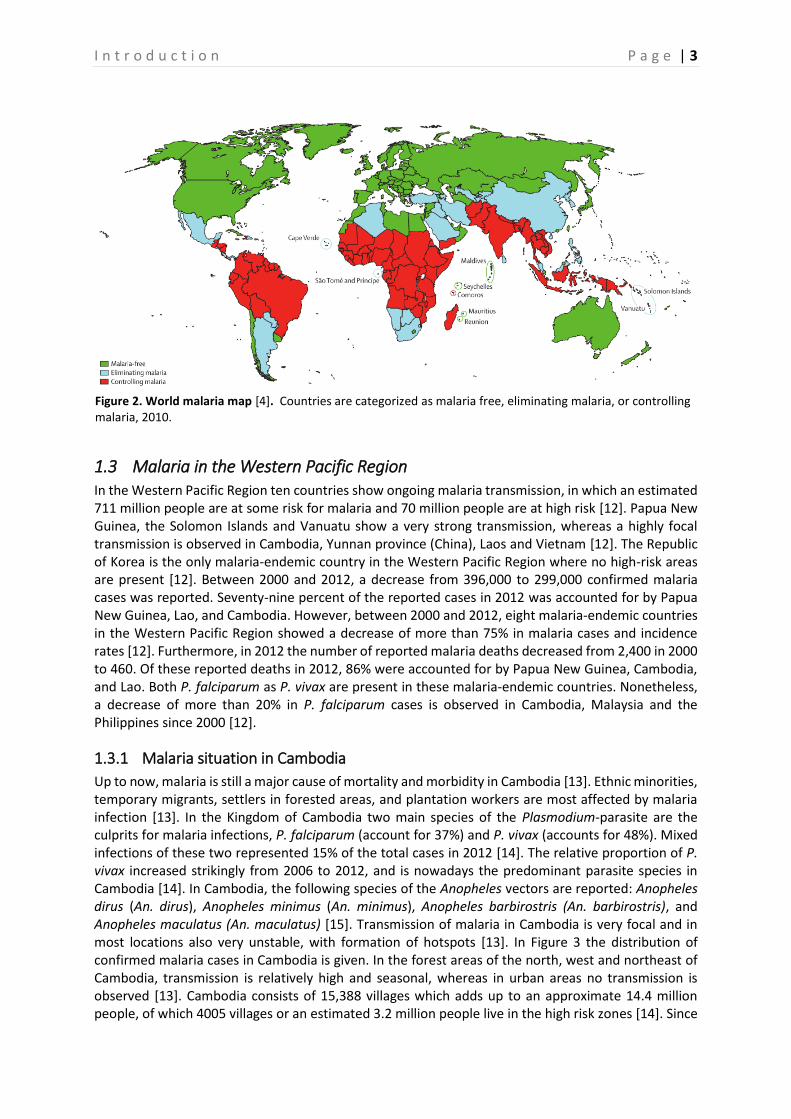
1.2 Global figures Achieving a 75% reduction in malaria cases by 2015 compared to 2000, is the main goal of the World Health Assembly (WHA) and Roll Back Malaria (RBM) [12]. Half of the countries that still show ongoing malaria transmission at the moment are on the right path to realize this goal [12]. Globally 3.4 billion people are at risk of malaria. Moreover, in 2012 approximately 207 million cases of malaria were reported with an estimated 627,000 malaria deaths. Of these deaths, 482,000 occurred in children under the age of five. Countries with lower numbers of cases and deaths seem to reduce their malaria case incidence and mortality rates faster. In 2013, 104 countries were still endemic for malaria of which 97 countries showed ongoing malaria transmission. The remaining seven show no more ongoing transmission, and hence are classified in the prevention of reintroduction phase. Of the 97 countries with ongoing malaria transmission, eleven are in the pre-elimination phase and seven in the elimination phase. [12]. In Figure 2 the world malaria map as it was in 2010 is shown.
I n t r o d u c t i o n P a g e | 3
1.3 Malaria in the Western Pacific Region In the Western Pacific Region ten countries show ongoing malaria transmission, in which an estimated 711 million people are at some risk for malaria and 70 million people are at high risk [12]. Papua New Guinea, the Solomon Islands and Vanuatu show a very strong transmission, whereas a highly focal transmission is observed in Cambodia, Yunnan province (China), Laos and Vietnam [12]. The Republic of Korea is the only malaria-endemic country in the Western Pacific Region where no high-risk areas are present [12]. Between 2000 and 2012, a decrease from 396,000 to 299,000 confirmed malaria cases was reported. Seventy-nine percent of the reported cases in 2012 was accounted for by Papua New Guinea, Lao, and Cambodia. However, between 2000 and 2012, eight malaria-endemic countries in the Western Pacific Region showed a decrease of more than 75% in malaria cases and incidence rates [12]. Furthermore, in 2012 the number of reported malaria deaths decreased from 2,400 in 2000 to 460. Of these reported deaths in 2012, 86% were accounted for by Papua New Guinea, Cambodia, and Lao. Both P. falciparum as P. vivax are present in these malaria-endemic countries. Nonetheless, a decrease of more than 20% in P. falciparum cases is observed in Cambodia, Malaysia and the Philippines since 2000 [12].
1.3.1 Malaria situation in Cambodia
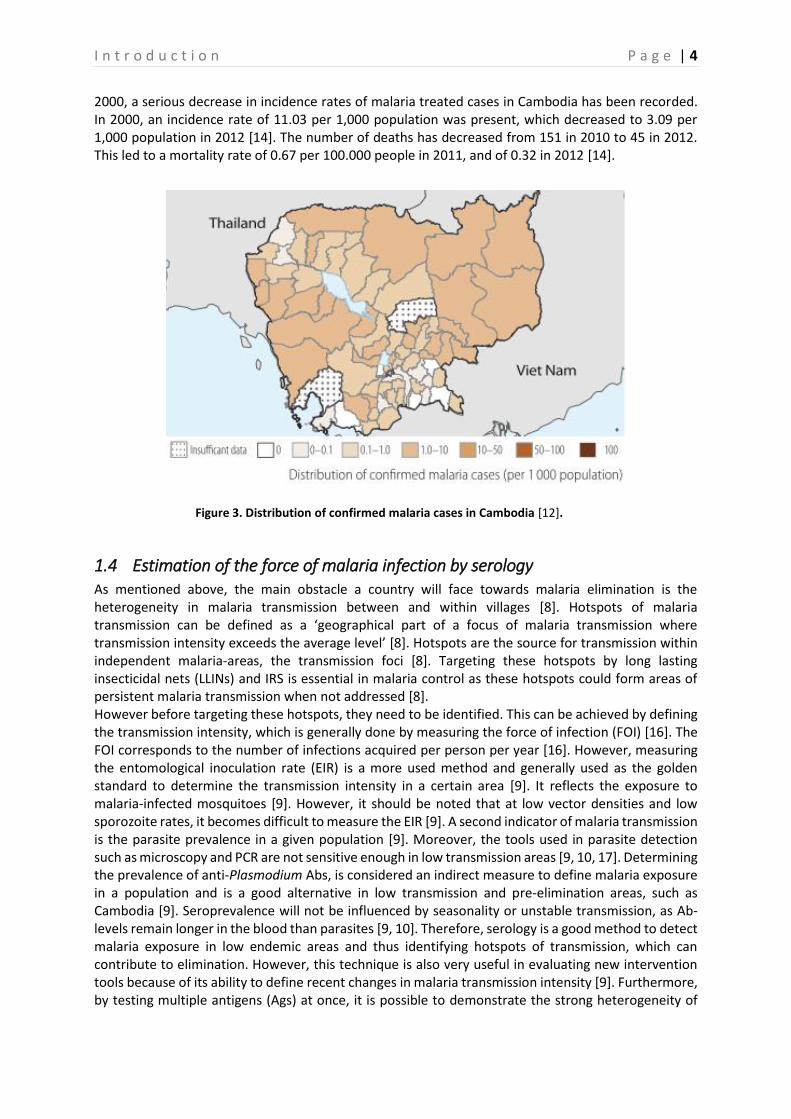
Up to now, malaria is still a major cause of mortality and morbidity in Cambodia [13]. Ethnic minorities, temporary migrants, settlers in forested areas, and plantation workers are most affected by malaria infection [13]. In the Kingdom of Cambodia two main species of the Plasmodium-parasite are the culprits for malaria infections, P. falciparum (account for 37%) and P. vivax (accounts for 48%). Mixed infections of these two represented 15% of the total cases in 2012 [14]. The relative proportion of P. vivax increased strikingly from 2006 to 2012, and is nowadays the predominant parasite species in Cambodia [14]. In Cambodia, the following species of the Anopheles vectors are reported: Anopheles dirus (An. dirus), Anopheles minimus (An. minimus), Anopheles barbirostris (An. barbirostris), and Anopheles maculatus (An. maculatus) [15]. Transmission of malaria in Cambodia is very focal and in most locations also very unstable, with formation of hotspots [13]. In Figure 3 the distribution of confirmed malaria cases in Cambodia is given. In the forest areas of the north, west and northeast of Cambodia, transmission is relatively high and seasonal, whereas in urban areas no transmission is observed [13]. Cambodia consists of 15,388 villages which adds up to an approximate 14.4 million people, of which 4005 villages or an estimated 3.2 million people live in the high risk zones [14]. Since
Figure 2. World malaria map [4]. Countries are categorized as malaria free, eliminating malaria, or controlling malaria, 2010.
I n t r o d u c t i o n P a g e | 4
2000, a serious decrease in incidence rates of malaria treated cases in Cambodia has been recorded. In 2000, an incidence rate of 11.03 per 1,000 population was present, which decreased to 3.09 per 1,000 population in 2012 [14]. The number of deaths has decreased from 151 in 2010 to 45 in 2012. This led to a mortality rate of 0.67 per 100.000 people in 2011, and of 0.32 in 2012 [14].
1.4 Estimation of the force of malaria infection by serology As mentioned above, the main obstacle a country will face towards malaria elimination is the heterogeneity in malaria transmission between and within villages [8]. Hotspots of malaria transmission can be defined as a ‘geographical part of a focus of malaria transmission where transmission intensity exceeds the average level’ [8]. Hotspots are the source for transmission within independent malaria-areas, the transmission foci [8]. Targeting these hotspots by long lasting insecticidal nets (LLINs) and IRS is essential in malaria control as these hotspots could form areas of persistent malaria transmission when not addressed [8]. However before targeting these hotspots, they need to be identified. This can be achieved by defining the transmission intensity, which is generally done by measuring the force of infection (FOI) [16]. The FOI corresponds to the number of infections acquired per person per year [16]. However, measuring the entomological inoculation rate (EIR) is a more used method and generally used as the golden standard to determine the transmission intensity in a certain area [9]. It reflects the exposure to malaria-infected mosquitoes [9]. However, it should be noted that at low vector densities and low sporozoite rates, it becomes difficult to measure the EIR [9]. A second indicator of malaria transmission is the parasite prevalence in a given population [9]. Moreover, the tools used in parasite detection such as microscopy and PCR are not sensitive enough in low transmission areas [9, 10, 17]. Determining the prevalence of anti-Plasmodium Abs, is considered an indirect measure to define malaria exposure in a population and is a good alternative in low transmission and pre-elimination areas, such as Cambodia [9]. Seroprevalence will not be influenced by seasonality or unstable transmission, as Ab-levels remain longer in the blood than parasites [9, 10]. Therefore, serology is a good method to detect malaria exposure in low endemic areas and thus identifying hotspots of transmission, which can contribute to elimination. However, this technique is also very useful in evaluating new intervention tools because of its ability to define recent changes in malaria transmission intensity [9]. Furthermore, by testing multiple antigens (Ags) at once, it is possible to demonstrate the strong heterogeneity of
Figure 3. Distribution of confirmed malaria cases in Cambodia [12].
I n t r o d u c t i o n P a g e | 5
malaria transmission based on different Ab responses. In Cambodia, this heterogeneity exists in both time and space, between age groups, as well as between different ethnic groups [10, 18–21]. In the following I will briefly discuss the humoral adaptive immune response elicited by a malaria infection, as the aim of this master thesis is to apply an assay that is used for the detection of multiple anti-malarial Abs. However, first a short introduction into the Plasmodium life cycle is given to clarify the aspects of the humoral immune response.
1.4.1 Plasmodium life cycle
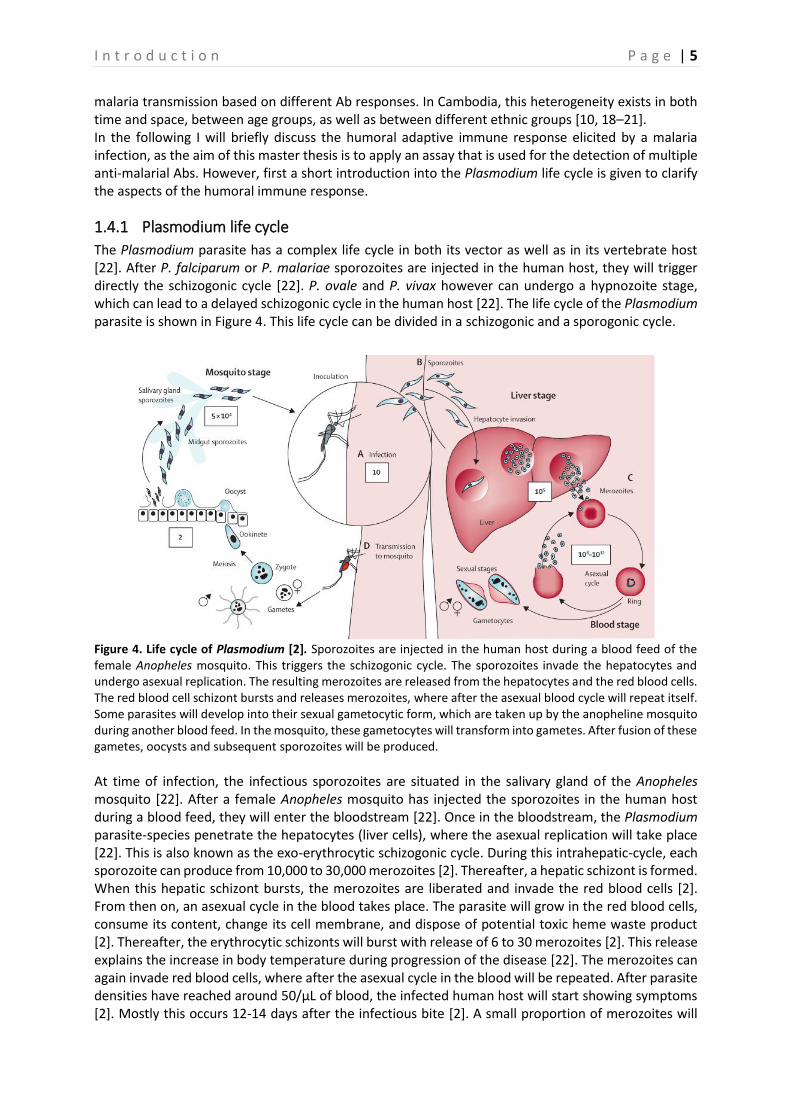
The Plasmodium parasite has a complex life cycle in both its vector as well as in its vertebrate host [22]. After P. falciparum or P. malariae sporozoites are injected in the human host, they will trigger directly the schizogonic cycle [22]. P. ovale and P. vivax however can undergo a hypnozoite stage, which can lead to a delayed schizogonic cycle in the human host [22]. The life cycle of the Plasmodium parasite is shown in Figure 4. This life cycle can be divided in a schizogonic and a sporogonic cycle.
Figure 4. Life cycle of Plasmodium [2]. Sporozoites are injected in the human host during a blood feed of the female Anopheles mosquito. This triggers the schizogonic cycle. The sporozoites invade the hepatocytes and undergo asexual replication. The resulting merozoites are released from the hepatocytes and the red blood cells. The red blood cell schizont bursts and releases merozoites, where after the asexual blood cycle will repeat itself. Some parasites will develop into their sexual gametocytic form, which are taken up by the anopheline mosquito during another blood feed. In the mosquito, these gametocytes will transform into gametes. After fusion of these gametes, oocysts and subsequent sporozoites will be produced.
At time of infection, the infectious sporozoites are situated in the salivary gland of the Anopheles mosquito [22]. After a female Anopheles mosquito has injected the sporozoites in the human host during a blood feed, they will enter the bloodstream [22]. Once in the bloodstream, the Plasmodium parasite-species penetrate the hepatocytes (liver cells), where the asexual replication will take place [22]. This is also known as the exo-erythrocytic schizogonic cycle. During this intrahepatic-cycle, each sporozoite can produce from 10,000 to 30,000 merozoites [2]. Thereafter, a hepatic schizont is formed. When this hepatic schizont bursts, the merozoites are liberated and invade the red blood cells [2]. From then on, an asexual cycle in the blood takes place. The parasite will grow in the red blood cells, consume its content, change its cell membrane, and dispose of potential toxic heme waste product [2]. Thereafter, the erythrocytic schizonts will burst with release of 6 to 30 merozoites [2]. This release explains the increase in body temperature during progression of the disease [22]. The merozoites can again invade red blood cells, where after the asexual cycle in the blood will be repeated. After parasite densities have reached around 50/μL of blood, the infected human host will start showing symptoms [2]. Mostly this occurs 12-14 days after the infectious bite [2]. A small proportion of merozoites will
I n t r o d u c t i o n P a g e | 6
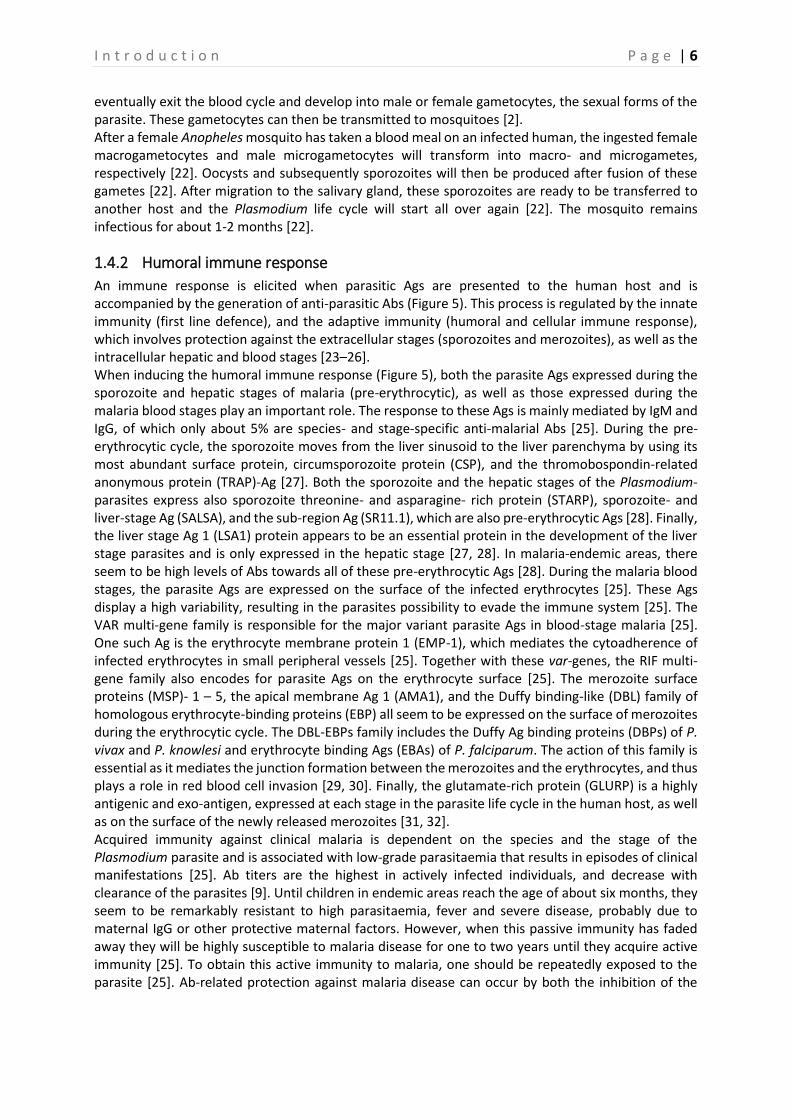
eventually exit the blood cycle and develop into male or female gametocytes, the sexual forms of the parasite. These gametocytes can then be transmitted to mosquitoes [2]. After a female Anopheles mosquito has taken a blood meal on an infected human, the ingested female macrogametocytes and male microgametocytes will transform into macro- and microgametes, respectively [22]. Oocysts and subsequently sporozoites will then be produced after fusion of these gametes [22]. After migration to the salivary gland, these sporozoites are ready to be transferred to another host and the Plasmodium life cycle will start all over again [22]. The mosquito remains infectious for about 1-2 months [22].
1.4.2 Humoral immune response
An immune response is elicited when parasitic Ags are presented to the human host and is accompanied by the generation of anti-parasitic Abs (Figure 5). This process is regulated by the innate immunity (first line defence), and the adaptive immunity (humoral and cellular immune response), which involves protection against the extracellular stages (sporozoites and merozoites), as well as the intracellular hepatic and blood stages [23–26]. When inducing the humoral immune response (Figure 5), both the parasite Ags expressed during the sporozoite and hepatic stages of malaria (pre-erythrocytic), as well as those expressed during the malaria blood stages play an important role. The response to these Ags is mainly mediated by IgM and IgG, of which only about 5% are species- and stage-specific anti-malarial Abs [25]. During the pre-erythrocytic cycle, the sporozoite moves from the liver sinusoid to the liver parenchyma by using its most abundant surface protein, circumsporozoite protein (CSP), and the thromobospondin-related anonymous protein (TRAP)-Ag [27]. Both the sporozoite and the hepatic stages of the Plasmodium-parasites express also sporozoite threonine- and asparagine- rich protein (STARP), sporozoite- and liver-stage Ag (SALSA), and the sub-region Ag (SR11.1), which are also pre-erythrocytic Ags [28]. Finally, the liver stage Ag 1 (LSA1) protein appears to be an essential protein in the development of the liver stage parasites and is only expressed in the hepatic stage [27, 28]. In malaria-endemic areas, there seem to be high levels of Abs towards all of these pre-erythrocytic Ags [28]. During the malaria blood stages, the parasite Ags are expressed on the surface of the infected erythrocytes [25]. These Ags display a high variability, resulting in the parasites possibility to evade the immune system [25]. The VAR multi-gene family is responsible for the major variant parasite Ags in blood-stage malaria [25]. One such Ag is the erythrocyte membrane protein 1 (EMP-1), which mediates the cytoadherence of infected erythrocytes in small peripheral vessels [25]. Together with these var-genes, the RIF multi-gene family also encodes for parasite Ags on the erythrocyte surface [25]. The merozoite surface proteins (MSP)- 1 – 5, the apical membrane Ag 1 (AMA1), and the Duffy binding-like (DBL) family of homologous erythrocyte-binding proteins (EBP) all seem to be expressed on the surface of merozoites during the erythrocytic cycle. The DBL-EBPs family includes the Duffy Ag binding proteins (DBPs) of P. vivax and P. knowlesi and erythrocyte binding Ags (EBAs) of P. falciparum. The action of this family is essential as it mediates the junction formation between the merozoites and the erythrocytes, and thus plays a role in red blood cell invasion [29, 30]. Finally, the glutamate-rich protein (GLURP) is a highly antigenic and exo-antigen, expressed at each stage in the parasite life cycle in the human host, as well as on the surface of the newly released merozoites [31, 32]. Acquired immunity against clinical malaria is dependent on the species and the stage of the Plasmodium parasite and is associated with low-grade parasitaemia that results in episodes of clinical manifestations [25]. Ab titers are the highest in actively infected individuals, and decrease with clearance of the parasites [9]. Until children in endemic areas reach the age of about six months, they seem to be remarkably resistant to high parasitaemia, fever and severe disease, probably due to maternal IgG or other protective maternal factors. However, when this passive immunity has faded away they will be highly susceptible to malaria disease for one to two years until they acquire active immunity [25]. To obtain this active immunity to malaria, one should be repeatedly exposed to the parasite [25]. Ab-related protection against malaria disease can occur by both the inhibition of the
I n t r o d u c t i o n P a g e | 7
merozoite invasion of erythrocytes, as the inhibition of the intra-erythrocytic growth or by enhancing the elimination of infected erythrocytes [25]. The longevity of the Abs that mediate protection is an important aspect that still needs to be defined. The plasma cells that secrete these Abs can either be short or long lived [33]. Therefore, the plasma cell population responsible for Ab secretion, could also account for the longevity of the Abs, as long lived plasma cells seem to secrete Abs for very long periods [33]. Akpogheneta et al. reported age-related Ab longevity of Ab responses to several Ags, concluding that their longevity increased during early childhood [33]. This observation could however also be due to the fact that the plasma cell population of young children overall involve short lived plasma cells, meaning that the Ab levels in these children rapidly decline when the infection is cleared [33]. Whereas older children have a higher proportion of long lived plasma cells which results in longer-lasting Ab responses [33]. Subsequently, persistent Ag presentation in older children is no longer needed for the persistent production of Abs [33]. They stated that infants produce Abs when actively infected, which at that moment appeared to be protective [34]. However, when the levels decreased the infant was not protected anymore [34]. Whether the increase in longevity of the Ab response is due to the fact that adults’ Abs are longer lived or because of the longer lived plasma cells in adults, is not clear. However, it has been proven by Taylor et al. that children show a clear fluctuation in Ab levels between seropositivity and seronegativity, whereas the Ab responses in adults do not fluctuate that much over time [19]. Even more so, it appeared that individuals were either continuously seropositive or seronegative for specific Ags [19].
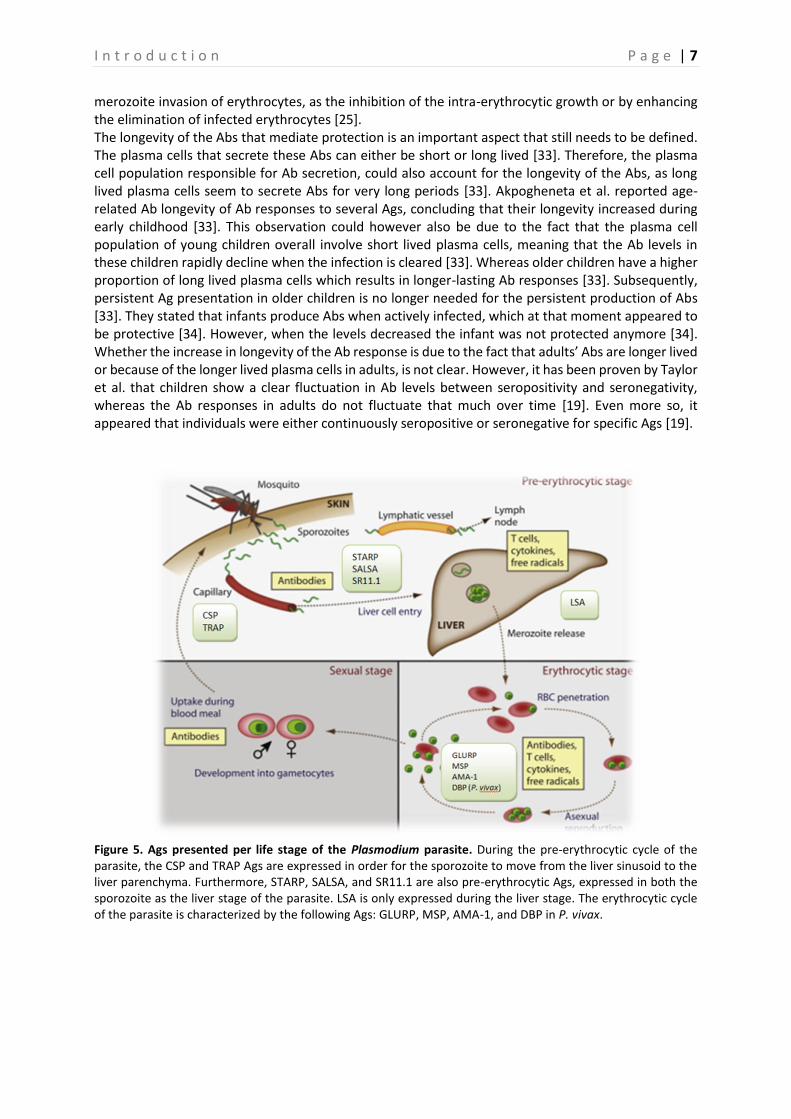
Figure 5. Ags presented per life stage of the Plasmodium parasite. During the pre-erythrocytic cycle of the parasite, the CSP and TRAP Ags are expressed in order for the sporozoite to move from the liver sinusoid to the liver parenchyma. Furthermore, STARP, SALSA, and SR11.1 are also pre-erythrocytic Ags, expressed in both the sporozoite as the liver stage of the parasite. LSA is only expressed during the liver stage. The erythrocytic cycle of the parasite is characterized by the following Ags: GLURP, MSP, AMA-1, and DBP in P. vivax.
I n t r o d u c t i o n P a g e | 8
1.5 Serological tools To define Ab levels in human sera, immunofluorescence Ab testing (IFAT) and enzyme-linked immunosorbent assay (ELISA) are the standard tests [31]. During the IFA test, a film of infected blood is put on a microscopic slide which is then covered with a serial dilution of the test serum and subsequently with a solution of antihuman globulin labelled to fluorescein isothiocyanate [35]. Thus, the parasite itself is used as Ag and visually observed under a fluorescent microscope [35]. By choosing between mono- or polyvalent antihuman sera, a difference can be made between IgG and IgM, based on fluorescence-intensity [35]. The ELISA procedure is similar to IFAT, with the difference that only a single Ag is now used instead of the whole parasite, and that the anti-Ab specific globulin is bound to an enzyme which will convert a substrate in order to observe a change of colour when the Ab has bound to the Ag [35]. It is however more difficult to detect low levels of Abs with ELISA than it is with the IFA test [35]. Both tests are highly sensitive, whereas the ELISA test also provides a high specificity [36]. There are however some disadvantages associated with these tests: they are labour-intensive, require a larger amount of serum, and only one Ag can be tested at the same time in the ELISA [31]. However, in order to detect all possible Ab responses, it is essential that multiple Ags are being tested [10]. That is why a multiplex bead assay has been developed. This test is extremely cost- and time-effective, only a minimum amount of serum is required, several Ags can be tested at once, and its sensitivity is comparable with (or even better than) an ELISA assay [31]. The multiplex bead based-assay uses paramagnetic microspheres/beads (polystyrene based) in order to detect the Ab response to multiple Ags simultaneously [37]. The principle of this technique is actually based on an ELISA, with the difference that Ags will now be coated on the paramagnetic beads instead of on a well. The Ags can be easily coupled to the microspheres, due to a carbodiimide reaction [38]. By multiplexing the coupled beads, a mixture of different beads coupled to different Ags will be obtained. This will then ensure that different Abs present in one blood sample are captured and quantified simultaneously. Eventually, the Abs present in the sample are measured by the MAGPIX, based on the colour code of the beads and the detection Ab [38, 39]. There are some studies that already performed this multiplex assay, however none in the Western Pacific Region. These multiplex-studies and other monoplex-studies will be further discussed in the discussion.
P r o j e c t p r o p o s a l P a g e | 9
2 Project proposal This master thesis is part of the MalaResT project, coordinated by the Institute of Tropical Medicine in collaboration with the Cambodian National Malaria Control Program (CNMCP) and Institut Pasteur du Cambodge (IPC). This project is set up to tackle outdoor and early biting transmission and it aims to acquire evidence on the effectiveness of mass use of safe and effective topical repellents, additional to the use of impregnated bed nets. During this project, the malaria prevalence and incidence in two study arms (control arm and intervention arm) will be compared based on PCR and serological outcomes respectively, to eventually assess the effectiveness of the used repellents. If this appears to be effective, it could contribute to the governmental objective of eliminating malaria in Cambodia by 2025. PCR is a widely used tool to measure the prevalence and incidence of malaria. Although the detection of parasite prevalence by PCR is useful as proxy of transmission intensity in high transmission areas, it has a low sensitivity in low-transmission areas. In these areas, a better approach to determine the force of malaria is rendered by serology. More specifically, anti-malaria Abs remain longer in the blood than parasites and are therefore less influenced by seasonality and unstable transmission. The most commonly used serological tools, ELISA and IFAT, are however time-consuming and labour-intensive (ELISA), or not specific enough (IFAT) when testing for the presence of multiple Abs in the serum. Therefore, a multiplex bead based-assay has recently been implemented in Cambodia, which makes it possible to measure Abs against multiple Ags. During this MSc thesis, the blood samples collected during the follow-up surveys of the study (survey 2 and survey 4) will be analyzed with the multiplex assay. Furthermore, the ones that were PCR-positive for Plasmodium parasites, and all samples of individuals that were sampled 3, 4 or 5 times during the large-scale project will be analyzed for the presence of anti-malarial Abs. Eventually, the general objective of this thesis is to make a first comparison between the different serological markers between both study arms. Finally, a robust measure of the force of infection (FOI) based on the multiplex serological data will be calculated, but this is out of the scope of this thesis. By including the individuals that were sampled several times, it is possible to look for the variation in Ab response in time in each individual, and to assess the effect of a malaria infection on the Ab responses. Furthermore, it will be essential to define the Abs that fluctuate the most in time, as these Abs will be very useful to evaluate future intervention methods. Therefore, this thesis will have the following specific objectives:
1. To determine the Ab response in blood samples of PCR-positive individuals and compare them with the response in PCR-negative individuals to identify Abs that are informative for current infection.
2. To determine the Ab response in all blood samples obtained from 3 and 4 times sampled individuals which tested positive in at least one survey for P. falciparum, P. vivax or P. malariae, to assess individual variation in Ab response and identifying Abs that fluctuate the most in time. It is assumed that Abs that fluctuate over short time periods are more sensitive to changes in transmission.
3. To determine the Ab responses in individuals sampled during cross-sectional surveys and to compare seroprevalence and Ab responses between the intervention and the control arm.
M a t e r i a l a n d m e t h o d s P a g e | 10
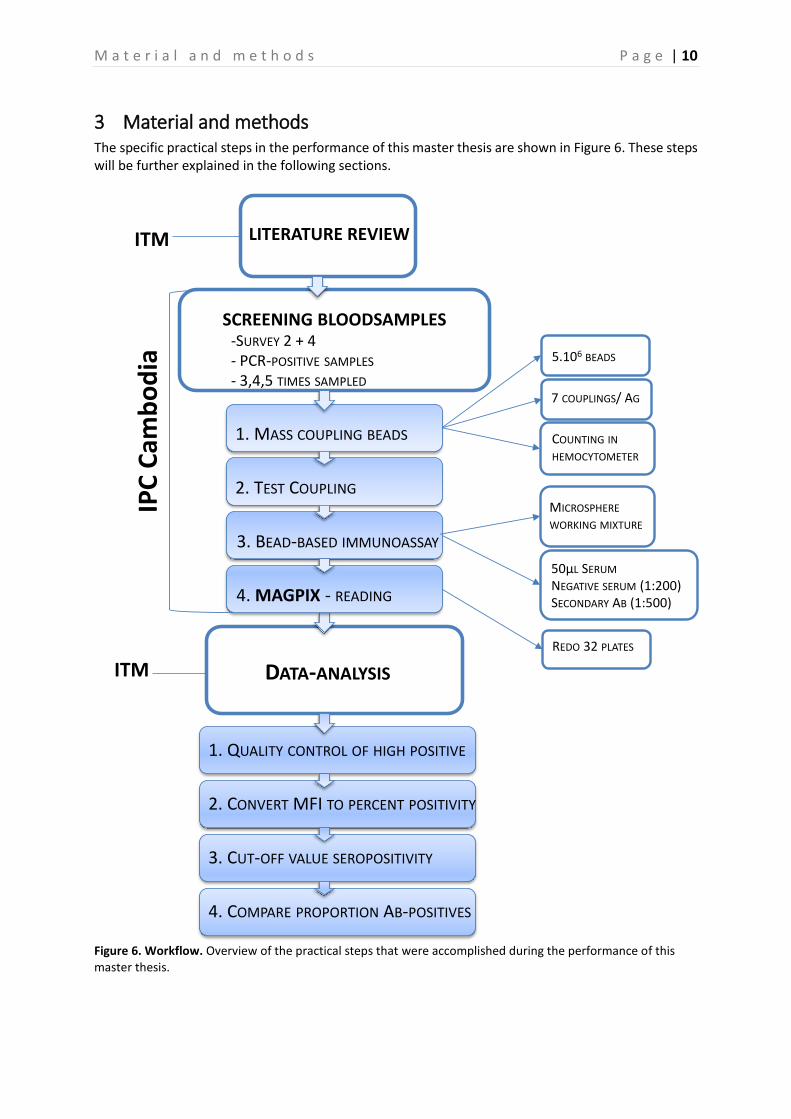
3 Material and methods The specific practical steps in the performance of this master thesis are shown in Figure 6. These steps will be further explained in the following sections.
Figure 6. Workflow. Overview of the practical steps that were accomplished during the performance of this master thesis.
3.1 Sera samples The repellent project, in which this master thesis is embedded, includes 98 clusters of villages in the high endemic province of Ratanakiri, Cambodia. These villages were randomly appointed to either of two treatment arms, a control and an intervention arm. Each arm consists of 49 clusters. All individuals in the control arm received a LLIN, whereas those in the intervention arm received the LLIN and were additionally provided bi-weekly with a topical repellent. Individuals in the intervention arm were asked to apply the repellent once every evening and every morning. After an initial pre-trial survey, the clusters were randomly allocated to the treatment arms based on eight different criteria, including past incidence, pre-trial prevalence, distance from each other, and population size. Thereafter, four surveys were carried out in order to obtain blood samples from randomly chosen people in these clusters at specific points in time. Per survey, 65 people were randomly selected in each cluster, of which an average of 50 were sampled (based on availability of people) by taking two drops of blood through a finger prick on a filter paper. This procedure has been repeated four times during two consecutive years, once at the start of the raining season in April and a second time six months later in October-November. The blood samples collected were analyzed immediately by real-time PCR to check for the parasite-prevalence. Thereafter, in a random selection of samples of survey 1, Abs against the Plasmodium Ags were detected by serology to look for previous exposure and to finally assess the longitudinal Ab-responses. The performed serology is essential to look for changes in seroprevalence as an estimation for malaria incidence. During this master thesis a random selection of 3500 blood samples collected during survey 2 and 4 was analyzed. Additionally, the ones that were PCR-positive for Plasmodium parasites, and all samples of individuals that were sampled three or four times during the project were analyzed as well.
3.2 Preparation of blood spots From each filter paper blood sample, 1 disc of 6mm (diameter) was punched into a 96-well plate and eluted overnight in 160µl of PBS-CR (Phosphate Buffered Saline – Charles River) (dilution of 1:40) at room temperature on a plate shaker. Before the assay, the concentration was adjusted to a dilution of 1:200 with PBS-CR, by transferring 30µl of serum and 120µl PBS-CR into a new plate [39]. To perform the final immunoassay, 50µl of this 1:200 dilution was used.
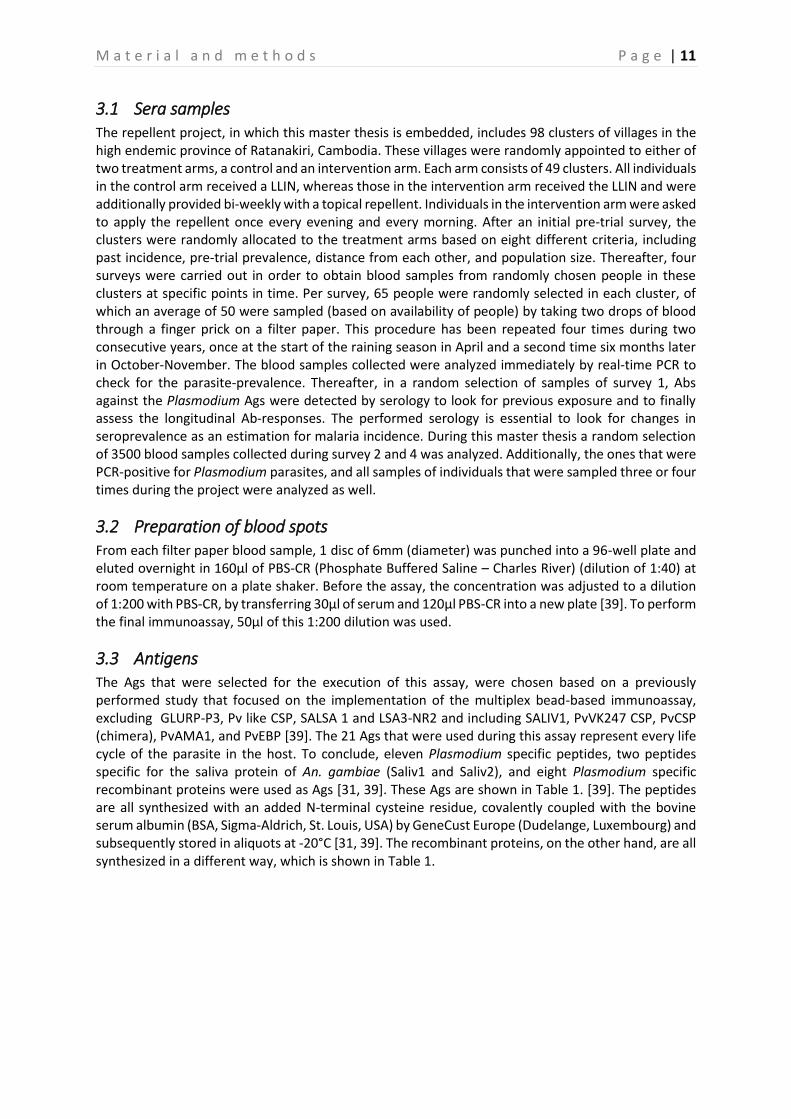
3.3 Antigens The Ags that were selected for the execution of this assay, were chosen based on a previously performed study that focused on the implementation of the multiplex bead-based immunoassay, excluding GLURP-P3, Pv like CSP, SALSA 1 and LSA3-NR2 and including SALIV1, PvVK247 CSP, PvCSP (chimera), PvAMA1, and PvEBP [39]. The 21 Ags that were used during this assay represent every life cycle of the parasite in the host. To conclude, eleven Plasmodium specific peptides, two peptides specific for the saliva protein of An. gambiae (Saliv1 and Saliv2), and eight Plasmodium specific recombinant proteins were used as Ags [31, 39]. These Ags are shown in Table 1. [39]. The peptides are all synthesized with an added N-terminal cysteine residue, covalently coupled with the bovine serum albumin (BSA, Sigma-Aldrich, St. Louis, USA) by GeneCust Europe (Dudelange, Luxembourg) and subsequently stored in aliquots at -20°C [31, 39]. The recombinant proteins, on the other hand, are all synthesized in a different way, which is shown in Table 1.
M a t e r i a l a n d m e t h o d s P a g e | 12
Table 1. Sequences of thirteen peptides used in this study and the eight recombinant proteins used in this study with their respective synthesis [39]. The life-cycle stage in which each Ag occurs is shown, together with the Plasmodium species.
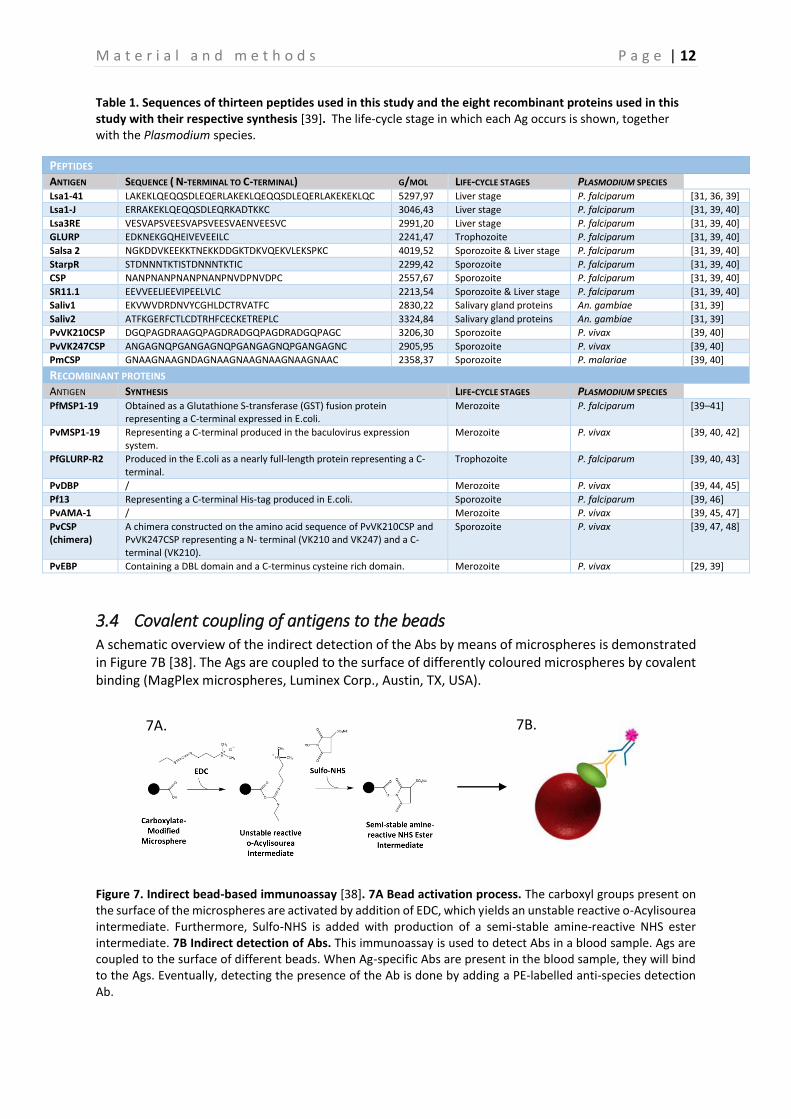
3.4 Covalent coupling of antigens to the beads A schematic overview of the indirect detection of the Abs by means of microspheres is demonstrated in Figure 7B [38]. The Ags are coupled to the surface of differently coloured microspheres by covalent binding (MagPlex microspheres, Luminex Corp., Austin, TX, USA).
Figure 7. Indirect bead-based immunoassay [38]. 7A Bead activation process. The carboxyl groups present on the surface of the microspheres are activated by addition of EDC, which yields an unstable reactive o-Acylisourea intermediate. Furthermore, Sulfo-NHS is added with production of a semi-stable amine-reactive NHS ester intermediate. 7B Indirect detection of Abs. This immunoassay is used to detect Abs in a blood sample. Ags are coupled to the surface of different beads. When Ag-specific Abs are present in the blood sample, they will bind to the Ags. Eventually, detecting the presence of the Ab is done by adding a PE-labelled anti-species detection Ab.
PEPTIDES
ANTIGEN SEQUENCE ( N-TERMINAL TO C-TERMINAL) G/MOL LIFE-CYCLE STAGES PLASMODIUM SPECIES Lsa1-41 LAKEKLQEQQSDLEQERLAKEKLQEQQSDLEQERLAKEKEKLQC 5297,97 Liver stage P. falciparum [31, 36, 39]
Lsa1-J ERRAKEKLQEQQSDLEQRKADTKKC 3046,43 Liver stage P. falciparum [31, 39, 40]
Lsa3RE VESVAPSVEESVAPSVEESVAENVEESVC 2991,20 Liver stage P. falciparum [31, 39, 40]
GLURP EDKNEKGQHEIVEVEEILC 2241,47 Trophozoite P. falciparum [31, 39, 40]
Saliv1 EKVWVDRDNVYCGHLDCTRVATFC 2830,22 Salivary gland proteins An. gambiae [31, 39]
Saliv2 ATFKGERFCTLCDTRHFCECKETREPLC 3324,84 Salivary gland proteins An. gambiae [31, 39]
PvVK210CSP DGQPAGDRAAGQPAGDRADGQPAGDRADGQPAGC 3206,30 Sporozoite P. vivax [39, 40]
PvVK247CSP ANGAGNQPGANGAGNQPGANGAGNQPGANGAGNC 2905,95 Sporozoite P. vivax [39, 40]
PmCSP GNAAGNAAGNDAGNAAGNAAGNAAGNAAGNAAC 2358,37 Sporozoite P. malariae [39, 40]
RECOMBINANT PROTEINS
ANTIGEN SYNTHESIS LIFE-CYCLE STAGES PLASMODIUM SPECIES PfMSP1-19 Obtained as a Glutathione S-transferase (GST) fusion protein
representing a C-terminal expressed in E.coli. Merozoite P. falciparum [39–41]
PvMSP1-19 Representing a C-terminal produced in the baculovirus expression system.
Merozoite P. vivax [39, 40, 42]
PfGLURP-R2 Produced in the E.coli as a nearly full-length protein representing a C-terminal.
Trophozoite P. falciparum [39, 40, 43]
PvDBP / Merozoite P. vivax [39, 44, 45]
Pf13 Representing a C-terminal His-tag produced in E.coli. Sporozoite P. falciparum [39, 46]
PvAMA-1 / Merozoite P. vivax [39, 45, 47]
PvCSP (chimera)
A chimera constructed on the amino acid sequence of PvVK210CSP and PvVK247CSP representing a N- terminal (VK210 and VK247) and a C-terminal (VK210).
Sporozoite P. vivax [39, 47, 48]
PvEBP Containing a DBL domain and a C-terminus cysteine rich domain. Merozoite P. vivax [29, 39]
7B. 7A.
M a t e r i a l a n d m e t h o d s P a g e | 13
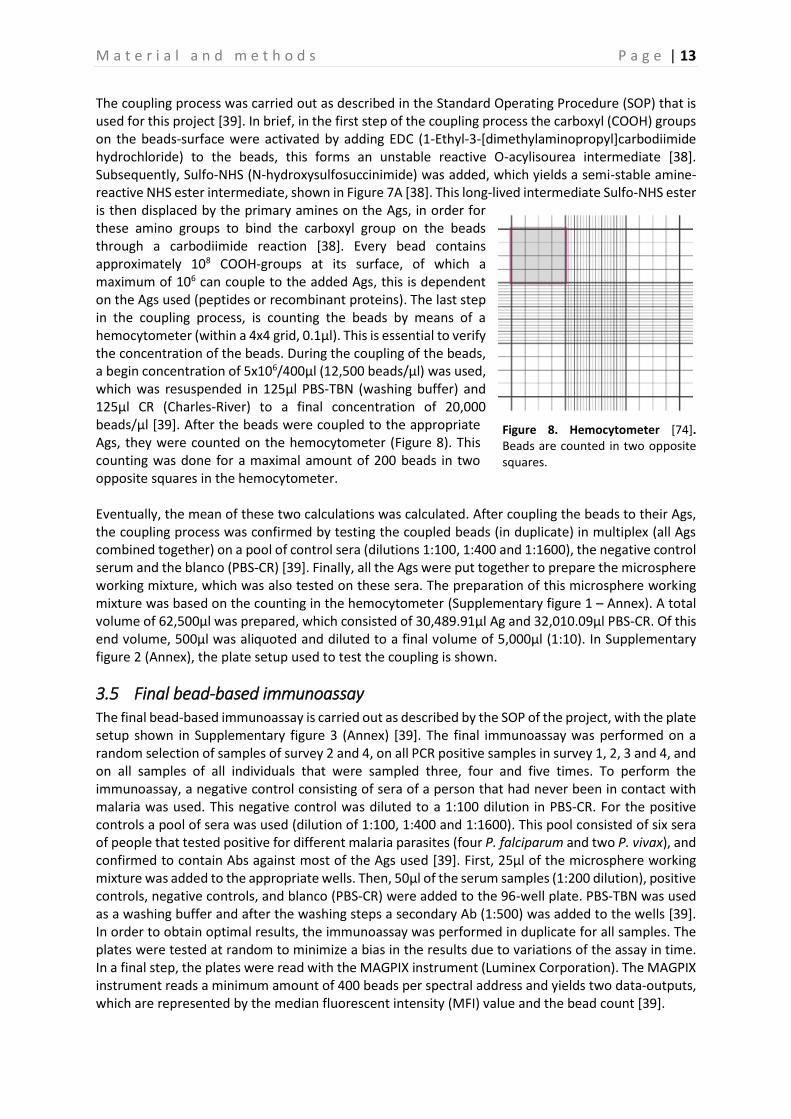
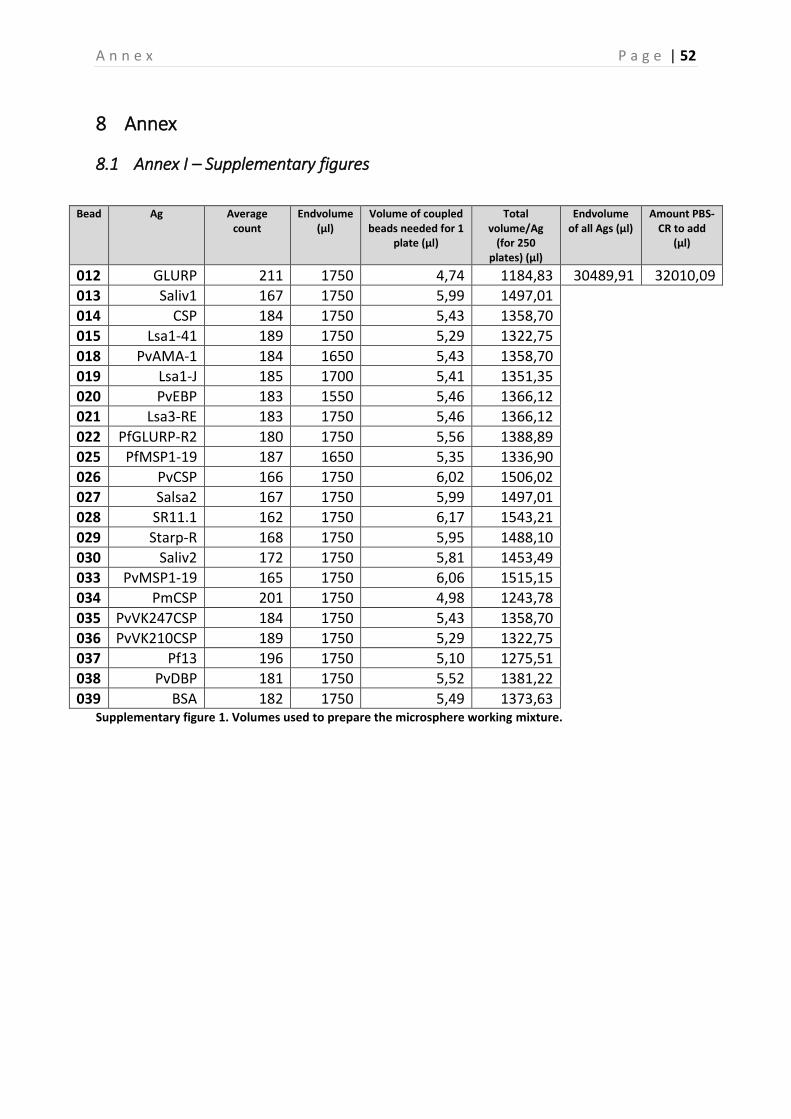
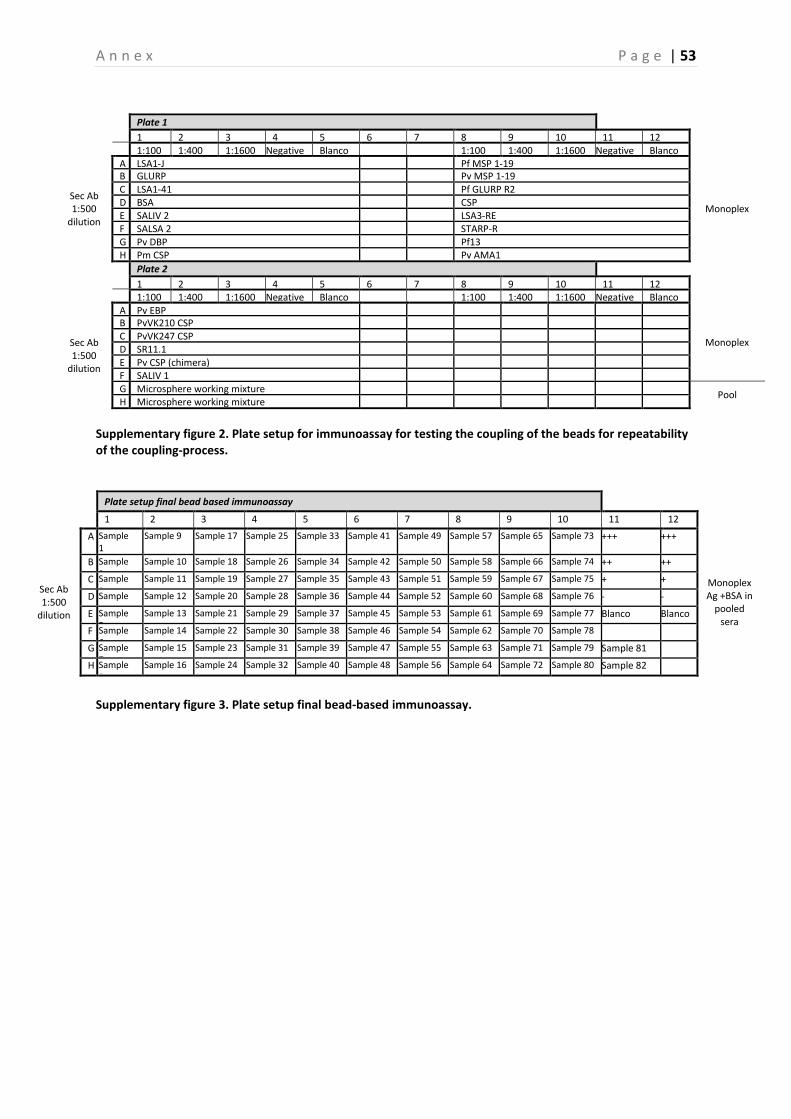
The coupling process was carried out as described in the Standard Operating Procedure (SOP) that is used for this project [39]. In brief, in the first step of the coupling process the carboxyl (COOH) groups on the beads-surface were activated by adding EDC (1-Ethyl-3-[dimethylaminopropyl]carbodiimide hydrochloride) to the beads, this forms an unstable reactive O-acylisourea intermediate [38]. Subsequently, Sulfo-NHS (N-hydroxysulfosuccinimide) was added, which yields a semi-stable amine-reactive NHS ester intermediate, shown in Figure 7A [38]. This long-lived intermediate Sulfo-NHS ester is then displaced by the primary amines on the Ags, in order for these amino groups to bind the carboxyl group on the beads through a carbodiimide reaction [38]. Every bead contains approximately 108 COOH-groups at its surface, of which a maximum of 106 can couple to the added Ags, this is dependent on the Ags used (peptides or recombinant proteins). The last step in the coupling process, is counting the beads by means of a hemocytometer (within a 4x4 grid, 0.1µl). This is essential to verify the concentration of the beads. During the coupling of the beads, a begin concentration of 5x10⁶/400µl (12,500 beads/µl) was used, which was resuspended in 125µl PBS-TBN (washing buffer) and 125µl CR (Charles-River) to a final concentration of 20,000 beads/µl [39]. After the beads were coupled to the appropriate Ags, they were counted on the hemocytometer (Figure 8). This counting was done for a maximal amount of 200 beads in two opposite squares in the hemocytometer. Eventually, the mean of these two calculations was calculated. After coupling the beads to their Ags, the coupling process was confirmed by testing the coupled beads (in duplicate) in multiplex (all Ags combined together) on a pool of control sera (dilutions 1:100, 1:400 and 1:1600), the negative control serum and the blanco (PBS-CR) [39]. Finally, all the Ags were put together to prepare the microsphere working mixture, which was also tested on these sera. The preparation of this microsphere working mixture was based on the counting in the hemocytometer (Supplementary figure 1 – Annex). A total volume of 62,500µl was prepared, which consisted of 30,489.91µl Ag and 32,010.09µl PBS-CR. Of this end volume, 500µl was aliquoted and diluted to a final volume of 5,000µl (1:10). In Supplementary figure 2 (Annex), the plate setup used to test the coupling is shown.
3.5 Final bead-based immunoassay The final bead-based immunoassay is carried out as described by the SOP of the project, with the plate setup shown in Supplementary figure 3 (Annex) [39]. The final immunoassay was performed on a random selection of samples of survey 2 and 4, on all PCR positive samples in survey 1, 2, 3 and 4, and on all samples of all individuals that were sampled three, four and five times. To perform the immunoassay, a negative control consisting of sera of a person that had never been in contact with malaria was used. This negative control was diluted to a 1:100 dilution in PBS-CR. For the positive controls a pool of sera was used (dilution of 1:100, 1:400 and 1:1600). This pool consisted of six sera of people that tested positive for different malaria parasites (four P. falciparum and two P. vivax), and confirmed to contain Abs against most of the Ags used [39]. First, 25µl of the microsphere working mixture was added to the appropriate wells. Then, 50µl of the serum samples (1:200 dilution), positive controls, negative controls, and blanco (PBS-CR) were added to the 96-well plate. PBS-TBN was used as a washing buffer and after the washing steps a secondary Ab (1:500) was added to the wells [39]. In order to obtain optimal results, the immunoassay was performed in duplicate for all samples. The plates were tested at random to minimize a bias in the results due to variations of the assay in time. In a final step, the plates were read with the MAGPIX instrument (Luminex Corporation). The MAGPIX instrument reads a minimum amount of 400 beads per spectral address and yields two data-outputs, which are represented by the median fluorescent intensity (MFI) value and the bead count [39].
Figure 8. Hemocytometer [74]. Beads are counted in two opposite squares.
M a t e r i a l a n d m e t h o d s P a g e | 14
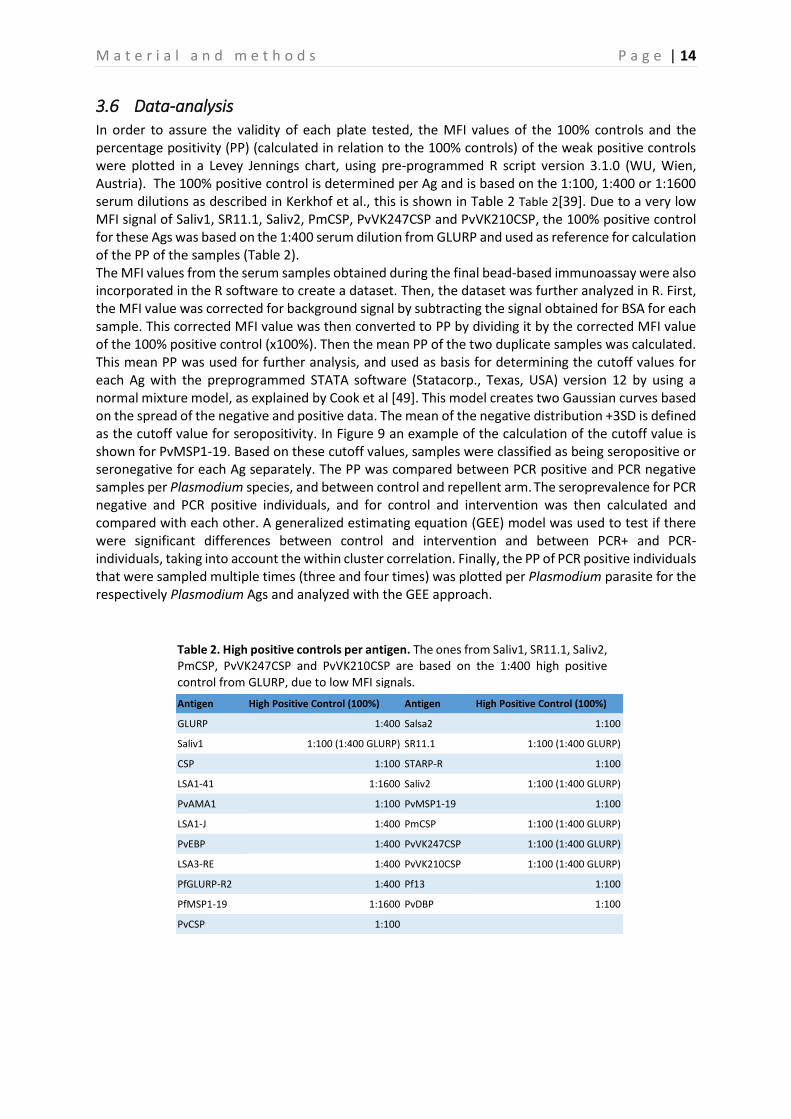
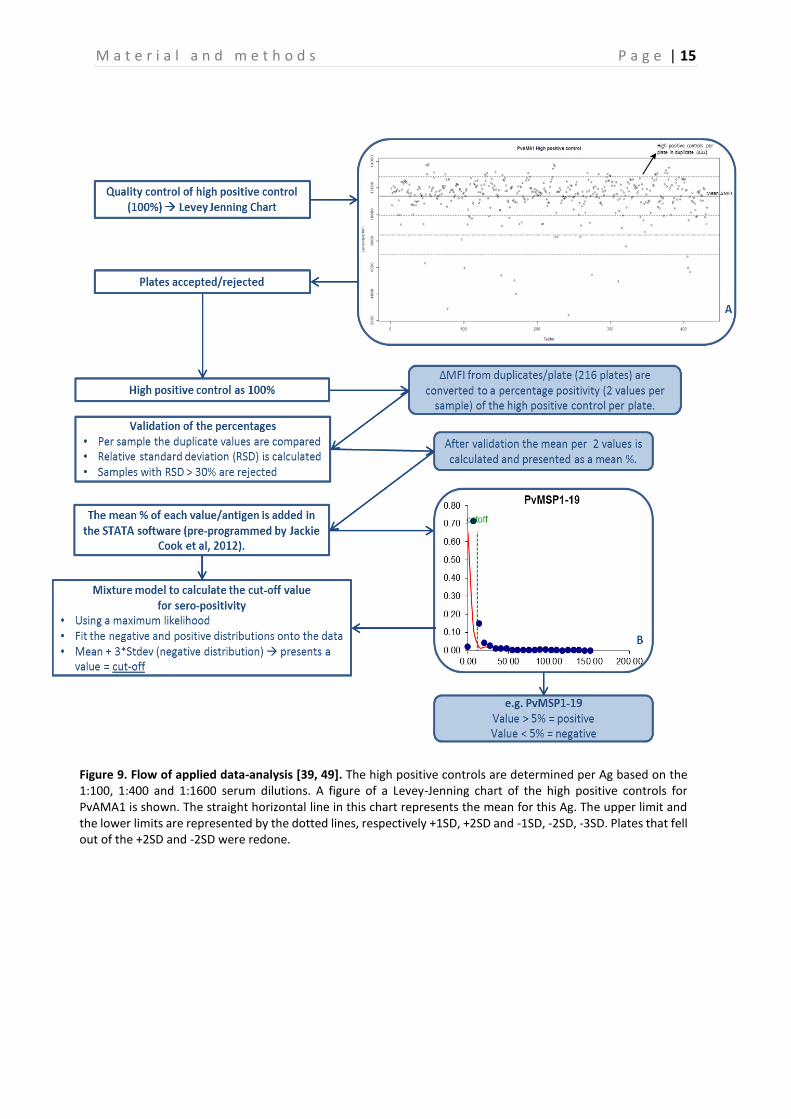
3.6 Data-analysis In order to assure the validity of each plate tested, the MFI values of the 100% controls and the percentage positivity (PP) (calculated in relation to the 100% controls) of the weak positive controls were plotted in a Levey Jennings chart, using pre-programmed R script version 3.1.0 (WU, Wien, Austria). The 100% positive control is determined per Ag and is based on the 1:100, 1:400 or 1:1600 serum dilutions as described in Kerkhof et al., this is shown in Table 2 Table 2[39]. Due to a very low MFI signal of Saliv1, SR11.1, Saliv2, PmCSP, PvVK247CSP and PvVK210CSP, the 100% positive control for these Ags was based on the 1:400 serum dilution from GLURP and used as reference for calculation of the PP of the samples (Table 2). The MFI values from the serum samples obtained during the final bead-based immunoassay were also incorporated in the R software to create a dataset. Then, the dataset was further analyzed in R. First, the MFI value was corrected for background signal by subtracting the signal obtained for BSA for each sample. This corrected MFI value was then converted to PP by dividing it by the corrected MFI value of the 100% positive control (x100%). Then the mean PP of the two duplicate samples was calculated. This mean PP was used for further analysis, and used as basis for determining the cutoff values for each Ag with the preprogrammed STATA software (Statacorp., Texas, USA) version 12 by using a normal mixture model, as explained by Cook et al [49]. This model creates two Gaussian curves based on the spread of the negative and positive data. The mean of the negative distribution +3SD is defined as the cutoff value for seropositivity. In Figure 9 an example of the calculation of the cutoff value is shown for PvMSP1-19. Based on these cutoff values, samples were classified as being seropositive or seronegative for each Ag separately. The PP was compared between PCR positive and PCR negative samples per Plasmodium species, and between control and repellent arm. The seroprevalence for PCR negative and PCR positive individuals, and for control and intervention was then calculated and compared with each other. A generalized estimating equation (GEE) model was used to test if there were significant differences between control and intervention and between PCR+ and PCR- individuals, taking into account the within cluster correlation. Finally, the PP of PCR positive individuals that were sampled multiple times (three and four times) was plotted per Plasmodium parasite for the respectively Plasmodium Ags and analyzed with the GEE approach.
Antigen High Positive Control (100%) Antigen High Positive Control (100%)
Table 2. High positive controls per antigen. The ones from Saliv1, SR11.1, Saliv2, PmCSP, PvVK247CSP and PvVK210CSP are based on the 1:400 high positive control from GLURP, due to low MFI signals.
M a t e r i a l a n d m e t h o d s P a g e | 15
Figure 9. Flow of applied data-analysis [39, 49]. The high positive controls are determined per Ag based on the 1:100, 1:400 and 1:1600 serum dilutions. A figure of a Levey-Jenning chart of the high positive controls for PvAMA1 is shown. The straight horizontal line in this chart represents the mean for this Ag. The upper limit and the lower limits are represented by the dotted lines, respectively +1SD, +2SD and -1SD, -2SD, -3SD. Plates that fell out of the +2SD and -2SD were redone.
R e s u l t s P a g e | 17
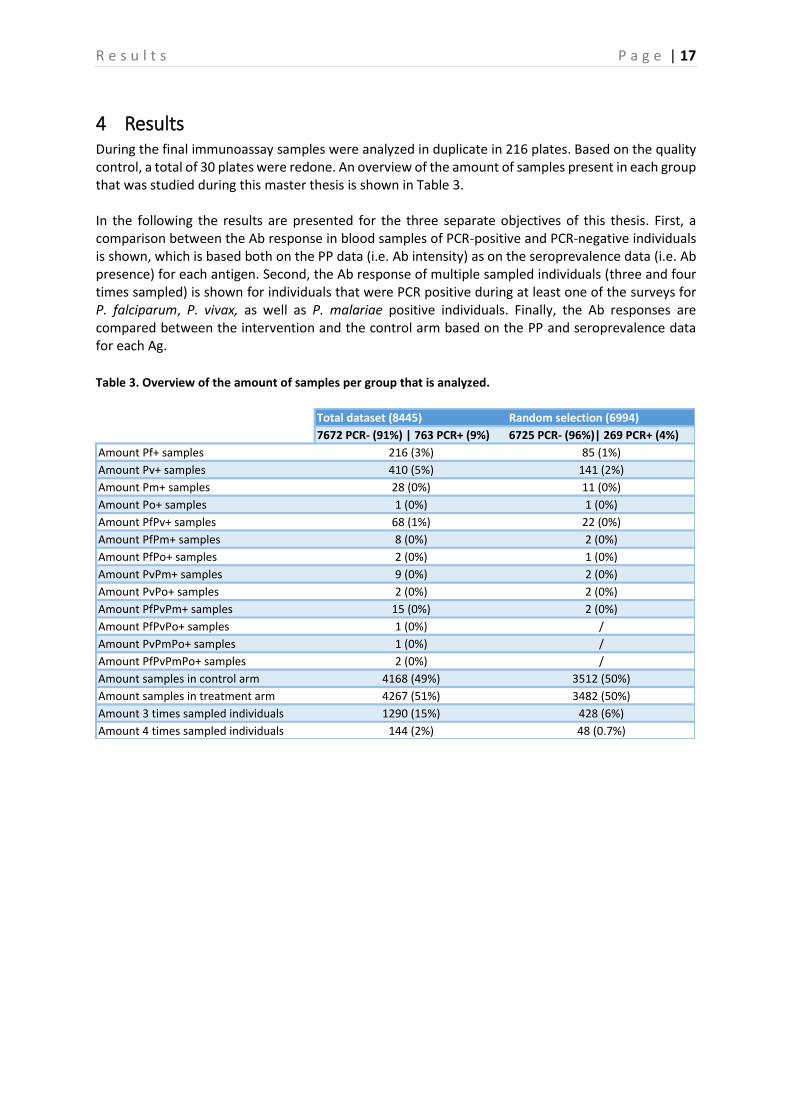
4 Results During the final immunoassay samples were analyzed in duplicate in 216 plates. Based on the quality control, a total of 30 plates were redone. An overview of the amount of samples present in each group that was studied during this master thesis is shown in Table 3. In the following the results are presented for the three separate objectives of this thesis. First, a comparison between the Ab response in blood samples of PCR-positive and PCR-negative individuals is shown, which is based both on the PP data (i.e. Ab intensity) as on the seroprevalence data (i.e. Ab presence) for each antigen. Second, the Ab response of multiple sampled individuals (three and four times sampled) is shown for individuals that were PCR positive during at least one of the surveys for P. falciparum, P. vivax, as well as P. malariae positive individuals. Finally, the Ab responses are compared between the intervention and the control arm based on the PP and seroprevalence data for each Ag. Table 3. Overview of the amount of samples per group that is analyzed.
Amount samples in control arm 4168 (49%) 3512 (50%)
Amount samples in treatment arm 4267 (51%) 3482 (50%)
Amount 3 times sampled individuals 1290 (15%) 428 (6%)
Amount 4 times sampled individuals 144 (2%) 48 (0.7%)
R e s u l t s P a g e | 18
4.1 Comparison percentage positivity and seroprevalence between PCR positive and negative individuals
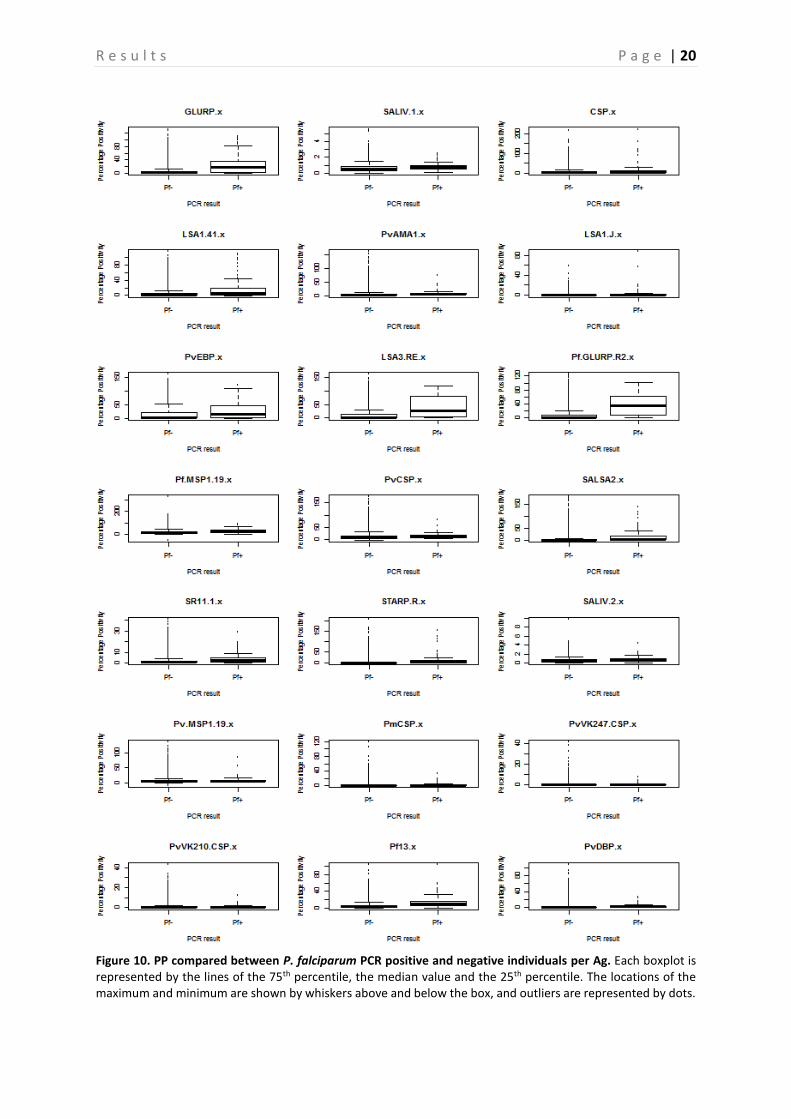
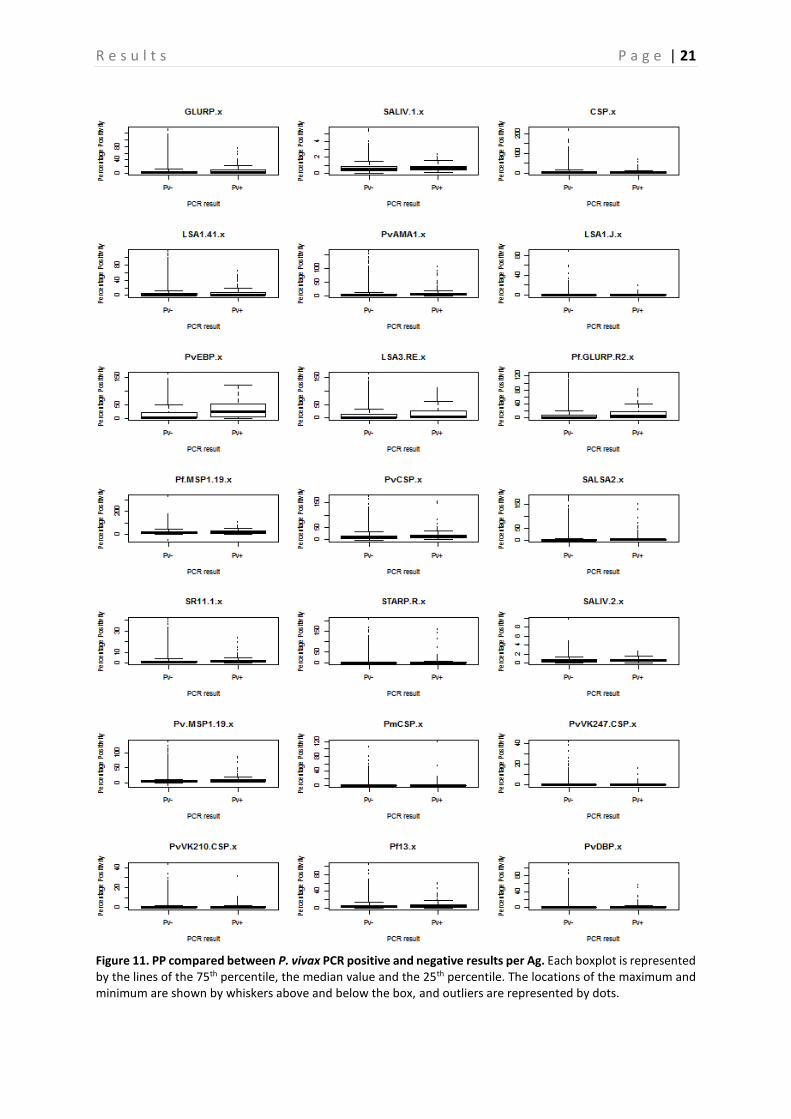
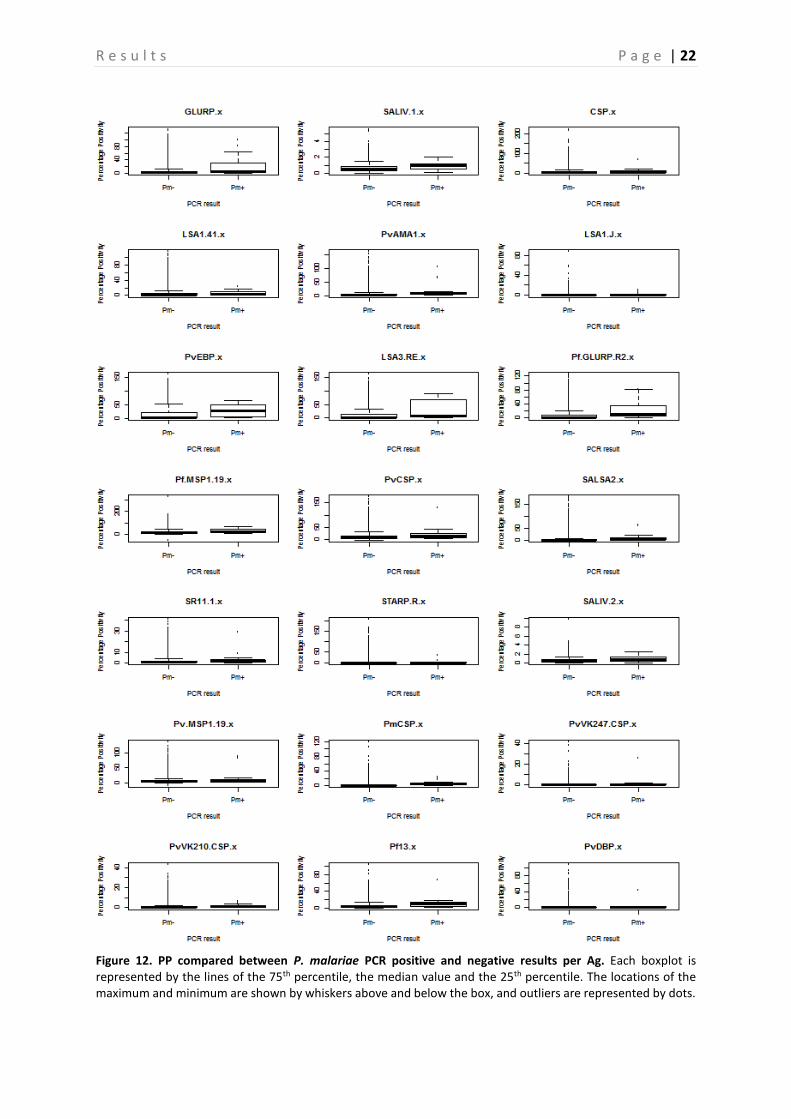
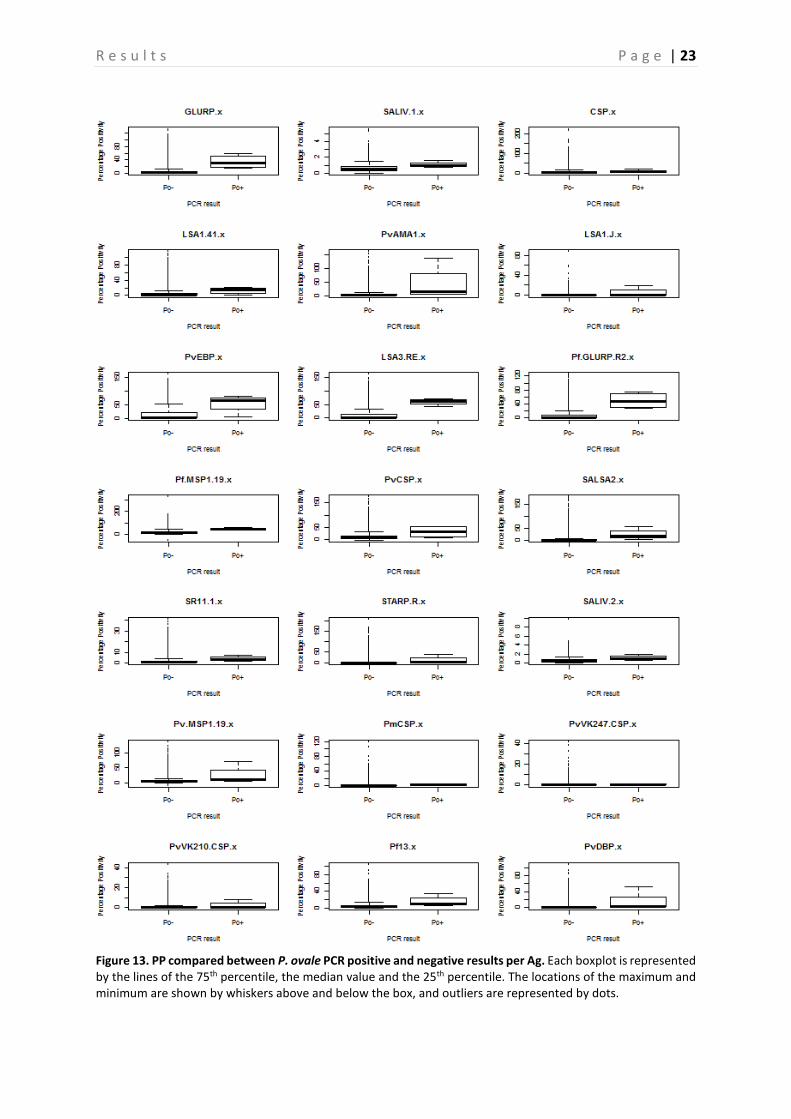
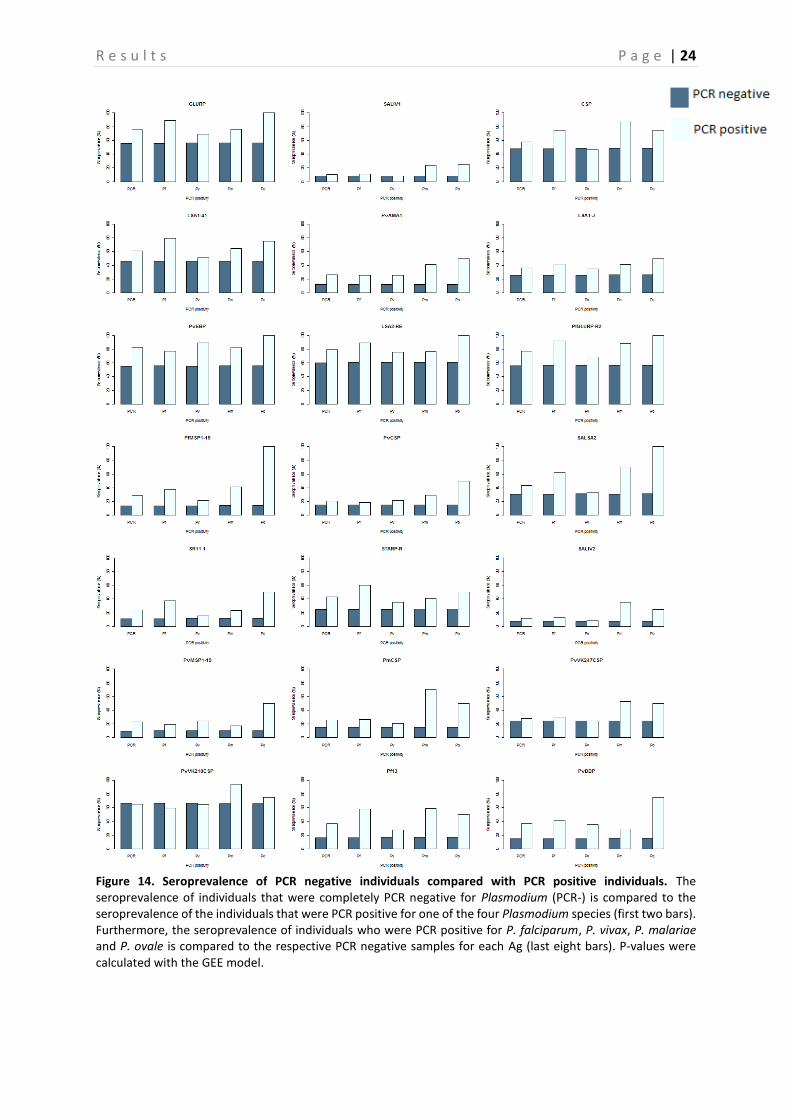
A comparison between the PP of PCR positive and negative samples is shown in Figure 10-13, this is done for P. falciparum, P. vivax, P. malariae, and P. ovale separately. Based on the p-values, calculated with the Mann-Whitney-U test, a significant difference between PP of PCR positive and negative individuals can be demonstrated (P < 0.05) (Table 4), and this for almost all Ags. However, there are some Ags that show no significant difference depending on the Plasmodium species. In neither of the Plasmodium species a difference in PvVK210CSP PP is observed (P > 0.05). PvVK247CSP shows a clear difference between P. malariae infected and non-infected individuals (P < 0.05), whereas this is not the case in P. falciparum, P. vivax and P. ovale infected individuals (P > 0.05). In P. vivax individuals, the Ab responses against CSP and PmCSP are not significantly different as compared to non-infected individuals. Finally, in P. malariae and P. ovale infected individuals no significant difference is observed for responses against LSA1-41, PvCSP and LSA1-J, PvCSP, and CSP respectively (P > 0.05) as compared to non-infected individuals. A comparison of the seroprevalence of the PCR positive and negative samples is shown in Figure 14. When looking at the difference between seroprevalence in the individuals negative for P. falciparum and P. vivax and the ones positive for these two, it can be noted that overall the PCR positive individuals show a higher seroprevalence than the negative ones. A relatively low seroprevalence in P. falciparum positive individuals is seen in SALIV1 and SALIV2. In Table 5 the P-values calculated by using the GEE model are shown. Based on these values it appears that in most samples a significant difference between the PCR positive and the PCR negative samples exists (P < 0.05). For the following Ags, however, no significant differences in seroprevalence were observed between P. falciparum positive and P. falciparum negative samples: SALIV1, PvCSP, PvVK247CSP and PvVK210CSP. In the P. vivax positive and negative samples there is no significant difference in seroprevalence for SALIV1, CSP, LSA1-41, SALSA2, SR11.1, SALIV2, PmCSP, PvVK247CSP and PvVK210CSP.
Furthermore, a very high seroprevalence for PvVK210CSP was observed compared to the other Ags, however the difference between the PCR negative individuals for this Ag is not significant (P > 0.05). A lower seroprevalence for the following Ags was observed, when compared to the other Ags: SALIV1, PvAMA1, PfMSP1-19, PvCSP, SR11.1, PvMSP1-19, PmCSP, PvVK247CSP. Of these, only the seroprevalence for SALIV1, SR11.1, PvVK247CSP and PvCSP (in P. falciparum) were not significantly different between PCR positive and PCR negative individuals (P > 0.05). On the contrary, a low seroprevalence for PvAMA1, PfMSP1-19, PvMSP1-19, PmCSP and PvCSP (in P. vivax) was observed, but they show a significant difference in seroprevalence between PCR negative and positive individuals.
R e s u l t s P a g e | 19
Table 4. P-values calculated by the Mann-Whitney-U test to indicate significant differences between PP of PCR positive and negative individuals per Plasmodium species, per Ag. The p-values in bold indicate the ones that show no significant difference between PCR positive and PCR negative individuals.
Table 5. P-values calculated by the GEE model to indicate significant differences between seroprevalence of PCR negative individuals and PCR positive individuals per Plasmodium species, per Ag. The p-values in bold indicate the ones that show no significant difference between PCR positive and PCR negative individuals. P-values are shown per Plasmodium species. The first column indicates the p-value between all PCR negative and positive individuals.
Antigens Pf Pv Pm Po
GLURP 1.43E-27 1.91E-05 0.002039 0.002122
SALIV1 1.04E-06 0.008308 0.027476 0.019832
CSP 3.72E-09 0.363393 0.003997 0.136603
LSA1-41 3.85E-15 0.002397 0.058187 0.049141
PvAMA1 2.87E-16 3.66E-11 0.000865 0.017206
LSA1-J 1.51E-06 0.001326 0.008158 0.318465
PvEBP 6.73E-09 2.57E-25 0.002311 0.015158
LSA3-RE 3.45E-21 1.04E-06 0.008582 0.002717
PfGLURP-R2 1.77E-34 1.84E-06 0.000202 0.001688
PfMSP1-19 7.49E-15 3.83E-04 0.00323 0.002149
PvCSP 1.18E-06 4.95E-05 0.097203 0.051173
SALSA2 1.08E-16 2.04E-02 0.000179 0.006462
SR11.1 7.03E-19 1.86E-04 0.012468 0.012361
STARP-R 1.44E-22 3.78E-05 0.002296 0.024591
SALIV2 3.20E-11 5.27E-04 0.00153 0.011961
PvMSP1-19 1.01E-08 1.12E-14 0.017458 0.01522
PmCSP 6.18E-07 1.83E-01 1.10E-05 4.84E-02
PvVK247CSP 2.27E-01 6.39E-01 0.015399 0.332727
PvVK210CSP 2.39E-01 2.69E-01 0.00303 0.355203
Pf13 4.53E-25 6.13E-06 0.000507 0.010659
PvDBP 2.89E-15 9.07E-15 0.020522 0.006886
R e s u l t s P a g e | 20
Figure 10. PP compared between P. falciparum PCR positive and negative individuals per Ag. Each boxplot is represented by the lines of the 75th percentile, the median value and the 25th percentile. The locations of the maximum and minimum are shown by whiskers above and below the box, and outliers are represented by dots.
R e s u l t s P a g e | 21
Figure 11. PP compared between P. vivax PCR positive and negative results per Ag. Each boxplot is represented by the lines of the 75th percentile, the median value and the 25th percentile. The locations of the maximum and minimum are shown by whiskers above and below the box, and outliers are represented by dots.
R e s u l t s P a g e | 22
Figure 12. PP compared between P. malariae PCR positive and negative results per Ag. Each boxplot is represented by the lines of the 75th percentile, the median value and the 25th percentile. The locations of the maximum and minimum are shown by whiskers above and below the box, and outliers are represented by dots.
R e s u l t s P a g e | 23
Figure 13. PP compared between P. ovale PCR positive and negative results per Ag. Each boxplot is represented by the lines of the 75th percentile, the median value and the 25th percentile. The locations of the maximum and minimum are shown by whiskers above and below the box, and outliers are represented by dots.
R e s u l t s P a g e | 24
Figure 14. Seroprevalence of PCR negative individuals compared with PCR positive individuals. The seroprevalence of individuals that were completely PCR negative for Plasmodium (PCR-) is compared to the seroprevalence of the individuals that were PCR positive for one of the four Plasmodium species (first two bars). Furthermore, the seroprevalence of individuals who were PCR positive for P. falciparum, P. vivax, P. malariae and P. ovale is compared to the respective PCR negative samples for each Ag (last eight bars). P-values were calculated with the GEE model.
R e s u l t s P a g e | 25
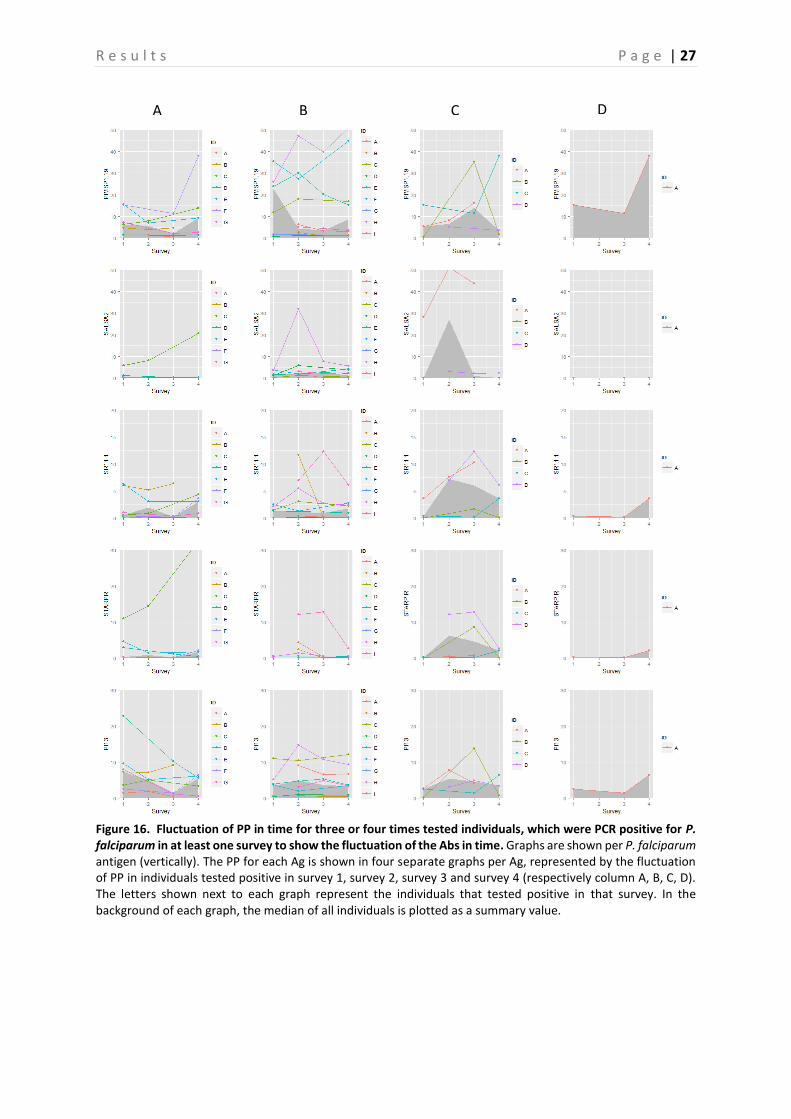
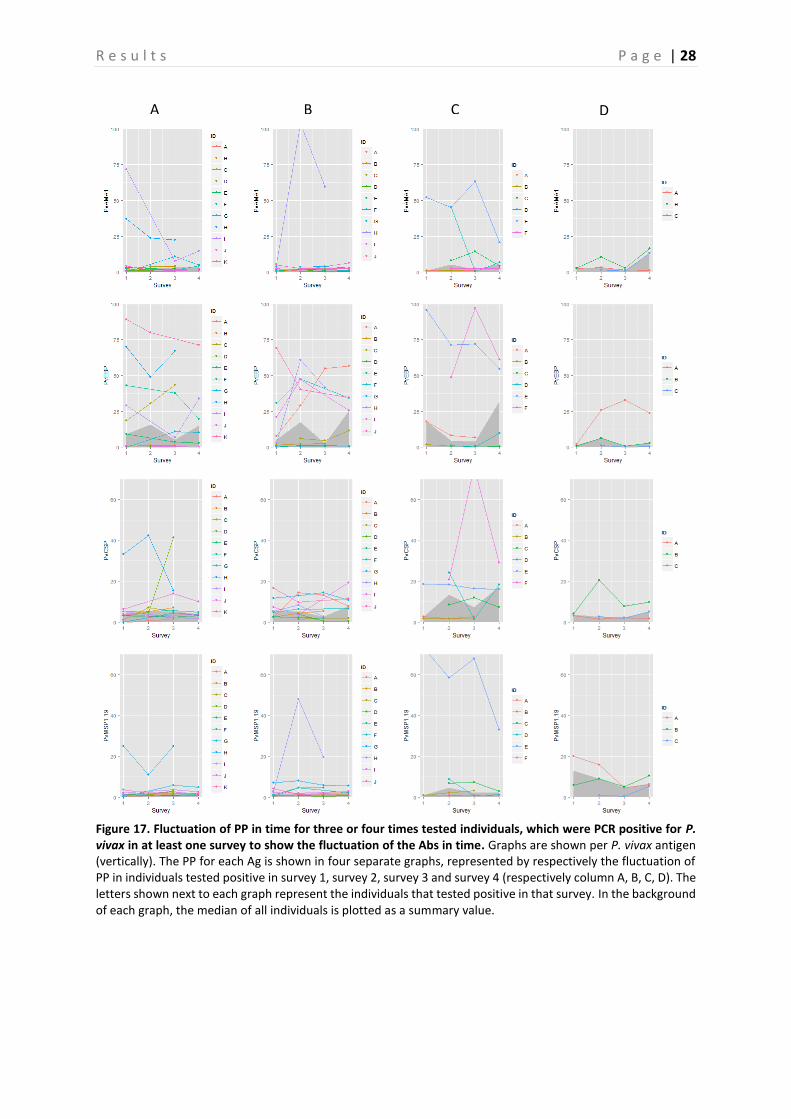
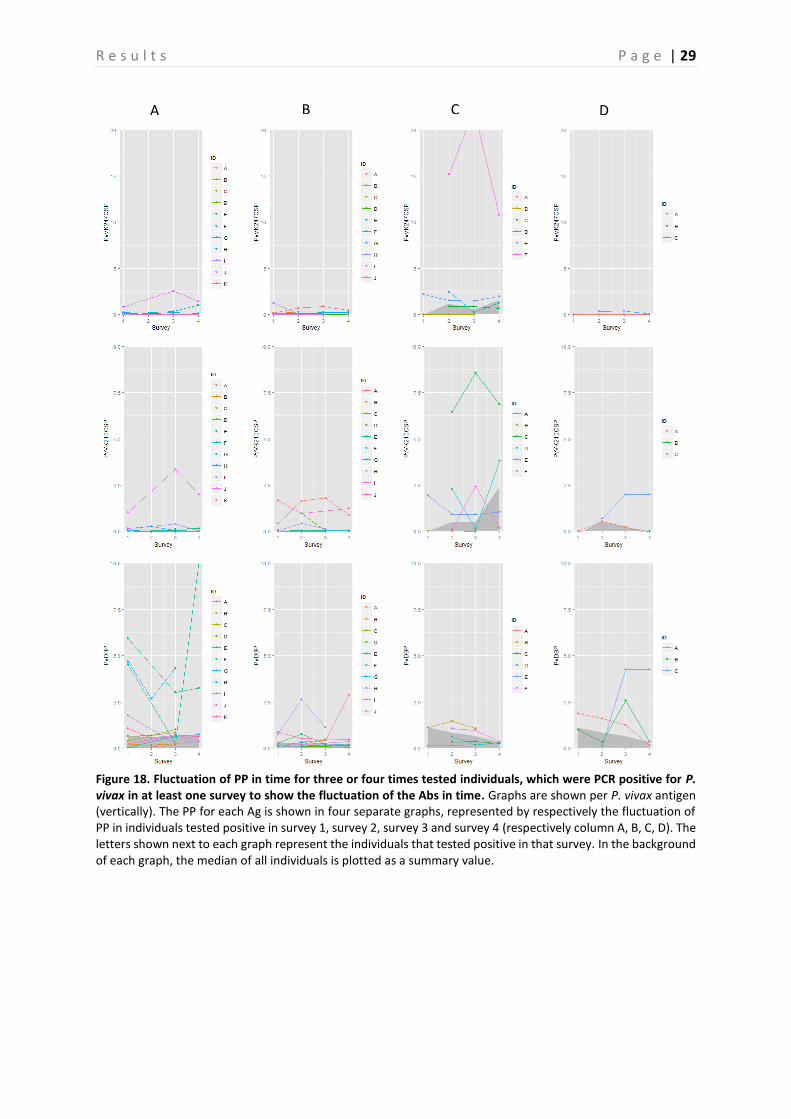
4.2 Evaluation of fluctuation of antibodies To assess the fluctuation of the Abs against different Ags, graphs representing the three and four times sampled individuals were created per Ag. Only the individuals that were PCR positive in at least one survey were selected and displayed in the graphs. These graphs are shown in Figure 15-19, representing respectively the individuals PCR positive for P. falciparum, P. vivax and P. malariae. In general, there is a lot of variation between the individuals. Therefore, in a first attempt to assess the Ab fluctuations, the median of all individuals is plotted as a summary value, which is shown as a grey area in the background of each graph. When looking at these median PP per Ag, individuals that were PCR positive in survey 3, appear to experience a boost in PP right before and a decay right after they were PCR positive for the following Ags: GLURP, LSA3-RE, PfGLURP-R2 and PfMSP1-19. This decay appears to be steeper in the Ags LSA3-RE and PfGLURP-R2. Furthermore, when the individual was PCR positive for P. falciparum in survey 4, a steep increase in PP is observed for the same Ags. A minor decrease in PP after individuals were tested positive for P. falciparum in survey 1 is observed for PfMSP1-19 and Pf13. Individuals that tested PCR positive for P. vivax in survey 2, show a clear peak in PP for PvEBP (Figure 17-18). However, for no other P. vivax Ag such a peak is observed. Furthermore, the PP of PvAMA1 is the only one of the P. vivax Ags that shows a little increase in PP when individuals were tested positive for P. vivax in survey 4. Finally, the individuals that were sampled three or four times and tested positive for P. malariae are only represented by the ones that tested positive in survey 2 and survey 3 (Figure 19). As only the P. malariae Ag PmCSP is included in this study, this is the only Ag shown. Both the individuals that tested positive in survey 2, as the ones that tested positive in survey 3 show a peak in PP at the moment they tested positive.
R e s u l t s P a g e | 26
Figure 15. Fluctuation of PP in time for three or four times tested individuals, which were PCR positive for P. falciparum in at least one survey to show the fluctuation of the Abs in time. Graphs are shown per P. falciparum antigen (vertically). The PP for each Ag is shown in four separate graphs per Ag, represented by the fluctuation of PP in individuals tested positive in survey 1, survey 2, survey 3 and survey 4 (respectively column A, B, C, D). The letters shown next to each graph represent the individuals that tested positive in that survey. In the background of each graph, the median of all individuals is plotted as a summary value.
A B C D
R e s u l t s P a g e | 27
Figure 16. Fluctuation of PP in time for three or four times tested individuals, which were PCR positive for P. falciparum in at least one survey to show the fluctuation of the Abs in time. Graphs are shown per P. falciparum antigen (vertically). The PP for each Ag is shown in four separate graphs per Ag, represented by the fluctuation of PP in individuals tested positive in survey 1, survey 2, survey 3 and survey 4 (respectively column A, B, C, D). The letters shown next to each graph represent the individuals that tested positive in that survey. In the background of each graph, the median of all individuals is plotted as a summary value.
A B C D
R e s u l t s P a g e | 28
Figure 17. Fluctuation of PP in time for three or four times tested individuals, which were PCR positive for P. vivax in at least one survey to show the fluctuation of the Abs in time. Graphs are shown per P. vivax antigen (vertically). The PP for each Ag is shown in four separate graphs, represented by respectively the fluctuation of PP in individuals tested positive in survey 1, survey 2, survey 3 and survey 4 (respectively column A, B, C, D). The letters shown next to each graph represent the individuals that tested positive in that survey. In the background of each graph, the median of all individuals is plotted as a summary value.
A B C D
R e s u l t s P a g e | 29
Figure 18. Fluctuation of PP in time for three or four times tested individuals, which were PCR positive for P. vivax in at least one survey to show the fluctuation of the Abs in time. Graphs are shown per P. vivax antigen (vertically). The PP for each Ag is shown in four separate graphs, represented by respectively the fluctuation of PP in individuals tested positive in survey 1, survey 2, survey 3 and survey 4 (respectively column A, B, C, D). The letters shown next to each graph represent the individuals that tested positive in that survey. In the background of each graph, the median of all individuals is plotted as a summary value.
A B C D
R e s u l t s P a g e | 30
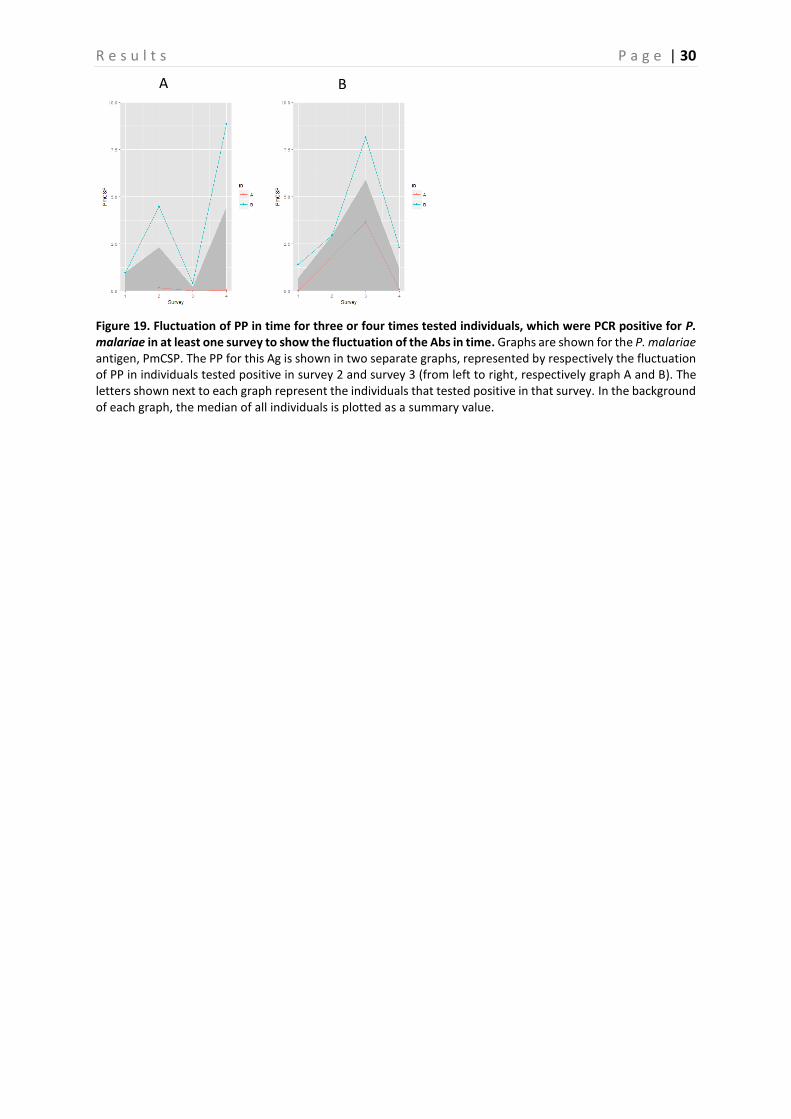
Figure 19. Fluctuation of PP in time for three or four times tested individuals, which were PCR positive for P. malariae in at least one survey to show the fluctuation of the Abs in time. Graphs are shown for the P. malariae antigen, PmCSP. The PP for this Ag is shown in two separate graphs, represented by respectively the fluctuation of PP in individuals tested positive in survey 2 and survey 3 (from left to right, respectively graph A and B). The letters shown next to each graph represent the individuals that tested positive in that survey. In the background of each graph, the median of all individuals is plotted as a summary value.
A B
R e s u l t s P a g e | 31
4.3 Comparison seroprevalence and percentage positivity between control and intervention arm
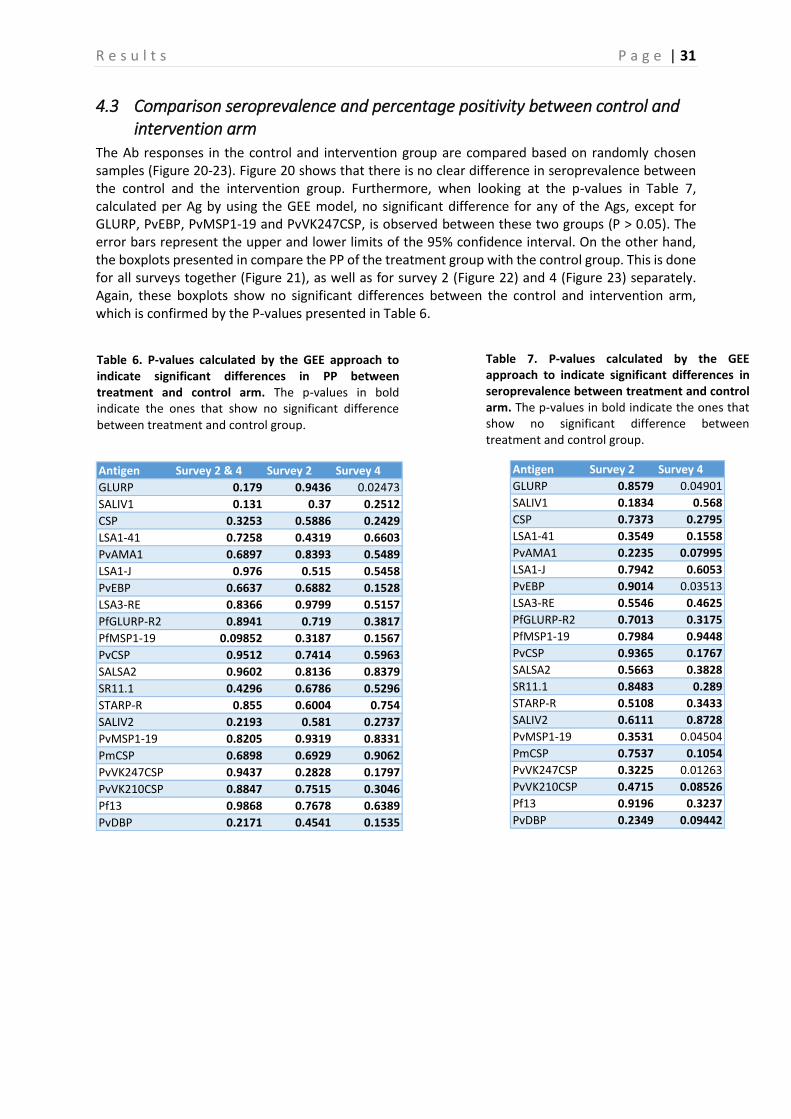
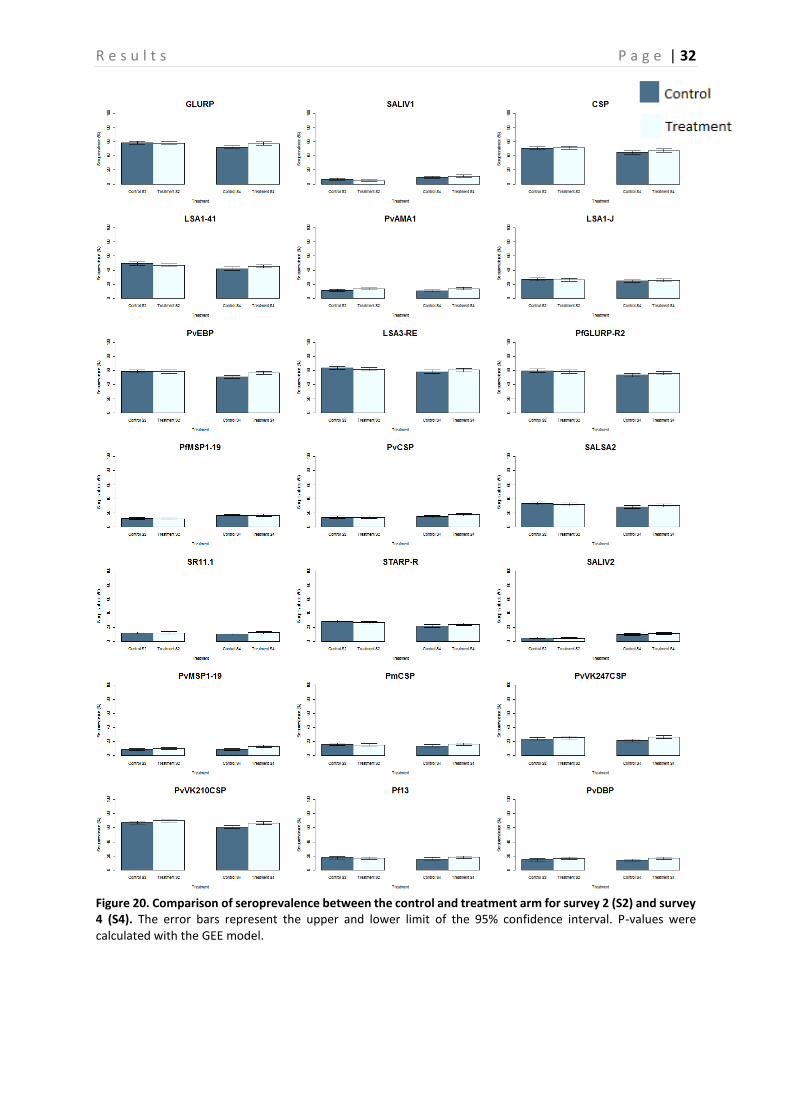
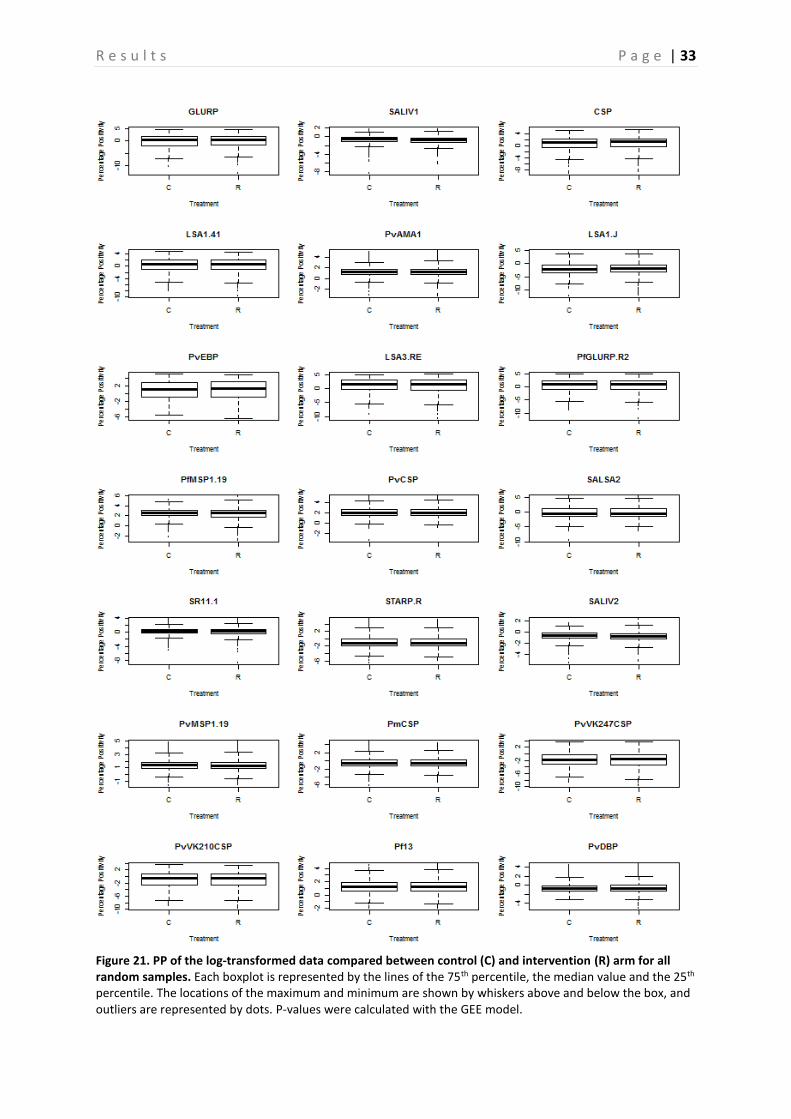
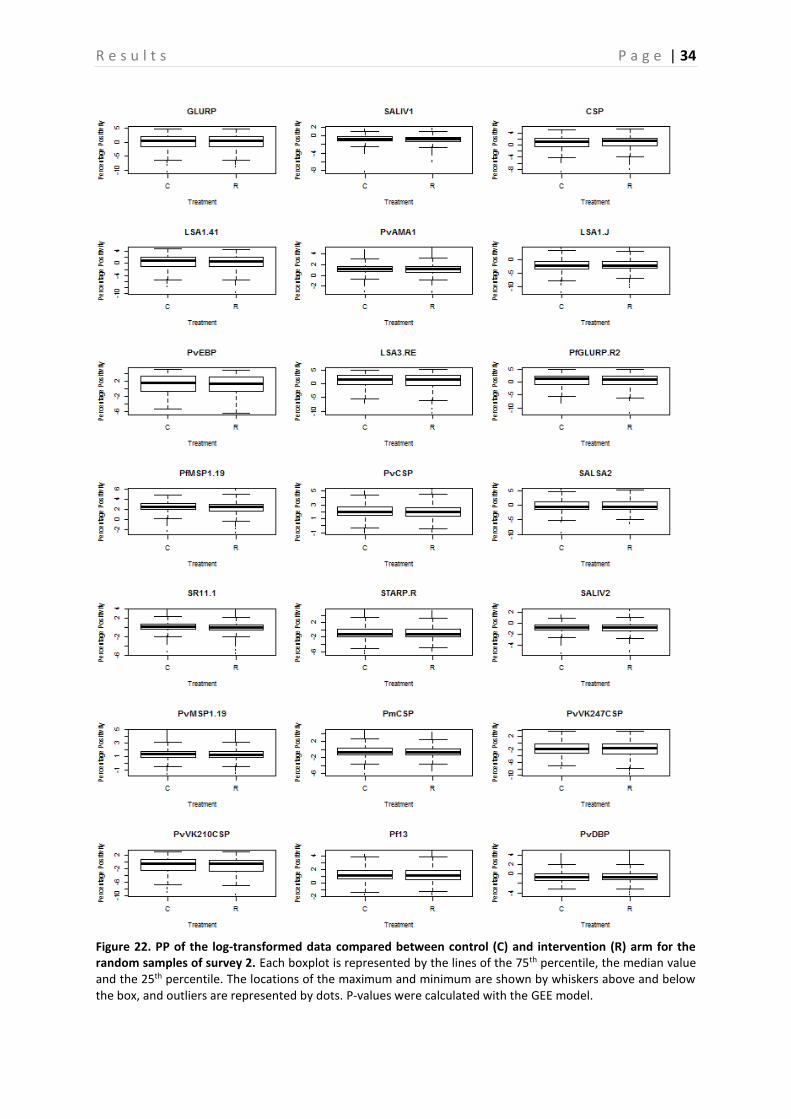
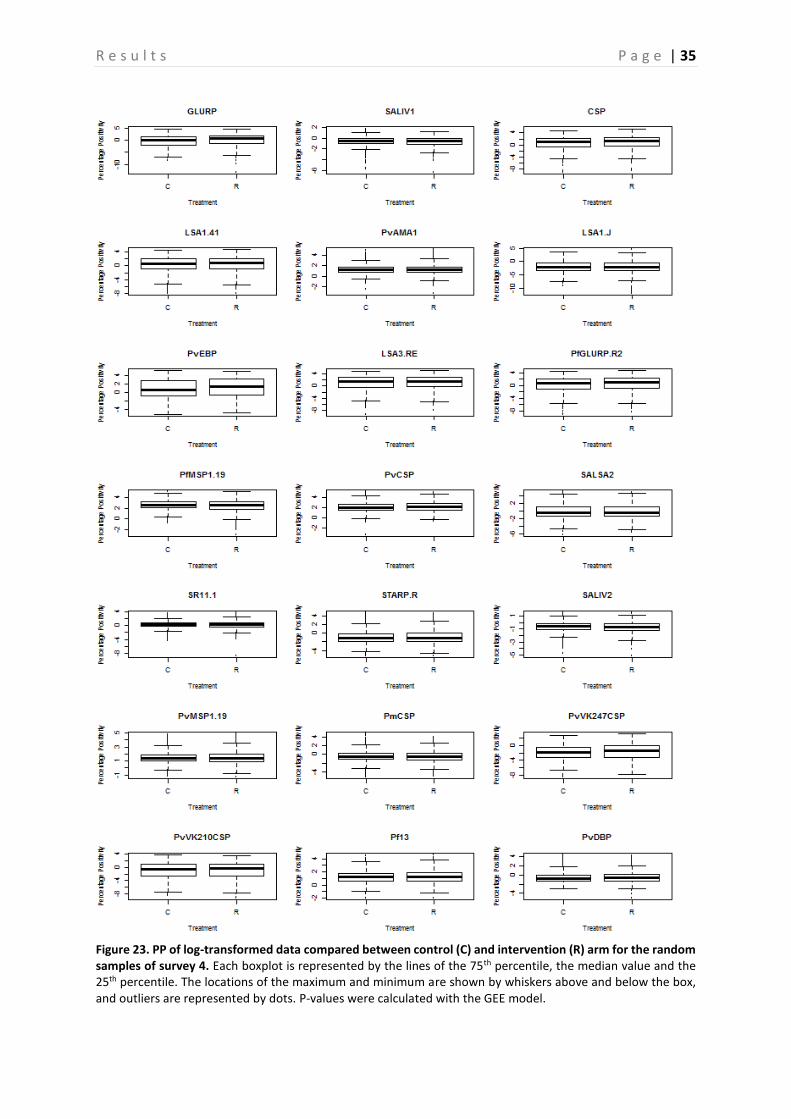
The Ab responses in the control and intervention group are compared based on randomly chosen samples (Figure 20-23). Figure 20 shows that there is no clear difference in seroprevalence between the control and the intervention group. Furthermore, when looking at the p-values in Table 7, calculated per Ag by using the GEE model, no significant difference for any of the Ags, except for GLURP, PvEBP, PvMSP1-19 and PvVK247CSP, is observed between these two groups (P > 0.05). The error bars represent the upper and lower limits of the 95% confidence interval. On the other hand, the boxplots presented in compare the PP of the treatment group with the control group. This is done for all surveys together (Figure 21), as well as for survey 2 (Figure 22) and 4 (Figure 23) separately. Again, these boxplots show no significant differences between the control and intervention arm, which is confirmed by the P-values presented in Table 6.
Table 6. P-values calculated by the GEE approach to indicate significant differences in PP between treatment and control arm. The p-values in bold indicate the ones that show no significant difference between treatment and control group.
Antigen Survey 2 Survey 4
GLURP 0.8579 0.04901
SALIV1 0.1834 0.568
CSP 0.7373 0.2795
LSA1-41 0.3549 0.1558
PvAMA1 0.2235 0.07995
LSA1-J 0.7942 0.6053
PvEBP 0.9014 0.03513
LSA3-RE 0.5546 0.4625
PfGLURP-R2 0.7013 0.3175
PfMSP1-19 0.7984 0.9448
PvCSP 0.9365 0.1767
SALSA2 0.5663 0.3828
SR11.1 0.8483 0.289
STARP-R 0.5108 0.3433
SALIV2 0.6111 0.8728
PvMSP1-19 0.3531 0.04504
PmCSP 0.7537 0.1054
PvVK247CSP 0.3225 0.01263
PvVK210CSP 0.4715 0.08526
Pf13 0.9196 0.3237
PvDBP 0.2349 0.09442
Antigen Survey 2 & 4 Survey 2 Survey 4
GLURP 0.179 0.9436 0.02473
SALIV1 0.131 0.37 0.2512
CSP 0.3253 0.5886 0.2429
LSA1-41 0.7258 0.4319 0.6603
PvAMA1 0.6897 0.8393 0.5489
LSA1-J 0.976 0.515 0.5458
PvEBP 0.6637 0.6882 0.1528
LSA3-RE 0.8366 0.9799 0.5157
PfGLURP-R2 0.8941 0.719 0.3817
PfMSP1-19 0.09852 0.3187 0.1567
PvCSP 0.9512 0.7414 0.5963
SALSA2 0.9602 0.8136 0.8379
SR11.1 0.4296 0.6786 0.5296
STARP-R 0.855 0.6004 0.754
SALIV2 0.2193 0.581 0.2737
PvMSP1-19 0.8205 0.9319 0.8331
PmCSP 0.6898 0.6929 0.9062
PvVK247CSP 0.9437 0.2828 0.1797
PvVK210CSP 0.8847 0.7515 0.3046
Pf13 0.9868 0.7678 0.6389
PvDBP 0.2171 0.4541 0.1535
Table 7. P-values calculated by the GEE approach to indicate significant differences in seroprevalence between treatment and control arm. The p-values in bold indicate the ones that show no significant difference between treatment and control group.
R e s u l t s P a g e | 32
Figure 20. Comparison of seroprevalence between the control and treatment arm for survey 2 (S2) and survey 4 (S4). The error bars represent the upper and lower limit of the 95% confidence interval. P-values were calculated with the GEE model.
R e s u l t s P a g e | 33
Figure 21. PP of the log-transformed data compared between control (C) and intervention (R) arm for all random samples. Each boxplot is represented by the lines of the 75th percentile, the median value and the 25th percentile. The locations of the maximum and minimum are shown by whiskers above and below the box, and outliers are represented by dots. P-values were calculated with the GEE model.
R e s u l t s P a g e | 34
Figure 22. PP of the log-transformed data compared between control (C) and intervention (R) arm for the random samples of survey 2. Each boxplot is represented by the lines of the 75th percentile, the median value and the 25th percentile. The locations of the maximum and minimum are shown by whiskers above and below the box, and outliers are represented by dots. P-values were calculated with the GEE model.
R e s u l t s P a g e | 35
Figure 23. PP of log-transformed data compared between control (C) and intervention (R) arm for the random samples of survey 4. Each boxplot is represented by the lines of the 75th percentile, the median value and the 25th percentile. The locations of the maximum and minimum are shown by whiskers above and below the box, and outliers are represented by dots. P-values were calculated with the GEE model.
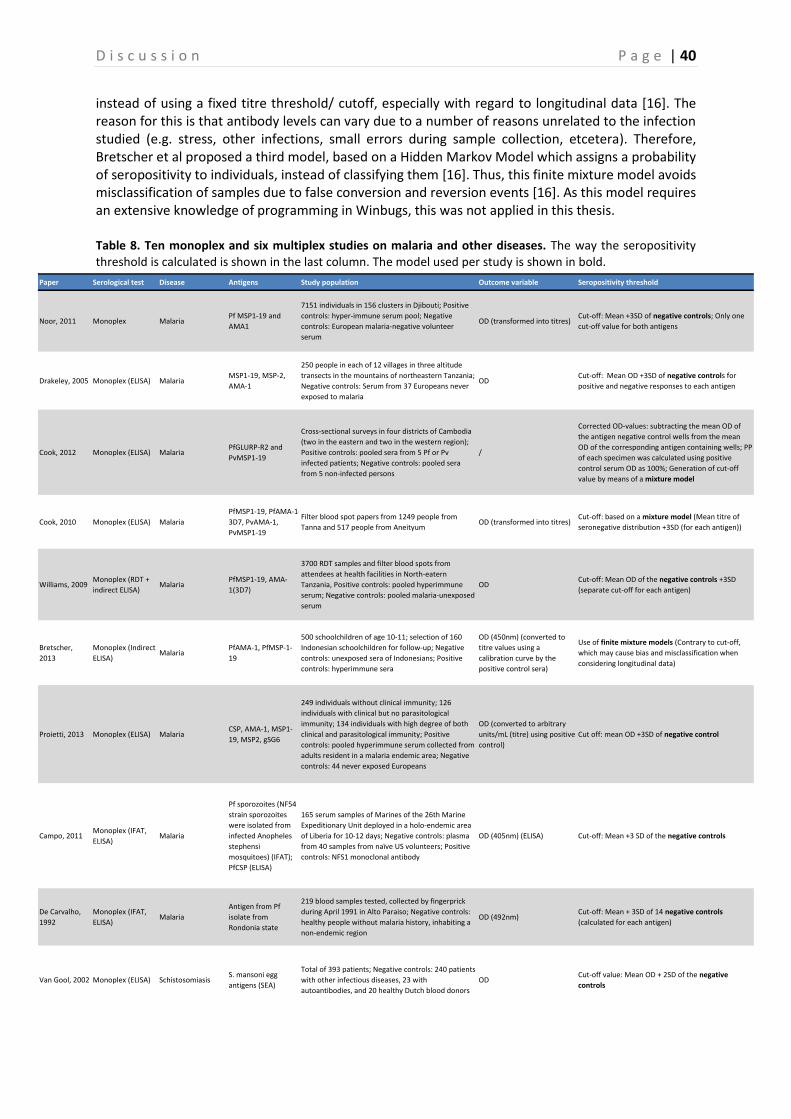
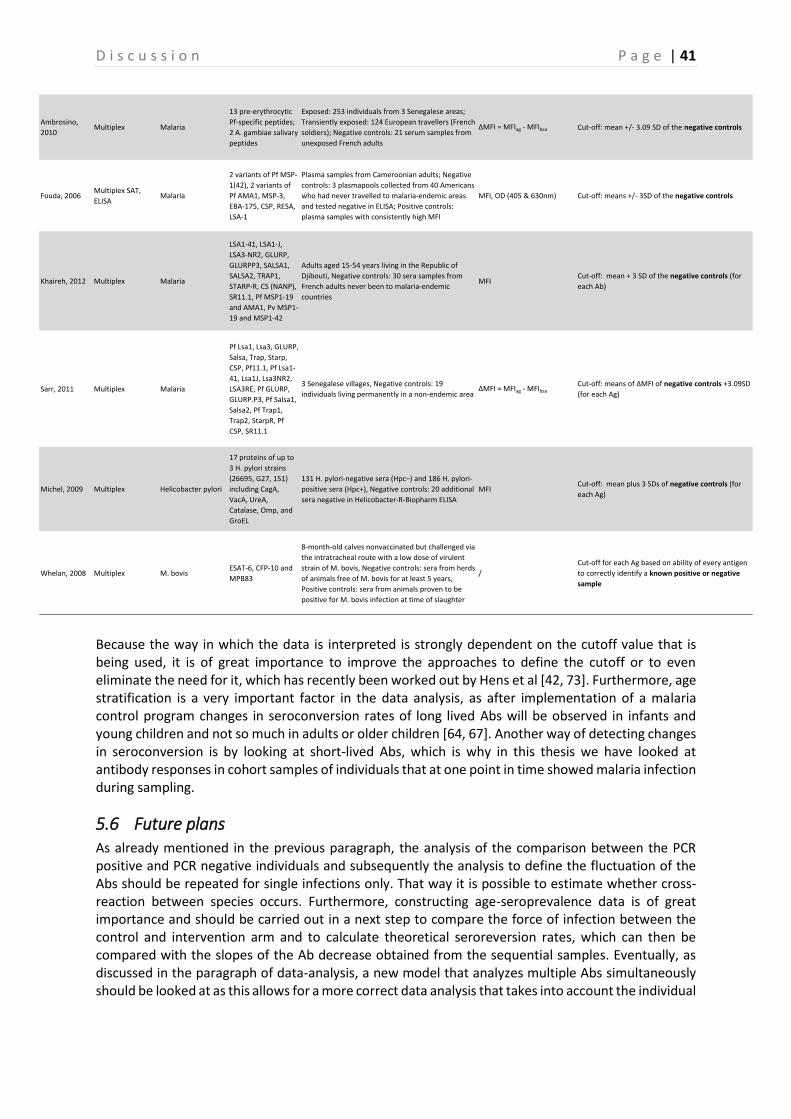
D i s c u s s i o n P a g e | 36
5 Discussion This thesis fits within the framework of the MalaResT project, a project that aims at evaluating the additional use of repellents (additional to LLINs) on malaria prevalence and incidence. In this project, one control arm and one intervention arm was included, and preliminary results based on comparison of PCR prevalence showed that the intervention had no effect on malaria PCR prevalence (no difference between control and intervention arm). However, this project was conducted in a low transmission area. In low-endemic areas, the use of serology is a good alternative to PCR to estimate transmission intensity, as anti-malarial Abs remain longer in the blood than parasites, and detection of these Abs might thus be more sensitive to estimate transmission than detection of the parasite. Therefore, four surveys were carried out in order to obtain blood samples from randomly chosen people at specific points in time. In the present study, a recently implemented multiplex assay was used to analyse 8654 blood samples taken during two follow-up surveys (survey 2 and 4) in this project to look for changes in seroprevalence as an estimation for malaria incidence. Moreover, to estimate the usefulness of the individual markers, PCR positive samples and samples from individuals that were sampled three or four times were also included in the analysis. That way, if a significant difference between these PCR positive and negative samples is demonstrated and if the respective Abs appear to fluctuate in time, these Ags can be used as serological marker to indicate recent infection. To perform the multiplex assay, thirteen peptides (eight for P. falciparum, two for P. vivax, two for An. gambiae salivary proteins and one for P. malariae) and eight recombinant proteins (three P. falciparum and five P. vivax) were used. Previous studies on malaria done by Ambrosino et al, Fouda et al, Sarr et al, Khaireh et al, and Kerkhof K. have already proven that the multiplex immunoassay is useful in serology and malaria research [31, 39, 50–52]. These studies focused in particular on the antigenicity of the antigens used, while in this study a more extensive analysis has been performed to eventually define serological markers that indicate recent infection, by also comparing the Ab responses in Plasmodium PCR positive individuals with PCR negative individuals, and by analyzing samples from individuals that were sampled three or four times to study the half-life of the Ab decrease.
5.1 Advantages and disadvantages of the multiplex assay Multiplex assays are believed to provide more accurate information to estimate the force of infection because of the variation in Ab responses that exists between individuals [51]. Moreover, the assay on its own has many practical advantages [31]. The possibility of analyzing multiple Abs simultaneously leads to a reduction in both time, measurement and costs [31]. Another major aspect is the small volume of serum required for the screening against multiple Ab responses [31]. This is particularly relevant in large populations of children, from whom minimal amounts of blood can be obtained. The multiplex assay is also very flexible, since it allows the researchers to include new targets, when required [31]. All these advantages make the multiplex assay a reliable technique for detection of multiple Ab responses at once in a fast manner. On the other hand, a major disadvantage of the multiplex assay is the high investment cost in purchasing the Luminex machine, which prevents the widespread use of this assay compared to the ELISA [31]. Another important concern is that combining multiple Ags coated beads might result in Ab competition, allowing cross-reactivity between the different Ag-coupled beads or blocking of the Ab responses [50].
5.2 Comparison PCR positive and negative individuals In this study a screening of all PCR positive samples collected during all surveys in the MalaResT project was performed. Based on these samples, a comparison of the PP and seroprevalence between the PCR positive and negative individuals was made. Including the data of these samples and subsequently carrying out a comparison between these two groups is a first step in defining serological markers that indicate recent malaria infection. The reason for this being that when a significant difference between the Ab intensity and Ab prevalence is observed in currently infected and non-infected persons, and if
D i s c u s s i o n P a g e | 37
these Abs have a short half-life, then the respective Ags could possibly serve as a serological marker of recent infection, which is an important tool for evaluation of anti-malarial interventions. When we look at the group of individuals that tested positive for P.falciparum, P.vivax, P.malariae or P.ovale in our study, it shows that mixed infections in all groups occur. These mixed infections can make the analysis more difficult and not always representative, as cross-reaction between species can occur. It is therefore essential to repeat this analysis for only the single infections. Looking at the results shown in Figure 10-14 it is clear that overall a significant difference exists in both seroprevalence and PP between the PCR positive and negative individuals. Especially the Ags GLURP, CSP, LSA1-41, LSA1-J, LSA3-RE, PvEBP, PfGLURP-R2, SALSA2, STARP-R, SR11.1, Pf13, PvDBP, PvMSP1-19 and PfMSP1-19 show a higher Ab response in PCR positive as compared to PCR negative individuals. To get a better overview, we will take a closer look at the different Ags. In case of the P. falciparum Ag GLURP and its recombinant protein PfGLURP-R2 a clear significant difference was observed in all four studied Plasmodium species. This can indicate that GLURP is highly antigenic [32], possibly due to the fact that each time a person gets infected, high levels of Abs are produced [39]. GLURP is present at every stage in the life cycle of the Plasmodium parasite and is known to have a short clearance half-life of 127 days [31, 53]. Furthermore, the findings in this study correspond to previous findings in a study performed by Sarr et al [51]. P. falciparum CSP is an Ag that is expressed at the sporozoite level in the Plasmodium life cycle [54]. In this study a significant higher Ab response is especially shown in the P. falciparum PCR positive samples. This Ag is known to have a shorter immune exposure time and has shown to have a short clearance half-life [54, 55]. These findings together with the significant difference seen between PCR positive and PCR negative samples in this study, suggest that CSP could serve as a serological marker for recent infection. However, it is essential to combine these findings with an analysis of the half-life of the antibodies as further discussed. Looking at the results of the P. falciparum LSA Ags (LSA1-41, LSA1-J and LSA-RE) a clear significant difference is seen in the P.falciparum and P.vivax PCR positive samples. LSA antigens are known to induce strong humoral responses, which could suggest that if these Abs rapidly decline after an infection they can play a potential role as serological marker for recent infection [56]. Previous performed studies have shown that these LSA Ags induce strong Ab responses, which was also confirmed in our study based on the PP-outcomes [56, 57]. Because of their strong Ab responses, these Ags are all under investigation as vaccine candidates [56, 57]. P. falciparum Ag STARP-R has proven to occur in low endemic areas, which makes it an interesting Ag in these areas [58]. These researchers confirmed that STARP-R could be a potential vaccine candidate in the Southeast Asian region. In this study we have shown that STARP-R shows a clear significant difference in all four studied Plasmodium species, while a very low seroprevalence was seen in the study performed by Ambrosino et al in the African region [31]. Thus, the Ab response to this Ag could depend on the geographical area studied. The Ags PvDBP and PvEBP belong both to the EBP superfamily and are important factors for invasion of the RBCs [45]. PvDBP has been shown to induce antibody production, that increases with repeated exposure to P. vivax [59]. In this study, both PvEBP as PvDBP showed a significant difference in seroprevalence and PP between the PCR positive and PCR negative population. In a previously performed study it has been shown that Ab levels to SALSA1 were significantly different when comparing PCR positive and negative individuals [51]. They also mentioned the use of Salsa Ags as a serological marker [51]. On the other hand, the Ag SALSA2 was used during this study. However, this Ag also showed a significant difference between these two groups. Furthermore, the Ag SR11.1 is currently being explored as a vaccine candidate and its Ab response and seroprevalence appeared to differ between the PCR positive and negative individuals in this study. This was also the case for the Ag Pf13. In a study performed by Vigan-Womas et al, a very high seroprevalence to Pf13 was already demonstrated [43].
D i s c u s s i o n P a g e | 38
Contrary to high seroprevalence findings in Kerkhof K. for the Ags PfMSP1-19 and PvMSP1-19, we have observed a lower seroprevalence in this study. These findings are probably due to the fact that the beads were coated with a lower concentration of Ags as the Ags were not available in sufficient amounts. However, these Ags still show a significant difference between the PCR positive and negative individuals. In this study we have also seen that the Ags PvVK247CSP and PvVK210CSP both showed no significant difference between the PCR positive and PCR negative population (except for the P.malariae infected individuals). These two Ags are shown to be present in the anopheline vector mosquitoes in Southeast Asia and Indonesia, which is not surprising as these are Ags specific for P. vivax sporozoites [60, 61]. The Saliv1 and Saliv2 antigens show a low seroprevalence and overall no significant difference between seroprevalence in PCR positive and PCR negative individuals is observed. These two Ags are derived from the An. gambiae salivary glands. Since this Anopheles species does not occur in Southeast Asia, the low seroprevalence results of these Ags are not a surprise. Further studies should therefore focus on Ags derived from the primary vectors in Cambodia, when these are available, as already discussed by Kerkhof et al. That way, if such Ags show a high seroprevalence, it could be possible to use them as an indicator for exposure to vector bites [31]. Although vector exposure and vector densities are not necessarily related to malaria transmission [15], such Ags could be used as evaluation tool for vector control interventions. Furthermore, PvCSP shows very low results in both seroprevalence and PP data, and no difference between the PCR positive and negative individuals is observed. Given the results discussed in this paragraph, it is evident that an analysis of the fluctuation of the Abs is essential in order to get a clear indication of the half-lives, and to subsequently make a good assumption of which antigens can be assigned as being a potential serological marker for recent infection. A short analysis of the half-life of all antibodies was performed during this study, which will be further discussed in the next paragraph.
5.3 Evaluation of fluctuation of antibodies and possible serological markers To evaluate possible fluctuations of Abs, 1468 samples from individuals that were sampled three or four times, and were Plasmodium PCR positive in at least one survey, were screened in the multiplex assay. These data could provide an indication of the half-life in order to see which Ag can be assigned as being a potential serological marker for recent infection. Due to limited time, only a very superficial descriptive analysis was performed to detect Abs that fluctuate the most in time. Up to now it has been difficult to define the Abs that fluctuate the most in time, since a lot of individual variation between the Ab responses occur. However, the results obtained in this study are a perfect start for further in-depth analysis (e.g. looking at the slope of the curves) to define a potential serological marker that is able to indicate if a recent infection has occurred or not. In a previously performed study by Kusi et al, sporozoite antigens were examined to see if these Ags could be alternative markers for predicting seasonal, short-term changes in malaria transmission intensity [54]. However, it should be noted that differences between individuals exist in the way they respond to CSP, which is an extra factor that should be born in mind when selecting a serological marker for recent infection [62]. During this master thesis, a rapid decline after infection could not be attributed to CSP. However, as previously mentioned, a more extensive analysis of the fluctuation of the antibodies is in order. The LSA Ags are known to induce strong humoral responses [56]. The Ab response against LSA3-RE Ag showed to decrease rapidly after infection, which indicates a short half-life. Even though it is difficult to determine the half-life of antigens, the half-life of PfMSP1-19, PvMSP1-19 and GLURP are already estimated in previous studies [53, 63, 64]. The half-life of PfMSP1-19 is 6,7 years [63], that for PvMSP1-19 is approximately 50 years [64], and for GLURP a half-life of 127days is recorded [53]. With this in mind a slow decrease of the PP over time is expected for PfMSP1-19 and PvMSP1-19. The results obtained in this study are shown in Figure 15-19. When we look at the
D i s c u s s i o n P a g e | 39
curves of respectively PfMSP1-19 and PvMSP1-19, some individuals do show a rapid decrease after infection. However, the plots of the median of all individuals which was used as a summary value doesn’t show such a rapid decrease and subsequently confirms long half-lifes for these Abs. This is also observed for GLURP, which would not be suspected when considering its previously recorded half-life [53]. Furthermore, individuals were sometimes positive in more than one survey for the same Plasmodium species, or for different ones. This was the case in two out of 18 individuals that tested positive for P. falciparum, two out of 30 individuals that tested positive for P. vivax and none in P. malariae positive individuals. Excluding these individuals from the analysis could be one step to improve this analysis. Furthermore, instead of grouping the individuals according to the survey in which they tested PCR positive, it could be worthwhile to align the individuals tested positive in survey 1, survey 2, survey 3 and survey 4, and compare the slope of the Ab decrease after the detection and treatment of the infection. Another next step in defining the Ab half-lives would be to construct age-seroprevalence curves to define seroconversion and seroreversion rates for each antigen (as described in Cook et al).
5.4 Comparison control and intervention In the MalaResT project two study arms were incorporated to evaluate the use of repellents in addition to LLINs. The serological outcomes of these study arms were compared, using both Ab intensity (PP) as seroprevalence as a response variable. Overall, no significant difference is seen between these two study arms, meaning that the additional widespread use of repellents does not significantly reduce malaria seroprevalence. These findings are in line with the ones obtained from analyzing the PCR prevalence in both arms. A possible explanation for the constant seroprevalence and PP seroprevalence could be that constant transmission exists in the areas studied. Only the Ags GLURP, PvEBP, PvMSP1-19 and PvVK247CSP showed a significant difference in seroprevalence with a higher seroprevalence in the repellent arm of the study. However, the p-values of these significant tests were in the range of 0.01 up to 0.049 (see Table 6-7), and would probably not be considered significant if we would have corrected for multiple testing [65].
5.5 Data-analysis Until present, not many multiplex assays were performed for malaria. This has led to the fact that data-analysis in these serological studies mainly is performed Ag per Ag, and multivariate analysis for serological outcomes still needs further elucidation. Literature review (Table 8) shows that most studies use a cutoff method for determining seropositivity, which is mainly performed by using a negative control [31, 42, 49, 51, 52, 66–71]. The negative control group consists in most studies of European sera with no history of malaria, which is often not representative when studying malaria-endemic populations. That is why, when a malaria endemic population is being studied, it would be more appropriate to use a model that takes into account the amount of baseline Abs present in this population [68]. This is the reason why Corran et al proposed the use of a mixture model to classify the studied populations into seropositivity categories [72]. In this mixture model, maximum likelihood methods are used to create seronegative and seropositive Gaussian distributions. The mean of the seronegative distribution plus three standard deviations is then set as the cutoff value for seropositivity [49]. As this is currently the method available for malaria serology, without the need for extensive programming in Winbugs, these mixture models were applied in this thesis. Seroconversion and seroreversion rates can be calculated by generating age-seroprevalence curves, which can then give an indication for the force of infection of a community and be useful to select Abs that reflect exposure over a long or short period [51]. Overall, in most of the papers reviewed in Table 8 such age-seroprevalence curves are constructed [42, 49, 51, 52, 64]. As time was limited, in this thesis they were not yet constructed, but this is the logical next step. In this thesis, instead of only focussing on the seroprevalence, we have also compared intensity of Ab responses by looking at the PP. Finally, as shown by the study of Michel et al, an antibody reaction that does not exceed the cutoff value doesn’t necessarily need to be classified as truly negative [70]. That is why, better methods can be developed
D i s c u s s i o n P a g e | 40
instead of using a fixed titre threshold/ cutoff, especially with regard to longitudinal data [16]. The reason for this is that antibody levels can vary due to a number of reasons unrelated to the infection studied (e.g. stress, other infections, small errors during sample collection, etcetera). Therefore, Bretscher et al proposed a third model, based on a Hidden Markov Model which assigns a probability of seropositivity to individuals, instead of classifying them [16]. Thus, this finite mixture model avoids misclassification of samples due to false conversion and reversion events [16]. As this model requires an extensive knowledge of programming in Winbugs, this was not applied in this thesis. Table 8. Ten monoplex and six multiplex studies on malaria and other diseases. The way the seropositivity threshold is calculated is shown in the last column. The model used per study is shown in bold.
Paper Serological test Disease Antigens Study population Outcome variable Seropositivity threshold
Noor, 2011 Monoplex MalariaPf MSP1-19 and
AMA1
7151 individuals in 156 clusters in Djibouti; Positive
controls: hyper-immune serum pool; Negative
controls: European malaria-negative volunteer
serum
OD (transformed into titres)Cut-off: Mean +3SD of negative controls; Only one
immunity; 134 individuals with high degree of both
clinical and parasitological immunity; Positive
controls: pooled hyperimmune serum collected from
adults resident in a malaria endemic area; Negative
controls: 44 never exposed Europeans
OD (converted to arbitrary
units/mL (titre) using positive
control)
Cut off: mean OD +3SD of negative control
Campo, 2011Monoplex (IFAT,
ELISA)Malaria
Pf sporozoites (NF54
strain sporozoites
were isolated from
infected Anopheles
stephensi
mosquitoes) (IFAT);
PfCSP (ELISA)
165 serum samples of Marines of the 26th Marine
Expeditionary Unit deployed in a holo-endemic area
of Liberia for 10-12 days; Negative controls: plasma
from 40 samples from naïve US volunteers; Positive
controls: NFS1 monoclonal antibody
OD (405nm) (ELISA) Cut-off: Mean +3 SD of the negative controls
De Carvalho,
1992
Monoplex (IFAT,
ELISA)Malaria
Antigen from Pf
isolate from
Rondonia state
219 blood samples tested, collected by fingerprick
during April 1991 in Alto Paraiso; Negative controls:
healthy people without malaria history, inhabiting a
non-endemic region
OD (492nm)Cut-off: Mean + 3SD of 14 negative controls
(calculated for each antigen)
Van Gool, 2002 Monoplex (ELISA) SchistosomiasisS. mansoni egg
antigens (SEA)
Total of 393 patients; Negative controls: 240 patients
with other infectious diseases, 23 with
autoantibodies, and 20 healthy Dutch blood donors
ODCut-off value: Mean OD + 2SD of the negative
controls
D i s c u s s i o n P a g e | 41
Because the way in which the data is interpreted is strongly dependent on the cutoff value that is being used, it is of great importance to improve the approaches to define the cutoff or to even eliminate the need for it, which has recently been worked out by Hens et al [42, 73]. Furthermore, age stratification is a very important factor in the data analysis, as after implementation of a malaria control program changes in seroconversion rates of long lived Abs will be observed in infants and young children and not so much in adults or older children [64, 67]. Another way of detecting changes in seroconversion is by looking at short-lived Abs, which is why in this thesis we have looked at antibody responses in cohort samples of individuals that at one point in time showed malaria infection during sampling.
5.6 Future plans As already mentioned in the previous paragraph, the analysis of the comparison between the PCR positive and PCR negative individuals and subsequently the analysis to define the fluctuation of the Abs should be repeated for single infections only. That way it is possible to estimate whether cross-reaction between species occurs. Furthermore, constructing age-seroprevalence data is of great importance and should be carried out in a next step to compare the force of infection between the control and intervention arm and to calculate theoretical seroreversion rates, which can then be compared with the slopes of the Ab decrease obtained from the sequential samples. Eventually, as discussed in the paragraph of data-analysis, a new model that analyzes multiple Abs simultaneously should be looked at as this allows for a more correct data analysis that takes into account the individual
Ambrosino,
2010Multiplex Malaria
13 pre-erythrocytic
Pf-specific peptides;
2 A. gambiae salivary
peptides
Exposed: 253 individuals from 3 Senegalese areas;
Transiently exposed: 124 European travellers (French
soldiers); Negative controls: 21 serum samples from
unexposed French adults
∆MFI = MFIag - MFIbsa Cut-off: mean +/- 3.09 SD of the negative controls
Fouda, 2006Multiplex SAT,
ELISAMalaria
2 variants of Pf MSP-
1(42), 2 variants of
Pf AMA1, MSP-3,
EBA-175, CSP, RESA,
LSA-1
Plasma samples from Cameroonian adults; Negative
controls: 3 plasmapools collected from 40 Americans
who had never travelled to malaria-endemic areas
and tested negative in ELISA; Positive controls:
plasma samples with consistently high MFI
MFI, OD (405 & 630nm) Cut-off: means +/- 3SD of the negative controls
Khaireh, 2012 Multiplex Malaria
LSA1-41, LSA1-J,
LSA3-NR2, GLURP,
GLURPP3, SALSA1,
SALSA2, TRAP1,
STARP-R, CS (NANP),
SR11.1, Pf MSP1-19
and AMA1, Pv MSP1-
19 and MSP1-42
Adults aged 15-54 years living in the Republic of
Djibouti, Negative controls: 30 sera samples from
French adults never been to malaria-endemic
countries
MFICut-off: mean + 3 SD of the negative controls (for
each Ab)
Sarr, 2011 Multiplex Malaria
Pf Lsa1, Lsa3, GLURP,
Salsa, Trap, Starp,
CSP, Pf11.1, Pf Lsa1-
41, Lsa1J, Lsa3NR2,
LSA3RE, Pf GLURP,
GLURP.P3, Pf Salsa1,
Salsa2, Pf Trap1,
Trap2, StarpR, Pf
CSP, SR11.1
3 Senegalese villages, Negative controls: 19
individuals living permanently in a non-endemic area∆MFI = MFIag - MFIbsa
Cut-off: means of ∆MFI of negative controls +3.09SD
(for each Ag)
Michel, 2009 Multiplex Helicobacter pylori
17 proteins of up to
3 H. pylori strains
(26695, G27, 151)
including CagA,
VacA, UreA,
Catalase, Omp, and
GroEL
131 H. pylori-negative sera (Hpc–) and 186 H. pylori-
positive sera (Hpc+), Negative controls: 20 additional
sera negative in Helicobacter-R-Biopharm ELISA
MFICut-off: mean plus 3 SDs of negative controls (for
each Ag)
Whelan, 2008 Multiplex M. bovisESAT-6, CFP-10 and
MPB83
8-month-old calves nonvaccinated but challenged via
the intratracheal route with a low dose of virulent
strain of M. bovis, Negative controls: sera from herds
of animals free of M. bovis for at least 5 years,
Positive controls: sera from animals proven to be
positive for M. bovis infection at time of slaughter
/
Cut-off for each Ag based on ability of every antigen
to correctly identify a known positive or negative
sample
D i s c u s s i o n P a g e | 42
variation in Ab response. A second improvement with regard to the data analysis can be made by using a model that doesn’t classify samples based on a fixed titre threshold (cutoff).
C o n c l u s i o n P a g e | 44
6 Conclusion This thesis fits within the framework of the MalaResT project, a project which aims at evaluating the additional use of repellents (additional to LLINs) on malaria prevalence and incidence. In this project, one control arm and one intervention arm was included, and preliminary results based on comparison of PCR prevalence showed that the intervention had no effect on malaria PCR prevalence (no difference between control and intervention arm). As serology might be more sensitive in estimating malaria transmission in low transmission areas, the main aim of this thesis was therefore to compare the serological responses in the control and the intervention arm of the MalaResT trial. A total of 8543 samples were successfully analyzed with a multiplex bead based immunoassay during this master thesis. The seroprevalence of samples of PCR positive and negative individuals was compared, and a first attempt to define the fluctuation of the Abs was performed, to eventually define a serological marker indicative for a recent malaria infection. Statistical analysis of these samples revealed that PCR positive individuals indeed experience a higher seroprevalence and Ab intensity compared to PCR negative individuals for most of the Ags. However, the analysis of the three and four times sampled individuals needs further in depth analysis before identifying Abs that fluctuate the most in time. A next step will be to analyze the slope of the curves that represent the Ab intensity in time of the three and four times sampled individuals, and calculate seroconversion and seroreversion rates. Finally, the comparison between the control and intervention arm of the large scale project didn’t show a significant difference in seroprevalence for all Ags based on the preliminary analysis that has now been performed, which confirms the analyses that were performed earlier on PCR prevalence.
B i b l i o g r a p h y P a g e | 45
7 Bibliography
1. Manguin, S., Carnevale, P., Mouchet, J., Coosemans, M., Julvez, J., Richard-Lenoble, D., and Sircoulon, J. (2008). Biodiversity of Malaria in the World (Paris: John Libbey Eurotext).
2. White, N. J., Pukrittayakamee, S., Hien, T. T., Faiz, M. A., Mokuolu, O. a, and Dondorp, A. M. (2013). Malaria. Lancet 6736.
3. WHO (2013). Malaria. Available at: http://www.who.int/mediacentre/factsheets/fs094/en/index.html [Accessed November 18, 2013].
4. Feachem, R. G. a, Phillips, A. a, Hwang, J., Cotter, C., Wielgosz, B., Greenwood, B. M., Sabot, O., Rodriguez, M. H., Abeyasinghe, R. R., Ghebreyesus, T. A., et al. (2010). Shrinking the malaria map: progress and prospects. Lancet 376, 1566–1578.
5. Mendis, K., Rietveld, A., Warsame, M., Bosman, A., Greenwood, B., and Wernsdorfer, W. H. (2009). From malaria control to eradication: The WHO perspective. Trop. Med. Int. Heal. 14, 802–809.
6. Cotter, C., Sturrock, H. J. W., Hsiang, M. S., Liu, J., Phillips, A. a, Hwang, J., Gueye, C. S., Fullman, N., Gosling, R. D., and Feachem, R. G. a (2013). The changing epidemiology of malaria elimination: new strategies for new challenges. Lancet 382, 900 – 911.
7. Alonso, P. L., Brown, G., Arevalo-Herrera, M., Binka, F., Chitnis, C., Collins, F., Doumbo, O. K., Greenwood, B., Hall, B. F., Levine, M. M., et al. (2011). A research agenda to underpin malaria eradication. PLoS Med. 8.
8. Bousema, T., Griffin, J. T., Sauerwein, R. W., Smith, D. L., Churcher, T. S., Takken, W., Ghani, A., Drakeley, C., and Gosling, R. (2012). Hitting hotspots: spatial targeting of malaria for control and elimination. PLoS Med. 9.
9. Badu, K., Afrane, Y. A., Larbi, J., Stewart, V. A., Waitumbi, J., Angov, E., Ong’echa, J. M., Perkins, D. J., Zhou, G., Githeko, A., et al. (2012). Marked variation in MSP-119 antibody responses to malaria in western Kenyan highlands. BioMed Cent. Infect. Dis. 12, 50–59.
10. Cook, J., Speybroeck, N., Sochanta, T., Somony, H., Sokny, M., Claes, F., Lemmens, K., Theisen, M., Soares, I. S., D’Alessandro, U., et al. (2012). Sero-epidemiological evaluation of changes in Plasmodium falciparum and Plasmodium vivax transmission patterns over the rainy season in Cambodia. Malar. J. 11, 86–98.
B i b l i o g r a p h y P a g e | 46
11. Collins, F. H., Alonso, P. L., Besansky, N. J., Burkot, T. R., Hemingway, J., James, A. A., Lindsay, S., Lobo, N. F., Mnzava, A., Tanner, M., et al. (2011). A research agenda for malaria eradication: vector control. PLoS Med. 8.
12. WHO (2012). World Malaria Report 2012.
13. Ministry of Health (2005). Strategic Master Plan for National Malaria Control Program.
14. Ly, P. (2013). Achievements of National Malaria Control Program 2012.
15. Durnez, L., Mao, S., Denis, L., Roelants, P., Sochantha, T., and Coosemans, M. (2013). Outdoor malaria transmission in forested villages of Cambodia. Malar. J. 12, 329–343.
16. Bretscher, M. T., Supargiyono, S., Wijayanti, M. a, Nugraheni, D., Widyastuti, A. N., Lobo, N. F., Hawley, W. a, Cook, J., and Drakeley, C. J. (2013). Measurement of Plasmodium falciparum transmission intensity using serological cohort data from Indonesian schoolchildren. Malar. J. 12, 21.
17. Moody, A. (2002). Rapid Diagnostic Tests for Malaria Parasites. Clin. Microbiol. Rev. 15, 66–78.
18. Dysoley, L., Kaneko, A., Eto, H., Mita, T., Socheat, D., Börkman, A., and Kobayakawa, T. (2008). Changing patterns of forest malaria among the mobile adult male population in Chumkiri District, Cambodia. Acta Trop. 106, 207–12.
19. Taylor, R. R., Egan, a, McGuinness, D., Jepson, a, Adair, R., Drakely, C., and Riley, E. (1996). Selective recognition of malaria antigens by human serum antibodies is not genetically determined but demonstrates some features of clonal imprinting. Int. Immunol. 8, 905–15.
20. Chowell, G., Munayco, C. V, Escalante, A. a, and McKenzie, F. E. (2009). The spatial and temporal patterns of falciparum and vivax malaria in Perú: 1994-2006. Malar. J. 8, 142–161.
21. Weiss, G. E., Traore, B., Kayentao, K., Ongoiba, A., Doumbo, S., Doumtabe, D., Kone, Y., Dia, S., Guindo, A., Traore, A., et al. (2010). The Plasmodium falciparum-specific human memory B cell compartment expands gradually with repeated malaria infections. PLoS Pathog. 6, 1–13.
22. Tuteja, R. (2007). Malaria - an overview. FEBS J. 274, 4670–4679.
23. Schofield, L., and Grau, G. E. (2005). Immunological processes in malaria pathogenesis. Nat. Rev. Immunol. 5, 722–35.
24. Good, M. F., and Doolan, D. L. (2010). Malaria vaccine design: immunological considerations. Immunity 33, 555–66.
B i b l i o g r a p h y P a g e | 47
25. Perlmann, P., and Troye-Blomberg, M. (2002). Malaria and the immune system in humans. Chem. Immunol. 80, 229–242.
26. Coban, C., Ishii, K. J., Horii, T., and Akira, S. (2007). Manipulation of host innate immune responses by the malaria parasite. Trends Microbiol. 15, 271–8.
27. Duffy, P. E., Sahu, T., Akue, A., Milman, N., and Anderson, C. (2012). Pre-erythrocytic malaria vaccines: identifying the targets. Expert Rev. Vaccines 11, 1261–1280.
28. Orlandi-Pradines, E., Penhoat, K., Durand, C., Pons, C., Bay, C., Pradines, B., Fusai, T., Josse, R., Dubrous, P., Meynard, J.-B., et al. (2006). Antibody responses to several malaria pre-erythrocytic antigens as a marker of malaria exposure among travelers. Am. J. Trop. Med. Hyg. 74, 979–985.
29. Kappe, S. H. I., Noe, A. R., Fraser, T. S., Blair, P. L., and Adams, J. H. (1998). A family of chimeric erythrocyte binding proteins of malaria proteins. Proc. Natl. Acad. Sci. U. S. A. 95, 1230–1235.
30. Souza-Silva, F. a, da Silva-Nunes, M., Sanchez, B. a M., Ceravolo, I. P., Malafronte, R. S., Brito, C. F. a, Ferreira, M. U., and Carvalho, L. H. (2010). Naturally acquired antibodies to Plasmodium vivax Duffy binding protein (DBP) in rural Brazilian Amazon. Am. J. Trop. Med. Hyg. 82, 185–193.
31. Ambrosino, E., Dumoulin, C., Orlandi-Pradines, E., Remoue, F., Toure-Baldé, A., Tall, A., Sarr, J. B., Poinsignon, A., Sokhna, C., Puget, K., et al. (2010). A multiplex assay for the simultaneous detection of antibodies against 15 Plasmodium falciparum and Anopheles gambiae saliva antigens. Malar. J. 9, 317–329.
32. Pratt-Riccio, L. R., Bianco, C., Totino, P. R. R., Perce-Da-Silva, D. D. S., Silva, L. A., Riccio, E. K. P., Ennes-Vidal, V., Neves-Ferreira, A. G. C., Perales, J., Da Rocha, S. L. G., et al. (2011). Antibodies against the Plasmodium falciparum glutamate-rich protein from naturally exposed individuals living in a Brazilian malaria-endemic area can inhibit in vitro parasite growth. Mem. Inst. Oswaldo Cruz 106 Suppl , 34–43.
33. Akpogheneta, O. J., Duah, N. O., Tetteh, K. K. a, Dunyo, S., Lanar, D. E., Pinder, M., and Conway, D. J. (2008). Duration of naturally acquired antibody responses to blood-stage Plasmodium falciparum is age dependent and antigen specific. Infect. Immun. 76, 1748–1755.
34. Branch, O. H., Udhayakumar, V., Hightower, a W., Oloo, a J., Hawley, W. a, Nahlen, B. L., Bloland, P. B., Kaslow, D. C., and Lal, a a (1998). A longitudinal investigation of IgG and IgM antibody responses to the merozoite surface protein-1 19-kiloDalton domain of Plasmodium falciparum in pregnant women and infants: associations with febrile illness, parasitemia, and anemia. Am. J. Trop. Med. Hyg. 58, 211–219.
35. Bruce-Chwatt, L. J. (1985). Essential Malarialogy Second. (London: The Alden Press).
B i b l i o g r a p h y P a g e | 48
36. Tangpukdee, N., Duangdee, C., Wilairatana, P., and Krudsood, S. (2009). Malaria diagnosis: a brief review. Korean J. Parasitol. 47, 93–102.
38. Luminex Corporation Fundamental Assay Techniques Protein.
39. Kerkhof, K. (2013). Implementation of a multiplex assay for detection of antibodies against different (20) Plasmodium antigens: A potential tool for evaluating anti-malarial interventions. 97.
40. Greenwood, B. M., Bojang, K., Whitty, C. J. M., and Targett, G. a T. (2005). Malaria. Lancet 365, 1487–1498.
41. Theisen, M., Vuust, J., Gottschau, a, Jepsen, S., and Høgh, B. (1995). Antigenicity and immunogenicity of recombinant glutamate-rich protein of Plasmodium falciparum expressed in Escherichia coli. Clin. Diagn. Lab. Immunol. 2, 30–4.
42. Noor, A. M., Mohamed, M. B., Mugyenyi, C. K., Osman, M. A., Guessod, H. H., Kabaria, C. W., Ahmed, I. A., Nyonda, M., Cook, J., Drakeley, C. J., et al. (2011). Establishing the extent of malaria transmission and challenges facing pre-elimination in the Republic of Djibouti. BMC Infect. Dis. 11, 121–135.
43. Vigan-Womas, I., Guillotte, M., Juillerat, A., Vallieres, C., Lewit-Bentley, A., Tall, A., Baril, L., Bentley, G. a, and Mercereau-Puijalon, O. (2011). Allelic diversity of the Plasmodium falciparum erythrocyte membrane protein 1 entails variant-specific red cell surface epitopes. PLoS One 6, e16544.
44. Souza-Silva, F. a, da Silva-Nunes, M., Sanchez, B. a M., Ceravolo, I. P., Malafronte, R. S., Brito, C. F. a, Ferreira, M. U., and Carvalho, L. H. (2010). Naturally acquired antibodies to Plasmodium vivax Duffy binding protein (DBP) in rural Brazilian Amazon. Am. J. Trop. Med. Hyg. 82, 185–193.
45. Hester, J., Chan, E. R., Menard, D., Mercereau-Puijalon, O., Barnwell, J., Zimmerman, P. a, and Serre, D. (2013). De novo assembly of a field isolate genome reveals novel Plasmodium vivax erythrocyte invasion genes. PLoS Negl. Trop. Dis. 7, e2569.
46. Sutherland, C. J. (2009). Surface antigens of Plasmodium falciparum gametocytes - A new class of transmission-blocking vaccine targets? Mol. Biochem. Parasitol. 166, 93–98.
47. Cheng, Y., Ito, D., Sattabongkot, J., Lim, C. S., Kong, D.-H., Ha, K.-S., Wang, B., Tsuboi, T., and Han, E.-T. (2013). Serological responses to a soluble recombinant chimeric Plasmodium vivax circumsporozoite protein in VK210 and VK247 population. Malar. J. 12, 323.
B i b l i o g r a p h y P a g e | 49
48. Perera, K. L., Handunnetti, S. M., Holm, I., Longacre, S., and Mendis, K. (1998). Baculovirus merozoite surface protein 1 C-terminal recombinant antigens are highly protective in a natural primate model for human Plasmodium vivax malaria. Infect. Immun. 66, 1500–6.
49. Cook, J., Reid, H., Iavro, J., Kuwahata, M., Taleo, G., Clements, A., McCarthy, J., Vallely, A., and Drakeley, C. (2010). Using serological measures to monitor changes in malaria transmission in Vanuatu. Malar. J. 9, 169.
50. Fouda, G. G., Leke, R. F. G., Long, C., Druilhe, P., Zhou, A., Taylor, D. W., and Johnson, A. H. (2006). Multiplex assay for simultaneous measurement of antibodies to multiple Plasmodium falciparum antigens. Clin. Vaccine Immunol. 13, 1307–1313.
51. Sarr, J. B., Orlandi-Pradines, E., Fortin, S., Sow, C., Cornelie, S., Rogerie, F., Guindo, S., Konate, L., Fusaï, T., Riveau, G., et al. (2011). Assessment of exposure to Plasmodium falciparum transmission in a low endemicity area by using multiplex fluorescent microsphere-based serological assays. Parasit. Vectors 4, 212–220.
52. Khaireh, B. A., Briolant, S., Pascual, A., Mokrane, M., Machault, V., Travaillé, C., Khaireh, M. A., Farah, I. H., Ali, H. M., Abdi, A.-I. A., et al. (2012). Plasmodium vivax and Plasmodium falciparum infections in the Republic of Djibouti: evaluation of their prevalence and potential determinants. Malar. J. 11, 395–427.
53. Claes, F., Speybroeck, N., Van den Eede, P., Nguyen, V. H., Ta, T. T., Le, M. D., Balharbi, F., and Van Overmeir, C. Estimating the incidence of malaria by measuring changes of Plasmodium falciparum GLURP antibody titres determined by ELISA in a community-based cohort in Vietnam. 25.
54. Kusi, K. a, Bosomprah, S., Dodoo, D., Kyei-Baafour, E., Dickson, E. K., Mensah, D., Angov, E., Dutta, S., Sedegah, M., and Koram, K. a (2014). Anti-sporozoite antibodies as alternative markers for malaria transmission intensity estimation. Malar. J. 13, 103.
55. Cho, P.-Y., Lee, S.-W., Ahn, S. K., Kim, J. S., Cha, S. H., Na, B.-K., Park, Y.-K., Lee, S. K., Lee, W.-J., Nam, H.-W., et al. (2013). Evaluation of circumsporozoite protein of Plasmodium vivax to estimate its prevalence in the Republic of Korea: an observational study of incidence. Malar. J. 12, 448.
56. Rodríguez, A., Goudsmit, J., Companjen, A., Mintardjo, R., Gillissen, G., Tax, D., Sijtsma, J., Weverling, G. J., Holterman, L., Lanar, D. E., et al. (2008). Impact of recombinant adenovirus serotype 35 priming versus boosting of a Plasmodium falciparum protein: characterization of T- and B-cell responses to liver-stage antigen 1. Infect. Immun. 76, 1709–1718.
57. Hillier, C. J., Ware, L. A., Barbosa, A., Angov, E., Lyon, J. A., Heppner, D. G., Lanar, D. E., Al, H. E. T., and Mmun, I. N. I. (2005). Process Development and Analysis of Liver-Stage Antigen 1 , a Preerythrocyte-Stage Protein-Based Vaccine for Plasmodium falciparum. 73, 2109–2115.
B i b l i o g r a p h y P a g e | 50
58. Suwancharoen, C., Putaporntip, C., Rungruang, T., and Jongwutiwes, S. (2011). Naturally acquired IgG antibodies against the C-terminal part of Plasmodium falciparum sporozoite threonine-asparagine-rich protein in a low endemic area. Parasitol. Res. 109, 315–20.
59. Sousa, T. N. De, Kano, F. S., Brito, C. F. A. De, and Carvalho, L. H. (2014). The Duffy binding protein as a key target for a Plasmodium vivax vaccine: lessons from the Brazilian Amazon. Mem. Inst. Oswaldo Cruz, 25–30.
60. Imwong, M., Nakeesathit, S., Day, N. P. J., and White, N. J. (2011). A review of mixed malaria species infections in anopheline mosquitoes. Malar. J. 10, 253.
61. Van Bortel, W., Trung, H. D., Hoi, L. X., Van Ham, N., Van Chut, N., Luu, N. D., Roelants, P., Denis, L., Speybroeck, N., D’Alessandro, U., et al. (2010). Malaria transmission and vector behaviour in a forested malaria focus in central Vietnam and the implications for vector control. Malar. J. 9, 373.
62. Rosenberg, R., and Wirtz, R. A. (1990). Intrinsic individual differences in circumsporozoite antibody response at a hyperendemic malaria focus. Trans. R. Soc. Trop. Med. Hyg. 84, 206–208.
63. Wipasa, J., Suphavilai, C., Okell, L. C., Cook, J., Corran, P. H., Thaikla, K., Liewsaree, W., Riley, E. M., and Hafalla, J. C. R. (2010). Long-lived antibody and B Cell memory responses to the human malaria parasites, Plasmodium falciparum and Plasmodium vivax. PLoS Pathog. 6, e1000770.
64. Drakeley, C. J., Corran, P. H., Coleman, P. G., Tongren, J. E., McDonald, S. L. R., Carneiro, I., Malima, R., Lusingu, J., Manjurano, a, Nkya, W. M. M., et al. (2005). Estimating medium- and long-term trends in malaria transmission by using serological markers of malaria exposure. Proc. Natl. Acad. Sci. U. S. A. 102, 5108–13.
65. Lin, M., and Lucas, H. C. (2013). Too Big to Fail : Large Samples and the p -Value Problem. 7047, 1–12.
66. Williams, G. S., Mweya, C., Stewart, L., Mtove, G., Reyburn, H., Cook, J., Corran, P. H., Riley, E. M., and Drakeley, C. J. (2009). Immunophoretic rapid diagnostic tests as a source of immunoglobulins for estimating malaria sero-prevalence and transmission intensity. Malar. J. 8, 168.
67. Proietti, C., Verra, F., Bretscher, M. T., Stone, W., Kanoi, B. N., Balikagala, B., Egwang, T. G., Corran, P., Ronca, R., Arcà, B., et al. (2013). Influence of infection on malaria-specific antibody dynamics in a cohort exposed to intense malaria transmission in northern Uganda. Parasite Immunol. 35, 164–73.
68. Campo, J. J., Whitman, T. J., Freilich, D., Burgess, T. H., Martin, G. J., and Doolan, D. L. (2011). Toward a surrogate marker of malaria exposure: modeling longitudinal antibody measurements under outbreak conditions. PLoS One 6, e21826.
B i b l i o g r a p h y P a g e | 51
69. Gool, T. Van, Vetter, H., Vervoort, T., Michael, J., Wetsteyn, J., Overbosch, D., and Doenhoff, M. J. (2002). Serodiagnosis of Imported Schistosomiasis by a Combination of a Commercial Indirect Hemagglutination Test with Schistosoma mansoni Adult Worm Antigens and an Enzyme-Linked Immunosorbent Assay with S . mansoni Egg Antigens 40(9), 3432-3437.
70. Michel, A., Waterboer, T., Kist, M., and Pawlita, M. (2009). Helicobacter pylori multiplex serology. Helicobacter 14, 525–35.
71. De Carvalho, MA., Ferreira, MU., De Souza, MRD., Ninomia, RT., Matos, GF. (1992). Malaria seroepidemiological comparison between indirect fluorescent Ab test and enzyme immunoassay using bloodspot eluates. Mem. Inst. Oswaldo Cruz. 87(2), 205-208.
72. Corran, P., Coleman, P., Riley, E., and Drakeley, C. (2007). Serology: a robust indicator of malaria transmission intensity? Trends Parasitol. 23, 575–582.
73. Hens, N., Shkedy, Z., Aerts, M., Faes, C., Van Damme, P., and Beutels, P. (2012). Modeling Infectious Disease Parameters Based on Serological and Social Contact Data: A Modern Statistical Perspective (Statistics for Biology and Health) (Springer).
74. Privalsky lab Cell Counting with a Hemocytometer. Available at: http://microbiology.ucdavis.edu/privalsky/hemocytometer [Accessed April 5, 2014].
A n n e x P a g e | 52
8 Annex
8.1 Annex I – Supplementary figures
Supplementary figure 1. Volumes used to prepare the microsphere working mixture.