Page 1
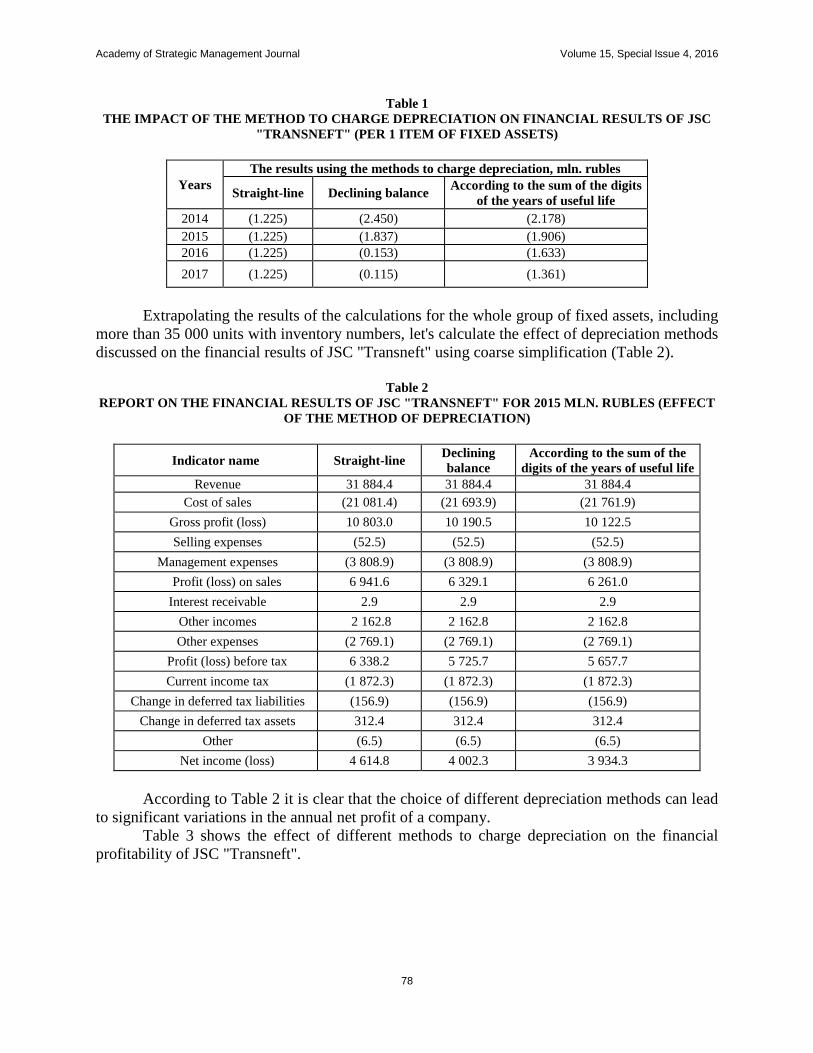
Volume 15, Special Issue 4 Print ISSN 1544-1458
Online ISSN 1939-6104
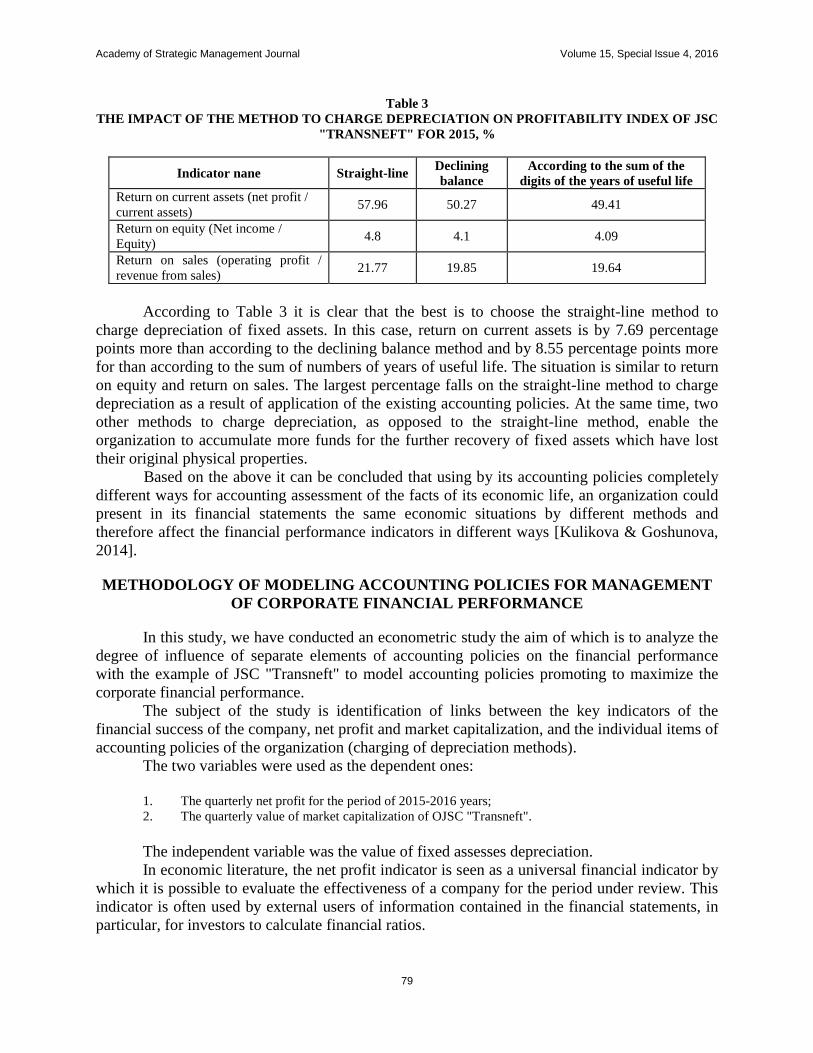
ACADEMY OF
STRATEGIC MANAGEMENT JOURNAL
Editor
Dr. Rezeda Muhtarovna Kundakchyan
Kazan Federal University
The Academy of Strategic Management Journal is owned and published by Jordan Whitney
Enterprises, Inc. Editorial content is under the control of the Allied Academies, Inc., a non-profit
association of scholars, whose purpose is to support and encourage research and the sharing and
exchange of ideas and insights throughout the world.
Page 2
Authors execute a publication permission agreement and assume all liabilities. Neither
Jordan Whitney Enterprises nor Allied Academies is responsible for the content of the
individual manuscripts. Any omissions or errors are the sole responsibility of the
authors. The Editorial Board is responsible for the selection of manuscripts for
publication from among those submitted for consideration. The Publishers accept final
manuscripts in digital form and make adjustments solely for the purposes of pagination
and organization.
The Academy of Strategic Management Journal is owned and published by Jordan
Whitney Enterprises, Inc., PO Box 1032, Weaverville, NC 28787, USA. Those
interested in communicating with the Journal, should contact the Executive Director of
the Allied Academies at [email protected] .
Copyright 2016 by Jordan Whitney Enterprises, Inc., USA
Page 3
EDITORIAL REVIEW BOARD
Dr. Gallyamova
Kazan Federal University
Ajdar Tufetulov
Kazan Federal University
Alexander Rozentsvaig
Kazan Federal University
Vladimir Nesterov
Kazan Federal University
Michail Panasyuk
Kazan Federal University
Alexei Isavnin
Kazan Federal University
Rezeda Kundakchyan
Kazan Federal University
Page 4
TABLE OF CONTENTS
CHOICE FORMATION AT THE CONSUMER MARKET OF INNOVATIVE
PRODUCTS…………………………………………………………………………………….…1
Nail N. Badrtdinov, Kazan Federal University
USING ABC TO ENHANCE THROUGHPUT ACCOUNTING: AN INTEGRATED
MANAGEMENT APPROACH……………………………………………………………… …8
Andrei Yu. Sokolov, Kazan Federal University
Tatyana V. Elsukova, Kazan Federal University
FINANCIAL STATEMENTS AS AN INFORMATION BASE FOR THE ANALYSIS AND
MANAGEMENT DECISIONS………………………………………………………………..16
F.S. Nugayev, Kazan Federal University
R.Z. Mukhametzyanov, Kazan Federal University
ENSURING THE EFFECTIVENESS OF THE PRIVATIZATION OF STATE-OWNED
COMPANIES IN THE CONDITIONS OF INSTABILITY OF THE FINANCIAL MARKETS
(UNDER THE EXAMPLE OF OJSC "OIL COMPANY "ROSNEFT")…………………….….23
Nail Gabdullin, Kazan Federal University
Igor Kirshin, LenarVafin, Kazan Federal University
FINANCIAL RISK MANAGEMENT INSTRUMENTS FOR PETRO-CHEMICAL
INDUSTRY…………………………………………………………………………………...…32
Adel A. Daryakin, Kazan Federal University
Gulnaz R. Khafizova, Kazan Federal University
MANAGEMENT OF INNOVATIVE PROJECTS ON THE ORGANIZATION OF
PRODUCTION AND COMMERCIALIZATION OF ENERGY-EFFICIENT PRODUCTS….39
A. M. Fatkhiev, Kazan Federal University
M. P. Postalyuk, University of Management “TISBI”
L. N. Safiullin, Kazan Federal University
INNOVATIZATION OF PLANNING INSTITUTIONS IN THE SYSTEM OF RUSSIAN
ECONOMIC MANAGEMENT…………………………………………………………………47
A. M. Fatkhiev, Kazan Federal University
M. P. Postalyuk, University of Management “TISBI”.
L. N. Safiullin, Kazan Federal University
ANTI-CORRUPTION POLICY OF THE REPUBLIC OF TATARSTAN………………….…54
Vyacheslav N. Ageev, Kazan Federal University
Ekaterina A. Khuzina, Kazan Federal University
Page 5
CONCEPT OF DEVELOPMENT OF AN ENTREPRENEURIAL CULTURE IN THE
HOSPITALITY INDUSTRY ENTERPRISES OF THE REPUBLIC OF TATARSTAN …..…60
G. A. Abulhanova, Kazan Federal University
G. R. Chumarina, Kazan Federal University
D. S. Shakirova, Kazan Federal University
ECONOMIC FORECASTING AND PERSONNEL MANAGEMENT OF SMALL AND
MEDIUM ENTERPRISES……………………………………………………………...........….67
G.A. Abulhanova, Kazan Federal University
G.R.Chumarina, Kazan Federal University
E.G. Nikiforova, Kazan Federal University
T.A. Sharifullina, Kazan innovative university
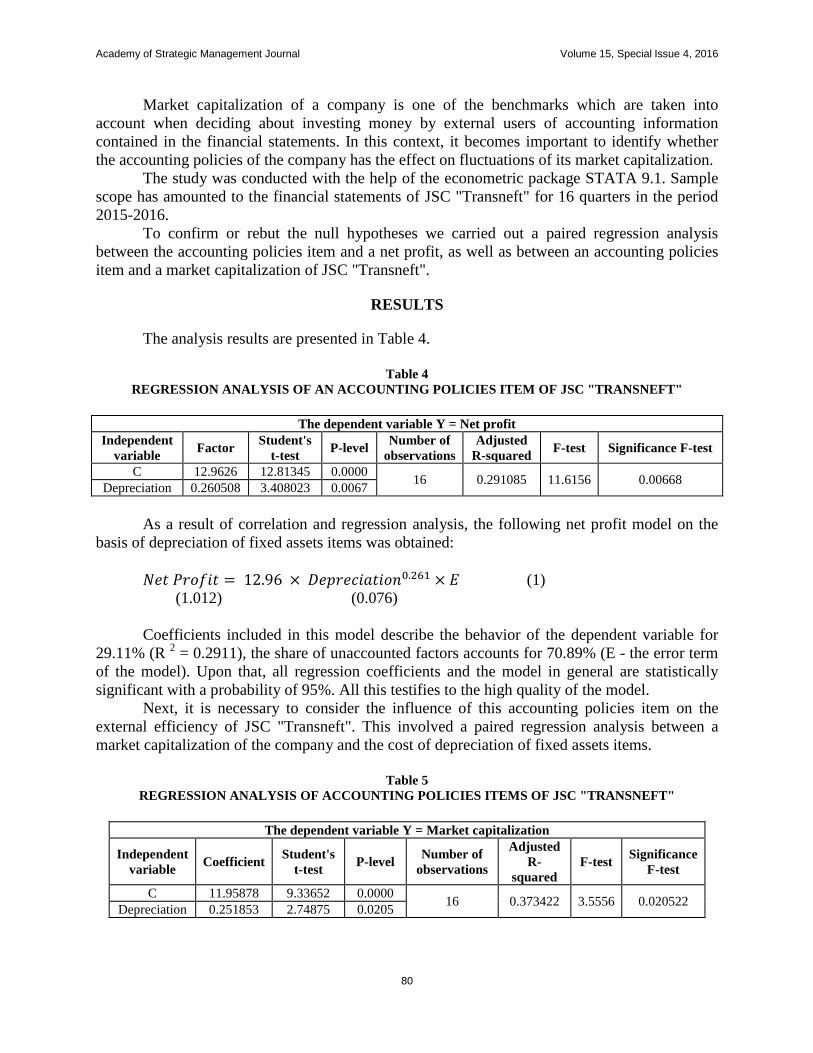
MODELING OF ACCOUNTING POLICIES AS A TOOL OF MANAGEMENT OF
CORPORATE FINANCIAL PERFORMANCE……………………………………………..….76
Anna Goshunovaa, Kazan Federal University
Alexey Kirpikovb, Kazan Federal University
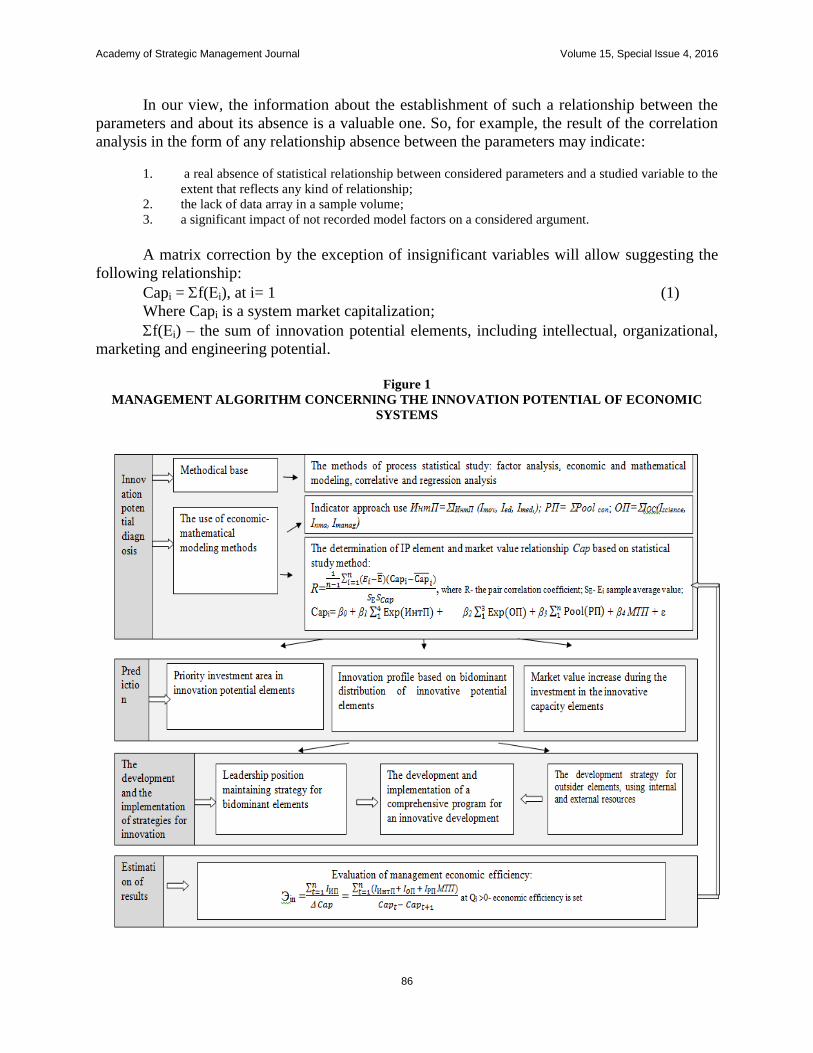
INNOVATION POTENTIAL MANAGEMENT FOR ECONOMIC SYSTEMS……………...83
Arthur E. Ustinov, Kazan Federal University
Liliya N. Ustinova, Kazan State Architectural and Construction University
Aida A. Safina, Kazan Federal University
Leysan M. Davletshina, Kazan Federal University
Larisa G. Nabieva, Kazan Federal University
Page 6
Academy of Strategic Management Journal Volume 15, Special Issue 4, 2016
1
CHOICE FORMATION AT THE CONSUMER MARKET
OF INNOVATIVE PRODUCTS
Nail N. Badrtdinov, Kazan Federal University
ABSTRACT
The article presents the interpretation of innovative products as an object of consumer
demand, which attributive signs include the initiation and (or) meeting the new needs by them,
enabling to implement the individual interests of consumers; the use of "subversive" or
"supportive" factors of production and their combinations; the presence of external effect in the
form of exceedence of public benefits over the private ones, enabling to implement the public
(collective) interest. The author has formulated the features of market of innovative products as
a consumer market segment, and a classification of consumers of innovative products is
presented based on the segmentation model of potential innovation consumers on the basis of
individual predisposition to the innovation perception (modelofE. Rogers). The methods of state
regulation of the market of innovative products are determined for the today conditions.
Key Words: Innovative Products, Consumer Demand, Classification of Product Innovation
Consumers, Innovation External Effect, Innovation Cycle, Methods of Consumer Demand
Stimulation, Consumer Behavior, and Consumer Choice Management.
INTRODUCTION
To solve the problem of increasing the costs of economic agents for the innovative
products in the Russian Federation (RF), it has been developed a system of measures,
encouraging the purchase of high-tech goods and services by the entrepreneurship subjects, it has
been created the Registry of Innovative Products, Technologies and Services that are
recommended for use, it is incorporated the institutions that ensure risk reduction of introduction
of new products and enable to coordinate the developers' efforts, it is transformed the principles
of functioning of educational institutions, aimed at forming a qualitatively new structure of
professional competences and participating in the promotion of innovative projects, etc. Such
measures are aimed at increasing the supply volume of innovative products, which is one of the
key factors of their competitiveness at the national and international markets. This, in turn,
causes an increase of the basic macroeconomic indicators, level indicators and quality of life of
the population. According to the expert estimates of McKinsey Global Institute (MGI) - an
independent research unit of McKinsey Company, the total direct benefit of mankind from the
introduction of 12 advanced technologies in 2015 was comparable with the GDP volume of the
USA and the states of the European Union (in the aggregate). However, a prerequisite for the
effectiveness of this strategy is the availability of consumer demand for the innovative products,
characterized by a number of specific features, without which it cannot be formed a closed
innovation cycle and it cannot be successfully made the innovations commercialization. In the
presence of the general laws of functioning of the market of innovative products, it should be
recognized the existence of a number of specific features, which are determined by the subjective
and objective structure of economic relations arising in the consumer market of innovative
products. This makes it necessary to study the choice management tools of households,
Page 7
Academy of Strategic Management Journal Volume 15, Special Issue 4, 2016
2
entrepreneurship and state subjects in favor of innovative products. This has determined the
choice of research topic, its theoretical and practical significance.
The ideas about the nature and forms of innovation have passed several stages in their
development. At the end of XIX - the first third of the XX century it was the beginning of the
formation of innovation theory in the framework of the concepts of economic growth and
cyclical development of society. In the second half of the XX century it was presented different
approaches to the innovation classification, it was conducted the analysis of the relationship of
cyclical economy with the innovation cyclic nature through the S-shaped logistic curve that
formed the basis of dynamic modeling of innovative business. Further development of the
innovation theory and innovative development is associated with the papers of A. Klyaynknekht
(the theory of innovation clusters on the long-term economic cycle phases), J. Van Dyne (the
development of the theory of "long waves" in the economy, taking into account the infrastructure
role), A.I. Anchishkin (position on the role of scientific and technological progress in the
planned economy), Yu.V. Yakovets (study of the relationship of radical innovations in different
sectors of society), S.Yu. Glazev (the concept of technological structures) D. Kolb (the "learning
loop" model), J. Tid (the innovation process model), G. Chesbro (the model of "open
innovations"), A.J. Berkkhout (the cyclic innovation model), L. Hayn (the integrated product
development model), E. Rojers (the segmentation model of potential innovation customers on the
basis of individual predisposition to the innovation perception) et al. The current stage of
development of the innovation theory is associated with the formation of the concept of national
innovation systems, the study of innovation activity management functions.
The beginning of development of the theory of consumer behavior was laid in the papers
of the representatives of the classical school of political economy (the idea of commodity
fetishism of K. Marx, the luxury concept of W. Sombart, etc.). Further development of the ideas
about the laws and regularities of consumer choice is due to the marginalist concept, under which
the cardinal and ordinal approaches have been formed. Certain aspects of consumer behavior
have been investigated in the framework of the marketing theory.
METODOLOGY
The methodological basis of the study is the provisions of alternative schools of
economic theory, which determine the current approaches to the interpretation of the regularities
of consumer behavior, innovations and innovative development, state regulation of the economy,
social welfare theory, evolution and change of technological structures. The multidimensional
nature of the object of study has predetermined the need for the use of provisions set forth in the
related fields of scientific knowledge - economic sociology and psychology, game theory, etc.
RESULTS
The assumption that the formation of effective consumer demand for innovative products
is a necessary condition for the implementation of closed innovative cycle, restoration of
sustainable economic development serves as a working hypothesis of the study.
The author proceeds from the assumption that the innovative products are the result of the
value creation process (life cycle of innovation), in the framework of which the incubation and
market (coinciding with the life cycle of innovative products) periods are identified with the
respectively negative and positive values of net present value, discreteness and continuousness;
at the same time it has been revealed that the attributive features of innovative products are the
Page 8
Academy of Strategic Management Journal Volume 15, Special Issue 4, 2016
3
initiation and (or) meeting the new needs by them, enabling to implement the individual interests
of consumers; the use of "subversive" or "supportive" factors of production and their
combinations (according to K. Kristensen), enabling to reduce the time lag between the
incubation period and the point of return on investment within a market period of innovation for
the manufacturers; the presence of external effect in the form of exceedence of public benefits
over the private ones, enabling to implement the public (collective) interest (Badrtdinov, 2015).
The market of innovative products is treated in this paper as a segment of consumer
goods (services) market, characterized by the presence of regional or sectoral boundaries, which
are caused by the placement area or type of economic activity carried out by the participants of
innovation cycle (Badrtdinov, 2015). This enables to use the provisions of industrial market
theory in its analysis. The presence of a time lag between the market and incubation periods of
the innovation cycle, as well as the time frames of its implementation determine the functioning
period of the market of innovative products. The inefficiency of such market is manifested in the
presence of external effects of innovative products consumption, the amount of which varies
depending on the recipient composition and the nature of institutional environment that
encourages (limits) the receipt of total utility, exceeding the volume of individual utility. If the
supply of innovative products corresponds to the demand formed or stimulates its creation, and
the institutions of such market contribute to the innovation diffusion, then the amount of total
utility greatly exceeds the amount of individual utility for a consumer.
A necessary condition for the functioning of this market is the existence of a competitive
environment (competition of manufacturers and competition of consumers). The market, which
is characterized by the monopsonic or oligopsonic structure, determines the lack of demand for
innovative products, since it leads to the formation of price, which does not provide an inflow of
economic profit. Thus, the competition stimulation between the buyers serves as one of the areas
of market regulation. The bilateral monopoly and bilateral oligopoly, arising from the monopoly
on the objects of intellectual property, are characterized by the formation of the equilibrium
price, which provides receipt of a minimum volume of consumer surplus and manufacturer
surplus, which results in the absence of the stimulus to the innovation commercialization. For the
development of this market it is necessary to stimulate the supply with the use of targeted
subsidies, instruments of competition stimulation in the other sectoral markets that enhance
excess of manufacturer surplus ofinnovative products. (Blackwell et al., 2007)
In contrast to the market of traditional products, the market of innovative products is
characterized by a high volume of transactional costs for the information search about the
potential manufacturers (sellers) and the buyers, the content and degree of requirements
satisfaction of the latter, the availability and properties of complement goods, as well as the costs
for negotiating and concluding contracts, the costs for protecting the intellectual property rights
and their transfer, the cost for monitoring the market capacity and the quality of products related
to the number of confidential or experimental products, the costs for functioning of the contract
enforcement mechanism.
The volume of supply of innovative products is directly dependent on the amount of
innovative potential of the consumer, which in turn is determined by the presence of
consumption experience of innovative products, the degree of compatibility with the complement
goods, the volume of the costs for replacement of traditional products, and the cross-cultural
characteristics of demand subjects. At that the demand for innovative products is relatively
inelastic, which is due to the limited impact of price on the demand volume. (Dorogina, 2016)
Page 9
Academy of Strategic Management Journal Volume 15, Special Issue 4, 2016
4
In the implementation phase of innovative products, which can be defined as the
prototyping phase, it is mostly used the expensive pricing method, enabling to set the lower price
limit based on incurred and estimated costs, as well as the income method based on the potential
investments in the production process. In the growth phase of innovative products (phase of
market entry by a small volume of products), which is characterized by a high risk of rejection of
the new product, it is implemented such price strategies as "skimming" or "market penetration",
as well as the parametric method, which takes into account the information on consumer
properties of the goods received by the consumer. It enables to make an adjustment of the price
lower limit set by the cost method. In the stabilization phase (phase of mass production) and the
life cycle decay phase of innovative products, the transaction costs for the information search
and monitoring are reduced, enabling to use different pricing models focused on the
maximization of sales volume, taking into account the elasticity of demand and the psychological
characteristics of the consumer. The study has shown that the achievement of Pareto-optimal
state of this market segment is possible in the case of application of price discrimination, which
is based on the implementation of improving innovations and pseudo innovations in order to
improve the production, as well as to account the system of value concepts and status roles of the
consumer, to introduce the transfer system of formalized knowledge and to support the processes
of its commercialization (technical support), providing the appropriate quality level. Thus, the
feature of the pricing mechanism on the market of innovative products is its dependence on the
life cycle phase, along with dependence on the market type, consumer preferences, and
government regulatory instruments.
During the study we have offered the classification of consumers of innovative products,
which is based on the segmentation model of potential innovation customers on the basis of
individual predisposition to the innovation perception (model of E. Rojers) (Aleshyna, 2006;
Solomon, 2003), which has made it possible to justify the dominance thesis in the number of
non-price factors of consumer demand of "innovators" of status or hedonic needs, "development
pioneers" - individual, group, generational, striation needs to demonstrate the economic, social,
moral, psychological factors, "early majority"- cognitive needs," late majority" - income, prices
for the complement goods, and "sluggish" - prices for the substitute products, institutional traps.
The analysis of factors, determining the household behavior on the markets of innovative
products, has enabled to determine that currently the most important criteria, having impact on
the decision-making in this area by the consumers, are: type of consumer, share of income
remaining at the household disposal after the acquisition of essential goods and services,
usefulness of innovative product with the household point of view, presence of the
recommendations of the members of household social network concerning the product purchase.
To test the significance of these factors were surveyed 108 household representatives of the
Volga Federal District, who purchased the innovative products (including products of
conspicuous consumption, 12.04% of the sample), using the 5-point Likert scale. At that, the
consumer type has been estimated at the level of propensity to purchase of innovative products
(1 - "buyer-innovator", 5 - "user-late follower"), the share of income remaining at the household
disposal after the acquisition of essential goods and services - in the percentage ratio of expenses
(1 - "after payment of the essential goods and services more than 40% of income remains at the
disposal of the household", 5 - "after payment of the essential goods and services less than 10%
of income remains at the disposal of the household"); the usefulness of innovative product with
the household point of view (1 - "completely useless" and 5 - "very useful"), the presence of
recommendations of the members of household social network concerning the product purchase
Page 10
Academy of Strategic Management Journal Volume 15, Special Issue 4, 2016
5
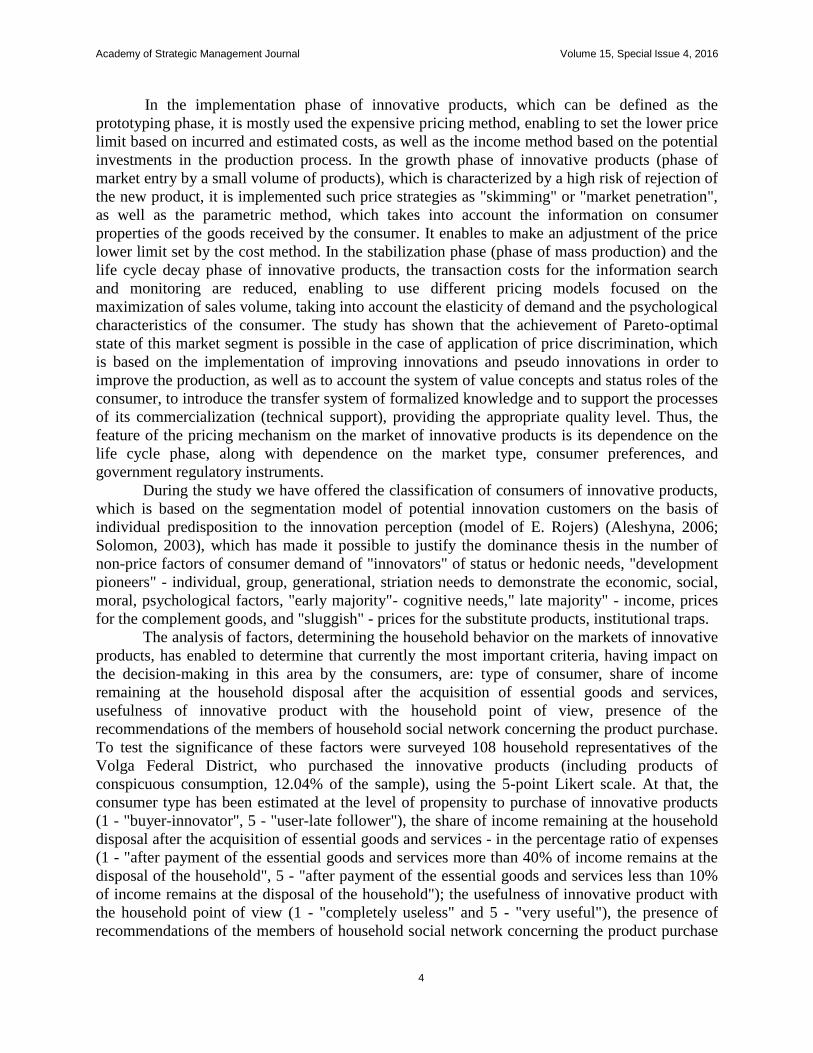
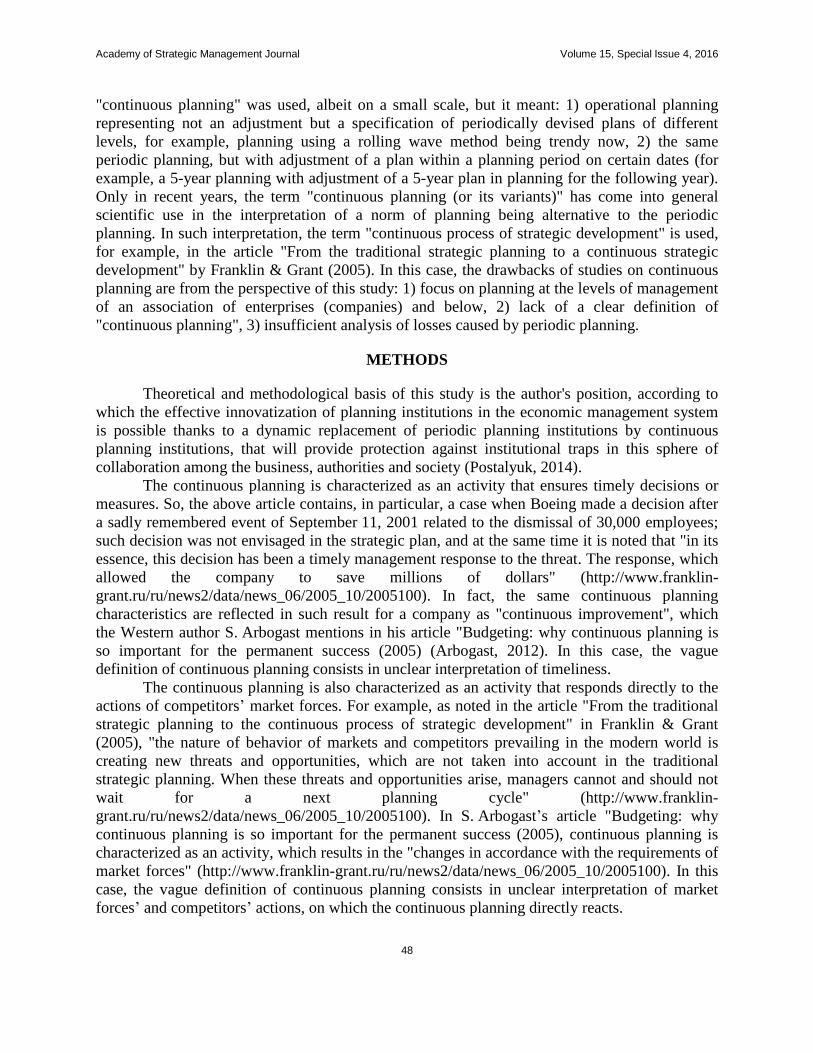
(1 - "nobody recommended the product", 5 - "all friends recommended the product"). The results
of correlation analysis carried out using the SPSS Statistics software are shown in Table 1 (** -
correlation is significant at the level of 0.01, * - correlation is significant at the level of 0.05).
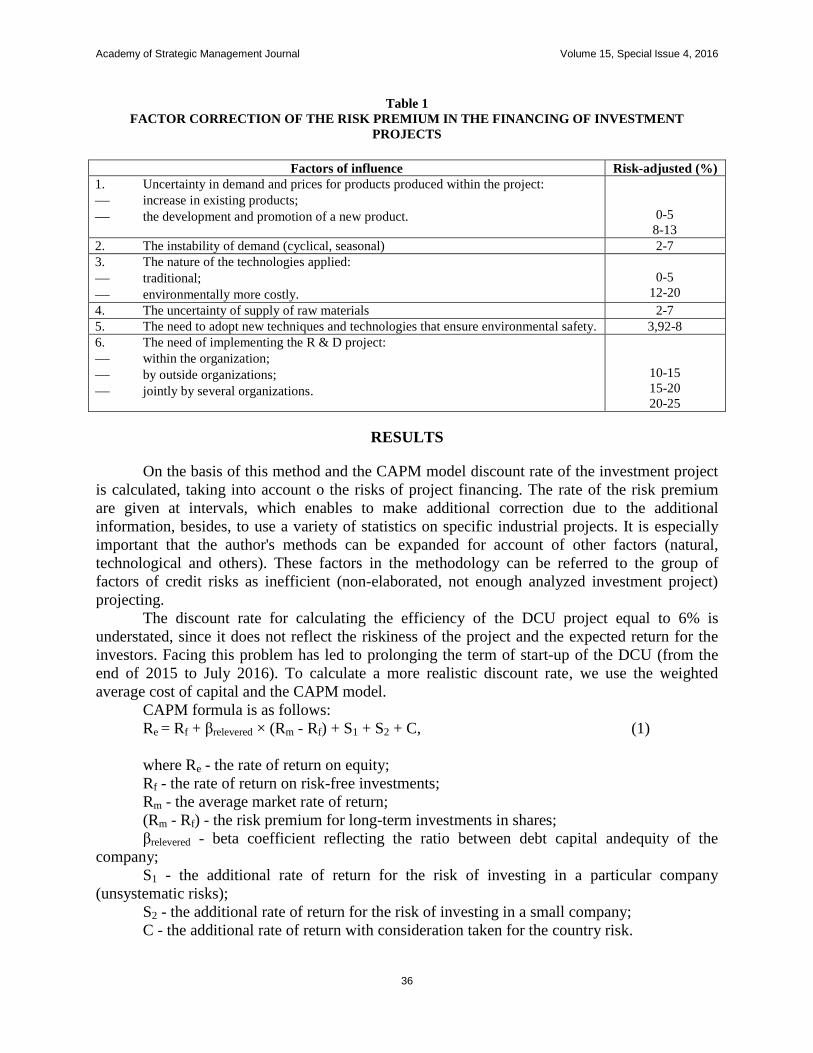
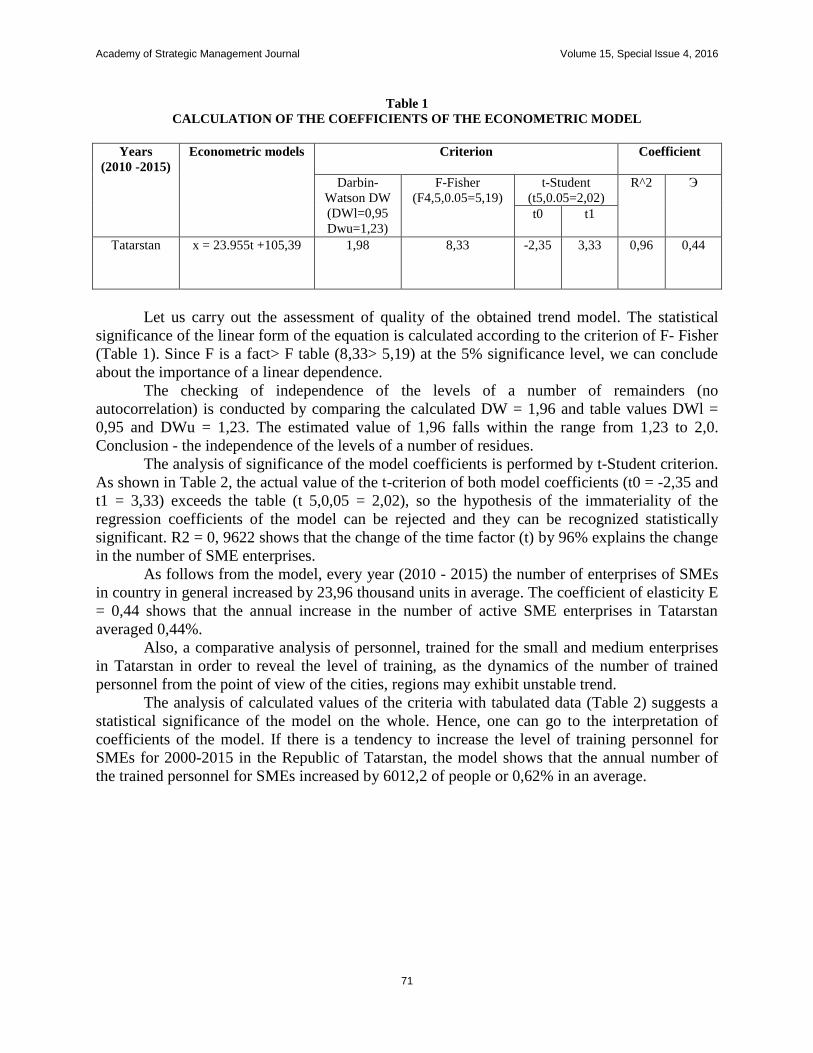
Table 1
THE CORRELATION ANALYSIS OF DEPENDENCE ON THE DECISION-MAKING BY THE
HOUSEHOLD TO BUY THE INNOVATIVE PRODUCT FROM THE CHARACTERISTICS OF
HOUSEHOLD CONSUMER BEHAVIOR
CT SFHI PU RSNM DPIP
Customer type (CT) Pearson correlation 1 ,842** ,895** ,848** -,853**
Val. (2-sided) ,009 ,003 ,008 ,007
N 108 108 108 108 108
Share of free household
income (SFHI)
Pearson correlation ,842** 1 ,716* ,684 ,697
Val. (2-sided) ,009 ,046 ,061 ,055
N 108 108 108 108 108
Product usefulness (PU) Pearson correlation ,895** ,716* 1 ,994** ,984**
Val. (2-sided) ,003 ,046 ,000 ,000
N 108 108 108 108 108
Recommendations of
social network members
(RSNM)
Pearson correlation ,848** ,684 ,994** 1 ,989**
Val. (2-sided) ,008 ,061 ,000 ,000
N 108 108 108 108 108
Decision to purchase an
innovative product
(DPIP)
Pearson correlation -,853** ,697 ,984** ,989** 1
Val. (2-sided) ,007 ,055 ,000 ,000
N 108 108 108 108 108
Selection of the Pearson correlation is due to the normal distribution of the responses in
the frameworks of the sample provided. As it follows from the above data, the least significant
factor is the share of household income, remaining available after payment of essential goods
and services. This indicator of household behavior largely determines the customer type and its
subjective assessment of the product usefulness, but the decision to purchase or not to purchase
an innovative product does not depend on this factor. This result is explained, on the one hand,
by the irrational behavior of the low-income consumers, and, on the other hand, by more rational
behavior of high-income consumers, which make a purchase decision based on the usefulness of
an innovative product and the presence of recommendations of the key members of the social
buyer network - the household representative. Other factors that determine the consumer
behavior of households in the market of innovative products have the expected impact on the
purchase decision. (Kotler, 2001)
Thus, the household decision to purchase an innovative product is influenced by the
customer type (the buyers-innovators are more prone to such purchases), the level of product
usefulness from the household point of view, as well as by the presence of recommendations
relevant for the social network members, which make decisions, while the household cost
structure is an insignificant factor, primarily, with the conspicuous consumption. In addition,
based on the decomposition of the respondents' answers on the costs structure, it has been
determined that the households, which possess of a large share of funds after payment of
essential goods and services, are more prone to make rational decisions about the purchase of
innovative products.
The features of the market of innovative products and the specificity of its functioning in
the conditions of development and implementation of the neoindustrialization strategy of the
Page 11
Academy of Strategic Management Journal Volume 15, Special Issue 4, 2016
6
Russian economy determine the need to clarify the composition of its regulation methods by the
state (Shmitleyn, 2000). Along with the traditional tools used by the state to fulfill its functions
in accordance with the provisions of social welfare theory, the revealed features of this market
segment necessitate the use of additional corrective actions. The content of the latter is
determined by many factors, among which the dominant type of the innovation cycle and the
subjective part of market agents are of particular importance.
If the innovative products act as a result of implementation of the interactive model of
innovation cycle and are initiated equally by consumers or research organizations (units as part
of business organizations), then the government should use the measures aimed at stimulating the
consumer expenses (for example, on the environmentally friendly products produced as part of
the implementation of import substitution strategy). In turn, they include the distinguished
measures oriented to the implantation of the representations, corresponding to the
neoindustrialization strategies of the Russian economy, which implies the need to use the
capacity of education and self-learning organizations, in the consumer normative values
("innovators" and "development pioneers"). With respect to “early majority", "late majority" and
"sluggish" individual consumers, it is appropriate to apply measures aimed at increasing the
demand with the use of income effect and substitution effect (social tax deductions, state
regulation of prices for the innovative products and substitute products, compensations on the
vehicle recycling program, etc.). (Statt, 2003)
If the innovative products are the result of implementation of innovation cycle network
model using the consumer-oriented strategy, the government should use the institutional design
tools aimed at overcoming the institutional traps. This, in turn, involves the development of
normative legal acts determining the criteria for assigning the products to a number of innovative
products; the measures aimed at networking the economic space and activating of cooperation of
entrepreneurship subjects within the integrated structures (clusters, etc.) and at the level of
national economy as a whole; reduction of transaction costs for the intellectual property
protection and monitoring the results of innovative projects, etc. (for example, labeling of
nanoproducts in order to improve the quality of consumer informing, development of science
cities, innovation centers, technology parks, etc.). (Felser, 2009)
If the innovative products act as a result of the implementation of the innovation cycle
information model, aimed at gathering and transfer of explicit (codified) knowledge, then the
government should use the tools aimed at accumulation and effective implementation of human
capital, as well as reduction of information asymmetries (for example, e-government services,
etc.).
SUMMARY
The implementation of approach offered to the content of the methods of state regulation
of innovative products ensures the implementation of systemic reforms aimed at creating the
value chains, increasing the profitability of domestic production, reducing the costs, optimizing
and diversifying the national economy structure within the neoindustrialization strategy.
ACKNOWLEDGEMENTS
The work is performed according to the Russian Government Program of Competitive
Growth of Kazan Federal University.
Page 12
Academy of Strategic Management Journal Volume 15, Special Issue 4, 2016
7
REFERENCES
Aleshyna I.V. Consumer Behavior. I.V. Aleshyna. М: Economist, 2006.
BadrtdinovN.N. Development of the Market of Innovative Products in Terms of Implementation of the
Neoindustrialization Strategy of Russian Economy: Abstract of a Thesis of the Ph.D. in Economics:
08.00.01 / N.N. Badrtdinov; the Department of Economic Theory of the Kazan (Volga) Federal University;
Scientific Supervisor R.M. Kundakchyan. — Kazan, 2015— 25 p.
Blackwell D.U., J.F. Miniard, Angel P.U. (2007). Consumer Behavior – SPb.:Piter.
Dorogina, M. N. (2016). Problems of the Human Capital Management in Current Economic Conditions. M. N.
Dorogina. Relevant Problems of Modern Science, (4), 30-33.
Felser G. (2009). Consumer Psychology and Advertising – M.: Humanitarian Centerб.
Kotler, F. (2000). Marketing Foundations. 2nd European Edition. F. Kotler, G. Armstrong, J. Sonders, V. Wong:
translation from English language. M.; SPb.; K.: Publishing House "Williams", 2001.
Shmitleyn D. Consumers as a Strategic Asset. Marketing, (1).
Solomon M.R. (2003). Consumer Behavior. Art and Science to Win in the Market. M.R. Solomon: translation from
English language. SPb.: LLC "DiaSoftYuP".
Statt D. Consumer Psychology – SPb.:Piter, 2003.
Page 13
Academy of Strategic Management Journal Volume 15, Special Issue 4, 2016
8
USING ABC TO ENHANCE THROUGHPUT
ACCOUNTING: AN INTEGRATED MANAGEMENT
APPROACH
Andrei Yu. Sokolov, Kazan Federal University
Tatyana V. Elsukova, Kazan Federal University
ABSTRACT
The relevance of the article is in studying the problems of the use of modern methods in
the enterprise management accounting under TA method (Throughput accounting) and ABC
method (activity based costing). The authors carried out a comparative analysis of these
methods, considered possible options for their integration and interaction for effective decision
making by managers.
Reports on the financial results with a breakdown to products using TA method can be
drawn up weekly, monthly, quarterly, etc. For the purposes of determining the profitability of
each product, improvement of the control function, TA method can be supplemented by the
elements of ABC method. In this case, the operating costs are accumulated by the activities of the
enterprise, so that the process of costing and cost control becomes more transparent. It is
recommended not to increase the work labor input, and to accumulate costs by type of activity of
the enterprise, as appropriate: at predetermined stages and phases of the product life cycle, to
calculate the price of the product, by changing the company's strategy or annually, to control the
costs and benefits in the future by comparison with the planned figures, and historical data.
It is expedient to draw up a Profit and Loss Statement according to TA method with АВС
elements with a breakdown to customer once a year. During a year, it will be gathered all the
information about incomes and costs for each customer that usually cannot be obtained quickly
due to the chosen pricing policy and complicated discount policy.
Key Words: Throughput Accounting, Activity-Based Costing, Management, Costs, Enterprises,
Enterprise.
INTRODUCTION
Given the instability in world markets, and rapidly changing external environment,
management of manufacturing companies is in need of high-quality and targeted information to
make operational and strategic decisions. Supplier of such information is a management
accounting. The researchers suggest that currently the most common are the traditional methods
of cost and benefits accounting such as standard costing, absorption costing, and direct costing.
However, the traditional methods are now changed by more modern ones. Thus, an alternative to
traditional approaches to the calculation of costs and benefits is TA method (throughput
accounting). Its main objective is the increase of throughput by eliminating the constraints that
hinder the growth of production and sales, cash inflow of a company, obtaining greater profit
margins. In many of the studies devoted to this method it is proved inexpedient to generate
information about the full cost of production for management decision-making purposes
(Hilmola, 2016).
Page 14
Academy of Strategic Management Journal Volume 15, Special Issue 4, 2016
9
The emergence of this trend in management accounting is directly connected with the
study and development of the theory of constraints, which was widespread throughout the world
since the end of the XX century and has proven to be effective in the management of companies
in various industries (Goldratt, 1992). In our previous works this methodology was examined in
retrospect, as well as the problem of the joint use of TA (Throughput accounting) and VSC
(Value Stream Costing) methods was investigated (Elsukova, 2015, Sokolov, 2007).
Through TA method, contribution of each product (works, services) in generation of the
total throughput value for the entire company is estimated. However, TA method is constantly
evolving. Its basic principles, functions and tasks require understanding. For example, the
composition of TVC (total variable costs), the classification of OE (operational costs), the timing
of definition of the actual indicator T (throughput) (on the one hand, it can be the date of
shipment to the buyer i.e. the transfer of risk to the goods, or on the other hand, the date of
receipt of funds from the buyer). It is also of interest the indicator "cost per factory hour" in the
denominator of TPAR (Throughput Accounting Ratio) formula. It is known that the priority
should be given to the products generating the best TPAR. As a rule, the rate of "cost per factory
hour" is calculated by dividing the fixed production costs (the sum of labor costs and production
overheads) to a total bottleneck resource time available. The question arises, whether it is
possible to include a part of the administrative costs in the cost per factory hour if the
relationship of these costs with the production will be proved, for example, by using the ABC
(activity-based costing) method tools? Deadlines for submission of internal reports under TA
method are important. In particular, prof. S. Jackman (Jackman, 2008) and E. Noreen (Noreen,
1995), in their research of firms which have put into practice the theory of constraints, noted the
need for daily planning and calculation of throughput indicator. Transfer to a weekly or even a
daily compilation of statements is one of the reasons why the TA method is often referred to as
instrument of operational management. However, the actual problem is the use of the TA method
for strategic decision-making, too.
Another problem is the nature of operating costs. It is assumed that they are constant, i.e.
do not depend on the volume of core activities. Fluctuations of overhead costs are not so visible
in companies with constant maximum capacity utilization. However, in conditions of abrupt
changes in capacity utilization, there are often observed significant changes in the value of
transaction costs (with regard to production overhead costs) incurred by a company for the
transformation of raw materials purchased in the inflow of money from products sold (Kulikova,
2015).
Currently, there is a shift of interest to the joint use of several methods for company
management purposes. The use of several methods at the same time also allows you to achieve
both operational and strategic objectives. In particular, there is a discussion about the question of
the joint use of TA and ABC. The basic principles of the ABC method were systematically
formulated in the 1980s in the US by R.S. Kaplan and R. Cooper (Kaplan, 1997). The objectives
of implementation of the method were: cost optimization, pricing, effective budgeting, more
accurate calculation of the profitability of products, calculation of incomes and costs with a
breakdown to buyers. Application of the ABC method is suitable for companies which have
significant overhead. It is believed that this method allows for obtaining reliable long-term
performance indicators.
We can make the assumption that the interest in joint use of the cost and benefits
management methods will continue to grow. It is necessary to find the most effective
Page 15
Academy of Strategic Management Journal Volume 15, Special Issue 4, 2016
10
combination of management methods for a particular company depending on market, industry,
enterprise, and its life cycle.
METHODS
The results of the analysis of the most used approaches in management accounting that
has been conducted by CIMA (Chartered Institute of Management Accountants) in 2010
(Jackman, 2008) show that TA method is used by 5% of the companies surveyed. However,
depending on the scale of business, it is mostly used by large companies. However, the ABC
method is applied more widely. UK scientists have conducted researches (Innes, 2000) among
352 largest companies. Results of the first survey showed that 21% of respondent companies use
the ABC system, 29.6% considered the feasibility of its implementation, 13.3% refused from its
application, and 31.6% did not consider the feasibility of its implementation. Five years later,
they found the following results: 17.5% of companies use the ABC system, 20.3% - consider the
feasibility of its implementation, 15.3% has refused from it after its application, 46.96% of
companies did not consider its use in general. Professors summed up the research results which
show a sequential decrease of interest in the cost accounting method.
Today, the issues of the ABC and the TA joint use are relevant as ever. Some scientists
oppose the ABC method to the TA method highlighting in the system of management accounting
the approaches focused on distribution of costs, and the approaches which exclude wide use of
cost allocation methods (Hutalung, 2003). Other experts having explored options for integration
of the two methods believe that the ABC method can create an "inertia" of the system
development (Sungatullina, 2015). If the TA method focuses on the results of the company
(indicator "throughput"), the ABC method pays more attention to overhead costs. The ABC
method involves determining the effectiveness of certain types of activities, the TA method
reorienting managers to identify the factors which hinder the process of raw material transfer into
money from buyers.
Thus, there are two ways:
1. The use of the TA method instead of the ABC;
2. Joint use of the ABC and the TA methods.
Proponents of the first approach deny the joint use of classical methods of management
accounting and ABC. These include: N. Hutalung (Hutalung, 2003), T. Corbett (Corbett, 1998).
Critics N. Gary and B. Ronen (Geri, 2005) argue about ABC obsolescence, about complexity of
the system that hinders prediction of profit and therefore, little suitability for making
management decisions.
Supporters of the second approach believe that achieving optimal efficiency by units is
the primary managerial task. Lack of analysis of constraints, as well as coordination of company
target with objectives of its subsidiaries lead to errors in the planning and utilization of
production capacities as well as making decisions on production.
The views of experts in management accounting to the problem of the relationship of TA
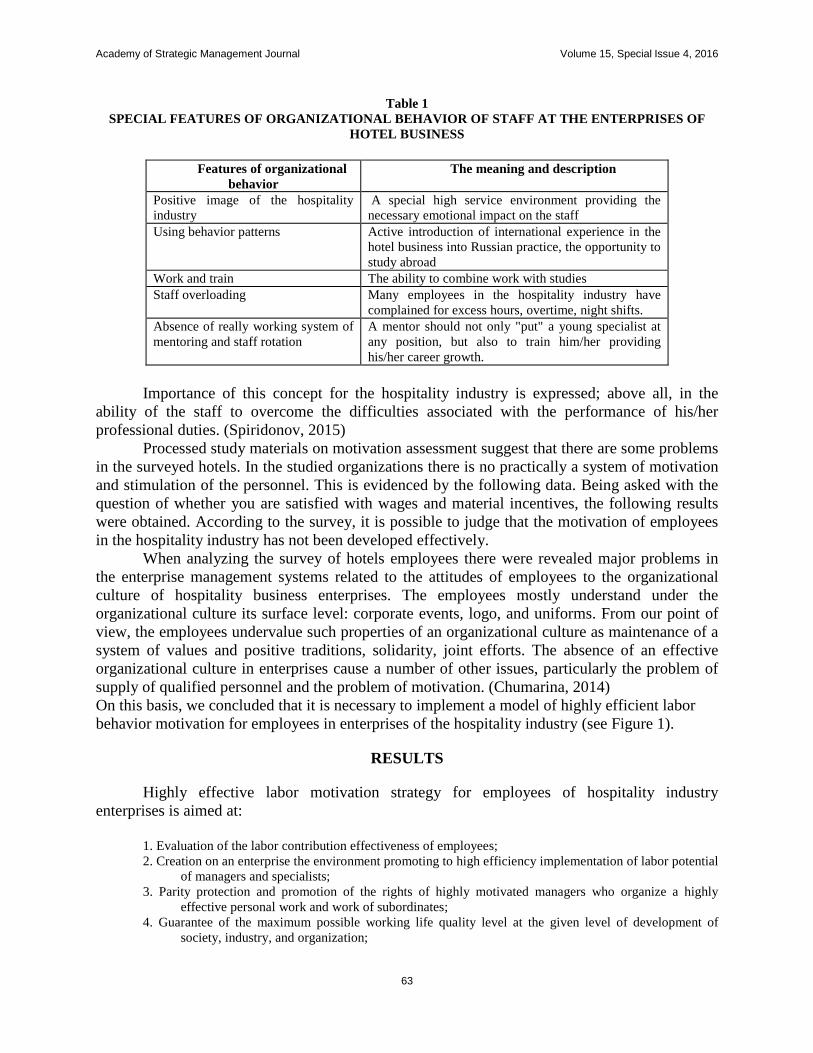
and ABC are presented in Table 1.
Page 16
Academy of Strategic Management Journal Volume 15, Special Issue 4, 2016
11
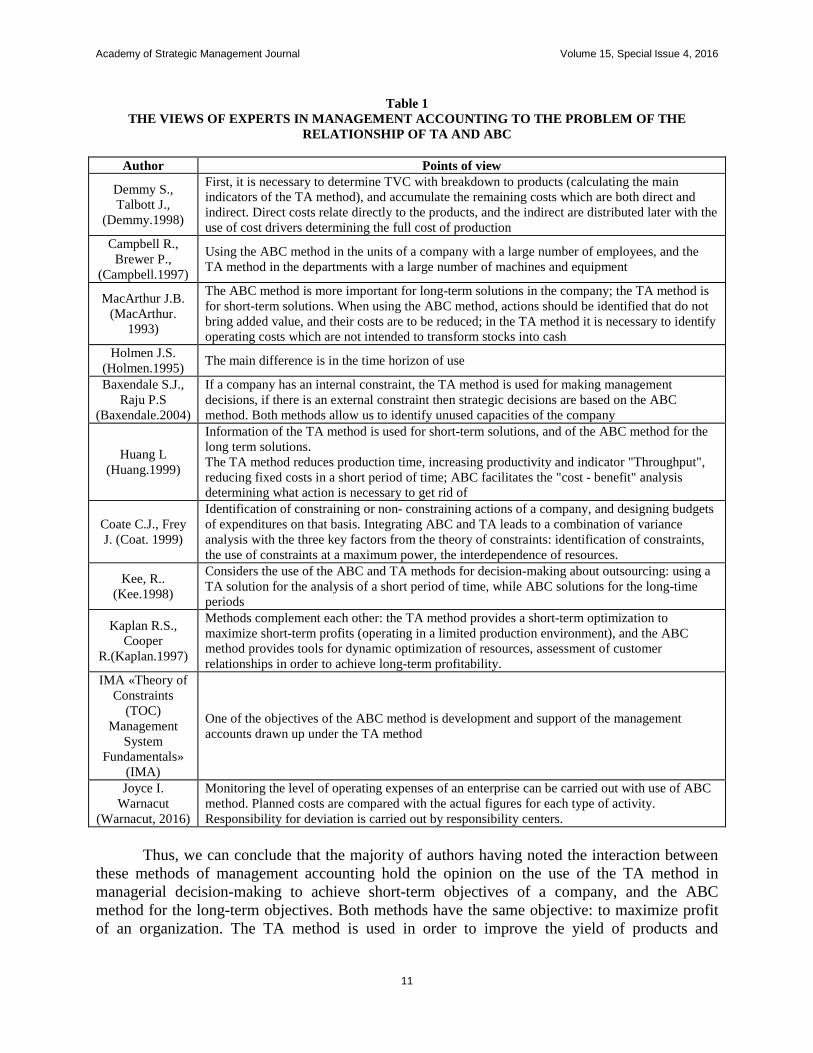
Table 1
THE VIEWS OF EXPERTS IN MANAGEMENT ACCOUNTING TO THE PROBLEM OF THE
RELATIONSHIP OF TA AND ABC
Author Points of view
Demmy S.,
Talbott J.,
(Demmy.1998)
First, it is necessary to determine TVC with breakdown to products (calculating the main
indicators of the TA method), and accumulate the remaining costs which are both direct and
indirect. Direct costs relate directly to the products, and the indirect are distributed later with the
use of cost drivers determining the full cost of production
Campbell R.,
Brewer P.,
(Campbell.1997)
Using the ABC method in the units of a company with a large number of employees, and the
TA method in the departments with a large number of machines and equipment
MacArthur J.B.
(MacArthur.
1993)
The ABC method is more important for long-term solutions in the company; the TA method is
for short-term solutions. When using the ABC method, actions should be identified that do not
bring added value, and their costs are to be reduced; in the TA method it is necessary to identify
operating costs which are not intended to transform stocks into cash
Holmen J.S.
(Holmen.1995) The main difference is in the time horizon of use
Baxendale S.J.,
Raju P.S
(Baxendale.2004)
If a company has an internal constraint, the TA method is used for making management
decisions, if there is an external constraint then strategic decisions are based on the ABC
method. Both methods allow us to identify unused capacities of the company
Huang L
(Huang.1999)
Information of the TA method is used for short-term solutions, and of the ABC method for the
long term solutions.
The TA method reduces production time, increasing productivity and indicator "Throughput",
reducing fixed costs in a short period of time; ABC facilitates the "cost - benefit" analysis
determining what action is necessary to get rid of
Coate C.J., Frey
J. (Coat. 1999)
Identification of constraining or non- constraining actions of a company, and designing budgets
of expenditures on that basis. Integrating ABC and TA leads to a combination of variance
analysis with the three key factors from the theory of constraints: identification of constraints,
the use of constraints at a maximum power, the interdependence of resources.
Kee, R..
(Kee.1998)
Considers the use of the ABC and TA methods for decision-making about outsourcing: using a
TA solution for the analysis of a short period of time, while ABC solutions for the long-time
periods
Kaplan R.S.,
Cooper
R.(Kaplan.1997)
Methods complement each other: the TA method provides a short-term optimization to
maximize short-term profits (operating in a limited production environment), and the ABC
method provides tools for dynamic optimization of resources, assessment of customer
relationships in order to achieve long-term profitability.
IMA «Theory of
Constraints
(TOC)
Management
System
Fundamentals»
(IMA)
One of the objectives of the ABC method is development and support of the management
accounts drawn up under the TA method
Joyce I.
Warnacut
(Warnacut, 2016)
Monitoring the level of operating expenses of an enterprise can be carried out with use of ABC
method. Planned costs are compared with the actual figures for each type of activity.
Responsibility for deviation is carried out by responsibility centers.
Thus, we can conclude that the majority of authors having noted the interaction between
these methods of management accounting hold the opinion on the use of the TA method in
managerial decision-making to achieve short-term objectives of a company, and the ABC
method for the long-term objectives. Both methods have the same objective: to maximize profit
of an organization. The TA method is used in order to improve the yield of products and
Page 17
Academy of Strategic Management Journal Volume 15, Special Issue 4, 2016
12
customers within existing resources and constraints. The ABC method helps to optimize costs,
and gives signals to managers which products and customers generate profit.
RESULTS
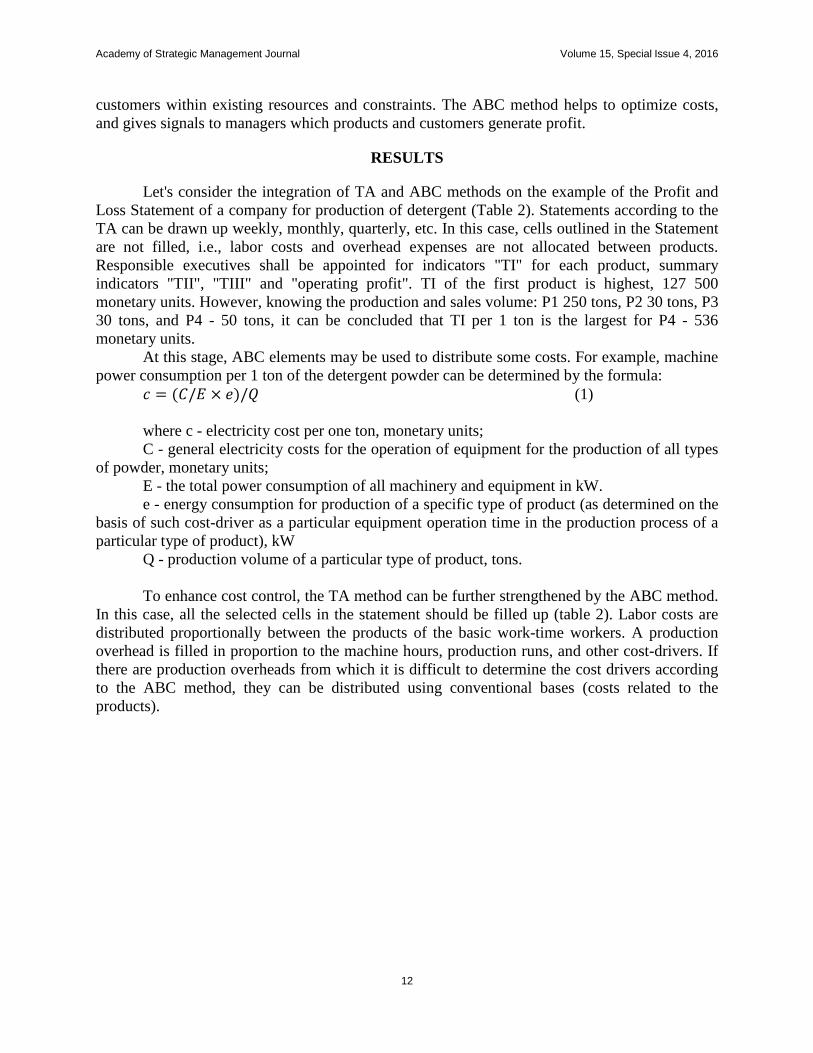
Let's consider the integration of TA and ABC methods on the example of the Profit and
Loss Statement of a company for production of detergent (Table 2). Statements according to the
TA can be drawn up weekly, monthly, quarterly, etc. In this case, cells outlined in the Statement
are not filled, i.e., labor costs and overhead expenses are not allocated between products.
Responsible executives shall be appointed for indicators "TI" for each product, summary
indicators "TII", "TIII" and "operating profit". TI of the first product is highest, 127 500
monetary units. However, knowing the production and sales volume: P1 250 tons, P2 30 tons, P3
30 tons, and P4 - 50 tons, it can be concluded that TI per 1 ton is the largest for P4 - 536
monetary units.
At this stage, ABC elements may be used to distribute some costs. For example, machine
power consumption per 1 ton of the detergent powder can be determined by the formula:
(1)
where c - electricity cost per one ton, monetary units;
C - general electricity costs for the operation of equipment for the production of all types
of powder, monetary units;
E - the total power consumption of all machinery and equipment in kW.
e - energy consumption for production of a specific type of product (as determined on the
basis of such cost-driver as a particular equipment operation time in the production process of a
particular type of product), kW
Q - production volume of a particular type of product, tons.
To enhance cost control, the TA method can be further strengthened by the ABC method.
In this case, all the selected cells in the statement should be filled up (table 2). Labor costs are
distributed proportionally between the products of the basic work-time workers. A production
overhead is filled in proportion to the machine hours, production runs, and other cost-drivers. If
there are production overheads from which it is difficult to determine the cost drivers according
to the ABC method, they can be distributed using conventional bases (costs related to the
products).
Page 18
Academy of Strategic Management Journal Volume 15, Special Issue 4, 2016
13
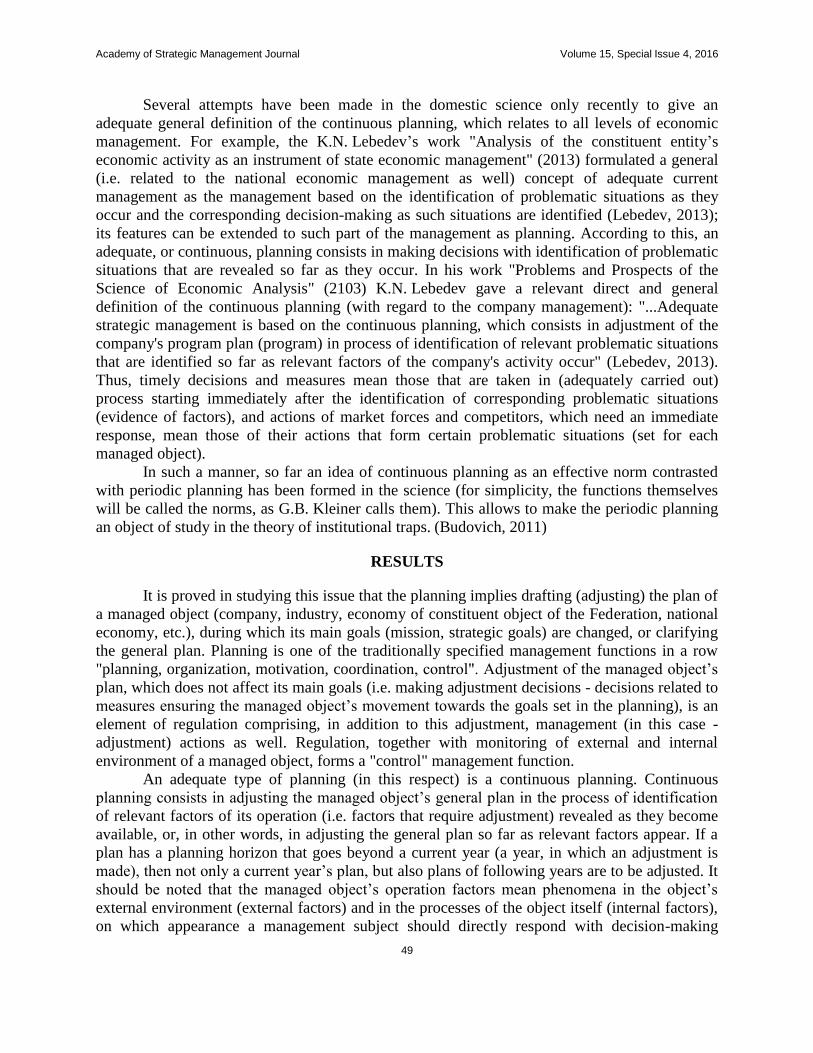
Table 2
AN INTERNAL REPORT FORM (TA AND ABC METHODS), MONETARY UNITS
Indicators
Washing powders
P1 P2 P3 P4 Total
Revenue (R) 275 000 37 500 36 000 55 000 403 500
Total Variable Costs (TVC):
- Raw Material costs 100 000 17 400 14 100 18 500 150 000
- Energy costs (electricity,
water, steam) 20 000 2 550 2 700 4 200 29 450
- Subcontractcosts 27 500 3 600 3 900 5 500 40 500
Throughput I (TI) 127 500 13 950 15 300 26 800 183 550
Throughput I/Revenue 0.46 0.37 0.43 0.49 0.45
Labor costs 33 791 5 069 6 082 6 758 51 700
Throughput II (TII) 93 709 8 881 9 218 20 042 131 850
Throughput II/Revenue 0.34 0.24 0.26 0.36 0.33
Production overheads (method ABC) 30 611 2 550 10 097 8 609 51 867
Production overheads (traditional
cost accounting) 9 655 1 420 1 680 1 985 14 740
Throughput III (TIII) 53 443 4 911 (2 559) 9 448 65 243
Throughput III/Revenue 0.19 0.13 (0.07) 0.17 0.16
Administrative and selling expenses
(method ABC) 2 272 1 363 909 1 136 5 680
Administrative and selling expenses
(traditional cost accounting or TI) 17 338 1 897 2 081 3 644 24 960
Operating profit 33 833 1 651 (5 549) 4 668 34 603
Operating profit / Revenue 0.12 0.04 -0.15 0.08 0.09
Administrative expenses, for which it is difficult to find a cost-driver according to the
ABC method, are better distributed in proportion to the indicator "TI". This distribution base is
the most equitable, as it is very difficult to associate administrative expenses with industries and
business processes. Indicators "TI / Revenue", "TII / Revenue", "TIII / Revenue", Operating
profit / Revenue become a roadmap of a company. They provide an opportunity to see how a
financial result could be gradually formed. According to the statement, P3 is unprofitable (5549
monetary units). It is necessary to optimize cost-drivers of production overheads or revise the
pricing policy.
Therefore, the purpose of the TA is to increase the throughput, the purpose of the ABC is
to control operating costs. This form of the statement can be used at certain stages of the product
life cycle, in order to optimize costs as a response to changes in the external market environment,
and for pricing purposes, for example once a year, etc. It is also important to compare the
activities of the reporting and previous periods.
CONCLUSION
It can be concluded that the majority of authors noting relations between TA and ABC
hold the opinion on the use of the TA method in managerial decision-making in the short-term
objectives of the company, and the ABC method in the long-term objectives. Both methods have
the same objective: to maximize profit of an organization. The TA method is used in order to
Page 19
Academy of Strategic Management Journal Volume 15, Special Issue 4, 2016
14
improve profitability within existing resources and constraints, and existing products and
customer relationships. The ABC method helps to reduce operating costs, giving signals to
managers which products and customers generate revenues in excess of the resource
consumption, and what products and customers require resources greater than the revenues
generated from the current use of resources. Reports under TA can be drawn up on an
operational basis. In the cases where the information about the operating profit for each product
is required, the reports under TA should be supplemented by ABC information. Reports under
the TA-ABC with breakdown to customers are encouraged to draw up once a year.
The joint use of the TA and ABC methods lead to a more structured information in an
enterprise on the constrained factors (resources), as well as actions that use those resources
(constraining and non-constraining the achievement of maximum financial results by the
company). This method will allow a company to make management decisions for a longer time
period for the production of new products, as well as to reduce costs.
ACKNOWLEDGEMENTS
The work is performed according to the Russian Government Program of Competitive
Growth of Kazan Federal University.
REFERENCES
Baxendale S.J., Raju P.S. (2004). Using ABC to enhance throughput accounting: A strategic perspective. Cost
Management (January/February), 31-38.
Campbell R., Brewer P., Mills T. (1997). Designing an Information System Using Activity-Based costing and the
theory of Constraints. Journal of Cost management (January/February), 16-25.
Coate C.J., Frey J. (1999). Integrating ABC, TOC and financial reporting. Journal of Cost Management
(July/August), - P. 22-27.
Corbett T., (1998). Throughput accounting. North river press 1998.-174 p.
Demmy S., Talbott J., (1998). Improve internal reporting with ABC and TOC. Management Accounting
(November), 18-20
Elsukova T.V. (2015). Lean accounting and throughput accounting: an integrated approach. MJSS, 6(3), 83-87.
Geri N. Ronen B. (2005). Relevance lost: the rise and fall of activity-based costing. Human Systems Management.
24, 133-144.
Goldratt E., Cox J. (1992). The Goal: A Process of Ongoing Improvement, North River Press Inc.1992.
Hilmola OP, Gupta M. (2016). Throughput accounting and performance of a manufacturing company under
stochastic demand and scrap rates. Expert Systems with Applications, 58(1), 221–228.
Holmen J.S. (1995). ABC vs TOC: It’s a matter of time. Management Accounting (January), 37-40.
Huang L. (1999). The integration of Activity-Based costing and the theory of Constraints. Journal of Cost
Management (November/December), 21-27.
Hutalung N. (2003). Throughput accounting End of Traditional Cost Accounting and Activity-Based Management
Approaches? Ingenious,1(1), 40-50.
Innes Jh., Mitcell F., Sinclair D. (2000). Activity-based costing in the U.K. Largest companies: a comparison of
1994 and 1999. Survey Results. Management Accounting Research, 349-362.
Jackman Sue. (2008). Innovations in Management Accounting Research & Practice: Whatever happened to
Throughput Accounting? EIASM 6th Conference on new directions in management accounting, Brussels/.
December. pp.25-30.
Joyce I. Warnacut (2016). The Monetary Value of Time: Why Traditional Accounting Systems Make Customers
Wait. Taylor & Francis Group. 2016.-170 p.
Kaplan R.S., Cooper R. (1997) Cost & Effect: Using Integrated Cost Systems to Drive Profitability and
Performance. Harvard Business School Press, 1997, 128 p.
Kee, R. (1998). Integrating ABC and the theory of constraints to evaluate outsoursing decision. Journal of Cost
Management, (January/February), 24-36.
Page 20
Academy of Strategic Management Journal Volume 15, Special Issue 4, 2016
15
Kulikova, L.I., Garyncev, A. G., Goshunova, A. V. (2015). Doubtful Debts Allowance Develoment: Stages and
Methods of Calculation. Mediterranean Journal of Social Sciences, 6(1), 448–452.
MacArthur J.B. (1993). Theory of Constraints and activity-based costing: Friends or foes? Journal of Cost
Management (Summer), 50-56.
Noreen E., Smith D., Mackey J.T. (1995). The theory of constraints and its implications for management
accounting. The North river press.1995.
Sokolov A.Y. Formation of cost information in the system of management accounting, Moscow: Accounting, 2007.
Sungatullina L. B., Sokolov A.Y. (2015). Applying Game Theory to Optimize Expenses for Employees?
Remuneration. Asian Social Science, 11(11), 2015 (Special Issue), 364-368
Theory of Constraints (TOC). Management System Fundamentals. 1999. Institute of Management Accountants.
Page 21
Academy of Strategic Management Journal Volume 15, Special Issue 4, 2016
16
FINANCIAL STATEMENTS AS AN INFORMATION
BASE FOR THE ANALYSIS AND MANAGEMENT
DECISIONS
F.S. Nugayev, Kazan Federal University
R.Z. Mukhametzyanov, Kazan Federal University
ABSTRACT
The processes and events taking place in an organization, and the results of financial and
economic activity are represented by a variety of information which in turn in the aggregate
forms an information base for analysis. The leading place among the information needed for the
analysis is taken by accounting data and financial reports of the company to which, in turn,
increased requirements are applied at the present stage of improvement accounts and records.
However, the data of financial statements of Russian companies for a number of years, as a rule,
are not comparable due to the frequent changes in accounting policy caused by changes in
legislation, registration forms, as well as failing to take inflation into account. The main reasons
for the low demand for accounting data for managerial purposes are that in most cases they
were incomplete, and also financial statements were low reliable. We have selected two groups
of respondents for their study the first of them consists of the heads of Russian companies
reporting under RAS (Russian Accounting Standards), and the second of CEOs of the companies
that prepare financial statements both under RAS and IFRS. Based on the survey, we found that
the companies preparing the statements both in accordance with RAS and IFRS, have more
accurate figures of financial statements than the companies that use RAS. We have found that
financial statements data are more in demand to external users than the internal ones, and the
reason for this is the lack for external users of other sources of information, while internal users
use all possible sources of additional information about the property and financial condition of
an enterprise.
Key Words: Information Database, RAS, IFRS, Respondents, Financial Statements, Reliability,
Transparency.
INTRODUCTION
With the development of market relations information support for management decisions
becomes increasingly important. Processes and events being under way in organizations, results
of financial and economic activity are disclosed by a variety of information which in turn
collectively forming information base for analysis. The lack of necessary information and the use
of unreliable or irrelevant data are the causes of serious mistakes in management decisions. It is
believed that the main purpose of the use of information, above all, should be to reduce
uncertainty in decision-making. Economic analysis and reliable decision-making is only possible
if there is the most complete information about the economic activity of an economic entity.
Thus, an analysis contains technical, technological, and other information, and is not limited to
economic data. This is due to the fact that in carrying out complex economic research, an
information base of the analysis should be developed with a view to its use within not a single
Page 22
Academy of Strategic Management Journal Volume 15, Special Issue 4, 2016
17
problem, and a complex of analytical problems. This information may be obtained from various
sources the main of which include (Ushakova and Mukhametzyanov, 2015):
1. economic legislation in the country;
2. the charter of the organization that reflects the types of its activities;
3. norms and standards used by the organization;
4. accounting data of the organization;
5. financial and statistical reporting of the organization;
6. control checks and special auditions data;
7. information from data bases of organizations and various non-system information.
Thus, we can say that it is necessary to use all possible sources of information for
economic analysis and management decision-making.
The key place among the information needed for the analysis is taken by accounting data
and financial statements of a company as they contain the most important and reliable
information about the activities of an economic entity. This information is grouped in various
forms of reporting and bookkeeping records on the basis of the information classification
principles (Izmestyeva, 2009).
Company's books provide summary information which summarizes and presents business
results in generalized terms.
In the Russian Federation the order of presentation of financial statements, their volume
and content are regulated by the Federal Law №402 - FZ dated 06.12.2011 "On Accounting" and
the Accounting Regulations 4/99 "Accounting reporting of an organization" (Federal law №402-
FZ "About accounting", 2011).
Accounting and reporting information is used as the basis for monitoring the
implementation of plans and forecasts, as well as the efficient use of material, financial, labor,
and other resources which share accounts for more than 70% of management information.
A special place is also taken by information from managers, and the professionals of an
organization that are directly involved in production and economic activity of the economic
entity.
At the present stage of improving the business management, increased requirements are
presented to the accounting information. It must be of high quality and be effective, it must meet
the requirements of internal and external users of information. In addition, it is desirable that the
financial statements would contain as little as possible indicators, but to satisfy the maximum
number of users at different levels of management. Accounting information must be necessary
and appropriate, and be formed with the least expenditure of labor and time. Obviously, it is
necessary to use different methods for collecting, processing and accounting information to meet
all the above requirements (Kulikova et al., 2014).
METHODS
According to the statistics, the accounting data of the Russian companies for a number of
years, as a rule, are not comparable due to the frequent changes in accounting policy caused by
the changes in legislation, in registration forms, as well as the inability to take inflation into
account. Reporting of these companies, in many cases, remains non-transparent, does not allow
one to interpret results obtained on the basis of its analysis. Currently, in Russia collection of
public financial statements is difficult due to the lack of real progress, common misstatements in
Page 23
Academy of Strategic Management Journal Volume 15, Special Issue 4, 2016
18
reporting and fear of their detection upon its analysis, lack of interest of companies to provide
information in connection with the lack of need (Aletkin, 2014).
The majority of respondents indicated incompleteness and low reliability of financial
statements in the capacity of the main reason for low demand in accounting figures for the
purpose of management. Most often this component is demonstrated in the financial statements
of companies prepared in accordance with the Russian Accounting Rules. There is such a feature
when companies that report in accordance with Russian regulations often do not fully reflect the
accounting information in its reporting, trying to achieve certain goals. An example of this can
be an artificial lowering of company's profits in order to avoid high taxes. As for the companies
which prepare the reporting both according to Russian, and to international financial reporting
standards (IFRS), the situation is reversed. On the contrary, companies' chief executives are
interested in an artificial increase in the rates of profit, thereby pursuing the goal of improving
the well-being of their owner by increasing the value of shares which in turn increases based on
improvement of efficiency of their activity for the reporting period or pursuing the goal on
attracting new investors (Kulikova and Gafieva, 2014).
Carrying out a survey of top managers of Russian companies on two above-stated
categories, we have come to certain results. Anonymous replies to the questionnaire made it
possible to find out what financial statements are in question. Under the terms of the survey,
when answering the question "In your opinion, how well companies reflect the following
indicators in their financial statements? - It was necessary to assess on a 4-point scale the degree
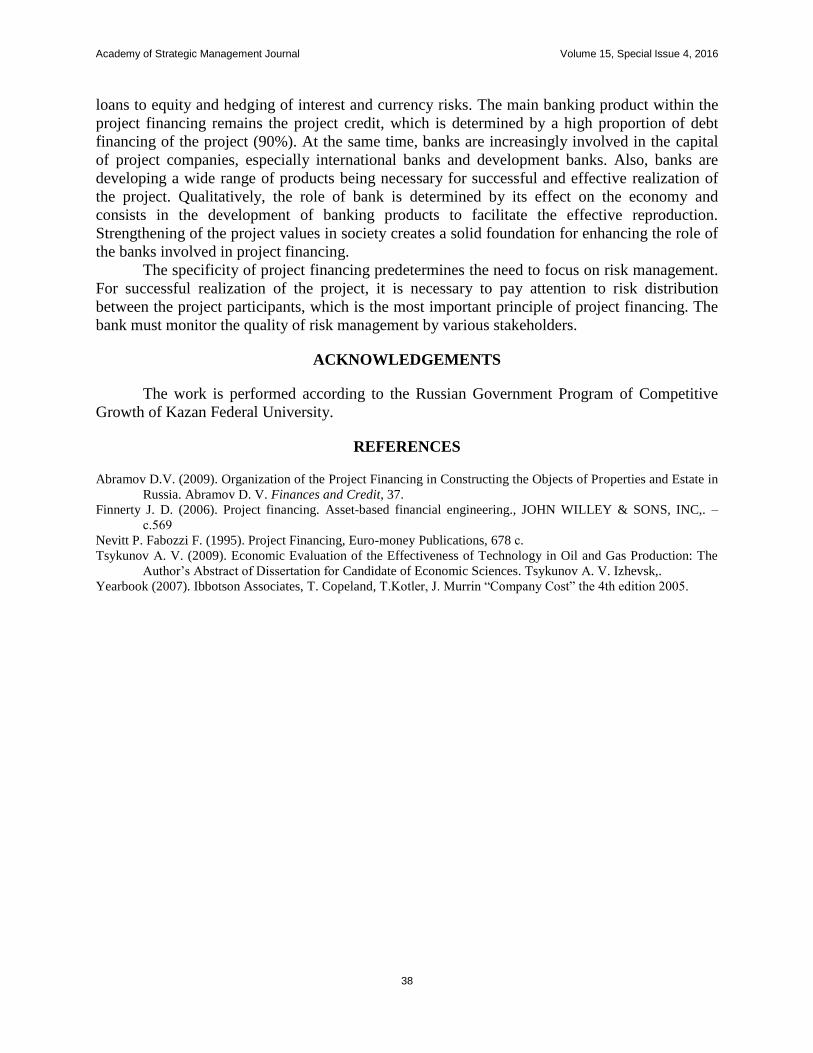
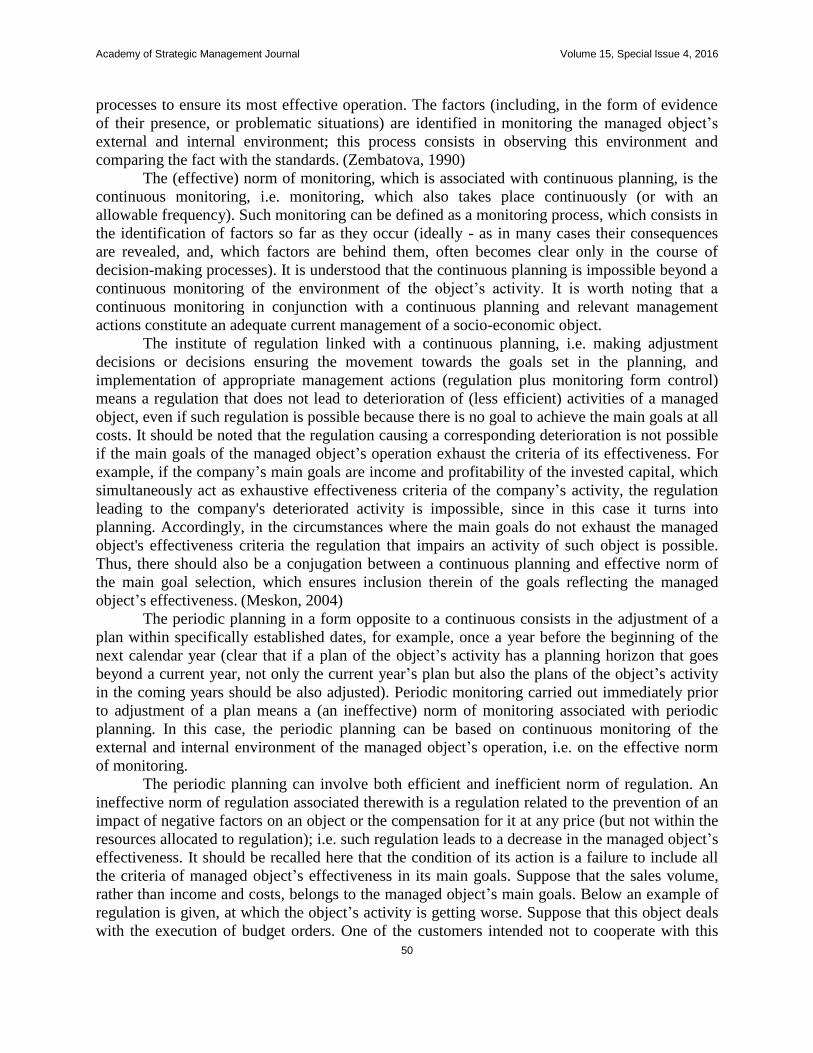
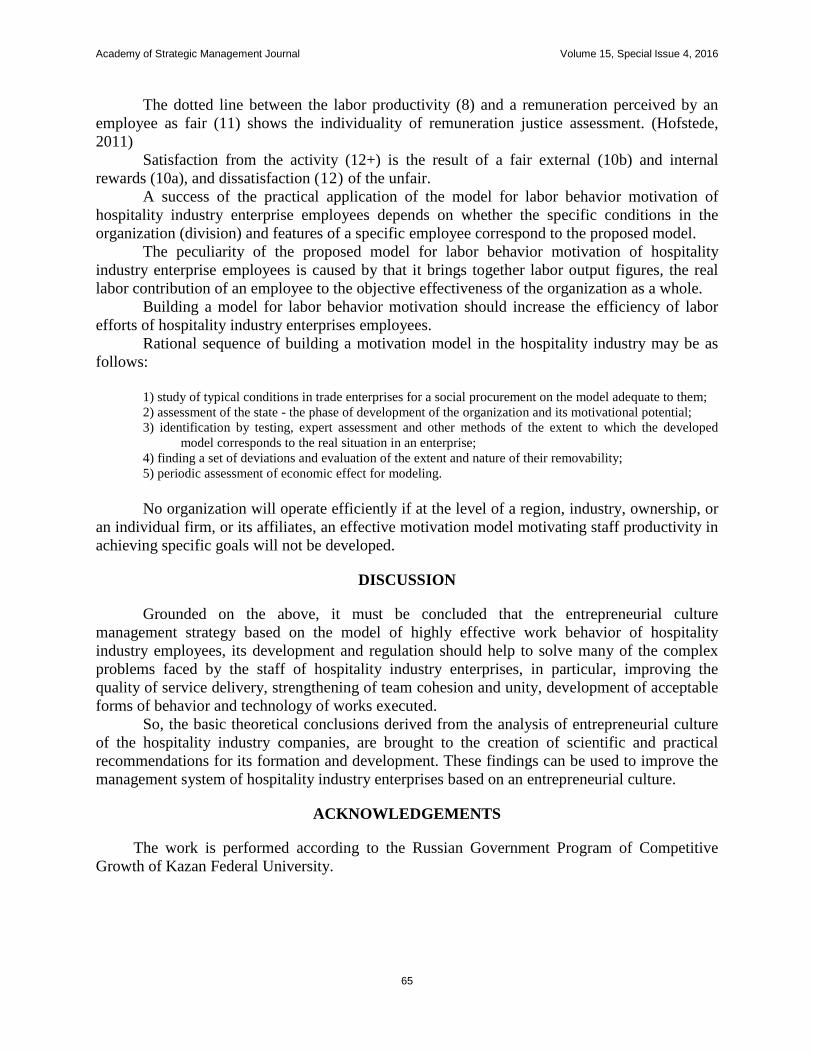
of reliability of the individual indicators from the financial statements. (Antonov, 2007)
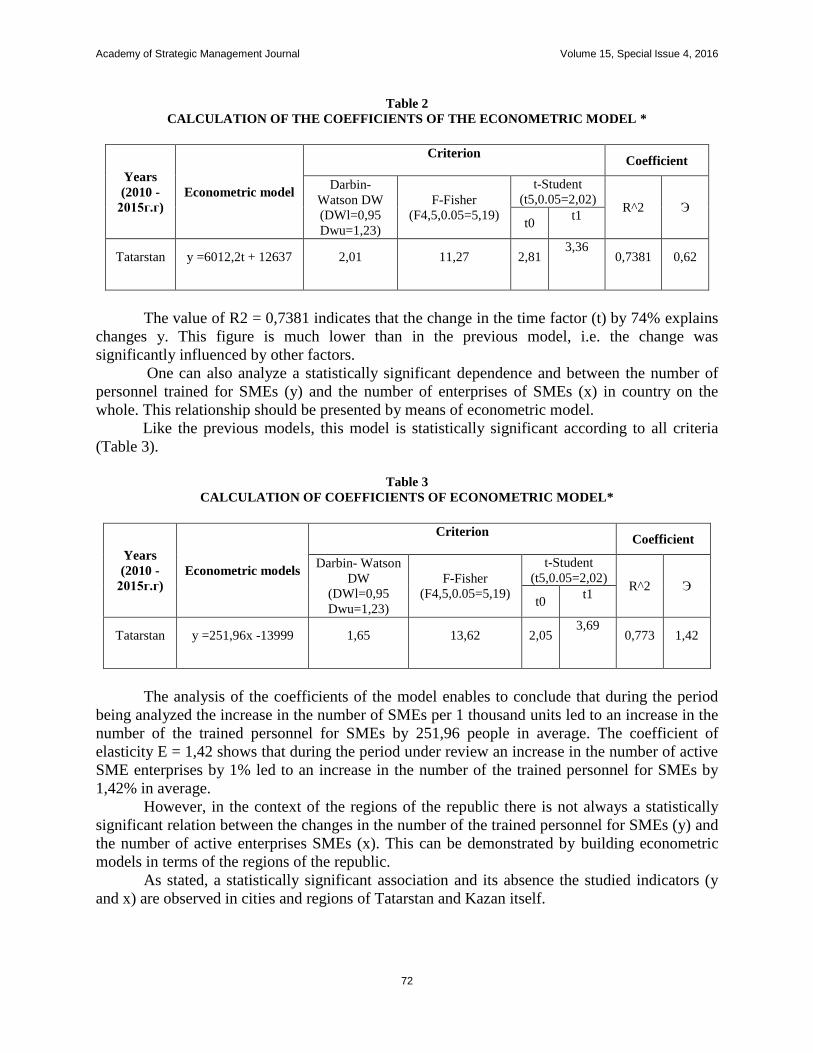
Figure 1
THE RESULTS OF THE RESPONSES OF COMMERCIAL ORGANIZATIONS HEADS FROM THE
GROUP №1 ON THE SURVEY QUESTIONS, % OF RESPONDENTS
About 25% of surveyed chief executives of the companies reporting under the Russian
Accounting Standards (Group №1) have considered the line "Revenue" in reporting as reliable in
most cases. The argument they replied was that the entire revenue goes through the account or
cash. About 20% of respondents said that the figure, as a rule, is reliable, whence about 45%
considered it valid only in individual cases. The indicated reason for unreliability was that
organizations apply the principle of splitting revenues to several related companies in order to
0.00%
10.00%
20.00%
30.00%
40.00%
50.00%
60.00%
Salesrevenue
Profit Marketvalue of
fixedassets
Ownedcapital
Accountspayable
Accountsreceivable
Almost always unreliable
Reliable in some cases
Reliable in most cases
Usually reliable
Page 24
Academy of Strategic Management Journal Volume 15, Special Issue 4, 2016
19
optimize taxation. And only about 10% of the respondents felt that in most cases the indicator
"revenue" recorded in the financial statements, is misleading.
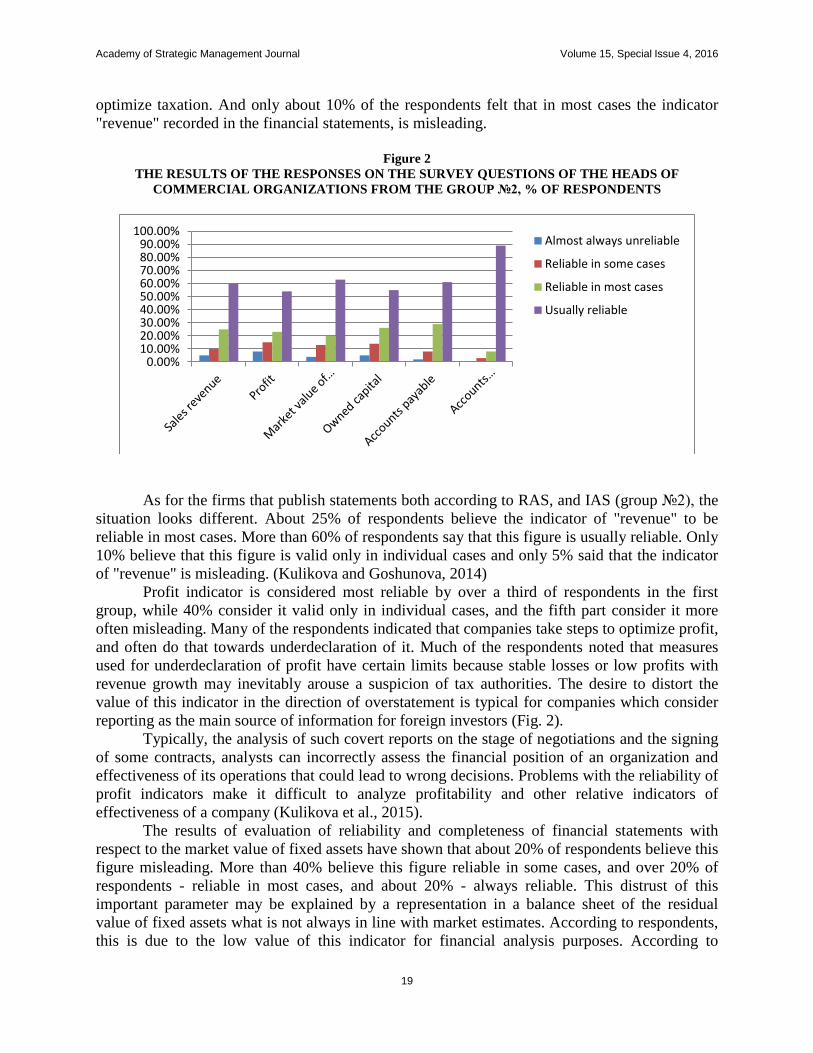
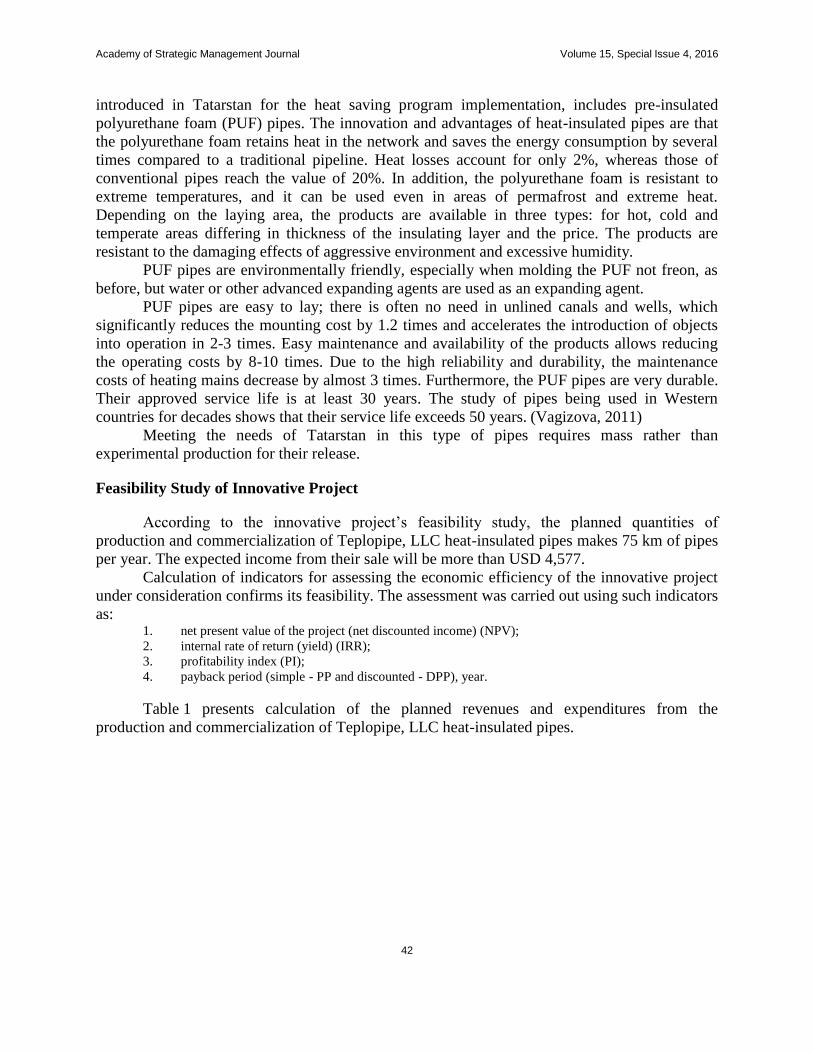
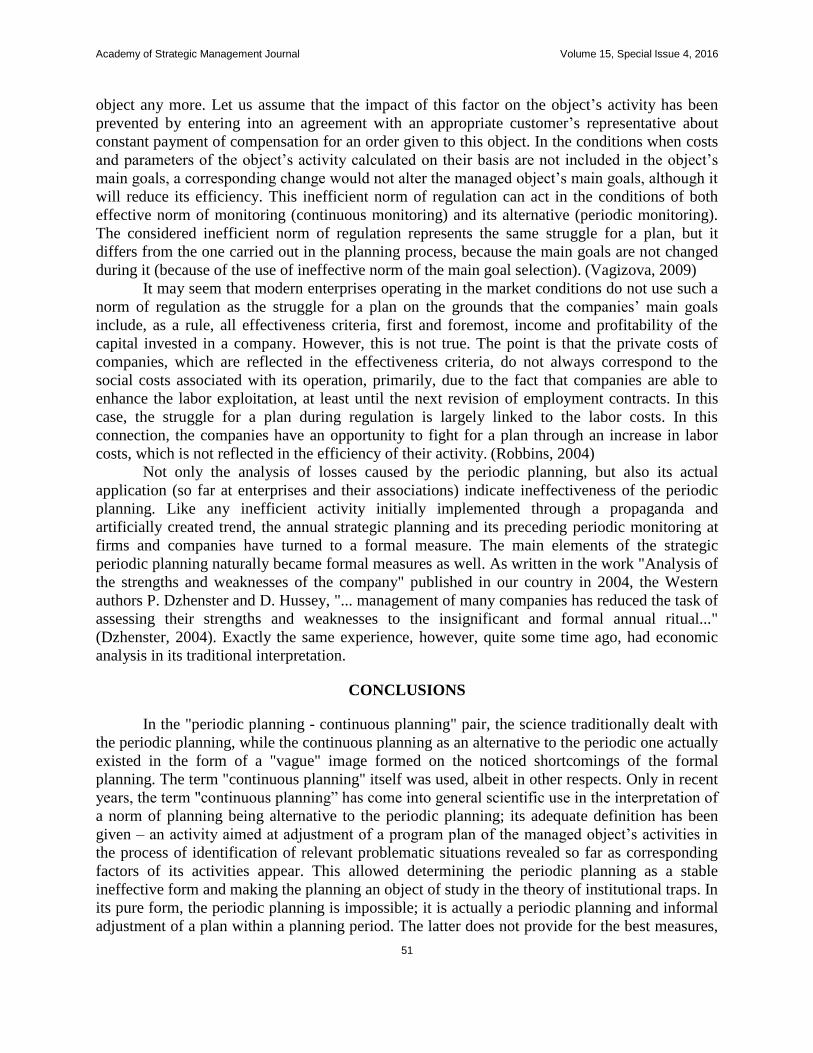
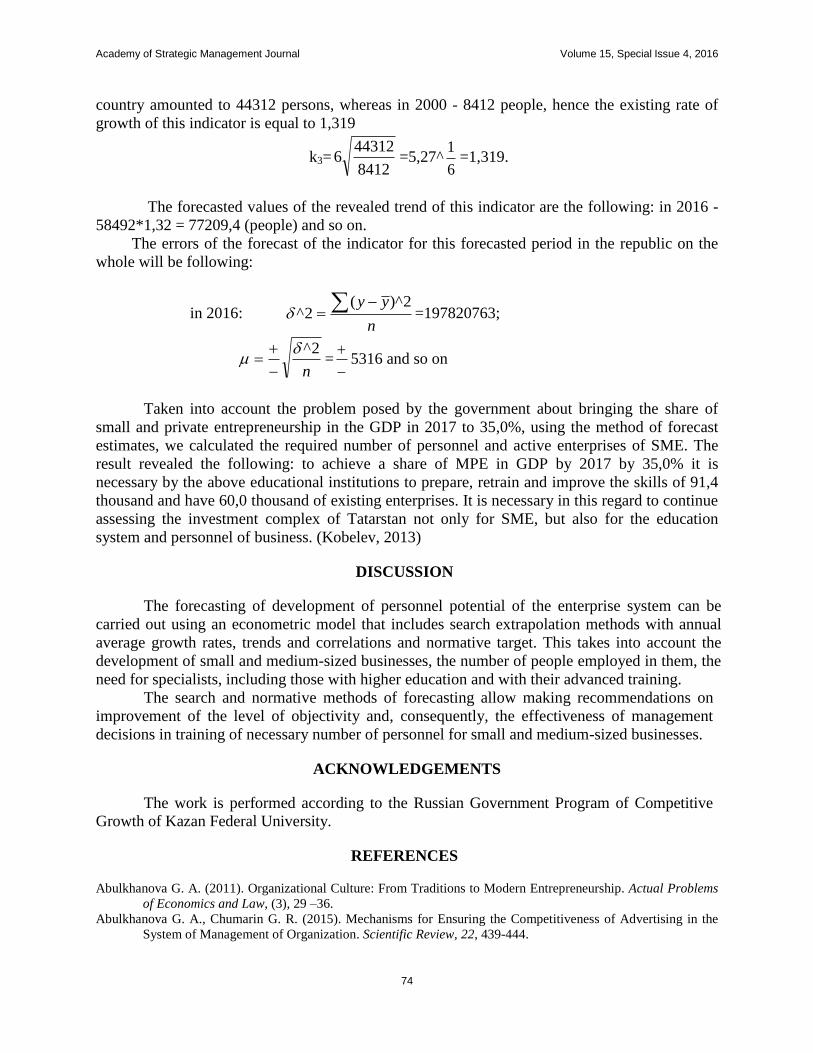
Figure 2
THE RESULTS OF THE RESPONSES ON THE SURVEY QUESTIONS OF THE HEADS OF
COMMERCIAL ORGANIZATIONS FROM THE GROUP №2, % OF RESPONDENTS
As for the firms that publish statements both according to RAS, and IAS (group №2), the
situation looks different. About 25% of respondents believe the indicator of "revenue" to be
reliable in most cases. More than 60% of respondents say that this figure is usually reliable. Only
10% believe that this figure is valid only in individual cases and only 5% said that the indicator
of "revenue" is misleading. (Kulikova and Goshunova, 2014)
Profit indicator is considered most reliable by over a third of respondents in the first
group, while 40% consider it valid only in individual cases, and the fifth part consider it more
often misleading. Many of the respondents indicated that companies take steps to optimize profit,
and often do that towards underdeclaration of it. Much of the respondents noted that measures
used for underdeclaration of profit have certain limits because stable losses or low profits with
revenue growth may inevitably arouse a suspicion of tax authorities. The desire to distort the
value of this indicator in the direction of overstatement is typical for companies which consider
reporting as the main source of information for foreign investors (Fig. 2).
Typically, the analysis of such covert reports on the stage of negotiations and the signing
of some contracts, analysts can incorrectly assess the financial position of an organization and
effectiveness of its operations that could lead to wrong decisions. Problems with the reliability of
profit indicators make it difficult to analyze profitability and other relative indicators of
effectiveness of a company (Kulikova et al., 2015).
The results of evaluation of reliability and completeness of financial statements with
respect to the market value of fixed assets have shown that about 20% of respondents believe this
figure misleading. More than 40% believe this figure reliable in some cases, and over 20% of
respondents - reliable in most cases, and about 20% - always reliable. This distrust of this
important parameter may be explained by a representation in a balance sheet of the residual
value of fixed assets what is not always in line with market estimates. According to respondents,
this is due to the low value of this indicator for financial analysis purposes. According to
0.00%10.00%20.00%30.00%40.00%50.00%60.00%70.00%80.00%90.00%
100.00%Almost always unreliable
Reliable in some cases
Reliable in most cases
Usually reliable
Page 25
Academy of Strategic Management Journal Volume 15, Special Issue 4, 2016
20
respondents, unreliability of this indicator may be explained in a certain sense by the lack of the
market where it would be possible to assess the real value of the objects. If to consider the results
of the second group of respondents, it can be noted that more than 60% of respondents believe
the figure reliable, 20% consider reliable in most cases, and only about 4% believe this figure
misleading. The higher reliability of this indicator is related to representation in the balance sheet
of facilities in accordance with IFRS requirements where the fair value of facilities plays a big
role.
With regard to own funds, about 35% of the respondents noted that their figures in the
financial statements are almost always reliable. Less than 20% said that these figures are reliable
in most cases, and about a quarter - in individual cases. More than 20% of respondents noted that
the data on the amount of own funds are unreliable in most cases because they do not give any
idea about the actual amount of invested own funds and surplus funds available to the company.
In practice, indicators of the authorized and additional capital often do not mean real investment
in fixed or revolving funds. For example, a car may be used as a contribution, and really it is not
used in the production (Kulikova et al., 2015). As respondents note, today financial statements
format does not represent even for internal users how many own funds were actually invested in
the business due to that it is difficult to assess their actual impact. Analysts receive incorrect
assessment of solvency of the business partners as a result of incompleteness and unreliability of
the data displayed in the balance sheet.
Survey of the second group of respondents showed that only about 5% of respondents
believe the own funds index unreliable when more than 55% rely on its validity.
As to assessment of reliability of the information concerning the debts of an enterprise,
almost 17% of respondents believe that it is almost always reliable, and nearly half believe that it
is reliable in most cases. According to respondents, the main drawbacks of the information
regarding the enterprise debt indicator are related to the fact that reporting does not allocate
"arrears", but it is the figure which has particular importance in the assessment of financial
stability and independence of the business partners. Survey results carry the inference that more
important sources of information for management purposes are the " instruments of payment",
payment schedules, and other similar issues that make it possible to avoid temporary problems
with insolvency, as compared with the calculation of indicators on the basis of accounting data
characterizing solvency, liquidity, and financial stability. According to the survey of the second
group, it may be noted in relation to the reliability of the accounts payable that more than 60%
believe this indicator is usually reliable when only 2% believe this figure misleading.
As to the indicator of debt to the company, assessments of reliability of information in the
financial statements are even more conservative. Nearly half of respondents believe that this
information is almost always or often reliable. About one-third believe that information about the
receivables is valid only in certain cases. Less than 20% negatively evaluate the objectivity of the
indicator. According to respondents, the main observation is also related to the lack of
information on arrears, and dependence of calculations on the specific debtors.
The survey of respondents in the second group has showed that about 90% of respondents
consider the indicator "receivables" as reliable when any one respondent has not spoken of
unreliability of this indicator. It tells about that the companies forming the statements both in
accordance with RAS and IFRS, the indicator of accounts receivable is less likely to contain
false information.
Page 26
Academy of Strategic Management Journal Volume 15, Special Issue 4, 2016
21
RESULTS
Based on the results of our study we may note that analysis of the responses to the survey
questions confirms our previous conclusion that the financial statements data are more in
demand to external users than internal. The main reason is the lack of other sources of
information in external users, while internal users use all possible sources of additional
information about the property and financial condition of the company.
To clarify the causes and frequency of demand for reporting by external organizations in
management decision-making, we have studied the answers to the question: "Do you use the
reported financials of other organizations to assess their financial condition in making decisions,
and for what reason?"
Results of the survey have shown that about one-third of the respondents do not use
statements of external organizations as a source of information, and only one of ten respondents
regularly use statements of external organizations as a source of complete and reliable
information.
The main reason for lack of demand for the information represented in the financial
statements is that the fulfillment of the legal requirements to reporting does not guarantee
representation in it of the real picture of the financial status. An analysis of third-party reporting
would be claimed even more than analysis of the own organization reporting, but not for the
reasons of more confidence to it, and because of absence of other more reliable sources of
information. (Kulikova et al., 2015)
Despite that all the respondents recognize the need to use information about financial
status of a company for management decision-making; the majority of enterprises use mainly
other information from the accounting system in the conditions of unreliability and
incompleteness of the financial statements.
CONCLUSIONS
In general, based on the analysis results for the survey of two groups of respondents it can
be noted that financial statements figures of the companies that form their reporting in
accordance both with RAS and IFRS are more reliable than of companies that use only RAS.
This tells us that reporting in accordance with international financial reporting standards would
make reporting more transparent and trustworthy.
ACKNOWLEDGEMENTS
The work is performed according to the Russian Government Program of Competitive
Growth of Kazan Federal University. We are indebted to the heads of organizations participated
in the survey for our research. We would also like to acknowledge the enormous contribution of
D.Sc. Economics, Professor L.D. Kulikova for assistance in gathering information and providing
extensive consultations on the study.
REFERENCES
Aletkin P.A. (2014). International financial reporting standards implementation into the Russian accounting system.
Mediterranean Journal of Social Sciences, 5(24), 33-37.
Antonov S.V. (2007). Analysis of financial statement as an information base for the management: the results of
questioning of top managers. Economics analysis: theory and practice, 24(105), 48-54.
Page 27
Academy of Strategic Management Journal Volume 15, Special Issue 4, 2016
22
Federal law №402-FZ "About accounting" dated 06.12.2011.
Izmestyeva O.A. (2009). Financial statement as an information base for the management decisions. Vestnik Sam
GUPS, 3(15), 19-27.
Kulikova L.I., Gafieva G.M. (2014). DEVELOPMENT OF FINANCIAL REPORTING PRINCIPLES,
Mediterranean Journal of Social Sciences, 5(24), 38-40.
Kulikova L.I., Garyntsev A.G., Gafieva G.M. (2015). The Balance Sheet as Information Model Original Research
Article. Procedia Economics and Finance, 24,339-343.
Kulikova L.I., Goshunova A.V., (2014). SCIENCE OF BALANCE PREPARATION: SUBSTANCE AND
STAGES OF DEVELOPMENT IN RUSSIA. Mediterranean Journal of Social Sciences, 5(24), 49-51.
Kulikova L.I., Grigoryeva L.L., Gubaidullina A.R. (2014). The interrelation between the professional judgment of
the accountant and the quality of financial reporting, Source of the Document. Mediterranean Journal of
Social Sciences. 5(24), 61-64.
Kulikova L.I., Nesterov V.N., Vakhotina D.A., Yakhin I.I. (2015). The revision of approaches to innovative
analysis. Source of the Document Mediterranean Journal of Social Sciences. (1S3), 421-425.
Ushakova T.V., Mukhametzyanov R.Z. (2015). Economic analysis within the models of corporate lifecycles. Kazan
Economic Vestnik, 3(17), 99-104.
Page 28
Academy of Strategic Management Journal Volume 15, Special Issue 4, 2016
23
ENSURING THE EFFECTIVENESS OF THE
PRIVATIZATION OF STATE-OWNED COMPANIES IN
THE CONDITIONS OF INSTABILITY OF THE
FINANCIAL MARKETS (UNDER THE EXAMPLE OF
OJSC "OIL COMPANY "ROSNEFT")
Nail Gabdullin, Kazan Federal University
Igor Kirshin, LenarVafin, Kazan Federal University
ABSTRACT
The current state of the world and Russian economy makes it necessary to search for the
additional sources of funding by the Government of the Russian Federation in terms of
undervaluation of the Russian companies.
The privatization strategy is aimed at regulation of the state budget deficit by attracting
the maximum possible amount of cash flows at the present stage of development of the Russian
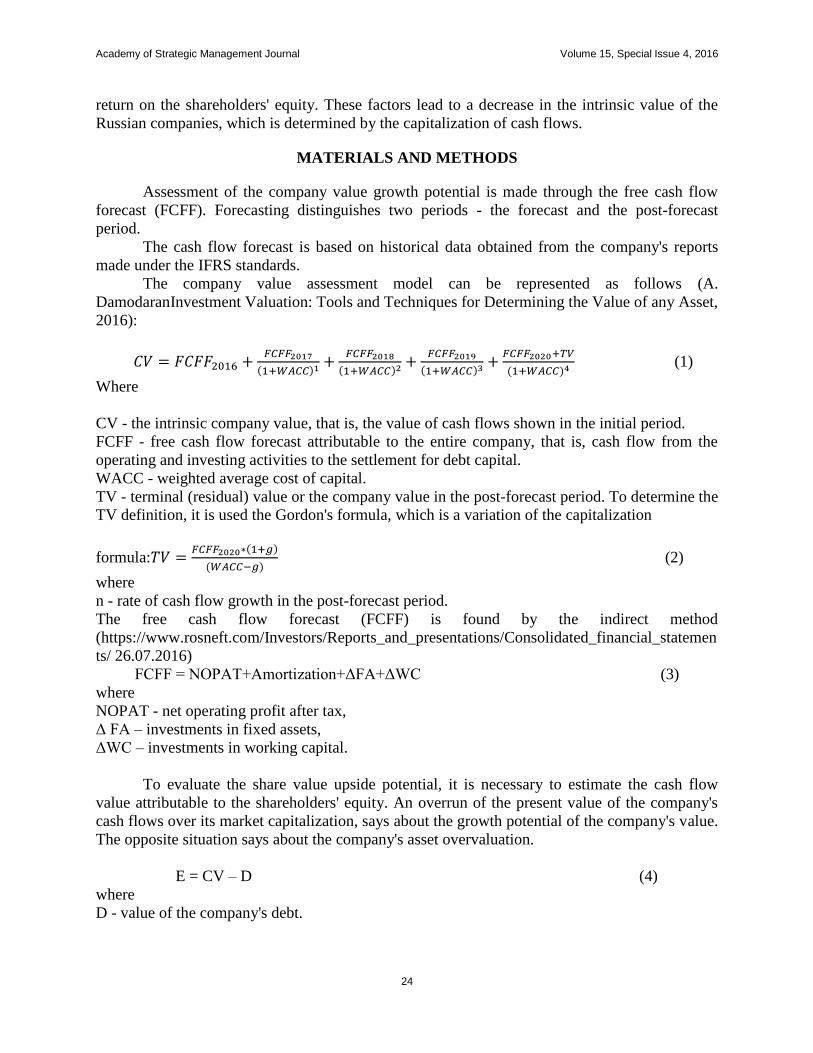
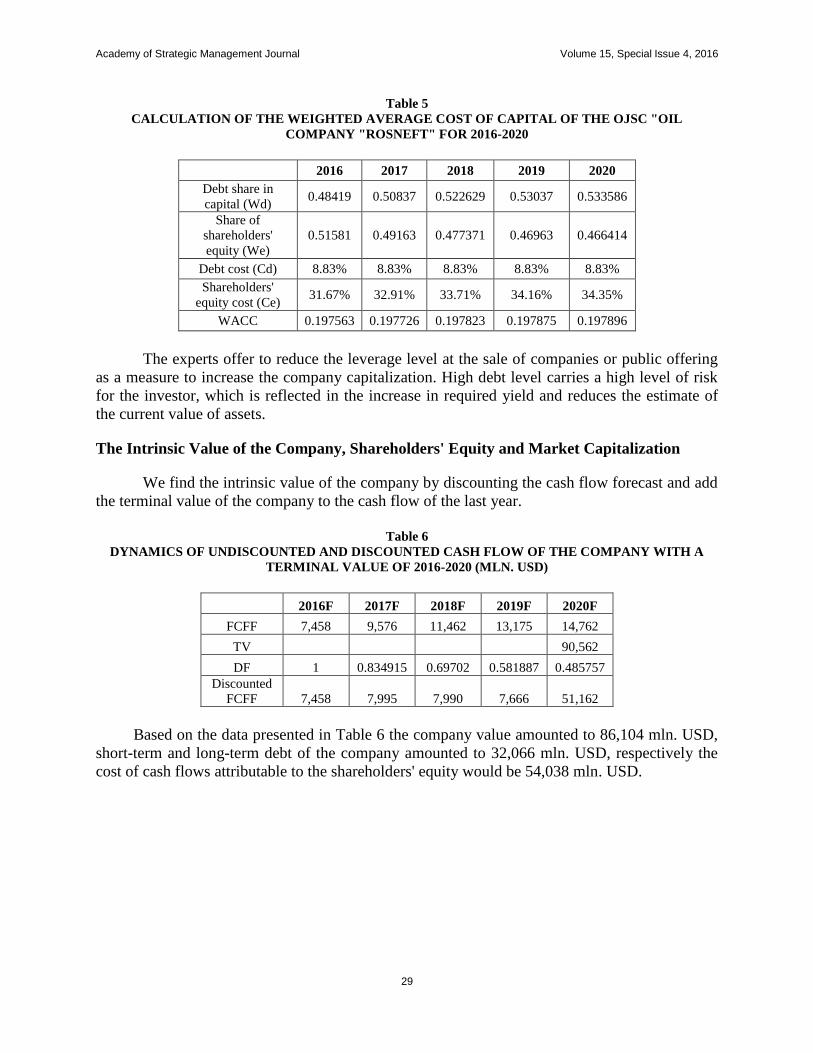
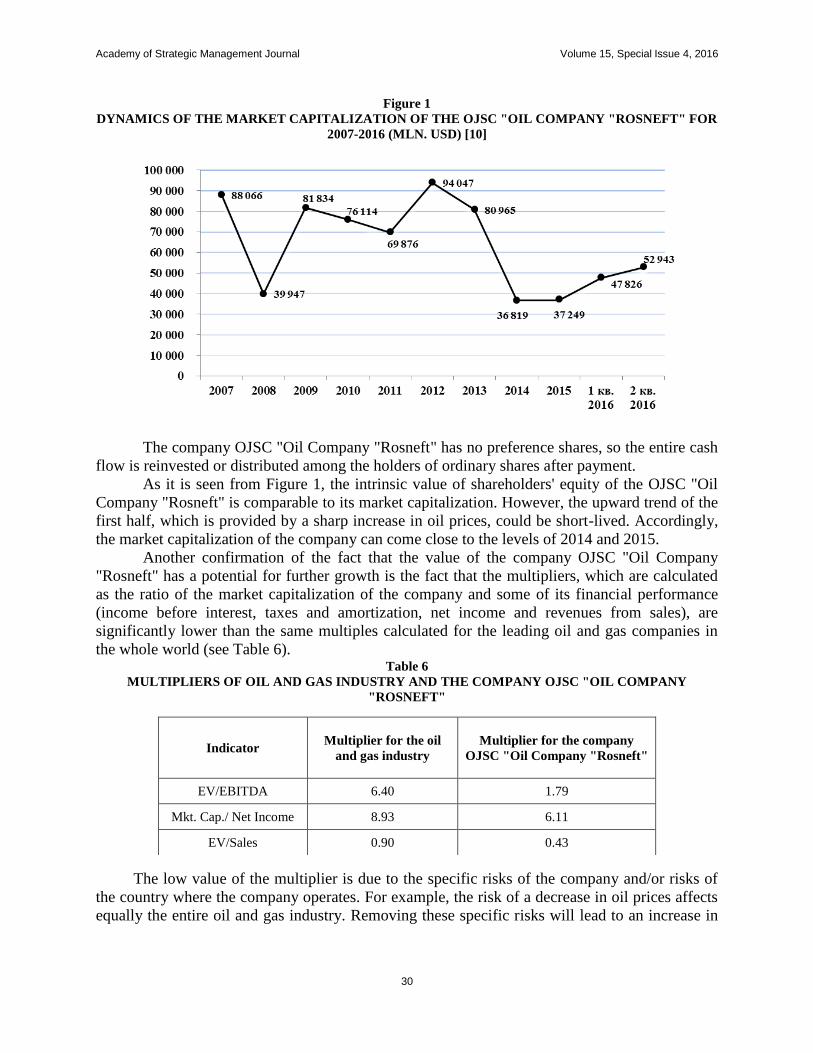
economy. However, due to the volatility of financial and commodity markets, and imposed
sanctions against the Russian companies, it raises the problem of an adequate assessment of the
privatized assets. A potential stabilization of markets and the prospects of lifting of restrictions
actualize the temporal aspects of privatization.
The paper includes the assessment of the value of cash flows generated by the company
and the shareholders' equity. A comparison of the cash flows of the company, attributable to the
shareholders’ equity, and its capitalization has allowed identifying the undervaluation or
overvaluation of the companies.
Cost evaluation of the OJSC "Oil Company "Rosneft" shows its undervaluation. This
company is overburdened with debts, which indicates the inefficiency of its privatization in the
current conditions. The undervaluation of the company by the investors is supported by a
comparative analysis of the values of its financial multiples and financial multiples of foreign oil
and gas companies. In the long term perspective the value of the company's cost of capital may
be reduced, and the values of cash flows may be increased. This will lead to an increase in the
value of the company's assets.
Key Words: Internal Value Of The Company, Market Capitalization, Company Cash Flow,
Required Rate Of Return, Cost Of Capital.
INTRODUCTION
Carrying out a privatization of the Russian companies to replenish the state budget may
show low efficacy in the present conditions. A decreased capitalization of the privatized
companies will attract significantly fewer resources to the budget than in the periods of
stabilization or economic growth. The issue on the privatization need is settled by assessing the
asset growth potential and the time when this potential will be realized. The privatized Russian
companies are significantly dependent on commodity prices, showing recently the poor market
conditions and the increasing financial risks, which significantly increase the required rate of
Page 29
Academy of Strategic Management Journal Volume 15, Special Issue 4, 2016
24
return on the shareholders' equity. These factors lead to a decrease in the intrinsic value of the
Russian companies, which is determined by the capitalization of cash flows.
MATERIALS AND METHODS
Assessment of the company value growth potential is made through the free cash flow
forecast (FCFF). Forecasting distinguishes two periods - the forecast and the post-forecast
period.
The cash flow forecast is based on historical data obtained from the company's reports
made under the IFRS standards.
The company value assessment model can be represented as follows (A.
DamodaranInvestment Valuation: Tools and Techniques for Determining the Value of any Asset,
2016):
( )
( )
( )
( ) (1)
Where
CV - the intrinsic company value, that is, the value of cash flows shown in the initial period.
FCFF - free cash flow forecast attributable to the entire company, that is, cash flow from the
operating and investing activities to the settlement for debt capital.
WACC - weighted average cost of capital.
TV - terminal (residual) value or the company value in the post-forecast period. To determine the
TV definition, it is used the Gordon's formula, which is a variation of the capitalization
formula: ( )
( ) (2)
where
n - rate of cash flow growth in the post-forecast period.
The free cash flow forecast (FCFF) is found by the indirect method
(https://www.rosneft.com/Investors/Reports_and_presentations/Consolidated_financial_statemen
ts/ 26.07.2016)
FCFF = NOPAT+Amortization+ΔFA+ΔWC (3)
where
NOPAT - net operating profit after tax,
Δ FA – investments in fixed assets,
ΔWC – investments in working capital.
To evaluate the share value upside potential, it is necessary to estimate the cash flow
value attributable to the shareholders' equity. An overrun of the present value of the company's
cash flows over its market capitalization, says about the growth potential of the company's value.
The opposite situation says about the company's asset overvaluation.
E = CV – D (4)
where
D - value of the company's debt.
Page 30
Academy of Strategic Management Journal Volume 15, Special Issue 4, 2016
25
RESULTS
Analysis and Forecasting of Cash Flows of the OJSC "Oil Company "Rosneft"
The company's ability to generate a cash flow is determined by the potential of the market
for the products. The OJSC "Oil Company "Rosneft" is the world's largest publicly traded
company on the volume of oil production. The company's business is focused on activities
related to the sale of oil and petroleum products.
The oil market dynamics showed a downward trend that was reflected in the value of the
free cash flow forecast (see Table 1).
Table 1
THE DYNAMICS OF REVENUES, COSTS AND INCOMES, OPERATING PROFIT AND NOPAT OF
THE OJSC "OIL COMPANY "ROSNEFT" FOR 2010-2015 (MLN. USD) (SIMKINS, 2013)
2010 2011 2012 2013 2014 2015
Revenues 63,056 92,512 99,389 145,272 142,148 83,295
Costs and incomes 50,543 77,229 86,133 130,035 128,299 72,963
Operating profit 12,512 15,283 13,256 17,436 15,495 11,629
NOPAT 10,010 12,226 10,605 13,949 12,396 9,304
As it is seen from Table 1, there has been a positive trend in revenues from 2010 to 2014,
increasing the cash flow. In 2015, there has been a strong negative correction, which has
decreased it by 41%. At the same time it has been observed the dynamics of costs and expenses
growth from 2010 to 2014. Thus, the growth rate has amounted to 2.54 times, with the cost
correction for 42% in 2015. A slowdown of these indicators is due to a decrease in oil prices on
the international markets and a decrease in the exchange-value of rouble, which have devalued
the price of refined petroleum products on the domestic market of the Russian Federation. A
significant decrease in the operating performance of the company has occurred in dollar terms,
and in rouble terms the decrease is insignificant.
It should be noted the company's ability to reduce costs with a decrease in revenues.
Therefore, the OJSC "Oil Company "Rosneft" can withstand a comparable level of operating
profit and NOPAT due to the flexible taxation system of the oil extraction industry. The main
component in the composition of costs and expenses, which has showed a strong decrease in
2015 compared to 2014, is the export duty, which has decreased from 29,915 mln. USD to
12,692 mln. USD, that is, by 58%.
The further dynamics of operating performance of the company is determined by the state
of commodity markets. There are extreme points of view regarding the role of oil and oil
products in the world economy. It is argued that humanity can dramatically reduce the
consumption of these resources (perhaps completely abandon), which can destroy the oil
extraction industry. The extraction limitations lie on the demand side due to the possibility of
replacing fossil resources by the alternative sources of energy, caused by the policy of reducing
emissions (Ibragimov, 2016).
However, the impact of these factors will be negligible in the short term. The rates of
average annual growth of revenues and costs have amounted to 1.07 and 1.08% in dollar terms,
respectively, from 2008 to 2015. This is the cycle period after the previous crisis, including a
decrease in 2015. In the first half of 2016 it is observed an increase in oil prices.
Page 31
Academy of Strategic Management Journal Volume 15, Special Issue 4, 2016
26
Table 2
THE DYNAMICS OF REVENUES, COSTS AND INCOMES, OPERATING PROFIT AND NOPAT OF
THE OJSC "OIL COMPANY "ROSNEFT" FOR 2016-2020 (MLN. USD)
2016F 2017F 2018F 2019F 2020F
Revenues 89,126 95,364 102,040 109,183 116,826
Costs and incomes 78,071 83,536 89,383 95,640 102,335
Operating profit 11,055 11,829 12,657 13,543 14,491
NOPAT 8,844 9,463 10,126 10,834 11,593
Therefore, in the forecast period the pace is adopted at 1.07 as the growth rate, and in the
post-forecast - 1.03. At that the revenue growth is possible both due to a rise in prices and to the
production volume
(https://www.rosneft.com/Investors/Reports_and_presentations/Consolidated_financial_s
tatements/ 26.07.2016). The forecast data are presented in Table 2.
At this growth rate the company will bypass the level of 2012 to 2020 in terms of income
and expenses, but will be far from the record levels of 2013 and 2014.
To evaluate the cash flow of the company, it is necessary to amend the NOPAT, which
are presented in Table 3 based on the formula 3.
Table 3
FORECAST OF THE CASH FLOW DYNAMICS OF THE OJSC "OIL COMPANY "ROSNEFT" IN 2016-
2020 (MLN. USD)
2016F 2017F 2018F 2019F 2020F
NOPAT 8,844 9,463 10,126 10,834 11,593
Amortization 7,539 7,690 7,844 8,001 8,161
Capital costs 1,985 2,025 2,065 2,107 2,149
Investments in
the WC 6,940 5,552 4,442 3,553 2,843
FCFF 7,458 9,576 11,462 13,175 14,762
At the free cash flow forecast (FCF), Table 3 supposes a decrease in the investments in
the WC. This is explained by the WC calculation method according to the formula:
WC = (CA-CASH) - (SL-SD)(5)
where
CA – current assets,
SL – short-term liabilities,
SD – short-term debt.
At the same time the company OJSC "Oil Company "Rosneft" has the non-debt items as
the long-term liabilities that should reduce the WC from the point of view of the classical
financial management. These liabilities enable not to use the shareholders' equity and debt capital
to finance the company's current assets (Levy, 2010).
For example, the item "Prepayment on the long-term contracts of oil and oil products
supply" has amounted to 2012 - 0 USD, in 2013 - 14,360 mln. USD, in 2014 - 15,766 mln.USD,
in 2015 - 24,492 mln. USD in the long-term liabilities of the company OJSC "Oil Company
Page 32
Academy of Strategic Management Journal Volume 15, Special Issue 4, 2016
27
"Rosneft". And this item of the long-term liabilities has become comparable with the total long-
term debt of the company in 2015.
Based on these characteristics of the company, this item of the liabilities has been used in
the WC evaluation. At that it should be noted the presence of debt signs in this item, which
suggests the presence of the company's quasi-debt. The presence of high values of this item and
the recognition of its non-debt nature lead to negative values of the WC, and a working capital of
the company has been actually decreased by 10 times in 2013.
It is expected the WC increase by 67% in the proposed estimation and forecasting model
due to the company's long-term debt growth by 76%, shareholders' equity growth by 23% and
fixed assets growth by 10% in 2020. The growth of investments in the fixed assets is negligible,
since the assessment model is guided by the conservative estimates of oil and oil products price
growth.
A replacement of quasi-debt with the real debt leads to the FCFF growth, but this
increase is compensated by the growth of the required return on shareholders' equity by the
financial leverage adjustment.It occurs due to the fact that the debt increase leads to the increased
risk of investment in the shareholders' equity of the company.
Valuation of the Company's Cost of Capital
The capital provided by the owners and financial institutions as the debt has a cost. The
cost of capital is determined by the interest rate per capital unit for a certain period of use.
Therefore, the company's cash flows that define the desired level of profitability are discounted
at the rate of cost of capital. A comparison of the discounted flows generated by the assets with
the costs for asset acquisition enables to speak about the economic efficiency of investments.
Classical formula for determining the cost of capital
( ) (6)
where:
Т - income tax rate;
(1-T) – tax shield;
We - share of the shareholders' equity in the company's capital;
Wd - share of debt capital in the company's capital;
Ce - shareholders' equity cost;
Cd - debt capital cost.
According to reports the weighted average cost of capital of the OJSC "Oil Company
"Rosneft" amounted to 13.1% in 2015 (11.0% in 2014) prior to the payment of income tax [6].
For the independent calculation of weighted average cost of capital, it is necessary to
evaluate the shareholders' equity. The OJSC "Oil Company "Rosneft" is included in the list of
blue chips. Therefore, in order to evaluate the shareholders' equity we can use the Capital Asset
Pricing Model (CAPM) (https://www.treasury.gov/resource-center/data-chart-center/interest-
rates/Pages/TextView.aspx?data=yield 29.07.2016), which shows good results in the publicly
traded companies.
( )+specific risks (7)
Rf - risk-free rate,
β (beta) - measure of the company's (industry's) shares volatility in comparison with the
market as a whole (systemic risk),
Rm - average market return (market yield) on portfolio.
Page 33
Academy of Strategic Management Journal Volume 15, Special Issue 4, 2016
28
It has been adopted the US Treasury rate of government bonds as a risk-free rate for the
calculations (http://people.stern.nyu.edu/adamodar/ 29.07.2016).We took the data calculated by
A. Damodaran as a premium for the risk of investment in the shareholders' equity in the formula
(7) and (http://moex.com/a3691 30.07.2016).
As it is seen from Table 4, the required rate of return on the investment in the
shareholders' equity of the OJSC "Oil Company "Rosneft" is from 31.67% to 34.35%. A high
value is determined by the high value of premium for the risk of investment in the shareholders'
equity of the Russian companies and the high level of financial leverage. At the same time we
have not amended the foreign exchange risk, as the cash flow calculation is in USD.
Table 4
CALCULATION OF THE SHAREHOLDERS' EQUITY COST OF THE OJSC "OIL COMPANY
"ROSNEFT" FOR 2016-2020
2016 2017 2018 2019 2020
Rf (risk-free) 1% 1% 1% 1% 1%
Market premium for the risk
of investment in E 10% 10% 10% 10% 10%
Beta excluding debt load 1.63 1.63 1.63 1.63 1.63
D\E indicator 0.9387 1.034048 1.094806 1.129334 1.144017
Income tax effective rate 0.2 0.2 0.2 0.2 0.2
β coefficient - lever
adjustment 2.854065 2.978399 3.057627 3.102652 3.121798
Small company -0.37% -0.37% -0.37% -0.37% -0.37%
Non-systemic liquidity risk 1.50% 1.50% 1.50% 1.50% 1.50%
Non-systemic growth risk 0.01 0.01 0.01 0.01 0.01
Risk amount 2.13% 2.13% 2.13% 2.13% 2.13%
Kе - capital rate in the
context of leverage 31.67% 32.91% 33.71% 34.16% 34.35%
The definition of the weighted average of cost of capital has no particular problems.
Thus, the value of cost of borrowed resources is provided in the company's reports. But the
increase in financial leverage may increase both the value of shareholders' equity and debt
capital. For the calculations, it was assumed a stable value of the shareholders' equity of the
OJSC "Oil Company "Rosneft".
The calculations show that the weighted average cost of capital of the OJSC "Oil
Company "Rosneft" compose a value close to 20%. This value is different from the same
indicator of 2015 under the company's reporting data upward. It should be noted the growth of
DER level of the companies, which can be characterized as an aggressive policy of financing
their activities.
Page 34
Academy of Strategic Management Journal Volume 15, Special Issue 4, 2016
29
Table 5
CALCULATION OF THE WEIGHTED AVERAGE COST OF CAPITAL OF THE OJSC "OIL
COMPANY "ROSNEFT" FOR 2016-2020
2016 2017 2018 2019 2020
Debt share in
capital (Wd) 0.48419 0.50837 0.522629 0.53037 0.533586
Share of
shareholders'
equity (We)
0.51581 0.49163 0.477371 0.46963 0.466414
Debt cost (Cd) 8.83% 8.83% 8.83% 8.83% 8.83%
Shareholders'
equity cost (Ce) 31.67% 32.91% 33.71% 34.16% 34.35%
WACC 0.197563 0.197726 0.197823 0.197875 0.197896
The experts offer to reduce the leverage level at the sale of companies or public offering
as a measure to increase the company capitalization. High debt level carries a high level of risk
for the investor, which is reflected in the increase in required yield and reduces the estimate of
the current value of assets.
The Intrinsic Value of the Company, Shareholders' Equity and Market Capitalization
We find the intrinsic value of the company by discounting the cash flow forecast and add
the terminal value of the company to the cash flow of the last year.
Table 6
DYNAMICS OF UNDISCOUNTED AND DISCOUNTED CASH FLOW OF THE COMPANY WITH A
TERMINAL VALUE OF 2016-2020 (MLN. USD)
2016F 2017F 2018F 2019F 2020F
FCFF 7,458 9,576 11,462 13,175 14,762
TV
90,562
DF 1 0.834915 0.69702 0.581887 0.485757
Discounted
FCFF 7,458 7,995 7,990 7,666 51,162
Based on the data presented in Table 6 the company value amounted to 86,104 mln. USD,
short-term and long-term debt of the company amounted to 32,066 mln. USD, respectively the
cost of cash flows attributable to the shareholders' equity would be 54,038 mln. USD.
Page 35
Academy of Strategic Management Journal Volume 15, Special Issue 4, 2016
30
Figure 1
DYNAMICS OF THE MARKET CAPITALIZATION OF THE OJSC "OIL COMPANY "ROSNEFT" FOR
2007-2016 (MLN. USD) [10]
The company OJSC "Oil Company "Rosneft" has no preference shares, so the entire cash
flow is reinvested or distributed among the holders of ordinary shares after payment.
As it is seen from Figure 1, the intrinsic value of shareholders' equity of the OJSC "Oil
Company "Rosneft" is comparable to its market capitalization. However, the upward trend of the
first half, which is provided by a sharp increase in oil prices, could be short-lived. Accordingly,
the market capitalization of the company can come close to the levels of 2014 and 2015.
Another confirmation of the fact that the value of the company OJSC "Oil Company
"Rosneft" has a potential for further growth is the fact that the multipliers, which are calculated
as the ratio of the market capitalization of the company and some of its financial performance
(income before interest, taxes and amortization, net income and revenues from sales), are
significantly lower than the same multiples calculated for the leading oil and gas companies in
the whole world (see Table 6). Table 6
MULTIPLIERS OF OIL AND GAS INDUSTRY AND THE COMPANY OJSC "OIL COMPANY
"ROSNEFT"
The low value of the multiplier is due to the specific risks of the company and/or risks of
the country where the company operates. For example, the risk of a decrease in oil prices affects
equally the entire oil and gas industry. Removing these specific risks will lead to an increase in
Indicator Multiplier for the oil
and gas industry
Multiplier for the company
OJSC "Oil Company "Rosneft"
EV/EBITDA 6.40 1.79
Mkt. Cap./ Net Income 8.93 6.11
EV/Sales 0.90 0.43
Page 36
Academy of Strategic Management Journal Volume 15, Special Issue 4, 2016
31
the company value, which will ensure a compliance of the multipliers with the worldwide
industry standards.
CONCLUSION
The raw character of development of the Russian economy leads to the significant
cyclical problems. In a period of high conjuncture of the commodity markets, the
macroeconomic risks of state budget deficit are hardly noticeable. However, when the price
conjecture has a downward trend, there are problems of reducing the state spending and covering
the state budget deficit.
The decision on the sale of assets of the companies with state participation is self-
contradictory, since the value of company assets is directly or indirectly linked to the value of
natural resources. From the standpoint of achieving a high efficiency in making decisions on the
privatization, it is necessary to carry out the sale of assets of the companies at the time of high
prices for resources, but in this period, as a rule, the cash flow of these companies and their net
profits are sufficient (Kirshin, 2016).
From the standpoint of obtaining the high cash flows, it is necessary to wait, for example,
an achievement of the level of 70,000 mln. USD of 2011. According to forecasts this indicator
may be achieved in 2017 - 2018, subject to the forecast increase in oil and oil products prices,
lifting of sanctions from the Russian economy and reducing the leverage of companies with state
participation.
ACKNOWLEDGEMENTS
The work is performed according to the Russian Government Program of Competitive
Growth of Kazan Federal University.
REFERENCES
A. Damodaran (2016). Investment Valuation: Tools and Techniques for Determining the Value of any Asset, B.
Simkins, R. Simkins Energy Finance and Economics: Analysis and Valuation, Risk Management, and the
Future of Energy March 2013, 624 pages.
Consolidated financial statements of the OJSC "Oil Company "Rosneft",
https://www.rosneft.com/Investors/Reports_and_presentations/Consolidated_financial_statements/
26.07.2016
Consolidated financial statements of the OJSC "Oil Company "Rosneft" dated December 31, 2015 P. 58
https://www.rosneft.com/Investors/Reports_and_presentations/Consolidated_financial_statements/
26.07.2016
Damodaran online. Data http://people.stern.nyu.edu/adamodar/ 29.07.2016
KirshinI.A. (2016). Capital Structure Optimization Method Taking into Account the Company's Financial
Difficulties. Financial Management, (2), 69 - 76.
Levy H. (2015). The CAPM is Alive and Well: A Review and Synthesis. European Financial Management, 16(1),
43–71.
Market capitalization of the securities on the basis of trading in CJSC "MOEX Stock Exchange" at the end of the II
quarter of 2016 http://moex.com/a3691 30.07.2016
Market capitalization of the securities on the basis of trading in CJSC "MOEX Stock Exchange" at the end of the II
quarter of 2016 http://moex.com/a3691 30.07.2016
R. Ibragimov 6 (2016). To the Question of Calculating the Terminal Component of Discounted Cash Flow Model.
Financial Analytics: Science and Experience, 27-41.
U.S. DAPARTMENT OF TREASURY. Daily Treasury Yield Curve Rates https://www.treasury.gov/resource-
center/data-chart-center/interest-rates/Pages/TextView.aspx?data=yield 29.07.2016.
Page 37
Academy of Strategic Management Journal Volume 15, Special Issue 4, 2016
32
FINANCIAL RISK MANAGEMENT INSTRUMENTS
FOR PETRO-CHEMICAL INDUSTRY
Adel A. Daryakin, Kazan Federal University
Gulnaz R. Khafizova, Kazan Federal University
ABSTRACT
The article deals with the problem of estimate of efficiency of the risk-adjusted projects,
influencing the time-frame and final result of realization. State of the Russian economy despite
some positive tendencies can be characterized as a crisis in terms of the reproduction process. It
also concerns the investment sphere in full.
The investment processes mediated by the relevant organizational structures (primarily
by commercial banks for the Russian Federation) are the catalysts in any economic system, the
driving force of the dynamic development of social production.
Currently, the banking sector comprises large financial resources that could contribute
to the economic development of the country. However, in case of investment activities,
commercial banks are faced with rather complex problems. As a result, the costs of banks in
preparing and realizing the investment projects are extremely high, and the risk is great at every
stage, as there are many economic factors that are likely to adversely affect the investment
process.
To assess the effectiveness of the projects on the example of JSC “Taneco”, the Weighted
average cost of capital model (WACC) was used. It is the average interest rate on all sources of
financing the company. To demonstrate the efficiency of the risk-adjusted project, the capital
asset pricing model is used - Capital Asset Pricing Model, CAPM, the calculation of which we
will dwell upon on the example of JSC “Taneco”.
Key Words: Management of Project Risk, the WACC Model, Efficiency.
INTRODUCTION
At the present time, most of the largest commercial banks in the world sent substantial
part of funds for crediting investment projects, and not only as the participants but also as the
organizers of the project financing. Such situation is determined by the opportunity for the banks
to get more profit and improve their image in the world financial market. For Russian banks this
activity is relatively new, the lack of practical experience in this area makes them be bewaring of
investing in large investment projects, which is extremely unfavorable for further development.
The new modern large-scale production of full processing of hydrocarbons to increase the
value added within the country and to avoid dependence on raw materials is especially needed in
today's geopolitical environment of Russia. Today's reality, when it is difficult to talk about long-
term stable high prices for traditional energy resources, force the Russian government and the oil
companies to do systematic development of this industry and launch of new large and medium-
sized petrochemical plants. (Abramov, 2009)
But to reverse the situation, it is needed a systematic work on the part of the Russian
Government for the development of new clusters, and on the part of large and medium-sized
Page 38
Academy of Strategic Management Journal Volume 15, Special Issue 4, 2016
33
businesses to build a great number of new large and medium-sized high-tech enterprises in the
petrochemical industry.
Considering the world trends and with a view of promoting diversification, growth,
profitability and, most of all, the desire to stand on a par with the world's largest oil and gas
giants, one had better contribute to the development of specialized petrochemical companies as
well as expand the petrochemical sectors in the leading Russian oil and gas companies. After all,
these companies along with some large and medium-sized chemical companies have the
potential and the greatest chances to promote the exit from the domestic petrochemical crisis. For
the development in this area, it is necessary to constantly implement the investment projects.
(Tsykunov, 2009)
Considering all of the above, a high level of risk influence the decision about
implementation of the project, so you need to take into account the risk factors from the point of
view of management of company’s projects. The main criterion of choosing the project is a risk-
adjusted project - a ratio project risks and the expected benefits, that is, the assessment of
profitability of the project can be affected by iaccount and assessment of possible adverse events.
LITERARY REVIEW
The subjects of the project financing is fairly widely reflected in the works related to the
general theory of corporate finances and in the specialized literature on risk management, project
management, cost estimating of investment projects, etc.
Among the works that cover the general theory of corporate finance, one is, first of all, to
highlight works by R. Braley and S. Myers “The Principles of Corporate Finance” and by Z.
Bodie, A. Kane and A. J. Marcus “The Principles of Investments”. These works consider the
issues connected with the theory of financial management of corporation and basic principles of
implementation of investment projects. The general theoretical issues of project financing are
expanded in work by F. Benoist “The Project Financing at the World Bank”. The modern
approaches to the project financing are widely reflected in the monograph by E. R. Yeskomb
“The Principles of Project Financing”. (Finnerty, 2006)
Among the works that deal with the project financing in Russia, one should note the work
by V. Y. Katasonov, D. S. Morozov, M. V. Petrov “The Project Financing: The World’s
Experience and Prospects for Russia”, the work by A.Konoplyanik and S. Lebedev “The Project
Financing in the Oil and Gas Industry: International Experience and the Beginning of
Application in Russia”, the work by A. M. Tavasiev “Banking: Management and Technology”,
and an analytical study of the rating agency Standard & Poor's “The Possibilities of Project
Financing in the Russian Oil and Gas Industry”. The key aspects of the topic under study are
considered in the listed publications. First of all, the authors pay attention to the main features of
the “classic” project financing, give the examples of the practical use of schemes of the project
financing in the CIS and abroad. Particular attention is given to the risks that arise when
implementing the major investment projects, and the ways of their minimizing.
The Object of Research
Building the Complex of Oil Refining and Petrochemicals in Nizhnekamsk was initiated
by the Government of the Republic of Tatarstan in 2005, during the construction of this complex
it was supposed to create a continuous process of oil refining. For the first time after the post-
Soviet period a new complex has been built, from scratch with a phased launch of additional
Page 39
Academy of Strategic Management Journal Volume 15, Special Issue 4, 2016
34
capacities and plants. When constructing and launching the first complex, the mechanism of
public and private partnership was applied, which is actively used for further financing.
The first phase of the complex was launched in December 2011, and Tatarstan took the
sixth place among Russian regions in terms of refinery in 2012.
According to the plans of the Group's management of the PJSC “Tatneft”, with a phased
launch of the complex, the construction of the unit of a delayed coking is approaching
completion, the launch of which will completely eliminate the yield of dark oil. Coke produced
in DCU will be used as fuel at Nizhnekamsk heat electropower station that will save natural gas
for JSC “TANECO” and solve the issue of utilization of coke.
In the process of realization of this project being obviously successful for JSC “Taneco”,
we faced with the problem of under-funding, as the project was developed in the pre-crisis
period. It was planned that DCU will process 2 million tons of heavy oil residues (sludge) per
year. As a result, the depth of processing petrol raw material at JSC “Taneco” reached 95-97%
(currently 67.92%). The cost of realization of the DCU project is 11,603 billion rubles.
Methodology
Diversification of the sources of project financing is a determining factor of the success in
realizing the project. In addition, as a rule, with the entry into the period of implementation, the
project will require the involvement of expensive equipment. In such circumstances, to attract,
for example, bank lending to purchase it would be impractical due to the fact that banks are
restricted by the estimated cost of collateral assets of the organization as well as the amount of
own funds invested in the project. However, in addition to equipment of project organization, the
project being implemented requires significant resources for other activities, including payments
to employees, suppliers and contractors, taxes and licensing fees, and other costs. (Nevitt and
Fabozzi, 1995)
The showing a typical contract structure and the structure of ownership of the project,
which is based on the establishment of the project company, is presented in Figure 1.
Distribution of risks between the participants may vary, depending on the specifics of the
project, and this issue has often a legal character as the risks and their distribution are reflected in
the design documentation and are critical issues of any contract. The basic moment of
distribution of risks is to find a balance between project risks taken by the parties and their
remuneration so that the project could be organized on the basis of a limited right of obligation
transfer. Since the basic principle of implementation of non-state investment projects is their
self-financing - agreements and contracts based on them should be directly or indirectly aimed at
facilitating the process of funding and reducing the risks of lenders and investors by determining
the obligations of participants of the project. The lenders lay responsibility for repayment of a
credit on the project company and, in the event of failure of the latter, have the opportunity to
take possession of the assets of the project company and appoint their own administrative staff
under existing agreements.
Page 40
Academy of Strategic Management Journal Volume 15, Special Issue 4, 2016
35
Figure 1
PROJECT FINANCING IN PETROCHEMICAL PRODUCTION
Non-acceptance of the bank risks in implementation of the project financing is nullified
by the efforts of the banking units on assessment and management of risks, such structures are
constantly being reorganized and reoriented according to the new goals, and the proposals put
forward by them on the allocation of funding, limits, the approaches to determining the discount
rate have a negative impact on the credit process. A striking proof of this is the current situation
with the Security Council of the Russian Federation, which adopted a single discount rate for all
investment projects (15%). The consequence of insufficient investigation of determining the
influence of banking risks is the fact that the credit limits on the unit of the Security Council of
the Russian Federation are directly (often unnecessarily) increased, and the standards of financial
and economic activity of borrowers are simplified.
On the basis of the statistical data and the data of petrochemical companies, the
methodology of assessment of riskiness of the project has been developed.
Page 41
Academy of Strategic Management Journal Volume 15, Special Issue 4, 2016
36
Table 1
FACTOR CORRECTION OF THE RISK PREMIUM IN THE FINANCING OF INVESTMENT
PROJECTS
Factors of influence Risk-adjusted (%)
1. Uncertainty in demand and prices for products produced within the project:
increase in existing products;
the development and promotion of a new product.
0-5
8-13
2. The instability of demand (cyclical, seasonal) 2-7
3. The nature of the technologies applied:
traditional;
environmentally more costly.
0-5
12-20
4. The uncertainty of supply of raw materials 2-7
5. The need to adopt new techniques and technologies that ensure environmental safety. 3,92-8
6. The need of implementing the R & D project:
within the organization;
by outside organizations;
jointly by several organizations.
10-15
15-20
20-25
RESULTS
On the basis of this method and the CAPM model discount rate of the investment project
is calculated, taking into account o the risks of project financing. The rate of the risk premium
are given at intervals, which enables to make additional correction due to the additional
information, besides, to use a variety of statistics on specific industrial projects. It is especially
important that the author's methods can be expanded for account of other factors (natural,
technological and others). These factors in the methodology can be referred to the group of
factors of credit risks as inefficient (non-elaborated, not enough analyzed investment project)
projecting.
The discount rate for calculating the efficiency of the DCU project equal to 6% is
understated, since it does not reflect the riskiness of the project and the expected return for the
investors. Facing this problem has led to prolonging the term of start-up of the DCU (from the
end of 2015 to July 2016). To calculate a more realistic discount rate, we use the weighted
average cost of capital and the CAPM model.
CAPM formula is as follows:
Re = Rf + βrelevered × (Rm - Rf) + S1 + S2 + C, (1)
where Re - the rate of return on equity;
Rf - the rate of return on risk-free investments;
Rm - the average market rate of return;
(Rm - Rf) - the risk premium for long-term investments in shares;
βrelevered - beta coefficient reflecting the ratio between debt capital andequity of the
company;
S1 - the additional rate of return for the risk of investing in a particular company
(unsystematic risks);
S2 - the additional rate of return for the risk of investing in a small company;
C - the additional rate of return with consideration taken for the country risk.
Page 42
Academy of Strategic Management Journal Volume 15, Special Issue 4, 2016
37
To illustrate the CAPM model, each of its components is considered in more detail
below. Table 2
CALCULATING THE COST OF EQUITY CAPITAL USING THE MODEL OF CAPITAL ASSETS
PRICING (CAPM)
Title Value
Risk-free rate 4,75%
The risk premium of investing in share capital 7,1%-1,5%=5,6%
Factor beta 1,3
Country risk 2,25%
Premiun for small capitalization 3,92%
Premium for the specific risk 2,05%
Total: 20,25%
In fact, WACC characterizes the alternative cost of investing, the rate of return that can
be received by the company when investing not in a new project but in an existing one. WACC
is calculated by the following formula:
WACC = Ks * Ws + Kd * Wd * (1 - T), (2)
where, Ks - The cost of equity capital(%);
Ws - The share of equity capital(in % (at balance);
Kd - The cost of borrowed capital (%);
Wd - The share of borrowed capital (in %(at balance).
After the calculations of WACC = 12,2%, which is 2 times higher than the proposed
discount rate. Now for a more realistic calculation of the efficiency, we will carry out the
financial and economic calculations of the project.
The economic effect of the project with such assessment is also higher, which will attract
investors, at the same time, when calculating, the assessment of an expected profitability of the
project was also used, taking into account the risk and cost of borrowed capital, which, due to the
project financing, is also inflated. (Yearbook, 2007)
Thus, during the preliminary examination, it is difficult to assess all the variants of the
development of the project with a variety of changing parameters, although such opportunities
are provided by a modern system of financial modeling. One of the most difficult moments in the
financial evaluation of the project is the prediction of the discount rate, which would take into
account the expectations of the parties of the project financing and the risks of such project.
CONCLUSION
The role of banks in the development of project financing increases. It is connected with
the increase of number and volume of transactions of project financing in the world, and with the
strengthening of banks' activity in this area. In spite of the increase in stock market values in
financing the companies, with project financing, bank is indispensable, since it takes an
individual approach to each project, flexible structuring of the transaction based on the
capabilities and the needs of the project. Quantitatively, the role of the bank is determined by the
volume and the variety of banking products offered within the project financing - from project
Page 43
Academy of Strategic Management Journal Volume 15, Special Issue 4, 2016
38
loans to equity and hedging of interest and currency risks. The main banking product within the
project financing remains the project credit, which is determined by a high proportion of debt
financing of the project (90%). At the same time, banks are increasingly involved in the capital
of project companies, especially international banks and development banks. Also, banks are
developing a wide range of products being necessary for successful and effective realization of
the project. Qualitatively, the role of bank is determined by its effect on the economy and
consists in the development of banking products to facilitate the effective reproduction.
Strengthening of the project values in society creates a solid foundation for enhancing the role of
the banks involved in project financing.
The specificity of project financing predetermines the need to focus on risk management.
For successful realization of the project, it is necessary to pay attention to risk distribution
between the project participants, which is the most important principle of project financing. The
bank must monitor the quality of risk management by various stakeholders.
ACKNOWLEDGEMENTS
The work is performed according to the Russian Government Program of Competitive
Growth of Kazan Federal University.
REFERENCES
Abramov D.V. (2009). Organization of the Project Financing in Constructing the Objects of Properties and Estate in
Russia. Abramov D. V. Finances and Credit, 37.
Finnerty J. D. (2006). Project financing. Asset-based financial engineering., JOHN WILLEY & SONS, INC,. –
с.569
Nevitt P. Fabozzi F. (1995). Project Financing, Euro-money Publications, 678 с.
Tsykunov А. V. (2009). Economic Evaluation of the Effectiveness of Technology in Oil and Gas Production: The
Author’s Abstract of Dissertation for Candidate of Economic Sciences. Tsykunov А. V. Izhevsk,.
Yearbook (2007). Ibbotson Associates, Т. Copeland, Т.Kotler, J. Murrin “Company Cost” the 4th edition 2005.
Page 44
Academy of Strategic Management Journal Volume 15, Special Issue 4, 2016
39
MANAGEMENT OF INNOVATIVE PROJECTS ON THE
ORGANIZATION OF PRODUCTION AND
COMMERCIALIZATION OF ENERGY-EFFICIENT
PRODUCTS
A. M. Fatkhiev, Kazan Federal University
M. P. Postalyuk, University of Management “TISBI”
L. N. Safiullin, Kazan Federal University
ABSTRACT
This article discusses the management theory and methodology relating to the economic
efficiency of an innovative project on the organization of production and commercialization of
energy-efficient heat-insulated pipes for the housing and communal services of Russia and its
region - Tatarstan. The study has been aimed at analyzing the assessment methods for the
economic efficiency of an innovative project on the organization of production and
commercialization of energy-efficient heat-insulated pipes for the housing and communal
services of Russia and its region - Tatarstan. The singularity of the study is firstly, a positive
innovative management solution made by Teplopipe, LLC for the design, organization of
production and sales of heat-insulated pipes was justified; such pipes are designed to ensure
energy saving efficiency in the housing and communal services in Tatarstan; secondly, a
feasibility study was made for the organization of production of heat-insulated pipes with
Tatarstan's planned quantities; thirdly, the risk factors of this innovative project and the methods
to reduce them were justified; fourth, variative possibilities were determined as to survival of
Teplopipe, LLC; such possibilities relate to the production, commercialization and application of
heat-insulated pipes in a possible crisis.
Key Words: Energy Saving, Heat Saving, Energy Efficiency, Innovative Project, Investment
Support, Housing and Communal Services, Economic Efficiency
INTRODUCTION
The global economic crisis has made the energy saving topic one of the major challenges
of the 21st century. Currently, Russia consumes for heating one square meter of housing 6-8
times as much energy resources as in the developed countries of the world.
The level of citizen’s life greatly depends on the solution of this problem. Russia does not
only have the essential natural resources and intellectual capacity to solve its energy problems,
but it is also objectively a resource base for the European and Asian countries; it exports oil,
petroleum products and natural gas in the volumes strategically important for the importing
countries. However, with a large volume of fuel and energy resources the Russia's strategy
should not include the energy wastage, as the most important factor for the competitiveness of
Russian goods and services is an energy-efficient economic management in the open market
economy. Therefore, it is unlikely to achieve sustainable growth in the gross domestic product
(GDP) not having radically changed the attitude towards energy and resource saving and not
Page 45
Academy of Strategic Management Journal Volume 15, Special Issue 4, 2016
40
having reduced the energy intensity of production. The energy saving should be a strategic goal
and a method of ensuring the countries’ energy security, as well as a way of saving when using
the hydrocarbon raw materials.
The high priority Russian authorities’ regulation in the field of energy saving represents
the Federal Law of the Russian Federation as of November 23, 2009 "On Saving Energy and
Increasing Energy Efficiency, and on Amendments to Certain Legislative Acts of the Russian
Federation", according to which the energy efficiency is implementation of organizational, legal,
technical, technological, economic and other measures aimed at reducing the amount of used
energy resources while maintaining the appropriate useful communicative and synergetic effect
from their use (including the volume of production, works, and services). (Antonyvech et al.,
2010)
The definition of the concept "energy saving" incorporates its strategic goal, which is to
increase the energy efficiency in all sectors, settlements and in Russia in general. The aim is to
search and select the spheres and measures for ensuring this increase.
We believe that such sphere in Russia is energy efficiency in the housing and communal
services (HCS). The ongoing structural changes in Russia in the past decade that take place in all
economic sectors have necessitated the market transformation exactly in this critical survival
industry and exactly by means of energy-saving technologies. The current situation is
characterized as critical. This is due to the influence of external and internal factors and a
number of problems accumulated in the pre-market period and resulting from certain market
reforms. Unfortunately, the level of the industry’s efficiency does not meet the modern
requirements. It accumulated the problems, which solution should be accelerated, because it is
one of the most important spheres of life of the population. The critical fundamental problems of
the Russian HCS include the restructuring of the investment process through the introduction of
innovative energy-saving technologies. That's it, in our opinion that should be preferred and
declared a high priority in the long-term and short-term housing and communal innovation
policy of Russia.
Implementation of innovative projects in the field of energy saving requires a prior
monitoring of the regional energy consumption (such as electric and heat power, water, etc.). Its
results will provide a choice of the main directions of investments in innovation based on the
identified reserves of savings or excessive resource consumption. This work presents short main
results of the feasibility study relating to the organization of production and sale of the items
aimed at heat saving, namely, heat-insulated pipes. (Blyakhman, 2013)
The implementation of energy-saving technologies should be motivated with trilateral
agreed and self-organized terms and conditions: for the authorities, which define the game rules
in the industry; for the business, a private investor, who comes into the industry; for the society,
which should have a dynamic socio-ecological-economic balance.
METHODS USED TO STUDY
To achieve this goal systematic and synergetic methods have been applied to assess the
economic efficiency of an innovative project on the organization of production and
commercialization of the heat-insulated pipes ensuring the economic efficiency of energy saving
in the housing and communal services. These methods allowed determining the innovative
project’s systemic effectiveness, which can be obtained in the process of self-organization of the
innovative interaction among the business, authorities and society in this sphere. The practical
Page 46
Academy of Strategic Management Journal Volume 15, Special Issue 4, 2016
41
model of the innovative project on the organization of production and application of heat-
insulated pipes was implemented using a SWOT-analysis and economic experiment. Application
of these methods allowed determining and calculating the design and experimentally derived
indicators to measure the economic efficiency of the organization of production and
commercialization of heat-insulated pipes ensuring the energy efficiency in the housing and
communal services: net present value of the project (net discounted income) (NPV); internal rate
of return (yield) (IRR); profitability index (PI); payback period (simple - PP and discounted -
DPP). As a result of the calculation, the considered indicators made, respectively: NPV –
USD 975.395.8; IRR - 69%; PI – 1.91; payback period, years – 2.46.
The obtained data show the accuracy and efficiency of an innovative management
solution on the organization of production and commercialization of heat insulated pipes
ensuring the energy saving efficiency in the housing and communal services of Russia and its
regions.
RESULTS
Current State of Heat Supply in Tatarstan
The analysis revealed that as of 01.10.2015 1,916 heat supply sources functioned with a
total capacity of 6.7 thous. Gcal/h in Tatarstan; they supplied heat energy to the population and
budget organizations and produced 9,045.2 thous. Gcal of heat energy.
In 2015, the heat losses amounted to 3,495.0 thous. Gcal or 10.2% of the total amount of
heat supplied to the network for various reasons of imperfection of the heat networks in
Tatarstan. The length of heat networks requiring renovation totaled 904.1 km (or 25% of the total
length), of which 606.4 km are dilapidated networks. Between 2009 and 2015, more than 200 km
of networks, of which 150.4 km dilapidated, were replaced.
Currently, the program On Saving Energy and Increasing Energy Efficiency in the
Republic of Tatarstan for 2010-2020 is implemented in Tatarstan. Its main tasks are:
1. decrease in the specific consumption of electric and heat energy;
2. reduction in the energy resources losses in production and consumption;
3. decrease in anthropogenic impact on the environment.
This Program has a section "Energy Efficiency in Housing and Communal Services and
Housing Facilities", which provides for some repair measures in relation to the housing and
communal networks ensuring heat supply of houses and industrial facilities: replacement of
existing pipes, in particular, hot water supply and heat pipes.
As of January 1, 2015, a need exists to replace more than 1,500 km of pipes. General
wear and tear of the heat networks exceeds 40% in Tatarstan. 15-20 km of heating mains are to
be replaced every year, but actually only 6-8 km of heating mains are re-laid. The main reasons
for this situation embrace the imperfection of processes in the housing and communal services in
Tatarstan and Russia in general.
Innovative Heat Saving Technologies in Tatarstan
The contemporary period is filled with intelligent technologies that contribute to the
savings and durability of manufactured products. The category of innovative products, which are
Page 47
Academy of Strategic Management Journal Volume 15, Special Issue 4, 2016
42
introduced in Tatarstan for the heat saving program implementation, includes pre-insulated
polyurethane foam (PUF) pipes. The innovation and advantages of heat-insulated pipes are that
the polyurethane foam retains heat in the network and saves the energy consumption by several
times compared to a traditional pipeline. Heat losses account for only 2%, whereas those of
conventional pipes reach the value of 20%. In addition, the polyurethane foam is resistant to
extreme temperatures, and it can be used even in areas of permafrost and extreme heat.
Depending on the laying area, the products are available in three types: for hot, cold and
temperate areas differing in thickness of the insulating layer and the price. The products are
resistant to the damaging effects of aggressive environment and excessive humidity.
PUF pipes are environmentally friendly, especially when molding the PUF not freon, as
before, but water or other advanced expanding agents are used as an expanding agent.
PUF pipes are easy to lay; there is often no need in unlined canals and wells, which
significantly reduces the mounting cost by 1.2 times and accelerates the introduction of objects
into operation in 2-3 times. Easy maintenance and availability of the products allows reducing
the operating costs by 8-10 times. Due to the high reliability and durability, the maintenance
costs of heating mains decrease by almost 3 times. Furthermore, the PUF pipes are very durable.
Their approved service life is at least 30 years. The study of pipes being used in Western
countries for decades shows that their service life exceeds 50 years. (Vagizova, 2011)
Meeting the needs of Tatarstan in this type of pipes requires mass rather than
experimental production for their release.
Feasibility Study of Innovative Project
According to the innovative project’s feasibility study, the planned quantities of
production and commercialization of Teplopipe, LLC heat-insulated pipes makes 75 km of pipes
per year. The expected income from their sale will be more than USD 4,577.
Calculation of indicators for assessing the economic efficiency of the innovative project
under consideration confirms its feasibility. The assessment was carried out using such indicators
as: 1. net present value of the project (net discounted income) (NPV);
2. internal rate of return (yield) (IRR);
3. profitability index (PI);
4. payback period (simple - PP and discounted - DPP), year.
Table 1 presents calculation of the planned revenues and expenditures from the
production and commercialization of Teplopipe, LLC heat-insulated pipes.
Page 48
Academy of Strategic Management Journal Volume 15, Special Issue 4, 2016
43
Table 1
PLAN OF TEPLOPIPE, LLC REVENUES AND EXPENDITURES
USD
Indicators
Total: 2014 2015 2016 2017 2018
1. Sales revenue 1,731,861 2,932,764 4,329,652 4,329,652 4,329,652 17,653,579
2. Cost of goods
manufactured 1,673,681 2,294,876 3,152,605 3,080,084 3,080,084 17,653,579
3. Taxes before
income tax 100,421 137,693 189,156 184,805 184,805 796,880
4. Income tax -8,448 100,039 197,578 212,952 212,952 715,074
5. Net income
(projected
revenue)
-33,793 400,156 790,312 851,810 851,810 2,860,295
Table 2 shows the calculation of the innovative project’s economic efficiency.
Table 2
INDICATORS OF ECONOMIC EFFICIENCY OF TEPLOPIPE, LLC INVESTMENT AND
INNOVATION PROJECT
Description of indicators
Total:
2014 2015 2016 2017 2018
Initial indices
1. Effect of investment
activities, USD -1,078,184
2. Effect of operating activities,
USD 104,537 538,485 928,641 990,139 990,139 3,551,941
3. Flow of real money, USD -973,647 538,485 928,641 990,139 990,139 2,473,757
The same, cumulative total -973,647 -435,162 493,479 1,483,618 2,473,757
4. Discounted flow of real
money, USD -811,373 373,948 537,408 477,498 397,915 975,395.8
Calculated indices
5. Net present value of the
project 975,395.8
(NPV), USD
6. Internal rate of return 69%
(IRR), %
7. Profitability index (PI) 1.90
8. Payback period, year 2.47
For reference only:
discount factor at the discount
rate of 10% 0.8333 0.6944 0.5787 0.4823 0.4019
Page 49
Academy of Strategic Management Journal Volume 15, Special Issue 4, 2016
44
Below are the considered indicators resulted from calculation:
1. Net present value of the project (NPV), USD - 975,395.8
2. Internal rate of return (IRR) - 69%
3. Profitability index (PI) - 1.91
4. Payback period, year - 2.46
The obtained data indicate that the calculated indicators meet the necessary criteria for a
positive innovative management solution.
Innovative Project’s Risks and Methods to Reduce Them
Risk analysis in the production of PUF pipes by Teplopipe, LLC showed that the
company can use the following methods to reduce the risks:
1. diversification, which implies an increase in the number of project participants, suppliers and
customers (can be used if this method does not lead to increased organizational and transport costs);
2. insurance, which involves: insurance of the company’s property from natural disasters; insurance of
the products shipped from the company for the period of transportation (if products are delivered to
a Teplopipe, LLC costumer); vehicle insurance; health insurance.
3. compensation (redundancy) suggesting the creation of certain reserves: financial, material and
information. The acquisition of additional information (for example, by carrying out more detailed
marketing research) can be considered as information resources. Financial reserves are organized by
allocating additional resources to cover unforeseen expenses. Stock of raw materials, materials and
components can serve as the material reserves.
Analysis of the innovative project’s sensitivity to the risk factors was performed under
the following conditions:
1. decrease in production quantities by 10%;
2. increase in material costs by 10%;
3. increase in investment costs by 15%.
The sensitivity of production to these risk factors was assessed by the results of changes
in such indicators of the innovative project’s efficiency as the net present value of the project
(NPV), internal rate of return (IRR), and profitability index (PI), and payback period.
The calculations revealed that the greatest negative impact on the project results has a
potential 10% increase in prices for materials. The project is less sensitive to a possible 10%
reduction of the production quantities. The possible increase in investment costs by 15% had the
least influence, as the rise in prices of equipment leads to increased depreciation charges.
As a result of the quantitative assessment of risk impact on the project, one can say that
none of the risks has a critical impact on the innovative project’s implementation. These risks
within the calculated limits do not pose a threat to the created production. (Gazizullin et al.,
2012)
In order to prepare the company's development strategy in crisis conditions, the main
factors of external and internal environment affecting the innovative project’s viability were
analyzed. Our own SWOT-analysis demonstrates that the company has substantial strong points
that enable it to survive in a crisis. They include its variative possibilities: enter new domestic
markets in such regions of Russia as Mari El, Chuvashia, Ulyanovsk region with low prices,
Page 50
Academy of Strategic Management Journal Volume 15, Special Issue 4, 2016
45
extend the range of products, export the products to foreign markets, and/or enhance the
production quantities by increasing the construction volume in Tatarstan and other regions of
Russia and abroad. Compact equipment, which can be easily dismantled, reduces the threat of
dependence from a lessor and indicates the production mobility. High profitability of the project
lowers a threat of increasing the bank loan interest. High rates of the innovative project’s
efficiency reduce the threat of no profit. (Kvon and Khamidullin, 2012)
CONCLUSIONS
The analysis showed that the management level of a positive innovative solution requires
the identification of factors that influence the innovation activities of business, authorities and
society in specific space-time dimensions, whether it is the city of Kazan, Tatarstan, Russia or
other territorial entities. In order to implement certain energy-saving technologies, efficiency of
the organization of production and sale of pipes ensuring heat saving in the housing and
communal services was calculated. The calculation results confirm a high degree of generality
and feasibility of investment resources in this innovative project. It should be noted that
implementation of this project will provide obtaining the economic efficiency to the business,
authorities and society in specific space-time dimensions. Further development of the project
involves effectiveness not only because of creation of the production, but also because of its
further implementation in constructing the heat-protected pipelines; this is caused by the
advantages of PUF pipes, which have been presented above. Implementation of this project in
the construction of a pipeline for the housing and communal services’ facilities, as well as
industrial enterprises will provide economic benefits on the following positions:
1. savings in the construction of heat-insulated pipes;
2. cost reduction in the current and capital repair of a pipeline;
3. savings from the heat loss reduction, etc.
According to the calculations carried out by authors of the article, the specific economic
benefits (per 1 km of pipes) are about USD 100 thousand. The amount of the expected effect
from the introduction of pipes per the planned production quantities will be USD 5.5 million for
the calculation period.
As noted above, the innovative project’s attractiveness rating for an investor is measured
by such indicators as the profitability index, payback period, net present value, and others.
However, the social component of this innovative project is generally of special importance
within specific space-time dimensions, because it allows reducing tensions on the labor market.
The project will create new jobs, decrease environmental tensions in the region and improve the
efficiency of interaction between the business, authorities and society.
ACKNOWLEDGEMENT
The work was performed according to the Russian Government Program of Competitive
Growth of Kazan Federal University.
Page 51
Academy of Strategic Management Journal Volume 15, Special Issue 4, 2016
46
REFERENCES
Antonyvech S.V., Finik S.N., Kotov V.V. (2010). Implementation of programs on saving energy and increasing
energy efficiency in HCS. Energy Saving, 7.
Blyakhman L.S. (, 2013). Industrial policy - the basis of transition to a new model of economic growth. Problems of
Modern Economy, 1(45).
Gazizullin F.G., Gazizullin N.F., Gazizullin T.N. (2012). Innovative thinking – is vital for modernization of the
Russian modern economy. Problems of Modern Economy, (3).
Kvon G.M., Khamidullin F.F. (2012). Evaluation of risks of innovative projects in the HCS system: quantitative
aspect. Problems of Modern Economy, (1).
Vagizova V.I. (2011). Communicative and Synergetic Efficiency of Mechanisms of Financial and Credit Guarantee
of Innovative Cooperation of Business Entities in Real and Financial Sectors of the Energetic System of the
Republic of Tatarstan. Bulletin of Economic Sciences, Law and Sociology, (3).
Page 52
Academy of Strategic Management Journal Volume 15, Special Issue 4, 2016
47
INNOVATIZATION OF PLANNING INSTITUTIONS IN
THE SYSTEM OF RUSSIAN ECONOMIC
MANAGEMENT
A. M. Fatkhiev, Kazan Federal University
M. P. Postalyuk, University of Management “TISBI”.
L. N. Safiullin, Kazan Federal University
ABSTRACT
The article focuses on the importance of innovatization of planning institutions in the
system of Russian economic management, describes the continuous planning as an alternative to
periodical planning, as well as the collaborating system of institutions affecting the management
efficacy in the Russian economy and an institutional form of struggle with losses produced by
both positive and negative factors of management. The study has focused on the importance of
innovatization of planning institutions in the system of Russian economic management, described
the continuous planning as an innovative alternative to traditional periodical planning, as well
as the collaborating system of institutions affecting the management efficacy in the Russian
economy and an institutional form of struggle with losses produced by both positive and negative
factors of management. The originality of the study is that the innovatization of planning
institutions has been presented as a process of accumulation, preservation, use and development
of the innovation potential of institutions in the system of collaboration among the business,
authorities and society in the Russian economic management. A thesis is substantiated on the
need for replacement of traditional institutions of periodic planning by innovative continuous
planning institutions. It is proved that such replacement increases the efficiency of the
institutional forms of struggle with losses produced by both positive and negative factors of the
Russian economic management.
Key Words: Innovatization, Institutions, Continuous and Periodical Planning, Management,
Monitoring, Regulation, Positive and Negative Factors and Losses
INTRODUCTION
Studying innovatization of planning institutions in the system of state economic
management is a fundamentally new holistic approach to the study of the dynamic collaboration
among the business, authorities and society in the part of the national institutional matrix, in
which institutional management traps occur. Their appearance is connected with the use of
alternative institutions and the emergence of correspondent losses caused by an inefficient norm.
In the "periodic planning - continuous planning" pair, the periodic planning in the
management of socio-economic objects, in particular, an enterprise and country's economy
served for a long time as the only object of development in the economic science, and it’s ideal
form called a "formal planning" in the western management was mainly developed. The
continuous planning as an alternative to the periodic planning actually existed in the form of a
"vague" image formed on the noticed shortcomings of the formal planning. In this case, the term
Page 53
Academy of Strategic Management Journal Volume 15, Special Issue 4, 2016
48
"continuous planning" was used, albeit on a small scale, but it meant: 1) operational planning
representing not an adjustment but a specification of periodically devised plans of different
levels, for example, planning using a rolling wave method being trendy now, 2) the same
periodic planning, but with adjustment of a plan within a planning period on certain dates (for
example, a 5-year planning with adjustment of a 5-year plan in planning for the following year).
Only in recent years, the term "continuous planning (or its variants)" has come into general
scientific use in the interpretation of a norm of planning being alternative to the periodic
planning. In such interpretation, the term "continuous process of strategic development" is used,
for example, in the article "From the traditional strategic planning to a continuous strategic
development" by Franklin & Grant (2005). In this case, the drawbacks of studies on continuous
planning are from the perspective of this study: 1) focus on planning at the levels of management
of an association of enterprises (companies) and below, 2) lack of a clear definition of
"continuous planning", 3) insufficient analysis of losses caused by periodic planning.
METHODS
Theoretical and methodological basis of this study is the author's position, according to
which the effective innovatization of planning institutions in the economic management system
is possible thanks to a dynamic replacement of periodic planning institutions by continuous
planning institutions, that will provide protection against institutional traps in this sphere of
collaboration among the business, authorities and society (Postalyuk, 2014).
The continuous planning is characterized as an activity that ensures timely decisions or
measures. So, the above article contains, in particular, a case when Boeing made a decision after
a sadly remembered event of September 11, 2001 related to the dismissal of 30,000 employees;
such decision was not envisaged in the strategic plan, and at the same time it is noted that "in its
essence, this decision has been a timely management response to the threat. The response, which
allowed the company to save millions of dollars" (http://www.franklin-
grant.ru/ru/news2/data/news_06/2005_10/2005100). In fact, the same continuous planning
characteristics are reflected in such result for a company as "continuous improvement", which
the Western author S. Arbogast mentions in his article "Budgeting: why continuous planning is
so important for the permanent success (2005) (Arbogast, 2012). In this case, the vague
definition of continuous planning consists in unclear interpretation of timeliness.
The continuous planning is also characterized as an activity that responds directly to the
actions of competitors’ market forces. For example, as noted in the article "From the traditional
strategic planning to the continuous process of strategic development" in Franklin & Grant
(2005), "the nature of behavior of markets and competitors prevailing in the modern world is
creating new threats and opportunities, which are not taken into account in the traditional
strategic planning. When these threats and opportunities arise, managers cannot and should not
wait for a next planning cycle" (http://www.franklin-
grant.ru/ru/news2/data/news_06/2005_10/2005100). In S. Arbogast’s article "Budgeting: why
continuous planning is so important for the permanent success (2005), continuous planning is
characterized as an activity, which results in the "changes in accordance with the requirements of
market forces" (http://www.franklin-grant.ru/ru/news2/data/news_06/2005_10/2005100). In this
case, the vague definition of continuous planning consists in unclear interpretation of market
forces’ and competitors’ actions, on which the continuous planning directly reacts.
Page 54
Academy of Strategic Management Journal Volume 15, Special Issue 4, 2016
49
Several attempts have been made in the domestic science only recently to give an
adequate general definition of the continuous planning, which relates to all levels of economic
management. For example, the K.N. Lebedev’s work "Analysis of the constituent entity’s
economic activity as an instrument of state economic management" (2013) formulated a general
(i.e. related to the national economic management as well) concept of adequate current
management as the management based on the identification of problematic situations as they
occur and the corresponding decision-making as such situations are identified (Lebedev, 2013);
its features can be extended to such part of the management as planning. According to this, an
adequate, or continuous, planning consists in making decisions with identification of problematic
situations that are revealed so far as they occur. In his work "Problems and Prospects of the
Science of Economic Analysis" (2103) K.N. Lebedev gave a relevant direct and general
definition of the continuous planning (with regard to the company management): "...Adequate
strategic management is based on the continuous planning, which consists in adjustment of the
company's program plan (program) in process of identification of relevant problematic situations
that are identified so far as relevant factors of the company's activity occur" (Lebedev, 2013).
Thus, timely decisions and measures mean those that are taken in (adequately carried out)
process starting immediately after the identification of corresponding problematic situations
(evidence of factors), and actions of market forces and competitors, which need an immediate
response, mean those of their actions that form certain problematic situations (set for each
managed object).
In such a manner, so far an idea of continuous planning as an effective norm contrasted
with periodic planning has been formed in the science (for simplicity, the functions themselves
will be called the norms, as G.B. Kleiner calls them). This allows to make the periodic planning
an object of study in the theory of institutional traps. (Budovich, 2011)
RESULTS
It is proved in studying this issue that the planning implies drafting (adjusting) the plan of
a managed object (company, industry, economy of constituent object of the Federation, national
economy, etc.), during which its main goals (mission, strategic goals) are changed, or clarifying
the general plan. Planning is one of the traditionally specified management functions in a row
"planning, organization, motivation, coordination, control". Adjustment of the managed object’s
plan, which does not affect its main goals (i.e. making adjustment decisions - decisions related to
measures ensuring the managed object’s movement towards the goals set in the planning), is an
element of regulation comprising, in addition to this adjustment, management (in this case -
adjustment) actions as well. Regulation, together with monitoring of external and internal
environment of a managed object, forms a "control" management function.
An adequate type of planning (in this respect) is a continuous planning. Continuous
planning consists in adjusting the managed object’s general plan in the process of identification
of relevant factors of its operation (i.e. factors that require adjustment) revealed as they become
available, or, in other words, in adjusting the general plan so far as relevant factors appear. If a
plan has a planning horizon that goes beyond a current year (a year, in which an adjustment is
made), then not only a current year’s plan, but also plans of following years are to be adjusted. It
should be noted that the managed object’s operation factors mean phenomena in the object’s
external environment (external factors) and in the processes of the object itself (internal factors),
on which appearance a management subject should directly respond with decision-making
Page 55
Academy of Strategic Management Journal Volume 15, Special Issue 4, 2016
50
processes to ensure its most effective operation. The factors (including, in the form of evidence
of their presence, or problematic situations) are identified in monitoring the managed object’s
external and internal environment; this process consists in observing this environment and
comparing the fact with the standards. (Zembatova, 1990)
The (effective) norm of monitoring, which is associated with continuous planning, is the
continuous monitoring, i.e. monitoring, which also takes place continuously (or with an
allowable frequency). Such monitoring can be defined as a monitoring process, which consists in
the identification of factors so far as they occur (ideally - as in many cases their consequences
are revealed, and, which factors are behind them, often becomes clear only in the course of
decision-making processes). It is understood that the continuous planning is impossible beyond a
continuous monitoring of the environment of the object’s activity. It is worth noting that a
continuous monitoring in conjunction with a continuous planning and relevant management
actions constitute an adequate current management of a socio-economic object.
The institute of regulation linked with a continuous planning, i.e. making adjustment
decisions or decisions ensuring the movement towards the goals set in the planning, and
implementation of appropriate management actions (regulation plus monitoring form control)
means a regulation that does not lead to deterioration of (less efficient) activities of a managed
object, even if such regulation is possible because there is no goal to achieve the main goals at all
costs. It should be noted that the regulation causing a corresponding deterioration is not possible
if the main goals of the managed object’s operation exhaust the criteria of its effectiveness. For
example, if the company’s main goals are income and profitability of the invested capital, which
simultaneously act as exhaustive effectiveness criteria of the company’s activity, the regulation
leading to the company's deteriorated activity is impossible, since in this case it turns into
planning. Accordingly, in the circumstances where the main goals do not exhaust the managed
object's effectiveness criteria the regulation that impairs an activity of such object is possible.
Thus, there should also be a conjugation between a continuous planning and effective norm of
the main goal selection, which ensures inclusion therein of the goals reflecting the managed
object’s effectiveness. (Meskon, 2004)
The periodic planning in a form opposite to a continuous consists in the adjustment of a
plan within specifically established dates, for example, once a year before the beginning of the
next calendar year (clear that if a plan of the object’s activity has a planning horizon that goes
beyond a current year, not only the current year’s plan but also the plans of the object’s activity
in the coming years should be also adjusted). Periodic monitoring carried out immediately prior
to adjustment of a plan means a (an ineffective) norm of monitoring associated with periodic
planning. In this case, the periodic planning can be based on continuous monitoring of the
external and internal environment of the managed object’s operation, i.e. on the effective norm
of monitoring.
The periodic planning can involve both efficient and inefficient norm of regulation. An
ineffective norm of regulation associated therewith is a regulation related to the prevention of an
impact of negative factors on an object or the compensation for it at any price (but not within the
resources allocated to regulation); i.e. such regulation leads to a decrease in the managed object’s
effectiveness. It should be recalled here that the condition of its action is a failure to include all
the criteria of managed object’s effectiveness in its main goals. Suppose that the sales volume,
rather than income and costs, belongs to the managed object’s main goals. Below an example of
regulation is given, at which the object’s activity is getting worse. Suppose that this object deals
with the execution of budget orders. One of the customers intended not to cooperate with this
Page 56
Academy of Strategic Management Journal Volume 15, Special Issue 4, 2016
51
object any more. Let us assume that the impact of this factor on the object’s activity has been
prevented by entering into an agreement with an appropriate customer’s representative about
constant payment of compensation for an order given to this object. In the conditions when costs
and parameters of the object’s activity calculated on their basis are not included in the object’s
main goals, a corresponding change would not alter the managed object’s main goals, although it
will reduce its efficiency. This inefficient norm of regulation can act in the conditions of both
effective norm of monitoring (continuous monitoring) and its alternative (periodic monitoring).
The considered inefficient norm of regulation represents the same struggle for a plan, but it
differs from the one carried out in the planning process, because the main goals are not changed
during it (because of the use of ineffective norm of the main goal selection). (Vagizova, 2009)
It may seem that modern enterprises operating in the market conditions do not use such a
norm of regulation as the struggle for a plan on the grounds that the companies’ main goals
include, as a rule, all effectiveness criteria, first and foremost, income and profitability of the
capital invested in a company. However, this is not true. The point is that the private costs of
companies, which are reflected in the effectiveness criteria, do not always correspond to the
social costs associated with its operation, primarily, due to the fact that companies are able to
enhance the labor exploitation, at least until the next revision of employment contracts. In this
case, the struggle for a plan during regulation is largely linked to the labor costs. In this
connection, the companies have an opportunity to fight for a plan through an increase in labor
costs, which is not reflected in the efficiency of their activity. (Robbins, 2004)
Not only the analysis of losses caused by the periodic planning, but also its actual
application (so far at enterprises and their associations) indicate ineffectiveness of the periodic
planning. Like any inefficient activity initially implemented through a propaganda and
artificially created trend, the annual strategic planning and its preceding periodic monitoring at
firms and companies have turned to a formal measure. The main elements of the strategic
periodic planning naturally became formal measures as well. As written in the work "Analysis of
the strengths and weaknesses of the company" published in our country in 2004, the Western
authors P. Dzhenster and D. Hussey, "... management of many companies has reduced the task of
assessing their strengths and weaknesses to the insignificant and formal annual ritual..."
(Dzhenster, 2004). Exactly the same experience, however, quite some time ago, had economic
analysis in its traditional interpretation.
CONCLUSIONS
In the "periodic planning - continuous planning" pair, the science traditionally dealt with
the periodic planning, while the continuous planning as an alternative to the periodic one actually
existed in the form of a "vague" image formed on the noticed shortcomings of the formal
planning. The term "continuous planning" itself was used, albeit in other respects. Only in recent
years, the term "continuous planning” has come into general scientific use in the interpretation of
a norm of planning being alternative to the periodic planning; its adequate definition has been
given – an activity aimed at adjustment of a program plan of the managed object’s activities in
the process of identification of relevant problematic situations revealed so far as corresponding
factors of its activities appear. This allowed determining the periodic planning as a stable
ineffective form and making the planning an object of study in the theory of institutional traps. In
its pure form, the periodic planning is impossible; it is actually a periodic planning and informal
adjustment of a plan within a planning period. The latter does not provide for the best measures,
Page 57
Academy of Strategic Management Journal Volume 15, Special Issue 4, 2016
52
since, in particular, a reaction to negative factors implies unconditional ensuring the achievement
of the most important goals, which is called the struggle for a plan.
The (effective) continuous monitoring and effective regulation serve (within the resources
allocated to regulation) as norms of monitoring and regulation associated with a continuous
planning. The periodic planning may involve both the effective monitoring and regulation, and
inefficient norms - periodic monitoring (that includes a forced continuous monitoring) and
regulation resulting in reduced effectiveness of the object’s activity in connection with the
requirement to ensure movement towards the set goals "at any cost".
The concept of losses caused by the periodic planning is not sufficiently developed in
science. So, traditionally only such losses from the formal planning are specified as losses from a
failure to use positive factors from the moment when it becomes possible, and losses caused by
negative factors due to delaying development and taking measures in the belief that the negative
factors will disappear and the time of their impact will be prolonged until the plan’s official
adjustment.
Types of losses from the periodic planning based on positive factors are stated below.
They are caused by 1) failure to use them from the moment when it becomes possible, 2)
inadequate use because of development of such measures, which do not affect the most
important main goals, 3) instruction to develop certain measures to lower management, 4) late
detection of factors – at association with the periodic monitoring, 5) inability to use positive
factors by the time of the plan’s official adjustment, 6) the fact that at the time of adjusting the
plan still valid unused positive factors can be used effectively, 7) the fact that during the plan’s
official adjustment the losses stipulated in Clause 2 and 3 cannot be eliminated completely.
Types of losses based on negative factors are given below. They are caused by 1) the fact
that measures developed during a plan’s forced adjustment are aimed at absolute ensuring the
achievement of the most important main goals (in the form of a struggle for the plan), 2) the fact
that the regulating measures are associated with a reduced effectiveness of the object’s operation,
3) instruction to adjust a plan to lower management within a planning period, 4) late detection of
the factors during a plan’s forced adjustment - at association with the periodic monitoring, 5)
delaying development and taking measures in response to the early identified factors in the belief
that the negative factors will disappear and the time of their impact will be prolonged until the
plan’s official adjustment, 6) the fact that the impact of some negative factors on a managed
object cannot be prevented by the time of the plan’s official adjustment.
ACKNOWLEDGEMENT
The work was performed according to the Russian Government Program of Competitive
Growth of Kazan Federal University.
REFERENCES
Arbogast S. Budgeting: why continuous planning is so important for the permanent success [Electronic resource]
IntersoftLab. Business Process Management Journal (online), 2005, 29.08.2005, URL:
http://www.iso.ru/rus/document6127.phtml (date of application: 10.04.2012).
Budovich Yu.I. (2011). The multidimensional nature of the subject of economic theory. Yu.I. Budovich, M.: MAX
Press, 155 p.
Dzhenster P. (2004). Analysis of the strengths and weaknesses of the company: identifying strategic opportunities.
Translated from English P. Dzhenster, D. Hussey, M: Williams House, 368 p.
Page 58
Academy of Strategic Management Journal Volume 15, Special Issue 4, 2016
53
From the traditional strategic planning to the continuous process of strategic development [Electronic resource]
Franklin & Grant. URL: http://www.franklin-grant.ru/ru/news2/data/news_06/2005_10/2005100... (date of
application: 12.11.2014).
From the traditional strategic planning to the continuous process of strategic development [Electronic resource]
Franklin & Grant. URL: http://www.franklin-grant.ru/ru/news2/data/news_06/2005_10/2005100 (date of
application: 12.11.2014).
Lebedev K.N. Analysis of the constituent entity’s economic activity as an instrument of state economic management.
K.N. Lebedev Russia and the modern world: key challenges and solutions in the economic, legal and social
spheres. Proceedings of the International Scientific and Practical Conference. Edited by O.V. Inshakov,
G.B. Kleiner, V.V. Sorokozherdyeva, Z.M. Khasheva, Krasnodar: YUIM (Southern Institute of Management),
2013, pp. 272-280.
Lebedev K.N. (2013). Problems and Prospects of the Science of Economic Analysis. K.N. Lebedev, M.: MAX Press,
600 p.
Meskon M.H. (2004). Fundamentals of Management, Translated from English. M.H. Meskon, M. Albert,
F. Hedouri, M.: Delo (Business), 800 p.
Postalyuk M.P. (2014). Innovatization of spatial structures of development in economic systems. Problems of
modern economy, 3, 34-38.
Robbins S.P. (2004). Management Translated from English. S.P. Robbins, M. Coulter, M.: Williams House, 880 p.
Vagizova V.I. (2009). Infrastructural support of innovative collaboration among business, government and society in
the modern economy. Modern Economic Problems, 3, 17-21.
Zembatova B.V. (1990). Planning: simple and complex truths. B.V. Zembatova, M.: Nauka (Science), 144 p.
Page 59
Academy of Strategic Management Journal Volume 15, Special Issue 4, 2016
54
ANTI-CORRUPTION POLICY OF THE REPUBLIC OF
TATARSTAN
Vyacheslav N. Ageev, Kazan Federal University
Ekaterina A. Khuzina, Kazan Federal University
ABSTRACT
The object of study of this article is the anti-corruption policy of the Republic of
Tatarstan.
The aim of this study is to study the regulatory legal acts of the Republic of Tatarstan,
forming the legal basis for anti-corruption policy of the Republic.
The article states that the development of anti-corruption legislation of subjects of the
Russian Federation has followed the path of advancing the formation of anti-corruption
legislative framework of the federal level, which ultimately has given rise to certain problems of
law enforcement nature.
In the process of writing this article we have been using both the scientific methods of
research (logical analysis and synthesis, functional and historical-legal methods) and special
methods.
The research methodology includes primarily the regulatory legal acts of the Russian
Federation, the Republic of Tatarstan, as well as the papers of Russian scientists; the
international experience on the issue has been also studied.
As a result of the study the authors conclude that currently almost all regional
legislation, including in the Republic of Tatarstan, is brought into line with the federal
legislation in the field of anti-corruption; and it is necessary to carry out a permanent set of
measures of the legal, socio-economic and educational nature for the effective implementation of
the anti-corruption policy both in the regions and the federal center.
Key Words: Corruption, Anti-Corruption Policy, Regional Anti-Corruption Policy, Anti-
Corruption, Anti-Corruption Legislation, the Republic Of Tatarstan
INTRODUCTION
Corruption is a phenomenon that reflects the level of development of the society itself, as
well as the state and the entire legal and political system. Corruption is born, exists and changes
at the same time with the state and its institutions.
V. Cope notes that corruption as an anti-social phenomenon has a destructive impact on
all legal institutions, with the result that the established rules of law are replaced by the rules
dictated by the individual interests of those who are able to influence the representatives of
government authority and are ready to pay for it (Koop, 1998).
It is obvious that the fight against corruption should be one of the priorities of state policy
(it should be noted that based on the content of many regulatory legal acts, it is really so).
Understanding the experience of fighting against corruption is essential, taking into
account an attempt to improve the anti-corruption policy in the public authorities, including at
the legislative level.
Page 60
Academy of Strategic Management Journal Volume 15, Special Issue 4, 2016
55
METHODS
In the process of writing this article we used the general methods of scientific knowledge.
The specifics of this theme led to the use of formal-legal and comparative-legal research
methods. Thus, the formal-legal method was used in determining the methodological aspects of
the anti-corruption policy in the Russian Federation and the Republic of Tatarstan. The
comparative-legal method was used in the analysis of international experience on the subject
under study, as well as for the analysis of various provisions of the regulatory legal acts of the
Russian Federation and the Republic of Tatarstan.
The empirical base of the research includes primarily the regulatory legal acts of the
Russian Federation, the Republic of Tatarstan, as well as the scientific studies of Russian and
foreign scientists.
MAIN PART
Currently, there are a lot of scientific papers devoted to the anti-corruption issues. Several
foreign authors have devoted their researches to various aspects of the organization of
counteraction to corruption practices in the government and judicial authorities (Arnim, 2003;
Bradley, 1998; Hodgkinson, 1997).
At the same time at the study of anti-corruption policy, which is highlighted in the papers
of many legal scholars, it is actually not fully developed the scheme, which would determine
such important aspects of development and implementation of the anti-corruption measures as:
disclosure of anti-corruption policy and its social properties; definition of the content and the
implementation mechanism of anti-corruption measures; comprehensive analysis of anti-
corruption policy and its relations with other areas of legal protection of the citizens' rights and
freedoms - criminal, administrative, disciplinary, civil, etc.
In this regard, the main direction of state policy in the sphere of state and public security
provision should be an improvement of the legal regulation to prevent and fight against
corruption in the long term (Sukharenko, 2013).
Investigation of the role of anti-corruption policy shows that it is one of the priority
directions of the state policy and aims to fight against corruption, to define the main vectors of
activity of the state in the future, to develop the measures to fight against corruption, to identify
and overcome its social component.
The legal concept of anti-corruption policy is a fundamental structural unit, which
connects all other elements of the state-legal mechanism of fighting against corruption with
direct real forms of its manifestation. It reflects the real-existing phenomenon and introduces it
within the legal framework (Idrisova, 2012).
Anti-corruption policy - is a science-based, systemic lawmaking activity and the activity
of civil society institutions aimed at fighting against and preventing corruption in order to reduce
its negative impact on the life of the state, society and citizens, associated with the elimination of
causes and conditions that contribute to its occurrence (Tashchilin, 2016).
The objectives of the anti-corruption policy are the most comprehensive fair protection of
rights and freedoms of individual persons and legal entities, strengthening the rule of law,
increasing the level of legal culture.
At the same time, it should be noted that each subject of the Russian Federation has its
own peculiar certain specifics of corruption risks, as well as its own system of corrupt practices
and methods of their implementation. In this connection, it should be noted that the effective
Page 61
Academy of Strategic Management Journal Volume 15, Special Issue 4, 2016
56
solution of the problems in the field of fighting against corruption in the activity of public
authorities and local self-government authorities of a certain subject of the Russian Federation
depends on the development and implementation of a set of measures to fight against corruption,
taking into account the requirements of the current legislation and the specifics of each region
(Korotkova, 2012).
It should also be noted that the development of anti-corruption legislation of subjects of
the Russian Federation has followed the path of advancing the formation of anti-corruption
legislative framework of the federal level, which suggests the formation of a complex legal
regulation of fighting against corruption.
The researchers note that, given the importance and necessity of fighting against
corruption, as well as seeing the inaction of the federal public authorities in this field, the
separate regional public authorities and their senior officials began to form their own legal
frameworks for fighting against corruption, including their own regional anti-corruption
legislation (Bikmukhametov, 2008).
Such subjects of the Russian Federation include also the Republic of Tatarstan, where its
own republican Law "On Fighting Against Corruption in the Republic of Tatarstan" has been
already in force from May 2006 (whereas a similar law has be adopted only at the end of 2008 at
the federal level).
The Law of the Republic of Tatarstan "On Fighting Against Corruption in the Republic of
Tatarstan" and regulatory legal acts adopted on the basis of it include the typical mechanisms of
fighting against corruption at the republican level, which subsequently have been taken by other
subjects of the Russian Federation, which have adopted the similar legal acts. In general, the
regional anti-corruption program of the Republic of Tatarstan is, without exaggeration, one of
the best programs.
In the most general terms it should be noted that in the Republic of Tatarstan the
specialized anti-corruption bodies are established; the measures for the prevention of corruption
practices are actively implemented at the level of ministries and departments, as well as the local
self-government authorities; the activity of public authorities and local self-government
authorities becomes more accessible and open; the methodical work is carried out to ensure
fighting against corruption, etc.
The analysis of the regulatory legal framework of the Republic of Tatarstan enables to
conclude that the main emphasis is made on expanding the arsenal of anti-corruption means
within the fight against corruption in the Republic, using for this purpose the political, legal,
economic, organizational and educational measures. The main measures include:
1. adoption of the Anti-Corruption Policy Strategy of the Republic of Tatarstan. The Strategy was
adopted in order to organize an effective fight against corruption, to eliminate the causes and
conditions generating it, to ensure the rule of law in the activities of public authorities of the
Republic of Tatarstan;
2. the Law of the Republic of Tatarstan dated May 4, 2006 No. 34-ZRT "On Fighting Against
Corruption in the Republic of Tatarstan";
3. the Resolution of the Cabinet of Ministers of the Republic of Tatarstan dated October 16, 2013 No.
764 "On Approval of the State Program "Provision of Public Order and Combating Crime in the
Republic of Tatarstan for 2014-2020";
4. planning work on fighting against corruption both in the whole Republic and in the ministries,
municipalities (see, for example, the Resolution of the Executive Committee of the Municipal Unit
of the City of Naberezhnye Chelny of the Republic of Tatarstan dated November 18, 2014 No. 7047
"On Approval of the Municipal Program "Implementation of Anti-Corruption Policy of the
Municipal Unit of the City of Naberezhnye Chelny for 2015-2020";
Page 62
Academy of Strategic Management Journal Volume 15, Special Issue 4, 2016
57
5. creation of a special body under the President of the Republic of Tatarstan, coordinating and
directing the preventive anti-corruption activities. Such body in the Republic is represented by the
Commission for Coordination of Fighting Against Corruption in the Republic of Tatarstan,
established in accordance with the Decree of the President of the Republic of Tatarstan dated
October 13, 2015 No. UP-986 "On the Commission for Coordination of Fighting Against Corruption
in the Republic of Tatarstan". The Commission for Coordination of Fighting Against Corruption in
the Republic of Tatarstan is a permanent coordinating body under the President of the Republic of
Tatarstan. The Commission shall perform the functions assigned to the Commission to comply with
the requirements for the official behavior and to settle the conflict of interest in respect of persons,
holding the public offices of the Republic of Tatarstan, for which it is not otherwise provided by the
federal law or the laws of the Republic of Tatarstan, and to consider the relevant issues in
accordance with the procedure established by the President of the Republic of Tatarstan;
6. introduction of the administrative regulations and standards for the provision of public services to
the individual persons and legal entities, reducing the level of corruption (the Resolution of the
Cabinet of Ministers of the Republic of Tatarstan dated November 2, 2010 No. 880 "On Approval of
the Procedure for Development and Approval of Administrative Regulations for the Provision of
Public Services by the Executive Public Authorities of the Republic of Tatarstan and on
Amendments to Certain Resolutions of the Cabinet of Ministers of the Republic of Tatarstan";
7. carrying out the anti-corruption expertise of regulatory legal acts and draft of the regulatory legal
acts in accordance with both the federal and regional legislation;
8. implementation of anti-corruption propaganda and creation of a system of anti-corruption education.
Thus, according to Article 12 of the Law of the Republic of Tatarstan dated May 4, 2006 No. 34-
ZRT "On Fighting Against Corruption in the Republic of Tatarstan", the purpose of anti-corruption
education is the acquisition of knowledge, skills and competence on the detection and prevention of
corruption offenses, formation of intolerance to corruption manifestations in the society, increasing
the level of legal awareness and legal culture. And the anti-corruption education is implemented
through the students' training under the additional educational programs approved by the Ministry of
Education and Science of the Republic of Tatarstan.
In addition, in this direction the agency of mass communication "Tatmedia" holds an
annual republican competition "Corruption: Journalist Opinion", the purpose of which is to
identify the journalists, who cover the issues on prevention and fighting against corruption in the
best way in the media of the Republic of Tatarstan.
Another way to fight against corruption is to participate in the anti-corruption civil
society institutions (inclusion of the public representatives to the audits made by the public
authorities, conduct of the sociological surveys of citizens about the prevalence, forms of
corruption and its most affected areas). In the anti-corruption legislation of most regions of the
Russian Federation, it is expressly stated that the public authorities and local self-government
authorities shall cooperate with the civil society institutions on the anti-corruption issue. For
example, in the legislation of the Republic of Tatarstan the cooperation in the sphere of anti-
corruption means the impact of various anti-corruption subjects, including the public authorities
and the local self-government authorities, as well as the civil society institutions on each other.
This impact shall pursue a common goal - a reduction of corruption level in the public
administration system (Kabanov, 2012).
An effective tool to increase the efficiency of anti-corruption measures implemented has
become the Decree of the President of the Republic of Tatarstan dated March 23, 2011 No. UP-
148 "On Measures for the Organization and Implementation of Monitoring the Effectiveness of
Activity of the Executive Authorities of the Republic of Tatarstan, Territorial Bodies of the
Federal Executive Authorities in the Republic of Tatarstan, Local Self-Government Authorities
of Municipal Districts and Urban Districts of the Republic of Tatarstan on Implementing the
Anti-Corruption Measures in the Territory of the Republic of Tatarstan", jointly developed by
Page 63
Academy of Strategic Management Journal Volume 15, Special Issue 4, 2016
58
the Presidential Anti-Corruption Policy Department of the Republic of Tatarstan and the
Committee for Socio-Economic Monitoring of the Republic of Tatarstan, as well as the
corresponding Decree of the Cabinet of Ministers of the Republic of Tatarstan.
As noted above, the regional anti-corruption legislation has been developed ahead of the
federal one. At the same time the consequence of this trend was represented by the differences in
the definition of concepts used in the federal regulatory legal acts on fighting against corruption
and in the regulatory legal acts of subjects of the Russian Federation that created additional
difficulties in the course of law enforcement activities.
However, it should be noted that at present almost all the regional legislation, including
in the Republic of Tatarstan, is brought into line with the federal law in the field of fighting
against corruption.
Summing up, it is possible to make some conclusions.
There is no doubt that one of the key means of fighting against corruption is the law as a
mean of regulatory legal impact, aimed at overcoming and preventing the occurrence and
development of corruption (Borgen Jan, 2005).
The basis of anti-corruption measures should be the legislation, taking into account the
international anti-corruption standards and anti-corruption experience in foreign countries.
As T.Ya. Khabrieva notes rightly, all public authorities should be aimed at improving the
law enforcement system, provision of effective implementation of laws and other legal acts, full
implementation of the powers of any bodies and organizations in the fields of public and private
law, protection of rights and legitimate interests of the citizens. This requires the development of
specific system of indicators that illustrate the effectiveness of the implementation of the legal
regulations (Khabrieva, 2012).
The law effectiveness is not equal to a simple aggregate of the effectiveness of individual
legal regulations and institutions, because the law is not limited to their amount. To ensure the
effectiveness of law it is necessary to constantly carry out a set of measures of the legal, socio-
economic and educational nature. When implementing purely legal measures it is necessary to
select those legal means, which contribute to achieving this goal. This includes the scientific
support of law-making and the new procedures of implementation of laws, etc.
RESULTS
The result of the study conducted is a statement of the following provisions:
1. corruption is a phenomenon that reflects the level of development of the society itself, as well as the
state and the entire legal and political system.
2. understanding the experience of fighting against corruption is essential, taking into account an
attempt to improve the anti-corruption policy in the public authorities, including at the legislative
level.
3. the regional anti-corruption policy is aimed as a whole at the implementation of the federal anti-
corruption policy;
4. in order to implement the anti-corruption policy in the Republic of Tatarstan the specialized anti-
corruption bodies are established; the measures for the prevention of corruption practices are
actively implemented at the level of ministries and departments, as well as the local self-government
authorities; the activity of public authorities and local self-government authorities becomes more
accessible and open; the methodical work is carried out to ensure fighting against corruption, etc.;
5. the analysis of the regulatory legal framework of the Republic of Tatarstan enables to conclude that
the main emphasis is made on expanding the arsenal of anti-corruption means within the fight
Page 64
Academy of Strategic Management Journal Volume 15, Special Issue 4, 2016
59
against corruption in the Republic, using for this purpose the political, legal, economic,
organizational and educational measures.
SUMMARY
Based on the analysis of anti-corruption legislation of the Republic of Tatarstan, as well
as the situation in the field of fighting against corruption, which prevails in the Republic, it
should be noted that the anti-corruption policy of the Republic should be developed in the
following areas:
1. organization of work to bring the republican law and municipal regulatory legal acts into conformity
with the federal legislation, because of the need to improve the governance in the field of fighting
against corruption;
2. bringing available to the public of the information on corruption offenses admitted by the officials of
the public authorities and local self-government authorities and on measures taken by the public
authorities for the implementation of both the republican and federal anti-corruption policy;
3. prevention of the emergence of corruption crimes, as well as reducing the conditions conducive to
the emergence of corruption practices;
4. improvement of the efficiency of cooperation between the public authorities and local self-
government authorities with the civil society institutions;
5. consistent application of the existing legal and educational measures aimed at fighting against
corruption.
ACKNOWLEDGEMENTS
The work is performed according to the Russian Government Program of Competitive
Growth of Kazan Federal University.
REFERENCES
Arnim, Hans Herbert von. (2003). Korruption. Netzwerke in Politik, Amtern und Wirtschaft. Munchen: Rowohlt
Verlag,
Bikmukhametov A.E. (2008). Gaps in the Tatarstan Anti-Corruption Legislation: Understanding the Regional
Experience . A.E. Bikmukhametov, R. R. Gazimzyanov, P. A. Kabanov. Business Security, 1, 7 – 10.
Borgen Jan. (2005). What is corruption? Collection of anti-corruption materials. – Oslo : ELSA,. – P. 11.
Bradley A. W. (1998). Parliamentary privilege and the common law of corruption : R. v. Greenway and others Publ.
law. L.Autumn, 356 – 363.
Hodgkinson P. (1997). The sociology of Corruption. Sociology, 31(l), 17 – 35.
Idrisova S.Z. (2012). The Concept and Legal Nature of Anti-Corruption Policy. S.Z. Idrisova . Russian Investigator.
20, 21 – 27.
Kabanov P. A. (2012). Some Forms of Cooperation Between the Civil Society Institutions and Local Self-
Government Authorities in the Field of Anti-Corruption. P. A. Kabanov. Administrative and Municipal
Law, 5, 5 – 8.
Khabrieva T.Ya. (2012). Corruption and Law: Doctrinal Approaches to the Problem Statement. T.Ya. Khabrieva
Journal of the Russian Law, 6, 5 – 17.
Koop V. (1998). Corruption. Parliament, 2, 9 – 10.
Korotkova O. I. (2012). Corruption and its Manifestations in the Public Service System - as One of the Most
Relevant Problems of Russian Reality . O. I. Korotkova . Government and Local Self-Government, 3, 22 –
25.
Sukharenko A.N. (2013). Anti-Corruption Policy in Russia: State and Problems. A.N. Sukharenko. Legal World, 11,
15 – 19.
Tashchilin M.T. (2016). On the Concept of Anti-Corruption Policy in Judicial System of the Russian Federation
M.T. Tashchilin. Russian Investigator, 1, 45 – 49.
Page 65
Academy of Strategic Management Journal Volume 15, Special Issue 4, 2016
60
CONCEPT OF DEVELOPMENT OF AN
ENTREPRENEURIAL CULTURE IN THE
HOSPITALITY INDUSTRY ENTERPRISES OF THE
REPUBLIC OF TATARSTAN
G. A. Abulhanova, Kazan Federal University
G. R. Chumarina, Kazan Federal University
D. S. Shakirova, Kazan Federal University
ABSTRACT
This paper presents the role of an entrepreneurial culture in the management system to
improve the efficiency of the hotel business enterprises in Tatarstan. Currently, the Republic of
Tatarstan has become one of the most attractive tourist destinations not only in Russia, but also
abroad, that certainly confirms the relevance of this study. Popular hotels of the city of Kazan:
"Shalyapin Palace Hotel", "Safar-Hotel" and "Regina" were made the objects of the study.
Survey and subsequent analysis of its data used in the capacity of a research method.
It was revealed that the organizational culture as an institutional framework of modern business
is characterized by focusing on maximum customer satisfaction, innovations, productivity,
independence and entrepreneurial attitude, quality, labor and product safety, and customization.
Based on substantiation of the motivational mechanism for development of
organizational culture in hospitality industry enterprises, we have developed an adaptive
strategy of organizational culture "implantation" into a company of hospitality industry that
shapes the entrepreneurial style of behavior, initiates staff efforts to achieve final results and the
efficiency with feedback system.
Practical application of the developed strategy enhances the effectiveness of labor efforts
of hospitality industry enterprise employees.
Key Words: Entrepreneurial Culture, Management System, Hotel Business, Staff Motivation
INTRODUCTION
As known, there are a lot of factors that determine the effectiveness of management
system of the hospitality industry enterprises. Among them the entrepreneurial culture factors,
the task of which is to give businesses a humane, socially oriented and culturally mediated
nature, become very significant.
Business viability has become defined by its flexibility, dynamism and adaptability to
environmental requirements. Now, a company is already regarded as an "open" system focused
on results. There is a need in transition to a new approach in the management of organizations
based on the entrepreneurial culture as an integral component of the entrepreneurial system.
This approach to management opens new possibilities for building an effective
organization; however, upon transition to it, a company will inevitably face with the complex
problems of the theoretical, methodological and applied nature. Analysis of these problems leads
to the understanding of a need to address the most important of them: creation of a technique of
transition to the management based on the entrepreneurial culture. Changes in the economic,
Page 66
Academy of Strategic Management Journal Volume 15, Special Issue 4, 2016
61
political and other spheres of life in the Russian society led to the transformation of the external
and internal environment of a company: the system of values, norms, rules and principles that
make up the social world has radically changed. Today, as in other crisis periods for the society,
loss of landmarks in activity of individuals becomes especially apparent; the status of the public
life subjects remains uncertain. These processes can be characterized as a crisis of values
necessary for a person to make a selection of his/her behavior patterns within the hospitality
industry firms.
It is extremely important to consider the organizational culture as a means (instrument) to
improve the efficiency of hospitality industry enterprises in connection with implementation of
the concept of "human capital" which affects the quality of services (Ivanov, 2003).
The entrepreneurial culture management strategies, its development and regulation should
help to solve many of the complex problems faced by the staff of hospitality industry enterprises,
in particular, improving the quality of services, enhancing the cohesion and unity of a team,
development of acceptable behavior forms and technology of works executed.
The hospitality industry companies which, for the realization of their objectives, employ
many workers and affect as a result of their activities the interests of other people, have to reckon
with the consequences of the impact of their operations. (Abulkhanova, 2011)
Entrepreneurial culture is considered by us as an effective management tool in
contributing to the achievement of business goals. Entrepreneurial culture is expressed in the
behavior of employees and their attitude to work. The system of values that are shared by
employees, and their skills, united in individual and collective efforts lead a company to the
intended results.
Existing entrepreneurial culture in a company shapes the behavior of employees and their
attitude to work. The efforts of employees lead to certain results of their activity: financial,
manufacturing, marketing, and social outcomes. According to the feedback system, the results
should be compared with the planned objectives that allow determining the effectiveness of the
costs incurred. Depending on the performance efference of remuneration for work of employees
is carried out that forms the degree of satisfaction or dissatisfaction with the job performance and
reward, and affects the further efforts of employees. (Kobelev and Simulation, 2013)
The value of an entrepreneurial culture for development of enterprise management
system of the hospitality industry is determined by several factors. First, it gives employees an
organizational identity, defines intragroup vision of the company, and is an important source of
stability and continuity in the organization. This creates among employees a sense of security of
the organization and their position in it, and contributes to formation of a social security sense.
Second, a basic knowledge of a company's corporate culture helps new employees to correctly
interpret the events taking place in the organization, defining all the most important and
significant in them. Third, more than anything else, the organizational culture stimulates self-
awareness and a high responsibility of an employee. Recognizing and rewarding such people,
organizational culture identifies them as role models (inspirational persons) (Abulkhanova et al.,
2016).
METHODS
The study of entrepreneurial culture at the enterprises of hotel business in Tatarstan was
conducted by us to identify problems and make recommendations for its improvement. The
objects of the study were three hotels: "Shalyapin Palace Hotel", "Safar-Hotel", and the hotel
Page 67
Academy of Strategic Management Journal Volume 15, Special Issue 4, 2016
62
"Regina". The study was conducted based on a questionnaire for hotel employees in the
following areas:
1. The attitude of staff to the entrepreneurial culture of the hotel. Such issues were studied as
understanding by the staff of the hotel mission, their perception of the content and implications of
organizational culture and other issues.
2. Motivation of employees in the hotels as a necessary part of an entrepreneurial culture. Such issues
were studied as the dependence of wages on the employee's job performance and satisfaction with
the current remuneration system.
The results showed that all respondents consider an entrepreneurial culture as extremely
important for the activity of a hospitality industry enterprise, but the majority of employees
(75%) understand the culture only at its surface level: tradition, corporate celebrations, rituals,
symbols. 25% of respondents could not even formulate the concept of organizational culture.
(Paley, 2012)
Among the positive aspects of the current organizational culture, employees of
"Shalyapin Palace Hotel" complex called availability of a corporate style in the interior of the
hotel, rationally organized system of training the newly arrived employees. The employees of
"Safar-Hotel" noted the following positive features of the organizational culture: availability of
brand marks and holding corporate events.
"Regina" hotel staff identified the following positive features of the current
organizational culture: tradition to celebrate holidays, in particular day of hotel birth;
competitions of professional skills; issuance of various products with company logo (calendars,
letterheads, pens, etc.); permission for employees to use the services of the hotel complex:
swimming pool, gym.
Along with the positive aspects of the current organizational culture, disadvantages also
were noted in the respondents' answers. We cannot say that these shortcomings immediately
have a negative impact on the effectiveness of the control system, but may affect negatively in
the near future.
We asked respondents to identify the main positive and negative factors that shape
behavioral patterns of labor behavior at the enterprises of hotel business. The following
responses (table 1) were received. (Sinyavets, 2015).
In the service sector where they work with a client face to face, there cannot be a question
about the high quality of service if employee satisfaction indicators are low. An important factor
in job satisfaction is an employee involvement in the organization. An involvement is much
deeper than a motivation. The motivation must be demonstrated to the company management,
and involvement is a characteristic of the staff that is often expressed in a deep emotional
commitment, even devotion to the goals and values of the organization. Namely, involvement
generates within an employee pride in the fact that he or she works in the organization, that he or
she is a part of the conglomerate (it does not matter, a large conglomerate or not) (Balashikha,
2014)
Page 68
Academy of Strategic Management Journal Volume 15, Special Issue 4, 2016
63
Table 1
SPECIAL FEATURES OF ORGANIZATIONAL BEHAVIOR OF STAFF AT THE ENTERPRISES OF
HOTEL BUSINESS
Features of organizational
behavior
The meaning and description
Positive image of the hospitality
industry
A special high service environment providing the
necessary emotional impact on the staff
Using behavior patterns Active introduction of international experience in the
hotel business into Russian practice, the opportunity to
study abroad
Work and train The ability to combine work with studies
Staff overloading Many employees in the hospitality industry have
complained for excess hours, overtime, night shifts.
Absence of really working system of
mentoring and staff rotation
A mentor should not only "put" a young specialist at
any position, but also to train him/her providing
his/her career growth.
Importance of this concept for the hospitality industry is expressed; above all, in the
ability of the staff to overcome the difficulties associated with the performance of his/her
professional duties. (Spiridonov, 2015)
Processed study materials on motivation assessment suggest that there are some problems
in the surveyed hotels. In the studied organizations there is no practically a system of motivation
and stimulation of the personnel. This is evidenced by the following data. Being asked with the
question of whether you are satisfied with wages and material incentives, the following results
were obtained. According to the survey, it is possible to judge that the motivation of employees
in the hospitality industry has not been developed effectively.
When analyzing the survey of hotels employees there were revealed major problems in
the enterprise management systems related to the attitudes of employees to the organizational
culture of hospitality business enterprises. The employees mostly understand under the
organizational culture its surface level: corporate events, logo, and uniforms. From our point of
view, the employees undervalue such properties of an organizational culture as maintenance of a
system of values and positive traditions, solidarity, joint efforts. The absence of an effective
organizational culture in enterprises cause a number of other issues, particularly the problem of
supply of qualified personnel and the problem of motivation. (Chumarina, 2014)
On this basis, we concluded that it is necessary to implement a model of highly efficient labor
behavior motivation for employees in enterprises of the hospitality industry (see Figure 1).
RESULTS
Highly effective labor motivation strategy for employees of hospitality industry
enterprises is aimed at:
1. Evaluation of the labor contribution effectiveness of employees;
2. Creation on an enterprise the environment promoting to high efficiency implementation of labor potential
of managers and specialists;
3. Parity protection and promotion of the rights of highly motivated managers who organize a highly
effective personal work and work of subordinates;
4. Guarantee of the maximum possible working life quality level at the given level of development of
society, industry, and organization;
Page 69
Academy of Strategic Management Journal Volume 15, Special Issue 4, 2016
64
Figure 1
MODEL OF MOTIVATING HIGHLY EFFECTIVE WORK BEHAVIOR OF HOSPITALITY INDUSTRY
EMPLOYEES
According to the proposed model, working efficiency of an employee (9) is mediated by
the results of the employee work (8) and depends on several variables: labor output (3) and labor
input (4) (these are not equivalent, because the effort does not always correspond to the effective
labor contribution, a part of them may be useless or even harmful), the personal qualities of an
employee (6), and a comprehensive assessment of the role of an employee in the enterprise (7)
(Fig. 3).
The level of an employee labor output (3) depends on the importance of (valence) of the
expected remuneration (1), on individual estimation of the probability of connection between a
labor output and remuneration (2); the level of labor contribution of an employee (4) depends on
the individual assessment of the probability of connection between a labor contribution and
remuneration (5). The individual working results (8) are directly related to the employee's work
dedication (3). The operating results of the organization, subordinate division or team are related
with working results and the labor efficiency of an employee (9).
ТО - В
13 +
Formation
negatively
motivated
employee behavior
FPM (–)
12 –
– dissatisfaction
U+ –
12 +
+ Satisfaction of
administrative
activity
13 +
Formation of
positive behavior
motivated
employee
FPM (+)
5 Estimating the
probability of labor
input connection -
compensation
ТВ - В
2 Estimating the
probability of labor
output connection -
compensation
1
The significance of the
remuneration for the
employee (valence)
ВЛ
7
Comprehensive
assessment of the
role of the worker
in the enterprise
О
4
Labour input of
staff
ТВ
3
Work efficiency of
staff
ТО
6
Personal qualities
of employees
КL
8
The results of the
individual nature of the
employee
РI
9
The effectiveness of the
employee in the overall
results of the organization
РК
10b
External employee
remuneration
Вext
10а
Internal employee
remuneration
Вint
11
Rewards are perceived
as fair
В
Page 70
Academy of Strategic Management Journal Volume 15, Special Issue 4, 2016
65
The dotted line between the labor productivity (8) and a remuneration perceived by an
employee as fair (11) shows the individuality of remuneration justice assessment. (Hofstede,
2011)
Satisfaction from the activity (12+) is the result of a fair external (10b) and internal
rewards (10a), and dissatisfaction (12) of the unfair.
A success of the practical application of the model for labor behavior motivation of
hospitality industry enterprise employees depends on whether the specific conditions in the
organization (division) and features of a specific employee correspond to the proposed model.
The peculiarity of the proposed model for labor behavior motivation of hospitality
industry enterprise employees is caused by that it brings together labor output figures, the real
labor contribution of an employee to the objective effectiveness of the organization as a whole.
Building a model for labor behavior motivation should increase the efficiency of labor
efforts of hospitality industry enterprises employees.
Rational sequence of building a motivation model in the hospitality industry may be as
follows:
1) study of typical conditions in trade enterprises for a social procurement on the model adequate to them;
2) assessment of the state - the phase of development of the organization and its motivational potential;
3) identification by testing, expert assessment and other methods of the extent to which the developed
model corresponds to the real situation in an enterprise;
4) finding a set of deviations and evaluation of the extent and nature of their removability;
5) periodic assessment of economic effect for modeling.
No organization will operate efficiently if at the level of a region, industry, ownership, or
an individual firm, or its affiliates, an effective motivation model motivating staff productivity in
achieving specific goals will not be developed.
DISCUSSION
Grounded on the above, it must be concluded that the entrepreneurial culture
management strategy based on the model of highly effective work behavior of hospitality
industry employees, its development and regulation should help to solve many of the complex
problems faced by the staff of hospitality industry enterprises, in particular, improving the
quality of service delivery, strengthening of team cohesion and unity, development of acceptable
forms of behavior and technology of works executed.
So, the basic theoretical conclusions derived from the analysis of entrepreneurial culture
of the hospitality industry companies, are brought to the creation of scientific and practical
recommendations for its formation and development. These findings can be used to improve the
management system of hospitality industry enterprises based on an entrepreneurial culture.
ACKNOWLEDGEMENTS
The work is performed according to the Russian Government Program of Competitive
Growth of Kazan Federal University.
Page 71
Academy of Strategic Management Journal Volume 15, Special Issue 4, 2016
66
REFERENCES
Abulkhanova, G.A. (2011). Organizational culture: from tradition to modern entrepreneurship. Actual problems of
Economics and Law, 3, 29 -36.
Abulkhanova, G.A., Demchenko, S.G., Morozov, I.G. (2016). Assessment and creation of a showroom image that is
located in a major city. Proceedings of the Free Economic Society of Russia, 198, 40 - 46.
Balashikha, E.A. (2014). Hospitality. How to achieve the perfect service. - Moscow: LLC "Vershina", 99-117.
Chumarina, G.R. (2014). On structural features of promotional activities at the stages of the reproductive process.
Bulletin of RGTEU, 1(81), 66-74
Hofstede G. H. (2011). Culture's consequences: Comparing values, behaviors, institutions, and organizations across
nations (2nd ed.). Thousand Oaks, CA: Sage Publications, 48-54.
Ivanov, M.A. (2003). The organization as your tool. Russian mentality and business practices. M.A. Ivanov, D.M.
Shusterman. - M: Alpina-Publisher, 350.
Kobelev, N.B. (2013). Simulation: A Tutorial N.B. Kobelev, V.A. Polovnikov, V.V. Devyatkov; Under the general
editorship of N.B. Kobelev. - M.: KURS: INFRA-M, 297 p.
Paley, T.F. (2012). Typology of state innovation policy models. T. F. Paley, Innovative environment; problems of
formation and development prospects: summary of the report on the All-Russian scientific-practical
conference - Kazan, 70-72.
Sinyavets, T. (2015). The management system as an object of control. T. Sinyavets, HR manager. Human Resource
Management. 5, 96 - 104.
Spiridonov, I.A. (2015). International competition and ways to improve the competitiveness of the economy of
Russia: Textbook . I. A. Spiridonov - M.: INFRA-M, 262 p.
Page 72
Academy of Strategic Management Journal Volume 15, Special Issue 4, 2016
67
ECONOMIC FORECASTING AND PERSONNEL
MANAGEMENT OF SMALL AND MEDIUM
ENTERPRISES
G.A. Abulhanova, Kazan Federal University
G.R.Chumarina, Kazan Federal University
E.G. Nikiforova, Kazan Federal University
T.A. Sharifullina, Kazan innovative university
ABSTRACT
Development of small and medium-sized businesses and the environment in which they
operate are essential for the successful development of the country. Small and medium
entrepreneurial activity is primarily an institution that provides the employment. The problem of
formation of high-quality and efficient use of the staff of small and medium enterprises is the
most relevant in the modern world. Therefore, the development of methodological approaches to
the management and forecasting of entrepreneurial staff is an urgent topic of the study.
Search techniques of extrapolation, trend and econometric models, the normative target
method. The method for predicting entrepreneurial staff allowing making recommendations in
training for small and medium-sized businesses has been formulated.
The methods of forecasting human resource capacity for small and medium-sized
enterprises have been offered.
It is manifested in the possibility to increase the accuracy of forecasting parameters for
training of small and medium-sized businesses.
Key Words: Small and Medium Entrepreneurship, Methods of Management, Forecasting,
Business Personnel
INTRODUCTION
Small and medium-sized companies due to their mobility and flexibility may mitigate
the negative processes in the field of employment, ensure social adaptation of employees
disengaging from large enterprises as well as create new market niches in terms of economic
growth.
At the same time, the contribution of small and medium-sized businesses to the overall
economic performance in Russia is much lower than in most not only developing but also
developed countries.
For forecasting of training, retaining and advanced training of personnel for enterprise
system, it is requires the studies of quantitative and qualitative characteristics, including the
definition of forecasting demand.
At the same time economic forecasting should be considered as the system of scientific
research of quantitative and qualitative character, aimed at identifying the trends in the
development of economic relations and the search for optimal solutions to achieve the goals of
this development. (Abulkhanova, 2011)
Page 73
Academy of Strategic Management Journal Volume 15, Special Issue 4, 2016
68
Economic forecasts of personnel of business is closely connected with other forecasts,
particularly with the measures of GDP, the number of active small and medium-sized
enterprises in the country on the whole, including in the regions of cross-section, the number of
trained personnel, the account of which, of course, increases the reliability of economic
forecasting . The important in forecasting is a selected method as well as techniques. The set of
special rules, techniques and methods is forecasting methodology, including the search methods
of extrapolation using annual average growth rates, trends and econometric models, and
normative target.
METHODS
The search forecast (or research, trend) is forecast of determining possible states of the
phenomenon in the future while maintaining the trends prevailing in the past (extrapolation).
In the medium-term forecasting of demand (from one year to 5 years), when in the
development of indicators of demand there is a stable tendency to its increase or decrease, for
predicting the state of future levels of the indicator under study, it is appropriate, in our view, to
use the indicators of average annual growth rates. The method is based on the assumption that a
number of indicators of the development of demand in time is a geometric progression. This
means that each subsequent member of the dynamic series (ai+1) is equal to the previous one,
multiplied by the average annual growth rate (kр). (Abulkhanova, 2015)
kр=
1Y
Yn n
,
where kр- average annual growth rate;
n - number of periods of dynamic series;
Yn - value Y in the reporting year;
Y1- value Y in the base year.
Forecast extrapolation of a trend is the curves of correlation and regression dependencies
based on factor analysis. It is typical for the trend to find a smooth line, reflecting time
development patterns. In this case, it is essential to use it as a main component of the forecast
time series, requiring the construction of a graph of dynamic timeline on which the function line
is mathematically defined. The line of trend in the general form for the linear dependence is
defined by the formula
у = а +bt,
where у – dependent rate (the quantity of trained personnel);
t – studied time interval;
а– parameter characterizing the effect of factors not accounted for in the model;
b – parameter characterizing the effect of the time factor on the change of dependent
indicator.
To determine the parameters, the system of equations is solved by the method of least
squares (MLS). The trends are calculated by means of equations, i.e. aligned values of demand
over the past years are determined and the forecast for the future is calculated.
In practice of the medium-term forecasting, correlation and regression or econometric
models (static and dynamic, single-factor and multi-factor) are also widely used. These models
serve as a function of demand, which use the factors determining changes in demand as
variables.
Page 74
Academy of Strategic Management Journal Volume 15, Special Issue 4, 2016
69
It is necessary to build a homogeneous dynamic econometric models of linear
relationship of the form y = a + bx, where y is a dependent variable (the number of trained
personnel); x - an independent factor (the number of small and private enterprises); and a – an
indicator of the influence of factors not accounted for in the model; b - an indicator of change in
the dependent variable (y), depending on the variation of the independent factor (x) by one unit
(in physical units).
The parameters of econometric models as well as a trend are calculated by the method of
least squares. The forecast of demand uses the indicator of elasticity expressing the dependence
of change of one factor on another state in percentage.
The ratio of demand of elasticity E is calculated according to the formula
E=x
x
y
y : ,
where у – demand for personnel;
х – the number of small and private enterprises;
– changes of indicators.
In contrast to the trend models, econometric model enables more accurately reflect the
process of formation of demand. It provides an opportunity on the basis of the available volume
and structural parameters of consumption for the past and present periods with consideration for
the influence of factors to determine the trajectory of demand for the coming period and to
calculate its key parameters. (Babeshko, 2011)
To assess the quality of the obtained trend and econometric models it is necessary to use:
1. the coefficient of determination - R^2_( 12^0 R ), which shows the changes in percentage
(variation) of resultant variable, in% (the closer to one, to more extent the factors influencing the
resultant sign are taken into account);
2. F- Fisher criterion to assess the statistical significance of the forms of communication of model. The
model is recognized meaningful if the calculated criterion value with the degrees of k1=n-1 , k2 =n-
m-1,where n - number of observations and m - number of factors included in the model, more table
value of Fisher criterion for a given level of significance; ;
3. DW- Durbin - Watson criterion to evaluate the random nature of connection of levels of a number of
remains by calculating the autocorrelation coefficient and comparing it with the theoretical table
values of criterion - the dl and du according to lower and upper limits;
4. Assessment of the significance of the regression coefficients in the model is conducted by the t -
Student criterion. Estimated value of t – the criterion with the number of degrees of freedom - k =
n-m-1 is compared with the tabular value of the criterion for a given level of significance - , and
if it is more than a table one, a regression coefficient of the model is considered to be statistically
significant.
Point forecast is complemented by interval presented in the form of confidence intervals,
reflecting the average forecast error.
The average forecasted error is calculated according to the formula
n
2^
,
where - the average forecasted error;
2^ - dispersion, defined by the formula n
yy
2)^(2^ .
Page 75
Academy of Strategic Management Journal Volume 15, Special Issue 4, 2016
70
Long-term forecasting of demand for enterprise personnel is by means of the normative-
target method. The normative forecast (or software, target) is performed to determine the ways
and time frames for achieving the possible states of an object of forecasting in future, taken as a
target.
Calculations by this method are carried out in two stages.
The first stage is determined by the average annual growth rate for the analyzed period
of time:
kр=
1Y
Yn n
.
In the second stage, one calculates the number of years of achieving the norm of
consumption under the existing growth of consumption :
kр=
1Y
Y .
where Y – given level of demand.
RESULTS
Given the development of the system of entrepreneurship in the Republic of Tatarstan
and the prospects of its growing role in the national economy as well as adequate proposals in
the field of basic training of personnel for the system of enterprise (universities, colleges, non-
governmental organizations, and others.), one can review the results and prospects of activity of
accelerated training of personnel, their retraining and advanced training, using the econometric
analysis. The organizers of the accelerated training of personnel are educational structures of the
Republic of Tatarstan, which are able on the whole to create effective demand for personnel at
their own expense as an addition to the basic training of specialists in the event of lack of their
necessary number (especially in groups of economic, legal, technological and engineering
specialties in industrial sectors). (Ilchenko, 2009)
To do this, it is essential to analyze the dynamics of the number of active small and
medium-sized enterprises (SMEs) from the point of view of the cities, regions and generally in
Tatarstan, where conventionally it is necessary to distinguish 2 group of cities, areas with
different trends of development of SMEs in the Republic, where the 1st group is characterized by
an increase in the number of active enterprises of SMEs, and in the other group it has been
declining.
Next, one is to consider the dynamics of the number of SME enterprises in Tatarstan in
general, applying an already trend econometric model by using the following indicators: the
number of active enterprises (thousand units); t - time (year) (Table 1).
Page 76
Academy of Strategic Management Journal Volume 15, Special Issue 4, 2016
71
Table 1
CALCULATION OF THE COEFFICIENTS OF THE ECONOMETRIC MODEL
Years
(2010 -2015)
Econometric models Criterion
Coefficient
Darbin-
Watson DW
(DWl=0,95
Dwu=1,23)
F-Fisher
(F4,5,0.05=5,19)
t-Student
(t5,0.05=2,02)
R^2 Э
t0 t1
Тatarstan
x = 23.955t +105,39 1,98
8,33
-2,35
3,33
0,96
0,44
Let us carry out the assessment of quality of the obtained trend model. The statistical
significance of the linear form of the equation is calculated according to the criterion of F- Fisher
(Table 1). Since F is a fact> F table (8,33> 5,19) at the 5% significance level, we can conclude
about the importance of a linear dependence.
The checking of independence of the levels of a number of remainders (no
autocorrelation) is conducted by comparing the calculated DW = 1,96 and table values DWl =
0,95 and DWu = 1,23. The estimated value of 1,96 falls within the range from 1,23 to 2,0.
Conclusion - the independence of the levels of a number of residues.
The analysis of significance of the model coefficients is performed by t-Student criterion.
As shown in Table 2, the actual value of the t-criterion of both model coefficients (t0 = -2,35 and
t1 = 3,33) exceeds the table (t 5,0,05 = 2,02), so the hypothesis of the immateriality of the
regression coefficients of the model can be rejected and they can be recognized statistically
significant. R2 = 0, 9622 shows that the change of the time factor (t) by 96% explains the change
in the number of SME enterprises.
As follows from the model, every year (2010 - 2015) the number of enterprises of SMEs
in country in general increased by 23,96 thousand units in average. The coefficient of elasticity E
= 0,44 shows that the annual increase in the number of active SME enterprises in Tatarstan
averaged 0,44%.
Also, a comparative analysis of personnel, trained for the small and medium enterprises
in Tatarstan in order to reveal the level of training, as the dynamics of the number of trained
personnel from the point of view of the cities, regions may exhibit unstable trend.
The analysis of calculated values of the criteria with tabulated data (Table 2) suggests a
statistical significance of the model on the whole. Hence, one can go to the interpretation of
coefficients of the model. If there is a tendency to increase the level of training personnel for
SMEs for 2000-2015 in the Republic of Tatarstan, the model shows that the annual number of
the trained personnel for SMEs increased by 6012,2 of people or 0,62% in an average.
Page 77
Academy of Strategic Management Journal Volume 15, Special Issue 4, 2016
72
Table 2
CALCULATION OF THE COEFFICIENTS OF THE ECONOMETRIC MODEL *
Years
(2010 -
2015г.г)
Econometric model
Criterion
Coefficient
Darbin-
Watson DW
(DWl=0,95
Dwu=1,23)
F-Fisher
(F4,5,0.05=5,19)
t-Student
(t5,0.05=2,02) R^2 Э
t0 t1
Tatarstan
y =6012,2t + 12637
2,01
11,27
2,81
3,36
0,7381
0,62
The value of R2 = 0,7381 indicates that the change in the time factor (t) by 74% explains
changes у. This figure is much lower than in the previous model, i.e. the change was
significantly influenced by other factors.
One can also analyze a statistically significant dependence and between the number of
personnel trained for SMEs (y) and the number of enterprises of SMEs (x) in country on the
whole. This relationship should be presented by means of econometric model.
Like the previous models, this model is statistically significant according to all criteria
(Table 3).
Table 3
CALCULATION OF COEFFICIENTS OF ECONOMETRIC MODEL*
Years
(2010 -
2015г.г)
Econometric models
Criterion
Coefficient
Darbin- Watson
DW
(DWl=0,95
Dwu=1,23)
F-Fisher
(F4,5,0.05=5,19)
t-Student
(t5,0.05=2,02) R^2 Э
t0 t1
Tatarstan
y =251,96x -13999
1,65
13,62
2,05
3,69
0,773
1,42
The analysis of the coefficients of the model enables to conclude that during the period
being analyzed the increase in the number of SMEs per 1 thousand units led to an increase in the
number of the trained personnel for SMEs by 251,96 people in average. The coefficient of
elasticity E = 1,42 shows that during the period under review an increase in the number of active
SME enterprises by 1% led to an increase in the number of the trained personnel for SMEs by
1,42% in average.
However, in the context of the regions of the republic there is not always a statistically
significant relation between the changes in the number of the trained personnel for SMEs (y) and
the number of active enterprises SMEs (x). This can be demonstrated by building econometric
models in terms of the regions of the republic.
As stated, a statistically significant association and its absence the studied indicators (y
and x) are observed in cities and regions of Tatarstan and Kazan itself.
Page 78
Academy of Strategic Management Journal Volume 15, Special Issue 4, 2016
73
Noteworthy is the prevailing weak inverse relationship between y and x in Kazan. From
our viewpoint, this can be explained by oversaturation with public institutions and the system of
training in the capital.
Using the models of the cities and regions included in the group of a statistically
significant relationship, one can analyze and interpret the existing stable trends of change in the
number of the trained personnel for SMEs and the number of active enterprises of SMEs. For
example: the econometric model for Naberezhnye Chelny shows:
у = 327,36х – 3182,8.
This means that for the period, an increase in the number of SME enterprises by 1
thousand units in Naberezhnye Chelny led to an increase in the number of the trained personnel
for SME by 327 people in average.
In the regions of another other group, for example in Nizhnekamsk and Zelenodolsk, the
investigated dependence does not have a marked trend. There is no the relationship between the
dynamics of the trained personnel and the number of the existing enterprises.
An analogous analysis can be performed using the models built for other cities and
regions of the group. All they are statistically significant, t. e. they can be used for further
economic analysis and forecasting.
By extrapolation method, as an example, we calculate the medium-term forecast values
(from 1 to 5 years) of the studied parameters as follows:
k1= 1Y
Yn n
= 6,125
5,2376
=1,89^ 6
1
=1,112.
The average annual rate of growth of SME enterprises for the period from 2010 to 2015
amounted to 1,112.
The forecast of this index will be: in 2016 - 264,1*1,112 = 293,7 (enterprises) and so on.
For this method, one can calculate forecasted value of this indicator from the point of
view of the cities and regions in the republic.
Also let us calculate the errors of forecast and confidence intervals for the predicted
values of the forecasted period in country on the whole
2016: n
yy
2)^(2^
= 7
01,15177
=2168,144.
n
2^
=
7
144,2168=
17,6 и т.д.
Table 4
Forecasted
years X- Forecasted
values X X+
2016 276,2 293,8 311,39
Next, let us calculate short-term and medium-term forecasted values for the number of
the trained personnel for SMEs. In 2015, the number of trained personnel for SMEs in the
Page 79
Academy of Strategic Management Journal Volume 15, Special Issue 4, 2016
74
country amounted to 44312 persons, whereas in 2000 - 8412 people, hence the existing rate of
growth of this indicator is equal to 1,319
k3=8412
443126 =5,27^
6
1=1,319.
The forecasted values of the revealed trend of this indicator are the following: in 2016 -
58492*1,32 = 77209,4 (people) and so on.
The errors of the forecast of the indicator for this forecasted period in the republic on the
whole will be following:
in 2016: n
yy
2)^(2^ =197820763;
n
2^
=
5316 and so on
Taken into account the problem posed by the government about bringing the share of
small and private entrepreneurship in the GDP in 2017 to 35,0%, using the method of forecast
estimates, we calculated the required number of personnel and active enterprises of SME. The
result revealed the following: to achieve a share of MPE in GDP by 2017 by 35,0% it is
necessary by the above educational institutions to prepare, retrain and improve the skills of 91,4
thousand and have 60,0 thousand of existing enterprises. It is necessary in this regard to continue
assessing the investment complex of Tatarstan not only for SME, but also for the education
system and personnel of business. (Kobelev, 2013)
DISCUSSION
The forecasting of development of personnel potential of the enterprise system can be
carried out using an econometric model that includes search extrapolation methods with annual
average growth rates, trends and correlations and normative target. This takes into account the
development of small and medium-sized businesses, the number of people employed in them, the
need for specialists, including those with higher education and with their advanced training.
The search and normative methods of forecasting allow making recommendations on
improvement of the level of objectivity and, consequently, the effectiveness of management
decisions in training of necessary number of personnel for small and medium-sized businesses.
ACKNOWLEDGEMENTS
The work is performed according to the Russian Government Program of Competitive
Growth of Kazan Federal University.
REFERENCES
Abulkhanova G. A. (2011). Organizational Culture: From Traditions to Modern Entrepreneurship. Actual Problems
of Economics and Law, (3), 29 –36.
Abulkhanova G. A., Chumarin G. R. (2015). Mechanisms for Ensuring the Competitiveness of Advertising in the
System of Management of Organization. Scientific Review, 22, 439-444.
Page 80
Academy of Strategic Management Journal Volume 15, Special Issue 4, 2016
75
Babeshko L. O. (2011). Foundations of Economic Modeling: Textbook. L. O. Babeshko. – The 4th edition. – М:
КоmBook, г. – 428p.
Ilchenko A. N. (2009). Workshop on Economic and Mathematical Methods: Textbook. A. N. Ilchenko, O. L.
Ksenofontova, G. V. Kanakina. – М. Finances and Statistics: INFRA – М,. 287p.
Kobelev N. B. (2013). Simulation: Textbook . N. B. Kobelev, V. A. Polovnikov, V. V. Devyatkov; Edited by N. B.
Kobelev. - М.: COURSE: INFRA-М, 2013. – 297 p.
Page 81
Academy of Strategic Management Journal Volume 15, Special Issue 4, 2016
76
MODELING OF ACCOUNTING POLICIES AS A TOOL
OF MANAGEMENT OF CORPORATE FINANCIAL
PERFORMANCE
Anna Goshunovaa, Kazan Federal University
Alexey Kirpikovb, Kazan Federal University
ABSTRACT
In this paper, a study of methodological aspects of company's accounting policies as a
tool of management of the corporate financial performance in terms of its market capitalization
and net profit. The comparative analysis of the accounting policies conducted with an example of
methods of depreciation for fixed assets showed that the choice of various depreciation methods
can lead to significant variations in the company's annual net profit indicator. The paper
presents the results of the econometric study the aim of which was to analyze the degree of
influence of separate accounting policies items on the financial performance with the example of
JSC "Transneft" to simulate accounting policies promoting to maximize the corporate financial
performance. In the course of the regression analyzes us have confirmed all the null hypotheses,
namely: it was found that the analyzed accounting policies of JSC "Transneft" (depreciation
method) affect the corporate financial performance indicators. Upon that, the greatest impact of
depreciation method was on the net profit of the company as compared to its market
capitalization. Thus, we can conclude that the modeling of accounting policies by selecting the
optimal method of accounting elements is an effective tool for a company management system.
Key Words: Accounting Policies, Financial Performance, Net Profit, Market Capitalization,
Management, Corporate Governance
INTRODUCTION
The process of formation and transformation of accounting policies requires an optimum
combination of the factors influencing it. The solution to this problem depends on the
professional judgment of an accountant which uses scientifically grounded methods, one of
which is a simulation [Dănescu et al., 2014]. The combination of the professional judgment
expression process with the use of objective and subjective factors and the modeling method in
the formation of accounting policies to the present day has not been quite fully addressed in the
scientific literature that conditions the urgency of solving this problem [Socea, 2012].
Modeling of accounting policies considered as a separate process in the formation of
accounting policies acts as a method which it is advisable to use in a professional judgment of an
accountant that is the main tool of a modeling subject [Rees & Sutcliffe, 1989].
At this stage, a professional judgment of an accountant has an important role, because this
or that interpretation affects a user's perception of accounting information formed as part of the
accounting process [Archer et al., 1995]. Accordingly, modeling of accounting policies in the
process of its formation is subject to subjective influences. This is due to the presence of many
economic interests that lead to a justification of different methodological and methodical
approaches to building the accounting and opportunity to choose accounting policies.
Page 82
Academy of Strategic Management Journal Volume 15, Special Issue 4, 2016
77
In this work we have conducted an econometric study the aim of which is to analyze the
degree of influence of separate accounting policies items on financial performance with the
example of JSC "Transneft" to model accounting policies promoting to maximize the corporate
financial performance.
In the course of the regression analyzes we have confirmed all the null hypotheses,
namely, we have found that the studied elements of the accounting policies of JSC "Transneft"
(depreciation method and written-down inventory assessment) influence on the financial
performance indicators of the company. Thus, we can conclude that the modeling of accounting
policies by selecting the optimal method of accounting elements is an effective tool for a
company management system.
However, there are some limitations for our work. The most serious limitation is a not
enough large number of observations used in the econometric analysis. In order to improve the
accuracy of estimation of the quality management system as a result of modeling the accounting
policies, our study should be based on a broader knowledge base. Despite this, the resulting
research findings are reliable because they are based on the logic of economic processes, and are
confirmed by statistically significant models.
ASSESSMENT OF THE IMPACT OF ACCOUNTING POLICIES ON THE
CORPORATE PERFORMANCE INDICATORS
A distinctive feature of the priority aspects choice for the accounting policies is the fact
that almost all alternative accounting policies affect the cost of sales rate and net profit later on.
In order to provide an economic assessment of implementation of the effective
accounting policies development model we investigated the influence of certain accounting
policies items on the financial performance indicators of JSC "Transneft", in particular, the
choice of depreciation method.
According to IFRS 16 "Fixed assets", the accounting policies may provide three methods
for calculation of fixed assets depreciation [Kulikova et al, 2015.]
1. Straight-line method;
2. Declining balance method;
3. A way to write off the cost in proportion to the volume of goods (works).
Russian accounting standards (RAS 6/01 "Accounting of fixed assets") also provide a
fourth method of depreciation: the method of writing off value according to the sum of the digits
of the years of useful life.
Using the example of a truck "KAMAZ" purchased by JSC "Transneft" in 2013, we
calculated the depreciation by all methods applicable to the asset (useful life was set to 96
months, the original cost was 9.8 mln. rubles). It has allowed us to determine the impact that the
choice of the method to charge depreciation to cost of sales, and therefore to the financial results.
Table 1 shows that for the first two years of use of the truck, much of the fixed asset cost
is written-down applying the declining balance method by 4.277 million rubles (or 44% of the
original value of the object). Upon the straight-line method, for the first two years costs would be
equal to 2.45 mln. rubles what is 25% of the original cost.
Page 83
Academy of Strategic Management Journal Volume 15, Special Issue 4, 2016
78
Table 1
THE IMPACT OF THE METHOD TO CHARGE DEPRECIATION ON FINANCIAL RESULTS OF JSC
"TRANSNEFT" (PER 1 ITEM OF FIXED ASSETS)
Years
The results using the methods to charge depreciation, mln. rubles
Straight-line Declining balance According to the sum of the digits
of the years of useful life
2014 (1.225) (2.450) (2.178)
2015 (1.225) (1.837) (1.906)
2016 (1.225) (0.153) (1.633)
2017 (1.225) (0.115) (1.361)
Extrapolating the results of the calculations for the whole group of fixed assets, including
more than 35 000 units with inventory numbers, let's calculate the effect of depreciation methods
discussed on the financial results of JSC "Transneft" using coarse simplification (Table 2).
Table 2
REPORT ON THE FINANCIAL RESULTS OF JSC "TRANSNEFT" FOR 2015 MLN. RUBLES (EFFECT
OF THE METHOD OF DEPRECIATION)
Indicator name Straight-line Declining
balance
According to the sum of the
digits of the years of useful life
Revenue 31 884.4 31 884.4 31 884.4
Cost of sales (21 081.4) (21 693.9) (21 761.9)
Gross profit (loss) 10 803.0 10 190.5 10 122.5
Selling expenses (52.5) (52.5) (52.5)
Management expenses (3 808.9) (3 808.9) (3 808.9)
Profit (loss) on sales 6 941.6 6 329.1 6 261.0
Interest receivable 2.9 2.9 2.9
Other incomes 2 162.8 2 162.8 2 162.8
Other expenses (2 769.1) (2 769.1) (2 769.1)
Profit (loss) before tax 6 338.2 5 725.7 5 657.7
Current income tax (1 872.3) (1 872.3) (1 872.3)
Change in deferred tax liabilities (156.9) (156.9) (156.9)
Change in deferred tax assets 312.4 312.4 312.4
Other (6.5) (6.5) (6.5)
Net income (loss) 4 614.8 4 002.3 3 934.3
According to Table 2 it is clear that the choice of different depreciation methods can lead
to significant variations in the annual net profit of a company.
Table 3 shows the effect of different methods to charge depreciation on the financial
profitability of JSC "Transneft".
Page 84
Academy of Strategic Management Journal Volume 15, Special Issue 4, 2016
79
Table 3
THE IMPACT OF THE METHOD TO CHARGE DEPRECIATION ON PROFITABILITY INDEX OF JSC
"TRANSNEFT" FOR 2015, %
Indicator nane Straight-line Declining
balance
According to the sum of the
digits of the years of useful life
Return on current assets (net profit /
current assets) 57.96 50.27 49.41
Return on equity (Net income /
Equity) 4.8 4.1 4.09
Return on sales (operating profit /
revenue from sales) 21.77 19.85 19.64
According to Table 3 it is clear that the best is to choose the straight-line method to
charge depreciation of fixed assets. In this case, return on current assets is by 7.69 percentage
points more than according to the declining balance method and by 8.55 percentage points more
for than according to the sum of numbers of years of useful life. The situation is similar to return
on equity and return on sales. The largest percentage falls on the straight-line method to charge
depreciation as a result of application of the existing accounting policies. At the same time, two
other methods to charge depreciation, as opposed to the straight-line method, enable the
organization to accumulate more funds for the further recovery of fixed assets which have lost
their original physical properties.
Based on the above it can be concluded that using by its accounting policies completely
different ways for accounting assessment of the facts of its economic life, an organization could
present in its financial statements the same economic situations by different methods and
therefore affect the financial performance indicators in different ways [Kulikova & Goshunova,
2014].
METHODOLOGY OF MODELING ACCOUNTING POLICIES FOR MANAGEMENT
OF CORPORATE FINANCIAL PERFORMANCE
In this study, we have conducted an econometric study the aim of which is to analyze the
degree of influence of separate elements of accounting policies on the financial performance
with the example of JSC "Transneft" to model accounting policies promoting to maximize the
corporate financial performance.
The subject of the study is identification of links between the key indicators of the
financial success of the company, net profit and market capitalization, and the individual items of
accounting policies of the organization (charging of depreciation methods).
The two variables were used as the dependent ones:
1. The quarterly net profit for the period of 2015-2016 years;
2. The quarterly value of market capitalization of OJSC "Transneft".
The independent variable was the value of fixed assesses depreciation.
In economic literature, the net profit indicator is seen as a universal financial indicator by
which it is possible to evaluate the effectiveness of a company for the period under review. This
indicator is often used by external users of information contained in the financial statements, in
particular, for investors to calculate financial ratios.
Page 85
Academy of Strategic Management Journal Volume 15, Special Issue 4, 2016
80
Market capitalization of a company is one of the benchmarks which are taken into
account when deciding about investing money by external users of accounting information
contained in the financial statements. In this context, it becomes important to identify whether
the accounting policies of the company has the effect on fluctuations of its market capitalization.
The study was conducted with the help of the econometric package STATA 9.1. Sample
scope has amounted to the financial statements of JSC "Transneft" for 16 quarters in the period
2015-2016.
To confirm or rebut the null hypotheses we carried out a paired regression analysis
between the accounting policies item and a net profit, as well as between an accounting policies
item and a market capitalization of JSC "Transneft".
RESULTS
The analysis results are presented in Table 4.
Table 4
REGRESSION ANALYSIS OF AN ACCOUNTING POLICIES ITEM OF JSC "TRANSNEFT"
The dependent variable Y = Net profit
Independent
variable Factor
Student's
t-test P-level
Number of
observations
Adjusted
R-squared F-test Significance F-test
C 12.9626 12.81345 0.0000 16 0.291085 11.6156 0.00668
Depreciation 0.260508 3.408023 0.0067
As a result of correlation and regression analysis, the following net profit model on the
basis of depreciation of fixed assets items was obtained:
(1)
(1.012) (0.076)
Coefficients included in this model describe the behavior of the dependent variable for
29.11% (R 2 = 0.2911), the share of unaccounted factors accounts for 70.89% (E - the error term
of the model). Upon that, all regression coefficients and the model in general are statistically
significant with a probability of 95%. All this testifies to the high quality of the model.
Next, it is necessary to consider the influence of this accounting policies item on the
external efficiency of JSC "Transneft". This involved a paired regression analysis between a
market capitalization of the company and the cost of depreciation of fixed assets items.
Table 5
REGRESSION ANALYSIS OF ACCOUNTING POLICIES ITEMS OF JSC "TRANSNEFT"
The dependent variable Y = Market capitalization
Independent
variable Coefficient
Student's
t-test P-level
Number of
observations
Adjusted
R-
squared
F-test Significance
F-test
C 11.95878 9.33652 0.0000 16 0.373422 3.5556 0.020522
Depreciation 0.251853 2.74875 0.0205
Page 86
Academy of Strategic Management Journal Volume 15, Special Issue 4, 2016
81
According to the results of the analysis, it was found that the dependence of the market
capitalization of "Transneft" JSC on depreciation of fixed assets is described by the equation:
(2)
(1.280) (0.092).
The parameters of this equation are significant for the t- statistics. Statistically the
equation is statistically significant as a whole; it shows the significance of F-criterion that is
equal to 0.0205. This model has the highest quality among all the models considered by us as it
explains by 37.34% the change in the market capitalization depending on depreciation of fixed
assets of JSC "Transneft".
Thus, the selected item of JSC "Transneft" accounting policies affects to some extent the
net profit and the company's market capitalization.
DISCUSSION AND CONCLUSIONS
Interpretation and analysis of the regression models coefficients made it possible to come
to the following conclusions: the analyzed element in accounting policies has a positive effect on
the corporate financial performance. The depreciation charging method has the greatest impact
on the net profit of a company as compared to its market capitalization.
Change of depreciation by 1% leads to a change in market capitalization by an average of
25.19%. This influence is due to the fact that a huge number of plants and equipment was carried
as an asset of JSC "Transneft". Since the quality of oil transportation depends on the quality of
the oil pipelines which are the fixed assets of the company, more stringent requirements are
presented to them consistently in this regard that leads to the need for regular diagnostics and
maintenance of oil and oil products pipelines in good condition, with their periodical upgrading
and reconstruction. Additional investments in fixed assets, in particular pipelines, contribute to
the qualitative performance of the company which strengthens the company's reputation and lead
to a further increase in the market capitalization of JSC "Transneft".
In turn, the increase in depreciation by 1% leads to a change in net income by an average
of 26.05%. From an accounting point of view, depreciation is expenses of the current period and
has a negative impact on the company's financial results. However, in its economic essence,
depreciation acts as the source of reproduction of fixed assets. Sufficiency of depreciation is a
prerequisite for the continued long term operation of the company. In turn, the reproduction of
fixed assets, and their expansion contribute to that economic benefits will inflow in the future.
Thus, the study was considered assessment of the impact of certain accounting policies on
the performance indicators of JSC "Transneft".
An integrated approach to understanding the company's management system involves not
only internal but also external evaluation of the impact of company's activities. In this
connection, obtaining objective and reliable results of the economic analysis of organizations
plays an important role for a company's management which goal is to ensure the growth of
investment attractiveness of the company as well as for potential investors interested in an
objective and accurate assessment of the financial and economic activities of the organization
with a view to establish long-term economic cooperation [Ntim, 2016; Marilena & Corina, 2012;
Fadhel et al, 2015.; del Carmen Briano - Turrent & Rodríguez-Ariza, 2016; Cheng et al., 2014].
Page 87
Academy of Strategic Management Journal Volume 15, Special Issue 4, 2016
82
The information necessary for management is generated in the accounting system, and
methods for generating this information depend on the accounting policies developed by the
company.
In the course of regression analysis carried out by us, all the null hypotheses were
confirmed, namely, it was found that the studied elements of the accounting policies of JSC
"Transneft" affect the financial performance indicators of the company.
Thus, we can conclude that the modeling of accounting policies by selecting the optimal
items of accounting method is an effective tool for a company management system.
ACKNOWLEDGEMENTS
The work is performed according to the Russian Government Program of Competitive
Growth of Kazan Federal University.
REFERENCES
Archer, S., Delvaille, P. & McLeay, S., (1995). The Measurement of Harmonisation and the Comparability of
Financial Statement Items: Within-Country and Between-Country Effects. Accounting and Business
Research, 25(98), 67–80.
Cheng, L. et al., (2014). Evaluating and comparing the quality of access control in different operating systems.
Computers & Security, 47, 26–40.
Dănescu, T., Prozan, M. & Dănescu, A.C., (2014). Accounting Policies and Procedures – Theoretical and Practical
Connotations in Treating Risks. Procedia - Social and Behavioral Sciences, 131, 332–339.
del Carmen Briano-Turrent, G. & Rodríguez-Ariza, L., (2016). Corporate governance ratings on listed companies:
An institutional perspective in Latin America. European Journal of Management and Business Economics,
25(2), 63–75.
Fadhel, A. Ben, Bianculli, D. & Briand, L., (2015). A comprehensive modeling framework for role-based access
control policies. Journal of Systems and Software, 107, 110–126.
Kulikova, L.I. & Goshunova, A. V., (2014). Science of balance preparation: Substance and stages of development in
Russia. Mediterranean Journal of Social Sciences, 5(24), 49–51.
Kulikova, L.I., Garyncev, A. G. & Goshunova, A. V., (2015). Doubtful Debts Allowance Develoment: Stages and
Methods of Calculation. Mediterranean Journal of Social Sciences, 6(1), 448–452.
Marilena, Z. & Corina, I., (2012). Embellishment of Financial Statements Through Creative Accounting Policies
and Options. Procedia - Social and Behavioral Sciences, 62, 347–351.
Ntim, C.G., (2016). Corporate governance, corporate health accounting, and firm value: The case of HIV/AIDS
disclosures in Sub-Saharan Africa. The International Journal of Accounting, 51(2), 155–216.
Rees, W.P. & Sutcliffe, C.M.S., (1989). Ex Ante Testing of Accounting Standards Using Stochastic Models.
Accounting and Business Research, 19(74), 151–160.
Socea, A.-D., (2012). Managerial Decision-Making and Financial Accounting Information. Procedia - Social and
Behavioral Sciences, 58, 47–55.
Page 88
Academy of Strategic Management Journal Volume 15, Special Issue 4, 2016
83
INNOVATION POTENTIAL MANAGEMENT FOR
ECONOMIC SYSTEMS
Arthur E. Ustinov, Kazan Federal University
Liliya N. Ustinova, Kazan State Architectural and Construction University
Aida A. Safina, Kazan Federal University
Leysan M. Davletshina, Kazan Federal University
Larisa G. Nabieva, Kazan Federal University
ABSTRACT
1. Introduction: At the present stage of economic development one of the important
trends of an enterprise competitive advantages development is the intangible resources along
with conventional ones, which form the basis for an innovation growth and the development of
an enterprise.
2. Methods: The methods of scientific research were the following ones: analysis,
synthesis, indicating method, system approach, factor analysis method, economic and
mathematical methods of data processing and analysis. The use of the abovementioned methods
provided the logical nature of an article structure development and the possibility of an informed
description of findings.
3. Results: The increase of investment volume in the i-th element of the innovative
capacity by 1% will result in market value increase as it was determined that the market value
increase after the investment increase by 1% in the institutional capacity of the considered
enterprise PJSC "Nizhnekamskneftekhim" is projected at the level of 1.095% at ceteris paribus of
a used econometric model.
4. Discussion: The subject of an innovative potential management and development at a
company is an actual one and demanded. In this respect the issue of its effective management as
large and medium industrial enterprises is an important one.
5. Final report: The practical significance of the innovation potential algorithm control
for economic systems is explained by the possibility of a practical application by the enterprises
of any industry sector and production scale.
Key Words: Innovative Potential, Management, Economic Systems, Development
INTRODUCTION
The relevance and a high practical importance of control process concerning the
innovative potential of economic systems determined the choice of the scientific article subject,
its content, the setting of goals and objectives.
The aim of the scientific article is the management algorithm improvement in respect of
economic system innovative potential.
The goal made it necessary to perform the following tasks:
1. To study the essence of innovative potential concept;
2. To conduct a review concerning the main approaches to innovative potential management;
Page 89
Academy of Strategic Management Journal Volume 15, Special Issue 4, 2016
84
3. To propose and justify an innovation potential control algorithm innovation for economic systems as the
basis for innovative development.
The innovation potential (IP) of an enterprise is the synthesis of several types of
resources: intellectual, financial, administrative and technical one, which will provide the ability
to create and implement innovations for a company (Albert and Bradley, 2015; IJTM, 2011;
Saifullina, 2010; Edvinsson, 2014). Processes, products, technologies, packaging, the schemes of
product sales are the result of an intellectual potential use (IJTM, 2011).
METHODS
The approaches to the evaluation of an innovative potential as a mandatory step of IP
management can be divided into three groups: quantitative, qualitative, and mixed (combined)
ones (Hakansson, 2010; Sultanova, 2007; Bukovich and William, 2003).
Quantitative methods involve the use of mathematical tools during the processing of a
significant amount of indicators based on their interpretive property.
The qualitative methods represent the approaches based on the identification of
innovation potential qualitative characteristics on the basis of indicators reflecting the efficiency
of a company activity according to potential key elements: fixed assets, current assets, trade and
production processes, marketing, management and human resources.
The western theory of innovation recognizes the importance and significance of
innovative potential evaluation in innovation management. So, Mityakova O.I. develops IP
management model on the basis of task solution stage structuring from the analysis of an
external environment to the assessment of outcomes in the work "The assessment of an industrial
enterprise innovation potential". At that the importance is given to the issue of an available IP
evaluation (Mityakova, 2004).
I.L. Tukkel and R. Nayak, J. Ketteringhem offers to take into account the age of experts
engaged in innovative projects within "The economy and the financial support of innovation
activity". However, in our opinion, the need of this indicator inclusion in the assessment of an
enterprise innovative potential seems to be very controversial one, since the age-related features
appear as from the best and the worst parts, serve as an advantage and as a disadvantage
(Davenport and Prusak, 2013; Nayak and Ketteringhem, 2001). Besides, under the system of
innovative activity indicators some authors are encouraged to use the amount of an enterprise
participation in exhibitions, seminars and conferences, which is not informative itself without the
establishment of cause-and-effect relationships with an enterprise innovative activity results
(Klimov, 2002; Sarabia and Sarabia, 2005; Sveiby, 2004).
According to the authors, the innovation potential of a company is the collection of
individual types of resources that influence innovation activity and have the characteristics of
innovation growth and development. One may represent the functional groups in an enlarged
way, which forms the innovative potential of an economic system as follows: an intellectual
(research), organizational, marketing and logistics potential. This IP structure will be used by us
in the framework of this article.
RESULTS
During the consideration of IP management issue it is worth to note five signs, ensuring
the effectiveness of IP control algorithm according to our opinion (Ustinova, 2013):
Page 90
Academy of Strategic Management Journal Volume 15, Special Issue 4, 2016
85
1. IP office is the part of a unified enterprise management system and is subject to the main purpose of
an enterprise;
2. The aims and the objectives of IP management model SP should be determined clearly;
3. The development of a management model is performed in a structural way;
4. The development of a model is performed using the system tools.
Let's emphasize additionally the fact that the goals and the objectives of a model should
be consistent with the goals and the objectives of an innovation development concerning an
entire economic system. Thus, it is possible to design, predict and control the trajectory of the
whole economic entity development.
According to the proposed principles the algorithm of effective enterprise IP use
estimation is reasonable to develop on the basis of a systematic approach. This process can be
divided into three stages:
1. The determination of a status and the needs of internal and external enterprise environment;
2. The determination of IP dominant elements on the basis of economic and mathematical models;
3. The selection of an optimal IP management model and the assessment of the compliance with the
established criteria.
A created model IP management model has a communicative model property, which
provides a mutual influence of an external environment on a system and a system on an external
environment. A key reason of this lies in the dynamics of the global economic, scientific,
technical and information content change that requires the systematization, the structuring and
the search of new management tools.
An outlined formalization and algorithm creation problem for an enterprise IP
management facilitated the process of differentiation into separate four units within functional
stages (Figure 1):
1 IP diagnosis. On the basis of empirically proven relationships between IP elements and
key performance indicators of an enterprise, the authors proposed to start the IP management
process with the diagnosis of quantitative and qualitative IP volume available at an enterprise
(Kaplan and Norton, 2006). The methodological base of this study phase can be the common
methods of study and the evaluation of qualitative and quantitative characteristics of an object:
the market capitalization method and the econometric methods of factor analysis. It is offered to
use market capitalization in this article as an indicator which demonstrates a company value in
an external environment.
The following speculations are within a proposed IP use efficiency measurement unit:
H1: There is a statistical relationship between the market performance of a company activity and IP level.
H2: The determination of priority elements in a company IP structure will influence the market
performance effectively.
H3: The determination of priority elements in a company IP structure will allow determining a company
innovative profile.
The feasibility of an indicator approach application in the field of IP research is described
by many scholars (Kozyrev and Makarov, 2003; Kokurin and Innovation, 2011; Dzinkowski,
2011). The indicators will allow characterizing, evaluating and studying the intangible objects
and acting as the equivalent of its absolute or a relative expression.
The development of an equation is conditioned by a put forward hypothesis 1 on the need
to study the statistical relationship of the argument Capi and the variables EICi.
Page 91
Academy of Strategic Management Journal Volume 15, Special Issue 4, 2016
86
In our view, the information about the establishment of such a relationship between the
parameters and about its absence is a valuable one. So, for example, the result of the correlation
analysis in the form of any relationship absence between the parameters may indicate:
1. a real absence of statistical relationship between considered parameters and a studied variable to the
extent that reflects any kind of relationship;
2. the lack of data array in a sample volume;
3. a significant impact of not recorded model factors on a considered argument.
A matrix correction by the exception of insignificant variables will allow suggesting the
following relationship:
Capi = f(Еi), at i= 1 (1)
Where Capi is a system market capitalization;
f(Еi) – the sum of innovation potential elements, including intellectual, organizational,
marketing and engineering potential.
Figure 1
MANAGEMENT ALGORITHM CONCERNING THE INNOVATION POTENTIAL OF ECONOMIC
SYSTEMS
Page 92
Academy of Strategic Management Journal Volume 15, Special Issue 4, 2016
87
In order to solve this problem, let's assume that Ei variable is the function, which is
influenced by the sum of zi factors.
Then the equation (1) will be transformed into the following one:
Еi = f(zi… zn) (2)
In our opinion, the use of multifactor statistical model class such as the multiple
regressions with regard to IP management tasks is an attractive and a convenient one from the
point of view of time series analytical data transparency used in a calculation.
However, the regression equations have high demands in respect of their economic
content and interpretation correctness. The increase of regression equation studied parameters
concerning a sample volume will make a positive impact on the performed analysis quality, since
the studied category IP is characterized by a long payback period of investment funds, the ability
to cyclic reproduction and accumulation.
Then we use the regression analysis equation in order to solve the equation (2):
Capi= β0 + β1 + β2 + β3 + β4 МТП + ε (3)
We will use the following indicators of IP elements in the equation (3):
Where, Сарi – the market value of an enterprise;
- The totality of the costs for intellectual potential development;
- The totality of the costs for a company maintenance and operation, as
well as the costs of research and design developments, describing an organizational capacity of
an enterprise.
– the share of an enterprise market, which characterizes the market
opportunities of an enterprise;
MTP – the carrying amount of a company property.
β0, β1, β2, β3, β4 – the parameters of a regression equation describing the change of results
at the change a relevant factor per unit during a constant value of the other factors set out at an
average level; ε - a random member, explaining the influence of an equation unaccounted
factors.
The development of a regression model (3) allows reflecting еру specific weight of each
element Ei on the proving sign Capi, which will allow revealing the most significant trends and
initiating their development.
Let's suppose that at the specific weight of the element Ei, the parameters of the
regression equation β0, β1, β2, β3 are the static ones, while the largest positive value of the
specific weight βi indicates the greatest contribution of Ei element in Capi argument. The priority
objective of this block for IP control is the determination of that IP part, which provides the
greatest increase concerning the qualitative and quantitative characteristics of an enterprise.
Prediction: Prediction is the process of development possibilities evaluation on the basis
of certain regularities. The objective of this phase of analysis is to define the criteria for the
priority investment areas in IP in order to increase the efficiency of intellectual resource use and
to increase the market appeal of an enterprise.
The proposed method of priority investment trends determination is based on the
assumption of element heterogeneity and the exclusion of chaotic character of influence on the
market value after the determination of an enterprise intellectual profile. The empirical studies of
IP elements effect on the market capitalization of a company, allow us to state that two elements
out of four ones make the influence on a proving sign. In this regard, it can be assumed that a
substantial impact on the market capitalization of a company and, consequently, the financial
Page 93
Academy of Strategic Management Journal Volume 15, Special Issue 4, 2016
88
stability in general is performed by the bidominants which define an innovative profile of a
company.
Evaluation of results. The effectiveness of performed management actions on the control
object is estimated by the economic return, which was recorded within a control result:
Эin = = (4)
Эin – economic efficiency of investments;
IИнтП, IОП IРП, Iмтп – investment in IP elements.
The expediency of performed investments is a justified one at Эin 0, otherwise, it is
necessary to conduct a further study concerning the external influencing factors on a proving
sign and establish the degree of its influence on the basis of a proposed approach.
In order to enable the practical implementation of a proposed algorithm on Figure 1 let's
perform its approbation using the example of one of the largest enterprises of the Republic of
Tatarstan which is OJSC "Nizhnekamskneftekhim".
Table 1
CALCULATION OF CORRELATION COEFFICIENTS AT OJSC "NIZHNEKAMSKNEFTEKHIM"
Indicator IntP MP OP MTP
Ri 0,86269 0,868579 0,617405 0,851225
Student's critical
distribution, tкрит*
3,182
Student's estimated
distribution, tрасч 3,39 3,48 1,56 3,2
Evaluation of
relation importance
and closeness
Important,
connection
relation is strong
Important,
connection
relation is strong
Negligent
Important,
connection relation
is strong
Where IntP - intellectual potential,
MP - market potential;
OP - organizational potential;
MTP- material and technical potential of a company.
In the first proposed block of the algorithm - the diagnostics of innovation potential for
this enterprise is used by the sample volume of 14 years.
The following results were obtained: during the analyzed period from 1999 - 2013 the
greatest impact on the market value of the enterprise OJSC "Nizhnekamskneftekhim" was made
by the market potential (Rrp = 0.868579), and the smallest impact was made by the material and
the technical condition of the enterprise (Rmtp = 0.851225) (see Table. 1)
DISCUSSION
The use of regression analysis model (3) revealed that the development of a positive
dynamics concerning the market capitalization value change of "Nizhnekamskneftekhim"
company is influenced greatly by intellectual potential which, ceteris paribus, proved to be a
significant one and an organizational, highly significant coefficient. This company has a high
level of intellectual resources in human capital, which has the highest rate of return (5):
Capнкнх= 15,15 + 1,16 +0,38 - 0,40 -0,55 МТП (5)
Page 94
Academy of Strategic Management Journal Volume 15, Special Issue 4, 2016
89
With the obtained calculation results, according to the 3-rd block of the algorithm the
OJSC "Nizhnekamskneftekhim", while in a high orientation sector on innovation and a type of
an enterprise - an internal innovator have a promising development trend of innovative
infrastructure in terms of investment into intellectual and organizational potential.
An integrated management of an enterprise IP can improve the efficiency of its use. At
the same time an own distinctive specifics is recorded causing the tendencies of an enterprise
innovative development for each control subject.
The systematic approach to the management by the innovative potential of economic
systems suggested by the authors is in the four-stage sequential algorithm of interrelated actions
aimed at the analysis, the study, the assessment of available IP enterprise, its structuring into
dominant elements, the calculation of necessary investment level into each IP element for the
possibility of an effective influence on the macro-financial indicator of a company activity - its
market capitalization. A systematic approach to IP management is the basis for the management
decision-making regarding the choice of future impact nature and the development of a particular
IP element, and it contributes to the purposeful management in order to improve its
effectiveness.
ACKNOWLEDGEMENTS
The work is performed according to the Russian Government Program of Competitive
Growth of Kazan Federal University.
REFERENCES
Albert, S. and Bradley, К. (2015). Iintellectual Capitales the Foundation for New Conditions relating to
Organizations and Management Practices, Working Paper Series No. 2015, Milton Keynes, Open
University Business School.
Ante Pulic. (3022). VAIC™ - an accounting tool for 1С management. International' Journal of Technology
Management 2011 - Vol. 20, No:5/6/7/8. - P. 702-714.
Bukovich W. (2003). William R. Knowledge management: The guide to action: Trans. from English. - M.: INFRA-
M, 2003. - p.178.
Davenport Т., Prusak L. (2013). Working Knowledge: How Organizations Manage What They Know. Harvard
Business School Press, 2013.
Dzinkowski, R. (2011). The measurement and management of intellectual capital. Management Accounting, 78(2),
32-36.
Edvinsson, L. (2014). Some perspectives on intangibles and intellectual capital 2000. Journal of Intellectual Capital,
1(1), 12-16.
Hakansson, H. (2010). Developing Relationships in Business Networks. I. Snehota, London and NewYork, 2, 15.
Kaplan R.S., Norton D.P. (2006). The Balanced Scorecard: Translating Strategy into Action. USA. Harvard
Business School Press, 322 p.
Klimov S.M. (2002). Intellectual resources of society. S.M.: Klimov. - SPb.: Knowledge, 2002. - 199 p.
Kokurin, D.I. (2011). Innovation activity, D.I. Kokurin. - M.: Examination, 2011 - 575 p.
Kozyrev A.N., Makarov V.L. (2003). Evaluation of intangible assets and intellectual property. M.: Interreklama,
2003. - 352 p.
Mityakova O.I. (2004). The assessment of Industrial Enterprise innovation potential. Finances and Credit, 13, 69-
74.
R. Nayak, Ketteringhem G. (2011). Making breakthroughs. Innovation and technological management. Thematic
collection of articles. Issue 8 - M.: The main editorial office of the International Journal "Problems of
management theory and practice", 4.-9.
Saifullina S.F. (2010). The problems of Russian companies innovative development, Economics, 3.
Sarabia M., Sarabia J.M. (2005) . TREEOR Model: An Approash to the Valuation of Intellrctual Capital.
University of Cantabria, Santander, Spain. Electronic Jornal of Knowledge Management, 3(2), 19-128.
Page 95
Academy of Strategic Management Journal Volume 15, Special Issue 4, 2016
90
Sultanova D.Sh. (2007). Structural study of innovative activity for industrial enterprises. Monograph. - Kazan: RITS
"School", 11.5 p.
Sveiby K.E. (2004). Methods for Measuring Intangible Assets, Jan 2001, updated April 2001, May 2002, October
2002, April 2004.
Ustinova L.N. (2013). Research of intellectual capital elements influence on an enterprise capitalization. The
economic analysis: theory and practice, 22(325), 59-63.