28
| Date post: | 22-Jan-2018 |
| Category: |
Technology |
| Upload: | binary-studio |
| View: | 59 times |
| Download: | 0 times |


What is data visualisation?Data visualization is the presentation of data in a graphical format.

Why you should visualize data?● Visuals are processed faster by the brain
● Visuals are committed to long-term memory easier than text
● Visuals can reveal patterns, trends, changes, and correlations
● Visuals can help simplify complex information
● Visuals can often be more effective than words at changing people’s
minds
● Visuals help people see things that were not obvious to them before

HistoryThe concept of using pictures to understand data has been around for
centuries, from maps and graphs in the 17th century to the invention of the
pie chart in the early 1800s.

Nowadays● HTML
● SVG
● Canvas

Data-driven documentsD3 (or D3.js) is a JavaScript library for visualizing data using web standards. D3
helps you bring data to life using SVG, Canvas and HTML.
It was created by Mike Bostock. He now works at the New York Times who
sponsors his open source work.
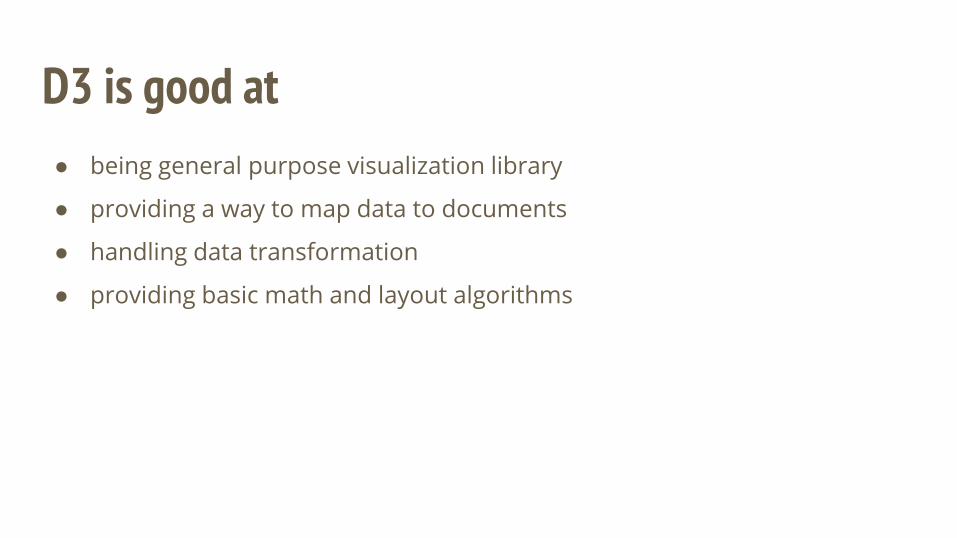
D3 is good at● being general purpose visualization library
● providing a way to map data to documents
● handling data transformation
● providing basic math and layout algorithms

Why D3?You choose how to visualize
https://bl.ocks.org/kerryrodden/raw/7090426/
https://bl.ocks.org/curran/raw/a9555f8041f04a5cbfb53e6f5c53caae/
https://bl.ocks.org/mbostock/raw/4062045/

Instalation
● via NPM:
npm install d3-selection
● load directly from d3js.org:
<script src="https://d3js.org/d3-selection.v1.min.js"></script>
npm install d3
<script src="https://d3js.org/d3.v4.js"></script>
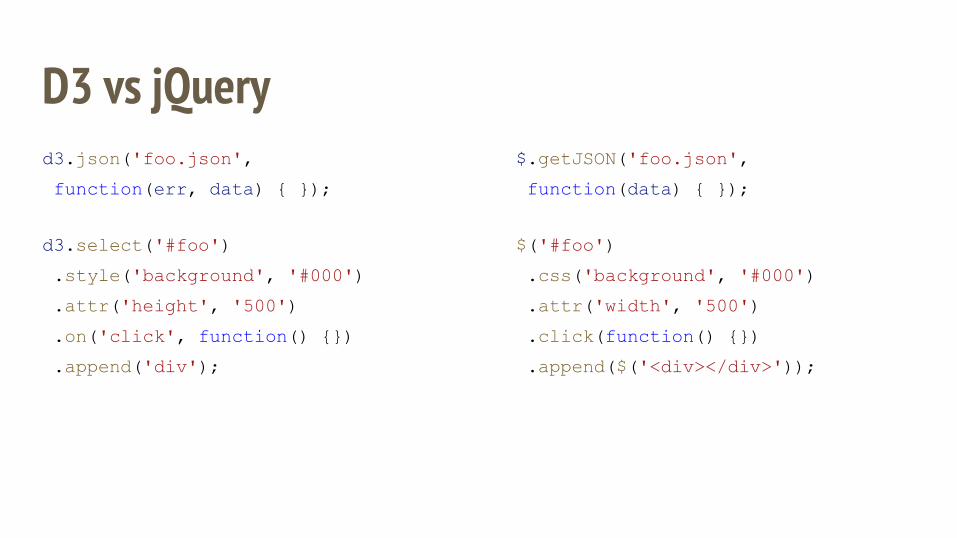
D3 vs jQueryd3.json('foo.json',
function(err, data) { });
d3.select('#foo')
.style('background', '#000')
.attr('height', '500')
.on('click', function() {})
.append('div');
$.getJSON('foo.json',
function(data) { });
$('#foo')
.css('background', '#000')
.attr('width', '500')
.click(function() {})
.append($('<div></div>'));

What is SVG?● SVG stands for Scalable Vector Graphics
● SVG is used to define vector-based graphics for the Web
● SVG defines the graphics in XML format
● SVG graphics do NOT lose any quality if they are zoomed or resized
● Every element and every attribute in SVG files can be animated

SVG Shapes● Rectangle <rect>
● Circle <circle>
● Ellipse <ellipse>
● Line <line>
● Polyline <polyline>
● Polygon <polygon>
● Path <path>
● Text <text>
https://codepen.io/sahanr/pen/JrLEEY

SelectionsSelections allow powerful data-driven transformation of the document object
model (DOM).
const block = d3.select('.container');
const rectangles = block.selectAll('rect');
https://codepen.io/sahanr/pen/aLYOQr
Selections

DifferenceOnly selectAll has special behavior regarding grouping; select preserves the
existing grouping. The select method differs because there is exactly one
element in the new selection for each element in the old selection. Thus,
select also propagates data from parent to child, whereas selectAll does not
(hence the need for a data-join)!

Modifying Elementsconst svg = d3
.select('svg')
.attr('name', 'container') // add attribute
.classed('green', true); // add class
const paragraphs = svg
.selectAll('text')
.filter(':nth-child(even)')
.style('text-decoration', 'underline') // add styles
.text('new inner text'); // added text
https://codepen.io/sahanr/pen/yzKeqV

Creating elementThe append and insert methods are wrappers on top of select, so they also
preserve grouping and propagate data.
const svg = d3
.select('svg')
.append('rect') // add new element
.attr('y', 30) // modify <rect> element
.attr('x', 0);
svg.select('text)
.remove(); // remove first text element
https://codepen.io/sahanr/pen/aLYmgG
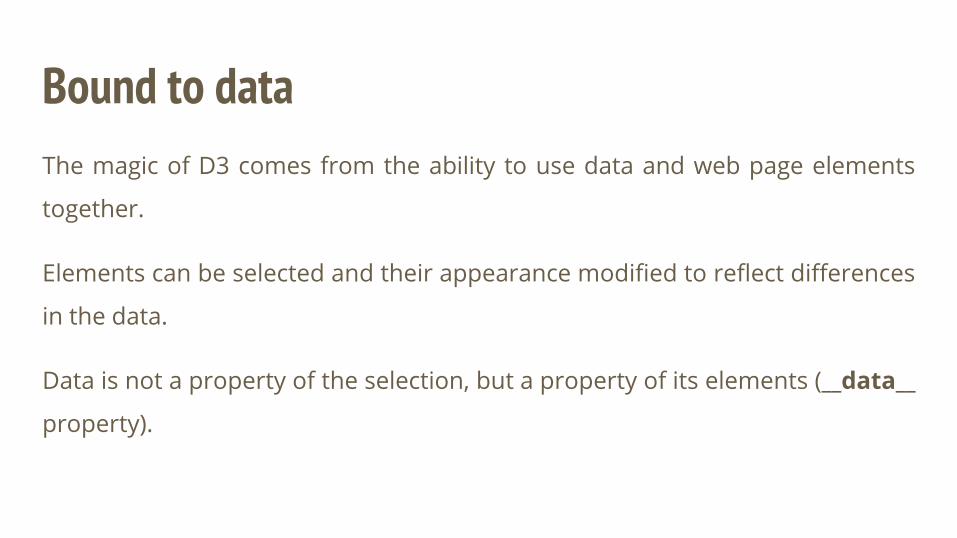
Bound to dataThe magic of D3 comes from the ability to use data and web page elements
together.
Elements can be selected and their appearance modified to reflect differences
in the data.
Data is not a property of the selection, but a property of its elements (__data__
property).

The data join● pairs an object and an element;
● keeps track of new and old objects;
● lets you animate differences
between new & old.
d3.selectAll('text')
.data(data)
.enter()
.append('text');
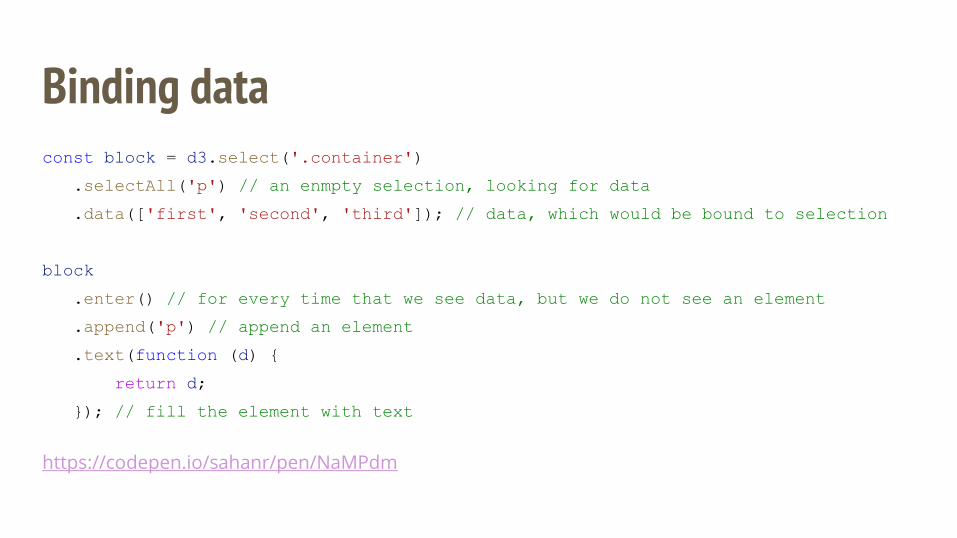
Binding dataconst block = d3.select('.container')
.selectAll('p') // an enmpty selection, looking for data
.data(['first', 'second', 'third']); // data, which would be bound to selection
block
.enter() // for every time that we see data, but we do not see an element
.append('p') // append an element
.text(function (d) {
return d;
}); // fill the element with text
https://codepen.io/sahanr/pen/NaMPdm

Binding dataData is bound to elements one of several ways:
● Joined to groups of elements via selection.data
● Assigned to individual elements via selection.datum
● Inherited from a parent via append, insert, or select

Loading datad3-request
This module provides a convenient alternative to XMLHttpRequest.
d3.text("/path/to/file.txt", function(error, text) {
if (error) throw error;
console.log(text); // Hello, world!
});
d3.json()
d3.tsv()
d3.csv()
d3.xml()
d3.html()

svg outputhttps://codepen.io/sahanr/pen/KXopZZ?editors=0010

ScaleScales are a convenient abstraction for a fundamental task in visualization:
mapping a dimension of abstract data to a visual representation.

Scalevar scores = [96, 74, 88, 65, 82 ];
const xScale = d3.scaleLinear()
.domain([0, d3.max(scores)]) -----> value range of the dataset
.range([0, 300]); ----------------> value range for the visualized graph
newItemGroup
.append('rect')
.attr('class', 'bar')
.attr('width', (d) => xScale(d))
.attr('height', barHeight - 5);
https://codepen.io/sahanr/pen/YraXeP
Scale types● linear - https://codepen.io/sahanr/pen/MEVbRP
● time - https://codepen.io/sahanr/pen/wrmobr
● sequential- https://codepen.io/sahanr/pen/oGyrNV
● quantize- https://codepen.io/sahanr/pen/gGeLNm
● ordinal - https://codepen.io/sahanr/pen/BwrQgd

Handling eventsWe can bind an event listener to any DOM element using d3.selection.on()
method.
https://codepen.io/sahanr/pen/mBxJxP

Linkshttps://bost.ocks.org/mike/join/ - Thinking with Joins,
https://bost.ocks.org/mike/circles/ - Three Little Circles,
https://bost.ocks.org/mike/selection/ - How Selections Work,
https://github.com/d3 - D3 docs

To be continued...


