Peiyin Hung MS PhD student Division of Health Policy and Management School of Public Health, University of Minnesota Identifying High Quality Rural Hospitals Peiyin Hung, MS; Ira S. Moscovice, PhD, Michelle M. Casey, MS
Transcript
Peiyin Hung MSPhD student
Division of Health Policy and Management
School of Public Health,
University of Minnesota
Identifying High Quality Rural HospitalsPeiyin Hung, MS; Ira S. Moscovice, PhD, Michelle M. Casey, MS
2INTRODUCTION METHODS RESULTS CONCLUSION
Acknowledgements
The study is funded by grant U27RH0180 from the Federal Office of Rural Health Policy.
April 15, 2023
3INTRODUCTION METHODS RESULTS CONCLUSION
Agenda
• Introduction• Data sources and sample• Methods• Results• Conclusion
April 15, 2023
4INTRODUCTION METHODS RESULTS CONCLUSION
Introduction
• Health care reform– Increased attention on potential ways to
identify and reward high performing health care providers
• Most quality assessments excluded small rural hospitals– Missing data (public reporting is not
required of Critical Access Hospitals)– Small volume problems
April 15, 2023 INTRODUCTION
5INTRODUCTION METHODS RESULTS CONCLUSION
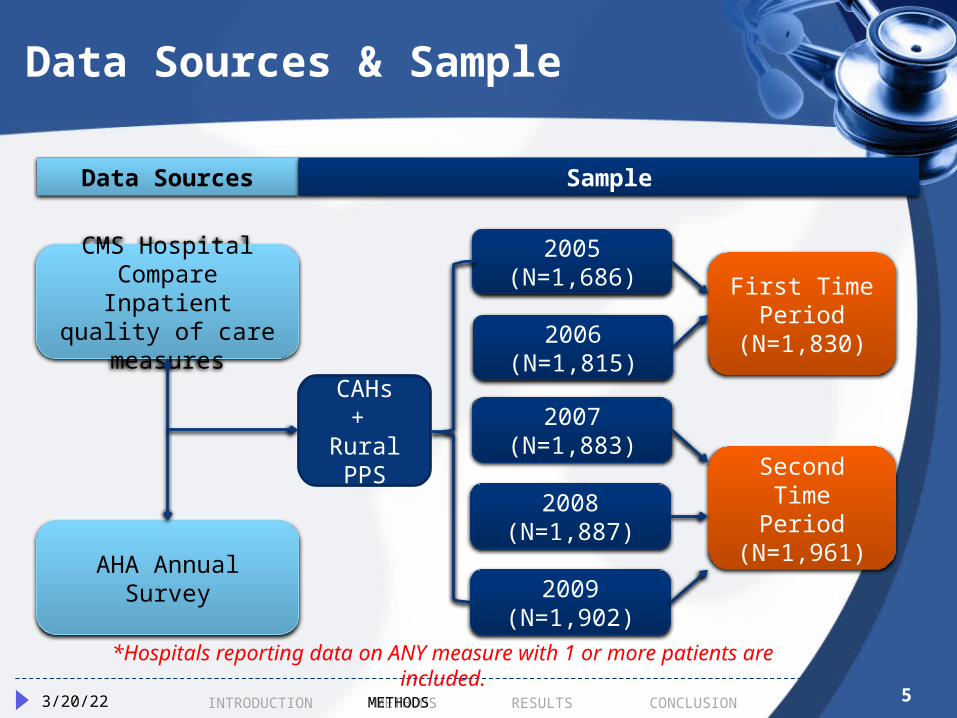
Data Sources & Sample
April 15, 2023 METHODS
CMS Hospital Compare Inpatient
quality of care measures
AHA Annual Survey
2005 (N=1,686)
2006 (N=1,815)
2007 (N=1,883)
2008 (N=1,887)
2009 (N=1,902)
First Time Period
(N=1,830)
Second Time Period
(N=1,961)
CAHs+
Rural PPS
*Hospitals reporting data on ANY measure with 1 or more patients are included.
Data Sources Sample
6INTRODUCTION METHODS RESULTS CONCLUSION
Methods
• Step 1: Calculate condition-specific composite scores in two time periods
• Step 2: Compare quality of rural hospitals using three quantitative concepts– Capability– Stability– Improvement
• Step 3: Identify consistency of top quality rural hospitals across three approaches
April 15, 2023 METHODS
7INTRODUCTION METHODS RESULTS CONCLUSION
Condition-Specific Composite Score
• By condition• Score: Percentage of opportunities
•Criterion: Rural hospitals in the top quartile of each condition-specific composite score in a period
April 15, 2023 METHODS
10INTRODUCTION METHODS RESULTS CONCLUSION
Methods-Stability
• Score: Condition-specific composite scores in both 2005-2006 and 2007-2009 period
• Criterion: Composite scores in the top quartile in both periods
April 15, 2023 METHODS
INTRODUCTION METHODS RESULTS CONCLUSION
0% 10% 20% 30% 40% 50% 60% 70% 80% 90% 100%0%
10%
20%
30%
40%
50%
60%
70%
80%
90%
100%
Co
mp
osit
e S
co
re 2
00
7-2
00
9Distribution of Heart Failure Scores
112/16/2012
Composite Score 2005-2006 METHODS
1212INTRODUCTION METHODS RESULTS CONCLUSION
Methods- Relative Improvement
Scores: Percentage of reduction for missed opportunities by comparing the 2007-2009 period with the 2005-2006 period.Criterion: Above median improvements for all rural hospitals
Among all rural hospitals, non-CAHs, accredited hospitals, and system-
affiliated hospitals performed significantly better than their
counterparts in both time periods.
April 15, 2023 RESULTS
16INTRODUCTION METHODS RESULTS CONCLUSION
Stability Approach
64% of top-performing rural hospitals in the baseline were in the
top quartile in the subsequent period for heart failure and 58% for
pneumonia.
Non-CAHs were more stable than CAHs.
April 15, 2023 RESULTS
17INTRODUCTION METHODS RESULTS CONCLUSION
Relative Improvements Approach
Median improvement was 42% reduction for missed opportunities
for heart failure, and 50% for pneumonia.
Non-CAHs, accredited, and system-affiliated hospitals had significantly higher relative improvements from
2005-2006 to 2007-2009.
April 15, 2023 RESULTS
18INTRODUCTION METHODS RESULTS CONCLUSION
Conclusion
• Consistency across three approaches– Of all rural hospitals, 11% were high
quality across three approaches.– Of the high capability hospitals in the
baseline• High stability: 58%~64%• High improvement: 45%~50%• High stability & improvement: 43%~45%
April 15, 2023 CONCLUSION
19
Q&A
Additional information please contact:Peiyin Hung: [email protected]
Thanks for your attention!
20INTRODUCTION METHODS RESULTS CONCLUSION
Measures Used
• Heart Failure (4 measures)– Discharge instructions– Evaluation of left ventricular systolic function– ACE inhibitor or ARB for left ventricular systolic
dysfunction – Smoking cessation advice/counseling
• Pneumonia (5 measures)– Assessed and given pneumococcal vaccination– Patients whose initial emergency room blood culture
was performed prior to the administration of the first hospital dose of antibiotics
– Smoking cessation advice/counseling– Given initial antibiotics within 4/6 hours after arrival– Given the most appropriate initial antibiotic
2/16/2012
21INTRODUCTION METHODS RESULTS CONCLUSION
Measures Used
• AMI (6 measures)– Heart attack patients given aspirin at arrival– Heart attack patients given aspirin at discharge– Heart attack patients given ACE inhibitor or ARB for
left ventricular systolic dysfunction– Heart attack patients given smoking cessation
advice/counseling– Heart attack patients given beta blocker at
discharge– Heart attack patients given fibrinolytic medication
within 30 mins of arrival• Surgical Improvement (2 measures)
– Given an antibiotic at the right time to help prevent infection
– Preventive antibiotics were stopped at the right time2/16/2012
2222INTRODUCTION METHODS RESULTS CONCLUSION
80% 82% 84% 86% 88% 90% 92% 94% 96% 98% 100%
-30%
-20%
-10%
0%
10%
20%
30%
40%
50%
60%
70%
80%
90%
100%
Composite Score 2005-2006
Com
posit
e S
core
20
07
-20
09
/R
ela
tive I
mp
rovem
en
t
Heart Failure Scores & Relative Improvements Among Baseline High Capable Rural Hospitals
2/16/2012 RESULTS
23INTRODUCTION METHODS RESULTS CONCLUSION
Heart Failure Composite Scores Among High Stable Rural Hospitals
232/16/2012
80% 82% 84% 86% 88% 90% 92% 94% 96% 98% 100%80%
85%
90%
95%
100%
Composite Score 2005-2006
Com
posit
e S
core
20
07
-20
09
RESULTS
24INTRODUCTION METHODS RESULTS CONCLUSION
Heart Failure: Composite Scores & Relative Improvements Among High Stable Rural Hospitals