45
ACCC, Regulatory Economic Unit Return on debt estimation: a review of the alternative third party data series Report for the AER August 2014
ACCC, Regulatory Economic Unit
Return on debt estimation: a review of the alternative third party data series Report for the AER
August 2014

i
The views expressed in this paper are those of the author and not necessarily those of the ACCC or the AER.
Regulatory Economic Unit,
Australian Competition and Consumer Commission
The Regulatory Economic Unit (formerly known as the Regulatory Development Branch) within the Australian Competition and Consumer Commission (ACCC) and Australian Energy Regulator (AER) was established in 2006 to increase the quality of economic analysis available to the ACCC/AER and promote the consistent use of economic principles across the different sectors subject to economic regulation.
The economic regulation of infrastructure is a relatively new area of activity in Australia and was integral to the implementation of the National Competition Policy. As the regulatory task undertaken by the ACCC/AER has developed there has been an increased need for input from specialist regulatory economists.
In response the ACCC established a group of economic specialists to
• provide wide ranging economic advice
• research and develop best practice regulatory techniques
• contribute to economic discussion, debate and training regarding regulatory issues.
The promotion of the use of best practice economic principles recognises that while the principles of regulation might have specific applications across the diversity of areas regulated by the ACCC/AER they are broadly shared. The Unit keeps abreast with latest thinking in regulatory economics and develops shared regulatory principles for the different sectors that the ACCC/AER regulates.
In addition the Regulatory Economic Unit has responsibility for a number of external activities such as the ACCC/AER annual Regulatory Conference, the Utility Regulators Forum, the Infrastructure Consultative Committee and the ACCC/AER Working Paper series.
The following paper is part of the Regulatory Economic Unit’s commitment to contribute and foster discussion on regulatory economic issues.
Dr Yuliya Moore
Principal Economist
Regulatory Economic Unit
ACCC

ii
Table of Contents
Background ....................................................................................................................... 1
Rate of return guideline .................................................................................................. 1
WACC criteria and the benchmark efficient entity .......................................................... 1
Previous regulatory decisions ........................................................................................ 2
RBA series ..................................................................................................................... 2
Bloomberg series ........................................................................................................... 3
AER staff considerations ................................................................................................ 3
REU Report ................................................................................................................... 3
Findings ............................................................................................................................. 3
Bond selection criteria .................................................................................................... 7
Curve fitting .................................................................................................................. 13
Summary ..................................................................................................................... 14
Comparative analysis of the input data ............................................................................ 16
Input data and sample selection criteria ....................................................................... 16
BVAL score and issue size restrictions ........................................................................ 19
Issuing entity: use of financial and non-financial corporate bonds ................................ 20
Secured and unsecured bonds .................................................................................... 22
Use of foreign currency bonds data.............................................................................. 23
Use of bonds with embedded options .......................................................................... 28
Accounting for outliers and other restrictions ................................................................ 30
Analysis of the curve-fitting methodologies ...................................................................... 34
Par yield curves versus averaging of yields to maturities or credit spreads .................. 34
Use of econometric techniques .................................................................................... 37
RBA’s conversion of the USD and Euro credit spreads into AUD credit spreads .......... 40

1
Background
This report is prepared in response to a request for Regulatory Economic Unit (REU) advice from the
AER rate of return team on implementing the AER’s proposed approach for estimating the return on
debt. The request was issued as a follow-up to the AER rate of return guideline published on 17
December 2013.
Rate of return guideline
In the guideline the AER proposed to set the allowed return on debt using a trailing average portfolio
approach (following the completion of a transitional arrangement period). In particular, the AER
proposed to apply the following:1
A trailing average portfolio approach with the length of the trailing average to be 10 years.
Equal weights to be applied to each annual element of the trailing average.
The trailing average to be automatically updated every regulatory year within the regulatory
control period.
For the estimation of the prevailing return on debt, the AER proposed the following:2
Use the published yields from an independent third party data service provider.
Use a credit rating of BBB+ from Standard and Poor's or the equivalent rating from other
recognised rating agencies.3
Use a term to maturity of debt of 10 years.4
The AER did not specify in the guideline which independent third party data service provider it
proposed to use. The AER had previously expressed a preference for using a method that is
transparent. However, in the guideline the AER also acknowledged that other factors—such as
differences in debt instruments selection criteria—would need to be considered in assessing
competing data providers.5
WACC criteria and the benchmark efficient entity
In the rate of rate return guideline, the AER defined the benchmark efficient entity as 'a pure play,
regulated energy network business operating within Australia’.6
Further, the AER set out criteria that it proposed to use to assess the merits of various sources of
information in setting the allowed rate of return. These criteria are presented below.7
1 See: AER, Rate of return guideline, December 2013, p. 19.
2 See: AER, Rate of return guideline, December 2013, p. 21.
3 If the published yields do not reflect the assumed credit rating of BBB+ (or its equivalent), the AER
proposed to apply the published yields that are the closest approximation of the BBB+ credit rating.
4 Where the yield at a term to maturity of 10 years is not published by the third party service provider, the
AER proposed to determine the method for extrapolation at each network service provider's determination.
5 See: AER, Rate of return guideline: explanatory statement, December 2013, pp. 126–130.
6 See: AER, Rate of return guideline: explanatory statement, December 2013, p. 32.
7 See: AER, Rate of return guideline, December 2013, p. 6.

2
The AER considers decisions on the rate of return are more likely to be consistent with the allowed rate
of return objective if they use estimation methods, financial models, market data and other evidence
that are:
(1) where applicable, reflective of economic and finance principles and market information
a. estimation methods and financial models are consistent with well accepted economic
and finance principles and informed by sound empirical analysis and robust data
(2) fit for purpose
a. use of estimation methods, financial models, market data and other evidence should
be consistent with the original purpose for which it was compiled and have regard to
the limitations of that purpose
b. promote simple over complex approaches where appropriate
(3) implemented in accordance with good practice
a. supported by robust, transparent and replicable analysis that is derived from available
credible datasets
(4) where models of the return on equity and debt are used these are
a. based on quantitative modelling that is sufficiently robust as to not be unduly
sensitive to errors in inputs estimation
b. based on quantitative modelling which avoids arbitrary filtering or adjustment of
data, which does not have a sound rationale
(5) where market data and other information is used, this information is
a. credible and verifiable
b. comparable and timely
c. clearly sourced
(6) sufficiently flexible as to allow changing market conditions and new information to be
reflected in regulatory outcomes, as appropriate.
Previous regulatory decisions
At the time the AER rate of return guideline was published, two independent third parties were
providing data that could be used to estimate the return on debt—the Reserve Bank of Australia
(RBA) and Bloomberg. This contrasts with previous regulatory decisions, where the Bloomberg seven
year fair value curve for BBB-rated bonds was the only viable third-party proxy for estimating the
return on debt for the benchmark entity.
RBA series
The RBA began publishing estimates of 3, 5, 7, and 10 year credit spreads and yields for BBB–rated
(and A–rated) Australian non–financial corporations in December 2013.8 The methodology
8 The RBA series are available from the RBA Statistical Table F3, Aggregate measures of Australian
corporate bond spreads and yields, at http://www.rba.gov.au/statistics/tables/.

3
underpinning the RBA’s estimates was described in its December Bulletin.9 At present, only month–
end estimates are available.
Bloomberg series
In addition to the Bloomberg fair value curve series, in November 2013 Bloomberg started publishing
its Bloomberg Valuation Service (BVAL) curve series.10
The longest published term to maturity for
this series is currently seven years. The curve is meant to replace the BFV series that were retired in
May 2014.
AER staff considerations
The AER is evaluating whether either of the two currently available third-party series (RBA series
and Bloomberg BVAL curve) is preferable for estimating the return on debt of the benchmark
efficient entity as defined in the guideline. This evaluation would need to take into account the
WACC criteria set out in the guideline, as well as the transparency and robustness of the two
methodologies and the availability and frequency of the estimates.
REU Report
This report aims to assist the AER’s evaluation by providing a comparative analysis of the bond
sample selection criteria and curve-fitting methodologies used by the RBA and Bloomberg.
The analysis takes into account the definition of the benchmark efficient entity and WACC criteria
provided in the rate of return guideline. During the preparation of the report, we routinely
corresponded with the RBA team (Domestic Markets Department, Securities Market Section) as well
as with several Bloomberg representatives to ensure better understanding of both methodologies.11
Some of the information we procured is confidential. The present analysis is based exclusively on
non-confidential information available.
In this report we examine the two series along the following dimensions: input data and curve fitting
methodology. We provide the description of specific features of the two data series in the relevant
sections. Further, we provide our initial view on the relevance of the two series from the point of view
of the return on debt estimation approach as specified in the rate of return guideline.
Findings
There are currently two third-party data providers producing bond yield series that could be used by
the AER for its return on debt estimation: the RBA and Bloomberg. Figure below plots the available
RBA yield data against the corresponding Bloomberg series (the BFV and BVAL curves). We chose
the tenor of 7 years (rather than 10) to facilitate easier comparison of the series, as Bloomberg’s series
are not available for the 10 year tenor and would need to be extrapolated.12
The BFV curve has been
9 I. Arsov, M. Brooks, M. Kosev, New Measures of Australian Corporate Credit Spread, Bulletin, December
Quarter 2013, pp. 15-26.
10 BS157 AUD Corporate BBB BVAL Curve.
11 A draft of this report was gratefully reviewed by RBA staff for confidentiality checking (to check
information provided to the ACCC/AER from the RBA, that the RBA considers is confidential, is not
contained in the report) and for fact checking (to check the report accurately represents the RBA’s debt data
series). However, the analysis and views in this paper are those of the author, and do not necessarily
represent the views of the ACCC, AER or RBA.
12 The RBA series plotted are identified in the RBA statistical tables as FNFYBBB7M, that is, 7 year yields on
Australian non-financial corporate BBB-rated bonds; Bloomberg series plotted have Bloomberg tickers
C3567Y and BVCSAB07, that is, BFV curve and BVAL curve for Australian AUD BBB rated corporate
bonds.

4
recently retired and is reproduced purely for illustrative purposes. The RBA data is only available for
the end of each month. For comparability, for Bloomberg we have used end of month data rather than
the full set of daily data available.
Figure
4
5
6
7
8
9
10
11
Yie
ld, p
er
cen
t
RBA and Bloomberg 7 year yields, end of month data
RBA BBB 7yrs BVAL BBB 7yrs BFV BBB 7yrs

5
Figure
Figure
4
5
6
7
8
9
10
11
12
13
14
Yie
ld, p
er
cen
t
RBA 3, 5, 7, and 10 year BBB yields
RBA BBB 3yrs RBA BBB 5 yrs RBA BBB 7yrs RBA BBB 10yrs
4
5
6
7
8
9
10
01-O
ct-0
1
01-A
pr-
02
01-O
ct-0
2
01-A
pr-
03
01-O
ct-0
3
01-A
pr-
04
01-O
ct-0
4
01-A
pr-
05
01-O
ct-0
5
01-A
pr-
06
01-O
ct-0
6
01-A
pr-
07
01-O
ct-0
7
01-A
pr-
08
01-O
ct-0
8
01-A
pr-
09
01-O
ct-0
9
01-A
pr-
10
01-O
ct-1
0
01-A
pr-
11
01-O
ct-1
1
01-A
pr-
12
01-O
ct-1
2
01-A
pr-
13
01-O
ct-1
3
01-A
pr-
14
Yie
ld, p
er
cen
t
Bloomberg 7 year series, daily
BFV BBB 7yrs BVAL BBB 7yrs
6
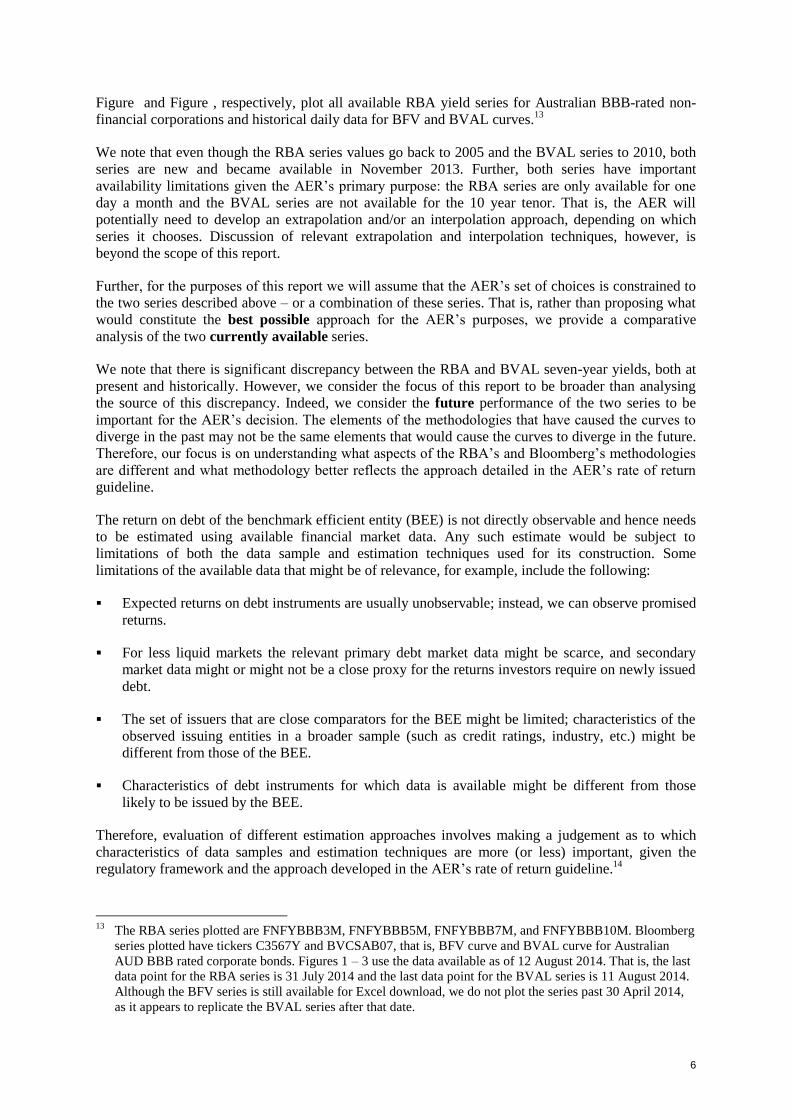
Figure and Figure , respectively, plot all available RBA yield series for Australian BBB-rated non-
financial corporations and historical daily data for BFV and BVAL curves.13
We note that even though the RBA series values go back to 2005 and the BVAL series to 2010, both
series are new and became available in November 2013. Further, both series have important
availability limitations given the AER’s primary purpose: the RBA series are only available for one
day a month and the BVAL series are not available for the 10 year tenor. That is, the AER will
potentially need to develop an extrapolation and/or an interpolation approach, depending on which
series it chooses. Discussion of relevant extrapolation and interpolation techniques, however, is
beyond the scope of this report.
Further, for the purposes of this report we will assume that the AER’s set of choices is constrained to
the two series described above – or a combination of these series. That is, rather than proposing what
would constitute the best possible approach for the AER’s purposes, we provide a comparative
analysis of the two currently available series.
We note that there is significant discrepancy between the RBA and BVAL seven-year yields, both at
present and historically. However, we consider the focus of this report to be broader than analysing
the source of this discrepancy. Indeed, we consider the future performance of the two series to be
important for the AER’s decision. The elements of the methodologies that have caused the curves to
diverge in the past may not be the same elements that would cause the curves to diverge in the future.
Therefore, our focus is on understanding what aspects of the RBA’s and Bloomberg’s methodologies
are different and what methodology better reflects the approach detailed in the AER’s rate of return
guideline.
The return on debt of the benchmark efficient entity (BEE) is not directly observable and hence needs
to be estimated using available financial market data. Any such estimate would be subject to
limitations of both the data sample and estimation techniques used for its construction. Some
limitations of the available data that might be of relevance, for example, include the following:
Expected returns on debt instruments are usually unobservable; instead, we can observe promised
returns.
For less liquid markets the relevant primary debt market data might be scarce, and secondary
market data might or might not be a close proxy for the returns investors require on newly issued
debt.
The set of issuers that are close comparators for the BEE might be limited; characteristics of the
observed issuing entities in a broader sample (such as credit ratings, industry, etc.) might be
different from those of the BEE.
Characteristics of debt instruments for which data is available might be different from those
likely to be issued by the BEE.
Therefore, evaluation of different estimation approaches involves making a judgement as to which
characteristics of data samples and estimation techniques are more (or less) important, given the
regulatory framework and the approach developed in the AER’s rate of return guideline.14
13
The RBA series plotted are FNFYBBB3M, FNFYBBB5M, FNFYBBB7M, and FNFYBBB10M. Bloomberg
series plotted have tickers C3567Y and BVCSAB07, that is, BFV curve and BVAL curve for Australian
AUD BBB rated corporate bonds. Figures 1 – 3 use the data available as of 12 August 2014. That is, the last
data point for the RBA series is 31 July 2014 and the last data point for the BVAL series is 11 August 2014.
Although the BFV series is still available for Excel download, we do not plot the series past 30 April 2014,
as it appears to replicate the BVAL series after that date.

7
We analyse the bond sample selection criteria and adjustments to the bond data, as well as the curve-
fitting methodologies, based on the publicly available information and non-confidential information
we obtained from the RBA and Bloomberg. For the bond sample analysis, we note that both the RBA
and Bloomberg provide a detailed list of bond selection criteria. The list of bonds used to derive the
curves (what Bloomberg refers to as the ‘constituents’) is only directly observable for the BVAL
curve, and only observable on the day of estimation. The situation is different with respect to the
curve-fitting methodologies: while the RBA has published a summary of its methodology, details of
Bloomberg’s approach have not been made available to the public.
Bond selection criteria
Overview
Table below summarises the key characteristics of the bond samples for the two data providers.
14
However, as we discuss below, we consider that the guideline does not provide us with enough detail to
assess some characteristics of the RBA’s and Bloomberg’s bond data samples.

8
Table : Comparison of the RBA and BVAL bond samples
Bond
characteristic
RBA sample BVAL sample Likely to result
in material
difference
Preferred approach
for the AER
Size of
issue /
quality of
pricing
data
At least A$100
million (or
equivalent)
BVAL score of 6 or
higher15
No retail size
medium-term notes
(MTN)16
Unclear Bloomberg
Residual
term to
maturity
Over 1 year At least 2 months Unclear Unclear
Issuing
entity
Non-financial
corporations
only
Incorporated in
Australia
Both financial and
non-financial
corporations
Australia is identified
as the country of risk
Possibly. More
evidence would
be needed to
confirm.
RBA, if evidence
suggests material
difference between
yields on financial
and non-financial
bonds.
Also depends on the
interpretation of the
country in the
definition of the
benchmark efficient
entity.
Secured /
unsecured
Both secured
and unsecured
senior bonds17
Unsecured senior
bonds only
Possibly. More
evidence would
be needed to
confirm.
Bloomberg, if
evidence suggests
material difference
between yields on
secured and
unsecured bonds.
Also, depends on the
AER’s approach to
15
BVAL score is a Bloomberg measure of the BVAL pricing data quality. It is discussed in detail on pages 17-
18.
16 Bloomberg Help defines MTN as follows: ‘Medium-term notes are unsecured, continuously offered debt
obligations with maturities ranging from nine months to 40 years. Each medium term note issue (also known
as tranche) is a drawdown from a program level.’ Retail size refers to the outstanding amount below 10
million dollars.
17 A secured bond is a bond for which the issuer has set aside assets or collateral to ensure timely interest and
principal payments.

9
the benchmark debt
instrument(s).18
Credit
rating
Broad BBB19
:
S&P bond
rating, if
available; S&P
issuer rating
otherwise
Broad BBB: broad
BBB Bloomberg
composite bond
rating, if available;
broad BBB or
equivalent from S&P
or Moody’s credit
rating agency
otherwise
Unclear Either approach
Currency
of issue
AUD, USD,
Euro
AUD Likely Depends on the
AER’s approach to
the benchmark debt
instrument(s).
Coupon
type
Fixed rate
bonds only
Fixed rate bonds only No Either approach
Embedded
options
Both bullet
bonds and
bonds with
embedded
options20
Bullet bonds only Unclear, but not
very likely
under the
current bond
sample
composition.
Depends on the
AER’s approach to
the benchmark debt
instrument(s).
Other
restrictions
Excludes bonds
with some form
of duplication
and several
credit wrapped
securities
Outliers are detected
and removed
Restrictions on the
number of bonds in
the sample and
subsamples by
maturity
Unclear Unclear, due to a
more discretionary
(less formulaic)
nature of the
restrictions.
Table illustrates that the two sets of bond selection criteria vary in a number of aspects; this can result
in differences in the bond sample and, hence, can potentially affect the value of the estimated yields.
Some bond selection criteria, such as characteristics of the issuing entity and credit rating criteria, can
be assessed using the relevant definitions provided in the AER’s rate of return guideline. Specifically,
18
We discuss the concept of a benchmark debt instrument later in this section.
19 ‘Broad BBB’ refers to S&P credit ratings in the following range: BBB-, BBB, BBB+.
20 Bullet bonds are redeemable only at maturities. An embedded option is a component of a financial bond or
other security, and usually allows either the bondholder or the issuer the right to take some action against the
other party on specified dates at specified prices.
10
the benchmark efficient entity is defined in the guideline as 'a pure play, regulated energy network
business operating within Australia’. The guideline also provides considerations for the benchmark
credit rating. At the same time, we consider that the guideline does not provide enough detail to
inform our assessment of other bond selection criteria, for example, those related to the currency of
bond issuance and embedded options.
Issuing entity characteristics
With respect to the issuing entity, the bond selection criteria differ in two aspects: (1) treatment of
financial bonds, and (2) definition of a bond’s country.
While the RBA sample does not include bonds from the financial sector, the BVAL sample includes
both financial and non-financial corporate bonds. As such, non-financial corporations might generally
be expected to be closer comparators to the benchmark efficient entity than financial corporations.
An empirical study based on the US bond data (for 1987-1996) observes that financial bonds have
higher yields than non-financial bonds in the same rating category.21
It is not clear, however, whether
this result applies in the context of the Australian market. While some Australian market participants
suggest that yields of financial and non-financial bonds trade differently, we consider that more
evidence would be needed to conclude that the yields on the non-financial bonds in the BVAL sample
materially and consistently differ from those on the financial bonds.
We consider that WACC criteria (1) and (2) might be of particular relevance for the AER assessment.
Specifically, the AER would need to be satisfied that the exclusion (or inclusion) of financial bonds
from the sample is consistent with well accepted economic and finance principles, informed by sound
empirical analysis and fit for purpose.
Further, while both data providers refer to Australian corporate bonds, their definitions of a bond’s
country vary. The RBA uses bonds of businesses incorporated in Australia and Bloomberg uses bonds
for which Australia is identified as the country of risk. While for a large proportion of bonds such a
distinction does not make a difference, there can still be important divergences between the resulting
bond samples. We suggest that the AER would need to assess whether the definition of the benchmark
efficient entity is more consistent with a business being incorporated in Australia or a business for
which Bloomberg identifies Australia as a country of risk – or both.
Credit rating
The two data service providers also use different credit rating criteria. Even though both bond samples
reflect a broad BBB credit rating, the BVAL sample uses the Bloomberg composite rating as the
primary indicator and would also generally include bonds not rated by S&P but rated by Moody’s. On
the other hand, the RBA’s selection is based exclusively on the rating produced by S&P. The AER
would need to assess whether the RBA’s approach would better reflect the credit rating definition
provided in the guideline, given the formulation ‘a credit rating of BBB+ from Standard and Poor’s or
the equivalent rating from other recognised agencies’. We do not, however, consider that one
approach would be clearly preferable to another.
Size of issue, quality of pricing data, and residual term to maturity
Both data service providers impose sets of restrictions meaning to eliminate bonds with poor quality
of pricing data. In particular, both of them impose restrictions on the residual term to maturity.
Further, the RBA imposes a restriction on minimal issue size; while Bloomberg excludes retail size
21
Edwin Elton, Martin J. Gruber, Deepak Agrawal, and Christopher Mann, Explaining the rate spread on
corporate bonds, February 2001, Journal of Finance, Vol. LVI, No. 1, p.253.

11
medium term notes (MTN) and also imposes a restriction on bonds’ BVAL score (a Bloomberg
measure of the BVAL pricing data quality).
In our opinion, the restriction on the BVAL score deals with the problem of pricing data quality more
effectively and directly than the restrictions imposed by the RBA.22
It is also more consistent with the
AER WACC criteria (2) and (5), that is, it is better fit for purpose, and the market data used is
comparable and timely. However, the overall effect of both sets of restrictions on the resulting
estimate would depend on the proportion of the bonds with low BVAL scores in the RBA sample at
any particular time.
Benchmark debt instrument(s)
We consider that the AER guideline does not provide enough detail to assess the differences in the
following three selection criteria:
Secured and unsecured bonds
Bullet bonds and bonds with embedded options
The currency of issuance
In particular, the guideline specifies that a credit rating of BBB+ and a term to maturity of 10 years
would be used to estimate the return on debt, using the published yields from an independent third
party data service provider. However, credit ratings are primarily an indicator of a bond’s probability
of default, whereas a bond’s return also reflects other information, for example, market expectations
regarding recovery of loss in case of default. Other features of bonds, such as coupon type and size,
embedded options, and currency of issue might also affect their yields. Therefore, unless it can be
demonstrated that the effect of those other features is negligible, to estimate the BEE’s return on debt
we would prefer to have more information about its debt issuance than its credit rating and term. For
example, if investors require a premium on callable bonds compared to otherwise identical bullet
bonds, then we would need to know if the BEE is assumed to issue bullet bonds, callable bonds, or a
combination of those. That is, we would need to know what ‘benchmark debt instruments’ the BEE is
assumed to issue.
As such, two alternative approaches are possible:
1. Under the first approach it is assumed that the BEE only issues one type of debt instrument,
for example, AUD senior unsecured fixed rate bond with no embedded options. We refer to
the first approach as a ‘simple portfolio’. This is similar to the AER’s definition of the
benchmark bond in previous decisions before the publication of the rate of return guideline.23
2. Under the second approach it is assumed that the BEE finances its debt via a portfolio of
different debt instruments, for example, bank debt, domestic bonds, and foreign currency
22
More detailed reasoning is provided on pages 17-18.
23 For example, in the Aurora draft decision, in addition to taking into account the benchmark credit rating and
benchmark term the AER estimated the debt risk premium based on a sample of bonds that, among other
conditions, were ‘Australian domestic corporate issuance’, ‘fixed interest rate—or floating interest rate
where this can be reliably converted into a fixed interest rate equivalent’ and ‘standard bonds (that is, not
callable or subordinated debt)’, or ‘non-standard bond type where this can be reliably converted into a
standard bond equivalent’. AER, Draft distribution determination—Aurora Energy Pty Ltd—2012-13 to
2016-17, November 2011, p.216. The Aurora draft decision was the most recent AER decision that
contained substantive analysis on the return on debt, prior to the rate of return guideline. For the Aurora final
decision, and subsequent AER decisions, the AER adopted the Bloomberg fair value curve following the
outcome of several Australian Competition Tribunal decisions on the debt risk premium.

12
bonds. In this case features for each of the debt instrument in such a portfolio would need to
be specified. In addition, assumptions would need to be made about the relative weights of the
debt instruments in such a portfolio. We refer to this approach as a ‘complex portfolio’.
To avoid some possible confusion, we note that in both cases the entire ‘portfolio’ is issued at a
specific point of time (regulatory year). That is, the return on such a portfolio would correspond to a
single (annual) component of the AER’s trailing average.
Under both approaches, in order to make a conclusion about the appropriateness of using specific
bond selection criteria, we would need to know the characteristics of the benchmark debt
instrument(s). Since providing the definition of the benchmark debt instrument is beyond the scope of
this report, we discuss how and whether particular features of the bonds included in the RBA and
BVAL curve samples are likely to result in different aggregate yields.
Secured/unsecured bonds and bonds with embedded options
With respect to the treatment of secured bonds and bonds with embedded options, we suggest that at
present the difference between the two series might be moderate due to the following considerations:
Currently the majority of BBB rated Australian senior bonds are unsecured.24
The current population of bonds with embedded options in the RBA sample is dominated by
those with a ‘make whole’ call feature. US empirical evidence appears to suggest that
incremental yields due to the ‘make whole’ call feature are low, especially in more recent time
periods.
At the same time, however, the following considerations suggest that the difference in the treatment of
secured bonds and bonds with embedded features by the RBA and Bloomberg should not be ignored:
It is conceivable that the composition of the RBA bond sample with respect to secured bonds and
bonds with embedded feature might change in the future.
We consider that at present there is insufficient evidence as to the differences in bond yields
between secured and unsecured Australian BBB rated bonds.
It might not always be appropriate to use the Bloomberg embedded functionality to evaluate
option adjusted spreads for bonds with embedded options other than those with make whole call
features.
We suggest that, similarly to the considerations regarding the industry of the bond issuer, it would be
desirable to obtain further evidence to assess whether the inclusion of secured bonds in the bond
sample is warranted from the AER’s perspective. If the AER forms a view on its approach to the
benchmark debt instrument(s), this decision would further inform the assessment. Further, if the AER
chooses to use the RBA estimates, it would be prudent to monitor the RBA bond sample composition
on an ongoing basis.
We consider that WACC criteria (1) and (2) might be of particular relevance for this assessment.
Specifically, the AER would need to be satisfied that the exclusion (or inclusion) of secured bonds
and bonds with embedded features is informed by sound empirical analysis and is fit for purpose.
Currency of issue
24
That is, bonds rated BBB-, BBB, BBB+ by S&P or with equivalent ratings from other credit rating agencies.

13
With respect to the currency of bond issuance, we suggest that the appropriateness (for the AER’s
purposes) of including foreign currency bonds in the sample depends on:
the difference between the credit spreads on the AUD bonds and hedged credit spreads on similar
foreign currency bonds in the sample, and
the AER’s assumptions about the benchmark debt instrument(s).
Assume first that a version of ‘swap’ covered interest parity holds for the AUD, USD and Euro-
denominated bonds issued by Australian companies. This would imply that the difference between the
AUD bond credit spreads and the hedged foreign currency spreads on comparable bonds is small (i.e.,
can be attributed simply to transaction costs). If that is the case, then it would be appropriate to treat
the hedged credit spreads on the USD and Euro-denominated bonds as similar to the credit spreads on
the AUD-denominated bonds.25
In this case the considerations of whether the AER’s benchmark debt
instruments only include AUD-denominated bonds or also comparable USD and Euro-denominated
bonds would be of less importance.
However, the approach would differ if this kind of swap covered interest parity is not observed – or is
not always observed. In that case, if the AER were to use only AUD bonds as the benchmark debt
instruments, then the RBA’s approach would not be well suited for the AER’s purposes. Further, if
the AER were to use both AUD and foreign currency bonds as benchmark debt instruments, then it
would need to assess whether the mix of bonds in the RBA’s and Bloomberg’s bond samples is a
good proxy for the mix of bonds making up the benchmark debt instrument(s). Since Bloomberg’s
sample includes AUD bonds only, it is unlikely to present a good proxy for such a ‘complex portfolio’
of benchmark debt instruments. On the other hand, the RBA’s sample is not guaranteed to present a
good proxy either. This is because the RBA’s bond sample contains bonds issued in the past as well as
new bonds. Hence, the sample proportions of bonds with different maturities and in different
currencies might not be reflective of the optimal proportions of a benchmark business issuing its debt
today (or in the near future).
We consider WACC criteria (1) and (2) to be most relevant for the AER’s decision. Specifically, the
AER would need to assess whether or not the inclusion of foreign currency bonds in the estimation
sample is consistent with the relevant finance principles and informed by sound empirical analysis.
Further, the AER’s decision on what represents the benchmark debt instrument(s) would inform
which of the two approaches (BVAL and RBA) best fits the AER’s purpose.
Curve fitting
Different levels of information are available with respect to the estimation (or, as we refer to them,
‘curve-fitting’) methodologies of the two data providers. The details behind Bloomberg’s BVAL use
of econometric techniques are not currently available in the public domain. The only non-confidential
information available to us with respect to Bloomberg’s curve-fitting approach is that the estimated
BVAL curves are par yield curves and that ‘the Bloomberg curve is fitted to observations by using an
adaptive mix of zeroth and first order non-parametric regression and subsequently smoothed by using
rational Bezier polynomials’.26
In contrast the RBA methodology is discussed at length in the RBA
Bulletin December 2013 edition. For this reason, our analysis below mostly refers to the RBA
methodology.
25
For example, as in the RBA’s methodology.
26 The former information is available, for example, from the AUD Corporate BBB BVAL Curve page on
Bloomberg terminal. The latter information is available from the description of the ‘Bloomberg curve fitter’
in Bloomberg CRV tool. Correspondence with Bloomberg representatives (24 June and 14 August 2014)
confirms that this description also applies to BVAL sector level curves (such as AUD Corporate BBB
BVAL Curve).

14
We make the following observations.
Firstly, the RBA methodology is based on computing the weighted average of the bonds’ credit
spreads, that is, the differences between the bonds’ yields to maturity and the corresponding swap
rates. Such an approach does not result in an estimate of a par yield curve, a zero coupon yield curve,
or an instantaneous forward yield curve, which are the standard ways to represent the term structure of
interest rates. The BVAL curve, in comparison, is a par yield curve.
Secondly, the RBA’s econometric technique is a non-parametric econometric method using an
analogue of the Nadaraya-Watson kernel estimator. This estimation approach may result in a biased
estimate for the bond tenors close to ten years, in particular, due to ‘the dearth of issuance of bonds
with tenors of 10 years or more’ and, in general, due to the asymmetry of the bond sample distribution
across terms to maturity.27
The behaviour of the estimate close to the ten year tenor is particularly
relevant to the AER, because its benchmark term to maturity is ten years.
Thirdly, based on the very limited information available on the BVAL curve fitting methodology,
Bloomberg appears to be using a somewhat similar approach to that of the RBA, although there would
also be differences – for example, Bloomberg’s approach is estimating a par yield curve, local linear
regression appears to be used, and there is a separate smoothing step. However, a more detailed
comparison – and in particular that related to a potential bias and goodness of fit – is not possible due
to the limited amount of information available on the BVAL curve-fitting approach.
Finally, we consider that the RBA’s article does not provide sufficient detail as to its method of
converting the foreign currency credit spreads into their AUD equivalent for us to replicate the
conversion.
To summarise, in evaluating the appropriateness of the RBA’s and Bloomberg’s approaches for the
AER’s purposes, we suggest that AER needs to take into consideration WACC criteria (1), (2), and
(3). That is, it needs to form an opinion of whether the RBA methodology and, respectively, BVAL
methodology are fit for the purpose of providing an estimate of the return on debt of the benchmark
debt instrument and whether, as such, they are consistent with well accepted economic and finance
principles. Further, with respect to the RBA’s conversion of foreign currency credit spreads – as well
as with respect to Bloomberg’s overall curve-fitting approach, the AER needs to consider whether it is
satisfied that the analysis is supported by robust, transparent and replicable analysis.
Summary
The purpose of this report is to review the RBA’s and Bloomberg’s approaches and to suggest factors
that might be important for the AER’s decision. As such, we consider that at this point it would not be
appropriate for us to make a recommendation of the preferred approach for the following reasons:
Some features of the two approaches might not be fit for the AER’s purpose or might not be
consistent with well accepted economic and finance principles.
The available evidence with respect to some features of the bond samples might not be sufficient
to make a judgement whether one approach would be clearly preferable to another.
Our view on whether some features are fit for the AER’s purpose depends on what approach the
AER uses with regards to the benchmark debt instrument(s).
Very little non-confidential detail is available on Bloomberg’s curve-fitting methodology to
enable a comparison with the RBA’s curve-fitting methodology.
27
I. Arsov, M. Brooks, M. Kosev, New Measures of Australian Corporate Credit Spread, Bulletin, December
Quarter 2013, p. 23.

15

16
Comparative analysis of the input data
The process of estimating a yield curve for a set of financial instruments can, in general, be split into
two stages: (1) selection and preliminary ‘standardisation’ of the data inputs, and (2) econometric
estimation. This section elaborates on the first stage of the process and presents a comparison of the
input data sets used by the RBA and Bloomberg, as well as preliminary adjustments applied to these
data sets. The next section deals with the estimation methods employed by the two data providers.
Input data and sample selection criteria
At present, both RBA and Bloomberg rely on the same primary data source - BVAL bond pricing data
produced by Bloomberg. As BVAL pricing data only became available in 2009, the RBA had to rely
on other data sources to back-cast their yield estimates. In particular, the RBA’s historical estimates
make use of two other pricing sources: Bloomberg generic prices (BGN) and the UBS data in case
neither BVAL nor BGN are available.
Bloomberg provides the following description of its BVAL pricing service:28
Bloomberg’s BVAL Evaluated Pricing Service provides transparent and highly defensible prices for
fixed income securities across the liquidity spectrum. The foundation of BVAL’s methodology is its
access to a wealth of market observations from thousands of contributed sources. This mass of market
data is the main driver of our innovative and quantitative approach that first prices actively traded
financial instruments and then derives a price on comparable financial instruments that trade less
frequently. This methodology aligns with Bloomberg’s tried-and-tested capabilities as the financial
industry’s leading analytics platform and source of fixed income information. In addition to
sophisticated algorithms that generate prices, the BVAL methodology assigns a BVAL Score based on
the quantity and quality of market data used.
Further, the following observations by a Bloomberg representative we have contacted suggests that
BVAL pricing service is relied upon by many market participants and, further, highlights
Bloomberg’s resources designated to support the service:29
- BVAL curves are a key component of our BVAL service for fixed income securities. BVAL is our
independent valuation service that provides transparent and defensible valuation for roughly 2.5 million
securities up to 7 times per day.
- To date, we have 300K+ desktop users accessing BVAL through their Bloomberg professional. As
part of our customer base we also have large Sell-Side and Buy-Side institutions as well as Government
Agencies and Accounting firms subscribing to BVAL at the firm level (enterprise solution)
- Our BVAL support team comprises 70+ evaluators and 50+ R&D staff with 24h coverage
We consider that the BVAL pricing source is likely to satisfy the AER WACC criterion (5), that is,
the information used is credible and verifiable, comparable and timely, and clearly sourced.
While both Bloomberg and the RBA use the same underlying Bloomberg data source for each bond,
their bond samples differ in a number of aspects, and we suggest that this might explain a large
proportion of the current difference in their resulting yield estimates. Below, we summarise the bond
selection criteria used by the two data providers. We discuss them in more detail in following
subsections of the report.
The RBA’s methodology is published in a 2013 RBA Bulletin article.30
The following selection
criteria for the bond sample are identified in the article:
28
Bloomberg product sheet, BVAL sector curves & issuer curves, p.1.
29 E-mail correspondence with Bloomberg, 30 May 2014.

17
The sample includes fixed-rate bonds identified by Bloomberg that were outstanding after 1990
and were issued by non-financial entities incorporated in Australia
Both bullet bonds and bonds with embedded options are included (callable, convertible and
puttable) 31
Only bonds with residual maturities over a year are included
The sample is restricted to bonds with prices, reported face values and available credit ratings
Only bonds with broad BBB credit rating are included in the estimation of the BBB yield curve.
Individual bond ratings issued by Standard & Poor’s (S&P) are used where available, and S&P’s
issuer rating is used otherwise
The sample is restricted to bonds raising the equivalent of at least A$100 million
The sample is restricted to bonds denominated in Australian dollars, USD or euros
Where a USD-denominated bond line has both 144A and Regulation S series, the latter is omitted
to avoid duplication32
A further seven securities were excluded due to other forms of duplication (the securities are not
identified in the article)
Further eight securities were excluded that had been downgraded multiple notches by credit
rating agencies during, or shortly after, the onset of the GFC (the securities are not identified in
the article)
Finally, the RBA states that ‘a small number of negative bond spread observations were excluded
from the sample’33
We consider that while the criteria above provide a degree of clarity on the sample composition at any
specific point of time, they do not identify the sample precisely (due to the conditions in the last three
bullet points).
Bloomberg uses the following selection criteria in relation to its BVAL sectoral curves:34
30
I. Arsov, M. Brooks, M. Kosev, New Measures of Australian Corporate Credit Spread, Bulletin, December
Quarter 2013, pp. 15-26.
31 Bullet bonds are redeemable only at maturities. An embedded option is a component of a financial bond or
other security, and usually allows either the bondholder or the issuer the right to take some action against the
other party on specified dates at specified prices. For example, callable bonds can be redeemed prior to their
maturity at the discretion of the bond issuer while puttable bonds give the holder a right to demand early
repayment. A convertible bond can be converted into a predetermined amount of the company’s equity at
certain times during its life, usually at the discretion of the bond holder.
32 As explained in the RBA Bulletin article (I. Arsov, M. Brooks, M. Kosev, New Measures of Australian
Corporate Credit Spread, Bulletin, December Quarter 2013, p. 17), ‘issuers raising bond funding in US
dollars can issue two types of securities for the same bond line that are intended for different investors and
classified as either 144A or Regulation S (Reg S). Securities issued under the US Securities and Exchange
Commission’s Rule 144A are privately placed into the US market and are sold to Qualified Institutional
Buyers. Reg S securities are issued in the Eurobond market for international investors and are exempt from
registration under the US Securities Act 1993. Each security type is typically assigned its own International
Securities Identification Number.’
33 I. Arsov, M. Brooks, M. Kosev, New Measures of Australian Corporate Credit Spread, Bulletin, December
Quarter 2013, p.18.

18
AUD bonds are included, if credit ratings and prices are available35
Senior unsecured bonds issued by both financial and non-financial Australian corporations are
included (‘country of risk’ field is used to determine the country of the bond36
)
Bond Structures:37
o Retail MTN — Exclude bonds with an embedded survivor put option OR are of retail
size.38
o Embedded structures — Exclude bonds with call/put options, Convertibles and Sinking
Funds.
o Coupon types — Exclude Inflation Linked, Floating Rate and Structured Notes.
Minimum Bond Maturity — only bonds with a minimum of 2 months to maturity are used in
curve construction
Bond Count Requirements — curves are constructed when there are:
o At least 15 bonds across the term structure
o At least 5 bonds with maturities between 5 and 10 years
o At least 5 bonds with maturities beyond 10 years39
Only bond with broad BBB credit rating are included. If available, Bloomberg composite rating is
used, if not, either S&P or Moody’s credit ratings are used, whichever is available40
Outlier Detection — bonds that breach certain yield-to-maturity thresholds are excluded from
curve construction
BVAL Score — only bonds with a BVAL score of 6 or higher are used in curve construction41
Table 1 in the previous section summarises the key characteristics of the bond samples used by the
RBA and Bloomberg. Below we discuss the selection criteria in more detail.
34
Bloomberg product sheet, BVAL sector curves & issuer curves, p.2; Bloomberg terminal description screen
for BS157 AUD Corporate BBB BVAL Curve [accesses 4 June 2014].
35 The latter condition is implied rather than explicitly stated, as otherwise the corresponding bond data could
not be used in the curve construction.
36 E-mail correspondence with Bloomberg, 30 May 2014.
37 The implication of this criterion is that only fixed rate bullet bonds are included in the construction.
38 Survivor put option (also known as a ‘survivor’s option’ or a ‘death put’) is an optional redemption feature
on a debt instrument allowing the beneficiary of the estate of the deceased to put (sell) the bond (back to the
issuer) in the event of the beneficiary’s death or legal incapacitation. Retail medium-term notes (MTNs) are
discussed on page 17. Refer to footnote for the definition of an MTN.
39 It appears that this criterion is currently relaxed and would be needed for the 10 year yield to be estimated.
40 E-mail correspondence with Bloomberg, 4 February 2014.
41 The definition of BVAL score and relevant intuition are discussed in next subsection.

19
BVAL score and issue size restrictions
The estimated yield curve is to a large extent affected by the quality of the input data used in the
estimation. For example, if bonds in the sample are traded very infrequently, their pricing data might
be ‘stale’ and not reflective of the current market conditions. In addition, Chairmont Consulting
emphasises the importance of comparing ‘like with like’ when estimating the return on a benchmark
bond:42
Consistent with the principles of benchmarking, an appropriate proxy needs to have a similar degree of
liquidity to the bond being benchmarked, all other things being equal.
For this reason, some measures of bond liquidity or the quality of the pricing data are often taken into
account when estimating yield curves. For example, the European Central Bank (ECB) uses the
following set of (typical) liquidity criteria to restrict a bond sample used to construct its yield curves
for government bonds: total turnover (total volume of daily trades), average trade size, bid-ask spread.
Further, only bonds with a minimum trading volume of €1 million per day are used.43
The ECB further suggests that:44
Bonds with maturities below three months are less traded and thus typically have more volatile
prices/yields than other bonds.
The RBA and Bloomberg also impose restrictions on the bond sample to address this issue of the
pricing data quality.
In particular, Bloomberg BVAL curve bond sample only includes bonds with the BVAL score of 6 or
higher. BVAL score is a metric developed by Bloomberg as a part of its BVAL pricing service:45
The BVAL Score
An important and complementary component of the Bloomberg Valuation Service is the BVAL Score.
This innovative, proprietary metric is designed to provide subscribers with a consistent and quantifiable
means of assessing the market data supporting each BVAL price. The BVAL Score scale ranges from 1
to 10, reflecting the relative quantity and strength of the market data used to generate the BVAL Price.
The quantity and quality of the market data are measured using BVAL’s proprietary “Effective
Number” and “Standard Deviation” calculations.
Effective Number — reflects the number of quality observations used in deriving the BVAL Score.
The “quality” of each observation is measured using various attributes, including timeliness, lot size
and quote type (e.g., trades versus broker levels). The Effective Number is the weighted sum of the
quality score for the individual quotes used in the BVAL price.
Standard Deviation — is a metric that captures the consistency of market input observations,
indicating the degree of corroboration or dispersion among the supporting market data.
Intuitively, the BVAL score is designed to serve as a measure of the BVAL pricing data quality. That
is, the higher BVAL score is, the higher is the quality of the corresponding pricing data. All other
things being equal, one would expect more liquid bonds to have a higher BVAL score.
42
Chairmont Consulting, Debt risk premium expert report, February 2012, pp. 12-13.
43 ECB, The new euro area yield curves, Monthly bulletin, February 2008, p.101.
44 ECB, The new euro are yield curves, Monthly bulletin, February 2008, p.101.
45 Bloomberg product sheet, BVAL sector curves & issuer curves, p.2.

20
In addition, Bloomberg excludes bonds with less than two months left to maturity. It also excludes
retail size MTNs:46
The "Retail MTN" criteria is based on outstanding amount. Anything under 10 million will be
considered as retail MTN. We exclude them as they are usually more illiquid and not considered
institutional size (which are more representative of the market). Retail size MTNs also have volatile
contributions, easily causing outliers.
The RBA does not specify any restrictions on the BVAL score. 47
Instead, the RBA restricts the bond
sample based on face value. The RBA also excludes bonds with residual maturity of one year or less.
To the extent that pricing data for bonds with smaller face value and those close to their maturity date
are of lower quality, this restriction can effectively serve the same purpose as the restriction on the
BVAL score.
In our opinion, the restriction on the BVAL score deals with the problem of pricing data quality more
effectively and directly. That is, it is conceivable that bonds with large issue size (and over one year
residual maturity) might be traded infrequently and it is therefore conceivable that their pricing data
might not be reflective of the current market conditions. As such, the restriction on the BVAL score is
more consistent with the AER WACC criteria (2) and (5), that is, it is better fit for purpose, and the
market data used is comparable and timely. However, the overall effect of the restrictions discussed
above on the resulting estimate would depend on the proportion of the bonds with low BVAL scores
in the RBA sample at any particular time.48
Issuing entity: use of financial and non-financial corporate bonds
The next restriction on the bond sample deals with the question of whether the industry of the issuing
entity has a significant effect on how bonds are priced.
The RBA’s sample does not include financial bonds. That is, those issued in the following sectors, as
identified by Bloomberg: banking, commercial finance, consumer finance, financial services, life
insurance, property and casualty insurance, real estate, government agencies, government
development banks, government regional or local, sovereigns, supranationals and winding-up
agencies.
On the other hand, Bloomberg AUD Corporate BBB BVAL curve bond sample includes both
financial and non-financial bonds. In fact, as of 6 June, 2014, the sector composition of the AUD
Corporate BBB BVAL curve bond sample included the total of 22 bonds, out of which 9 were
identified as real estate and one as commercial finance sector bonds.
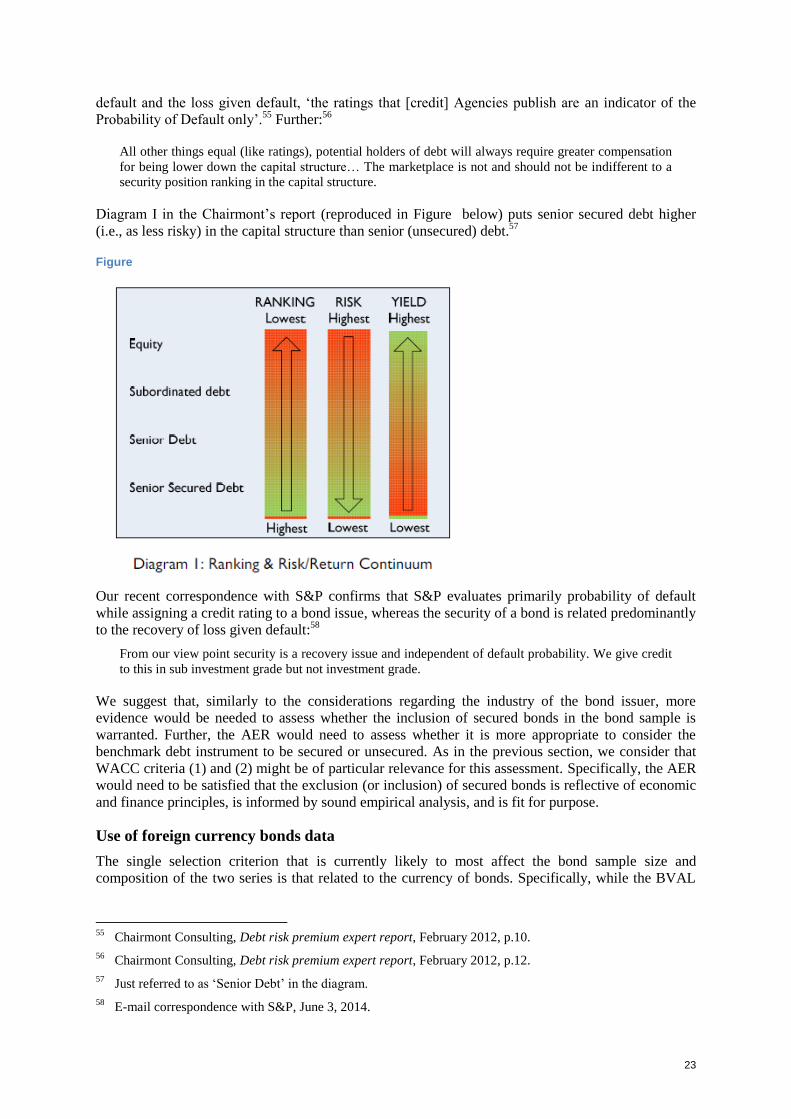
A simple visual inspection (Figure ) of the current (6 June 2014) BVAL series bond sample does not
appear to suggest a significant difference in the yields to maturity of financial and non-financial BBB
rated Australian bonds in the current sample. However, such analysis does not take into account
potential differences in original time of issue, maturity at issue, and coupon rates.
46
E-mail correspondence with Bloomberg, 9 June 2014.
47 BVAL scores for individual bonds cannot be automatically downloaded into an Excel spread sheet. In
addition, historical information on BVAL scores is not readily available. Thus, the RBA might not be using
this criterion for practical reasons.
48 As explained in the footnote above, tracing BVAL scores for a set of bond is a relatively resource-intensive
exercise. As such, it is outside the scope of this report.

21
Figure
Source: Bloomberg, BS157 AUD Corporate BBB BVAL Curve constituents for 6 June 2014.
In our opinion, the issue of whether or not it is appropriate to treat BBB rated Australian financial
bonds differently from non-financial bonds might still be open to debate.
In its 2012 report Chairmont Consulting suggested that:49
Appropriate benchmarking must take into consideration that similar or same industry specific risks may
impact similarly on the trading spread determination for debt in similar or same industries. Therefore,
proxies should come from the same or similar industry as the entity issuing the debt being
benchmarked.
Chairmont Consulting further suggested that:50
Economic cycles are part of the capitalistic model. In downturn periods, default levels increase and it is
the financial services sector, primarily banks that carry many of the losses that result. Traders consider
this factor as well as other industry specific risks when they price bank and insurance company issued
debt. It highlights why financial institution debt is not an appropriate proxy for infrastructure as the
industry risks are different. Consequently, credit spreads of banks compensate for and are affected by
different factors than credit spreads of entities from other industries that have their own specific risks.
And finally:51
49
Chairmont Consulting, Debt risk premium expert report, February 2012, p.11.
50 Chairmont Consulting, Debt risk premium expert report, February 2012, p.13.
51 Chairmont Consulting, Debt risk premium expert report, February 2012, p.17.
3.5
3.7
3.9
4.1
4.3
4.5
4.7
4.9
5.1
5.3
5.5
0 1 2 3 4 5 6 7
Yie
ld t
o m
atu
rity
, p
er
cen
t
Remaining years to maturity
BVAL bond sample, yield to maturity
Nonfinancials Financials

22
The industry of the debt issuer is of paramount importance in benchmarking and banking is not similar
enough industry to infrastructure to qualify bank debt as an appropriate proxy for this process…
In its recent report to the QCA, PwC states:52
We conclude that industry membership is generally not important for estimating the debt risk premium,
but single out the finance industry as an exception. Market participants consider that the yields of the
bonds of banks and finance companies trade materially differently from operating non-financial
businesses.
PwC further refers to the following evidence:53
In relation to this matter we interviewed Mr. Michael Bush, Head of Fixed Interest Securities at
National Australia Bank, who confirmed that the industry practice is to remove the bonds of financial
institutions when estimating FVCs for corporate bonds. Formal empirical analysis confirms this.
PwC refers to an empirical study using the US bond data (for 1987-1996), that observes that:54
…in general, the corporate spread for a rating category is higher for financials than it is for industrials.
While this observation was made for the US sample of 1987-1996, we are not aware of an empirical
study that would make a similar observation using current Australian bond data – specifically those in
the broad BBB credit rating range. One reason for this might be the scarcity of available bond data.
With respect to Chairmont’s observations, we note that in its analysis Chairmont mostly focuses on
the banking industry, and there are currently no BBB rated bonds in the BVAL sample issued by
banks. We consider that more evidence would be needed to conclude that the yields on the non-
financial bonds in the BVAL sample materially and consistently differ from those on the financial
bonds.
Ultimately, the AER would need to make a judgement on whether financial bonds are relevant
comparators for the benchmark debt instrument. We consider that WACC criteria (1) and (2) might be
of particular relevance for this assessment. Specifically, the AER would need to be satisfied that the
exclusion of financial bonds is informed by sound empirical analysis and is fit for purpose. The
AER’s original purpose is informed by the definition of the benchmark efficient entity and its
judgement of what represents a relevant set of comparators for the benchmark debt instrument. This
judgement, in turn, is informed by available evidence (or lack thereof).
Secured and unsecured bonds
The RBA and BVAL samples further diverge in their treatment of secured bonds. AUD BBB Corp
BVAL sample only includes senior unsecured bonds, while the RBA does not specify an equivalent
restriction on bond security. Currently the vast majority of Australian BBB-rated corporate bond are
unsecured bonds. However, there are currently (June 2014) more than 10 BBB-rated Australian
bonds, mostly in transportation and logistics sector (e.g., airports), which are secured. It is also
conceivable that this composition could change in response to more constrained market conditions.
In its 2012 report Chairmont Consulting noted that while ‘there are two components market
practitioners consider when forming expectations about total credit risk’, specifically, probability of
52
PwC, A cost of debt estimation methodology for businesses regulated by the Queensland Competition
Authority, June 2013, p.9.
53 PwC, A cost of debt estimation methodology for businesses regulated by the Queensland Competition
Authority, June 2013, p.9.
54 Edwin Elton, Martin J. Gruber, Deepak Agrawal, and Christopher Mann, Explaining the rate spread on
corporate bonds, February 2001, Journal of Finance, Vol. LVI, No. 1, p.253.
23
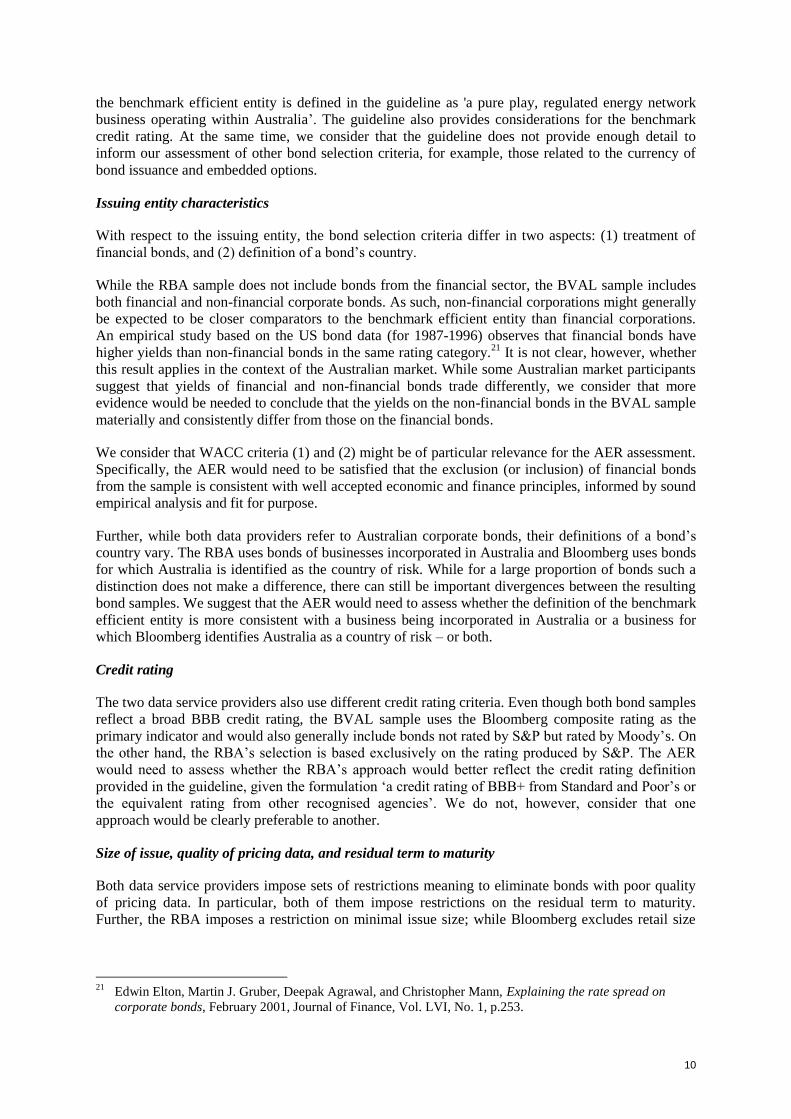
default and the loss given default, ‘the ratings that [credit] Agencies publish are an indicator of the
Probability of Default only’.55
Further:56
All other things equal (like ratings), potential holders of debt will always require greater compensation
for being lower down the capital structure… The marketplace is not and should not be indifferent to a
security position ranking in the capital structure.
Diagram I in the Chairmont’s report (reproduced in Figure below) puts senior secured debt higher
(i.e., as less risky) in the capital structure than senior (unsecured) debt.57
Figure
Our recent correspondence with S&P confirms that S&P evaluates primarily probability of default
while assigning a credit rating to a bond issue, whereas the security of a bond is related predominantly
to the recovery of loss given default:58
From our view point security is a recovery issue and independent of default probability. We give credit
to this in sub investment grade but not investment grade.
We suggest that, similarly to the considerations regarding the industry of the bond issuer, more
evidence would be needed to assess whether the inclusion of secured bonds in the bond sample is
warranted. Further, the AER would need to assess whether it is more appropriate to consider the
benchmark debt instrument to be secured or unsecured. As in the previous section, we consider that
WACC criteria (1) and (2) might be of particular relevance for this assessment. Specifically, the AER
would need to be satisfied that the exclusion (or inclusion) of secured bonds is reflective of economic
and finance principles, is informed by sound empirical analysis, and is fit for purpose.
Use of foreign currency bonds data
The single selection criterion that is currently likely to most affect the bond sample size and
composition of the two series is that related to the currency of bonds. Specifically, while the BVAL
55
Chairmont Consulting, Debt risk premium expert report, February 2012, p.10.
56 Chairmont Consulting, Debt risk premium expert report, February 2012, p.12.
57 Just referred to as ‘Senior Debt’ in the diagram.
58 E-mail correspondence with S&P, June 3, 2014.

24
curve only makes use of AUD-denominated bonds, the RBA bond sample includes bonds
denominated in AUD, USD, and Euros.
As we foreshadowed earlier, we suggest that the appropriateness (for the AER’s purposes) of
inclusion of foreign currency bonds in the sample depends on:
the difference between the credit spreads on the AUD bonds and hedged credit spreads on similar
foreign currency bonds in the sample, and
the AER’s assumptions about the benchmark debt instrument(s).
In his earlier report to the AER as a part of the rate of return guideline development, Associate
Professor Martin Lally recommended that foreign currency denominated bonds be excluded from the
return on debt calculations.59
He raised several concerns in this respect, including:
The QTC (2012) suggested that the principal US holders of USD denominated Australian bonds
typically hold them until maturity and therefore these bonds are not very liquid.60
Therefore,
while primary market data on such bonds would be rare, secondary market based estimates would
have low quality due to low liquidity of the market.61
If foreign currency denominated bonds are being used merely to assist in estimating the DRP of
a local currency bond, it may provide a poor estimate, as the DRPs from local and foreign
markets may differ due to a range of factors: ‘because local and foreign lender perceptions of the
default risk of Australian firms may be different, premiums for the relative liquidity of the bonds
may differ across markets, and the premiums for systematic risk are likely to be different’.
If foreign currency denominated bonds are used to better reflect the actual costs of a firm’s debt
finance, then this would raise an issue of also including bank debt in estimation. Further, the
optimal weights to be placed upon each source of debt will fluctuate over time (inversely with
relative costs), and the optimal weights at the current time will be unknown. Finally, some
businesses might not have access to foreign borrowing – for example, due to their limited size
and/or their lack of a credit rating. Then, there is an issue of whether these businesses with
limited foreign borrowing options should be treated in the same manner as the businesses that
have access to foreign borrowing.
With respect to the second and third issues above raised by Associate Professor Lally, similar
concerns were raised by the QTC and PwC. The QTC states:62
In relation to the weighting that could be apply to international data, the maximum would be based on
the proportion of debt that firms have sourced from those markets in recent issuance. For example, it
may be unreasonable to conclude that where Australian firms have issued into a market several years
ago (but not since), that the benchmark efficient firm would be able to issue debt during the reset
period.
59
M. Lally, Estimating the cost of debt of the benchmark efficient regulated energy network business, 16
August 2013, pp. 24-27.
60 QTC, 2012, Submission to the AEMC, Attachment 1, p.25.
61 The AER could potentially use the BVAL scores of the foreign bonds to draw conclusions regarding their
liquidity. However, the RBA does not use the BVAL scores as a bond selection criterion. The onus then
would be on the AER to continuously monitor the composition of the foreign bond sample used in the RBA
estimates.
62 QTC, 2012, Submission to the AEMC, Attachment 1, p.25.

25
While the use of international bond issuance data may be appropriate, especially while Australian NSPs
are active issuers in international markets, there is the risk that this could disadvantage NSPs if at the
time of their revenue determination the opportunities to issue in international markets have been
impacted by changing market conditions. In the case of bond data from any overseas market, expert
financial market input should be sought regarding the current ability of Australian firms to issue into
that market.
Further, on the question of using foreign debt markets data for cost of debt estimation PwC concludes
in its recent report to the QCA:63
In our view, the application of foreign debt market data to estimate the debt risk premium for the
benchmark Australian firm requires:
o Establishing the benchmark financing behaviour of the benchmark firm, i.e. discovering how
much debt on average is sourced from which overseas markets;
o Establishing a clear and replicable methodology for the conversion of foreign market data to
Australian dollar equivalent terms;
o The estimation of all additional transaction costs that would be incurred in sourcing debt from
international markets; and
o Undertaking a comparative analysis over a reasonable period of time to assess whether the
cost of debt differentials implied by a consideration of international debt market data is
justified by the additional complexity and data gathering costs, and the potential for more
disagreement (as foreshadowed by the Tribunal).
To assess what treatment of foreign currency bonds is more appropriate for the AER, we need to first
consider whether or not a version of ‘swap’ covered interest parity holds for the AUD, USD and
Euro-denominated bonds issued by Australian companies. This would imply that the difference
between the AUD bond credit spreads and the hedged foreign currency credit spreads on comparable
bonds is small (i.e., can be essentially attributed to transaction costs). If that is the case, then it would
be appropriate to treat the hedged credit spreads on the USD and Euro-denominated bonds similarly to
the credit spreads on the AUD-denominated bonds. This treatment would be appropriate regardless of
whether the AER’s benchmark debt instruments only include AUD-denominated bonds or also
comparable USD and Euro-denominated bonds.
However, as Lally’s report suggests, swap covered interest parity might not always hold for the bond
category we are interested in. In fact, it appears that even in highly liquid markets for short-term
instruments where covered interest parity is normally observed, significant deviations can occur in
times of market turbulence. For example, Levich provides a diagram of deviations from covered
interest parity at three-month maturity for AUD-USD currency pair showing a large spike around the
time of the GFC (reproduced below in Figure ).64
63
PwC, A cost of debt estimation methodology for businesses regulated by the Queensland Competition
Authority, June 2013, p.15.
64 R. Levich, Evidence on financial globalization and crises: interest rate parity, 31 August 2011, p.29.
[Published in The Evidence and Impact of Financial Globalization, Vol. 3, pp. 417-27, edited by Gerard
Caprio, Elsevier Publishing Inc., 2013; available at http://people.stern.nyu.edu/rlevich/research.html].

26
Figure
If the relevant swap covered interest parity is not observed – or is not always observed – then, the
AER’s assumptions about the benchmark debt instrument(s) become more important for the
assessment of the two bond samples. In particular, if the AER were to use only AUD bonds as the
benchmark debt instruments, then the RBA’s approach would not be well suited for the AER’s
purposes. Further, if the AER were to use both AUD and foreign currency bonds as benchmark debt
instruments, then it would need to assess whether the mix of bonds in the RBA’s and Bloomberg’s
bond samples is a good proxy for a mix of bonds in its portfolio of benchmark debt instruments. Since
Bloomberg’s sample includes AUD bonds only, it is unlikely to present a good proxy for such a
‘complex portfolio’ of benchmark debt instruments. On the other hand, the RBA’s sample is not
guaranteed to present a good proxy either. This is because the RBA’s bond sample contains bonds
issued in the past as well as new bonds. Hence, the sample proportions of bonds in different
currencies might not be reflective of the optimal proportions of a benchmark business issuing its debt
today (or in the near future).
For instance, visual inspection of graphs 3 and 6 of the RBA Bulletin article (reproduced below in
Figure and Figure ) suggests that the RBA bond sample composition has varied significantly over
time with respect to the ratio of domestic to foreign currency bonds. Given the considerations above,
it is unlikely that those dynamic proportions would be reflective of the optimal allocation of debt
issuance between different bonds at any point of time.
To conclude, we consider that the comparison of the two data series with respect to
inclusion/exclusion of foreign currency bonds would depend on the AER’s assumptions about the
benchmark debt instrument(s). Hence, it is not appropriate for us to make a recommendation at this
stage. We consider WACC criteria (1) and (2) to be of most relevance for the AER’s decision.
Specifically, the AER would need to assess whether or not the inclusion of foreign currency bonds in
the estimation sample is consistent with the relevant finance principles and informed by sound

27
empirical analysis. Further, the AER’s decision on what represents the benchmark debt instrument(s)
would inform which of the two approaches (BVAL or RBA) best fits the AER’s purpose.
Figure
Figure

28
Use of bonds with embedded options
Bloomberg excludes bonds with embedded structures (i.e., bonds with call and put options,
convertibles and sinking funds) from its BVAL curve sample.65
On the other hand, the RBA sample explicitly includes bonds with embedded options, in particular,
callable (including make whole callable), convertible, and puttable bonds.66
Further, the RBA Bulletin
article states that the securities with embedded options ‘tend to be over-represented at longer
maturities’.67
Taking into account the RBA’s econometric technique (that gives highest weight to the
observations closest to the tenor for which the estimation is performed), this would suggest that the
inclusion of such securities would have a more significant effect on the RBA’s credit spread estimates
for longer maturities.
The RBA points out that an adjustment is required to account for the optionality:68
The analysis is complicated by the inclusion of bonds with embedded options, where the optionality
affects the underlying value of the bond and, in turn, its yield and swap spread. This requires the use of
an option adjusted spread (OAS), which measures the spread that is not attributable to the value of the
option.
The RBA uses Bloomberg’s OAS estimates for the bonds with options other than make whole call
option. The RBA uses unadjusted spread for the latter category, since this category is currently not
incorporated into Bloomberg’s OAS calculations.
In a recent report to the QCA PwC removed callable bonds from its study sample with the following
justification:69
Call options were excluded since the observed yield needs to be adjusted to remove the effect of the
option, which adds complexity and the potential for analyst-induced error.
In its 2012 report Chairmont Consulting pointed out the following problems with estimating an OAS
of a (callable) bond in the context of Australian BBB corporate bond market:70
the type of options embedded in the instruments are not the type of option that can be valued
by a options pricing model like Black-Scholes; and
there is no observable credit curve from the issuers that reflects “standard” (unstructured non-
callable) debt to which a structured bond can be compared.
Bloomberg’s YASN function draws on a comparison of bond with an embedded option and a
‘standard’ comparable bond without embedded options.71
Therefore, unless a ‘standard’ curve is
available, OAS produced by YASN function would be of poor quality:72
65
Bloomberg product sheet, BVAL sector curves & issuer curves, p.2.
66 A make whole call is a provision that allows a borrower to prepay the remaining fixed rate term debt. The
borrower, however, has to make an additional payment that is derived from a formula based on the net
present value of the future debt payments.
67 I. Arsov, M. Brooks, M. Kosev, New Measures of Australian Corporate Credit Spread, Bulletin, December
Quarter 2013, p.19.
68 I. Arsov, M. Brooks, M. Kosev, New Measures of Australian Corporate Credit Spread, Bulletin, December
Quarter 2013, pp.18-19.
69 PwC, A cost of debt estimation methodology for businesses regulated by the Queensland Competition
Authority, June 2013, p.34.
70 Chairmont Consulting, Debt risk premium expert report, February 2012, p.28.

29
YASN is meant to be used to value options by comparing a yield curve of bonds with embedded
options to a yield curve of bonds without embedded options… YASN can’t be used because it is
supposed to be used to show an OAS of a structured security by comparing the structured security to a
(non-existent) standard security or yield curve that is observable in the marketplace.
On the other hand, visual examination of Graph 5 in the Bulletin article (reproduced in Figure below)
suggests that at present (and historically), the majority of bonds with embedded options in the RBA
sample have make-whole call options only.73
Therefore, they are treated by the RBA in the same
manner as bullet bonds and no adjustment for optionality is performed. To the extent that such an
approach is justified, the RBA’s treatment of bonds with embedded options is unlikely to cause major
concerns in terms of affecting the overall estimates. That is, of course, as long as the current trend
whereby most bonds with embedded options are make whole callable bonds continues into the future.
Powers and Tsyplakov (2008) estimate empirical incremental yields associated with make whole call
provisions for a set of US corporate bonds issued between 1995 and 2004 and model theoretical
incremental yields.74
The study suggests that the theoretical incremental yields for make-whole call
options are small (from approximately 2 bps to 5 bps on average, depending on the underlying
assumptions). The observed incremental yields for the entire sample average between 12 and 24 bps.
However, the analysis further indicates that in the later years of the sample period the observed
incremental yields begin to converge to model-generated values. Therefore, if this trend continues into
the future – and if the study bond sample is comparable with the make whole callable bonds in the
RBA sample, the RBA’s treatment of these bonds would appear reasonable.
Figure
71
Bloomberg Help provides the following description of YASN: ‘YASN provides a standardized yield
analysis calculator for structured notes so you can work up pricing and analyse risk. You can customize
various inputs, including volatility assumptions, to calculate price, yield, fixed-equivalent yields, and risk
and hedge ratios’.
72 Chairmont Consulting, Debt risk premium expert report, February 2012, p.33.
73 It appears that only 2-3 bonds in the 2013 sample have other types of embedded options.
74 E. Powers, S. Tsyplakov, What is the Cost of Financial Flexibility? Theory and Evidence for Make-Whole
Call Provisions, Financial Management, Vol. 37, No. 3 (Autumn, 2008), pp. 485-512.

30
In conclusion, if the AER considers the benchmark debt instrument to be a bond with no embedded
features, then, other things being equal, bonds with no embedded features would be closer
comparators than those with embedded features. At the same time, given the current and historical
composition of the RBA bond sample, we would not expect the optionality of some bonds in the
sample to have a major effect on the resulting estimates. That being said, more detailed analysis can
be performed using the RBA’s current and historical bond samples (subject to their availability). In
addition, it is conceivable that the composition and size of the subset of bonds with embedded options
used by the RBA could change over time (for example, if the proportion of bonds other than those
with make whole call provisions increases). Thus, if the AER chooses to use the RBA estimates, we
would advise to monitor the sample composition on an ongoing basis.
Accounting for outliers and other restrictions
In this section we consider the remaining differences in the restrictions imposed by the two data
providers on the bond samples.
Firstly, while both providers refer to bonds issued by Australian entities, their definitions of the
bond’s country vary. The RBA uses bonds with Australia listed as country of incorporation and
BVAL sample is restricted to those bonds with Australia identified country of risk. Below are the
relevant definitions from Bloomberg:75
Country of Incorporation
Specifies the ISO (International Organization for Standardization) country code of where a company is
incorporated…
Country of Risk
Returns the International Organization for Standardization (ISO) country code of the issuer’s country
of risk. Methodology consists of four factors listed in order of importance: management location,
country of primary listing, country of revenue and reporting currency of the issuer. … The following
methodology applies to listed/unlisted parent-subsidiary relationships:
If a subsidiary is listed, it will be assigned its own issuer country classification based on the
aforementioned criteria unless the subsidiary is supported/guaranteed by the parent.
If a subsidiary is unlisted, it will be assigned the issuer country classification of its parent
unless determined that there is no support/guarantee from that parent. …
While for a large proportion of bonds country of incorporation and country of risk are the same, there
are some important differences between the samples. For instance, BVAL constituents do not include
three BBB-rated bonds issued by Holcim Finance Australia, two of which appear to satisfy all of the
RBA bond selection criteria (the third one matures within less than a year). These bonds are excluded
from the BVAL sample because their country of risk is identified as Switzerland. On the other hand,
the current BVAL sample (as of 6 June 2014) includes a bond issued by Powercor Pty Ltd (maturing
in 2017) that lists Australia as a country of risk, but US as a country of incorporation.
Ultimately, the AER would need to consider which of the two definitions is more consistent with the
AER’s definition of the benchmark efficient entity.
Secondly, the two data providers use somewhat different criteria with respect to bonds’ credit ratings.
The RBA uses S&P credit ratings of individual bonds where available, and S&P issuer rating
otherwise. If neither is available for a bond, the bond is not included in the sample. Bloomberg uses
75
Since both data providers use BVAL bond data as a pricing source, presumably, both restrictions are based
on Bloomberg data fields.

31
Bloomberg composite ratings of individual bonds where available, otherwise either S&P or Moody’s
ratings of individual bonds are used, depending on which are available.
This difference can result in divergence between the two bond samples. For instance, bonds that are
rated by Moody’s but not by S&P would not be included in the RBA sample, but would be in
Bloomberg’s. Further, if a bond has a Bloomberg composite rating, it might be different from the
bond’s S&P rating. To the extent that ratings supplied by different credit rating agencies can be
considered as substitutable for each other, both the RBA’s and Bloomberg’s criteria appear to be fit
for purpose.
Thirdly, both data providers exclude several bonds from their sample. In particular, in the Bulletin
article the RBA suggested that some bonds were excluded from the sample due to some form of
duplication and some other special considerations (credit wrapped bond, bonds substantially
downgraded after GFC, as well as observations with negative spread).76
BVAL curve description, on
the other hand, specifies that an ‘outlier detection’ mechanism is used, so that:77
‘bonds that breach
certain yield-to-maturity thresholds are excluded from curve construction. Outlier detection prevents
instability associated with technical trading factors.’
An outlier detection and removal procedure with a similar, albeit more technical, description is used
by the ECB in construction of the Euro area government bond yield curves:78
Despite the …selection criteria, the yields of a few bonds may still deviate significantly from the rest.
To prevent noise in the yield curve estimation, these outliers are removed from the sample. Outliers are
traced separately for a number of residual maturity brackets. Bonds with yields that deviate more than
two standard deviations from the average are considered as outliers and are removed from the sample.
Within each of these brackets, the average yield and standard deviation are calculated. This procedure
is iterated in order to reduce the sensitivity of the analysis to potentially large outliers eliminated in the
first round that could have distorted the average yield level and the standard deviation.
BVAL constituents are available from the Bloomberg terminal, though only on the day of estimation.
Therefore, it might be possible to establish which bonds were considered by Bloomberg analysts as
outliers if one monitors the constituents sample over time.79
Establishing which exact bonds were
excluded by the RBA would rely on interpreting the information the RBA provided in the article,
since a list of exceptions is not publicly provided.80
Further, tracing excluded bonds over time (for
both Bloomberg and RBA) might be resource-intensive. As the example below illustrates, it is
difficult to describe an exhaustive set of bond sample selection criteria up front. Thus, whichever third
party data provider the AER uses, the provider would likely exercise a degree of discretion to adjust a
data sample over time. Ultimately, the AER needs to decide whether it is comfortable with the chosen
data provider exercising discretion on such occasions.
Example: The BVAL bond sample of 11 April 2014 contained three MTNs issued by Coca-Cola
Amatil Ltd (two of them are EMTNs, that is, they were issued into the European market in AUD). By
2 May 2014, already six Coca-Cola MTNs were BVAL constituents (five of them EMTNs; all six
were issued in 2012-2013). However, 30 May 2014 the BVAL sample does not contain any bonds
76
I. Arsov, M. Brooks, M. Kosev, New Measures of Australian Corporate Credit Spread, Bulletin, December
Quarter 2013, pp. 17-18.
77 Bloomberg product sheet, BVAL sector curves & issuer curves, p.2.
78 ECB, The new euro are yield curves, Monthly bulletin, February 2008, p.102.
79 The constituents need to be recorded daily, as Bloomberg does not currently allow viewing past constituents.
80 Upon our request, the RBA has provided us with a list of currently excluded bonds on a confidential basis.

32
issued by Coca-Cola Amatil. Bloomberg BVAL curve specialists provided the following explanation
for removing Coca-Cola bonds from the sample in response to our inquiry:81
The reason that some coca cola bonds appeared in the AUD BBB curve in April but not anymore is
because of internal changes we made. We assessed the AUD BBB curve and, whilst these coca cola
bonds are indeed BBB rated, they were much richer than other BBB rated AUD bonds (see attached
file). As such, we decided that the A rated curve (BVSC0160 Index) is more appropriate for these
bonds and better represents their yields, which is where you will be able to find them now.
The attached illustration is reproduced below (Figure ).
Note that based on our understanding of the RBA’s selection criteria all six Coca-Cola bonds would
have been included in the RBA BBB bond sample from 14 April 2014 onwards.
81
E-mail correspondence with Bloomberg (3 June 2014).

33
Figure
Coca Cola
Other bonds
34
Analysis of the curve-fitting methodologies
This section discusses the econometric techniques employed to estimate the yield curves, given a
sample of bonds. Bloomberg does not currently provide any publicly available information on its
curve-fitting methodologies, except that the estimated curve is a par yield curve and that ‘the
Bloomberg curve is fitted to observations by using an adaptive mix of zeroth and first order non-
parametric regression and subsequently smoothed by using rational Bezier polynomials’.82
For this
reason, this section focuses on the RBA methodology that is described in the December 2013 RBA
Bulletin article.83
The section is split into subsections addressing the following questions: (1) what
curve is being estimated; (2) what econometric techniques are used; (3) what adjustments are made to
the input data prior to estimation.
Par yield curves versus averaging of yields to maturities or credit spreads
A yield curve is a graphical representation of the term structure of interest rates, that is, a relationship
between residual maturities of a homogenous set of financial instruments and their computed interest
rates.84
This computation is made on the basis of market prices of underlying financial instruments, as
well as information on the future promised payments for these financial instruments, such as bond
coupon rate and redemption payment in case of fixed rate bonds.
One commonly used measure of ex ante (promised) return on a bond is yield to maturity (YTM), or
redemption yield. It is the bond’s internal rate of return — ‘the single interest rate at which the dirty
price of a bond is equal to the present value of the stream of cash flows discounted at this rate’.85
While YTMs are relatively straightforward to compute, their use in informing us about the underlying
term structure is limited. In particular, a YTM on a zero coupon bond is simply equal to the interest
rate corresponding to the remaining term to maturity on that bond. Therefore, if we have enough data
on zero coupon bonds, maturing at different points in time, we can recover the underlying term
structure from the YTMs of such bonds. However, in practice, such bonds are not always available
and most bonds issued by Australian corporations are coupon-bearing bonds. The relationship
between the interest rates and YTM of a coupon-bearing bond is more complex:86
When calculating the yield to maturity of coupon-bearing bonds, all payment flows (coupons and
redemptions) are discounted to current values at the same rate – i.e. the yield to maturity. Unless a
constant discount rate applies to all maturities, i.e. the term structure is flat, the (zero coupon) interest
rates – also referred to as spot rates – and yields to maturity of coupon bonds will differ.
In other words, YTMs on coupon-bearing bonds cannot be aggregated into a yield curve (or term
structure) in a straightforward manner:87
82
The former information is available, for example, from the AUD Corporate BBB BVAL Curve page on
Bloomberg terminal. The latter information is available from the description of the ‘Bloomberg curve fitter’
in Bloomberg CRV tool. Correspondence with Bloomberg representatives (24 June and 14 August 2014)
confirms that this description also applies to BVAL sector level curves.
83 I. Arsov, M. Brooks, M. Kosev, New Measures of Australian Corporate Credit Spread, Bulletin, December
Quarter 2013, pp. 15-26.
84 See, for example, ECB, The new euro are yield curves, Monthly bulletin, February 2008, p.97.
85 J. James and N. Webber (2000), Interest rate modelling (Wiley Series in Financial Engineering), p.6. The
dirty price is the price of a bond including any interest that has accrued since the issue of the most recent
coupon payment.
86 ECB, The new euro are yield curves, Monthly bulletin, February 2008, p.98.
87 Stephen M. Schaefer, The problem with redemption yields, Financial Analysts Journal, Vol. 33, No. 4 (Jul. -
Aug., 1977), p.59-60.
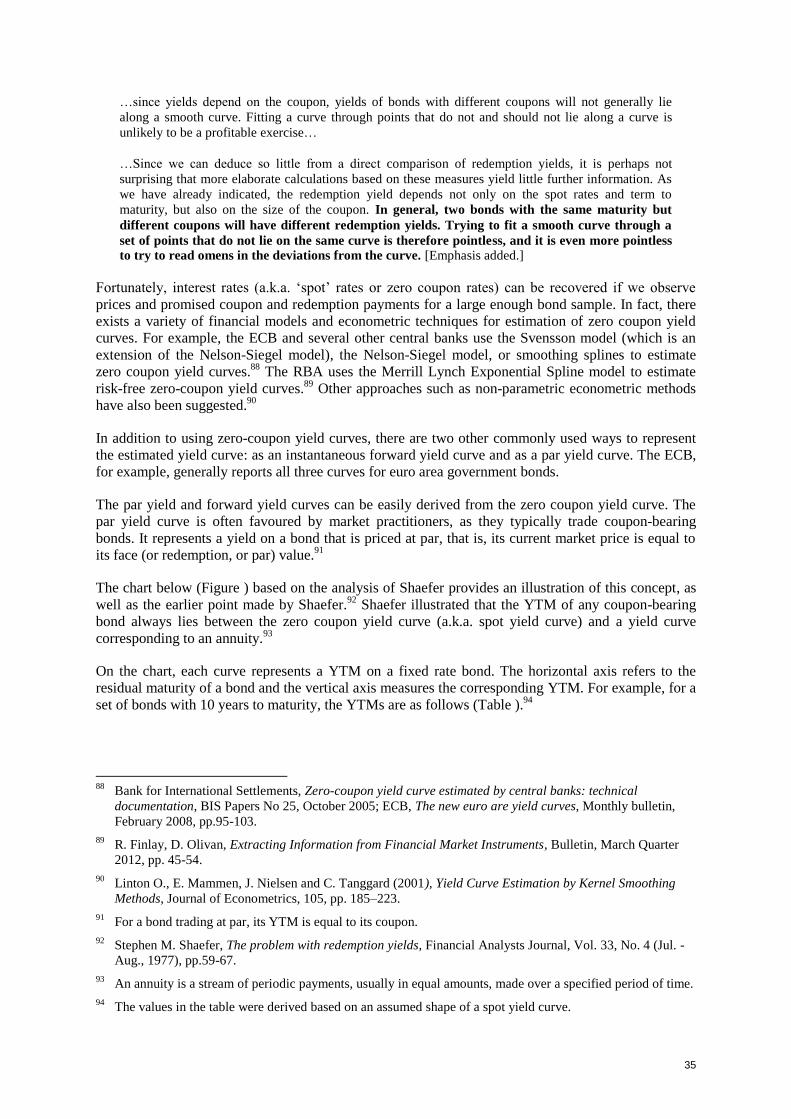
35
…since yields depend on the coupon, yields of bonds with different coupons will not generally lie
along a smooth curve. Fitting a curve through points that do not and should not lie along a curve is
unlikely to be a profitable exercise…
…Since we can deduce so little from a direct comparison of redemption yields, it is perhaps not
surprising that more elaborate calculations based on these measures yield little further information. As
we have already indicated, the redemption yield depends not only on the spot rates and term to
maturity, but also on the size of the coupon. In general, two bonds with the same maturity but
different coupons will have different redemption yields. Trying to fit a smooth curve through a
set of points that do not lie on the same curve is therefore pointless, and it is even more pointless
to try to read omens in the deviations from the curve. [Emphasis added.]
Fortunately, interest rates (a.k.a. ‘spot’ rates or zero coupon rates) can be recovered if we observe
prices and promised coupon and redemption payments for a large enough bond sample. In fact, there
exists a variety of financial models and econometric techniques for estimation of zero coupon yield
curves. For example, the ECB and several other central banks use the Svensson model (which is an
extension of the Nelson-Siegel model), the Nelson-Siegel model, or smoothing splines to estimate
zero coupon yield curves.88
The RBA uses the Merrill Lynch Exponential Spline model to estimate
risk-free zero-coupon yield curves.89
Other approaches such as non-parametric econometric methods
have also been suggested.90
In addition to using zero-coupon yield curves, there are two other commonly used ways to represent
the estimated yield curve: as an instantaneous forward yield curve and as a par yield curve. The ECB,
for example, generally reports all three curves for euro area government bonds.
The par yield and forward yield curves can be easily derived from the zero coupon yield curve. The
par yield curve is often favoured by market practitioners, as they typically trade coupon-bearing
bonds. It represents a yield on a bond that is priced at par, that is, its current market price is equal to
its face (or redemption, or par) value.91
The chart below (Figure ) based on the analysis of Shaefer provides an illustration of this concept, as
well as the earlier point made by Shaefer.92
Shaefer illustrated that the YTM of any coupon-bearing
bond always lies between the zero coupon yield curve (a.k.a. spot yield curve) and a yield curve
corresponding to an annuity.93
On the chart, each curve represents a YTM on a fixed rate bond. The horizontal axis refers to the
residual maturity of a bond and the vertical axis measures the corresponding YTM. For example, for a
set of bonds with 10 years to maturity, the YTMs are as follows (Table ).94
88
Bank for International Settlements, Zero-coupon yield curve estimated by central banks: technical
documentation, BIS Papers No 25, October 2005; ECB, The new euro are yield curves, Monthly bulletin,
February 2008, pp.95-103.
89 R. Finlay, D. Olivan, Extracting Information from Financial Market Instruments, Bulletin, March Quarter
2012, pp. 45-54.
90 Linton O., E. Mammen, J. Nielsen and C. Tanggard (2001), Yield Curve Estimation by Kernel Smoothing
Methods, Journal of Econometrics, 105, pp. 185–223.
91 For a bond trading at par, its YTM is equal to its coupon.
92 Stephen M. Shaefer, The problem with redemption yields, Financial Analysts Journal, Vol. 33, No. 4 (Jul. -
Aug., 1977), pp.59-67.
93 An annuity is a stream of periodic payments, usually in equal amounts, made over a specified period of time.
94 The values in the table were derived based on an assumed shape of a spot yield curve.
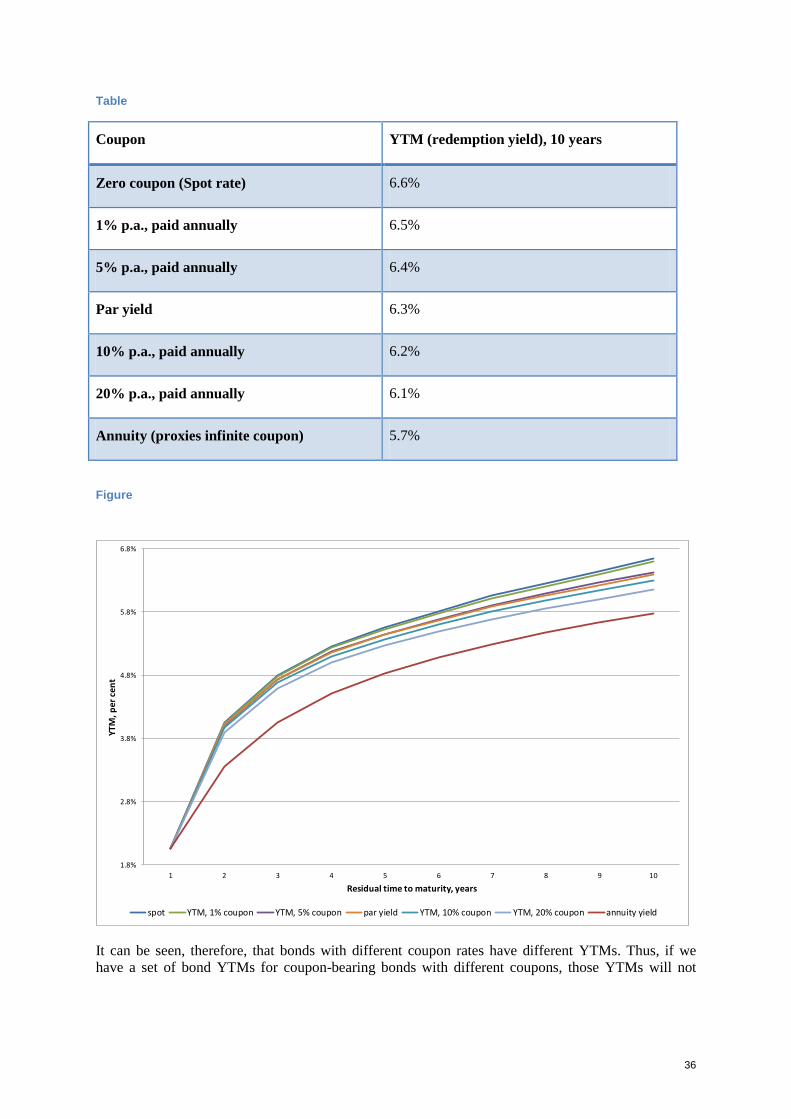
36
Table
Coupon YTM (redemption yield), 10 years
Zero coupon (Spot rate) 6.6%
1% p.a., paid annually 6.5%
5% p.a., paid annually 6.4%
Par yield 6.3%
10% p.a., paid annually 6.2%
20% p.a., paid annually 6.1%
Annuity (proxies infinite coupon) 5.7%
Figure
It can be seen, therefore, that bonds with different coupon rates have different YTMs. Thus, if we
have a set of bond YTMs for coupon-bearing bonds with different coupons, those YTMs will not
1.8%
2.8%
3.8%
4.8%
5.8%
6.8%
1 2 3 4 5 6 7 8 9 10
YTM
, per
cen
t
Residual time to maturity, years
spot YTM, 1% coupon YTM, 5% coupon par yield YTM, 10% coupon YTM, 20% coupon annuity yield

37
generally lie on the same curve.95
At the same time, we may expect there to be one zero coupon yield
curve and one par yield curve.
Bloomberg describes the BVAL curves as par yield curves. At the same time, the RBA’s
methodology is based on computing the weighted average of the bonds’ credit spreads. That is,
differences between the bonds’ YTMs and the corresponding swap rates. Such a method clearly does
not result in an estimate of either a par yield curve or a zero coupon rate curve. Therefore, strictly
speaking, the resulting estimate may only by chance accurately represent the underlying term
structure. This problem would be somewhat reduced if the bonds in the RBA sample, for instance,
trade at par at every estimation point. However, such a situation cannot be guaranteed, unless it is
added as a bond selection criterion. For example, the BVAL bond sample for 6 June 2014 has bonds
with coupon rates ranging from 4.5% to 8.25% and most of them trade at a premium.
In conclusion, in evaluating the appropriateness of the RBA’s and Bloomberg’s approaches for the
AER’s purposes, we suggest that AER needs to take into consideration WACC criteria (1) and (2).
That is, it needs to form an opinion of whether the RBA methodology (and, respectively, BVAL
methodology) is fit for the purpose of providing an estimate of the return on debt of the benchmark
debt instrument and whether, as such, it is consistent with well accepted economic and finance
principles. In our opinion:
(1) the RBA’s resulting estimate does not represent a par yield curve or a zero-coupon yield
curve. As such, it is not clearly consistent with well accepted finance principles.
(2) An estimated par yield curve, other things being equal, would fit the AER’s purpose better
than an estimate of an average yield/credit spread over a range of coupon-bearing bonds.
Use of econometric techniques
RBA methodology
The RBA provides the following summary of its econometric method:96
In this article, aggregate credit spreads of A-rated and BBB-rated Australian NFCs are estimated for a
given (target) tenor as the weighted average of the Australian dollar equivalent credit spreads over the
swap rate. The method is applied to the cross-section of bonds in the sample that have the desired credit
rating. The weights are determined by a Gaussian kernel that assigns a weight to every observation in
the cross-section depending on the distance of the observation’s residual maturity and the target tenor
according to a Gaussian (normal) distribution centred at the target tenor… The advantage of the
Gaussian kernel over other more simplistic weighting methods, such as an equally weighted average, is
that it uses the entire cross-section of bonds, albeit with weights approaching zero as the distance of the
bonds’ residual maturity from the target tenor increases. This provides a robust method capable of
producing estimates even when the number of available observations is relatively small.
In particular, the credit spread estimator for a target tenor T takes the following form:
( ) ∑ ( )
Where T is the target tenor, σ is the standard deviation of the Gaussian kernel, and Si is observed
spread for bond i in the sample of N bonds with the given broad credit rating. The weight for the
target tenor T of applied to observation i is determined as follows:
95
And similarly, neither will their spreads to a swap curve.
96 I. Arsov, M. Brooks, M. Kosev, New Measures of Australian Corporate Credit Spread, Bulletin, December
Quarter 2013, p.20.
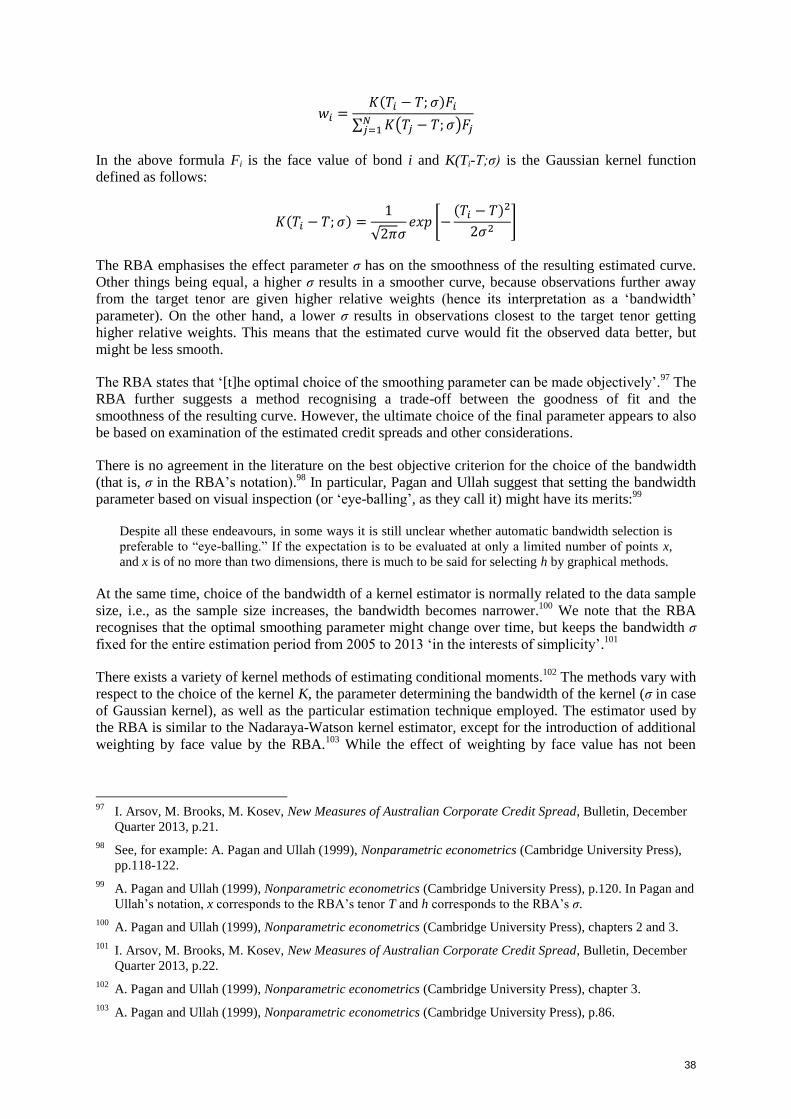
38
( )
∑ ( )
In the above formula Fi is the face value of bond i and K(Ti-T;σ) is the Gaussian kernel function
defined as follows:
( )
√ [
( )
]
The RBA emphasises the effect parameter σ has on the smoothness of the resulting estimated curve.
Other things being equal, a higher σ results in a smoother curve, because observations further away
from the target tenor are given higher relative weights (hence its interpretation as a ‘bandwidth’
parameter). On the other hand, a lower σ results in observations closest to the target tenor getting
higher relative weights. This means that the estimated curve would fit the observed data better, but
might be less smooth.
The RBA states that ‘[t]he optimal choice of the smoothing parameter can be made objectively’.97
The
RBA further suggests a method recognising a trade-off between the goodness of fit and the
smoothness of the resulting curve. However, the ultimate choice of the final parameter appears to also
be based on examination of the estimated credit spreads and other considerations.
There is no agreement in the literature on the best objective criterion for the choice of the bandwidth
(that is, σ in the RBA’s notation).98
In particular, Pagan and Ullah suggest that setting the bandwidth
parameter based on visual inspection (or ‘eye-balling’, as they call it) might have its merits:99
Despite all these endeavours, in some ways it is still unclear whether automatic bandwidth selection is
preferable to “eye-balling.” If the expectation is to be evaluated at only a limited number of points x,
and x is of no more than two dimensions, there is much to be said for selecting h by graphical methods.
At the same time, choice of the bandwidth of a kernel estimator is normally related to the data sample
size, i.e., as the sample size increases, the bandwidth becomes narrower.100
We note that the RBA
recognises that the optimal smoothing parameter might change over time, but keeps the bandwidth σ
fixed for the entire estimation period from 2005 to 2013 ‘in the interests of simplicity’.101
There exists a variety of kernel methods of estimating conditional moments.102
The methods vary with
respect to the choice of the kernel K, the parameter determining the bandwidth of the kernel (σ in case
of Gaussian kernel), as well as the particular estimation technique employed. The estimator used by
the RBA is similar to the Nadaraya-Watson kernel estimator, except for the introduction of additional
weighting by face value by the RBA.103
While the effect of weighting by face value has not been
97
I. Arsov, M. Brooks, M. Kosev, New Measures of Australian Corporate Credit Spread, Bulletin, December
Quarter 2013, p.21.
98 See, for example: A. Pagan and Ullah (1999), Nonparametric econometrics (Cambridge University Press),
pp.118-122.
99 A. Pagan and Ullah (1999), Nonparametric econometrics (Cambridge University Press), p.120. In Pagan and
Ullah’s notation, x corresponds to the RBA’s tenor T and h corresponds to the RBA’s σ.
100 A. Pagan and Ullah (1999), Nonparametric econometrics (Cambridge University Press), chapters 2 and 3.
101 I. Arsov, M. Brooks, M. Kosev, New Measures of Australian Corporate Credit Spread, Bulletin, December
Quarter 2013, p.22.
102 A. Pagan and Ullah (1999), Nonparametric econometrics (Cambridge University Press), chapter 3.
103 A. Pagan and Ullah (1999), Nonparametric econometrics (Cambridge University Press), p.86.

39
addressed analytically by the RBA, the RBA suggests that such weighting does not have a substantial
effect of the resulting estimates.104
A potential problem for the AER with using the Nadaraya-Watson kernel estimator for samples such
as the RBA’s bond sample is illustrated below. The overwhelming majority of bonds in the RBA’s
sample have a remaining time to maturity of less than 10 years (refer to Figure ) – which is the AER’s
tenor of interest. As is recognised by the RBA:105
At the end points of the tenor range (1 and 10 years, but particularly at the 1-year tenor), the Gaussian
kernel, and other similar methods, may be somewhat biased because there are no observations below
and above the target tenor. Effectively, the weighted average is calculated from bonds on only one side
of the estimation window. At the 10-year tenor, this is also an issue due to the sparse issuance above 10
years, but is less problematic for the A-rated bonds, for which some observations are available.
However, the degree of bias depends on the true shape of the credit spread curve, with steeper curves
resulting in more biased estimates.
Some kernel estimation methods — in particular, local linear regression — have better finite-sample
properties than the Nadaraya-Watson estimators.106
Pagan and Ullah suggest that:107
…unlike the Nadaraya-Watson kernel estimator, … [the local linear regression estimator’s] bias and
variance are of the same order of magnitude in both interior and near the boundary of the support…
It is generally the case that local linear regression estimator has smaller MSE than the kernel estimator
[Nadaraya-Watson]; this turns out to be particularly true around the boundary points.
Methods that allow for a variable bandwidth also generally improve the goodness of fit of the
resulting estimator.108
Estimation for terms to maturity close to the end of the sample
Below we provide an example of a potential problem with the RBA-style kernel estimator arising
close to the boundary of the bond sample – or, even more generally, in situations where the bond
sample distribution is asymmetric around a given maturity.
As of March 2014, the RBA BBB bond sample included 20 bonds with residual maturity of 1 to 4
years, 16 bonds with residual maturity of 4-6 years, 15 bonds with residual maturities of 6-8 years,
and 9 bonds with residual maturities of 8-12 years.
It can easily be seen that the distribution of the bond sample across maturities is not uniform – and
neither should it be expected to be uniform. All bonds that were originally issued at 8-12 years to
maturity would be expected to move into the next cohort down (6-8 years to maturity) as time passes,
unless they drop out of the sample (for instance, due to a default or a rating downgrade). Eventually,
we can expect them to be in the 1-4 years cohort. However, only those bonds that were originally
issued for a term longer than 8 years would ever make it into the 8-12 years cohort. Therefore,
104
I. Arsov, M. Brooks, M. Kosev, New Measures of Australian Corporate Credit Spread, Bulletin, December
Quarter 2013, p.21.
105 I. Arsov, M. Brooks, M. Kosev, New Measures of Australian Corporate Credit Spread, Bulletin, December
Quarter 2013, p.20.
106 As the name suggests, local linear regression means that a weighted linear regression analysis is performed
for each tenor of interest, with weights determined based on the chosen kernel K.
107 A. Pagan and Ullah (1999), Nonparametric econometrics (Cambridge University Press), pp.105-106.
108 A. Pagan and Ullah (1999), Nonparametric econometrics (Cambridge University Press), p.94.

40
generally speaking, we would expect to observe more bonds in the 1-4 cohort than other cohorts.
Further, we would expect the cohort of bonds with more than 8 years to maturity to be the smallest.
However, the weighting system applied to the credit spreads of individual bonds is symmetric around
the tenor of interest. For example, if the tenor we are interested in is 10 years and σ = 1.5 (as in the
RBA’s method), the corresponding weights applying to bond credit spreads of different remaining
term to maturity would be as follows.109
Table
Remaining term to maturity 5 6 7 8 9 10 11 12 13 14 15
( ) 0.00 0.01 0.04 0.11 0.21 0.27 0.21 0.11 0.04 0.01 0.00
That is, the largest weight would be given to the bond observations with 10 years to maturity, and
then the weights would decrease as the remaining term to maturity moves further away from 10 years.
Given an asymmetric bond distribution across remaining term to maturity and assuming that actual
credit spread increases with the term to maturity (which is often the case), we might expect the
resulting estimate to be biased downwards if there are more bonds in the sample with term to maturity
under 10 years relative to those over 10 year to maturity.
As noted above, to some extent this bias can be addressed by adjusting the kernel window width (σ)
depending on the number of observations. Further, this problem can be addressed by using a local
linear regression kernel estimator. However, while the RBA is aware of this concern, it is not
addressed by its current methodology. Therefore, we consider that it is unclear whether the RBA’s use
of econometric techniques satisfies the AER’s first and second WACC criteria, that is, whether it is fit
for purpose and informed by sound empirical analysis and robust data.
At the same time, there is very little information available in the public domain in relation to the
econometric approach used for BVAL curve estimation. As mentioned earlier, the only non-
confidential description of Bloomberg methodology we are aware of is the following:110
The Bloomberg curve is fitted to observations by using an adaptive mix of zeroth and first order non-
parametric regression and subsequently smoothed by using rational Bezier polynomials.
As far as we understand, ‘zeroth order non-parametric regression’ is likely referring to a non-
parametric regression that fits a constant, such as the Nadaraya-Watson approach, while ‘first order
non-parametric regression’ is likely referring to a local linear regression estimator. Thus, at first
glance, Bloomberg appears to be using a somewhat similar approach to that of the RBA, although
there would also be differences – for example, Bloomberg’s approach is estimating a par yield curve,
local linear regression appears to be used, and there is a separate smoothing step. However, a more
detailed comparison — and in particular that related to a potential bias and goodness of fit — is not
possible due to the limited amount of information available on the BVAL curve-fitting approach.
RBA’s conversion of the USD and Euro credit spreads into AUD credit spreads
Given the proportion of the foreign currency bonds in the RBA sample and their importance for the
credit spread estimation, especially at the longer maturities, we consider it would be important to
evaluate the conversion of the foreign currency credit spreads into those in AUD performed by the
109
We assume for simplicity that all bonds have identical face value. As the RBA suggests that weighting by
face value produces very similar results to not weighting by face value.
110 This information is available from the description of the ‘Bloomberg curve fitter’ in Bloomberg CRV tool.
Correspondence with Bloomberg representatives (24 June and 14 August 2014) confirms that this
description also applies to BVAL sector level curves.

41
RBA. However, we consider that the Bulletin article does not provide sufficient detail with regards to
the procedure to enable us to replicate the conversion or provide a comprehensive assessment of it.111
It appears that the procedure relies on the approximation of the exact conversion formula based on the
concept of bond duration similar to the procedure employed by PwC in its report to the QCA.112
We
note there are other potential approaches such as cross-currency spread matrix and swap manager
(SWPM) function available from Bloomberg. The RBA article notes its chosen methodology is
‘commonly used by market participants in practice’.113
111
The description is provided in general terms and is explained in approximately half a page of the article.
Upon request, RBA staff have provided further information on its conversion methodology, however this
information was provided on a confidential basis. The analysis in this report is based solely on non-
confidential information.
112 PwC, A cost of debt estimation methodology for businesses regulated by the Queensland Competition
Authority, June 2013, pp. 105-109.
113 I. Arsov, M. Brooks, M. Kosev, New Measures of Australian Corporate Credit Spread, Bulletin, December
Quarter 2013, p.25.
42
Errata (7 Nov. 14) Following the completion of this report “Return on debt estimation: a review of the alternative third
party data series: August 2014”, correspondence with the RBA has clarified certain minor matters of
methodology that are not accurately reflected in the report. Those aspects are as follows:
1. The report states that the RBA bond sample includes ‘both secured and unsecured senior bonds’.
In fact the sample is not limited to senior bonds.
Original text Correct text
Page 8, Table 1, column ‘RBA sample’;
‘Both secured and unsecured senior bonds’
‘Both secured and unsecured bonds’
Page 12; ‘Currently the majority of BBB
rated Australian senior bonds are unsecured’
‘Currently the majority of BBB rated
Australian bonds in the RBA sample are
unsecured’
Page 22; ‘AUD BBB Corp BVAL sample
only includes senior unsecured bonds, while
the RBA does not specify an equivalent
restriction on bond security. Currently the
vast majority of Australian BBB-rated
corporate bond are unsecured bonds.’
‘AUD BBB Corp BVAL sample only
includes senior unsecured bonds, while the
RBA does not specify an equivalent
restriction on bond security or seniority.
Currently the vast majority of Australian
BBB-rated corporate bonds in the RBA
sample are unsecured bonds.’
2. Figures 1-3 present yields for various bond series. The Bloomberg series are all plotted using
effective annual rates. The RBA series have not been converted to effective annual rates. The
figures plot yields reported in the RBA table F3, which the RBA indicates (in e-mail
correspondence on 16 October 2014) are not effective annual rates and ‘can be best thought of as
annual rates with semi-annual compounding’. Therefore, the RBA and Bloomberg yields in
Figure 1 are not plotted on a strictly comparable basis. The qualitative conclusions of the report
are not affected by this difference.


