34
Accelerating DevOps Performance Using Lean Metrics

Accelerating DevOps Performance Using Lean Metrics

@LeanAgilist
@DrGail

Agenda
1. Compare and contrast lean and agile values2. Accelerate DevOps performance using lean and
agile metrics3. Use the CUE model to solve organizational,
departmental, and team performance issues4. Discuss the importance of a DevOps culture
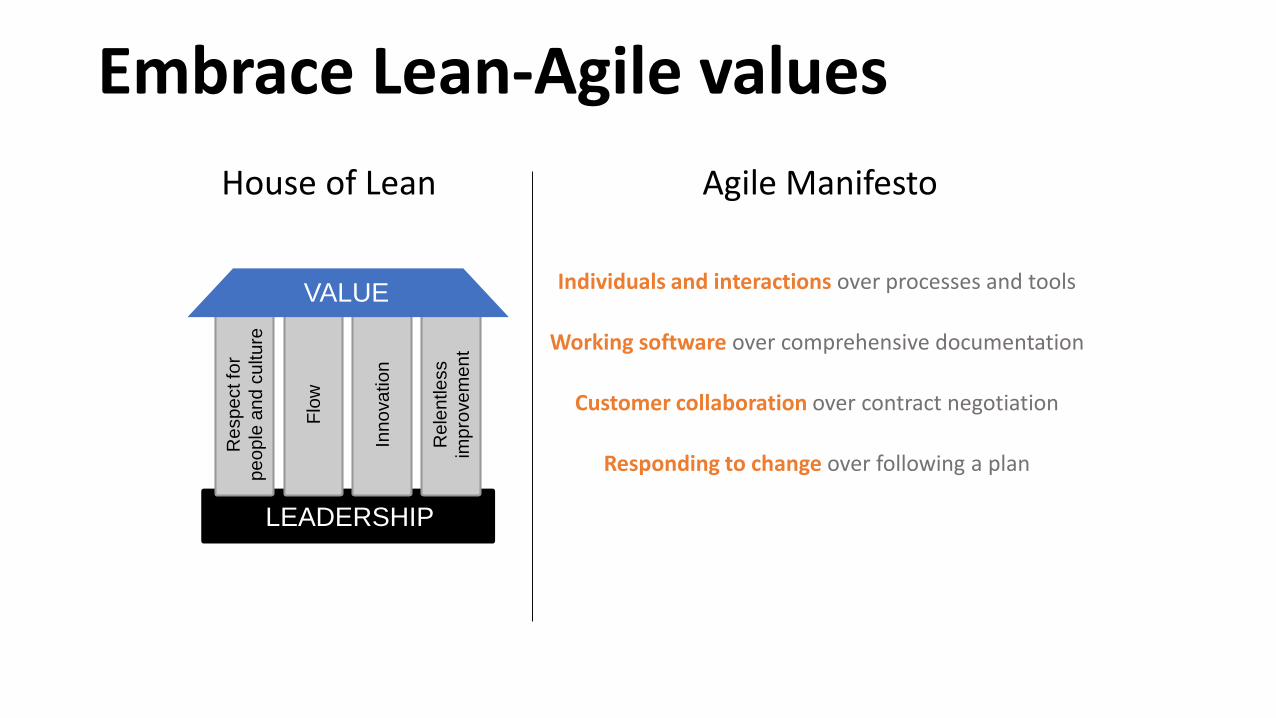
Embrace Lean-Agile values
LEADERSHIP
Re
sp
ect fo
r
pe
op
le a
nd
cu
ltu
re
Flo
w
Inn
ova
tio
n
Re
len
tle
ss
imp
rove
me
nt
VALUE
House of Lean
Individuals and interactions over processes and tools
Working software over comprehensive documentation
Customer collaboration over contract negotiation
Responding to change over following a plan
Agile Manifesto
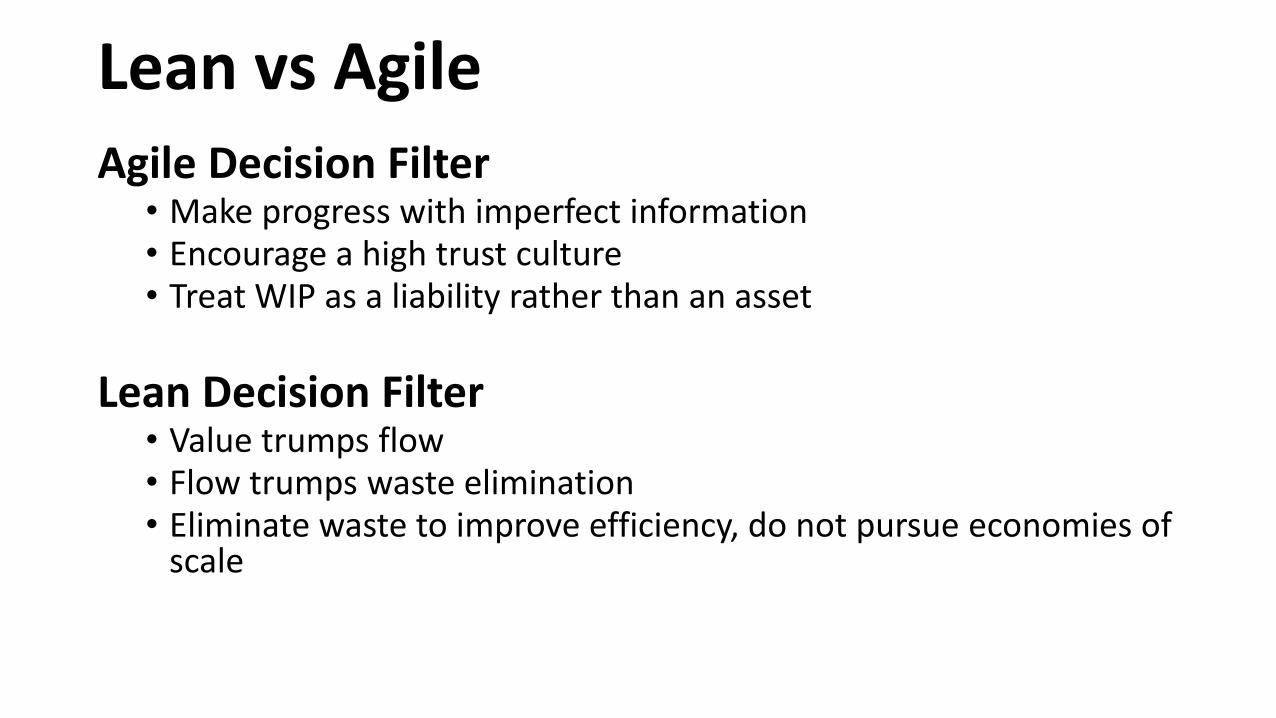
Agile Decision Filter• Make progress with imperfect information• Encourage a high trust culture• Treat WIP as a liability rather than an asset
Lean Decision Filter• Value trumps flow• Flow trumps waste elimination• Eliminate waste to improve efficiency, do not pursue economies of
scale
Lean vs Agile

Lean + Agile =

DevOps Tool Chain
TESTBUILDCODE PACKAGE RELEASE CONFIGURE MONITOR
Code Development and Review, Continuous Integration Tools
Version control tools, code merging, build status
Test and results determine performance
Artifact repository, Application pre-deployment staging
Change management, release approvals, release automation
Infrastructure configuration and management,Infrastructure as Code tools
Applications monitoring performance, End user experience
Build Release Operate

Lean Agile DevOps
Reduce Waste Increase Value Speed to Market
Quality Products Working Software Lower failure rates
Shortened Lead Time Improve Speed to Delivery
Increased DeploymentFrequency
ContinuousImprovement
Learning Organization Aligned Organization
Build a Kaizen Culture Collaborative Culture DevOps Culture
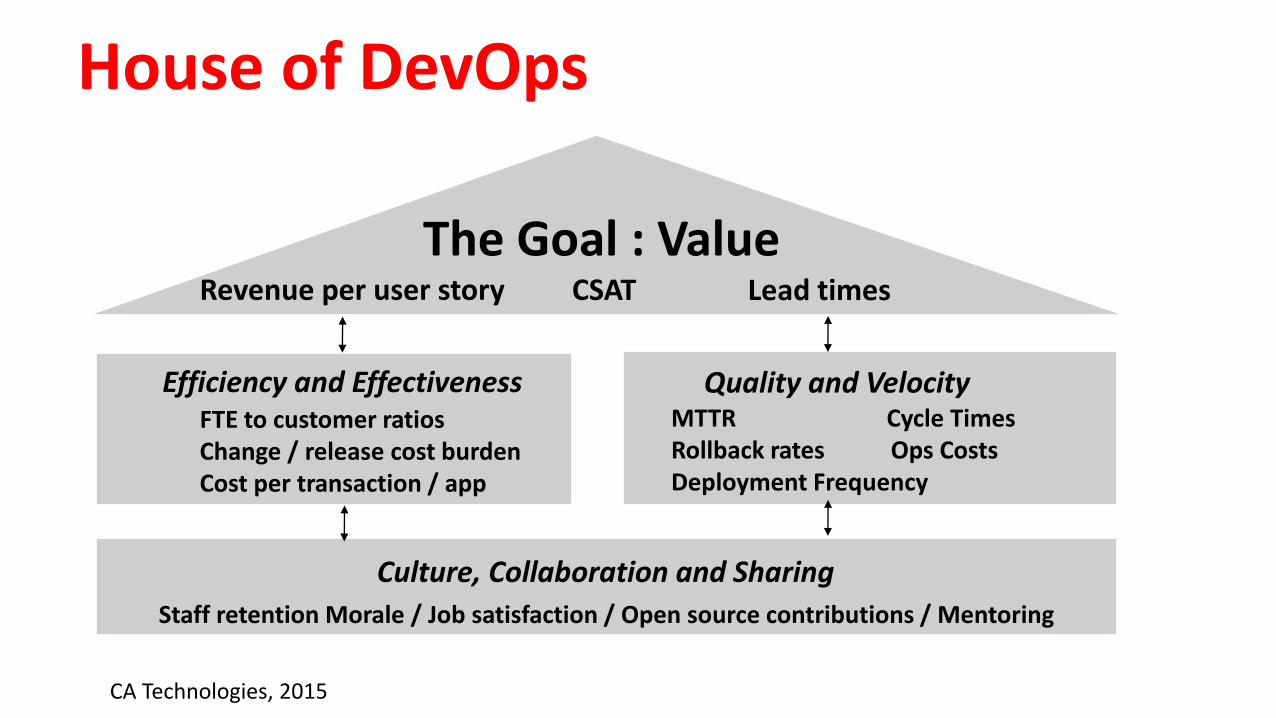
House of DevOps
The Goal : Value
Staff retention Morale / Job satisfaction / Open source contributions / Mentoring
Culture, Collaboration and Sharing
CSAT Lead timesRevenue per user story
FTE to customer ratios Change / release cost burden Cost per transaction / app
Efficiency and Effectiveness Quality and VelocityMTTR Cycle TimesRollback rates Ops CostsDeployment Frequency
CA Technologies, 2015
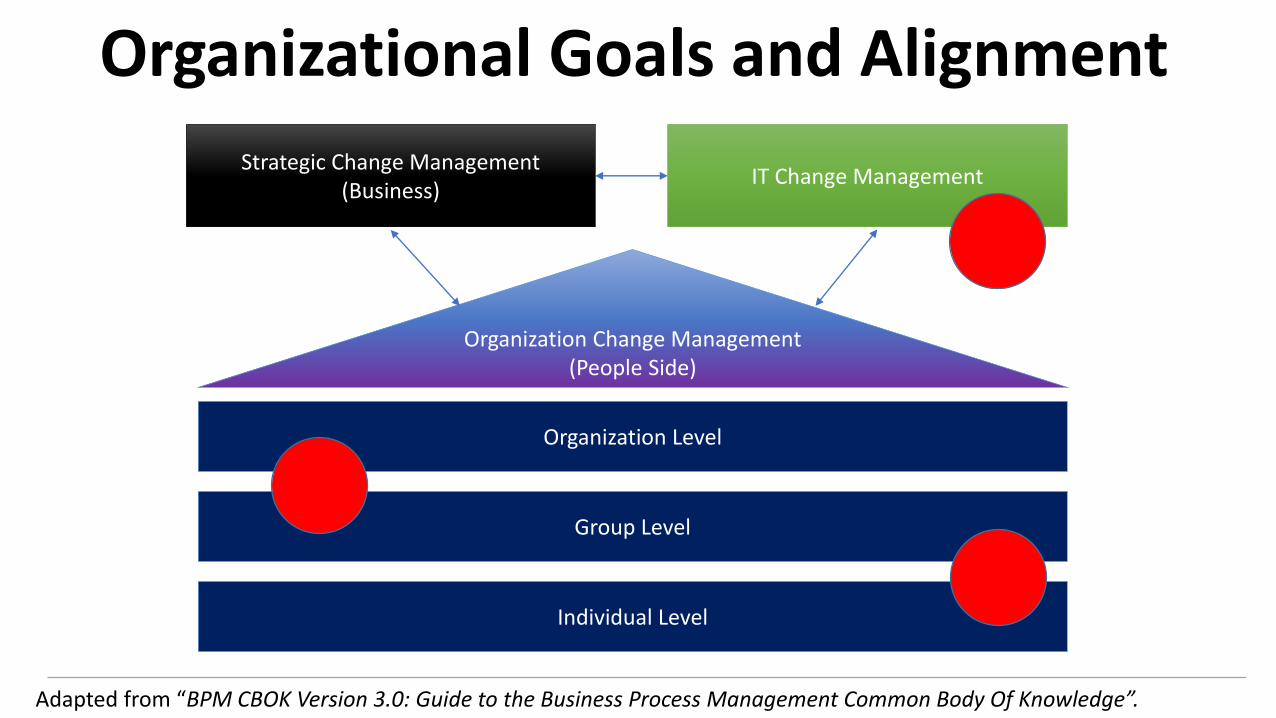
Organizational Goals and Alignment
Strategic Change Management (Business)
IT Change Management
Organization Change Management (People Side)
Organization Level
Group Level
Individual Level
Adapted from “BPM CBOK Version 3.0: Guide to the Business Process Management Common Body Of Knowledge”.

Remove Constraints (Bottlenecks)

Accelerating the DevOps Process
Speed to Market
Increased Deployment Frequency
Reduced Failure Rates

Accelerating the DevOps Process

Process Time
WIP
Lead Time
Wait Time
Throughput
Value
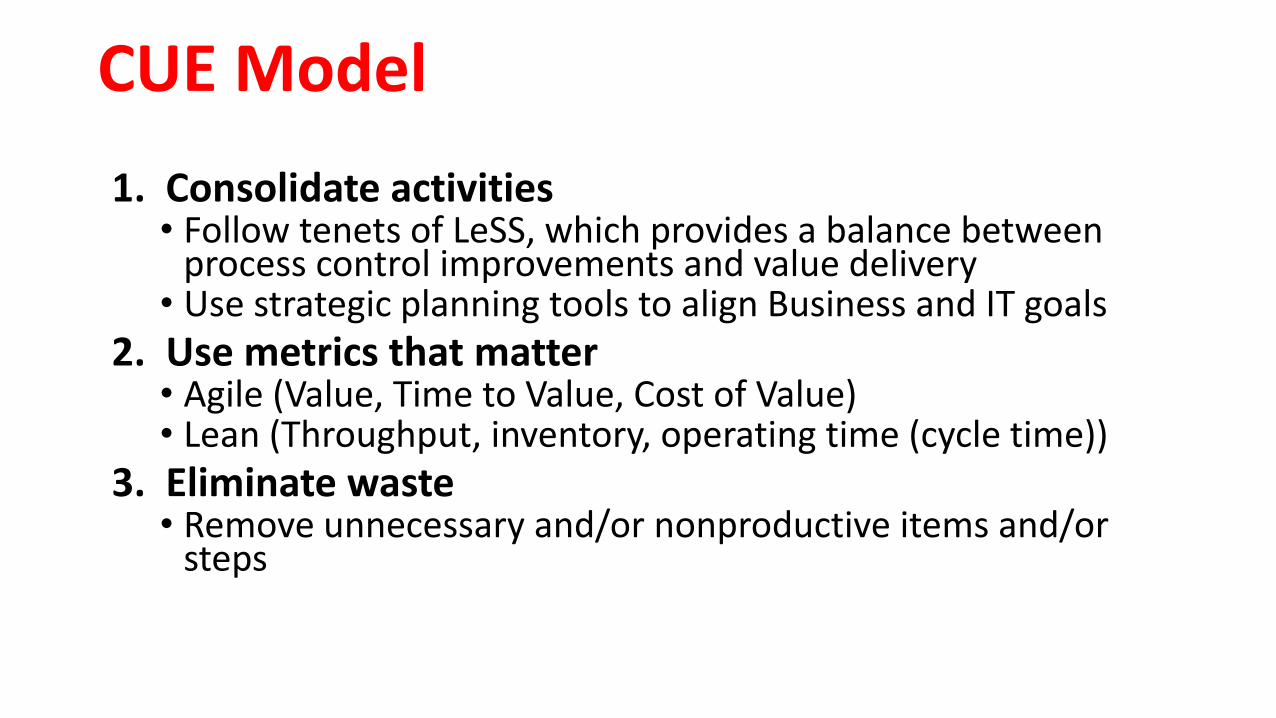
CUE Model
1. Consolidate activities • Follow tenets of LeSS, which provides a balance between
process control improvements and value delivery• Use strategic planning tools to align Business and IT goals
2. Use metrics that matter • Agile (Value, Time to Value, Cost of Value) • Lean (Throughput, inventory, operating time (cycle time))
3. Eliminate waste• Remove unnecessary and/or nonproductive items and/or
steps
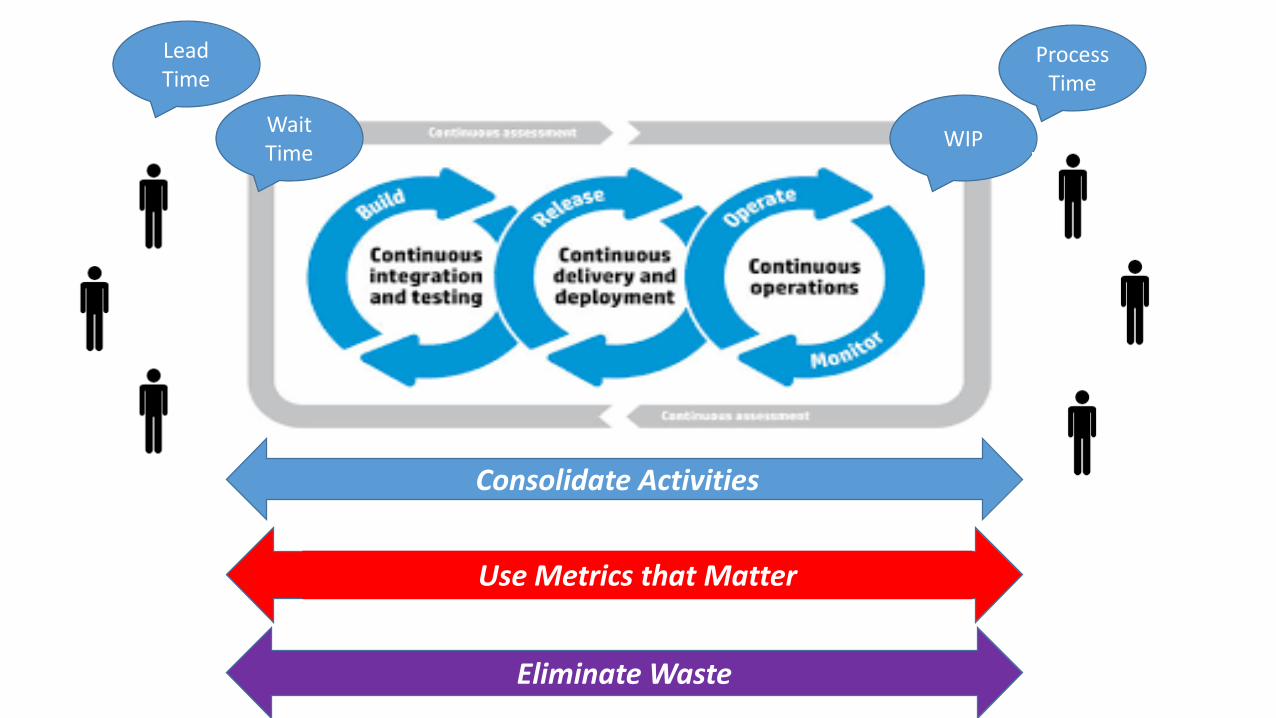
Process Time
WIP
Lead Time
Wait Time
Consolidate Activities
Use Metrics that Matter
Eliminate Waste
Consolidate Activities
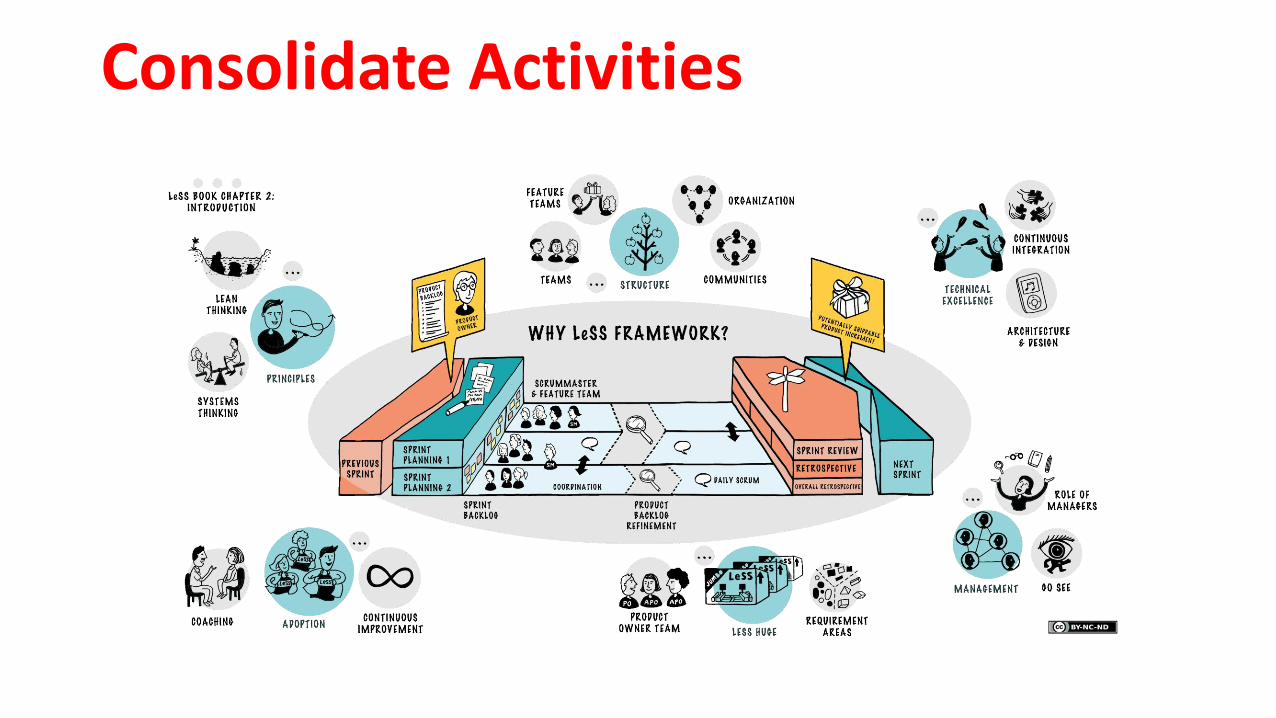
Consolidate Activities

1. What activities will you consolidate?
2. What activities will you not consolidate?
3. How will you consolidate activities?
CUE Model Exercise Step 1: ConsolidateIn teams of 3 people discuss and write down the following:

Use Metrics That Matter
• Answers the most important question you have• Forces you to draw a line in the sand• Focuses the entire company • Inspires a culture of experimentation
One Metric that Matters “You can’t manage what you can’t measure”1

1. What is the one metric that matters most?
2. What other metrics are important to your organization?
CUE Model ExerciseStep 2: Use Metrics That Matter
In teams of 3 people discuss and write down the following:

Eliminate Waste

Eliminate Waste

1. What are your areas of waste? 2. Where are your areas of waste? 3. Where are your constraints (bottlenecks)?
CUE Model Exercise Step 3: Eliminate Waste
In teams of 3 people discuss and write down the following:
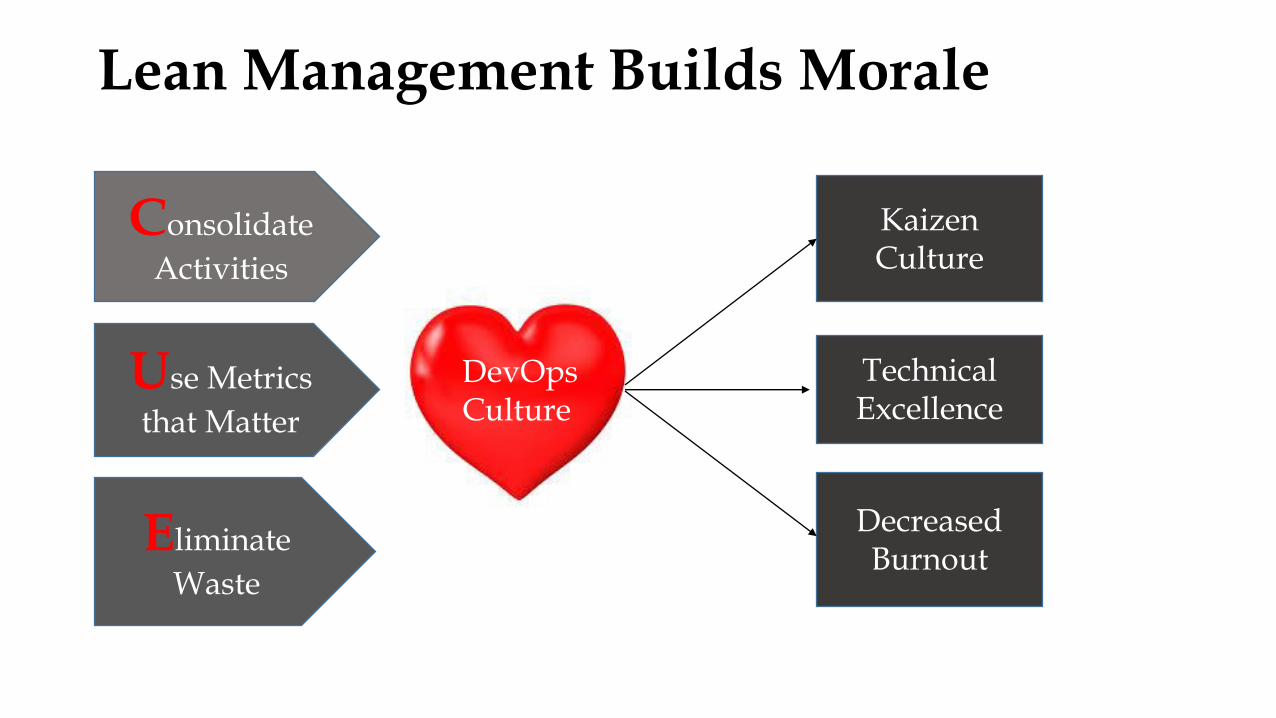
Lean Management Builds Morale
Kaizen Culture
Technical Excellence
Decreased Burnout
DevOps Culture
Use Metrics
that Matter
Eliminate
Waste
Consolidate
Activities

Summary
1. Lean + Agile practices encourage flow and improves throughput while creating valuable products.
2. Using the CUE model aligns goals to optimize processes and reduce waste.
3. Using Lean Management to improve DevOps processes fosters morale and culture.

A Few Good References

Appendices / Handouts

28 28
Lean vs. Agile ValuesLean Agile/Scrum/XP
Standardization Standard dev practices, framework usage, communications model
Value Threads Story Mapping from Roadmap to Release to MMF to Epic to Story
Automation Automated testing, Continuous Integration, Code Health, Easy Deploy
Line Stop (Jidoka,
Poka Yoke, Andon)
Refactor, Reuse, Big Visuals, Iterate, Incremental
Fail Fast Iterate, Inspect and Adapt, Retrospectives
No defects No defects, Definition of Done, Test Driven Development, Refactor, Shippable code
Go See Yourself Customer close by, Prototypes, Iterative and Incremental, Early Deploy
Remove Waste Customer close, decisions at lowest level, good estimation, actionable user stories, no gold-plating, team
instead of cowboy, remove needless metrics, automation of almost all testing, no over-the-wall, biz/IT
combined teams, simplify governance, daily stand-ups
Workload Leveling,
Concurrent Eng.
Small stories, slicing and swarming, cross-functional team, daily stand-ups
Quick Changeover Cross-functional team, simple and repeatable practices, no individual Code ownership, consistent build
and deploy, team rotations, daily stand-ups
Automation Automated test, integration, build, deploy tools, communication
Orthogonal Arrays OATS Pairing with Dev and QA, Automation
Increased accessibility to
Value
Efficiency & Capability,
Speed
Cost
QualityCustomer
Value
Value Stream
Flow
Customer
Pull
Perfection
Lean Principles
Lean
Tools
Reduce
Waste
+ Six Sigma
Optimaluse of
Resources
Cycle Time
“Lean” is a systematic,
continuous improvement
approach that focuses on
eliminating waste from
your processes.
Capacity Planning
(Queuing Theory)
Enterprise Backlogs, Product Backlogs, Prioritization based Biz Value, Release Planning.
Pull (Kanban) Prioritized backlog, Kanban (Scrum board) tracking/status, Feature focused, User Scenarios to Stories,
Personas, Iterative and Incremental, User Acceptance Testing, Sprint Goals, Sprint Planning (only 1-2
iterations),
Takt Time (customer
to customer)
Backlog to Production measurement
Single Piece Flow Small stories, feature based/slicing and swarming, Iterative and Incremental
Waste Elimination Only develop stories that are actionable, only do what’s absolutely necessary,
simplicity in all things, automation, excellence in engineering,

Lean + Agile =

The Seven Wastes

Lean Metrics Definitions
• Lead Time (LT): The elapsed time from receiving a customer request to delivering on that request. Lead Time = Process Time plus Wait Time.
• Wait Time (WT): The time that work sits idle not being worked.
• Work-in-progress (WIP): The amount of work in a system that has been started but not finished.
• Process Time (PT): Process time begins when the work has been pulled into a doing state and ends when the work is delivered to the next downstream customer.

Flow Metrics
• Throughput • Rate which inventory generates money through sales, not
just production.
• Inventory • Money invested in goods the firms intends to sell.
• Operating Expense• Includes all money the firm spends converting inventory into
throughput.

Metrics1. Number of bug fixes for top 20 systems2. Number of critical issues, average time to close and
longest time to close – looking just at the average may mask longer running issues
3. WIP: number of projects in each phase of the SDLC4. Customer feedback for top 5 systems – preferably actual
user feedback; failing that whatever you can infer from app usage. Top 5 systems may change over time as you launch new functionality or as usage changes according to the business calendar.
5. Percentage of projects who deliver 100% of their agreed scope
6. Core application availability – actual availability to users, not SLA adherence
![DevOps Culture: Connecting Dots [Decoding DevOps Conference - InfoSeption]](https://static.documents.pub/doc/80x56/55d2a717bb61eb826e8b45f4/devops-culture-connecting-dots-decoding-devops-conference-infoseption.jpg)


![Characterizing DevOps Culture: A Systematic Literature Revie · DevOps is about culture [3]: DevOps means a culture shift toward collaboration be-tween development, quality assurance,](https://static.documents.pub/doc/80x56/5ecc6a53bbbc2c3ed8293a26/characterizing-devops-culture-a-systematic-literature-devops-is-about-culture-3.jpg)


