39
“Accelerating Improvement in Patient Experience by Integrating Two Proven Methodologies: LSS Lean Daily Management and Influencer®” Presented by Greg Zobell and Teresa Deason

“Accelerating Improvement in
Patient Experience by Integrating Two
Proven Methodologies:
LSS Lean Daily Management and
Influencer®”
Presented by Greg Zobell and Teresa Deason
Introductions – Teresa Deason
• McCaw Cellular Communications
• Genie Industries
• Jefferson Healthcare
• The Everett Clinics
Teresa Deason is the President & Founder of Lean Synergy &
Solutions and Senior Consultant at JWA Consulting. Over 30
years experience in management , marketing, project
management, facilitation, training, quality improvement & lean.
Her lean expertise includes implementation of lean
management systems, value stream improvement, internal
consultant development, training and executive coaching.
• John C. Lincoln Health Network
• Children’s Hospital & Clinics of Minnesota
• Children’s Hospital Central California
• Nemours a Children’s Health System
Lean Clients include:

Introductions – Greg Zobell
Greg Zobell is the founder and managing partner of Zobell
Consulting, a consulting practice committed to inspiring service
and leadership excellence in healthcare organizations.
With over 30 years experience in Healthcare, Greg’s primary
role since November 2013 has been the Network Director for
the Patient Experience for the Scottsdale Lincoln Health
Network.
Healthcare Experience includes:
• Medical Technologist
• Associate Administrator at Good Samaritan Medical Center, Phoenix, AZ
• Associate Administrator at Banner Desert Medical Center, Tucson, AZ
• CEO, Kino Community Hospital in Tucson, AZ
Greg is a certified trainer for VitalSmarts Crucial Conversations®, Influencer®, and
ChangeAnything® & Crucial Accountability® courses.

“Deliver the
Best Patient Experience
in the Nation.”
Our Vision

Learning Objectives
• Understand the Six Sources of Influence
necessary for accelerated change.
• Learn how to integrate the LSS Lean Daily
Management System with the Influencer® Model
to improve specific HCAHPS results.
• Create a Patient Experience Daily Management
System Dashboard.

Challenge in Healthcare
Delivered Service Quality
• Versus industry norms
• Personal Needs
• Past Experience
• Word of Mouth
Expected Service
• Reliability
• Responsiveness
• Assurance
• Empathy
Perceived Service
“Would you recommend us to your friends & family?

Closing the Gap
Expected Service
• Reliability
• Responsiveness
• Assurance
• Empathy
Strategy
Standards
Execution
Communications
Delivered Service Quality
• Versus industry norms
• Personal Needs
• Past Experience
• Word of Mouth

Own the Gap
Strategy – Understand Patient Expectations
Standards – Delivery Clinical & Service Quality
Execution – Daily Action & Problem-solving
Communications – Outbound to Patient

LeadershipMindset
Methods
ManagementSystem1. Strategy Deployment2. Cross-functional Management3. Daily Management
Lean as the Management System

Good Results Come from Good Process
ResultsProcess
Nature of
people’s
actions at
the
process
• Quality
• Cost
• Delivery
• Safety
Process
outcomesConsequences
• Rewards (or lack of)
• Feedback
A lot of Toyota’s
management
focus is here
A lot of our
management
focus is here
Adopted from Mike Rother, Toyota Kata

A Model for Influencing Sustainable Change
Step 1. What
do you want to
achieve?Step 3. What are the
barriers?
Step 4. What tactics for all
Six Sources?
Step 2. What
few behaviors
will lead to the
greatest
amount of
change?

Key Steps for Sustainable Change
1. Identify the Goal/Target
2. Identify Vital Behaviors
3. Engage all 6 Sources of Influences
– Identify Barriers
– Identify Tactics
4. Daily Management to ensure Compliance,
Accountability & Transparency
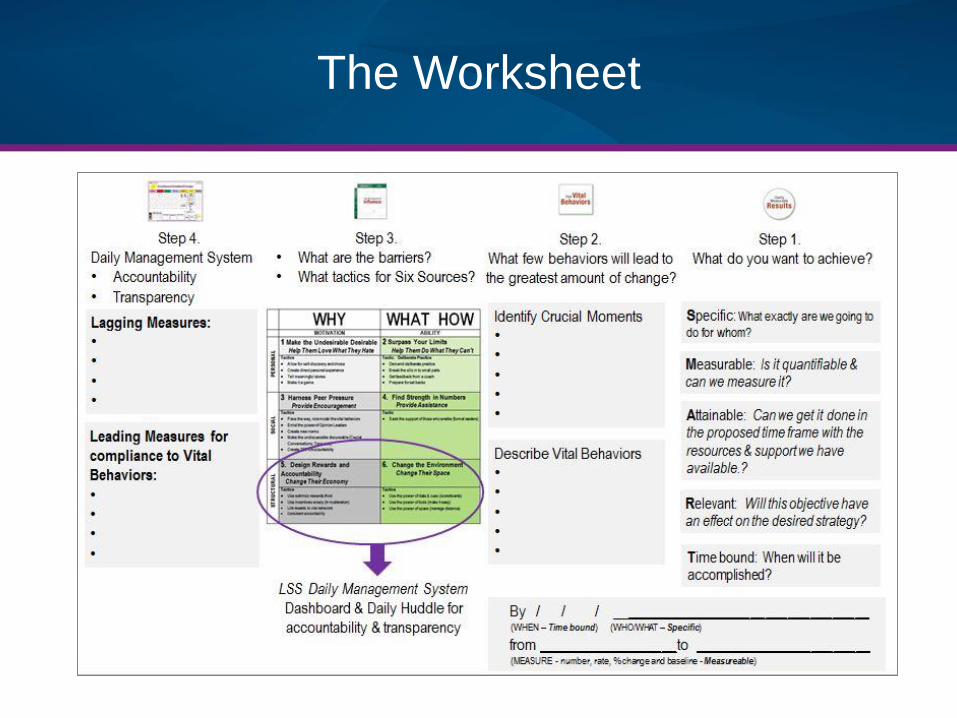
The Worksheet

The Influencer Model
Step 1. What
do you want to
achieve?Step 3. What are the
barriers?
Step 4. What tactics for all
Six Sources?
Step 2. What
few behaviors
will lead to the
greatest
amount of
change?

What do you want to Achieve?
Step 1 – Clarify Measureable Results
15
S
M
A
R
T
Specific
Measureable
Achievable
Reasonable
Timely
By / / / ______________________(WHEN – Time bound) (WHO/WHAT – Specific)
from ___________ to ___________________(MEASURE - number, rate, % change and baseline - Measureable)

Step 1. What do
you want to
achieve?Step 3. What are the barriers?
Step 4. What tactics for all Six
Sources?
Step 2. What
few behaviors
will lead to the
greatest amount
of change?
The Influencer Model

The Big Idea
1.The best way to improve results
is to focus not on results, but on
the behaviors that produce
them.
2.Even with complex and long-
standing problems, just a few
vital behaviors can lead to
enormous change.
Identify Vital Behaviors

What are the
recommended vital
behaviors when
experiencing a rattlesnake
bite?
Call 911.
Elevate the bite area.
Stay calm.
Drive yourself to the hospital.
Put ice on the bite.
Cut open the bite and attempt
to suck out the venom.
Use a tourniquet.
Vital Behaviors Quiz

What few behaviors will
lead to the greatest
amount of change?
Crucial Moments:
•
•Vital Behaviors:
•
•Identify Crucial Moments
•
•
•
Describe Vital Behaviors
•
•
•
Step 2 – Identify Vital Behaviors

Step 1. What do
you want to
achieve?Step 3. What are the barriers?
Step 4. What tactics for all Six
Sources?
Step 2. What
few behaviors
will lead to the
greatest amount
of change?
The Influencer Model

Step 3: Engage All Six Sources of Influence

There is a Big Tug of War going on

Tactics for all Six Sources

Accountability &
Transparency
for Vital
Behaviors
Step 3 – Engage all of the 6 Sources
Today’s Workshop Focus is
Sources 5 & 6

Step 4 – LSS Daily Management System
How can we measure compliance to vital
behaviors?
• Observation
• Self-auditing
• Peer-auditing
• Patient feedback
You must first
Establish the Standard
“Without standards, there can
be no improvement”
— Taichi Ohno

The Basics
Standard Work & Standard Work Audits
– Documented procedure owned by an
individual, used by everyone
– Standard work documented & has an owner
– Evidence that everyone follows the standard
Documented Standard Work
for Vital BehaviorsCompliance to Standard Work
Standard Work Audit
100
95
90
85
80
75
70
65
60
55
50
45
40
35
30
25
20
15
10
5
0
Au
dit
Sc
ore
(%
)
4/2
7/2
009
4/2
8/2
009
4/2
9/2
009
4/3
0/2
009
5/1
/200
9
5/4
/200
9
5/5
/200
9
5/6
/200
9
5/7
/200
9
5/8
/200
9
5/1
1/2
009
5/1
2/2
009
5/1
3/2
009
5/1
4/2
009
5/1
5/2
009
5/1
8/2
009
5/1
9/2
009
5/2
0/2
009
5/2
1/2
009
5/2
2/2
009
5/2
5/2
009
5/2
6/2
009
5/2
7/2
009
5/2
8/2
009
5/2
9/2
009
Team: Deer Valley Inpatient Charge Nurses Date: Sheet of
Process Description: Whiteboard communication
Product: Whiteboard standard work
Location: Inpatient JCL DV
Standard Work Owner: Brenda Hollenbeak/ Christina Ridings
Op Description PCT RNElapsed time
(Minutes)Notes
1 Notified of staff assignment 60 60 2
a. New admission/Transfer
b. Shift change
2 Fill out staff names/date/DR name/Phone #/Room # 120 2
3 Meet & Greet 60 3
a. Introduce self.
b. Review already written (#2) information with the patient.
c. If family present ask pt if it is ok to review info with family in room.
4 Ask/Fill out patients preferred name 30 4
5 Ask/Fill out patients contact name/# 120 6
6 Review diet, activity, and precautions 90 7
7 Review POC: setting shift goals 175 10
8 Review DC plan and expected date 35 11
9 Review pain management; scale/set goal/next med available 120 13
10 Review/educate medication and S/E 120 15
11 Questions for care team 60 16
Seconds 120 810 0
Minutes 2 14 0
Standard Work
Time (seconds)

Daily Structure of
accountability &
transparency
Identify WHAT to
measure?
Lagging Measures
Leading Measures
Step 4 – LSS Daily Management System
Lagging Measures:
•
•
Leading Measures for
compliance to Vital Behaviors:
• Compliance to Standard Work
•
•
Fro
m S
tep
1

Step 4 – LSS Daily Management System
28
Patient Experience
Standard Work Audit
Re
su
lt M
ea
su
res
DEER
VALLEY
NORTH
MOUNTAIN
OSBORN SHEA THOMPSON
PEAK
71 (55%tile) 77 (80%tile) 78 (82%tile) 74 (70%tile) 83 (93%tile)
76 (30%tile) 81 (75%tile) 74 (30%tile) 77 (40%tile) 85 (90%tile)
75 (10%tile) 80 (40%tile) 77 (20%tile) 80 (40%tile) 84 (70%tile)
57 (10%tile) 60 (20%tile) 64 (40%tile) 65 (43%tile) 74 (80%tile)
70 (40%tile) 68 (30%tile) 70 (40%tile) 78 (92%tile) 68 (30%tile)
73 (92%tile) 71 (87%tile) 63 (45%tile) 60 (25%tile) 73 (92%tile)
72 (45%tile) 74 (60%tile) 73 (50%tile) 66 (17%tile) 73 (50%tile)
60 (47%tile) 53 (25%tile) 45 (<10%tile) 48 (10%tile) 75 (92%tile)
90 (90%tile) 86 (60%tile) 81 (20%tile) 82 (25%tile) 90 (90%tile)
27 (23%tile) 32 (47%tile) 70 (83%tile) 65 (51%tile) 75 (98%tile)
Discharge Information
Food Quality
Responsiveness
Pain Management
Medication Communication
Cleanliness
Noise
Patient Experience Scores 03-03-14
Overall Hospital Rating
Nurse Communication
Physician Communication
Make it Visual
on a
Dashboard
Le
ad
ing
Mea
su
res

JOHN C. LINCOLN NORTH
MOUNTAIN CASE STUDY

Hospital Compare April 2012-March 2013Patient Experience Scores
National
Average
Arizona
Average OSBORN SHEA
THOMPSON
PEAK
DEER
VALLEY
NORTH
MOUNTAINOverall Hospital Rating
70 69 68 72 77 69 67Nurse Communication
78 76 73 75 77 73 72Physician Communication
81 77* 69 75 76 72 72
Responsiveness
67 65 64 63 62 62 57Pain Control
71 70 69 73 75 68 68Medication Communication
64 62 57 61 62 60 57Cleanliness
73 69 68 70 75 64 70Noise
61 57 47 52 66 53 51Discharge Information
85 85 78 81 78 84 82
These
scores are
adjusted for
Mode and
Estimated
Patient Mix
Below National Average
Top Quartile
SLHN Hospitals – Apr 2012-Mar 2013
HCAHPS Patient Experience Scores

Key #2:
Find
Vital
Behaviors
Key #3:
Engage all
Six
Sources of
Influence Find Vital BehaviorsA high-leverage action that, if routinely
enacted, will lead to the results you want.
Tend to lead directly to better results
Tend to break us out of self-defeating
patterns of behavior
Tend to cause many other behaviors to
flow naturally.
Identify Crucial MomentsThe point in time where the right behavior, if
enacted, leads to the results you want.
The Model: The New Science of Leading Change

Improving Medication Communication
1. Clearly write New Medication
and 2 Side-effects on every
Whiteboard
2. Conduct Teach-back with
every patient on new
Medications
3. Leadership Audit of vital
Behaviors
Identify Crucial Moments Nurse Leader Rounding to Patients
Executive Leader Rounding with Nurse
Leaders to the Patients
Whiteboard Dialogue with Patients
Pain Management (Control)
Call Button Response
Communication about Medication
Discharge Instructions
Service Recovery on
concerns/complaints
Room/bathroom cleanliness
Noise Control
Discharge Phone Calls
Shift Change
Doctor Communication
Motivation Ability
Pers
on
al
So
cia
lSt
ruct
ura
l
Service Standards
and Behaviors
Patient Rights
“The Right Thing to Do”
HCAHPS survey results
Active listening to patient
feedback (Stories)
Study Best Practices
Understand Default
Future
Deliberate Practice of Teach-
Back Skills
Nursing Leader Rounding &
/Coaching Skills
Standard Work
Nurses keep daily score on
Medication Communication
Enlist the power of opinion
leaders in Hospital Team
focused on improving
Medication Communication
Daily Management System
with Daily Huddles
Practice Accountability
Leader audit through
rounding
Leader Feedback and
Coaching
Daily Management System
Accountability
Reporting in Leader Huddles
Pharmacy providing
Medication Information
Meaningful rewards and
celebrations
Performance
appraisals and other
formal Accountability
Compensation system
Whiteboards in patient
rooms
Weekly HCAHPS
Scoreboards
Standard Work Checklists
Standards/Behaviors
visual cues: posters,
Standard of the Month
Medication Information
folders in Patient Rooms
To achieve 64
% Always for
Medication
Communication
by December
31, 2013.
(67% Always
by 12/31/15)
Will it be worth it? Can I/we do it?
Key #2:
Find Vital Behaviors
Key #3:
Engage all Six Sources of
Influence

Purpose: To ensure that all RNs utilize and exhibit the
vital behaviors for medication education with our patients.
Process Steps:
1. Inform Patient of Medication & Side Effects
2. Update Whiteboard
3. Educate Patient Using the Side Effect Teaching Sheet
4. Conduct Patient Teach Back
5. Document Care Notes
6. Update Discharge Folder
Vital Behaviors: Medication Communication

Engage 6 Sources: LSS Daily
Management System
34
Patient Experience
Lag
gin
g R
esu
lt M
easu
res
DEER
VALLEY
NORTH
MOUNTAIN
OSBORN SHEA THOMPSON
PEAK
71 (55%tile) 77 (80%tile) 78 (82%tile) 74 (70%tile) 83 (93%tile)
76 (30%tile) 81 (75%tile) 74 (30%tile) 77 (40%tile) 85 (90%tile)
75 (10%tile) 80 (40%tile) 77 (20%tile) 80 (40%tile) 84 (70%tile)
57 (10%tile) 60 (20%tile) 64 (40%tile) 65 (43%tile) 74 (80%tile)
70 (40%tile) 68 (30%tile) 70 (40%tile) 78 (92%tile) 68 (30%tile)
73 (92%tile) 71 (87%tile) 63 (45%tile) 60 (25%tile) 73 (92%tile)
72 (45%tile) 74 (60%tile) 73 (50%tile) 66 (17%tile) 73 (50%tile)
60 (47%tile) 53 (25%tile) 45 (<10%tile) 48 (10%tile) 75 (92%tile)
90 (90%tile) 86 (60%tile) 81 (20%tile) 82 (25%tile) 90 (90%tile)
27 (23%tile) 32 (47%tile) 70 (83%tile) 65 (51%tile) 75 (98%tile)
Discharge Information
Food Quality
Responsiveness
Pain Management
Medication Communication
Cleanliness
Noise
Patient Experience Scores 03-03-14
Overall Hospital Rating
Nurse Communication
Physician Communication
Lea
din
g M
easu
res
Daily Tracking of Compliance to Standard Work
Weekly
Medication Communication
Total HCAHPS
Quarter to Date
Leader Rounding Compliance
White Board Compliance
Bedside Report

John C. Lincoln North Mountain Hospital
Measures2012
Jan-2013
Feb-2013
Mar-2013
Q1 Q1Apr-2013
May-2013
Jun-2013
Q2 Q2Target
BaselineMo.
ActualMo.
ActualMo.
ActualQT
ActualMo.
TargetMo.
ActualMo.
ActualMo.
ActualQTD
ActualMo.
Target2013
Patient Experience n=145 n=117 n=106 n=375 n=182 n=153 n=124 n=472
HCAHPS % 9 or 10 69 64 59 67 64 69 67 72 69 68^ 69 71
HCAHPS - Nursing 73 73 69 73 71 73 78 75 75 76 75 79
HCAHPS - Doctors 74 73 71 72 72 75 80 74 77 77 75 81
HCAHPS - Call Button Response 57 61 54 63 58 59 64 50 57 61 62 66
HCAHPS - Pain 70 65 57 71 65 70 73 69 72 71 70 71
HCAHPS - Medication 58 53 62 62 58 57 72 69 73 71 62 64
HCAHPS - Cleanliness 71 72 65 68 69 69 71 70 74 71 70 73
HCAHPS - Noise 52 50 47 49 49 52 56 54 60 56 54 60
HCAHPS - Food 29 24 18 24 22 29 24 38 25 29^ 30 34
HCAHPS-Discharge Instructions 84 81 81 86 82 84 86 86 87 86 84 85
ED Overall Satisfaction 44 51 48 52 50 45 48 54 50 50 46 50

The Results – Medication Communication
Mode adjustments and ESTIMATED Patient Mix Adjustments have been applied
to the dimension scores. Scores for the individual questions do not have adjustments applied.
FY 2016
VBP
Thresholds
John C Lincoln North Mountain Hospital Phoenix, AZ
Ap
r-Ju
n
11Ju
l-S
ep
11O
ct-D
ec
11Ja
n-M
ar
12A
pr-
Jun
12Ju
l-S
ep
12O
ct-D
ec
12Ja
n-M
ar
13A
pr-
Jun
13Ju
l-S
ep
13O
ct-D
ec
13Ja
n-M
ar
14
62.33 68.13 72.77Communication about
Medications56.1 58.9 62.5 63.5 55.0 55.4 57.3 57.9 70.8 64.7 68.6 71.81
62.
33
68.
13
72.
77Med Explanation 73.3 75.9 78.3 80.4 72.7 74.0 75.4 75.7 82.9 78.1 80.3 83.1
62.
33
68.
13
72.
77Med Side Effects 46.2 49.2 54.0 53.9 44.6 44.2 46.6 48.1 66.8 59.3 64.8 67.1
0.0
0
0.0
0
0.0
0Number of Surveys 191 191 180 270 209 219 256 185 228 219 223 154
90
thP
erc
en
tile

0
10
20
30
40
50
60
70
80
2009 2010 2011 2011 4Q 2012 1Q 2012 2Q 2012 3Q 2012 4Q 2013 1Q 2013 2Q 2013 3Q 2013 4Q 2014 1Q
EMRImplementation
Influencer
Begins
John C. Lincoln North Mountain Hospital
Medication Communication
DMS
Refresh
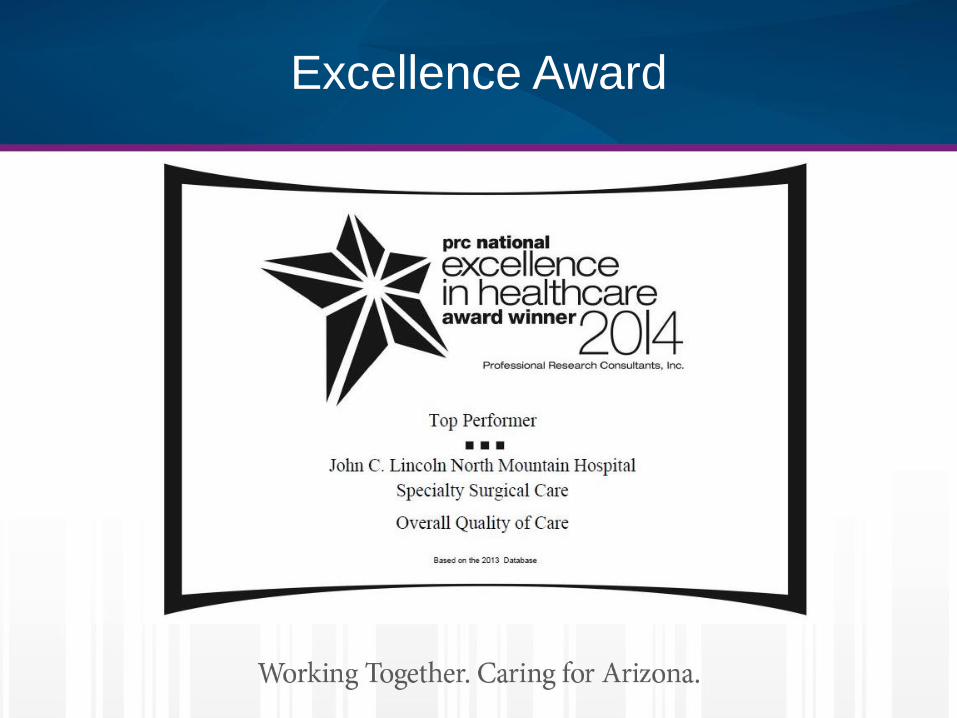
Excellence Award

Questions & Answers


