207
ACCELERATION AND EXPANSION OF INDONESIA ECONOMIC DEVELOPMENT 2011-2025 MASTERPLAN REPUBLIC OF INDONESIA

ACCELERATION AND EXPANSION OF INDONESIA ECONOMIC DEVELOPMENT 2011-2025
MASTERPLAN
R E P U B L I C O F I N D O N E S I A


Doc. Wijaya Karya

Masterplan for Acceleration and Expansion of Indonesia Economic Development
© Copyright Coordinating Ministry For Economic Affairs, Republic of Indonesia
Published by : Coordinating Ministry For Economic Affairs
Editor : Deputy Minister for Coordinating Infrastructure and Regional
Development, Coordinating Ministry For Economic Affairs
Design by : IndoPacific Edelman
First Published 2011
All Rights Reserved
Coordinating Ministry For Economic Affairs, Republic of Indonesia
Masterplan for Acceleration and Expansion of Indonesia Economic Development
Jakarta: Coordinating Ministry For Economic Affairs, 2011
212 pages; 28 x 30 cm
ISBN 978-979-3754-14-7

MasterplanaCCeleratIOn anD eXpansIOn OF InDOnesIa
eCOnOMIC DeVelOpMent 2011-2025
Coordinating Ministry For Economic Affairs
Republic of Indonesia

Table of Contents
Masterplan P3EI Abstract
6
Preface from The President of Republic of IndonesiaAbstractHistorical Breakthrough in the Making of MP3EI
1.TheSelf-Sufficient,Advanced,Just,andProsperousIndonesiaA. PrefaceB.AccelerationandExpansionofIndonesiaEconomicDevelopmentC. Indonesia’sPositionWithinTheRegionalandGlobalDynamicsD.Indonesia’sPotentialandChallengesE. AccelerationofEconomicTransformation-ANewWayofWorking
(Not Business as Usual)F. MP3EI-AnIntegralPartofNationalDevelopmentPlanningG.FrameworkDesignofMP3EI
2.BasicPrinciples,PrerequisitesforSuccessandMainStrategiesofMP3EIA.BasicPrinciplesandPrerequisitesforSuccessfulImplementationofMP3EIB. ImprovingRegionalEconomicPotentialThroughTheDevelopmentofSix
Economic CorridorsC. StrengtheningNationalConnectivityD.StrengtheningHumanResourceandNationalScienceandTechnology
Capabilities
81011
131415151720
2324
27
2831
3339
Doc. Wijaya Karya Doc. Wijaya KaryaDoc. Astra Otoparts

4546517496
120140156
177178179183
184185192
3. Indonesia Economic CorridorA. Posture of Indonesia Economic CorridorB. Sumatra Economic CorridorC. JavaEconomicCorridorD.KalimantanEconomicCorridorE. Sulawesi Economic CorridorF. Bali – Nusa Tenggara Economic CorridorG.Papua–KepulauanMalukuEconomicCorridor
4.TheImplementationandGovernanceofMP3EIA.ImplementationStageB. ImprovementofRegulationsandPermitsC.MonitoringandEvaluation
ACKNOWLEDGEMENTSGLOSSARYAPPENDIX
Doc. Wijaya KaryaDoc. Astra Otoparts Doc. Wijaya Karya

BismillahirrahmanirrahimAssalamu ’alaikum Warahmatullahi Wabarakatuh,Peace be upon us all,
My beloved fellow countrymen,
Three years ago, on 20th May 2008, when our country commemorated one century of our National Awakening, I gave a nation-wide address concerning the future of Indonesia. I mentioned at the time that Indonesia can transform into a developed nation in the 21st Century. With the introduction of the main theme “Indonesia Can”, we pledged and promised to unite and work hard to increase self reliance, competitiveness, with a distinguished and proud nation as prerequisites to becoming a developed nation in the 21st Century, which is likely to be full of challenges as well as opportunities.
We may recall, right after our nation commemorated 100 years of National Awakening, the world experienced a serious economic crisis affecting all nations of the world. The economy of developed countries collapsed, and the world experienced a distressful “Second Great Depression”. However, with the help of God Almighty and the readiness and hard work of every one of us, Indonesia managed to minimize the impact of that global crisis, and our economy not only prevailed but actually grew. This historical episode shows that Indonesia CAN overcome the crisis and meet the challenge.
In a gathering with the Kadin business community in Jakarta on 10 September 2009, I asked our country’s business community to synergize and improve Indonesia’s economy. In a simple and clear language I expressed that our bigger mission within the next 5 years (2010–2015) was to exercise “debottlenecking”, acceleration and expansion of Indonesia’s national development. If we are able to accomplish these three main activities, then our economy will grow more rapidly, employment opportunities will be created, and poverty will be more swiftly alleviated.
Meanwhile, when addressing a general assembly during the anniversary of ITS Surabaya on December 14th, 2010, I asked the whole of Indonesia to together build optimism and confidence that Indonesia can become an Advanced Economy from Emerging Economy 15 years from now. At that time, many world institutions and observers have predicted that Indonesia, now a member of the G-20, will soon migrate froman Emerging Economy to an Advanced Economy. It was during that ITS address in Surabaya that I first stated to the public the agenda for the acceleration and expansion of Indonesia economy, which includes contributions in technology and national innovations, which is today presented as MP3EI.
All of what I have extended is solely to build our assurance and confidence as a nation, that Indonesia truly CAN build its own better future. Of course, as I so often remind us all, there is never an easy way to reach such high goals. Our ambition to significantly increase economic development starts with developing good strategies, making supportive policies and clear and proper action plans, implemented with persistence and earnest, along with the effective and dedicated leadership of all state and regional officials.
Fellow countrymen,
The Republic of Indonesia is a nation blessed with almost all of the prerequisites for transformation into a great economic power. With its abundant natural resources, large, productive and young population, and strategic access to the global mobility network, these assets and access empower Indonesia to establish itself to its rightful place among the leading economies of the world. This perspective is supported by many international agencies therefore we must prove to the world that Indonesia is worthy and capable of being a big player in the global economy.

As we all know, development measures implemented since our independence 66 year ago has brought progress and improvements in many fields. This success is partly reflected by the ever increasing wealth and prosperity of the people, the reduction in poverty, and the open involvement of the community in the nation’s various development programs.
Nevertheless, we must also acknowledge that our economic growth thus far have not yet reached advanced, inclusive and sustainable growth level. As a country operating within a highly competitive global economies, Indonesia’s current strengths have not yet earned us our rightful position and recognition. On the other hand, difficult challenges also lie ahead. Indonesia’s position at the new global economic center of gravity, namely the East Asia and South East Asia regions, demands that Indonesia prepare itself better to accelerate its transformation into a developed nation with prosperity that can be enjoyed equally by all.
Therefore, smart and focused measures are necessary with defined indicators and clear management. The development of the Masterplan for Acceleration and Expansion of Indonesia Economic Development (Masterplan Percepatan dan Perluasan Pembangunan Ekonomi Indonesia – MP3EI) implemented with a spirit of “not business as usual”. MP3EI is intended to drive the realization of high, balanced, fair and sustainable economic growth. At the same time through this acceleration process, Insha Allah, Indonesia will be able to place itself at the top ten advanced economies in the world by 2025 and world’s top six by the year 2050.
This masterplan has two key factors, i.e. acceleration and expansion. With the development of the masterplan, it is hoped that Indonesia is able to accelerate the development of various existing development programs, especially in boosting value adding of the prime economic sectors, increasing infrastructure development and energy supply, as well as the development of human resources and science & technology. The acceleration of development is expected to boost Indonesia’s future economic growth.
Besides acceleration, the government also pushes for the expansion of Indonesia’s economic development so that the positive effects of Indonesia’s economic development can be felt not only at each and every region in Indonesia, but also by all components of the community across Indonesia.
The MP3EI is not intended to replace the National Mid Term Development Plan nor the national and regional development processes currently ongoing. On the contrary, the MP3EI also functions as a complementary working document for the above mentioned development plans.
To achieve tangible benefits and measurable impacts, acceleration and expansion measures were specifically formulated based on consultation with key stakeholders. Eight main programs and 22 main economic activities have been identified. In addition, 6 economic corridors are identified as growth centers and are expected to boost economic development throughout the nation. Investors and businesses can therefore clearly choose their desired sectors and preferred regions according to their business interest and specialization in accordance with the key economic drivers of the six corridors.
The improvement of the investment climate is one of the main agendas in the MP3EI. Therefore, in the short term, improvement of the investment climate will be through debottlenecking, regulations, incentives and the acceleration of infrastructure development needed by all stakeholders.
Debottlenecking efforts mentioned above will not be successful without the support of all parties, including the central and local governments. In the future, the local governments are expected to play a more active role in the debottlenecking efforts to improve investment climates. Therefore, in regards to the implementation of MP3EI, I will establish an Implementation Team and a Monitoring Team through a Presidential Decree. I will personally lead the teams to ensure the quick decision making needed to solve all problems found during implementation. The active participation of all relevant stakeholders will be key to the smooth implementation of MP3EI. Therefore, the membership of the team will consist of representation of all relevant stakeholders. At the local level, I expect the Governors will play an active role spearheading and driving all parties to synergize for the implementation of MP3EI programs.
I truly hope that our efforts will receive blessings from God Almighty. The future prosperity and the greatness of Indonesia as a nation and a country lies in our hands. Let us all work hard for the pride and prosperity of future generations of Indonesia.
Wassalamu ‘alaikum Warahmatullahi Wabarakatuh
Jakarta, Mei 2011President of the Republic of Indonesia
Dr.H.SusiloBambangYudhoyono

Masterplan P3EI Abstract
10
AbstractIndonesia requires acceleration and expansion of economic development to support its transformation into a developed country by 2025. In doing so, many millions of people will be lifted out of poverty, and given better access to quality education, employment, higher living standard and medical care. A stronger middle class will also mean that the country and its citizens will have higher purchasing power and the increased ability to compete in the global arena.
The Masterplan for the Acceleration and Expansion of Economic Development of Indonesia (MP3EI) provides the building blocks to transform Indonesia into one of the 10 major economiesin the world by 2025. To achieve this, real economic growth must reach 7 - 9 percent per year, on an ongoing basis.
The development of MP3EI can be accomplished if the government and business sector embrace a new way of thinking in doing business. Everyone must take a collective approach toward improving and utilizing the country’s resources, strategic position, and manpower, in order to propel its citizens forward. The stakeholders, the central government, local governments, state owned enterprises, and private sector must work together productively. The private sector will be given a major and important role in economic development, particularly in investments to increase job opportunities. The government will not only be a regulator, it will also be a facilitator, and catalyst to support this growth. With regard to regulations, the government will amend or remove (debottlenecking) regulations that inhibit the implementation of investments. As a facilitator and catalyst, the government will provide incentives, both fiscal and non fiscal.
Implementation of MP3EI will include 8 main programs which consist of 22 (twenty two) main economic activities. The implementation strategy of MP3EI will integrate 3 main elements: (1) Developing the regional economic potential in 6 (six) Indonesia Economic Corridors: Sumatra Economic Corridor, Java Economic Corridor, Kalimantan Economic Corridor, Sulawesi Economic Corridor, Bali – Nusa Tenggara Economic Corridor, and Papua – Kepulauan Maluku Economic Corridor; (2) Strengthening national connectivity locally and internationally; (3) Strengthening human resource capacity and national science & technology to support the development of main programs in every economic corridor.
Implementation of MP3EI is expected to fully support and complement existing development planning documents produced by the government, including Long Term National Development Plan (RPJPN) and Medium Term National Development Plan (RPJMN).
The implementation of MP3EI will be coordinated by a Committee chaired by the President of Republic of Indonesia. This committee will be responsible for the coordination, monitoring and evaluation of specific strategies and actions identified in the masterplan.

Historical Breakthrough in The Making of MP3EI:TheBeginningofIndonesiaEconomicTransformationAcceleration
MP3EI has spirit of not doing business as usual. This spirit is reflected since the start of making of MP3EI. The document that was originally prepared by the Government, has been further enriched by taking into consideration, views and inputs from various stakeholders, especially from business society through a series of intensive, interactive and participative dialogues.
The making of MP3EI started when The President of Republic of Indonesia gave directive order through Limited Retread Cabinet on December 30th 2010. In this retread, the President pointed out that our future development challenge will be tougher. Indonesia has to be ready to adjust with regional and global economic dynamics. With the geographic position of the country, that is located in the center of new economic gravitation, Indonesia should prepare itself to become a developed country with outcomes that are equally utilized among all societies. Considering the potentials and advantages embedded, as well as developmental challenges that are to be faced, Indonesia needs an economic transformation. This transformation will be executed by acceleration and expansion of Indonesian economic development towards a well developed country thereby enhancing its competitiveness and prosperity among society.
In response to the President`s directive command, Government in collaboration with National Economic Committee (Komite Ekonomi Nasional/KEN) and National Innovation Committee (Komite Inovasi Nasional/KIN) held several meetings starting with sector development aspiration hearings. These meetings aimed to identify challenges and obstacles faced by business society with regard to their efforts to develop related sectors, and thereby enhanced government`s knowledge on various sector development strategies and prospects for the future. In these meetings, business associations had an important role to provide the main sources of information. These meetings were attended by more than 500 participants. Most of the participants were business association’s representative.
Based on these meetings, several follow up meetings were held in the form of Working Group (Gugus Tugas) forum. This forum simultaneously was divided into six Economic Corridor Working Groups. Each Working Group forum aimed to create sector development strategy, considering spatial dimension, so that a concrete and specific sector development strategy suitable for each sector`s potencies and advantages can be achieved. Thus, corridor development strategy could be developed integrating both sectoral and regional aspects. This forum also discussed the need of infrastructure development to support connectivity required by developments in each sector. This forum also allowed government to identify the need of human resource development as well as innovation development to improve each sector`s competitiveness. Each Economic Corridor Working Groups’ discussion was led by senior government officials who were competent in the field of regional economic development and attended by more than 600 participants comprising of CEOs, experts and academics, and also other senior government officials.
The result of MP3EI discussion was reported to The President of The Republic of Indonesia through a meeting between Government, State Owned Enterprises (Badan Usaha Milik Negara/BUMN), and local government on February 21st – 22nd 2011 held at Bogor Presidential Palace. This meeting was lead by The President of The Republic of Indonesia and was attended by The Vice President of The Republic of Indonesia, Ministers of Second United Indonesian Cabinet, and more than 400 participants consisting of directors and commissioners of State Owned Enterprises (SOEs), Chairman and the member of KEN and KIN, Governors of all provinces in Indonesia and senior government officials. The result of this meeting was used as inputs to revise, sharpen, and to further improve the draft of MP3EI.
Before the finalization of MP3EI document, the draft revision was completed and reported to The President of Republic Indonesia through the Grand Meeting between Government and Business Society that was held on April 18th – 19th 2011 at Bogor Presidential Palace. This Grand Meeting was led by The President of The Republic of Indonesia and was attended by The Vice President of The Republic of Indonesia, Ministers of Second United Indonesian Cabinet, the Vice Ministers of Second United Indonesian Cabinet, High State Agency Officials, Chairman and the member of KEN and KIN, and more than 500 participants from competent stakeholders such as the chairmen of private enterprises, senior government officials, Governors from all provinces in Indonesia, local legislative, and SOEs. Based on further directions from the President, Vice President, and the participants of the Grand Meeting, the draft of MP3EI was revised, sharpened and there upon finalized.
With all the interactive and participative process in the making of MP3EI, it is expected that there will be high ownership toward MP3EI, and a strong commitment amongst stakeholder will be well developed. Thus, the spirit of not doing business as usual will continue to make another breakthrough to accelerate Indonesian economic transformation and to achieve Indonesian visiontocreateanindependent,welldeveloped,equitable,andprosperoussociety.
Masterplan P3EI Historical Breakthrough in The Making of MP3EI
11


1The Self-Sufficient,
Advanced, Just, and Prosperous Indonesia
In order to realize the vision as a developed and prosperous nation by 2025, Indonesia is determined
to accelerate the economic transformation. Therefore, Indonesia prepared The Masterplan for Acceleration and Expansion of Indonesia Economic Development (MP3EI)
that put forward not business as usual approach, involving all stakeholders and focused on tangible and measurable
priorities. However, MP3EI is an integral part of the existing national development planning system.

1Masterplan P3EI The Self-Sufficient, Advanced, Just, and Prosperous Indonesia
14
The Self-Sufficient, Advanced, Just, and Prosperous IndonesiaA. Preface
After more than six decades of its independence, Indonesia has made tremendous progresses in its economic development. Originating from a traditionally agricultural-based economy, Indonesia has shifted a larger portion of its economic activities toward manufacturing and service oriented industry. Its economic development has also improved the nation’s level of prosperity, which is reflected in its increased income per capita as well as in other social and economic indicators including the Human Development Index (HDI). From 1980 to 2010, the HDI had nearly doubled, from 0.39 to 0.60.
Indonesia also plays a much bigger role in the global economy. Currently, it ranks 17th as the world’s largest economy. Indonesia will continue its significant involvement in many regional and global forums, e.g. ASEAN, APEC, G-20 and other bilateral activities. Indonesia had successfully overcome the 2008’s global economic crisis, which was highly praised by international economic agencies. While other countries experienced their debt rating being down-graded, Indonesia on the contrary improved its debt rating significantly.
There are some challenges in Indonesia’s economic development that need to be resolved. The dynamics of domestic and global economy requires Indonesia to be proactive and ready for change. Its proximity to the new center of gravity of global economy, i.e. East Asia and South East Asia, demand that Indonesia better prepare itself to accelerate the realization of becoming a developed country within which the result of its development and prosperity can be enjoyed equally among the people.
It is within this context that President Susilo Bambang Yudhoyono recognizes the need to prepare a Masterplan for Acceleration and Expansion of Indonesia Economic Development (MP3EI) as a directive for Indonesia’s economic development up to the year 2025. Through this acceleration and expansion of economic development, the Government hopes to increase the quality of Indonesia’s human development as a developed nation realized through increased income and purchasing power, as well as improved equality and quality of life for the whole nation.

Masterplan P3EI The Self-Sufficient, Advanced, Just, and Prosperous Indonesia
15
Figure 1.1:Plans for
Indonesia’s GDP
2010GDP: USD 700 Billion Income/CapitaUSD 3,000
GDP: ~ USD 4.0 – 4.5 TrillionIncome/Capitaestimated ~ USD 14,250 – 15,500 (country with high income)
GDP: ~ USD 15.0 – 17.5 TrillionIncome/Capita ~ USD 44,500 – 49,000
2025
2045
B. Acceleration and Expansion of Indonesia Economic Development MP3EI directive is aimed at implementing the 2005-2025 Long-term National Development Plan, which is stated in the Law No.17 Year 2007, the vision of the acceleration and expansion of Indonesia’s economic development is to create a self-sufficient, advanced, just, and prosperous Indonesia.
By utilizing the Masterplan for Acceleration and Expansion of Indonesia’s Economic Development (MP3EI), Indonesia aims to earn its place as one of the world’s developed country by 2025 with expected per capita income of USD 14,250-USD 15,500 with total GDP of USD 4.0-4.5 Trillion. To achieve the above objectives, real economic growth of 6.4-7.5 percent is expected for the period of 2011-2014. This economic growth is expected to coincide with the decrease in the rate of inflation from 6.5 percent in 2011-2014 to 3.0 percent in 2025. The combined growth and inflation rates reflect the characteristics of a developed country.
“Transform the Indonesian economy into a developed nation, which recognized by the world community, through high, inclusive, and sustainable economic growth.”
The 2025’s vision is achieved by focusing on 3 main goals:1. Increase value adding and expanding value chain for industrial production processes, and increase
the efficiency of the distribution network. In addition increase the capability of the industry to access and utilize natural resources and human resources. These increases can be attained by the creation of economic activities within regions as well as among regional centers of economic growth.
2. Encourage efficiency in production and improve marketing efforts to further integrate domestic markets in order to push for competitiveness and strengthen the national economy.
3. To push for the strengthening of the national innovation system in the areas of production, process, and marketing with a focus on the overall strengthening of sustainable global competitiveness towards an innovation-driven economy.
C. Indonesia’s Position within the Regional and Global Dynamics
As the center of gravity for global economy, East Asia (including South East Asia) has a total population of approximately 50 percent of the world’s population. China’s population is 1.3 billion people, India 1.2 billion people, and ASEAN is inhabited by around 600 million people. Being in the center of these regions, the high number of population in East Asia and its huge economic potential gives Indonesia a strong geographical advantage.

Masterplan P3EI The Self-Sufficient, Advanced, Just, and Prosperous Indonesia
16
Figure 1.3: Asia and World
Population
Others: 3,429 million
China: 1,322 million
India: 1,130 million
About 50% of World’s Population are in this area
Notes:World Bank Data: Eastern Asia consists of Philippine, China, Malaysia, Indonesia, Cambodia, Thailand, Korea, Fiji, and Vietnam.
Global Market Concentration
Indonesia’s development is therefore integral with regional and global dynamics. Geographically, Indonesia lies in the heart the world’s economic growth. East Asia’s economic growth is higher than the average of other regions in the world (see Figure 1.2). When the long-term trend (1970-2000) of world’s economic growth experienced a decline, East Asia’s economic growth, on the contrary experienced an increase.
Looking at global trade perspectives, South to South trades, including trades among India-China-Indonesia show a rapid increase. Since 2008, developing countries’ export growth which is initiated by demands from other developing countries, has increased significantly (total contribution is 54 percent). In 1998 contribution was only 12 percent. China’s strong growth has created tremendous impact towards regional and global trade development. China’s trade has risen sharply in exports and imports, during and after global economic crises in 2008. On the other hand, its growing consumption has also triggered significant imports from countries in the region including Indonesia.
In South East Asia, Indonesia is a country endowed with the highest population and the richest natural resources within its archipelago of 17 thousand islands spread accross a vast region. These blessings put Indonesia as South East Asia’s number one power house. However, the planned implementation of ASEAN’s Economic Community and the existence of the ASEAN-China Free Trade Area (ACFTA) mandate Indonesia to increase its competitiveness. This is to ensure that Indonesia will get the full benefits of those economic integrations. In consideration of these factors, the acceleration of the economic transformation formulated in MP3EI is aimed at providing a catalytic force to increase Indonesia’s competitiveness.
With the implementation of MP3EI platform, Indonesia aims to position itself as one of the world’s main food suppliers, as a processing center for agricultural, fishery, and natural resources, as well as a center for global logistics by 2025 or earlier.Figure 1.2:
Global Economic Growth Of Each Decade
8
6
4
2
0Source: World Bank
Developing Country
World
Developing Country in Eastern Asia
1970 1980 1990 2000
G-7
average percent per year
Global Economic Growthfor Each Decade
ASEAN: 573 million
Australia: 20 million
Japan: 127 million

Masterplan P3EI The Self-Sufficient, Advanced, Just, and Prosperous Indonesia
17
D. Indonesia’s Potential and Challenges
The acceleration and expansion of Indonesia’s economic development are supported by its demographic potentials, the abundance of its natural resources, and by its geographical advantages.
Indonesia’s Potential
1. Population and Human Resources
In 2010, Indonesia ranks the 4th most populous country in the world. Its huge population and the rapidly increasing buying power of its population is creating a significant market. Moreover, the population is also increasing in the quality of its human resources, thus providing a desirable competitive edge.
Figure 1.4:Indonesia’s Demography
Indonesia is experiencing a transition period in the structure of its population productive age. In the period of 2020-2030 the dependency index (which was started in 1970) will reach its lowest point thus increasing its productive work force has one of the highest in the region. An important implication of this condition is the increased importance of job creations that will cater to the huge portion the population productive age. More importantly, if the general education continuous to improve, Indonesia’s economic productivity will experience an exponential growth.
2. Natural Resources
Indonesia has an abundance of renewable (agricultural products) and un-renewable (mining and minerals) natural resources. It must be able to optimize the handling of its natural resources by increasing a processing industry that will provide high added value, while at the same time reducing exports of raw materials.
1950
1955
1960
1965
1970
1975
1980
1985
1990
1995
2000
2005
2010
2015
2020
2025
2030
2035
2040
2045
2050
Bonus Demography
Periode in whichdependency ratio < 1
% p
opul
ation
Dep
ende
ncy
ratio
0.80
0.70
0.60
0.50
0.40
0.30
0.20
0.10
0
80
70
60
50
40
30
20
10
0
Working Age(15 – 64) (left axis)
Children(0 – 14) (left axis)
Elderly(more than 65) (left axis)
Dependency ratio(right axis)

Masterplan P3EI The Self-Sufficient, Advanced, Just, and Prosperous Indonesia
18
Figure 1.5:Natural Resources of Indonesia
Key Indicator
• Large amount of gas-based resources and petrochemical
• Exclude Non-Conventional Gas from Coal Bed Methane (CBN) and Coal Gasification
Based on the assumption that 40% of reserve feasible to be developed into 12 GW. Nowadays, it is only 1,200 MW developed
Reserve reaches 165 TCF
within +3 TCF production level
annualy
Natural Gas Coal Geothermal Palm Oil Cocoa Tin Nickel Bauxite
The second largest exporter
in the world
Reserve 40% of resources
(the largest in the world)
The largest exporter in the world > 19 million ton/year
770,000 tons/year, the second largest producer
in the world
65,000 tons/year, the second largest producer
in the world
Provide 12% world reserves
(4th largest)
7th world reserves
provider, 4th
largest producer in the world
In 2013, start to be processed locally
(Law No. 4 Year 2009 - Mineral and Coal Mining)
For downstream industry development purpose
Until 2010, Indonesia is one of the world’s major producer of a broad range of commodities. It is the largest producer and exporter of palm oil in the world. It is the world’s second largest producer of cocoa and tin. For nickel and bauxite it comes 4th and 7th respectively in world’s reserves. It is also one of the largest producers for steel, copper, rubber and fisheries.
It also has huge reserves for energy such as, coal, geo-thermal, and water. They have been used to support Indonesia’s prime industries such as, textiles, shipyards, transportation, as well as food and beverages.
Based on data from the United Nations Environmental Program (UNEP, 2009) there are 64 Large Marine Ecosystem (LME) worldwide, they are characterized by the level of fertility, productivity, and the influence of climate change on each LME. Indonesia has direct access to 6 (six) LME which have great marine and fisheries potentials, including LME 34-Bengala Bay; LME 36-South China Sea; LME 37-Sulu-Celebes Sea; LME 38-Indonesian Sea; LME 39-Arafura-Carpentaria Gulf; LME 45-Northern Australia Sea. The opportunity for Indonesia to further develop its fisheries industry is enormous.
3. Geographical Location
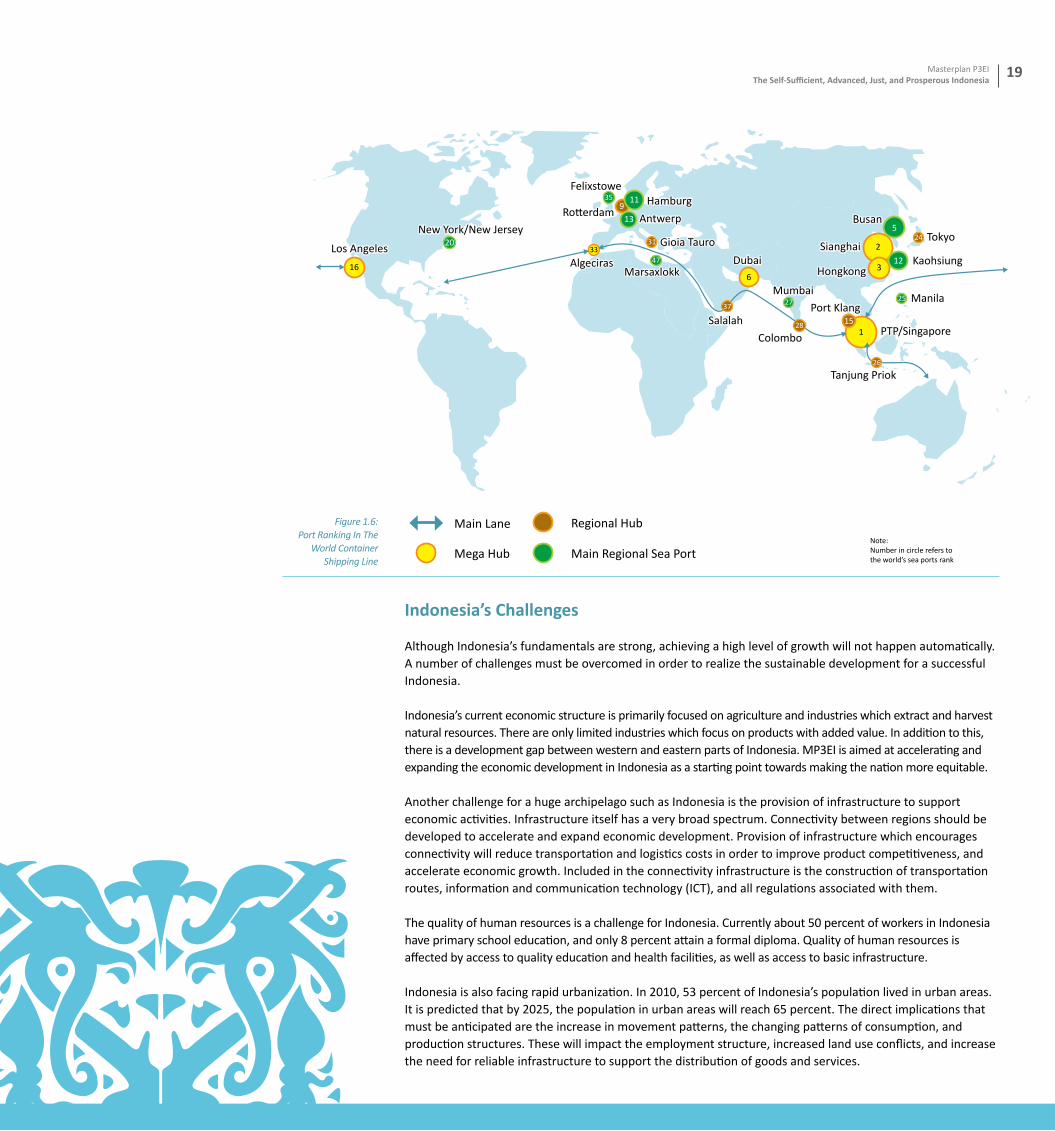
Indonesia is the world’s largest archipelago, stretching from east to west with a length of 5,200 km and a width of 1,870 km. Indonesia has a direct access to the world’s largest market since it is passed by one of the most active Sea Lane of Communication (SLOC), i.e. The Malaccan Strait. This route is the prime route for global container shippings (please refer to Figure 1.6).
Indonesia is located within five hours travel time from the world’s two largest and fastest growing economies, namely India on the Northwest and China on the Northeast.
Masterplan P3EI The Self-Sufficient, Advanced, Just, and Prosperous Indonesia
19
Indonesia’s Challenges Although Indonesia’s fundamentals are strong, achieving a high level of growth will not happen automatically. A number of challenges must be overcomed in order to realize the sustainable development for a successful Indonesia.
Indonesia’s current economic structure is primarily focused on agriculture and industries which extract and harvest natural resources. There are only limited industries which focus on products with added value. In addition to this, there is a development gap between western and eastern parts of Indonesia. MP3EI is aimed at accelerating and expanding the economic development in Indonesia as a starting point towards making the nation more equitable.
Another challenge for a huge archipelago such as Indonesia is the provision of infrastructure to support economic activities. Infrastructure itself has a very broad spectrum. Connectivity between regions should be developed to accelerate and expand economic development. Provision of infrastructure which encourages connectivity will reduce transportation and logistics costs in order to improve product competitiveness, and accelerate economic growth. Included in the connectivity infrastructure is the construction of transportation routes, information and communication technology (ICT), and all regulations associated with them.
The quality of human resources is a challenge for Indonesia. Currently about 50 percent of workers in Indonesia have primary school education, and only 8 percent attain a formal diploma. Quality of human resources is affected by access to quality education and health facilities, as well as access to basic infrastructure.
Indonesia is also facing rapid urbanization. In 2010, 53 percent of Indonesia’s population lived in urban areas. It is predicted that by 2025, the population in urban areas will reach 65 percent. The direct implications that must be anticipated are the increase in movement patterns, the changing patterns of consumption, and production structures. These will impact the employment structure, increased land use conflicts, and increase the need for reliable infrastructure to support the distribution of goods and services.
Figure 1.6:Port Ranking In The
World Container Shipping Line
Main Lane
Mega Hub
Regional HubNote:Number in circle refers to the world’s sea ports rankMain Regional Sea Port
FelixstoweHamburg
Los Angeles
16
20
359
11
13
3331
47
37
6
27
28
26
15
12
24
25
5
2
3
1
New York/New Jersey
Rotterdam
Algeciras
Port Klang
Sianghai
HongkongKaohsiung
Marsaxlokk
Antwerp
Gioia Tauro
Dubai
Mumbai
Colombo
Tanjung Priok
PTP/Singapore
Manila
Tokyo
Salalah
Busan

Masterplan P3EI The Self-Sufficient, Advanced, Just, and Prosperous Indonesia
20
Indonesia faces the challenge of global climate change. Several indicators significantly affecting human life are: rising sea levels, rising air temperatures, changes in rainfall period, and extreme climate change. Similarly, the influence of a combination of raising temperature in regions, changes in the level of precipitation and the intensity of drought/flood.
E. Acceleration of Economic Transformation – A New Way of Working (Not Business as Usual)
In order for Indonesia to accelerate its economic development, Indonesia will need to embrace a new way of thinking, a new way of working, and a new way of conducting business. Regulations at the central and regional level need to be streamlined to ease doing business. A new way of thinking should be based on the spirit of “Not Business as Usual”
Figure 1.7: The Illustration of
Indonesia’s Economic Transformation
Acceleration
Business as usual
TIME
The implementation of the new way of thinking in the economic development, needs collaborative efforts among government, local governments, SOEs, private enterprises and the people. The government has very limited funds to finance development through its State Budget (APBN). Thus, to foster the economic growth in Indonesia, it will depend on the private sector participation which includes state-owned enterprises, and private domestic and foreign investors.
Government policy must be streamlined to allow a bigger participation from private sector. Regulations must be clear, and without possibilities for mis-interpretation, in order to encourage trust and maximum participation from investors to build much needed industries and infrastructure. In order to achieve the above objectives, all existing regulatory frameworks must be evaluated, and strategic steps must be taken to revise and change regulations. The spirit of Not Business As Usual should also reflect in the implementation of important
Eco
nom
ic Tra
nsformati on

Masterplan P3EI The Self-Sufficient, Advanced, Just, and Prosperous Indonesia
21
development elements, such as the infrastructure development. The old thinking suggests that infrastructure must be built using goverment funding. However, due to the limitation of government funding, the old line of thinking resulted in the slow fulfillment of adequate infrastructure to support rapid development. Under the new way of thinking and working, cooperations between the government and the private sector under the public-private partnership (PPP) scheme is expected to bring in much needed investments.
The role of Government in the implementation of MP3EI is to provide a set of rules and regulations that provide incentives for investors to build sectoral industries and infrastructure. Incentives can be condusive policies on tariff, taxes, import duties, labor regulations, licensing and permits, land procurements, etc. The central and local governments must build a reliable link within and beyond the centers of economic growth.

Masterplan P3EI The Self-Sufficient, Advanced, Just, and Prosperous Indonesia
22
To support the acceleration and expansion of economic development in Indonesia, the Government has set a number of major programs in collaboration with key stakeholders including government ministries and the private sector in the development of MP3EI.
Based on stakeholders’ agreement the focus of development was classified into 8 main programs, i.e.: agriculture, mining, energy, industrial, marine, tourism, telecommunication, and the development of strategic areas. The eight main programs consist of 22 main economic activities.
Figure 1.8: 22 Main Economic Activities
Transportation Equipment
ICT ShippingTextiles
Food-Beverages
Defence Equipment
Palm Oil
Rubber
Cocoa
Animal Husbandry
TimberOil and
GasCoal
Nickel
Bauxite
Fishery
Tourism
Food Agriculture
Jabodetabek Area
Sunda Straits
Strategic Area
Copper
22 Main
Economic Activities
Steel
8/228/22

Masterplan P3EI The Self-Sufficient, Advanced, Just, and Prosperous Indonesia
23
F. MP3EI - An Integral Part of National Development Planning
MP3EI is a working document and as such it will be updated and refined progressively. It contains the main direction of development for specific economic activities, including infrastructure needs and recommendations for change/revision of regulations as well to initiate the need of new regulations to push for acceleration and expansion of investment. MP3EI is an integral part of the national development planning system. MP3EI is not meant for substituting the existing Long Term Development Plan 2005 – 2025 (Law No. 17 Year 2007) and the Medium-Term Development Plan 2004 – 2009 (Presidential Decree No. 7 Year 2009). MP3EI is formulated in consideration of the National Action Plan for Greenhouse Gas (Rencana Aksi Nasional Gas Rumah Kaca – RAN GRK) as a national commitment which recognizes the global climate change.
Figure 1.9: MP3EI Position in the Government’s Development Plan
Development adaptation, integration, and acceleration: FOCUS and CONCRETE
1
Masterplan of Acceleration and Expansion of Indonesia
Economic Development
RKP/RAPBN
1
RAN-GRK REDD
RTRWN
RPJPN 2005 – 2025
RPJMN 2010 – 2014
Financial and Planning SystemLaw No. 25 Year 2004 - Law No. 17 Year 2003
• Global Condition (Economic Crisis in 2008, BRICS, etc.)
• International Commitment (G20, APEC, FTA, ASEAN, Climate Change)
• Domestic Socio-Economic Development
Action Planning/ProjectPrivate Investment
and PPP
To Accelerate National Economic Transformation
Dinamic Change

Masterplan P3EI The Self-Sufficient, Advanced, Just, and Prosperous Indonesia
24
Figure 1.10: Framework Approach Masterplan P3EI
“To Create a Self-Sufficient, Advanced, Just, and Prosperous Indonesia”
1. Encourage a large scale investment realization in 22 main economic activities2. Synchronization of national action plan to revitalize the real sector performance
3. The Development of center of excellence in each economic corridor
ECONOMIC POTENTIAL
DEVELOPMENT THROUGH ECONOMIC CORRIDORS
STRENGTHENING THE NATIONAL CONNECTIVITY
STRENGTHENING NATIONAL HUMAN
RESOURCES CAPABILITY
AND SCIENCE & TECHNOLOGY
BASIC PRINCIPLES AND SUCCESS PREREQUISITES FOR ACCELERATION AND EXPANSION OF ECONOMIC DEVELOPMENT
STRATEGIC INITIATIVES OF MP3EI
MAIN STRATEGY OF MP3EI
BASIC PRINCIPLES OF MP3EI
INDONESIA VISION 2025
G. Framework Design of MP3EI
Based on the various factors noted, the framework design of the Masterplan for Acceleration and Expansion of Indonesia Economic Development (MP3EI) for 2011 to 2025 is formulated as in Figure 1.10. Each main strategy of MP3EI will be discussed in more detail in subsequent chapters of this Masterplan.

Masterplan P3EI The Self-Sufficient, Advanced, Just, and Prosperous Indonesia
25


2Breakthrough steps contained in the MP3EI’s strategies and
policies are formulated by considering a number of prerequisites. It also developed a strategy that consists of 3 (three) main pillars
based on determined vision and mission, which are to increase the potential of the region through the development of growth
centers in the economic corridors, strategies to strengthen national connectivity, as well as strategies to increase the capacity
of Human Resources and Science & Technology. Prerequisites and various development strategies will strongly influence the
successful implementation of MP3EI.
Basic Principles, Prerequisites for Success and
Main Strategies of MP3EI
Doc. Wijaya Karya

2 The Masterplan for Acceleration and Expansion of Indonesia Economic Development (MP3EI) is developed based on basic principles and prerequisites for successful implementation. This chapter will also elaborate the three main strategies that act as important pillars for MP3EI 2011 – 2015.
A. Basic Principles and Prerequisites for Successful Implementation of MP3EI
Basic Principles for Development Success
The successful execution of MP3EI is determined by the following basic principles. These basic principles will require the shift in perspective and behavior of all of the nation’s components as follows:• Change must affect positively on all stakeholders of the nation;• Change in mindset starts from the Government and its bureaucracy;• Change requires the spirit of hard work and the strong desire to develop collaborations within a healthy
competitive environment;• Productivity, innovation and creativity, driven by science and technology;• Enhancing entrepreneurship;• Private sector has an important role in economic development;• A Campaign to implement sustainable development principles;• Campaign for change in mindset to improve prosperity has to be carried out extensively by all
stakeholders of the nation.
Prerequisites for Successful Implementation of MP3EI
The Role of Government and Business Enterprises Business enterprises (private sector companies, state and regional owned companies) have an important role in economic development, particularly in generating investments and the creation of employment opportunities. The government, on the other hand, is responsible for creating conducive macro-economic conditions for the acceleration and expansion of investments. Therefore, national development policies must be supported by the full commitments of both the government and business enterprises, in the form of:• Encouraging businesses to support and increase investment and to boost economic growth and the
creation of employment opportunities;• Business enterprises must undertake innovative measures to develop technology and production
methods in order to triumph in today`s global competitiveness;• The government will provide equal and fair opportunities for all businesses;• The government is supported by a bureaucracy that serves the needs of businesses;• The government is creating conducive macro economic, political, legal and social environment to support
business activities;• The government provides social basic protection and services.
State Financial Policy ReformBudget policy must begin with the structuring of a credible and sustainable State Budget (APBN), withprovisions to accelerate economic growth in order to create equitable and sustainable development. Essential elements include:
Masterplan P3EIBasic Principles, Prerequisites for Success and Main Strategies of MP3EI
28
Basic Principles, Prerequisites for Success and Main Strategies of MP3EI

• Prioritizing the allocation of the State Budget for the development of infrastructure, improve basic public services and provide social security for the poor;
• Allocating government loans to finance investment activities instead of to finance routine expenditure. The rate of return on government investment should be higher than the cost of debt;
• Infrastructure will be developed in partnership with the private sector;• Subsidy will be used as an instrument of social protection by switching the subsidy objective from subsidy
for goods into direct subsidy for the poor. To facilitate the implementation of direct subsidy, the proposed national “Single Identity Number“ must be implemented immediately;
• The revenues and royalties from non renewable natural resources extraction should not be treated and expanded as current revenue but rather some portion to be kept for the benefit of future generations;
• The return from processing renewable natural resources will be invested to enhance the quality of human capital and technology;
• Expanding access to education and basic health service facilities;• Improve quality of public services for the society and businesses.
Taxes and import duties are one of the instruments of economic policy to support the acceleration and expansion of national economic development. Therefore reform is considered necessary, and can be carried out using the following tax approach:• Tax rates and import duties should be adjusted due to the economic cycle;• Increase the number of actual Tax Payers;• Coordination amongst authorized institutions must be carried out to ensure that all citizens who gainin
come above nontaxable income level pays tax according to applicable law;• Taxes levied on the tax object in Indonesia and not levied on the tax subject in Indonesia (change in
concept from National into Domestic or from the concept of GNP to GDP).• Taxation aimed at the final consumer, replacing the system of value added tax (VAT);• All taxation schemes are evaluated so that there is no ambiguity in interpretation leading to clarity on
what is taxable and not taxable; • In order to improve competitiveness and efforts to reduce tax evasion, efforts should be made to
benchmark the tax rate with neighboring countries;• Avoidance of double taxation;• To avoid double counting all tax exemption or tax relief will no longer be regarded as a tax levied to the state.
One of the key component of financial policy reform by the government is an enhanced ”State Asset Reporting System” which recognizes the monetary value of this asset (including natural resources, land and buildings, etc.) and to empower the government to effectively use this asset for budget and planning.
Bureaucracy Reform • Acceleration and expansion of Indonesia economic development needs strong support from government
through bureaucratic reforms that are based on the following principles:• Creating an effective bureaucracy, which is able to better manage and enhance the people’s livelihood as
well as supporting the needs of the business sector;• Bureaucracy supported by strong and effective institutions, which creates a well managed bureaucracy
and administration, responsible legislature, independent judicial institutions;• Building a commitment to the implementation of good governance;• A strong and effective bureaucracy and institution structure will also act as a feedback channel for future
planning.
Connectivity between regions in IndonesiaThe government should be the driver in the development of connectivity between regions through:• Creating an integrated system of national logistics, national transportation system, regional development,
and communication and information systems;• Identify the transportation hubs and distribution centers to facilitate the logistical needs for primary and
supporting commodities;
Masterplan P3EIBasic Principles, Prerequisites for Success and Main Strategies of MP3EI
29

Economic development is significantly affected by the mobility of the business sector which create employment opportunities and revenue.
• Strengthening connectivity of intra and inter-corridors as well as global connectivity;• Improve information and communication technology (ICT) networks to facilitate all economic activities,
government activities, and national education sector activities.
Food Security, Water, and Energy PoliciesFood security is an essential prerequisite to support the success of Indonesia’s development based on the following principles:• Food security covers consumption and production;• Adequate and equitable food supply is available for all Indonesians to fulfill a healthy and productive life;• Efforts to diversify food consumption away from current staples shall occur in tandem with the increase
in people’s income level and pricing structure that meets the prevailing economic condition;• Diversification of food production is adjusted based on the local food production capability;• Development of new food production centers outside of Java;• Increase productivity through the development of research and development activities, especially for
seedlings and post harvest technology.
Policies related to the provision of clean water are not only focused on infrastructure development, but also considering several principles as follows:• Government has to ensure availability and access to water for all;• Provision of clean water should include the preservation of water resources in order to maintain its
sustainability;• The reforestration strategies will continue and enhance to sustain water catchment areas;• Local governments will be required to allocate forest area as a percentage of the total area;
Energy security must be developed based on risk management of the needs and availability of energy in Indonesia, which include:• Manage risks through the continuous adjustment to the energy mix, which support sustainable
economic development in Indonesia;• Revision of current legislations related to energy mix and power production to support increased
investments in the sector by improving consistency between laws and regulations;
Doc. Wijaya Karya
Masterplan P3EIBasic Principles, Prerequisites for Success and Main Strategies of MP3EI
30
• Restriction of the export of energy commodities followed by further processing activities within the country in order to increase value added exports;
• Implementation of good mining practices to minimize environmental damage.
Social Security and Poverty ReductionThe government will assume more responsibility towards implementing a social safeguard system to ensure the benefits of economic development widely shared among the people, therefore the government will provide:• Social safeguard in the form of targetted economic assistance for the poor, and in the form of universal
social insurance for the public;• Economic assistance can be executed in the form of subsidies and cash transfers targeted to the poor;• Universal social insurance is implemented through the combination of private and community funding.
The strategies for poverty alleviation are based on a broad framework of creating new employment opportunities. In line with this, the following efforts are required:• Improving the availability and access to education and skills training to increase national productivity;• Creation of formal employment opportunities that protect national workers, and implemented based on
industrial relations that support fairness between workers and employers;• Protection of Indonesian workers, as part of social safeguard framework, is given to both formal and
informal sectors;• Improve employment and industrial relation regulations to be supportive of both employers and
employees.
Poverty alleviation is a coordinated effort between the government and the society, in which each plays specific roles:• The role of society and businesses should be directed toward partnerships with local governments to
solve the real problems of poverty specific to a certain region;• Businesses can help to reduce poverty by focusing on specific areas through the implementation of
corporate social responsibility (CSR) programs;• The central government further coordinates the activities of government, communities and regions.
B. Improving Regional Economic Potential through The Development of Six Economic Corridors
Acceleration and expansion of Indonesia’s economic development are based on the development of existing and creating new growth centers. This development strategy is essentially an integration of the sectoral and regional development approaches. The purpose of developing new growth centers is to optimize agglomeration advantages, to explore regional strengths, and to reduce spatial imbalance of economic development throughout the country. As part of this strategy, each region will develop their own specific local products.
The development of economic growth centers will be managed through the development of industrial clusters and special economic zones (SEZ). This will be accompanied with increased and improved connectivity between the centers of economic growth (major cities) and main industrial clusters supported by improved infrastructures including roads, seaports, airports, power, water, and other related infrastructures. In all, growth centers and connectivity are the building blocks of Indonesia Economic Corridors. Increasing the economic potential of the region through the economic corridors has become one of the three main pillars of MP3EI.
Masterplan P3EIBasic Principles, Prerequisites for Success and Main Strategies of MP3EI
31

Economic Growth Center: Commercial centers of trading hubs
Supporting Connectivity: Linking main economic activities with supporting infrastructure
Main Connectivity:Linking Economic Centers
Indonesia’s Economic Corridor Development: The development of main economic activities in the centers of economic growth accompanied by strengthening the connectivity between economic centers, the location of the main economic activities and supporting facilities
Main Economic Activities: Economic activities prioritized in the economic corridor
Suggested SEZ Connectors
Supporting Infrastructure: Sea Ports, Airports, Power Supply
Economic Center
Industrial Cluster
Main Connectivity
Supporting Connectivity
Electricity, Water, and Fiber Optic Development
Sea Port and Airport
Electricity, Water, and Fiber Optic
Special Economic Zone
In order to accelerate and expand economic development, it is necessary to create new economicregions outside of the existing economic growth centers. The government will provide special incentivesto support the development of these centers, especially those located outside of Java, and particularlyto businesses that are willing to finance the construction of supporting facilities and infrastructures.The aim of providing such incentives is to encourage businesses to build long term perspectives in thedevelopment of the new economic growth centers.
These Incentives shall include: favourable taxation and customs policies, labor regulations, and licensing developed in consultation with the private sector. In order to avoid enclaves in these growth centers, the central and local governments will encourage strong linkages between growth centers and its surrounding industrial areas. The new economic growth centers may be in the form of large scale Special Economic Zones (SEZs) expected to be developed in each economic corridor conforming to the local potentials and specializations of each region.
Development of economic corridors is similar to regional development aimed at creating an integrated and sustainable economic base. However, the development of the six economic corridors give greater emphasis to economic development as follows:1. Indonesia Economic Corridor will emphasize the increase of productivity and value-adding on
natural resource management through the expansion and creation of a sustainable upstream and downstream activity chain;
2. Indonesia Economic Corridor will focus on diverse and inclusive economic development, which connects corridors with other regions to develop opportunities based on local potential and specialization;
3. Indonesia Economic Corridor emphasize sectoral and regional development synergies to enhance national, regional and global comparative and competitive advantages;
4. Indonesia Economic Corridor emphasizes integrated economic development between transportation and logistics, as well as communications and information systems to open regional access;
5. Indonesia Economic Corridor will be supported with fiscal and non-fiscal incentives, ease of regulation, licensing, and optimum public services from Central and Local Governments.
Figure 2.1. Economic Corridors
SEZ
SEZ
SEZ
Masterplan P3EIBasic Principles, Prerequisites for Success and Main Strategies of MP3EI
32

C. Strengthening National Connectivity
The success of the MP3EI highly depends on the strength of national and international economic connectivity (intra and inter region). With this consideration, the MP3EI has identified the strengthening of national connectivity as one of three main pillars.
National connectivity consist of 4 (four) national policy elements i.e. National Logistic System (Sistem Logistik Nasional/Sislognas), National Transportation System (Sistem Transportasi Nasional/Sistranas), Regional Development (RPJMN/RTRWN), and Information and Communication Technology (ICT). These policies were combined in order to create an effective, efficient, and integrated national connectivity.
Indonesia’s national connectivity is part of the global connectivity. Therefore, the strengthening of the national connectivity has to consider Indonesia connectivity with regional and global economic growth centers in order to enhance national competitiveness and optimize advantages of Indonesia’s regional and global connectivity.
Elements of Mobility Management in the National ConnectivityNational Connectivity includes 5 (five) elements as follows:1. Personnel/passengers, which covers the management of the mass movements of people travelling within,
to and from the region;2. Abiotic materials/goods (physical and chemical materials) which includes the movement of industry and
industrial products;3. Biotic material/element/species, which includes the movement of live products, such as cattle, biotoxins,
veral, serum, verum, seeds, bio-plasma, biogen, bioweapon;4. Services and Finance, which covers technology mobility, human resources and capital development for the
region;5. Information, concerning the mobility of information for the benefit of regional development which is
strongly associated with the competency of information and communication technology.
The improvement of mobility management on five elements above will enhance national capacity to accelerate and expand development as well as to achieve quality growth as mandated by Law No. 17 Year 2007 on the National Long Term Development Plan 2005 - 2025.
Indonesia, A Maritime NationThe total length of Indonesia coast line is 54,716 kilometers. It stretches along the Indian Ocean, theStrait of Malacca, South China Sea, Java Sea, Celebes Sea, Moluccas Sea, Pacific Ocean, Arafura Sea, Timor Sea, and in other small regions. Embedded within the Indonesian archipelago, there are several sea lines considered as economically strategic sea lines and global strategic military sea lines. These sea lines are the Straits of Malacca (which is the Sea Lane of Communication or SLoC), the Sunda Strait (ALKI 1), the Straits of Lombok and Makassar Straits (ALKI 2), and the Strait of Ombai Wetar (ALKI 3). Most of the world’s major shipping and cruise liners pass and use these sea lanes as part of their shipping routes.
MP3EI priority is to maximize utilization of SLoC and Indonesia Archipelagic Sea Lanes (Alur Laut KepulauanIndonesia/ALKI) mentioned above. Indonesia could take benefits from these maritime advantages. It can begin by accelerating growth in various regions in Indonesia (especially in eastern Indonesia), improve a maritime competitiveness, and enhance national security and economic sovereignity of Indonesia.
Masterplan P3EIBasic Principles, Prerequisites for Success and Main Strategies of MP3EI
33

Indonesia’s Frontline Global Connectivity In order to strengthen national connectivity that considers regional and global geo-strategic position, global connectivity must utilize SLoC and ALKI to support the implementation of MP3EI. This concept will form the backbone of national connectivity strategy and also it is expected to facilitate more equitable economic development across Indonesia and create a solid economic independence and economic competitiveness.
ALKI-I
ALKI-II
SLoC MALACA
ALKI-III ALKI-III B
ALKI-III C
Strategic Framework and the Policy of Connectivity StrengtheningThe aims and objectives of the National Connectivity Strengthening are:1. Connecting the centers of major economic growth based on the principles of integration and not
similarity, through “inter-modal supply chain systems”.2. Expanding economic growth through accessibility improvement from the centers of growth to the
hinterland.
Figure 2.2Concepts of Gate Port and
International Airport in The Future
International Airports
Alternative International Sea Ports Hub
Main International Sea Ports
Sea Lane of Communication (SLoC) and ALKIPrimary National Sea LaneSecondary National Sea LanePrimary Land Lane (Roads and/or Railways)
Primary Sea Ports
Masterplan P3EIBasic Principles, Prerequisites for Success and Main Strategies of MP3EI
34
Kuala Tanjung
Bitung
Makassar

3. Distribute the benefits of economic development by improving the quality of connectivity to the less developed areas, isolated areas, and border areas in order to achieve equitable economic development.
To achieve these objectives, some inter-related connectivity components need to be harmonized into a singleintegrated planning framework. Figure 2.3 includes the components for national connectivity: (a) National Logistics System (SISLOGNAS), (b) National Transportation Systems (SISTRANAS), (c) Regional Development (RPJMN and RTRWN); (d) Information and Communication Technology (ICT). The planning document of each components have been completed, however it was executed separately. Therefore, the strengthening of National Connectivity seeks to integrate the four components.
Figure 2.3 Connectivity Components
SISLOGNAS SISTRANAS REGIONAL DEVELOPMENT(RPJMN and RTRWN) ICT
1. Migration Toward Convergence
2. Equitable Access and Services
3. Broadband Network Development
4. Improving Network Security and Information System
5. Integration of Infrastructure Application, and National Data
6. Increasing e-literacy, independent domestic ICT industry, ICT HR availability
7. Synergy of National ICT Activities and Investments
1. Decide Key Commodities
2. Strengthen Logistic Services
3. Infrastructure Netwok
4. Human Resources Capacity Building
5. ICT Improvement6. Regulation
Harmonization7. National Logistic
Board is Needed
1. Local Economy Improvement
2. Human Resource Capacity Building
3. Infrastructure Development
4. Institutional Capacity Building
5. Improvement of Access to Working Capital
6. Improving Basic Social Facilities
1. Transportation Safety
2. Transporation Procurement
3. Transportation Netwok
4. Human Resource and Science and Technology
5. Maintenance of Environtment Quality
6. Provision of Development Fund
7. Improvement of State Administration
Posture Forming Components of the National Connectivity
Strengthening National Connectivity Carried Out by Integrating and Synergizing Sislognas, Sistranas, Regional Development, and ICT Plans
Masterplan P3EIBasic Principles, Prerequisites for Success and Main Strategies of MP3EI
35

The integration of the four components of national connectivity will be formulated into a national connectivityvision, which is: ‘LOCALLY INTEGRATED, GLOBALLY CONNECTED’.
Locally Integrated is a connectivity system to support an effective and efficient movement of goods, services, and information, within the country. Therefore, the integration of transportation nodes, inter-modal connectivity and communication networks are important elements to strengthen local and national connectivity.
Transportation hubs (seaports, airports, terminals, stations, and center of distribution, etc.) should be integrated efficiently and effectively with the transport network and inter-modal transportation facilities. Communication and information networks also need to be integrated to support information flow, particularly information related to trading, financial, and other electronic-based activities.
The governance of flow of goods, information, and financial information must be executed efficiently and effectively, on time, and can be monitored through virtual information and communication network. This system covers procurement, storage/warehousing, transportation, distribution, and delivery of goods in accordance with the type, quality, quantity, time and place demanded by producers and consumers, starting from the point of origin to its destination point.
The above mentioned strategy to strengthen national connectivity is aimed at unifying the country economically and encourage more equitable economic growth across the regions.
Globally Connected is a connectivity system aimed at connecting the country with the rest of the world via a system of global connectivity through a network of international gateway/exchange located at the major seaport and airport supported by custom and trade facilities.
Figure 2.4 National Connectivity Vision
NATIONAL CONNECTIVITY FRAMEWORK
Regional Development
(RPJMN & RTRWN)
National Transportation
SystemICT National Connectivity VISION
Locally Integrated,
Globally Connected
National Logistic System
Masterplan P3EIBasic Principles, Prerequisites for Success and Main Strategies of MP3EI
36

To realize this vision, the strengthening of connectivity that integrates growth centers inside economic corridors, as well as between economic corridors is required. The strengthening of international connectivity especially to facilitate international trade as well as an entry point for foreign tourists is also required. (Figure 2.5)
Figure 2.5 Framework of the National
Connectivity
Corridor 1
Corridor 2
Corridor 3
Indonesia’s International
Gate
Asia
Europe
America
INTER-CORRIDOR CONNECTIVITY
LOCAL CONNECTIVITY NATIONAL CONNECTIVITY GLOBAL CONNECTIVITY
Connectivity within Corridors
GLOBALCONNECTIVITY
Connectivity within the centers of economic growth in the corridor and between the centers
of economic growth with its hinterland, including including the non-corridor areas
Growth Centers Sector Locus
In order to implement the strategy, the following key points need to be noted: (1) enhance the flow of goods,services and information, (2) reduce logistics costs, (3) reduce cost inefficiencies (4) realize equitable access across the region, and (5) realize the synergy between growth centers.
Doc. Berau Coal
Masterplan P3EIBasic Principles, Prerequisites for Success and Main Strategies of MP3EI
37

The focus of national connectivity strengthening is to support acceleration and expansion of Indonesiaeconomic development through:
INTRA ECONOMIC CORRIDOR
CONNECTIVITY
• Improve and build roads and shipping lanes on the corridor
• Improve & developed infrastructure facilities and railways passenger and goods
• Improve local access road connecting the centers of growths with support facilities (port, energy) and with the hinterland as well as with non economic corridor areas
• Revitalize the ferry transport, local port, and optimizing shipping pioneer and PSO mechanism
• Improve air transportation and pioneer aviation
• Develop backbone extension network that covers into growth centers and main activities centers
• Equitable infrastructure access which covers growth centers and main activity centers, and also strengthen backhaul network
• Adequate radio spectrum frequency allocation
• Infrastructure sharing implementation including passive infrastructure (towers, pipes, poles, right of way) as well as non telecommunication operator
• Utilize green technology equipment to support electricity provision in non commercial areas
• Development of national internet exchange at growth centers
INTER ECONOMIC CORRIDOR
CONNECTIVITY
• Encourage the efficient and effective flow of goods and services inter-economic corridor to enhance regional and global competitiveness
• Reduce logistical and economic cost for inter-economic corridor delivery of goods and services
• Appoint several sea ports and airports as collection and distribution centers and also enhance its capacity by implementing integrated logistic port management
• Developed interconnection between primary ports (collection and distribution centers) and local ports and also between primary ports and international hub ports
• Integrate multi-backbone mode (optical fiber, satellite, microwave)
• Strengthen optical fiber backbone infrastructure: development in Kalimantan Economic Corridor, Sulawesi Economic Corridor, Papua – Kepulauan Maluku Economic Corridor, and also integration with services at western economic corridor
• Utilize information and communication technology to facilitate trading activities as inaportnet system development applied at regional ports
INTERNATIONAL TRADE LOGISTIC
• Prepare and assign sea ports and airports in western and eastern Indonesia as international hubs
• Optimization the operation of National Single Window (NSW) system at international hubs ports and airports through the improvement of Information and Communication Technology service. This strategy was set up in order to implement Customs Advance Trade System (CATS) and NSW and also make connection between national supply chain with ASEAN and global supply chain at international ports.
• Enhance efficient and productive operation of international ports and airports through the implementation of integrated management logistic system
• Open the new international gateways (links) to foreign countries as an alternative to existing links
• Develop international exchange at growth centers
• Improve regional and global connectivity infrastructure to achieve ASEAN logistic integration on 2013, ASEAN market integration on 2015, and global market integration on 2020.
Masterplan P3EIBasic Principles, Prerequisites for Success and Main Strategies of MP3EI
38

At the regional and global level the cross-border cooperation has been developed, in which focus will be oncooperation commitment for development at the ASEAN and APEC level. Indonesia must prepare itself toreach ASEAN logistic integration by 2013 and ASEAN single market integration by 2015, whereas in the contextof WTO global cooperation, Indonesia will prepare for global market integration by 2020. Based on Indonesia’scurrent pace, the strengthening of national connectivity will ensure integration of the National LogisticsSystem domestically and it will also create connection between national connectivity and regional economiccenters, between national connectivity and ASEAN, as well as between national connectivity and globalsociety in order to enhance national competitiveness. This strategy is very important in order to maximize thebenefits of regional and global connectivity.
One of the national connection efforts is the need to integrate national connectivity with developmentcooperation at the ASEAN level in order to:• Facilitate economic agglomeration and the integration of production networks;• Strengthen regional trade among ASEAN countries;• Strengthen the attractiveness of investments and reduce the development gap among ASEAN members
and between ASEAN with other countries in the world.
These efforts will be carried out through the effective and efficient strengthening of infrastructure network,communication network, and commodity (goods, services, and information) movement. These efforts are partof international connectivity. The main elements of ASEAN connectivity strengthening consists of:
The integration of national connectivity with ASEAN connectivity needs to be carried out with the spirit of development cooperation, which puts forward the principle of mutual benefit among ASEAN countries.
D. Strengthening Human Resources and National Science and Technology Capabilities
The improvement of human resource and national science and technology capabilities is the third pillars of the implementation strategy for MP3EI. In the era of knowledge-based economy, the engine of economic growth depends heavily on the capitalization of inventions to become innovation products. In this context, a well educated pool of human resource plays a key role in supporting sustainable economic growth. Therefore,
1. Physical Connectivity• Transportation• Information and Communication Technology• Energy
2. Institutional Connectivity• Facilitation and liberalization of trade• Facilitation and liberalization of investment
and services• Mutually beneficial collaboration• Regional transport collaboration• Cross-border procedures• Capacity Building program
3. Social and Cultural Connectivity (People-to-people Connectivity)• Education and culture• Tourism Figure 2.6
Major Element of ASEAN Connectivity
Physical Connectivity
Institutional Connectivity
People-to-People Connectivity
Masterplan P3EIBasic Principles, Prerequisites for Success and Main Strategies of MP3EI
39

the education and training system must be able to create human resources that can adapt well to the development of science and technology.
Human ResourcesProductive human resources is the driving force of economic growth. To produce a productive workforce, it is deemed necessary to have high quality education that is relevant with the development needs. In an economy that is shifting towards a knowledge-based economy, the role of high level education is very important to create a superior and productive workforce. This superior and productive workforce is expected to have the ability to apply science and technology needed to improve the value added of sustainable economic activity. The high level education consists of academic education programs, vocational education programs, and professional education programs.
UniversityResearch Center
Community Colleges(In every capital city)
UniversityAcademic/Polytechnic
(including higher formal school)
The need for large number of Gross Participatory Level (APK) in a short period of time by introducing new models of higher and secondary level education managment such as
establishing community college in every regency/city through expansion of existing school, through community college, the costs can be reduced as students do not need to go far for
getting higher/secondary level education
High School/Vocational School
OutstandingStudent
PotentialStudent
Figure 2.7:Integrated Middle and
Higher Education.
The development of academic education programs is aimed at aligning the fields and study programs with the economic development potential in each economic corridor. Academic program must create a network which contributes to the value added chain for each commodity and sectors developed in each economic corridor. University research centers must be developed nationally as an important part of national innovation center. University research centers have to be developed based on the principle of integration, resource sharing, and utilize information technology optimally.
Vocational education programs are encouraged to produce skilled graduates. Therefore, the development of vocational education programs should correspond with the potential in each economic corridor. In each regency, high level education on the community college level should be developed. The community college
development, through the development of diploma course 1, diploma course 2, and diploma course 3 is expected to produce graduates whom can be absorbed directly by the economic activity in the centers of economic growth in every economic corridor. Therefore, the development of community colleges conducted jointly between government, business enterprises, and the university as a manager of a community college. The quality of community college will be controlled by polytechnics that are developed in provincial capital cities. The polytechnics are developed in accordance with the potentials and advantages of each economic corridor.
In addition to the development of high level education, human resource development is also carriedout with the development of education Vocational School (SMK), the development of job training, anddevelopment of the certification body.
Science and TechnologyThe ability of a nation to promote sustainable economic growth depends heavily on the ability of thenations to improve innovation. Innovation based on the capitalization of technology research productswill make an immediate impact on improving sustainable productivity, which in turn can accelerate theeconomic growth of a nation. The ability to master science and technology is a basic capital to create innovations that will be useful to develop the economy in order to face global competition.
Masterplan P3EIBasic Principles, Prerequisites for Success and Main Strategies of MP3EI
40

The efforts to increase productivity towards the creation of competitive advantage can be achievedwith the innovation based human resource capacity development. The legacy of natural resource-basedeconomy, which is labor intensive, needs to be gradually improved towards skilled labor intensiveand eventually to human capital intensive. The improvement of human capital mastering science andtechnology is highly needed when Indonesia enters into the innovation-driven economies stage.
Figure 2.8: Productivity
Improvement towards Competitive
Advantage
Increased Productivityto Competitive Excellence
Increased Economic Competency
Natural Resource-Based Economy
Factor Driven Investment Driven
Industry-Based Economy Innovation-Based Economy
Innovation Driven
Competitive
• Natural Resources• Labor Intensive
• Capital and Technology• Skilled Labor Intensive
• Innovation• Human Capital Intensive
Comparative
NationExcellence
Heritages Creations
National Treasures
Increased
Productivity
PROCESSINPUT OUTPUT
To support innovation program through 747 scheme, R & D fund which is around 1% of GDP until 2014 is needed.
The increase in R & D fund can be realized gradually based on government’s capacity, and also SOEs and private participation
1. Introduce incentive and regulation system that support innovation and use of domestic products
2. Improve the quality and flexibility of human resource movement
3. Develop innovation centers to support small and medium industry
4. Develop regional innovation clusters
5. Enhance researcher’s remuneration system
6. Develop R & D infrastructure7. Develop research funding system
and management that support innovation
1. Basic industries (food, medicine, energy, and water supply)
2. Creative industry (culture and ICT based)
3. Local capacity based industry (S & T Park & Industrial Park)
4. Strategic industry (defense, transportation)
PRESIDENT’S INITIATIVE : 1-747
1. Increase intellectual property rights from researches and industries that directly affect economic growth
2. Improve the infrastructure of S & T parks to reach international standards
3. Achieve self sufficiency for sustainable food, medicine, energy, clean water
4. Doubled the export for creative industry products5. Increase the number of superior products and improve
industrial value added of all regions6. Achieve self sufficiency form in products and system for
defense, transportation, and ICT industries7. Achieveing sustainable economic growth, equitable
prosperity, and strengthen NKR
1 7 74% Objectives of Indonesia’s Vision 2025Modes of EconomicGrowth Acceleration
Steps of Innovation System Improvement
Figure 2.9: Proposed innovation initiatives 1-747
of GDPper year
Masterplan P3EIBasic Principles, Prerequisites for Success and Main Strategies of MP3EI
41

To realize the increase of productivity, it is recommended that Indonesia applies presidential’s innovation initiative 1-747 as a key driver in the transformation to innovation-based economic system by strengthening the education system (human capital) and technological readiness.
Under the presidential innovation initiative 1-747 one percent of the GDP will be earmarked towards this strategy. This proportion should be increased gradually to 3% of GDP by 2025. Research and development funding portion as mentioned above, comes from the Government and the businesses. The transformation will be carried out through 7 improvement steps of innovation ecosystems, while the process will be carried out using 4 acceleration economic development instruments as a model for the strengthening of key stakeholders in innovation including tertiary institutions and community colleges. Therefore, it is expected that the 7 innovation targets in 2025 in the field of Human Resources and Science & Technology
will be achieved in order to ensure sustainable economic growth. In line with the economic progress of the factor-driven economy towards innovation driven economy, it is expected over time the role of government in funding R & D will decrease and the role of private sector in funding R & D will increase.
Innovation Implementation Initiatives in MP3EIThe following are some initiatives of innovation implementation that will support the success of MP3EI:1. Cluster Development in Support of 6 (six) Economic Corridors Development of 6 (six) economic
corridor should be accompanied by innovation cluster strengthening as the center of excellence in order to improve the ability for innovation to enhance competitiveness. The development of the Center of Excellence is expected to integrate with industrial clusters
2. Revitalization of PUSPIPTEK as Science & Technology (S & T) ParkRevitalize PUSPIPTEK as an S & T Park to deliver innovation-based SMI/SME in the various strategic areas, which are able to optimize interaction and utilization of university, research and development institutions, and business resources so that it is able to produce innovative products. To maintain the continuity of the management of the S & T Park, it is necessary to carry out the following steps:a. Making PUSPIPTEK as a professionally managed Public Service Agency (Badan Layanan Umum/
BLU), in order to create links between businesses and research.b. Making PUSPIPTEK as a leading center of high-tech research.
3. Establishment of Regional Innovation Cluster for Equitable GrowthMP3EI encourages and empowers efforts by the communities, business entities, and local governments that already has initiatives to develop innovation potentials on regional prime products and programs, such as:a. Agroindustry Innovation Zone Development Model, in North Gresik, East Java Province.b. Integrated Downstream Innovation Program Development Model, to develop palm oil, cocoa, and
fisheries.c. Non Renewable and Renewable Energy Based Innovation Zone Development Model, in East
Kalimantan Province.
Masterplan P3EIBasic Principles, Prerequisites for Success and Main Strategies of MP3EI
42

4. Innovation Stakeholders StrengtheningA key factor for the successful implementation of MP3EI depends on smart and effective effort of innovation stakeholders consisting of academicians/researchers, business/industry, community, legislators, and government. Some of the following ideas have to be executed in the smart planning and utilization of the nation’s potential in order to build a developed and dignified Indonesia. Those ideas are:a. Creating human resources that have the competence, high level of integrity through a combined
curriculum of science & technology, social value, and humanities education.b. Optimize the deployment of existing highly educated workforce, particularly those with master and
doctoral degrees, and overtime increase the number of Ph.D holders in science and technology to 7,000 – 10,000 by 2014.
c. Establish international standard laboratories both in basic and applied science in universities, vocational and non vocational research and development institutes, and at private research centers.
d. International cooperation that encourages the understanding and application of science and technology and the utilization of best practices that have been developed in various countries.
The Strengthening of Operation of National Innovation System Development of innovation product of an invention involves 3 main stakeholders in national innovation systems, namely: (a) the government as regulator, facilitator and catalyst, (b) business/industry as the users of the invention, and (c) research institutions and universities as incubators of the invention. The Collaboration of these three main stakeholders is very important and necessary for the development of innovative products.
In order to develop innovation, the Government will provide:1. Fiscal incentives to businesses (private and state-owned) that are developing innovation, and to foreign
companies that are using technology that was developed by Indonesia or transferring technology that was developed by foreign countries to Indonesia.
2. Research funds will be granted to the innovation developer with the following conditions: (a) the innovative products have to meet the needs and interest of the industry; (b) the innovative products have been proven to have ability to improve the productivity of the industries concerned. This requirement becomes important for the development of national innovation. The private sector is requested to become a major driver of innovation by providing information regarding state of the art technological invention needs, which have high market value.
Figure 2.10: Indonesia’s National
Innovation System Strengthening
Incentives
Technology & Management
Tech
nolo
gy &
M
anag
emen
t
Tech
nolo
gy &
M
anag
emen
t
Inve
stm
ent
Inve
stm
ent
Inve
stm
ent
IDR IDR IDRInvention Incubation
Private Sectors, SOEs, FDIs
Research & Technology
and University Institution
Domestic &Foreign Markets
Production
Gov
ernm
ent
QC and Marketing
Masterplan P3EIBasic Principles, Prerequisites for Success and Main Strategies of MP3EI
43


3Indonesia Economic
CorridorBased on the three strategies that have been
determined, development plan of 6 economic corridors were prepared to which its multiplier effects cover all regions throughout the nation.
Each of the economic corridors will be focused on developing a number of main economic activities in accordance with their respective advantages. A
number of indicated investment up to 2014, including main infrastructures, were identified based on the
consultation with all stakeholders.Doc. Wijaya Karya

Indonesia Economic Corridor
A. Posture of Indonesia Economic CorridorThe development of economic corridors in Indonesia is based on the potentials and advantages inherent in each region throughout Indonesia. As a country consisting of thousands of islands and located between two continents and two oceans, the Indonesian archipelago has a unique combination of economic potentials with specific major islands or regions having its own strategic future-role in achieving Indonesia’s 2025 vision. By taking into consideration these potentials and strategic roles of each major island, six economic corridors have been identified as depicted on the map 3.A.1.
3
The development themes of each corridor in the acceleration and expansion of economic development are as follows:• Sumatra Economic Corridor as a “Center for Production and Processing of Natural Resources and As
Nation’s Energy Reserves”• Java Economic Corridor as a “Driver for National Industry and Service Provision”• Kalimantan Economic Corridor as a “Center for Production and Processing of National Mining and Energy
Reserves”• Sulawesi Economic Corridor as a “Center for Production and Processing of National Agricultural,
Plantation, Fishery, Oil & Gas, and Mining”
Figure 3.A.1: Economic Corridors Map
13
5
4
Mega Economic Center
Economic Center
Kalimantan EC32 Java EC1 Sumatra EC Bali – Nusa Tenggara EC5Sulawesi EC 4 Papua – Kepulauan Maluku EC6
6
2
Masterplan P3EIIndonesia Economic Corridor
46

• Bali – Nusa Tenggara Economic Corridor as a “Gateway for Tourism and National Food Support”• Papua – Kepulauan Maluku Economic Corridor as a “Center for Development of Food, Fisheries, Energy,
and National Mining”
Figure 3.A.2: Theme of The Six Economic
Corridors in Indonesia
Theme of every economic corridor for acceleration and expansion of economic
development
Indonesia as basis for global food security, center of processing products of agriculture, plantation, fishery, mineral and energy resources as well as a center of global logistics
Center for Production
and Processing of National
Agricultural, Plantation, Fishery, Oil & Gas, and
Center for Production
and Processing of National
Mining and Energy
Reserves
Driver for National Industry
and Service Provision
Center for Production
and Processing of Natural
Resources and As Nation’s
Energy Reserves
SUMATRA JAVA KALIMANTAN SULAWESI
Center for Development
of Food, Fisheries,
Energy, and National Mining
Gateway for Tourism and
National Food Support
BALI - NT PAPUA - KEP. MALUKU
Masterplan P3EIIndonesia Economic Corridor
47

The prime purpose of MP3EI is to enable Indonesia to become a developed and prosperous country with a National GDP of around USD 4 – 4.5 Trillion by 2025 and becoming the 9th largest economy in the world. To achieve this goal, approximately 82 percent or equivalent to USD 3.5 Trillion will be targeted as a contribution to GDP from economic corridors.
By implementing the MP3EI, Indonesia’s overall GDP is expected to grow more rapidly and broader, both for areas within the six economic corridors and for areas outside the corridors. By applying MP3EI, the annual national GDP growth will be approximately 12.7 percent nationally with regional growth within the corridor at 12.9 percent. Growth in the areas outside of the corridors would also increase by 12.1 percent as a result of the spillover effects of economic development within the corridor areas.
Under the MP3EI, the growth of Java Economic Corridor will be pegged against the RPJMN. This will enable the rest of the five Economic Corridors to grow at a higher growth rate, to reduce the dominance of the Island of Java and allowing increased growth of the rest of Indonesia by 2025.
The MP3EI development focuses on eight main programs, namely the development of agriculture, mining, energy, industry, maritime, tourism, telecommunication, and development of strategic zones. These eight primary programs consist of 22 main economic activities which are designed based on the inherent potential and strategic value of each of the corridors.
Below is a mapping of main economic activities for each corridor:
Figure 3.A.3: Annual Growth Target for The
Six Corridors in Year 2025 Sumatra EC
% GDP Nominal Growth (2010 – 2025)
Java EC Kalimantan EC
Sulawesi EC Bali – NT EC Papua – Kep. Maluku
EC
Non-EC Indonesia
Business As Usual
RPJM
MP3EI
12.5%
10.2%10.6%
9.1% 9.6%10.3%
8.8%
10.5% 10.3%11.2%
11.9%
13.1%13.8%
11.1%11.8% 12.2%
12.9%
11.8% 12.1% 12.4% 12.7%12.8% 12.8%13.2%
15
10
5
0
MainEconomicActivity Sumatra Java Kalimantan Sulawesi Bali – Nusa Tenggara
Papua – Kep.
Maluku
Steel
Food and Beverages
Textile
TransportationEquipment
Shipping
Nickel
Copper
Bauxite
Masterplan P3EIIndonesia Economic Corridor
48

The development of Economic Corridors requires a large amount of power supply. Under MP3EI, the additional power supply needed in Indonesia by the year 2025 is projected to reach about 90,000 MW.
To support the development of the main economic activities within the corridors, the total investment value has been identified at about IDR 4,012 Trillion. The government will contribute around 10 percent of this cost in the form of basic infrastructure provision, such as roads, seaports, airport, railways, and power generation. The remaining will be provided by state owned enterprises, private sector, and through public private partnership (PPP).
MainEconomicActivity Sumatra Java Kalimantan Sulawesi Bali – Nusa Tenggara
Papua – Kep.
Maluku
Palm Oil
Rubber
Food Agriculture
Tourism
ICT
Coal
Oil and Gas
Jabodetabek Area
SundaStraitsNationalStrategicArea
DefenceEquipment
AnimalHusbandry
Timber
Cocoa
Fishery
Figure 3.A.4: Quantum of Estimated Investments in Each Corridor
Private
SOE
Government
Mix
Investment Indications
Value Based on Investor
Indications of Investment in 6 Economic CorridorsIDR Tn
18% 15%3%8%32% 24%% investment per Corridor
4,000
3,000
2,000
1,000
0
4,012
1,290
Total Papua - Kep. Maluku
Bali - Nusa Tenggara
SulawesiKalimantanJavaSumatra
Masterplan P3EIIndonesia Economic Corridor
49

IndicationsofInvestmentinMainEconomicActivities(IDR Tn)
Figure 3.A.5: Indications of Invesment in 22 Main Economic Activities MP3EI
The above estimated investments in each of the corridors includes investments in infrastructure as shown in Figure 3.A.6.
Figure 3.A.6: Indications of Infrastructure
investment in MP3EI
2,000
Indications of Infrastructure Investment (IDR Tn)
1,500
339
681
32632
242
1,786
18
31
117
1,000
500
0Road
InfrastructurePort
InfrastructurePower & Energy
Infrastructure
Airport Infrastructure
Railway Infrastructure
Water Utility ICT Other Infrastructure
Total
5,000
4,500
4,000
3,500
3,000
2,500
2,000
1,500
1,000
0
4,0121,786
2,226
Stee
l
Food
Bev
erag
es
Texti
les
Tran
spor
tatio
n Eq
uipm
ent
Ship
ping
Nic
kel
Copp
er
Baux
ite
Palm
Oil
Rubb
er
Food
Agr
icul
ture
Tour
ism ICT
Coal
Oil
and
Gas
Jabo
deta
bek
Are
a
Sund
a St
rait
Stra
tegi
c A
rea
Alu
tsis
ta/D
efen
se E
quip
men
t
Ani
mal
Hus
band
ry
Tim
ber
Coco
a
Fish
ery
Inve
stm
ent I
ndic
ation
in
Mai
n A
ctivi
ty
Infr
astr
uctu
re
Tota
l Inv
estm
ent I
ndic
ation
Masterplan P3EIIndonesia Economic Corridor
50

Padang
Sibolga
Medan
Banda Aceh
Pekanbaru
Tanjungpinang
Pangkal Pinang
To Pontianak
Palembang
Bandar Lampung
Serang
Jakarta
Alternative International HubKuala Tanjung
Free Trade Zone PortBatam
SumatraEconomic Corridor
Development Theme: Main Economic Activity:Consists of 11 Economic Centers:
• Pangkal Pinang• Padang• Bandar Lampung• Bengkulu• Serang
• Banda Aceh• Medan• Pekanbaru• Jambi• Palembang• Tanjungpinang
Center for Production and Processing of Natural Resources As The Nation’s Energy Reserves
• Palm Oil• Rubber• Coal• Shipping• Steel
• Sunda Straits National Strategic Area
Coal Mining Node
Capital City/Economic Center
Rubber Plantation Node
Palm Oil Plantation Node
Industrial Cluster
Domestic Sailing Network
Railway
Economic Center Connecting Lane
Existing Access Road
Main Exit Corridor Lane
Sea Port
Doc. Berau Coal
Masterplan P3EISumatra Economic Corridor
51

Figure 3.B.1: Value and Growth in GDP per Capita in Sumatra Economic Corridor
Overview of Sumatra Economic Corridor Sumatra Economic Corridor is expected to become The Center for Production and Processing of Natural Resources As The Nation’s Energy Reserves. Sumatra’s strategic location can propel it to become,“The Front Line of The National Economy into The European, African, South Asian, East Asian, and Australian Markets”.
The corridor thrives in the fields of economic and social development. Its main economic activities are palm oil, rubber and coal. Despite this, the corridor must address:• A significant income disparity within the corridor, both between urban and rural areas and among the
provinces;
• Growth of the main economic activities for oil and gas (20 percent share of GDP corridor) is very low due to dwindling reserves;
• Investments have been declining in recent years;• Current inadequate basic infrastructure for industrial development, such as narrow and damaged roads,
out-dated and damaged railroad tracks, inefficient and the lack of sea ports and electricity to support industries.
The economic development strategy for the Corridor focuses on three main economic activities: palm oil, rubber and coal. These activities have great potential to become main economic drivers. Steel production which is concentrated in Banten is also expected to become one of the drivers of growth in this corridor, particularly after the completion of the Sunda Straits Bridge.
-5%
Lhokseumawe
Rokan Hilir
AcehProvince
Provincial city:
North Sumatra Riau1 Jambi Lampung Banten
JambiPekanbaruMedan(North)
Palembang B. Lampung Serang
South Sumatra
Bengkalis
Siak
Musi Banyuasin
Muara Enim
Cilegon
High income region
Low income region
Growth rate
IDR Mn
GRDP per Capita at Current Price And Real Growth Rate for Regency/City in Sumatra Economic Corridor (2008)
5 year GRDP real CAGR (2003 -2008)
National GDP per capita IDR 21.7Mn
150
100
50
0
15%
10%
5%
0%
1 Riau relatively higher GRDP per capita driven by oil and gas industry (44% of GRDP output)Source: Province and Regency in number; National Statistic Agency (NSA); Analysis Team 2009
Masterplan P3EISumatra Economic Corridor
52

Sumatra plays an important role in the supply of palm oil plantations in Indonesia and the world. Since 2007, Indonesia has been the largest palm oil producer in the world. Previously, Malaysia held the title.
Palm oil is the largest source of vegetable oil used by many industries in the world. World demand for palm oil continues to experience growth of 5 percent per year. Indonesia produces approximately 43 percent of the total production of crude palm oil (CPO) in the world. The growth of palm oil production in Indonesia was 7.8 percent per year, compared to Malaysia with 4.2 percent per year.
Palm oil activities provide a large economic contribution to Sumatra, where 70 percent of palm oil area in Indonesia is located. It provides a high number of jobs. Approximately 42 percent of palm oil land is owned by small holders.
Figure 3.B.2: Palm Oil Production of Indonesia and Malaysia (Million Tons)
Palm Oil Production of Indonesia and Malaysia (Mn Tons)
Source: FAOSTAT; Team Analysis
2007
31.0 31.935.6 37.0
2008 2009 2010
40
30
20
10
0
Malaysia
Indonesia15.6
15.3
16.6
17.6
18.0
17.5
19.5
4.2%
7.8%
15.5
Palm oil
7.5
6.0
4.5
3.0
1.5
0
Mn Ha
Areas for Palm Oil in Indonesia (2009)
Source: Indonesia Palm Oil Statistic, 2009
1.50
1.33
1.20 0.310.49
0.51
0.580.33 0.38
0.24 0.02 0.03 6.92
4%26%70%
Other Region in Sumatra
North Sumatra
West Sumatra
Riau Aceh Java TotalSulawesiSouth Kalimantan
East Kalimantan
Central Kalimantan
West Kalimantan
PapuaFigure 3.B.3:
Areas for Palm Oil in Indonesia
Sumatra
Masterplan P3EISumatra Economic Corridor
53

Figure 3.B.5:Productivity of Some
Categories of Plantation Owners and Other
Benchmarks
8
6
4
0Government
Indonesia Average Yield
Malaysia Average Yield
Potential Yield1
CPO Yield (Ton/Ha), 2009
Private
3.83.4
4.14.2 4.6
7.0
Small Holders1 Based on yield of international benchmark companies.
Plantation: In 2009, Sumatra had approximately five million hectares of palm oil plantations, of which 75 percent were mature plantations. However, further expansion of palm oil plantations in Sumatra is limited due to environmental consideration.
As a result, intensification approaches need to be applied to increase the production yields of the existing palm oil. Indonesia’s current palm oil productivity is 3.8 tons/Ha, which is still far below the productivity of Malaysia at 4.6 tons/Ha, and still much lower than the potential productivity that could be achieved at 7 tons/Ha.
The following figure illustrates the value chain from plantations, mills, refineries, and palm oil processing in downstream industries.
Figure 3.B.4: Value Chain of Main
Economic Activities of Palm Oil
Source: BCG experience
Palm Oil Plantations
Oilsand FatsMilling of Palm Oil
Trading and Logistics
Bio-fuels
Refining and Fractionation
Oleo-chemicals
Oleo-chemicals
Plantation RefineryMilling Downstream
Fresh Fruit Bunches (FFB) Cooking oilMargarine
Bio-fuelGlycerine
Fatty AcidsFatty Alcohol
Crude Palm Oil (CPO)Palm KernelsPalm Kernel Oil
RBD Palm OilRBD OleinRBD StearinPFAD1
Approximately USD 0.03 Bn5
(0.6%)
Approximately USD 0.08 Bn4
(1.4%)
Approximately USD 5.25 Bn3
(98.0%)
Value add2 (USD Bn)
1 Palm Fatty Acid Distillate; 2 Estimated based on typical profit margin and the estimated volume flowing through each value chain step; 3 15 Mn Tons of CPO with margin of ~USD 350/Ton at current price of ~USD 680/Ton; 4 Approximately 7.5 Mn Tons (50% of overall) at margin of USD 10/Ton; 5 Approximately 3 Mn Tons at margin of Approximately USD 10/Ton.
Source: Industry Reports; Ministry of Agriculture; USDA Foreign Agriculture Service; Team Analysis
Masterplan P3EISumatra Economic Corridor
54

The low productivity for small holders is primarily caused by:• Use of low quality seeds. Research shows that the use of higher quality seeds can increase yields by up to
47 percent from current levels;• Inadequate use of fertilizer due to high prices for fertilizers;• Time between Fresh Fruit Bunches (FFB) to the old mill (above 48 hours) decreases the productivity of
CPO produced.
Milling: Improvements must be made to the value chain, beginning with better access from palm oil plantations to the mill. Inadequate access cause high transportation costs, long travel time, and low productivity. Better construction access to the mill will increase production. The lack of sea ports capacity is compounded by the lack of storage facilities, which causes a long waiting time and high transport costs.
Refinery: The refinery process changes the CPO from the mill into a final product. In 2008, Indonesia was estimated to have a refining capacity of 18-22 million tons of CPO. This capacity was sufficient to process all CPO produced.
With excess capacity available today (50 percent utilization), refining the value chain has a low margin (USD 10/tons) when compared to plantation value chain (about USD 350/tons). The low margins do not interest investors.
Palm Oil Downstream: Primary downstream industries in the supply chain of palm oil includes palm oil distillation, oleo-chemical and bio fuel. Similar to the value chain of palm oil distillation, the downstream of palm oil industries has sufficient installed capacity. This results in the low profit margin of the value chain. In the long run, however, the continued development of palm oil downstream industries is a must in order to maintain the strategic positioning of Indonesia. Having full upstream and downstream capabilities would enable Indonesia to sell high quality produce at competitive price.
Regulation and Policy To implement the development strategy of palm oil, the following must be addressed:• Increase spatial certainty for the development of upstream activities for palm oil (plantations and mills/
palm oil processing plants);• Improvement of regulations, incentives, and disincentives for the development of downstream palm oil
industries.
Connectivity (infrastructure) Development of the main economic activity of palm oil requires the following infrastructure:• Improve the quality of roads from the plantations to palm oil mills, the industrial estates and ports. CPO
productivity level is very dependent on the travel time from the plantations to the mills, the quality of FFB (Fresh Fruit Brunch) will decline within 48 hours after picking;
• Increase the capacity and quality of railway at several locations to transport crude palm oil from the mills to the ports;
• Increase the capacity and quality of port services to transport CPO production. At present, the traffic density in the ports is such that it causes excessive waiting times of 3-4 days.
Human Resources and Science & Technology In addition to regulatory requirements and supporting infrastructure improvements, development of main economic activities for palm oil will depend on the following:• Increased research to produce superior quality palm oil seedlings in order to increase the productivity of
palm oil;• Provision of financial assistance, education and training, especially for small holders;• Establishment of research centers and national control of oil management system.
Figure 3.B.6: The Margins of Each Value Chain
Source: Team Analysis 2009
Plantation & Milling
Refinery Oleo - Chemicals Historically
Oleo - Chemicals
Now
Estimated Profit Margins (USD/Ton)
Masterplan P3EISumatra Economic Corridor
55

Figure 3.B.8: Main Economic
Activities of Rubber Value Chain
Source: Interviews; Team Analysis 2009
Plantation Downstream industriesProcessing
Natural rubber is derived from rubber plants, typically planted in regions with equatorial temperatures and high rainfall
Rubber plants start producing rubber after ~6 years• No production of rubber in the first
6 years• Thus plantation owners need to
sustain without significant revenues in the initial stages
Rubber is collected from various small holders and is processed (smoked) to dry rubber• This is efficient to transport and is an
internationally traded commodity
Downstream industry uses natural rubber to produce various products in Sumatra, like:• Tyres• Gloves, footwear• Chemical products such as essential oils,
etc.
In most applications, natural rubber can be replaced or blended with synthetic rubber• Synthetic rubber is made from crude
oil - thus, rubber price is correlated to crude oil price
Approximately USD 800-1,000/Ton USD 200-400/Ton USD 200-400/Ton
Indonesia is the second largest producer of natural rubber (approximately 28 percent of world rubber production in 2010) in the world. It ranks behind Thailand (approximately 30 percent). In the future, the demand for natural rubber and synthetic rubber will continue to be quite significant. Demand is driven by growth in the automotive industry which requires raw material of synthetic rubber and natural rubber for tyres. The price of synthetic rubber made from petroleum will be volatile against the changes in world oil prices. Similarly, natural rubber prices will depend on world oil prices because natural rubber and synthetic rubber are complementary goods. With the use of petroleum as an energy source for both types of rubber processing, the price of natural rubber and synthetic rubber will depend on the condition of world oil prices.
The expected growth of the automobile industry in Asia and the world will increase demand for natural rubber. Sumatra is the largest producer of raw rubber from plantations. It stands to gain by improving productivity. Sumatra Economic Corridor generates approximately 65 percent of the national rubber production.
The main economic activities for rubber are divided into three sections, from plantation, processing, and utilization of rubber with added-value through downstream rubber industries. Rubber value chain activities are illustrated in following figure:
Figure 3.B.7: Share of Rubber Production in Indonesia
Source: A Literature Review, Team Analysis, Statistics Indonesia 2010
Share of Rubber Production (%)
16
20
11
133
104 1
22 100
64% 36%
Nor
th S
umat
ra
Sout
h Su
mat
ra
Jam
bi
Riau
Wes
t Su
mat
ra
Wes
t Ka
liman
tan
Sout
h Ka
liman
tan
Wes
t Ja
va
Oth
ers
Tota
l Estimated margin (USD/Ton)
Rubber
Masterplan P3EISumatra Economic Corridor
56

Plantation: Natural rubber from Hevea Brasiliensis plants are grown in the tropics and sub-tropical areas with moderate to high rainfall. The majority of rubber production is produced by small holders (approximately 80 percent of the national production). Private companies and the government each produce approximately 10 percent of the total national production. Most small holders have a small plot of land and still use the traditional way of plantation methods. This causes low productivity. As seen in the following figure, small estate-owned businesses have a 30 percent lower productivity than the large private estates or State Owned Enterprises (SOEs or BUMN). This impacts the profitability of the plantation as a whole value chain.
Figure 3.B.9: Production of Rubber
Industry Based On the Ownership of
Rubber Plantations in Indonesia
Indonesia’s productivity of rubber is approximately 50 percent of the productivity of India. When compared with other countries in Southeast Asia, Indonesia has a productivity level 30-40 percent lower than Thailand, Vietnam, and Malaysia, despite the fact that the role of small holders in other countries is greater than in Indonesia.
Figure 3.B.10: Comparison of Productivity of
Indonesian Rubber and Other Countries
2,000
1,500
1,000
500
0
1,9031,699 1,661
1,411
993
India Thailand Vietnam Malaysia Indonesia
Yield From Mature Land, 2008 (Kg/Ha)
100
80
60
40
20
0
Land with Small Holders (%)
IndiaThailand VietnamMalaysia Indonesia
9995 90
85
50
Source: Association for Natural Rubber Producing Countries; Team Analysis 2009
1,238
1,181
821
0 500 1.000 1.500
SOEs
Private Companies
Small Holders
Productivity (Kg/Ha)1
1 Productivity per Ha, both mature and immatureSource: Tree Crop Estate Statistics of Directorate General of Estate; Team Analysis 2009
Rubber Production (Thousand Tons)
Government Estate
Private Estate
Small Holders
2002
1,227
1,6301,823
2,0662,271
2,6372,755
217186
195
189
219277
232
232 288
221222
210
1,396 1,656 1,839 2,186 2,190
2003 2004 2005 2006 2007
3,000
2,000
1,000
0
+12%
4,000
2008 2009
2,922
3,678
294
306
320
332
2,308 3,040
Masterplan P3EISumatra Economic Corridor
57

Low productivity of rubber plantations in Indonesia are caused by low quality seeds, land utilization that is not optimal, and poor maintenance of plants. Low seed quality becomes a main problem for the plantations in Sumatra Economic Corridor, as demonstrated by a range of productive rubber trees that are less than 30 years old. The main solution is therefore to plant seeds known to have higher productivity.
At the time of planting, it is important to set optimal spacing. Traditionally, farmers or planters need to wait for 6-7 years until the plant can produce. Currently, large plantations using higher quality seeds are ready for production after 3.5 years. For small holders, the first 2 years can be used to intercrop with food agricultures so as to increase their income. It is expected that this can increase the attractiveness for investment in rubber plantations.
Processing: Large plantations (14 percent of the total area of rubber plantations in Indonesia) process the clot by cleaning and drying into dried rubber latex and concentrated latex. The processing value chain is an important part for the main economic activity for rubber. Issues in the value chain include the presence of intermediaries who collect the products from small holders at the rubber plantation. The intermediaries increase rubber prices in Indonesia, rubber farmers receive only 50-60 percent of the total sale price, whereas in Thailand and Malaysia, the farmer’s share reaches about 90 percent. To compensate, the small holders try to increase profits by mixing pure rubber with other ingredients to increase the weight, even though this practice will decrease the quality of processed rubber. The improvement of the rubber-gathering process used in Sumatra Economic Corridor must be done to improve the quality and productivity of rubber to attract investors for downstream rubber value chain.
Downstream Industry: Currently, only 15 percent of upstream production is consumed by the downstream industry in Indonesia, and the remaining 85 percent of natural rubber is a commodity for export. Natural rubber and synthetic rubber are used as a raw material for rubber tyres with levels between 40-60 percent of rubber content and added various other ingredients. The result is downstream industries producing shoes soles, retread tyres, and rubber goods for the market. Concentrated latex can be used as raw material for gloves, condoms, rubber threads, balloons, pillows and mattresses, and others products.
100
75
50
25
02-wheeler tyres TotalBicycle tyres4-wheeler tyres Footwear OthersRetreaded tyres Glove Industrial GoodsTotal tyres
31
14
9
7
61
14
12
67
100
Figure 3.B.11:Use of Natural
Rubber in Indonesia Source: Interviews, Team Analysis 2009
Share of Natural Rubber Use by Downstream Industry Application (%)
The use of natural rubber in Indonesia is dominated by the tyre industry with 61 percent of the use of rubber in downstream industries and the remainder used for industrial gloves and footwear. This is consistent with the use of natural rubber in the downstream industry. The potential for the tyre industry is significant; this is indicated the tyre exports, which grew by an average 22 percent per year and sufficient supply of raw materials, giving the Indonesian tyre industry a competitive advantage.
Masterplan P3EISumatra Economic Corridor
58

Regulation and Policy The major focus of the related regulations and policies in the development of main economic activity of rubber are:• Reviewing the Government policy concerning the types of materials and products that should not be
exported to support local industries (arranged through the Minister of Trade Decree No. 1 Year 2007);• Improving efficiency of processing and marketing value chain by effectively implementing the Law No. 18
Year 2008 of the Plantation and its implementation rules (Regulation of the Minister of Agriculture No. 38 Year 2008 of Guidelines for Materials Processing and Marketing Sports Rubber, and Regulation of the Minister of Trade No. 53 Year 2009 concerning the Control of Export Commodity Quality Sports Materials Standard Indonesian Rubber Traded);
• Increasing the productivity in the upstream (small holder plantations) by replanting gradually on a larger scale, together with subsidy assistance from bank credit, providing a high quality seeds along with the incentives that support the replanting program, providing a sufficient post-harvest’s extension of cultivation and technology (such as: wiretapping, usage of tapping bowl, tapping knife, rain shield, clotting materials and clotting containers), and also a support from the National Land Agency (BPN) to collect the land ownership data and provision of land certificate data;
• Developing strategies for downstream rubber industry by taking into account incentive-disincentive, Domestic Market Obligation (DMO), industry type and availability of raw materials and auxiliary materials which can strengthen the competitiveness of local downstream industries of rubber;
• Providing an easier way for investors to invest in the downstream rubber industry with the provision of information along the process and procedures, which are clear and measurable investments.
Connectivity (infrastructure) In order to support the general strategy for rubber development, there are some basic infrastructures requirements which must be addressed:• Development of port capacity to support the rubber industry, both upstream and downstream by
streamlining the waiting time at the port. Rubber production requires port services to serve as a gateway for export and domestic consumption;
• Additional power capacity is required to support the rubber industry in Sumatra;• Development of onshore logistics network between plantations, processing centers and access to the ports.
Human Resources and Science & Technology Development of the main economic activities of rubber requires the support of science & technology, including:• Establishment of a rubber industry institution which can be useful as a research center and can be used to
improve the product quality of rubber material so that the traders and the middlemen can enhance the efficiency in the future;
• Enhancement of human resources through the development of research-related education for rubber.
Masterplan P3EISumatra Economic Corridor
59

120
80
40
0Sumatra Kalimantan Others
52.4
51.9
104.8
0.4
Total
Coal Resources in Indonesia, 2009 (Bn Tons)* Coal Resources in Sumatra, 2009 (Bn Tons)*
120
80
40
0South
SumatraJambi Riau Others Total
47.152.4
2.2 1.8 1.8
Coal is a main economic activity which is very attractive due to strong demand from Asia Pacific as well as growing domestic demand.
Indonesia is rich in coal, and is the largest thermal coal exporter in the world (about 26 percent of world exports), followed by Australia with 19 percent of world exports. Of the total resources of coal reserves (104.8 billion tons) in Indonesia, 52.4 billion tons are found in Sumatra, with approximately 90 percent of these reserves located in South Sumatra. With coal production of approximately 200 million tons/year, Indonesia has coal reserves for the long term.
Figure 3.B.12: Coal Reserves in Indonesia
and Sumatra*Includes the 2009 joint study by Ministry of Energy and New Energy and Industrial Technology Development Organization (NEDO) of Japan Source: Provincial and district in number; Central Bureau of Statistics; Team Analysis, 2009.
Even though Sumatra has a very large coal reserves, its coal production is very low, at approximately 20 million tons per year or approximately 10 percent of total coal production in Indonesia. Of the ten largest coal producing companies in Indonesia, only one company operates in Sumatra.
Challenges of coal production in Sumatra are:1. Most of coal mining activities are located in the middle of the island, away from sea ports and coastline
and also away from transportation network like railways. This makes transportation to the port inefficient because the condition of the current land transport infrastructure is not good enough. This causes higher costs for transportation from the mines;
2. Average coal reserves in Sumatra have lower quality (Low Calorie Value-CV) compared to coal from Kalimantan. Total coal reserves of low CV in Sumatra reached 47 percent, while in Kalimantan only 5 percent;
3. Basic supporting infrastructure for coal mining is still inadequate. The option for use of railway for transporting coal is extremely limited. The highways used to transport the coal are often damaged. Limited port capacity causes bottleneck for the development of coal industry;
4. Difficulties in land acquisition, the low quality of human resources, and the lack of clear government policy regarding the use of coal continue to cause challenges.
Figure 3.B.13: Coal Reserves by Calorie Value (CV)
0 2 1
Source: Directorate General of Mineral Resources, Coal and Geothermal, Coal Book 2008/2009: A Literature Review, Team Analysis.
% of Resource Coal
Sumatra
Low CV (<5,100)
5
Medium CV (5,100-6,100)
OverallIndonesia
High CV (6,100-7,110)
Very High CV (>7,100)
Coal
Doc. Berau Coal
Masterplan P3EISumatra Economic Corridor
60

Regulation and Policy To ensure the optimal development of coal production, regulatory and policy support is required, such as:• Setting the coal usage as the primary fuel for electricity power in Sumatra. It is estimated that 52 percent
of fuel for power plants in Sumatra will use coal by 2020. This will increase interest for investors for coal mining operations;
• Increase utilization of coal. Coal mined in Sumatra it is not directly exported as a raw commodity, but processed into higher value-added products, such as electricity conversion (minemouth power plant), upgraded coal, or petrochemical products. Minemouth power plant is worth consideration because it is more efficient and has no transportation costs;
• Issuance of regulations concerning the operational policies in utilizing low rank coal for the national electricity supply. Apply the direct appointment method for coal companies capable of supplying coal for minemouth Power Plant for a minimum of 30 years, with interest to use for power generation;
• Acceleration of the determination of Reference Price of Coal in order to determine the benchmark prices of coal on a regular basis based on location and amount of calories;
• Standardization of methods of measuring and reporting the amount of production at the mine and the allocation of export and Domestic Market Obligation (DMO) to obtain coal Mining Permit (IUP) from the Ministry of Energy and Mineral Resources and local government;
• Strengthen the regulatory and land policy to solve the issue of land compensation;• Control of illegal mining without permit (PETI-Illegal Mining).
Connectivity (infrastructure) Related to the connectivity (infrastructure), the key strategies required are:• Coal mining activities in Central South Sumatra requires rail infrastructure that can be used to transport coal.
Given the low CV of coal, transport by road is not economically efficient. By using the railway, transport costs will decrease up to a profitable level for the low CV coal;
• Construction of a railway that can carry coal from the inland to the port; • Increasing capacity of the port in Lampung and South Sumatra to improve the delivery of coal out of Sumatra.
Existing Location
Proposed Location
Aceh
NorthSumatra
WestSumatra
Riau
Jambi
Bengkulu
SouthSumatra
Approximately 90% of South Sumatra
resources are inland
Lampung
Figure 3.B.14: Location of Coal
Mining in Sumatra
Masterplan P3EISumatra Economic Corridor
61

Human Resources and Science & Technology Development of the main economic activities of coal requires:• Improved quality of human resources through education and training. Education and training need to be
improved. To increase coal production by 10 million tons/year, it needs 2,500 workers, 10-15 percent of which are managerial staff;
• Improved corporate governance for investment in coal mining to increase investor interest.
Doc. Berau Coal
Masterplan P3EISumatra Economic Corridor
62

Figure 3.B.15: The Capacity of The
National Shipping Industry (Reparation)
figure 3.B.16: The Capacity of the National Shipping Industry (New
Building)
The development of shipyard industry depends on the demand for new vessels and the intensity of shipping traffic in Indonesia.
The implementation of cabbotage policy increased the number of ships, but it did not significantly increase domestic shipbuilding as shipping companies prefer to buy used ships. Shipbuilding capacity with large tonnage and transport of offshore oil drilling equipment has not been mastered by Indonesian shipyards.
In Indonesia most shipyards are only capable of building ships there are generally 500 DWT or less than 20,000 GT. Currently there are 90 businesses that involved in building new ships and there are 120 businesses involved ship repairs. As for shipyards with the capacity to build ships above 10,000 DWT or above 180,000 GT there are only 10 businesses that involved in building new ships and 20 businesses to repair these bigger
Shipping
Kapasitas Industri Perkapalan (Bangunan Baru)
Sumber: IPERINDO; 2011
200.000
180.000
160.000
140.000
120.000
100.000
80.000
60.000
40.000
20.000
0
100
90
80
70
60
50
40
30
20
10
Kapa
sita
s Te
rpas
ang
Jum
lah
Gal
anga
n Ka
pal (
unit)
< 500 DWT 500-1.000 DWT 1000-3000 DWT 3000-5000 DWT 5000-10.000 DWT >10.000 DWT
Kap Terpasang (GT) Kap Terpasang (DWT) Jumlah Gol. (unit) sumbu kanan
Output Produk
1.000-3.000 DWT 3.000-5.000 DWT 5.000-10.000 DWT
Jumlah Galangan (Unit)Sumbu Kanan
Sumber: IPERINDO; 2011
1.400.000
1.200.000
1.000.000
800.000
600.000
400.000
200.000
0
140
120
100
80
60
40
20Kapa
sita
s Te
rpas
ang
Jum
lah
Gal
anga
n Ka
pal (
unit)
Kapasitas Industri Perkapalan (Reparasi)
Output Produk
< 500 DWT 500-1.000 DWT 1000-3000 DWT 3000-5000 DWT 5000-10.000 DWT >10.000 DWT
Kap Terpasang (GT) Kap Terpasang (DWT) Jumlah Gol. (unit) sumbu kanan
1.000-3.000 DWT
1.000-3.000 DWT
3.000-5.000 DWT
3.000-5.000 DWT
5.000-10.000 DWT
5.000-10.000 DWT
Jumlah Galangan (Unit)Sumbu Kanan
Jumlah Galangan (Unit)Sumbu Kanan
1,400,000
1,200,000
1,000,000
800,000
600,000
400,000
200,000
0
200,000
180,000
160,000
140,000
120,000
100,000
60,000
40,000
20,000
0
< 500 DWT
< 500 DWT
Installed Capacity (GT)
Installed Capacity (GT)
The Capacity of the National Shipping Industry (Reparation)
The Capacity of the National Shipping Industry (New Building)
Installed Capacity (DW)
Installed Capacity (DW)
Product Output
Product Output
Amount of Shipyard (unit) Right axis
Amount of Shipyard (unit) Right axis
Source: IPERINDO; 2011
Source: IPERINDO; 2011
500 – 1,000 DWT
500 – 1,000 DWT
1,000 – 3,000 DWT
1,000 – 3,000 DWT
3,000 – 5,000 DWT
3,000 – 5,000 DWT
5,000 – 10,000 DWT
5,000 – 10,000 DWT
> 10,000 DWT
> 10,000 DWT
Am
ount
of S
hipy
ard
(uni
t)A
mou
nt o
f Shi
pyar
d (u
nit)
Inst
alle
d Ca
paci
tyIn
stal
led
Capa
city
Masterplan P3EISumatra Economic Corridor
63

ships. This gap indicates that the shipping industry in Indonesia is in need of investment for the construction of shipyards with a capacity above 10,000 DWT or above 180,000 GT.
The East Coast of Sumatra, directly opposite the Straits of Malacca (Sea Lanes of Communications - SLoC) is a busy shipping passage. No fewer than 300 ships per day pass through, of which, approximately 50 ships include VLCC tankers (Very Large Crude Cruiser) that bring oil to East Asia from the Persian Gulf. The sea lanes of the Sunda Straits are in a highly strategic position. Along the east coast and Southern Sumatra, the Riau Islands and the western coast of Banten are good locations to build a shipyard. However, the number and amount of tonnage and distribution of its location needs to be adjusted.
Long term development of shipbuilding should be developed near major ports such as on Karimun Island - Riau Islands Province (near Singapore), Port of Belawan, and Kuala Tanjung which will be developed to serve as an alternative International Hub at the western gate. The shipyard for the manufacture of new vessels will be located in Dumai - Riau. The development of the shipbuilding industry is expected to replace the role of Java Corridor, where there will be more restrictions for the development of heavy industries.
Strategies which need to be undertaken are:• Increase utilization of domestic production vessel;• Increase the ability of the shipping industry;• Develop supporting shipping industries (shipping component); and• Improve funding support for the shipping industries.
Regulation and Policy In order to support this general strategy, some related regulatory and policy measures are required:• Increase the number and ability of the national shipbuilding industry in the construction of ships up to a
capacity of 50,000 DWT (Dead Weight Tonnage);• Establish a national shipbuilding facility with production facilities in the form of building berth, graving
dock with capability of building or repairing vessels up to 300,000 DWT;• Enforce the development and repairment for ships under 50,000 DWT;• Prioritize shipbuilding to support oil and gas activities, except for the vessel type C;• Remove Value Added Tax (VAT) from upstream to downstream in the shipping industry in order to cut
production costs by 10 percent;• Determine the level of interest rates and reasonable collateral for loans from commercial banks and
granting soft loans from ODA (Official Development Assistance)/JBIC (Japan Bank for International Cooperation) with two step loan schemes through Public Ship Financing Program (PSFP);
• Review the Minister of Finance Regulation No. 261/PMK.011/2010 with regard the implementation of Import Duty Covered by Government (BMDTP) policy for shipping industries (only for shipping component that is not produced in Indonesia).
Human Resources and Science & Technology In addition to regulatory and policy improvements, the following need to be completed:• Improve human resources capabilities in ship design through the establishment of special schools for
shipping construction;• Improve laboratory test facilities in accordance with International Maritime Organization (IMO) standards.
Masterplan P3EISumatra Economic Corridor
64

Figure 3.B.17: Tree of Iron Steel Industry
Steel industry has a strategic role in economic development. As a developing country, Indonesia is making progress towards developed status. The national demand for steel increases from year to year. The national steel industry is managed by State-Owned Enterprises (SOEs) and the private sector. They both currently have a high degree of dependence on foreign parties, either in the form of importing raw materials for industrial production or in the form of technological supports.
Indonesia steel consumption is still very low. In 2005, it was 29 kg/capita, compared to the average world consumption of 170 kg/capita. Thus, steel industries in Indonesia need to be further developed.
Steel
Source: Krakatau Steel Tbk.
APPLICATIONS
Existing Industry Non Existing Industry
Masterplan P3EISumatra Economic Corridor
65

The steel industry is made up by 45 economic activities consist of 4 iron ore mining activities and 41 downstream manufacturing industries (as seen on Figure 3.B.17). Typically, iron ore still has other minerals content which has economic value that generates added value for the steel industry. However, downstream manufacturing industries are still not being developed in Indonesia.
The implementation of Export Duty for iron ore cannot be done as yet, because iron ore processing industries that produce iron ore concentrate have not been developed in Indonesia.
Another problem in the iron ore mining is the lack of synchronization of authority between central and local governments, related to the monitoring system and the issuance of mining permits (IUP). In addition, the issuance of permits for small deposit mining (maximum 2 million tons) have the potential to damage the environment, while efforts to restore the environmental conditions are still very difficult.
Steel companies fill 27 types of downstream industries (or 66 percent of the total types of steel manufacturing), 11 of which are downstream industries with application activities such as the household appliance industry, automotive, and electronics and infrastructure. In the downstream industry, refer to the tree of steel industry diagram (Figure 3.B.17), Indonesia has not able to produce heavy profile steels such as rails, and stainless steel rod and bar shaft.
Figure 3.B.18:Iron Steel Growth
100
75
50
25
0
84Laterite iron deposit
Primary iron deposit
29 32
5 8
17
40
21
Iron deposit in Indonesia (%)
Oth
ers
Sula
wes
i
Kalim
anta
n
Sum
atra
Papu
a
Mal
uku
150
100
50
0
Estimated production cost
USD/bmtu
2004 2005 2006 2007 2008 2009 2010
100
75
50
25
0
1.5x potential3
49.1
21.342.9
67.9
94.3
15.8
4.2
Projected non-oil and gas mining contribution by kind of mineral (IDR Tn)
Nic
kel
Copp
er
Coal
Iron
San
d
Gol
d an
d Si
lver Tin
1 Indonesian Commercial Newsletter Volume 57, June 20082 World Bank Commodity Price Data (Pink Sheet)3 based on the assumption that the same reserves for 30 years with the price of USD100 per tons of iron ore price
Source: Indonesian Commercial Newsletter; World Bank Commodity Price Data; Team Analysis
As the island with the largest iron ore reserves1 …
X =
… together with the relatively high iron-ore price2 …
Iron ore have a potential to double its contribution
The number of steel based industrial enterprises increased by 2.6 percent, although in 2005, they experienced negative growth of 1.47 percent.
Iron ore deposits are distributed in Kalimantan, Sulawesi, Sumatra, Maluku and Papua. Sumatra has 8 percent of Indonesian laterite iron ore reserves located in Bengkulu, West Sumatra and Riau Islands.
In 2004, demand for the steel industry began to increase. This was primarily driven by demand from other growing sectors, including automotive, electronics, and infrastructure. In 2005, the production capacity of domestic steel (slabs, billets, bloom and ingot) and crude steel in Indonesia amounted to 6.5 million tons, with an average utility rate of about 50 percent.
Masterplan P3EISumatra Economic Corridor
66

The steel industry value chain is attractive because the price of iron ore is approximately USD 55-60 per tons (operational cost USD 25-35 per tons) and the selling price of concentrate is approximately USD 100-120 per tons (operational cost USD 15-25 per tons). Other estimates: industrial products agglomeration USD 180-200 per tons (operating cost of USD 10-20 per tons), iron-making industry (smelting) in the range of USD 350-400 per tons (operational cost USD 50-110 per tons), and the production of the steel is expected to reach USD 700 per tons (operational cost USD 80-110 per tons).
Mining DownstreamSmelting
Iron Steel Industry Value Chain
Iron Ore
Finished Product
Applications
• Hot Forming• Cold Forming
• Ore Dressing• Agglomeration• Iron Making• Steelmaking casting
Figure 3.B.20:Iron Steel Industry
Value Chain
Estimated Profit (USD/Tons)
Figure 3.B.19: The Margins of Each
Value Chain Source: Team Analysis, 2009
300
250
200
150
100
50
0
MiningManufacture of
Iron Concentrate
AgglomerationIron
ManufactureSteel
Manufacture
2015
1540 40
140
Maximal Estimated Profit (USD/Tons)
Minimal Estimated Profit (USD/Tons)
50
130
130
35
Mining: Mining will continue to increase in line with increasing world demand for iron ore. On the other hand the upstream steel industries do not have a manufacturing iron ore processing capability to provide iron ore concentrate causing downstream manufacture to be dependent on imported raw materials. Without more downstream activities, Indonesia will miss the opportunity to increase employment and profit margins on the value chain because of the absence of downstream processing industries of iron ore and iron sand that needed to build a steel industry production chain in Indonesia.
Investment in the steel industry is attractive despite the fact that it requires substantial funds. Results show that the benefits from mining are not optimal, because revenues from iron ore processing industry would provide more added value than the direct sale of iron ore.
Smelting: The steel smelting industry in Cilegon is already using imported scrap and sponge iron as raw material. There is a need to improve productivity to meet domestic demand, and to boost new production capacity to 60 percent capacity. In order to compete in the world market, it will be more effective if the industry is vertically integrated. It is necessary to apply appropriate incentives and disincentives in an effort to complete the required type of industry. The availability of adequate electricity is needed to support the development of upstream iron ore industry.
Masterplan P3EISumatra Economic Corridor
67

Downstream: Sumatra Economic Corridor’s steel industry is concentrated in Cilegon - Banten Province through SOE partnerships with foreign companies. This partnership will build the steel smelting industry with a capacity of 3 million tons per year, to produce steel slab which will be purchased or used directly by the SOE, exported or utilized by other downstream industries.
In order to reach the steel consumption of 100 kg/capita/year by 2025 or 43 kg/capita/year by 2015, the development of steel industries are needed in places such as Cilegon (with a capacity of more than 4.5 million tons per year), Kalimantan (with a capacity of 15 million tons), Lampung (with a capacity of 5 million tons) and the remaining 5 million tons scattered in other locations in Sulawesi, Sumatra, Maluku. In Sumatra, industrial estate development should be considered at a location near the Sunda Straits Bridge in Lampung Province.
Because iron and steel industry are linked to other strategic national industries, therefore it needs to be distributed across the major islands of Indonesia. In this way the widespread location of production chain can function securely by minimizing the effects of strike and other adverse factors.
Regulation and Policy Strategic development of the main economic activities of steel requires regulatory and policy improvements, as follows:• Improve the national’s iron ore concentrate production through policies that provide the requirements by
building a manufacturing process of iron ore concentrate near the mining areas;• Increase production capacity of the steel industry through the provision of raw materials, particularly iron
ore through the Domestic Market Obligation (DMO), issued by the central government;• Improve the competitiveness of national steel products through development of new industries that
have not been developed in Indonesia, increase production capacity, and build national upstream and downstream business partnerships;
• Develop a business climate that is conducive for the steel industry through increased partnerships, fiscal incentives and disincentives, application of level of domestic content regulations (TKDN) on steel products, and improve facilities support production and marketing of national steel industries;
• The Policy for cluster development of downstream steel industry prioritizes industrial estates for efficiency of operation and maintenance of supporting infrastructure or integration of steel smelting and stainless steel production (slab, Hot Roll Coil (HRC) and Cold Roll Coil (CRC)).
Connectivity (infrastructure) The supporting infrastructure is needed to increase connectivity in the development of steel industry as follows:• Provision of supporting infrastructure (electricity, road network, railways, ports); • Improve basic infrastructure including inter locus related activities (roads, railways, waste managements).
Human Resources and Science & Technology Development of the main economic activities in Sumatra needs human resources development and science & technology support as follows:• Implementation of education and training to improve skilled labor in the steel industry;• Development of human resources through training centers and higher education to produce skilled
manpower to meet the required quantity and quality of the steel industry.
According to the National Statistic Agency (Census 2010), 57 percent of the Indonesian population live in Java, while the land in Java represents only 7 percent of the archipelago, 21 percent live in Sumatra, (Sumatra’s land area represents 21 percent of the archipelago). Therefore, both islands have huge potential to enforce human and goods mobility.
Masterplan P3EISumatra Economic Corridor
68

Currently, Sumatra and Java are connected only by ships and aircrafts which are heavily influenced by weather conditions (wind, fog, ocean currents, day and night conditions), and technical condition of transportation modes.
Connectivity (infrastructure) As the connection between Sumatra and Java, Sunda Straits Bridge (JSS) will provide:• An efficient transportation between the islands of Sumatra and Java, and relatively free of weather and wave
resistance. JSS will shorthened the travel time to only 30 minutes compared to ferry services that take on average of 2-3 hours. Moreover, JSS will be provided with railway access which enables passengers and freight to use train services to cross Sunda Straits;
• The Sunda Straits Bridge can also be used as infrastructure for the installation of liquid and gas pipes, cables and fiber optic networks, and the Center for Tidal-based Electricity.
The Sunda Straits Bridge will be located on part of “Indonesian Sea Lanes” (ALKI). Therefore, technical characteristic should consider types and sizes of container ships and passenger ships such as Nimitz Class and USS Enterprise. In addition, technical design of the bridge should consider the plan for its railway development. Other technical aspects that need to be considered are route selection and the configuration of the bridge such as geology, fault, seabed contours, seismicity, volcanology and tsunami.
Benefits The benefits of Sunda Straits Bridge are:• Facilitate a shift in the development of industrial activities concentrated in Java to Sumatra;• Develop agricultural sector in Sumatra as an agricultural supplier to Java;• Facilitate the development of the main economic activity in surrounding area near the bridge, such as the
tourism resort of Tanjung Lesung (1,500 Ha), the area around Bojonegara Container Terminal (500 Ha) and industrial estate in Cilegon, as well as industrial and warehousing areas in Lampung;
• The industrial sector, tourism, and transportation services will be positively affected, including transportation industry services and tourism across ASEAN and Australia. In addition, the Map of geo-economic tourism industry that is focused on 12 of the National Tourism Destinations will change with the existance of JSS.
Population Area
Source: National Statistic Agency (NSA), 2010
Figure 3.B.21: Percentage of Total
Population and Area Within The Major Island, in 2010
(%)
Sumatra
60
40
20
0Java Bali - NT Kalimantan Sulawesi Papua - Kep.
Maluku
Sunda Straits National Strategic Area
Doc. PT Bangungraha Sejahtera Mulia
Masterplan P3EISumatra Economic Corridor
69

For the preparation and accelerated development of the Sunda Straits Bridge, the following should be considered:1. Acceleration of Presidential Regulation1 , which will regulate the Sunda Straits bridge construction to secure
public and national interests for Indonesia. Increase possibility to use Public Private Partnership schemes involving the relevant provincial government, SOE, Local SOE, and strategic partners;
2. Prepare the procedures for the agency or team conducting the Feasibility Study (FS), including the use of a comprehensive system to set prices, limits for negotiated concessions, including the amount and validity period of the concession;
3. Develop infrastructure associated to operationalization of Sunda Straits bridge such as: Panimbang - Serang Toll Roads, South Banten Airport, Bojonegara Container Port, and Cilegon - Bojonegara Toll Road (14 km);
4. Anticipate the effect on patterns of spatial utilization and spatial structure activities in Java and Sumatra, particularly in areas directly affected by the Sunda Straits Bridge. The effect of spatial utilization and the spatial structure pattern must consider protected areas in RTRWN (Government Regulation No. 26 Year 20082)
Other Economic ActivitiesIn addition to the main economic activities in Sumatra Economic Corridor, there are also several activities that with economic potential such as food agriculture, tourism, oil and gas, timber, and fisheries. As for securing the availability of food production, the activity will focus on food storage development in Aceh.
InvestmentTo develop Sumatra Economic Corridor, new investments of the main economic activities have been identified comprising of Coal, Iron Ore/ Steel, Rubber, Palm Oil, Shipping, National Strategic Area (KSN) Sunda Straits Bridge, and the supporting infrastructure, with a total investment amount of IDR 714 Trillion.
Figure 3.B.22: Total Investment in Sumatra Economic
Corridor
714414
Investment Indication in Sumatra Economic CorridorIDR Tn
Coal ShippingPalm OilSteel InfrastructureKSNSunda Straits Bridge
TotalRubber
103
174
Government
SOE
Private
Mix
800
600
400
200
0
181
7443150
64
32
255
1 Presidential Regulation Number 13/2010 on Government Cooperation With Business Entities In The Provision Of Infrastructure is no longer sufficient for mega projects such as the Sunda Straits Bridge (JSS)
2 The function key region associated with Sunda Straits is the mainstay of the Sea Area and surrounding Krakatoa which serves as: fisheries, mining and tourism and the Bojonegara-Merak-Cilegon Regions that serves as: industry, tourism, agriculture, fishery and mining
Investment initiatives that has been successfully identified from government funds, private and state owned enterprise (SOE) as well as a mixture of all three.
In addition to the major investments, there are also several investments that are part of 22 main economic activities, which includes Tourism, Agriculture, Food, Gas, Timber and Fisheries with a total investment of IDR 100.2 Trillion. There are also identified investments outside the 22 primary economic activities developed in MP3EI, such as activities in gold mining with a total investment amount of IDR 44 Trillion.
Masterplan P3EISumatra Economic Corridor
70

Strategic Initiatives of Sumatra Economic Corridor
Government
SOE
Private
1K1-(9)-1
IDR 2.50 Tn
Sei Mangke Area -Palm Oil
4
1
2
3
4
5
6
K1-(9)-4
IDR 27.78 Tn
Muara Enim, Pendopo - Palm Oil, Coal
2K1-(9,16)-2
IDR 5.36 Tn
Dumai Industrial Area -Palm Oil
5K1-(18,26)-5
IDR 150 Tn
Sunda Straits National Strategic Area -Sunda Straits Bridge
3K1-(15)-3
IDR 1.8 Tn
Tanjung Api-api, Tanjung Carat - Coal
Sumatra Economic Corridor
6K1-(26)-6
IDR 57.90 Tn
Cilegon - Iron Steel
Figure 3.B.23: Sumatra Economic Corridor Investment Map
Coal Mining Node
Capital City/Economic Center
Rubber Plantation Node
Palm Oil Plantation Node
Industrial Cluster
Domestic Sailing Network
Railway
Economic Center Connecting Lane
Existing Access Road
Main Exit Corridor Lane
Sea Port
Masterplan P3EISumatra Economic Corridor
71

In addition to investments associated with the main economic activities above, the Government is also committed to develop infrastructure in Sumatra Economic Corridor. The following is an indication of the value of infrastructure investment for each type of infrastructure that will be done by the Government, SOE, and a combination of both.
No Code Locus Main Economic
Activity Stakeholders Supporting Infrastructure
Investment Value
(IDR Tn)
Investment Sharing Towards Main
Economic Activities in All Corridors (%)
1 K1-(9)-1 Sei Mangke Area Palm Oil SOE Railway, Road, Power & Energy 2.50 3
2 K1-(9)-2 Dumai Industrial
AreaPalm Oil Private Road, Port, Power & Energy 5.36 6
3 K1-(14)-3Tanjung Api-Api/
Tanjung CaratCoal Private Railway, Road, Power & Energy 1.80 1
4 K1-(9,14)-4
Muara Enim Palm Oil
Private
Railway, Road, Power & Energy 0.29 0.32
Pendopo Coal Power & Energy 27.49 13
5 K1-(17)-5Sunda Straits Strategic Area
Sunda Straits Bridge
Government, Private
Sunda Straits Bridge(JSS)
150.00 100
6 K1-(1)-6 Cilegon Iron Steel SOE, Private Power & Energy, Water Utility 57.90 58
Figure 3.B.24: Investment Indication Agglomeration
Infrastructure Investment Indication by Government, SOE and Mix (IDR Tn)
JSS Total
500
400
300
200
100
0
109
76
9
4
70
50
0.1
5
150 473
Figure 3.B.25: Indication of
Infrastructure Investment by
Government
Road Infrastructure
PortInfrastructure
AirportInfrastructure
OtherInfrastructure
RailwayInfrastructure
Power & EnergyInfrastructure
Water Utility ICT
Masterplan P3EISumatra Economic Corridor
72

In the long term, Sumatra Economic Corridor is directed at four main economic activities. The main economic activities are: Palm Oil, Rubber, Coal and Steel. To support the development, it is essential to increase connectivity such as roads and railway construction across the eastern part of Sumatra, from north Banten to Aceh. Strengthening connectivity in the corridor is also taking into account intra corridor connectivity (connectivity within the corridor), inter corridor connectivity (connectivity from and to corridors), and international connectivity.
The development of Sumatra Economic Corridor is based on spatial structure planning, which is shaped by movement patterns of plantation (rubber and palm oil) and coal mining to processing or industrial zones and also to ports. Therefore, for each province, giving priority for maintaining and constructing new infrastructures such as road, bridge, railway, seaport and airport is aimed to improve connectivity to deliver increased goods and services.
Because Sumatra serves as a gateway to Indonesia on the west side, the main port for international shipping functioning as the international hub port should be established. Kuala Tanjung port is qualified as an alternative for international hub.
Doc. Wijaya Karya
Masterplan P3EISumatra Economic Corridor
73

Java Economic Corridor
Development Theme: Main Economic Activity:Consists of 4 Economic Centers:
• Jakarta• Bandung• Semarang
Driver for National Industry and Services Provision
• Yogyakarta• Surabaya
• Food & Beverage
• Textile• Transportation
Equipment
• Shipping• ICT• Defense Equipment• Greater Jakarta Area
Masterplan P3EIJava Economic Corridor
74
Food And Beverage Industry Node
Capital City/Economics Center
Textile Industry Node
Domestic Sailing Network
Railroad
Economic Center Connecting Lane
Existing RoadMain Exit Corridor LaneManufacturing Machinery and Transportation Equipment Node
Industrial Cluster
Doc. Astra Otoparts
Sea Port
To Kalimantan & Sulawesi
To Banjarmasin
To Balikpapan & Samarinda
To Sulawesi
To Eastern Indonesia
To Bali & Nusa Tenggara
To PontianakTo Batam
To the west of Sumatra
International Primary Port of Tanjung Priok
International Primary Port of Tanjung Perak

The main focus of the Java Economic Corridor development will be on food and beverage, textile, and transportation equipment. In addition, there is also desire to develop other economic activities such as shipping, ICT, and defense equipments.
Overview of Java Corridor Driver for National Industry and Services Provision are the main themes of the Java Economic Development Corridor. To support this, a special strategy will be implemented to further develop Java Corridor industries that support the conservation of water and the environment.
In general, Java Corridor has better economic and social conditions in relevance to other corridors. Therefore, the Java Economic Corridor has potential to progress in its value chain from manufacturing based economy to service-based economy. This corridor has the potential to serve as the benchmark for economic changes, evolving from primary-industry focus towards being more focused on tertiary-industry. Such value chain evolution has been successfully developed in Singapore, Shenzhen and Dubai.
There are several issues identified in Java Economic Corridor requiring attention:• High GDP and prosperity gap between provinces within the corridor;• Growth disparity throughout the value chain; the progress of the manufacturing sector is not followed by
the progress of other sectors;• Lack of domestic and foreign investment;• Lack of sufficient infrastructure.
Figure 3.C.1: The Distribution of GDP per Capita at Current Prices
and Real Growth Rates for the Regency/City in Java Economic
Corridor Year 2008 Source: Province and Regency in Figure, NSA, Team Analysis
High Income region
Low Income region
Growth rate
IDR Mn
5 year GRDP real CAGR (2003-2008)
Provincy City:Jakarta (West)
DKI Jakarta West Java Central Java East Java
Bandung Semarang Surabaya(East)
Spread of wealth
Provinces
GDP per capita at current price and real growth rate in 2008 for Regencies/Cities in the Java Economic Corridor
National GDPper capitaIDR 21.7 Mn
Masterplan P3EIJava Economic Corridor
75

The food and beverage industry is a significant contributor to the GDP of Indonesia. In 2008, the industrial production value of food and beverage reached USD 20 billion, and has grown at an average of 16 percent every year thereafter. This industry absorbs the largest labor force among other manufacturing industries. In 2010, this industry absorbed a labor force of 3.6 million people, an increase of 3.8 percent from 2009.
From January to August 2010, the food and beverage industry increased its export value by 16 percent for the food industry and by 13 percent for the beverage industry relative to the same period in the previous year.
Production for this industry contributes approximately 22.3 percent of total manufacturing production in Java Corridor making it the second largest manufacturing industry after the machinery. Total realized investment for this industry in Indonesia at the end of 2010 was IDR 25 Trillion, in which IDR 9 Trillion of the investment came from foreign investment (FDI) and the remaining IDR 16 Trillion from domestic investment (DDI). This industry ranks the highest for the amount of domestic investments realized in 2010. In 2011, the investment in food and beverage is expected to reach IDR 38.87 Trillion.
Milk is a product of the food and beverage industry that has potential to be developed further as the consumption of dairy products per capita in Indonesia is relatively lower when compared to China, Malaysia, and India. This can be considered as an opportunity and therefore, sales of dairy products in Indonesia are projected to grow by 17 percent annually.
Although this industry has been growing in recent years, there are still challenges in terms of infrastructure, human resources, and regulations for this industry. These challenges prevent this industry to grow to its full potential. One such challange that inhibits the growth of this industry is the regulations that imposes import tariff for food ‘end-products’ made from rice flour, potato, milk, and chocolate is lower than the rates of import tariff for its raw materials. Other regulatory challenges also include the imposition of import tariff or packaging materials. The imposition of such import tariff has led to the price increase inpackaging, causing the high price of packaged products, such as sweets and biscuits. In terms of exports, another challenge being faced is the high transportation costs whereas the margin generated by thesale of food and beverage products is relatively smaller.Figure 3.C.3:
Consumption of Dairy Products in Indonesia
Consumption of Dairy Products in Indonesia
Kg per Capita
Source: Euromonitor; Expert Interviews; Team Analysis
Singapore Malaysia China India Indonesia
Cheese MilkYoghurt & sour milk drinks
Other dairy products
Source: Euromonitor; Team Analysis
Beverage 13%
Food 16%
Food and Beverage
Figure 3.C.2: Total Sales of Food and Beverage in
Indonesia
USD Bn
Total Sales of Food and Beverage in Indonesia
CAGR 2004-2008+16%
11 12
1416
20
Masterplan P3EIJava Economic Corridor
76

Strategies required to face challenges are:• Implement more effective marketing to capture domestic demand, which is growing rapidly;• Increase the use of the Indonesian National Standard (SNI) and strong branding/labeling in order to
improve regional export for high value added products. Regulation and Policy To effectively implement the above mentioned strategies, several measures need to be taken relating to regulations and policies as follows:• Reform policies and regulations in order to make foreign investment more attractive, e.g. import duty
tariff for raw materials such as for rice flour, potato, milk and chocolate should be made lower than the tariff for their end products (Ministry of Finance Regulation No. 241/PMK.011 Year 2011 concerning Decision Systems Classification of Goods and the Imposition of Tariffs of Import Duty on Imported Goods);
• Review policies to lower the cost of packaging materials in order to increase the competitiveness of the food and beverage packaging products (Ministry of Finance Regulation No. 19 Year 2009 concerning Decision on Import Duty Tariff Determination of Specific Products in order to reduce duty for raw materials e.g.polypropylene and polyethylene packaging).
Human Resources and Science & Technology In order to support the development of the main economic activities for food and beverage industry, human resource & technology supporting the industry needs to be developed as follows:• Recruit qualified human resources from within Indonesia and abroad;• Improve education and training for local experts supporting the food and beverage industry.
The textile industry is an industry with the highest level of employment in Indonesia (it employs more than 1.3 million people). Of the total labor employed, about half (600 thousand) work in the labor-intensive textile garment industry.
Figure 3.C.4: Labor Employment for
each Value Chain of Textile Main Activities
Figure 3.C.5: Percentage of Textile Company
based on Company Size
% Firms by Size
Small scale firms
Medium-large scale firms
Employees (Thousand)
Textile products
Fabrics Yarn Fiber
Sumber: API
1,500
30
748
1,399
381
240
1,000
1,000
Texstile
Masterplan P3EIJava Economic Corridor
77

An important source of foreign exchange, the textile industry is the only non-oil manufacturing export industry with a positive net export. Textile products are Indonesia’s largest export commodity to the United States.
Figure 3.C.8: Estimated Growth in Textile Industry
IDR TnEstimated GDP growth for the textile industry
Source: Team Analysis
CAGR2004-2009
Fiber
Yam
Fabric
Garment
CAGR2009-2013
Figure 3.C.6: Total Export and Import
Commodities Non Oil
Figure 3.C.7: Big Ten Exports to the U.S. Based on Value (Year
2007)
USD Bn
Top 10 Indonesian Exports to US by Value (2007)
USD Mn
2,000
1,500
1,000
500
Net ExportsExports Imports
Note: Imports expressed as negative valuesSource: WTO trade statistics, US Census Bureau; Team Analysis
Indonesia’s Non Oil & Gas ManufacturedMerchandise Export and Import
In the global marketplace, Indonesian textile exports to the U.S. and Japan are lesser than China’s textile exports to both countries. Indonesian textiles industry could benefit from the policies that exist in many countries where they restric imports from a particular country.
Textile products contribution to national GDP is significant, amounting to IDR 90 Trillion in 2007. The amount decreased due to the economic crisis in 2009, but is expected to continue its increased contribution in the future.
Texti
les
and
Clot
hing
Cott
on A
ppar
el
Oth
er T
extil
e A
ppar
el
Nat
ural
Rub
ber
Fish
& S
hellfi
sh
Furn
iture
Spor
ting
App
arel
Car
Part
s &
A
cces
sori
es
Com
pute
r A
cces
sori
es
Crud
e oi
l
Tele
visi
ons,
DVD
Pla
yers
and
othe
r vi
deo
Equi
pmen
t
Chem
ical
s
Offi
ce a
nd
Tele
com
Eq
uipm
ent
Tele
com
mun
icati
on
Equi
pmen
t
Aut
omoti
vePr
oduc
ts
Elec
tron
ics
Iron
& S
teel
Masterplan P3EIJava Economic Corridor
78

The upstream textile industry in Indonesia still imports 90 percent of raw natural cotton materials. With a suitable climate for cotton cultivation, Indonesia should increase cotton production and therefore be poised to improve the possibility of upstream integration, maximize value added and decrease dependency on imported raw material. From the downstream side, Indonesia has begun to develop the garment design industry in Jakarta. Design is anactivity with high value addition, and as such, should be supported by competitive design capabilities.
Figure 3.C.9: Total sales of Textile Products Up In
the End Consumer
2008 201220102009 20132011
7591
110133
161
1957
+21%
9
11
13
1619
1620
24
29
35
42212
175
145
12098
256
IDR Tn
Total sales of textile products to end consumers
21%
CAGR2008-2013
Others1
Articles clothing& accessories
Garments
22%
21%
240
280
320
200
160
120
80
40
0
1 Others includes clothing material and expenditure on cleaning, repair and hire of clothingsource: Euromonitor; Team Analysis
The textile industry is labor-intensive, therefore the ease of labor employment/empowerment becomes very important and Indonesia in this regard is currently ranked below China, India and Thailand.
The upstream textile industry (fibers into fabric) is a capital and technology intensive industry that needs abundant energy recources. The availability and price of electricity effects the level of competitiveness of products produced. Another hindering issue is high transport costs due to the low efficiency of Indonesian seaports. Ship turnaround time at seaports of Jakarta, Semarang and Surabaya are 67,77, and 38 hours respectively which is consideredrelatively long. Turnaround times in ports in Indonesia are much longer than in Singapore, which is 26 hours. Yet another hindering issue aside to those mentioned above is the condition of production machineries in which directly effects level of productivity. The average age of textile machines in Indonesia is more than 20 years resulting in low productivity.
To develop this sector, a strategy was developed to recapture the domestic market and increase export valueby strengthening the role of Java as the country’s textile-producing hub. There are additional opportunities to strengthen its position in the value chain from upstream (raw materials production) to downstream (design production of garment) so as to create vertical integration and to improve overall competitiveness.
Most textile production in Indonesia is concentrated in Java (94 percent), with Jakarta, Bandung, Semarang as major production hubs. Upstream industries include fiber producers in Purwakarta, Subang and Tangerang.
% of Machines
100
80
60
40
20
0
Age of textile related machines in Indonesia (2006)
Source: Ministry of Industry; Team Analysis
Spinning Weaving Knitting Finishing Garment
36
6482
8493
78
7221618
Older than 20 years
Younger than 20 years
Figure 3.C.10: Age of Textile Machinery in Indonesia (Year 2006)
Masterplan P3EIJava Economic Corridor
79

Regulation and Policy To further improve the main economic activity of textiles, especially in Java, the support of regulations and policies needed include:• Increase bilateral cooperation with countries importing textiles;• A review of Law No. 13 Year 2003 concerning Labor Act to further improve business and investment
climate, because the textile industry in general is labor intensive;• Provide incentives for textile activities with high added value such as design;• Capture domestic textile market, which is projected to grow rapidly (21 percent);• Increase monitoring of the entry of imported products (legal and illegal imports), while increasing the
quality of national products to counter the market of imported products.
Connectivity (infrastructure) The development of major textile economic activity requires the improvement for connectivity through infrastructure support services, including:• Increasing electricity supply and the feasibility of electricity prices (which can compete with electricity
prices in China and Vietnam);• Increasing time efficiency of transport (ship turnaround time) through main ports such as Jakarta,
Semarang and Surabaya;• Decreasing transport cost (Terminal Handling Charge), to that lower than costs in Singapore, Philippines,
Malaysia, and Thailand.
Human Resources and Science & Technology The development of the textile industry that is labor and capital intensive requires measures in human resources and science & technology, such as:• The provision and improvement of vocational education, specifically in the field of textile product design;• Provision and support to upgrade outdated textile machinery/equipment and increasing textile producing
technology;• Increased technological innovation for textile products in order to increase sales of textile products to the
final consumer, in the form of clothing (garment), or other textile products.
There is great potential for growth in the equipment and machinery sector. More than 80 percent GDP contribution of this sector comes from Java Corridor.
In the industrial sector for equipment and machinery, the transportation equipment segment is the largest contributor, e.g. 93 percent of equipment and machinery sector in Jakarta came from transportation
Figure 3.C.11: Percentage Contribution of Equipment and
Machinery segment in Jakarta and West Java
Percentage split within equipment & machinery segment1
(%)
Transportation Equipment
1Based on value added at market prices data for 2005 for each provincesource: NSA; Team Analysis
100
80
60
40
20
0
Others
Communication equipment
Machinery and apparatus
Transportation equipment
JakartaWest Java
44
93
33
3
22
41
Masterplan P3EIJava Economic Corridor
80

Figure 3.C.12: Value Vehicle Sales
Figure 3.C.13: Car Ownership
per 1,000 people
CAGR 2003-2009
IDR Tn
+13%
200
160
120
80
40
0
Auto and motorcycles sales value
Source: Euromonitor, Data Consult, AISI, Team Analysis
20042003 20092005 2006 2007 2008
27.8
82.3
54.5 61.2
94.2
56.5 73.488.1
105.8 Auto +12%
42.8
45.6
60.1
66.7 Motorcycle +16%
99.3
119.0
148.2
172.5
50.1
144.3
37.8
99.0
Note: Data collected for countries with PPP per capita < USD 15,000; ASEAN countries include Indonesia, Thailand, Malaysia, Philippines, and Vietnam
Source: EIU, Global Insight, Team Analysis
Car ownership per 1,000 people
Malaysia
Romania
Russia
BrazilIran
Argentina
Chile
Kazakhstan
South Africa
Indonesia 2017Indonesia 2007
ASEAN 2007
MexicoUkraine
Egypt
IndiaSri LankaChina
Thailand
PhilippinesVietnam
Indonesia 2012
Pakistan
Turkey
GDP per capita (USD PPP)
4,0002,000 14,000 16,0006,000 8,000 10,000 12,000
300
200
100
0
equipment segment. Transportation equipment industries are concentrated and form a major hub of transportation equipment production in Jakarta, Bogor, Bekasi and Karawang/Purwakarta (Greater Jakarta).
The transportation equipment industry has a strong potential to continue growing. Ownership ratio of vehicles in Indonesia is still low and is expected to rise with the increase in GDP.
The increase in car sales is expected to be followed by the transportation component of industrial production growth as projected in Figure 3.C.14
Comparison of Transportation Spare Part Industry Production Growth
Source: API, Indotextile, Team Analysis
0 5 10 15 20
IndiaIndonesia
ASEANThailand
ChinaRussiaCzech
PolandMexico
BrazilTurkey
IranItaly
GermanyUSA
16.1
11.1
10.4
10.4
10.0
7.4
4.9
4.2
3.9
3.8
3.2
2.8
2.1
1.1
1.3 Growth (%)(CAGR 2007 - 2012)
Figure 3.C.14: Comparison of Transport Components
Industrial Production Growth
Masterplan P3EIJava Economic Corridor
81

Figure 3.C.15: Vehicle Production in Indonesia for Export and Domestic Sales
CAGR 2006-2008
(Thousand Units)
800
600
400
200
0
Production of vehicles in Indonesia for export and domestic sale
Source: Euromonitor, Data Consult, AISI, Team Analysis
20042003
10.5 14.6 16.8
2005
31
296
265351.4
499.6 Production for domestic sale
37.3%
Production for exports
80.6%101.0
600.6
60.3
411.6
Exports as % of productiion
In addition to large domestic markets, Indonesia is also likely to increase exports of vehicles. Although production for export has not been big in volume, production for exports is expected to grow two times faster than domestic sales.
The main economic activities for transportation equipment will face a number of challenges and problems asit develops and grows. Consistent availability of electricity is one of the main challenges. Periodic blackouts and high costs are obstacles that many producers complain about.
Seaport infrastructure limitations could inhibit the growth of this industry. The development and operation of the car terminal in Tanjung Priok is still perceived as critical, eventhough there will be additonal terminals developed and already exist in medium term planning.
The limitations of skilled and capable human resources is also considered a critical matter that needs to be addressed in order to attract more Original Equipment Manufacturers (OEMs) to invest in Indonesia.
The problems faced by the transportation equipment industry can be described as follows:• ASEAN regulations and policies have encouraged the development of automotive industry and its
components in ASEAN countries. The implication of this conditon is a higher import of CBU vehicles from other ASEAN countries (especially from Thailand) compared to CBU vehicle exports from Indonesia to other ASEAN countries;
• Lack of incentives for the development of the motor vehicle industry and its components that are based on future technology (Fuel Efficient Car);
• The policy for motorcyle (two-wheeled vehicle) industry has not been effective;• The increase in volume of low quality and low price vehicle components imported from China,
Thailandand India;• Current regulations/policies are not attractive for the development of automotive industry;• The current regulations do not support the automotive industry to do exports.
The following strategies need to be implemented to respond to the challenges faced:• Increase overall capacity in order to anticipate the growth of domestic and export markets in 2015
through 2025 by giving priority to certain Motor Vehicle Industry Investment and its main component within the period of 2011-2014;
• Develop the ability to design and construct vehicles;• Increase role in development and harmonization of industry standards for motor vehicles within the
international arena;
Masterplan P3EIJava Economic Corridor
82

• Improve the investment incentive policies;• Improve the policy of export development;• Improve the domestic market development policies.
Regulation and Policy Regulatory and policy reforms required in order to support the strategies and efforts to address the problems include:• Strengthen the structure of the automotive industry through the addition of major components industries
such as engines, drive trains, and axles;• Revise regulations on threshold for exhaust emissions and noise, as well as building the industry for
alternative-fueled vehicles;• Actively participate in the global arena with harmonization of automotive industry standards;• Harmonization of tariffs by the FTA, for upstream and downstream industries;• Policy incentives, which include the proposed reduction in tax allowances, Import duty and Value Added
Tax (PPN);• The policy of export development through the proposed reduction in import duty and Income Tax (PPh);• Policy for domestic market development through the proposed reduction of import duty, VAT, Vehicle Re-
registration Fee (BBN), and Vehicle Registration Tax (PKB);• Provision of incentives to OEMs to make Indonesia its production base. With the AFTA, OEMs have
greater freedom to determine its production base, therefore, strengthening relationships with existing OEMs is crucial. It is necessary to create an condusive climate to attract investment in Indonesia compared to other countries in Southeast Asia.
Connectivity (infrastructure) Development of the main economic activities requires transportation and infrastructure connectivity support in the form of:• Increased capacity and adequate electricity supply to avoid periodic blackouts, which can also reduce
the high production cost;• The development and operation of motor vehicles special terminal at the port of Tanjung Priok or in
the short term, the addition of new terminals.
Human Resoures and Science & Technology The necessary steps required for the development of transportation in regards to human resources and science & technology include:• Encourage the transfer of knowledge and technology, in which currently, Indonesia’s manufacturing
capability is limited to activities with low added value (it is necessary to raise Indonesia’s manufacturing position in the value chain so that it is no longer just producing simple plastic component, but have the capacity to produce the body, electrical components and complex transmission);
• Improve ability to provide adequate resources for experts with proper skills to perform higher addedvalue tasks, especially to attract investments from Original Equipment Manufacturers (OEMs) to Indonesia, specifically in Java.
As a maritime country with extensive territorial waters, Indonesia requires sea transportation to travel within its archipelago. Ships are needed, not only as a means of transportation for passengers and goods, but also to support the defense system in Indonesian waters.
Within the last five years, the shipping industry in Indonesia has shown good progress. In March 2010, Indonesia had a fleet of 9,309 units (11.95 million Gross Tonnage), an increase by 3,268 units of ships (54.1 percent) compared to that in March 2005 (6,041 ships; 5.67 million Gross Tonnage) (IPERINDO, 2011). This increase is the impact of the implementation of base cabotage, e.g. 100 percent of domestic freight must be transported by Indonesian-flagged vessels (Presidential Instruction No. 5 Year 2005 on the National Shipping Industry Empowerment).
Shipping
Masterplan P3EIJava Economic Corridor
83

On a national scale, the major challenge facing the shipping industry is to increase the capacity of the national ship building industry to build ships. This is a result of the implementation of base cabotage, considered by some as too early and not in line with domestic industrial capability to build ships. On an international scale, the main challenge is to increase the role of Indonesia in international ship building. Indonesia is one of the largest maritime countries in the world, but the position of Indonesia in the role of ship building in the world is still far below Vietnam. Currently, Indonesia is ranked 18th while Vietnam is ranked 5th. Top position is held by China, followed by South Korea and Japan (Investor Daily, 2009; IPERINDO, 2011)1.
Strategies needed to be undertaken to raise the level of Indonesia’s maritime position:• Increase utilization of domestic production of ships;• Increase capacity and capability of the shipping industry;• Development of shipping supporting industries (shipping component); and• Improve support of the banking sector to the shipping industry.
Regulation and Policy In order to support the major economic activities of shipping development in Java, as well as Sumatra, the necessary support and related policy regulations needed are:• Increase the number of manufacturers and the ability of national shipbuilding industry in the construction
of ships up to a capacity of 50,000 DWT (Dead Weight Tonnage). Shipyards that have the facilities in the form of buildingberth/raving dock capable of building/repairing boat/vessels up to a capacity of 300,000 DWT are directed to be developed outside of Java or Sumatra;
• Give priority to the building and improvement for ships under 50,000 DWT in the country;• Review Presidential Decree No. 22 Year 1998 on Commercial Ships and Fishing Vessel Import in New and
Non-New Condition, in the context of utilization of the national shipbuilding industry and its supporting industries;
• Give priority to the manufacturing of vessels supporting exploration and exploitation of oil and gas that can be made domestically, except for the type-C vessels;
• Determine the reasonable level of interest rates and collateral for loans from commercial banks and the provision of soft loans facilitated by the Government;
• Restructure the strong financial support from a number of financial institutions in the country to finance the domestic production of ships in order to comply with the provisions of cabotage;
• Review the policy for Value Added Tax (VAT) from upstream to downstream shipping industry in order to cut cost of production;
• Review the application of policy on import duty covered by the Government (BM DPT) for the shipping industry, in which BM DPT applies only for shipping components that are not produced in Indonesia.
Connectivity (infrastructure) Efforts to develop the shipping industry in Java requires connectivity (infrastructure) support in the form of:• Pier development, break water facility, main access point and terminals access point at the seaports used
for shipping industry activities;• Provision of electricity;• Provision of clean water treatment plant and wastewater treatment facilities.
Human Resources and Science & Technology Shipping industry activities should also be supported by the development of human resources and science & technology through:• Increased capability in ship design through the development of special schools in the field of shipping
industry to improve capability to produce shaft, propellers, steering gear and deck machinery;• Education development to increase the capacity of industries supplying raw material for ship component;• Improved facilities of test laboratories to comply with the International Maritime Organization (IMO)
standards;• Routine training for work force in the shipping industry.
Source: IPERINDO, 2011
10,000
9,000
8,000
7,000
6,000
5,000
4,000
3,000
2,000
1,000
0
Ship
Uni
t
9,309
6,041
until March 31, 2005 until March 31, 2010
3,268 unit(54.1%)
Figure 3.C.16: Increasing Number of Fleet National Commerce Indonesian flag (Position in March 2005 vs. March 2010)
1Investor Daily, 2009, “Investasi Galangan Kapal Butuh US$ 5,4 Miliar”, http://www.ptppa.com/index.php?option=com_content&view=article&id=98%3Ainvestasi-galangan-kapal-butuh-us54-miliar&catid=1%3Alatest-news&lang=in, April 6th, 2011IPERINDO, 2011, “Potensi Sektor Industri dan Manufaktur Bidang Perkapalan”, disampaikan pada Rapat Percepatan dan Perluasan Pembangunan Ekonomi Indonesia 2011-2025, Borobudur Hotel, February 8th, 2011
Masterplan P3EIJava Economic Corridor
84

As mentioned in the Presidential Regulation No.28 Year 2008 on National Industrial Policy, ICT has beenrecognized as a mainstay industry of the future. In addition, the ICT is a meta-infrastructure2, which isbecoming an important prerequisite for maintaining the sustainability of economic growth. Development ofICT should continue to be accelerated in order to improve the nation’s competitiveness to create knowledge based economy.
ICT has been able to provide the range and choice of services that increasingly facilitates various levels ofsociety to gain access to voice communications, images and data. Currently, except for Maluku andPapua, all major cities in Java and other main islands have been connected by fiber-optic backbone network.Meanwhile, the ICT market is growing from year to year. In 2009, markets included hardware products valuedat USD 979.9 Million, consulting USD 211.7 Million and software USD 110.3 Million (HP Indonesia, 2009).
However, to support the acceleration and expansion of economic development, ICT infrastructuredevelopment needs to adapt to international trends and available new technologies. The Indonesiangovernment has targeted the development of the National Broadband Network (NBN) for the period 2010-2015. This is in line with the World Bank study (2009) which states that for developing countries, every 10percent increase in broadband penetration can enhance economic growth by 1.38 percent. As one of themajor national economic activity, the development of NBN is integrated into the Masterplan for Accelerationand Expansion of Indonesia Economic Development (MP3EI).
2Metainfrastructure is any infrastructure which can improve the effectiveness of other infrastructure
Information and Communication Technology (ICT)
Source: Telkom Indonesia, 2011
80%
70%
60%
40%
30%
20%
10%
0
Inst
alle
d Br
oadb
and
Perc
enta
ge
Installed Broadband Capacity Percentage
2010 2011 2012 2013 2014 2015
up to 1 Mbps 19% 15% 11% 7% 3% 2%
1-4 Mbps 60% 53% 42% 29% 19% 8%
20 Mbps 21% 31% 43% 56% 68% 75%
100 Mbps 0% 1% 4% 7% 11% 15%
Figure 3.C.17: Wireline Access Transformation target 2010-2015
The target to be achieved in the development of ICT infrastructure is to develop NBN based on thedevelopment of the Telkom Super Highway network and other network operators that currently exists. Withthis, the target of the development of ICT by 2014 is reaching broadband connection level of 8 percent of all households or 30 percent of the population already convered by broadband access.
However, the development of NBN to spur economic growth must also be synchronized with the efforts to revitalize the domestic ICT industry, considering that during this process, the ICT sector remains largely dependent on imported goods. Data from Ministry of Communications and Information (Kemkominfo) shows that the development of ICT infrastructure experienced rapid growth with capital expenditure (CAPEX) of ICT devices around IDR 40 Trillion during the period of 2004-2005, and the number is increasing from year to year, especially with the growing needs fornational broadband capacity.
Masterplan P3EIJava Economic Corridor
85

2008 2009 2010 2014
Population (million) 238 240 242 252
Number of Household (million) 61 62 63 66
Number of Broadband (million) 0.41 0.85 1.25 19.7
BB Penetration (% of Household) 0.2% 0.4% 0.5% 8%
BB Penetration (% of population) 0.7% 1.4% 2% 30%
Broadband Penetration
Target
ICT INDUSTRY UPSTREAM-DOWNSTREAM (CURRENT CONDITION)
FOREIGN
FOREIGN FINISHED PRODUCT
ICT COMPONENT
NON ICT COMPONENT ASSEMBLY
ASSEMBLY SW DESIGN
HOUSE
FOREIGN
- Plastic- PCB Design
House- Antenna- Module- Cabin- Power
- Plastic- Copper- Paper - Printing
- Base Station- CPE- M.I.D.- Handset- Computers
- User Interface
- Games
INDONESIA INDONESIA INDONESIA& FOREIGN
? 60% 5% 5% 30%BOMWeight
Source: Telkom Indonesia, 2011
UPSTREAM DOWNSTREAM
Figure 3.C.20: ICT Industries Downstream-Upstream Linkages
Figure 3.C.18: National ICT Service
Target
The ICT industry structure can be described in the form of layers, in which the industry located at the upper layer depends on the layer below it (ICT industry Layer Structure) as is shown on figure 3.C19.Based on considerations for strategic position, the readiness of stakeholders in the country, values, and schedule of implementation, it is expected that the Government of Indonesia will fully support domestic industries, namely:1. Device Manufacturing Industry;manufacturing of terminal devices in all Economic Zones and chipset
industries centered in Economic Zones located in Java.2. Ecosystem Development-based Services Industry;i.e. professional and consulting services, market research.3. Content and Applications Industry;which support software applications in productive sectors such as
agro-industry, tourism, fisheries, mining, and creative industries (advertising, animation, games, cloud application).
4. Ecosystems Research and Innovation to support industrial development and synchronized with the priorities and needs of users in each economic zone.
In the case of ICT device manufacturing industry, there are linkages between upstream-downstream industries. The upstream industry represents research and development (R & D) and the downstream industry is the finished product in the form of devices. Devices are not only limited to small/hand-held devices, base stations, computers, and electronic tools, but also supporting devices for telecommunications operator (telecommunications infrastructure).
The main challenge faced by the ICT industry is preparing to face free market competition beginning 2014. In 2014, aside from Indonesia, which targets a 30 percent broadband penetration, other countries are also targeting large increase in broadband penetration i.e. Korea 93 percent, Singapore 87 percent, Malaysia 73 percent and Taiwan 57 percent.
Figure 3.C.19 Structure of ICT Industry Layer
Layer 0 • Content Industry
• ICT Application Industry (e-Government, e-Health)
• Access Sevices Industry
• Infrastructure Services Industry (network provider)
• Integration, Installation, and Maintenance System Industry of ICT Device
• ICT Device Manufacturing Industry
• ICT Device Component Industry
• ICT Device Component Material Industry
Layer 1
Layer 2
Layer 3
Layer 4
Layer 5
Layer 6
Layer 7
Masterplan P3EIJava Economic Corridor
86

Strategies needed to respond to the above challenges include:• Harmonization of policies and government programs to create a conducive atmosphere to encourage the
development of ICT in Indonesia;• Acceleration of equitable provision of infrastructure and ICT services;• Expanding the use of ICT applications in various major economic activity;• Strengthening the competitiveness of the national ICT industry.
Regulation and Policy In order to support the general strategy, regulatory and policy measures need to be aligned, namely:• Evaluate TKDN (Level of Local Content) calculation and guidance for Domestic Industries including for SMEs;• Provide tax incentives for ICT components that can not be produced in Indonesia;• Prepare mechanism of cooperation among government agencies, private, and research institutes.
Connectivity (infrastructure) The development of ICT industry needs to be supported by:• Provision of backbone and last mile connection with required broadband capacity to support business
entities;• Development of government communication and information systems that are safe (secure) and
integrated.
Human Resources and Science & Technology Development of ICT industry needs to be supported by the following activities:• Build data centers and data recovery center based on in-country potentials and human resources;• Encourage capacity building in the ICT sector in every layer of society, both in the civil society,
government agencies and decision maker(s);• Build domestic applications and digital content industries;• Expand the scope of laboratory testing capabilities so that it can test the technical specifications of other
countries;• Build and develop the Smart and Techno parks.
It is very important for Indonesia to have the ability to maintain security and to create conducive atmospherefor economic development. The task of maintaining national security will be easier if there is guaranteedtechnological capability support from the national strategic industry. The national technological capability should be able to produce defense equipment products as well as commercial products that are highly competitive.
In the defense equipment industries, there are a number of national programs where the state-ownedenterprises is the lead integrator (person in charge of the system) and SOE Strategic Industries as the level 1,level 2 and level 3 (tier 1 to tier 3) Contractors. National programs should be able to produce planes, rockets/missiles, torpedoes, warships/submarines, combat vehicles, weapons, and ammunitions.
There are compelling reasons for Indonesia to further develop this area:• Indonesia has a higher border threat as a result of its vast sea and land border. Border cases in Indonesia
are often triggered by strained relations with neighboring countries. The forms of violations that occur are complex, including illegal fishing, illegal mining and trading in the form of sand mining and logging;
• The forms of the offense require a systematic effort to save Indonesia’s oceans, as well as improve the ability to exploit marine resources of Indonesia;
• The strategic position of Indonesia on the axis of international traffic, including its placement making it more prone to various security threats by air. Air safety issues with potential future threats include threats of violence (air piracy, sabotage vital facilities, terror, and so on), the threat of air violations (dark and reconnaissance flights to parts of Indonesia), the threat of resources (use of airspace by a foreign country), and the threat of violation of the law through the medium of air (illegal migration and human smuggling).
Defense Equipment
Masterplan P3EIJava Economic Corridor
87

2009-2010
2011
2011-2015
2015-2020
2025
• Determination of TNI’s Needs• Industrial Policy• National Defence• Determination of The
Enterprises
• Formulate National Program • Determination of Enterprise
Mission• Budgeting Policy
Expansion to global market through partnership
MISSION
1. Fulfilling the basic needs of military dimension of land, sea, and air, so that Indonesia could become independent
2. Experting technology and having domestic industrial root
3. Having competent and creative human resources
4. Having wide network through strategic alliances with domestic and overseas partner
Independent Defence Industry
• Competitiveness Development• Investment• Progressive Manufacturing• Prototyping
Long Run• Core Competence
Development• Strategic Alliances
Short Run:• Determination of Mission• Improving Enterprises’ Quality• Human Resources Preparation• System Reorganization• Increasing Revenue Mix
Middle Term:• Business Repositioning &
Marketing System• Financial Access• Domestic and Foreign Partnership• Innovation and Development of
Product & Services
Figure 3.C.21: Strategic Defense Industries until 2025
Regulation and Policy In order to support the general strategy, the following matters must be addressed: • Urgent discussion of the bill related to the Strategic Industries Development and Utilization for Defense;• Acceleration of the publication of the Presidential Instruction that can be used by the Ministry of Defence
and Security, Ministry of Industry, National Development Planning Agency, and Ministry of Finance in carrying out the construction of propellant;
• Increased cooperation with foreign partners, as well as increased involvement of Indonesian human resources in the development of KFx fighter aircraft design.
Human Resources and Science & Technology Support for the development of major defense equipment requires the construction of research centers in order to increase technological capabilities and production.
On the other hand, the main economic activities for defense equipment is to address problems in orderto develop and grow. This is due to the absence of Law for Development and Utilization of Strategic Defense Industries that would support Indonesia to have a national defense industry. The domestic industry has not been able to provide for all of their own needs.
Development of activities for defense equipment to 2025 emphasizes the fulfillment of the increasing needs of defense equipments from TNI (National Army) and National Police. This can be accomplished by beginning with the following strategies: synchronization to meet the needs of defense equipment within the domestic industry, accelerate technology transfer process (transfer of technology) for infrastructure development, increase local content and production cooperation (joint production), and encourage further economic activity in the country.
Masterplan P3EIJava Economic Corridor
88

Aerospace Industry
In addition to products related to defense and security, other products that are highly commercial/competitive that could be an output from the national strategic industry is the production of air passenger transportation.
In the vast archipelago of Indonesia, geographical conditions often dictate the mode of transport. If the location is difficult to reach using land or sea transport, then air transport is a better alternative, only if there is sufficient airport infrastructure.
Air transport is a preferred mode in order to facilitate the flow of people, goods and information from an area or region to another. Air transport is considered a transportation mode related to time utility as a means of moving people, goods and information within or across regions.
The implementation of air transports to remote areas, which often is economically not profitable, needs government compensation in some form of subsidies to ensure continuity of air transport services to remote areas.
Main challenges faced by the National Aerospace Industry are as follows:• The market for the product class Feeder (19 passengers) and Commuter Regional (30 to 50 passengers)
are very large. Almost all the world airline industry compete market in Indonesian market;• Aircraft products owned in Indonesia, are products of the 1970s and 1980s, and there has been no
substitute product until now;• Low local commitment to use domestic products;• Not having Customer Financing and Leasing Facilities like other aircraft industry;• Growth in passenger movement and goods transport continue to rise, though the rate of an aircraft
accident rate in Indonesia is still high;• The average age of an aircraft in Indonesia is over 20 years.
NATIONAL SYNERGY
Aircraft with 50 seatsCapacity (National Production)
Amphibi Aircraft
• Rapid passenger’s growth
• Lack of aircraft with 50 seats capacity
Existing Condition NATIONAL STRATEGIC INDUSTRY
Figure 3.C.22:Synergy Aerospace Industry Development
Planning and Implementation Coordination
Sertification and Users
Assistance and Industry Policy
Supervisor of SOE
Technology Development
Ministry of Research and Technology
Government Agencies and R&D
Ministry of Transportation
Ministry of Industry
Ministry of SOE
Ministry of Research and Technology
The Agency for the Assesment and Application of Technology
Masterplan P3EIJava Economic Corridor
89

Figure 3.C.23: Comparison between Estimated Number of Vehicles and Highway Capacity
15,000
10,000
5,000
0
10,000
8,000
6,000
4,000
2,000
0Esti
mati
on o
f Tot
al V
ehic
lein
Jabo
deta
bek
Road
’s L
engt
h (K
m)
Estimation of Total Vehicle Number
Road’s Length
Road Capacity
2008 2009 2010 2011 2012 2013 2014 2015
Regulation and Policy To address the various challenges in the development of the national aerospace industry, regulatory and policy support is required for the following:• Develop standardized aviation components by using maximum local content and technology transfer;• Develop raw materials industrial and components to support the aerospace industry;• Develop and produce primarily passenger aircraft with a capacity of less than 100 passengers;• Provide ease of financing facilities and taxation;• Facilitate cooperation with similar industry and/or market users at home and abroad;• Provide support from the state budget financing, budget and procurement of domestic banks in the
production of national aircrafts;• Multi-years contracts, can be used by remote areas aviation operators to purchase the aircraft with a
capacity of 19 passengers;• Establish an integrated regional airline industry.
Human Resources and Science & Technology Efforts to support the national aerospace industry requires human resources and science & technology and development through:• Development of marketing research and engineering that are commercially feasible;• Human Resources Development in aerospace industry.
The Jabodetabek Area covers three provinces (namely DKI Jakarta, Banten and West Java) and 12 regencies/cities which control approximately 60 percent of national import-export activities, as well as more than 85 percent of decisions related to the nation’s financial.
Based on the latest population data, the total population residing in the Greater Jakarta area is approximately 28 million inhabitants (2010) or more than 12 percent of the national population. Greater Jakarta area is the largest urban area in Southeast Asia. It is estimated that more than 30 percent of Greater Jakarta residence has income of more than IDR 50 Million or approximately USD 5,000 per year.
There are a number of challenges faced in the development of Greater Jakarta. One of the main problems in this region is high traffic congestion caused by the current road capacity, which if far below the capacity required to accommodate vehicle movement. Growth of motor vehicles is much higher than the growth of road capacity.
Greater Jakarta Area/Jabodetabek Area
Another challenge faced by the Greater Jakarta area is the low availability of clean water, limited airports and seaports capacity, and hindered access to airports because of flooding during the rainy season. The occurrence of flooding is caused by poor drainage arrangements, and the buildup of waste in rivers such as Ciliwung River, and Kali Krukut.
Masterplan P3EIJava Economic Corridor
90

40
30
20
10
0
Soekarno-Hatta Airport Capacity (Current condition)
Source: Team Analysis, Jakarta Globe Source: Indonesia Shipping Report 2010
Passengers
Capacity
+15%
2001 2002 2003 2004 2005 2006 2007 2008 2009 2010
Terminal 3Operation
20
15
10
5
0
Passengers (Million) Mn TEUs
Capacity and Estimated of ContainerSea Port Demand in Jakarta
Passengers
Capacity
2008 2010 2012 2014 2016 2018 2020 2022 2024 2026 2028 2030
Inadequate CapacityAfter 2014
Figure 3.C.24: The Capacity of Airports that are no Longer
Sufficient
Figure 3.C.25: Capacity and Demand Estimates in Jakarta
Container Port
Strategies undertaken to address these challenges include:• Spread business activity outside of DKI Jakarta to reduce the time of travel between business centers in
the internal Greater Jakarta;• Development of a mass transportation system that is comfortable, safe and cheap, especially to
commute from the suburb area (expected to reduce air pollution of this region more than 50 percent) and because about 40 percent of the national vehicle located in Greater Jakarta, it will significantly reduce the amount of national subsidies for fuel. Subsidy reduction could be used by other regions in Indonesia that is more in need;
• Development of interconnected mass transportation network pattern that is easily accessible to all the activities surrounding the business centers and government;
• Development of an efficient logistics network of production centers in the region as well as with other production centers that have a close relationship;
• Development of sewerage and drainage system that can overcome the problems of environmental quality (accumulation of garbage, slums and flood).
Regulation and Policy In order to support this general strategy, some related regulatory and policy measures need to be done, namely:• Arrange transportation management into a single institutional handling at the central government
level;• Build the Maja area in Tangerang and provide incentives to encourage spread of some activity outside
of DKI Jakarta;• Encourage cooperation with various parties, both with domestic and international community, through
mechanisms that uphold professionalism;• Organize neighborhoods and business centers to encourage a better ‘micro-cosmic’ condition through
the provision of green areas;• Expand the industrial area to the east of Jakarta, including developing smart community.
Connectivity (infrastructure) Advancing the Greater Jakarta area can be done by:• Further developing Soekarno Hatta Airport;• Further developing the Port of Tanjung Priok and build a new possible Port at Cilamaya;
Masterplan P3EIJava Economic Corridor
91

Figure 3.C.26: The Value of Investments in Java Corridor
• Develop a network of mass transportation trains from suburbs into the center of metropolitan areas and metropolitan centers in the region;
• Build the MRT North-South, East-West to reduce air pollution and the amount of national subsidies for fuel;
• Build a monorail and a circular railway line from Manggarai to Soekarno-Hatta International Airport;• Improve road network in the Greater Jakarta area, including the construction of fly-overs and under-
passes;• Develop a logistics network of industrial centers on the outskirts of Greater Jakarta area for improved
access to the Port of Tanjung Priok Port Cilamaya, and Soekarno-Hatta Airport;• Reform the flood control system;• Reform the system of solid and liquid waste disposal from residential areas and industrial areas, including
the development of processing and final disposal of solid waste in West Java;• Develop new sources of clean water supply.
Other economic activitiesIn addition to the main economic activities for Java, there are also several industries that are considered to have potential for development, including steel, copper, oil and gas as well as the 10 National Tourism Destinations. These activities are expected to contribute to the entire development of Java Corridor.
InvestmentThe Java Economic Development Corridor identified new investment plans for development of main economic activities of Food and Beverage, Textiles, Transportation Equipment, Greater Jakarta Area, Shipping, Defense Equipment, and supporting infrastructure with a total investment of IDR 1,290 Trillion
The following is an overview of existing investment in Java:
1,500
1,000
500
0Food and Beverage
Indication of Investment in Java CorridorIDR Tn
JabodetabekArea
Transportation Equipment
Shipping Textile InfrastructuresICT Total
Mix
SOE
Private
Government
Defense Equipment
352
856
419
295
95
481
1,290
25 32 9 2 9 4
Investment initiatives that successfully identified the funds are collected from Government, private sector and state-owned enterprises as well as a combination of all.
Masterplan P3EIJava Economic Corridor
92

In addition to the investments listed, there are some other investments that are part of the 22 nationalpriorities but are not part of main economic activities in Java, such as steel, copper, tourism (focused on 10 ofthe National Tourism Destination) and oil & gas with a total investment of IDR 168.58 Trillion.
Strategic Initiatives of Java Corridor
Masterplan P3EIJava Economic Corridor
93
To Kalimantan & Sulawesi
To Banjarmasin
To Balikpapan & Samarinda
To Sulawesi
To Eastern Indonesia
To Bali & Nusa Tenggara
To PontianakTo Batam
To the west of Sumatra
International Primary Port of Tanjung Priok
International Primary Port of Tanjung Perak
Food And Beverage Industry Node
Capital City/Economics Center
Textile Industry Node
Domestic Sailing Network
Railroad
Economic Center Connecting Lane
Existing Road
Main Exit Corridor Lane
Manufacturing Machinery and Transportation Equipment Node
Industrial Cluster
Sea Port
Figure 3.C.27: Java Corridor Investment Map
Java Corridor
Government
SOE
Private
2K2-(16)-2
IDR 351.89 Tn
Jabodetabek Area
IDR 7.58 Tn
Banten: Food and Beverage, Transportation Equipment
K2-(2,4)-1 1
IDR 1.27 Tn
Bogor: Transportation Equipment
K2-(4)-3 3
IDR 28.65 Tn
Bekasi & Surroundings: Transportation Equipment, Food and Beverage
K2-(4,2)-4 4
IDR 4.37 Tn
Southern Central Java: Food and Beverage, Textiles
K2-(2,3)-6 6
IDR 2.06 Tn
Pasuruan-Malang: Food and Beverage
K2-(2)-8 8
IDR 51.64 Tn
Java: Trans Java
K2-(23)-9 9
IDR 204.54 Tn
Java: Railway and Express Train
K2-(23)-10 10
IDR 13.44 Tn
Metropolitan gerbang Kertosusilo: Food & Beverage, Shipping
K2-(3,5)-7 7
IDR 1.97 Tn
Bandung & Surroundings: Defense Equipment, Textiles
K2-(18,3)-5 5
1 2
3
4
5
10
10
109 9
96
8
7

No Code Locus Main Economic Activity Stakeholders Supporting Infrastructure
Investment Value
(IDR Trillion)
Investment Sharing Towards Main Economic Activities in All Corridors
(%)
1 K2-(2,4)-1 Banten
Food and Beverage
Private
Roads, Power & Energy, Airports, Ports, Railway, Other Infrastructure 5.12 20
Transportation Equipment
Roads, Power & Energy, Airports, Ports, Railway, Other Structure 2.46 8
2 K2-(16)-2 Jabodetabek Jabodetabek AreaGovernment, SOE
and Private Airports, Railway, Ports, Roads, Other
Infrastructure 351.89 100
3 K2-(4)-3 Bogor Transportation
EquipmentPrivate
Roads, Power & Energy, Other
Infrastructure 1.27 4
4 K2-(4,2)-4 Bekasi and its
surroundings
Transportation
Equipment Private
Roads, Ports, Railway, Power & Energy, Other Infrastructure 22.57 69
Food and Beverage Roads, Ports, Railway, Power & Energy, Other Infrastructure 6.08 24
5 K2-(18,3)-5Bandung and its
surroundings
Defense Equipment
SOE and Private
Airports, Ports, Power & Energy, Other Infrastructure 1.58 100
Textile Railway, Roads, Power & Energy, Other Infrastructure 0.38 4
6 K2-(2,3)-6 Southern Central
Java
Food and BeveragePrivate
Roads, Ports, Power & Energy, Railway, Other Infrastructure 3.46 14
Textile Roads, Ports, Power & Energy, Other Infrastructure 0.91 10
7 K2-(3,5)-7 Metropolitan
Gerbang Kertosusila
Food and Beverage
SOEand Private
Roads, Ports, Railway, Power & Energy 4.44 17
Shipping Roads, Power & Energy 9.00 56
8 K2-(2)-8 Pasuruan-Malang Food and Beverage Private Roads, Railway, Power & Energy, Other
Infrastructure 2.06 8
9 K2-(23)-9 Trans Java Cross Sector Government - 51.64 3
10 K2-(23)-10 Railway and Express
TrainCross Sector
Government, SOE
and Private- 204.54 11
Figure 3.C.28: Investment Indication Agglomeration
Masterplan P3EIJava Economic Corridor
94

Figure 3.C.29: Indications of infrastructure investment by government, SOEs and the mixture (IDR Tn)
In addition to investments associated with the main economic activities above, the Government and SOEs are committed to infrastructure development in Java Corridor. The following is an indication of the value of infrastructure investment for each type of infrastructure that will be made by the Government, SOEs, and mix:
Looking forward, even though Java will continue to serve as a pillar for the Indonesian economy, economic development for main economic activities should be limited if they consume large quantities of water and have high energy consumption. Java should restrict economic activity that is aggressively changing the environmental landscape. In the period from 2011 to 2014, Java Economic Development Corridor will focus on six main economic activities with an indication of the total investment to be issued expected to reach IDR 1,290 Trillion.
In relation to spatial structure, and by promoting the principles of sustainable development, infrastructure development in Java Economic Corridor will be focused on the northern part of Java. Along the northern coast of Java, the Trans Java highway and railroad will be constructed that will connect different locuses.
The development and improvement of seaports in Tanjung Priok, Cilamaya, Merak, and Lamongan will expedite the flow of goods both intra-and inter-corridor. International Airport of West Java which will be built in Majalengka, and is expected to accelerate the realization of the Corridor and at the same time spread the density of economic activities in western part of Java.
The development of a number of main economic activities and the development of connectivity in Java Economic Development Corridor is expected to help Java overcome the main problems faced by the corridors of GDP disparities among regions. Acceleration and expansion of the economy in Java Corridor is expected to strengthen the position of Java as the “Center of National Industry and Services Provision” and provide positive effects for the development of other corridors.
Indication of infrastructure investment by Government, SOE, and Mix (IDR Tn)
800
600
400
200
0
249
32
16
105
45
24
138 799
TotalOther Infrastructure
Water Utility
ICTAirport Infrastructure
Railway Infrastructure
Power & Energy Infrastructure
Port Infrastructure
189
Road Infrastructure
Masterplan P3EIJava Economic Corridor
95

Balikpapan Port
Samarinda
Pontianak Port
Maloy Port
to Surabaya
to Surabaya
to Semarang and Surabaya
to Semarang
to Bojonegoro
to Batam
Kalimantan Economic Corridor
Development Theme: Main Economic Activity:Consists of 4 Economic Centers:
• Pontianak• Palangkaraya• Banjarmasin• Samarinda
Center for Production and Processing of National Mining and Energy Reserves
• Oil and Gas• Coal• Palm Oil
• Steel• Bauxite• Timber
Capital City/Economic Center
Steel Activity Node
Oil and Gas Activity Node
Bauxite Activity Node
Palm Oil Activity Node
Timber Activity Node
Economic Center Connecting Lane
Existing Access Road
Railway
Domestic Sailing Network
Sea Port
Coal Activity Node
Doc. Berau CoalDoc. Berau Coal
Banjarmasin Port
to Bitung
Masterplan P3EIKalimantan Economic Corridor
96

Overview of Kalimantan Economic Corridor Taking into consideration the abundant resources available and the geographic features of Kalimantan, the development theme of Kalimantan economic corridor in MP3EI is designated for a center for Production and Processing of National Mining and Energy Reserves. This is shown in the list of “fast track” investment plan in MP3EI which is dominated with main economic activities in energy (oil, gas, and coal) and minerals (bauxite and steel). The main economic centers of Kalimantan are Pontianak, Palangkaraya, Banjarmasin, and Samarinda, which will be connected with the Corridor Conectivity Lane.
Data from NSA reveals that the regional economy of Kalimantan is mainly supported by oil & gas and mining sectors contributing approximately 50 percent of the total GRDP. However, there are several shortcomings associated with economic development in the Kalimantan Economic Corridor, such as:
• A decline in annual total production of the oil and gas sector. To ensure economic sustainability of Kalimantan, there is the need to intensify development of non oil & gas sectors to counter the downward turn in production of oil & gas sector;
• A disparity of development among regions in the corridor, both between the oil & gas and the non oil & gas producing regions, as well as between urban and rural areas;
• A gap between the need and the availability of basic infrastructure services i.e. physical infrastructure such as roads, electricity and clean water, as well as basic non-physical (social) services such as education and healthcare;
• A low realization of development investments within the Kalimantan Economic Corridor.
Masterplan P3EIKalimantan Economic Corridor
97

50% of GRDP in Kalimantan1 made up of oil & gas manufacturing and oil & gas mining
% of nominal GRDP in Kalimantan
Source: National Statistic Agency (NSA); Team Analysis
2007 2008 2009
100%
80%
60%
40%
20%
0%
5.7
5.1
6.6
4.1
8.9
7.1
20.4
13.6
20.7
7.7
6.2
9.7
15.3
18.5
5.1
19.1
3.65,1
4.63.0 2.7 3.2 Electricity, Gas & Water
Hotels & Restaurants
Finance, Real Estate & Business Service
Non-Food Agriculture
Transport & Communication
Services
Construction
Food Agriculture
Non-Oil & Gas Mining
Non-Oil & Gas Manufacturing
Oil & Gas Mining
Oil & Gas Manufacturing
0.9 0.8 1.04.7 5.2
7.4
10.8
16.3
14.6
7.1
18.3
6.04.2
5.3
Figure 3.D.1 GRDP of Kalimantan
Figure 3.D.1 shows that although there is a decrease in the contribution of the oil and gas sector, almost 50 percent of the GRDP of Kalimantan is still dominated by oil and gas. The oil and gas sector will remain a main economic driver, which will be a focus of economic development activities in the corridor. In addition to oil and gas, other main economic activities that have been identified as a prime economic mover to accelerate and expand the economic growth of Kalimantan Economic Corridor are coal and palm oil.
In order to support the MP3EI the following main economic activities such as steel, bauxite, and timber are considered as future potential drivers for economic growth in Kalimantan.
1,500
1,400
1,300
1,200
1,100
1,000
0
10,000
8,000
6,000
4,000
2,000
0
thousand barrels/day
Oil consumption
Oil production
Gap addressedthrough import
Indonesia oil consumption & production gap Indonesia oil reserves (MMSTB), 2008
200420022000 2006 2008 2010 Java
Sum
atra
Kalim
anta
n
Indo
nesi
a
Oth
ers
Indonesia has grown dependent on foreign oil in recent years
The development of top 3 reserves is key in easing this dependence
69.2%
18.4%
9.3%
100%
3.1%
Source: BP Statistical Review of World Energy; Team Analysis
Figure 3.D.2 Import of Oil and
Gas
Oil and GasSince 2002, increasing demand in domestic consumption of oil and gas has made Indonesia dependant on imports of supply. In response to this situation, Indonesia sees the need to explore new oil and gas reserves in three areas known to have large reserves, one of these areas is located in Kalimantan. Currently, oil and gas production in Kalimantan is decreasing due to limited exploration of new oil and gas fields.
Masterplan P3EIKalimantan Economic Corridor
98

0
0
500
500
1,000
1,000
1,500
1,500
Top World LNG Exporters, 2005
Top World LNG Exporters, 2007
billion cubic feet
billion cubic feet
Indonesia
Malaysia
Qatar
Algeria
Australia
Qatar
Malaysia
Indonesia
Algeria
Australia
Indonesia is no longer the world’s largest exporter of LNG
Without discovery of new reserve, Kalimantan’s gas production will decline
Kalimantan share of Indonesia’s gas production ~37%
5,000
4,000
3,000
2,000
1,000
0
-7%
Projected East Kalimantan natural gas supply without new reserves (MMSCFD)
200920082007 2010 2011 2012 20142013 2015
Source: US Energy Information Administration; Downstream Oil and Gas Regulatory Agency; Team Analysis
Figure 3.D.3 Exports of Oil and
Natural Gas Figure
Figure 3.D.4 Projected Oil and
Gas Reserves
Based on the 2005 U.S. Energy Information Administration, Indonesia was listed as the world’s top Liquefied Natural Gas (LNG) exporter. However since 2007, Indonesia has fallen to the world’s third largest exporter behind Qatar and Malaysia. Kalimantan contributes approximately 37 percent of Indonesia’s overall production. However, LNG production from the province of East Kalimantan – the largest LNG producing province in Indonesia – is declining. Without exploration of new LNG reserves, the overall production of the country’s LNG will also experience significant down turn.
The acceleration strategy for oil and gas development is to increase national oil and gas production to 1 million bpd by 2025 (source: Ministry of Energy and Mineral Resources, 2010). Currently the average level of reserves lifting in December 2010 to February 2011 is only approximately 893,000 bpd. One of the reasons of this deficit in domestic production is the decline in natural lifting of oil and gas (a decline of approximately 12 percent/year).
In the near future, oil and gas exploration will be directed to areas with more difficult conditions such as deep sea exploration, which would require higher investment. In addition to conventional methods for oil and gas exploration, increasing the production capacity of Coal-Bed Methane (CBM) is one potential way to leverage the increase of national gas production. For example, CBM production capacity in Bontang, East Kalimantan, is not yet optimized because it requires a substantial amount of investment to develop the use of CBM technology. CBM exploration is to optimize Bontang LNG production of up to 3.7 mmcfd. Currently, production is at 2.55 mmcfd and 2.38 mmcfd for 2009 and 2010 respectively.
The main economic activity of oil and gas are located in Balikpapan, Delta Mahakam Block, Rapak, and Ganal. Oil and gas industry investment plan for the period of 2011-2015 will comprise of major projects such as additional production capacity of fossil fuel in Balikpapan and its surrounding areas, as well as deep-sea exploration in Rapak and Ganal. The development of main economic activities for oil and gas fields in Kalimantan Economic Corridor will involve the private sector, state owned enterprises, and the government.
Regulation and Policy Regulations and policies that need to be addressed to reduce inefficiencies and increase the attractiveness of investment for the development of main economic activity of oil and gas are:• Designing more production sharing contracts (PSC) that is more attractive for oil and gas companies
where the attractiveness is determined by the amount of investments that need to be paid in advance to acquire a production sharing contract and the level of government involvement (the less the cost and the involvement, the more attractive the PSC is);
• Simplify regulations (including licensing) in the oil and gas sector;• Gradually reducing oil and gas subsidies.
Connectivity (infrastructure) Other effort needed to support the development of the main economic activity of oil and gas is improving the quality of infrastructure to support oil and gas distribution and logistics.
Human Resources and Science & Technology The comprehensive development of exploration and exploitation efforts (the ability of upstream oil and gas exploitation and downstream processing of oil and gas) through appropriate application of technology can be accomplished through:• Providing technical support through improved technology and quality human resources to reduce
exploration costs, especially in areas with difficult terrain conditions, such as deep-sea exploration;
1The oil reserves curve commonly end in exponential declining. The production curve is similar with normal curve (bell-curve) that is known as the Hubbert curve. The decreasing ends at the point where production no longer generate profit
Masterplan P3EIKalimantan Economic Corridor
99

104,800
21,000
300
200
100
0Resources
Coal Profile in Indonesia, 2010 (Mn Tons)
Indonesia has amount of Coal resources and reserves. However, the utilization is still not optimal
Production ExportReserves
104,800 21,000 325 265
Source: Indonesia Coal Mining Association (2010)
Figure 3.D.5 Coal Profile
• Providing additional investment to develop the utilization of technology to increase the capacity of CBM gas;
• Accelerating the Enhanced Oil Recovery (EOR) technology as an approach in improving the upstream activities (exploration and production). The use of EOR technology will optimize the capacity of concessions from old oil wells (brown fields);
• Developing technologies that support transportation, refining, and marketing to increase the capacity
of downstream activities.
From 1996 to 2010, Indonesia’s coal production grew by an average of 14.8 percent per year with an average growth of coal exports at 15.1 percent per year. The level of domestic coal consumption experienced an average growth of 13.8 percent per year within the period of 1996-2010.
CoalAs oil and gas production decreases, coal mining sector is identified as one of the main economic drivers that can sustain the economic development of the Kalimantan Economic Corridor. In 2010, the amount of coal used for domestic consumption is 60 million tons or 18 percent of the total national coal production of 325 million tons, most of which is consumed for domestic electricity generation. The remaining 265 million tons was exported to several main consuming countries such as Japan, China, India, South Korea, and other ASEAN countries.
Masterplan P3EIKalimantan Economic Corridor
100

1 Includes the 2009 joint study by Ministry of Energy and New Energy and Industrial Technology Development Organisation (NEDO) of JapanSource: Directorate General Mineral; Coal and Geothermal Resources; Indonesia Coal Book 2008/2009; Literature search; team analysis
Kalimantan accounts for ~50% of overall coal resources in Indonesia
Coal resources in Indonesia, 2009 (in Bn Tons)1Coal resources in Kalimantan, 2009 (in Bn Tons)1
East Kalimantan has the largest reserves within Kalimantan
Growth in Production, Export, and Domestic Sales of Coal (1996 – 2010)
Mn Tons
350
300
250
200
150
100
50
0
1996 1997 1998 1999 2000 2001 2002 2003 2004 2005 2006 2007 2008 2009 2010
10.9
40.9 46.7 53.9 57.2 63.473.4
85.393.76
110.79102.6
121.04130.86
152.86
190.48
221.1
240
283
325
191
230
265
13.2 15.4 1922.1
27.3 29.235.74 37.1
41.3 45.54
62.549 53 60
Production
Export
Domestic
144.94
158.6
35.5
46.254.1
62.172.9 79.3
90.7
Source Indonesia Coal Mining Association (2010)
60
40
20
0
72% 23.7% 3.1% 1%
East Kalimantan
South Kalimantan
Central Kalimantan
West Kalimantan
Total
37.5
12.3 1.6 0.5 51.9
52.4
120
80
40
0
50.0% 49.6% 0.4%
51.9 0.5 104.8
KalimantanSumatra TotalOthers
Figure 3.D.6 Growth of export
production and coal sales
Figure 3.D.7 Coal Resources
Based on 2009 data, aside from Sumatra, the amount of coal deposits in Kalimantan is considered to be one of the largest in Indonesia. Almost 50 percent of national coal deposits are located in Kalimantan.
Currently coal industry activities are centralized in East Kalimantan. More than 70 percent of explored coal deposits are concentrated within this province, followed by South Kalimantan with 23.7 percent, Central Kalimantan with 3.1 percent and West Kalimantan with 1 percent.
Masterplan P3EIKalimantan Economic Corridor
101

Analysis of existing data on 2009 coal production suggests that coal production will increase 6.7 folds if infrastructure improvements are applied in Central Kalimantan alone. Improvement in infrastructure can provide added value for coal production particularly in inland production areas.
A common problem that now exists in the mining sector in Kalimantan is an overlapping of land use for mining and for forestry or plantation. Another challenge found is overcoming the weakness of bureaucracy in issuing mining permits particularly due to unclear time frame and SOPs (Standard Operating Procedures) for applying such permits. Thus, bureaucratic reforms and providing clear and transparent services for coal business licensing are an immediate necessity.
The general strategy for economic development in coal mining sector is to encourage the extraction of large coal deposits located in inland Kalimantan, accessible with adequate infrastructure and supported by proper regulations while maintaining environmental sustainability.
Increasing added value for minerals, as is stipulated in Law No. 4 Year 2009 concerning the Mineral and Coal Mining, is through investment in coal conversion activities such as coal gasification that can produce Gas Fuel and also investment in liquefied coal. Aside from capturing gains generated by profit, these types of investments can provide significant multiplier effect such as increasing employment opportunities, increasing of revenues, and also potential savings from import substitutions.
1. Based on cost per tonne-km estimates from expert interviewsSource: Expert interviews; Indonesian Coal Book 2008/2009; Team analysis
Inland mines are challenging to develop Transportation cost significantly higher for inland mines
60
40
20
0
0 100 200 300 400 500
Estimated inland transportation cost (USD/Tons)1
Truck (own road)
Truck (public roads)
RailwayBarges
Kms
Addition of Infrastructure likely to boost production
10
8
6
4
2
0
Coal Production (Mn Tons)
~6.7x
Central Kalimantan Coal Production
2009 Coal Production
Projected annual production with railway
Figure 3.D.8Coal Mining in Inland Area of Kalimantan
Coal deposits
Coal concessions
Masterplan P3EIKalimantan Economic Corridor
102

Coal
DIRECT USAGE
Power Plant
High Rank Coal
Industry
OIL FUEL
GAS FUELChemical Feedstock
LIQUIFACTION
GASIFICATION
COKING COAL
ACTIVE CARBON
CONVERSION
CWM
UPGRADING
L O W R A N K C O A L
Source: Center for Energy and Mineral Resources in the ITB and Presentation Materials Indonesia Mining Association
Figure 3.D.9 Coal Value Chain
Efforts to enhance value-added in the development of coal required incentives from the Government due to the high difficulty level in some coal mining activities. Examples of such incentives include tax incentives to encourage the use of environmentally friendly technology for developing and processing coal.
Kalimantan coal industry investment plan for 2011 - 2015 will be focused in Bontang, East Kutai, Balikpapan, South Kalimantan and West Kalimantan.
Regulation and Policy Regulation and policy reform should be addressed to ensure the development of the main economic activity of coal mining, such as:• Accelerating the completion of the Regional Spatial Plan (Provincial RTRW and Regency/City RTRW)
through the alignment of Law No. 41 Year 1999 on Forestry, and Law No. 4 Year 2009 on Mineral and Coal Mining;
• Improving regulations concerning land administration and spatial conflicts between coal mining and forestry or plantation;
• Solving environmental issues regarding the categorization of waste and emissions, as well as the integration of post-mining activities with environmental conservation programs;
• Providing guarantee of raw materials supply for local industry and domestic electricity generation through the implementation of Domestic Market Obligation;
• Reforming bureaucracy in mining permit process through simplification of licensing procedures and providing better service in licensing process to ensure continuity of business;
• Formulating attractive tax incentives for investors to avoid high economic costs (taxes, import duties, other tax collection on imports, and excise duty plus a variety of illegal fees) throughout its supply chain;
• Formulating tax incentive mechanisms for businesses investing in value-added coal mining activities (including coal upgrading and coal conversion).
Connectivity (infrastructure) Several matters have been identified to address infrastructure provision to support the main economic activities of coal mining as follows:• Developing coal railway to link coal mining locations with ports and/or utilization of river transport to
maximize coal exploitation in the inland areas and ensuring economic feasibility;
Masterplan P3EIKalimantan Economic Corridor
103

• Increasing port capacity, both river port and sea port, as a response to the projected annual increase of coal production from inland areas in Kalimantan, which include the development of the ports in Barito and Mahakam Rivers and their connection with the coal railway system;
• Providing tax incentives for coal mining businesses that participate in infrastructure development;
• Increasing electricity generating capacity for coal mining.
Human Resources and Science & Technology The following are proposed efforts to optimize added value to fully drive the main economic activities of coal mining:• The development of coal processing technologies (including gasification and liquid coal) and exploration-
production technologies within environmentally friendly practices;• Training provision to improve the quality of Human Resources and Science & Technology, both for
management and operational staff;• Providing specialist training in coal mining and utilization, including clean coal technologies, mining safety,
feasibility studies, and management training.
Masterplan P3EIKalimantan Economic Corridor
104

Figure 3.D.11Palm Oil
Plantation Area
Kalimantan has potential to follow the success of palm oil industry in Sumatra
Areas of palm oil plantation in Indonesia, 2008
Mn Ha
2004 2005 2006 2007 2008
8
6
4
2
01.10
3.98
1.15
4.10
1.55
4.81
1.66
4.81
1.82
4.90 Sumatra
CAGR
Kalimantan
5.29%
13.31%
Plantation commodities in Kalimantan are dominated by palm oil production contributing up to 80 percent of total plantation production. This amount is much higher than production of rubber and coconut. According to the 2008 NSA data, total area for palm oil plantation reached 53 percent of the total plantation area in Kalimantan.
The total area of palm oil plantation in Kalimantan (around 2 million Ha) is less than half of Sumatra (around 5 million Ha. However, until 2008 the growth rate of palm oil plantation in Kalimantan (around 13 percent per year) is more than twice that of Sumatra (approximately 5 percent per year).
Palm oil makes up >80% of plantation production in Kalimantan...
% of primary plantation production in Kalimantan by commodity, 2008
100%
80%
60%
40%
20%
0%
...while also occupying majority of plantation areas
% of plantation areas in Kalimantan by commodity, 2008
100%
80%
60%
40%
20%
0%Palm Oil
Rubber
Coconut
Other
81.6
53.2
34.6
7.64.5
13.0
3.9 1.5
Figure 3.D.10 Production of Palm Oil Plantations
Palm Oil
However, further expansion of palm oil plantations in Kalimantan is limited due to environmental consideration. As a result, intensification approaches need to be applied to increase the production yields of the existing palm oil plantations.
Source: National Statistic Agency (NSA), Team Analysis
Source: National Statistic Agency (NSA), Team Analysis
Masterplan P3EIKalimantan Economic Corridor
105

Figure 3.D.12 CPO Productivity
Opportunity to significantly increase average CPO yield in
Kalimantan
Average CPO yield in Sumatra
Average CPO yield in Kalimantan
Average CPO yield in Papua-Kep.Maluku
8
6
4
2
0
Indonesia Potential Yield
CPO Productivity (Tons/Ha)
Malaysia Average Yield
3.6
20092008
3.12.4
3.73.0
2.3
7.0
4.6
The productivity of palm oil in Kalimantan is still below other countries which are considered as a benchmark for top listed palm oil producers. CPO productivity in Kalimantan is lower than the average productivity level in Malaysia that reaches 4.6 tons/Ha. The potential to further develop and expand palm oil plantation in Kalimantan will significantly increase Indonesia’s overall production of palm oil.
There is also a potential for significant increase in the value of palm oil development, particularly from the development of upstream industries through selective land development, conversion of productive land, and the increase in CPO production.
The main economic activities of palm oil production can be seen to the following value chain:
The development of palm oil sector in Indonesia is still disadvantaged by lack of added value gains from the downstream palm oil industries. This is due to unfavorable investment climate, and tax incentive policies that are not attractive enough to investors. For example, imposition of Export Duties of CPO is not yet considered encouraging for potential development of value-added downstream industries. Also, revenue collected from Export Duties are not utilized for infrastructure development. Three hindering issues affecting low output of palm oil yields are:• Using low quality seeds. Research shows that high quality seeds potentially increase yields of up to
Plantation RefineryMilling Downstream
Oil Palm Plantations
Oils and fatsMilling of Oil Palm
Trading and logistics
Bio-fuels
Refining and fractionation
Oleo-chemicals
Fresh FruitBunches (FFB)
Cooking oilMargarine
Bio-fuelGlycerine
Fatty acidsFatty alcohol
Crude PalmOil (CPO)Palm kernelsPalm kernel oil
RBD Palm oilRBD oleinRBD stearinPFAD1
~USD0.03Bn5
(0.6%)~USD0.08Bn4
(1.4%)~USD5.25Bn3
(98.0%) Value add2 (USD Bn)
1 Palm Fatty Acid Distillate;2 Estimated based on the model of
profit margins and the estimated volume flowing at each stage of value chain activities;
3 15 million tons of CPO with a margin of approximately USD 350/Ton based on the nominal price of about USD 680/Ton;
4 about 7.5 million tons (50 percent overall) in the margin of USD 10/Ton;
5 About 3 million tons of margin around USD10/Ton.
Figure 3.D.13 Palm Oil Value
Chain Source: Team Analysis, 2010
Masterplan P3EIKalimantan Economic Corridor
106

47 percent from current levels;• Using insufficient fertilizer due to high prices;• Transportation of Fresh Fruit Bunches (FFB) to the mills takes too long. Transportation longer than 48
hours results in lower grade CPO quality
Milling In order to address the disadvantages inherent in the above value chain, adequate access from plantation areas to milling locations should be provided. Inadequate access results in high transport costs and low productivity. Provision of infrastructure to provide a better access to the mills is necessary to increase the production rate of CPO. Inadequate capacity of sea ports, as well as the unavailability of storage tanks causes long queues at ports, thus resulting in high transport cost.
Distilling Distillation is an activity that processes CPO from the mills into the final product. With excess capacity available today (50 percent utilization), refining generates a significantly low margin (USD 10/Ton) when compared to gains generated by plantation (about USD 350/Ton). Consequently, the downstream value chain development is less attractive for investors.
Palm Oil Downstream Primary downstream industries in the supply chain of palm oil includes palm oil distillation, oleo-chemical and bio fuel. Similar to the value chain of palm oil distillation, the downstream of palm oil industries has sufficient installed capacity. This results in the low profit margin of the value chain. In the long run, however, the continued development of palm oil downstream industries is a must in order to maintain the strategic positioning of Indonesia. Having full upstream and downstream capabilities would enable Indonesia to sell high quality produce at competitive price.
The main economic activities of palm oil in Kalimantan Economic Corridor are located in East Kutai, Paser and Bulungan in East Kalimantan; Banjar and Kotabaru in South Kalimantan; Barito East Kotawaringin and West Kotawaringin in Central Kalimantan; Sanggau Ketapang and Kapuas Hulu in West Kalimantan. The 2011-2015 palm oil industry investment plan includes development projects and the creation of new palm oil plantations. The development projects will include expansion of port capacity in Kumai, Central Kalimantan. Almost all investment activities of palm oil should be conducted by private investors, even though currently there are still palm oil plantations managed by state-owned enterprises.
Regulation and Policy Policy and planning regulation needed to develop the main economic activity of palm oil in Kalimantan must include:• Government policies that help landowners increase palm oil production yield. The policy should
focus on small scale landowners because they control the majority of production areas but has a productivity level much smaller than large-scale landowners (corporations);
• Implementing strategic initiatives to support palm oil landowners increase their productivity through the establishment of a Palm Oil Board that will provide financial support for small-scale landowners.
Connectivity (infrastructure) Infrastructure needed to improve connectivity for the development of palm oil industries include:• Improving capacity of palm oil ports and harbors;• Expanding capacity and improving the handling process of two ports (Kumai and Quay Bun) in
anticipation of future increase in palm oil production;
• Improving access roads within the plantations
Human Resources and Science & Technology Human resources and science & technology support for the main economic activity of palm oil includes providing education and training facilities for those involved in palm oil production.
Masterplan P3EIKalimantan Economic Corridor
107

Steel industry has a strategic role in enhancing competitiveness and economic development for Indonesia. The steel industry has a huge multiplier effect as it relates to other industries. Kalimantan has the largest iron ore reserves in Indonesia and the existence of iron ore and steel industry in Kalimantan is important for the nation 84 percent of primary iron ore reserves and 29 percent of laterite iron ore deposits are found in Kalimantan. Increased trends of steel prices continue to take place and potential contribution of steel sector to the national economy increased by two-folds. All of the above are clear justifications for the need of further development of this sector.
Main economic activities of steel in Kalimantan are located in West Kotawaringin in Central Kalimantan and Batulicin, Tanah Bumbu, and Tanah Laut in South Kalimantan. Development projects in these locations include iron ore processing and smelting and the development of downstream processing industries from iron-ore smelting into raw materials (pellets and sponge iron) for the steel industry in Indonesia. The iron and steel industry is likely to remain dominated by private investors with an estimated investment value of IDR 40 Trillion until 2015.
Since 2004, demand for steel continues to increase, and this demand has been driven by an increase in demand from other industries such as electronics, infrastructure, and automotive. However, the level of steel consumption per capita in Indonesia is currently at 37.1 kg/capita per year, which is low when compared to other ASEAN countries including Malaysia, Singapore, Thailand, and Vietnam.
The high number of iron ore exports, and the number of illegal mining activities that ignore the principles of good mining practice also need to be addressed. Since 2006, the volume of iron ore exports has been higher than imports but up until now steel trade balance is still experiencing deficit.
1 Indonesian Commercial Newsletter Vol 57, June 2008 2 World Bank Commodity Price Data (Pink Sheet) 3 Assuming reserves are depleted over a 30 year period and a USD100 per tonFigure 3.D.14
Reserves of Iron Ore Source: Indonesian Commercial Newsletter; World Bank Commodity Price Data; Team analysis
X =
100
75
50
25
0
84
Kalim
anta
n
Primary iron deposit
Iron deposit in Indonesia (%)
As the island with the largest iron ore reserves1 …
Laterite iron deposit
Sula
wes
i
Sum
atra
Papu
a
Mal
uku
Oth
ers
29 32
85
2117
40
150
100
50
0
USD/dmtu
Estimated production cost
2004 2005 2006 2007 2008 2009 2010
… together with the relatively high iron-ore price2 …
100
75
50
25
0
Coal
Projected non-oil and gas miningcontribution by kind of mineral (IDR Tn)
Iron ore have a potential to double its contribution
1.5x potential 3
Copp
er
Iron
San
d
Gol
d &
Silv
er Tin
Nic
kel O
re
94.3
49.1
67.9
21.315.8
4.2
42.9
000
Steel
Masterplan P3EIKalimantan Economic Corridor
108

Source: Data BBPT, processed from the Road Map for National Steel Industry - Ministry of Industry 2007
Steel Consumption, 2008
Kg/c
apit
a/ye
ar
10.5 37.1 37.1
91
206.3
327.5
737
MYANMAR
PHILIPINES
VIETNAM
THAILAND
MALAYSIA
SINGAPORE
INDONESIA
Figure 3.D.16 Consumption of
Steel
Mining DownstreamSmelting
Steel Industry Value Chain
Iron Ore
Finished Product
Applications
• Hot Forming• Cold Forming
• Ore Dressing• Agglomeration• Iron Making• Steel Making Casting
Figure 3.D.15 Steel Industry
Value Chain
One of the development strategies for the national steel industry is to encourage the creation of synergies and linkages in the industry chain, both upstream and downstream.
The upstream industry in steel value chain is iron ore mining, whereas the downstream industry is finished flat steel products and finished long products industries. The synergy between the two can be maximized by facilitating partnerships to meet the needs of downstream industrial raw materials while encouraging the increased use of domestic production of steel for infrastructure and defense industries development.
There are still some elements of the steel industry value chain that has not yet been developed In Indonesia. From 2011-2014, investment in the iron and steel industry will focus on developing processing industries or downstream value-chain of iron and steel industry. These efforts have the potential to provide positive implications for optimizing the potential for increasing value added activities for upstream industries in order to strengthen the national steel revitalization program.
Regulation and Policy The main economic activities of steel in Kalimantan requires regulatory and policy reforms as follows: • Development of a steel industry blue print, which shows the synergy and relevance of the industry chain
for both upstream and downstream steel industries creating a self-sufficient steel industry that is able to meet domestic needs;
• Control of illegal mining activities for iron ore trade balance deficit (although since 2006 the volume of iron ore exports is greater than imports);
• The implementation of high export duties for iron ore to restrict raw material export to ensure that national demand can be met.
Masterplan P3EIKalimantan Economic Corridor
109

Connectivity (infrastructure) Infrastructure needed to increase connectivity for the main economic activities of steel are as follows: • Provision of infrastructure such as electricity, road network, railways and ports in the proximity of
steel industries;• Improving infrastructure networks (roads, railways, etc) both between steel industries locations and
to ports and harbor facilities.
Human Resources and Science & Technology Human resources development and science & technology support needed for the main economic activity of steel are as follows:
• Encourage the use of most advanced technology to enhance the level of productivity, and create higher quality products which is needed by the private sector;
• Encourage the use of non-destructive exploration technology to accurately and efficiently identify the availability of iron ore;
• With assistance from the Agency for the Assessment and Application of Technology (BPPT), develop an appropriate technology which can process low grade iron ore and laterites ore, and produce bulk
materials which meet the criteria or material specifications required by the steel industry.
Currently, Indonesia is ranked 7th in the world in bauxite reserves, and ranked 4th as bauxite producer. Indonesia’s bauxite reserve is estimated to reach 24 million tons.
Figure 3.D.17 Profile Indonesia Bauxite
Bauxite Profile in Indonesia, 2008 (thousand tons)
Bauxite Utilization is still not optimal in Indonesia
Source: Ministry of Energy and Mineral Resources; Team Analysis
208,000
24,000
4,000
0Resources Reserves Production
2,000
207,93224,000
5,504
Bauxite
The largest bauxite reserve in Kalimantan is located at West Kalimantan. Bauxite mining currently exports bauxite as raw material to be further processed into aluminum. With the importance of bauxite for the processing of aluminum, the development of an industry to process bauxite into alumina should be seriously considered. This is also in line with Law No. 4 Year 2009 concerning Minerals and Coal Mining, which proposes the optimization and capturing of added value chain of bauxite-alumina-aluminum downstream production. This is in recognition of the fact that alumina value is 10 times higher than the value of bauxite. This provides clear justification for encouraging the establishment of alumina smelting industries in Kalimantan.
Masterplan P3EIKalimantan Economic Corridor
110

MININGINTERMEDIATE
INDUSTRYSMELTERDOWNSTREAM
INDUSTRY
• BAUXITE • Smelter Grade Alumina
• Chemical Grade Alumina
• Aluminium Scrap• Aluminium Ingot
• Aluminium Rod• Aluminium Sheet• Aluminium Flat Bar• Aluminium Tube• Aluminium Round Bar• Aluminium Square BarFigure 3.D.18 Bauxite
Industry Value Chain
In the near future, to support the capturing of added value in the aluminium industry in Indonesia, there is a need for the development of an integrated aluminum industry. In particular combining: • Alumina-processed industry (smelter grade alumina), utilizing local bauxite raw materials reserves;• Aluminium smelter (primary aluminium ingot and processed molten aluminium); • Other derivates of aluminum production (Aluminium die casting) as well as downstream aluminium
industries (Liquid-based aluminium, aluminium pigment and powder).
The efforts to support future aluminium industry will require incentives from the government in order to attract investors to Indonesia given that the processing of bauxite into alumina is very expensive and require advanced technology and the high power supply. These risks makes it difficult for investors to obtain financing for aluminium industry.
Bauxite industry in Kalimantan will be implemented within the period of 2011-2014, and will focus on the processing of bauxite into alumina, centered in East Kutai regency in East Kalimantan, and in the regions of Mempawah, Ketapang, and Sanggau in West Kalimantan. Investments in the bauxite industry is likely to be dominated by private investors with estimated investment reaching approximately IDR 57 Trillion.
Regulation and Policy Recommendations to achieve optimal productivity include the improvement of regulations and policies as follows: • The need for operating standards that govern the licensing mechanism to reduce and eliminate
irregularities such as illegal fee collections. • Provide legal certainty and safeguarding investor from extortion practices, especially for investors
who are already implementing good mining practices.
Connectivity (Infrastructure) Development of the main economic activity of bauxite in Kalimantan needs the support of infrastructure, including road access to ports, road access or conveyor belt system connecting the mine with the processing plants, as well as electricity generation.
Human Resources and Science & Technology In order to support the creation of independent production and processing of bauxite in Indonesia, particularly in Kalimantan, several matters are required:• Strengthen the capacity of human resources and science & technology through the establishing of
training centers for aluminium design and engineering;• Develop education and technology transfer at institutions of higher education to improve technical
expertise in this industry
Masterplan P3EIKalimantan Economic Corridor
111

Forestry contributed between 8-9 percent of National Gross Domestic Product (GDP) between 2005 to 2009, with a total production valued at IDR 36.1 trillion in 2007 and IDR 44.9 trillion in 2009 (NSA, 2010).
Kalimantan is considered as one of the world’s major ‘lungs’ due to its vast forest areas. Kalimantan has the second largest forest area after the island of Papua, with its forest area of 41 million Ha compared to 42 million Ha of forest area in Papua. According to data from the Ministry of Forestry (2009), Kalimantan has the largest production forest area with a total of 29.8 million Ha. Only 52.7 percent (or 15.7 million Ha) of the area has been utilized for timber production forest with Timber Cutting and Wood Production (IUPHHK) licensing both for commercial scale Industrial Plantation Forest (HTI), and for Natural Forest (HA). This indicates a strong potential for the development of timber industry as one of main industry in forestry.
Gambar 3.D.19 Forest Area in Kalimantan
Kalimantan has an IUPHHK-HTI1 area
10
8
6
4
2
0
4.56
4.160.68
IUPHHK-HTI land area, 2010* (Mn Ha) IUPHHK-HA land area, 2010* (Mn Ha)
Sumatra
Land Area (%) Land Area (%)48.52% 44.24% 7.24% 100%
Kalimantan Others Total
9.40
1IUPHHK-HTI means Forest Product Utilization Business License - Industrial Plantation Forest2IUPHHK-HA means Forest Product Utilization Business License - Natural Forest*Data in December 2010
Source: Road Map Plantation based-Forestry Development and National Parks, Team Analysis
Doc. Antara
... and also the largest IUPHHK-HA2 in Indonesia
25
0
15
10
5
0
47.37% 38.02% 5.77% 8.84% 100%
Kalimantan Papua – Maluku
Sumatra Others Total
11.61
9.321.41
2.17 24.50
In general, the forestry sector contains a non-timber potential resources such as fruits, rattan, bamboo, bee hive, silk, eaglewood which can absorb carbon emissions under the international scheme, Reducing Emission from Deforestation and Degradation (REDD+).
Timber
Masterplan P3EIKalimantan Economic Corridor
112

Figure 3.D.20 illustrates the huge potential area for development of timber industry by expanding untapped economic value of production forests. The contribution of the forestry sector to the national GDP 2009 has remained stagnant despite the increased in the volume of forestry output. This suggests that the utilization and management of forestry output in the national economy could be more optimized.
To encourage timber industry, there needs to be a paradigm shift in the Indonesian timber industry. Log cutting production will be restricted to Production Forest Development (both through Community Plantation Forestry and Industrial Plantation Forest development), while the utilization of natural forests will be directed to the potential use of non-timber forestry. The development of Production Forest is considered necessary not only due to the depletion of productive natural forests, but also the fact that the development of production forests can rehabilitate the damaged natural forest. Aside from this, the production forest is intended to produce log production through sustainable methods and has lower cost compared to the exploitation of Natural Forest. Thus, Timber Production and Timber Primary Industry (IPHHK) can be more competitive.
The contribution of the forestry sector to the economy can be optimized by increasing the productivity of Forest Production Development through better application of efficient cultivation techniques
Investment plans of timber industry for short and medium terms planning (MP3EI fast track investment plans) for Kalimantan Economic Corridor include commercial scale Industrial Plantation Forest Estate (HTI) and Wood Production and Primary Timber Industry (IPHHK). The large HTI investment is spread across several locations in West Kalimantan (1 million Ha with investment of approximately IDR 9.6 Trillion), followed by East Kalimantan (417 thousand Ha, investment of IDR 7.2 Trillion), Central Kalimantan (270 thousand Ha, investment of IDR 5.4 Trillion), and South Kalimantan (89 thousand Ha, investment of IDR 1.3 Trillion). For IPHHK, the investment will still be concentrated in East Kalimantan (IDR 7.8 Trillion), and in Central Kalimantan, which has listed an investment value of IDR 893 Billion
Distribution of Production Forest Area in Each Province of Kalimantan (In thousand Ha)
Source: Progress Report on Forest Utilization and Production (Quarter IV, 2009), Forestry Ministry; and MP3EI
5,000
269.45
416.75
89.40841.101,109.79
1,839.49
1,004.492,740.22
7,555.189,734.65
14,651.55
Fast Track MP3EI
Production Forest
Production Forest Zone
Forest Area
4,590.7413,770.58
15,300.00
10,000 15,000 20,0000
Central Kalimantan
East Kalimantan
South Kalimantan
West Kalimantan 5,226.14
9,178.76
Figure 3.D.20Distribution of Production Forest
Area in Each Province of Kalimantan
Masterplan P3EIKalimantan Economic Corridor
113

• Industrial Plantation Forest• Public Plantation Forest• FPUBL– IPF/IUPHHK-HA) produce round
timber
• Cutting Timber• Wood Preservation• Rattan and Bamboo Preservation• Rattan Processing• Plywood• Laminated Plywood, includes decorative goods• Other wood panels• Veneer
Production Forest Utilization Primary Industrial Wood Forest Products
Figure 3.D.21 Timber Industry Value Chain
There are also challenges facing the development of timber industry (HTI and IPHHK), among others:• Limited space for HTI producers to market logs. The quota of export for logs now has been lifted,
while the structure of domestic markets tends to be monopsony (controlled by a few major players). This condition results in the HTI producers low bargaining power to determine the fair domestic selling price. At present, there is a significant difference between domestic and international prices (domestic price is 30-40 percent lower than that of international).
• Lack of financing support from local commercial banks for development of IPHHK. The banks are reluctant to finance modernization of production machinery for timber industries as well as for
development of new IPHHK production areas.
Regulation and Policy To overcome some of the challenges mentioned above, the necessary regulatory and policy reforms are: • Development of timber industry, both for investments in HTI and IPHHK, must be made
simultaneously not sequentially;• IPHHK development should not be limited to only increasing investment in new areas, but should be
accompanied by an increase in the number of players in order to balance the bargaining power in the log market. Especially given the fact that the re-opening of logging export restriction is no longer an available option in the future;
• The banking sector should be encouraged to support the development of investment in IPHHK
through the socialization of potential financial gains and risk characteristics of investment in IPHHK
Other Economic ActivitiesIn addition to the main economic activities in the Kalimantan Economic Corridor, there are also several activities with economic potential i.e., rubber, food crops, livestock, fisheries and tourisms of 7 National Tourism Destinations
InvestmentTo develop the Kalimantan Economic Corridor, new investments of the main economic activities have been identified comprising of Oil & Gas, Coal, Palm Oil, Iron Ore and Steel, Bauxite, and Timber sectors as well as infrastructure support needed, with a total investment amount of IDR 945 Trillion.
Masterplan P3EIKalimantan Economic Corridor
114

The following is an overview of the main economic activities investment plans and Infrastructure for Kalimantan Economic Corridor:
In addition to the investments identified above, there are also several investment potentials that is part of 22 main economic activities, which includes copper, rubber, food crop, fisheries, and animal husbandries with a total estimated investment of IDR 20.5 Trillion. Petrochemicals, explosives, manganese, and consumer goods with an investment plan amounting to IDR 72 Trillion also have been considered as other investment potentials outside of the 22 main economic activities mentioned. The main economic activities of oil and gas, coal, palm oil, steel, bauxite, and timber are spread along the Kalimantan Economic Corridor with the main locus as illustrated in the following map.
Figure 3.D.22 Value of Investment in
Kalimantan Corridor
Government
Private
SOE
Mix
Indication of Investment in Kalimantan Corridor
IDR Tn
37
181
13748
34432
167 94561
67
785
Coal
Baux
ite
Stee
l
Palm
Oil
Oil
and
Gas
Tim
ber
Infr
astr
uctu
re
Tota
l
1,000
800
600
400
200
0
31
Masterplan P3EIKalimantan Economic Corridor
115

Figure 3.D.23 Map of Kalimantan Investment Corridor
Strategic Initiative of Kalimantan Economic Corridor
to Bitung
Masterplan P3EIKalimantan Economic Corridor
116
Government
SOE
Private
Kalimantan Economic Corridor
7
1
3
4
5
6
7
2
IDR 111.59 Tn
Kutai Timur, Bontang -
Bauxite, Palm Oil, Coal,
Timber
K3-(8,9,14,20)-1 1
2K3-(9,15,20)-2
IDR 159.50 Tn
Balikpapan - Palm Oil, Oil and
Gas, Timber
IDR 70.00 Tn
Rapak and Ganal Kalimantan
Timur - Oil and Gas
K3-(15)-3 3
IDR 16.06 Tn
Kotabaru, Tanah Bambu -
Steel, Palm Oil, Coal, Timber
K3-(1,9,14,20)-4 4
IDR 94.28 Tn
Pontianak, Mempawah - Bauxite, Palm Oil, Timber
K3-(8,9,20)-6 6
IDR 61.15 Tn
Coal Railway and Trans
Kalimantan Road
K3-(23)-7 7
IDR 44.08 Tn
Barito - Steel, Palm Oil,
Timber
K3-(1,9,21)-5 5
Capital City/Economic Center
Steel Activity Node
Oil and Gas Activity Node
Bauxite Activity Node
Palm Oil Activity Node
Timber Activity Node
Economic Center Connecting Lane
Existing Access Road
Railway
Domestic Sailing Network
Sea Port
Coal Activity Node

Figure 3.D.24 Investments Indication
Agglomeration
No Code LocusMain Economic
Activity Stakeholders Supporting Infrastructure
InvestmentValue(IDR
Trillion)
Investment Sharing Towards Main Economic Activities in all Corridors (%)
1K3-(8,9,14,20)-1
Bontang, Kutai Timur
Bauxite
Government,SOE, Private
Port, Road, Railway, and Power & Energy
36.00 26
Palm Oil 5.35 6
Coal 62.79 29
Timber 7.45 24
2 K3-(9,15,20)-2 Balikpapan
Palm Oil Government,SOE,
Private Port, Bridge, Road, Water Utilities
0.30 34
Oil and Gas 158.65 1
Timber 0.55 2
3 K3-(15)-3Rapak dan
Ganal KaltimOil and Gas Private - 70.00 15
4 K3-(1,9,14,20)-4Kotabaru,
Tanah Bambu
Steel
SOE, Private Overland Conveyor, Power & Energy, and Road
6.56 7
Palm Oil 2.81 3
Coal 5.42 3
Timber 1.27 4
5 K3-(1,9,20)-5 Barito
Steel Government,SOE,
Private Power & Energy, Port, and Road
35.00 35
Palm Oil 2.79 5
Timber 6.29 20
6 K3-(8, 9, 14,20)-6Pontianak,
Mempawah
Bauxite
Government, SOE, Private
Airport, Road, and Power & Energy
62.22 46
Palm Oil 17.97 20
Coal 4.50 2
Timber 9.59 30
7 K3-(23)-7
Coal Railway and
Trans Kalimantan
Road
Cross Sector Government,
Private- 61.15 3
Masterplan P3EIKalimantan Economic Corridor
117

In addition to investments associated with the main economic activities as mentioned above, the Government and SOEs also committed to infrastructure development in Kalimantan Economic Corridor. The following is an indication of the value of infrastructure investment for each type of infrastructure that will be undertaken by the Government, SOEs, and the combinaton of the two.
Figure 3.D.25 Infrastructure investment by
Government, SOEs, and Mix Sources
For the long run, the development of the main economic activity will be focused to develop downstream industries, supported by strengthening of human resources (HR) and science & technology capacities. In addition, the service sector also needs to be developed to replace non-renewable natural resource-based economic activities in the Kalimantan Economic Corridor.
Aside from the initiatives offered by the Kalimantan Economic Corridor, is the creation and development of industrial agglomeration, which is supported by the provision of supporting infrastructure such as electricity, clean water, and waste treatment. The main economic centers in Kalimantan as defined in the regional spatial plan will be connected through transportation networks of highways and Trans Kalimantan railway, which is integrated with river transport. The patterns of downstream industries comprising economic activities of mining, agriculture, and plantations will be integrated with development of downstream industrial clusters located along the rivers. This is done for the purpose of efficiency in the procurement of land transportation infrastructure. Considering the natural resources and geographical conditions of the island of Kalimantan, the Corridor has the main development theme Production and Processing of Mining and National Energy Source. All development efforts of the Kalimantan Economic Corridor are built with the full awareness of the importance to conserve Kalimantan’s forests as the lungs of the World. The synergies between mining and forestry activities can be done through good mining practices during exploration and post-mining activities.
In order to accelerate growth and economic expansion in the Kalimantan Economic Corridor, the government is committed to create conducive business environment to ensure certainty and continuity of business. Some changes and harmonization of regulations related to mining, farming, forestry, environment and spatial planning will be done in order to minimize the barriers to optimizing and the creation of in-country added value, and increase value added of export-oriented products.
In order to improve efficiency in infrastructure provisions, the private sectors would be encouraged to develop and share basic infrastructure through collaboration between mining companies and the road or railway operators as well as mining companies and conveyor belt operators.
21
10
40
35 0.3
19 128
3
150
100
50
0
Infrastructure Investment Indication by Government, SOEs, Mix (IDR Tn)
Road Port Airport Railway Water Utilities
TotalICTPower & Energy
Masterplan P3EIKalimantan Economic Corridor
118

Masterplan P3EIKalimantan Economic Corridor
119

Sulawesi Economic Corridor
Development Theme: Consists of 6 Economic Centers :
• Palu• Gorontalo• Manado
• Makassar• Kendari• Mamuju
Center of Production and Processing of National Agricultural, Plantation, Fishery, Oil & Gas, and Mining
Main Economic Activity:
• Agricultural (Rice, Corn, Soybean, and Cassava)
• Cocoa• Fishery• Nickel• Oil and Gas
Capital City/Economic Center
Food Estate Activity Node
Food Agriculture Activity Node Existing Access Road
LNG Area
Fishery Activity Node
Industrial Cluster
Economic Center Connecting LaneNickel Mining Activity Node
Domestic Sailing Network
Sea Port
Doc. Berau Coal
Sofifi
Makassar Alternative International Hub
Bitung Alternative International Hub
Makassar
Mamuju To Papua
Masterplan P3EISulawesi Economic Corridor
120

29
57
9
21
30
Overview of Sulawesi Economic Corridor The theme of Sulawesi Economic Corridor is to serve as the center for production and processing of nationalagricultural, plantation, fishery, oil & gas, and mining.
This corridor is expected to be at the forefront of the national economy serving the markets of East Asia,Australia, Oceania and America. Sulawesi Economic Corridor has a high potential to achieve economic andsocial development with its main economic activities. In order to accomplish this, several issues must beconsidered:• The low value of Sulawesi’s GRDP per capita when compared to other islands in Indonesia;• The slow growth of agriculture as the main economic activity even though agriculture is the largest
contributor to Sulawesi’s GRDP (30 percent) and absorbs about 50 percent of the total workforce;• Investments in Sulawesi are from domestic and foreign investors, but relatively low compared to other
regions;• Lack of adequate economic and social infrastructure such as roads, electricity, water, and health.
Sulawesi Economic Corridor development focuses on the main economic activities of food agriculture, cocoa,fishery and nickel mining. In addition, the main economic activities of oil and gas can also be developed withthe potential to drive economic growth in this corridor.
Food Agriculture activities in Sulawesi are rice, corn, soybean, and cassava. Food agriculture activities, especially rice and corn, are very important, particularly for domestic consumption. Indonesia is the third largest rice producer in the world, most of which is used for domestic consumption. Indonesia imported 800,000 tons of corn in 2010 to meet its domestic demand of 5 million tons.
Sulawesi is the third largest food producer in Indonesia, which accounts for 10 percent of national rice production and 15 percent of national corn production. Food Agriculture contributes 13 percent of Sulawesi’s GRDP.
Figure 3.E.1: The Countries Proportion of Rice Producing in the World and the Areas Proportion of Rice Producing in Indonesia
Production
Top 5 rice producing and consuming nations (%)Share of rice produced in Indonesia (%)
Source: USDA, National Statistic Agency (NSA), Processed
Indonesia has 9% of worldwide rice production and consumption, only after China and India
Sulawesi is the 3rd largest rice producing province
Consumption
Others
VietnamBangladesh
Indonesia
India
China
Java
Sumatra
SulawesiKalimantan
Bali – Nusa Tenggara
Indonesia Rice production
57
10
23
54
27
57
9
22
29
Food Agriculture
Masterplan P3EISulawesi Economic Corridor
121
100
80
60
40
20
0

Figure 3.E.2: Comparative Productivity of Rice between Sulawesi
Economic Corridor and Other Areas
Figure 3.E.3: Comparative Productivity of Corn between Sulawesi Economic Corridor and Other Areas
Indonesia is the largest corn producer in Southeast Asia, but even the domestic corn demand can not be fulfilled only from domestic production. The low ability to supply domestic needs closely relates to the overall level of national corn productivity. Sulawesi’s corn productivity is still below the national average of corn productivity.
Corn Productivity, 2009 (Hundred kg/Ha)
Rice yields, 2009 (Hundred kg/Ha)
Japan Average
US Average
Vietnam Average
EU Average
Indonesia Average
China Average
Vietnam AverageIndonesia Average
Wes
t Nus
a Te
ngga
ra
East
Nus
a Te
ngga
ra
East
Java
East
Java
Wes
t Jav
a
Cent
ral J
ava
Wes
t Su
law
esi
Sout
heas
tSu
law
esi
Sout
hSu
law
esi
Cent
ral
Sula
wes
i
Nor
thSu
law
esi
Nor
thSu
law
esi
Considering the limited available land to expand agricultural area, food intensification is one of the most possible ways to increase food production. Rice productivity in Sulawesi is still lower compared to other regions in Indonesia.
Source: National Statistic Agency (NSA), Team Analysis
Masterplan P3EISulawesi Economic Corridor
122
Source: Ministry of Agriculture
5.8 5.7 4.8 4.7 4.7 4.6 4.6 4.1
10.20
6.80
4.604.20
3.6 2.6
Wes
t Jav
a
Wes
t Su
mat
ra
Nor
thSu
mat
ra
Sout
hSu
law
esi
Cent
ral J
ava

Figure 3.E.4: Use of Fertilizer in Some Areas in Indonesia
Low food productivity is caused by low fertilizer use, the limited use of modern agricultural equipment, and an inadequate irrigation network. The use of balanced fertilizer in Sulawesi in the form of urea, potassium chloride (KCl), and phosphate (SP-36) is still low compared with other regions. Low use of fertilizers is closely related to its availability, the transport cost and the farmer’s knowledge of agricultural cultivation techniques.
Increased agricultural productivity will depend on the use of agricultural machinery, especially for land management. Indonesia is still far behind in tractor use compared with other countries. The use of agricultural machinery in Sulawesi is limited, and this is reflected in the low use of tractor compared with other regions in Indonesia.
1Super Phospate 2Potassium Chloride
Outside of Sulawesi
Sulawesi Province
400
300
200
100
0
Urea
kg/ha
Wes
t Lo
mbo
k
50 C
ities
East
Lom
bok
Srag
en
Sopp
eng
Rang
kas
Kara
wan
g
Solo
k
Polm
as
Sopp
eng
Polm
as
150
100
50
0
kg/ha
SP-361
Wes
tLo
mbo
k
East
Lom
bok
Srag
en
Rang
kas
Kara
wan
g
Solo
k
50 C
ities
East
Lom
bok
Polm
as
50
40
30
20
10
0
kg/ha
KCI2
Srag
en
Sopp
eng
Rang
kas
Kara
wan
g
Solo
k
50 C
ities
Figure 3.E.5: Agricultural Irrigation Systems in
Indonesia Areas
Other province in Sulawesi
OthersSouth Sulawesi
% of land
3,235 3,758
Percentage of Irrigated Agricultural Land
Total PaddyLand (thousand ha)
Source: Ministry of Agriculture, Team Analysis
IrrigationSystem
Other
Valley
Rain fed
Non-technical irrigation
Semi-technical irrigation
Technical Irrigation
Source: FAO, Team Analysis
Most of the irrigation networks are still in the form of simple and non-technical irrigations (only 37 percent of food agricultural lands have been irrigated by technical and semi-technical irrigation).
Policy and Regulation In order to face the identified challenges, the following regulatory and policy support are necessary: • Expanding planting area by optimizing the utilization of land, the creation of new paddy fields, rehabilitation
and conservation of agricultural land;• Securing the availability and sustainability of food production through the development of food reserves
and storage, empowerment and institutional capacity building of farmers (Farmer’s Group or GAPOKTAN, Cooperatives);
• Reducing the potential loss of quantity and value of post-harvest through improved quality storage and development of effective purchasing mechanisms;
Java
Masterplan P3EISulawesi Economic Corridor
123

• Improving financing access for farmers;• Strengthening institutions to support farmer’s empowerment and improve their coordination function.
Connectivity (infrastructure) Development of food agriculture depends on increased connectivity (infrastructure) in the form of: • Improve access roads to reduce dependence on commercial intermediaries;• Improve irrigation facilities, where production capacity is vulnerable to climate change if it continues to
rely on simple irrigation dependent on rain;• Revitalize and improve the capacity of existing warehouse and storage (currently BULOG buys 5 percent
of national rice production, but the storage facilities are old and in need of repair) to increase the life of food in storage, and to reduce losses caused by bad storage (number of BULOG warehouses in Sulawesi is the second highest in Indonesia);
• Improve access roads between farms and trading centers, to help farmers facilitate sales and reduce reliance on intermediaries who raise prices up to 30 percent of final price (expected to increase the welfare of farmers);
• Develop/improve farm irrigation networks (Jaringan Irigasi Teknis Usaha Tani/JITUT), village irrigation networks (Jaringan Irigasi Desa/JIDES), and micro water management (Tata Air Mikro/TAM), as well as
construct/repair pumps, wells, water ponds, etc.
Human Resources and Science & Technology In order to make food agriculture more effective and efficient, it is necessary to: • Increase productivity through the use of appropriate technologies (irrigation systems and tractors), balanced
fertilizer use with accuracy-based principles, high quality/certified seeds, and increasing farmers’ knowledge;• Management of treatment for pests (Organisme Pengganggu Tanaman/OPT) and controling pesticide residues;• Increasing levels of agriculture education for farmers.
Indonesia is the world’s second largest cocoa producer, contributing 18 percent annually to the global market.Domestically, cocoa commodity produces the third largest foreign exchange after palm oil and rubber. In 2009,foreign exchange from cocoa reached USD 1.38 Billion (derived from beans and processed cocoa). Processed cocoa beans produce cocoa butter and cocoa powder, which are commodities with higher demand from international markets such as the United States and Europe, with a demand reaching 2.5 million tons per year. Indonesia targets a capacity of producing 2.5 million tons of cocoa beans in 2025 with an estimated export value of USD 6.25 Billion.
According to ICCO (International Coffee & Cocoa Organization) data, world demand for cocoa will continue to grow at 2-4 percent per year. Growth has been at 5 percent per year (3.5 million tons/year) for the last 5 years. China and India, with their large population, are potential markets of Indonesian cocoa.
Figure 3.E.6 Regional Distribution Map of Cocoa in Indonesia
Plantation development activities and the cocoa industry aim to increase the production of competitive international cocoa (cocoa beans and processed products) and develop the cocoa industry so as toprovide increased income for farmers and cocoa entrepreneurs.
Sulawesi economic corridor has strong potential for the development of cocoa production, both for cocoaplantations and its processing industry. Total land area for cocoa production in Sulawesi reaches 838,037 Haor 58 percent of total cocoa area in Indonesia. Most of the land used for cocoa production (96 percent oftotal area) is owned by the farmers. Development of cocoa in Sulawesi faces the challanges with Source: ASKINDO
Cocoa
Masterplan P3EISulawesi Economic Corridor
124
Aceh 74,546 Ha
North Sumatra 85,251 Ha
West Sumatra 80,000 Ha Total Large Area in
Kalimantan Island 47,826 Ha
West Sulawesi156,104 Ha
South Sulawesi262,807 Ha
Central Sulawesi 221,677 Ha
Southeast Sulawesi 197,449 Ha
East Java 52,537 Ha
Lampung 38,655 Ha

production, technology, policy, and infrastructure constraints. The lack of roads, ports, electricity, and gas infrastructures in the provinces of Central Sulawesi, Southeast Sulawesi and West Sulawesi also causes loss of market opportunities estimated to be as high as 600 thousand tons of cocoa production, which is equivalent to approximately USD 360 Million.
Sulawesi accounts for 63 percent of the national cocoa production. Production of cocoa in Sulawesi is on a decline, despite increasing planting area. The main cause is the decline in productivity of cocoa farming which is currently at only 0.4 to 0.6 Million Tons/Ha, compared with its potential productivity that is 1 to 1.5 Million Tons/Ha. Decline in cocoa productivity is closely linked to the condition of crops which have aged-most have been exposed to attacks from pests and plant diseases, low cultivation techniques for cocoa management, and limited infrastructure support for the activities of the cocoa plantation and processing industry.
Development activities have added-value and other positive prospects. The ratio of raw seed production is greater than the production of cocoa powder, but the overall product of processed cocoa has a higher value than the raw beans. The development of export markets, and the increasing growth in consumption of cocoa products is an opportunity that should be captured in the short, medium and long term. However, there are also challenges that need to be addressed such as improving quality and certification of fermented cocoa beans, increasing cocoa processing industry capacity, increasing downstream industries and the level of chocolate consumption.
Figure 3.E.8: Decreasing of
Cocoa Productivity
800
600
400
200
0
Ha
6%
6%
6%
Even as plantation areas are being expanded... ...Yields have been declining
(Ton/Ha)
SoutheastSulawesi
SoutheastSulawesi
SouthSulawesi
SouthSulawesi
CentralSulawesi
CentralSulawesi
2004 20042005 20052006 20062007 20072008 2008
0.9
0.8
0.7
0.6
0.5
0.4
Production in Sulawesi Selatan has been on a declining trend
800
600
400
200
0
Thousand ton
11%
-5%
-2%
8%
0%
OtherWest SulawesiCentral SulawesiSouth SulawesiNorth SulawesiSoutheast SulawesiGorontalo
2004 2005 2006 2007 2008Southeast Sulawesi
% of share of IndonesiaCocoa production by Province (%), 2008
Source: Ministry of Agriculture, Team Analysis
Source: Ministry of Agriculture, Team Analysis
~63% of all cocoa produced is from Sulawesi
Central Sulawesi
South Sulawesi
West Sulawesi
Other TotalFigure 3.E.7:
Contribution of Cocoa Productivity
in Sulawesi
19
18
15
11
37
100
Masterplan P3EISulawesi Economic Corridor
125

Source: USAID, Interview, Team Analysis
0 020 40 60 80 100
100
2,900
2,300
5,000
2,000 4,000 6,000
USD/ton
16
84
% of total production
Total production
Exported as raw beans
Raw beans
Cocoa powder
Cocoa butter
Processed
Production is exported as raw beans Processed products have significantly higher value
Figure 3.E.9: Export Products of Indonesia Cocoa
Development of the main economic activities will be to focus on improving yield of cocoa upstream value chain, and downstream industry development. Increased production of the upstream industry is obtained through:1. Increasing production, sustainable productivity, and improving quality of cocoa;2. Improving the quality of cocoa bean through fermentation and certification (through Cocoa Bean
Fermentation National Movement);3. Accelerating the provision of infrastructure that supports the development of national cocoa industry.
Added-value activities should include:1. Increasing utility capacity of existing cocoa processing industry;2. Increasing downstream market share at home and abroad;3. Applying international standards in order to improve the quality of cocoa products in the downstream industry.
Policy and Regulation In order to support quality improvements for added-value of cocoa production, the following regulatory and policy supports are necessary:• Providing active support during the rehabilitation and rejuvenation of plants, provision of cocoa cloned seeds,
and controlling cocoa plant pests;• Increasing the implementation of financing schemes for fermentation of cocoa beans to produce higher quality
processed products (butter, powder, cake) for export;• Diversifying export markets for refined products (butter, powder, cake), which will provide added-value in the
value chain;• Performing Cocoa Bean Fermentation National Movement as a commitment and approval for a joint action for
the increasing and improvement of production, productivity, and quality;• Developing industry and home industry, which will absorb food products of processed cocoa;• Conducting comprehensive and indepth assessment and evaluation of Exit Customs Tariffs on cocoa products;• Evaluating the possibility of elimination of tariff discrimination for processed cocoa in Europe;• Conducting discussions on import duty of processed cocoa with export destination countries with the
assurance that Indonesia cocoa products meets international standard (Codex standard);• Creating an efficient chain for cocoa trade, therefore enabling farmers and the industry to obtain a fair and
adequate margin;• Providing one-stop service for investors;• Improving the supervision of the implementation of mandatory SNI for cocoa powder;• Carrying out the implementation of international standards of cocoa products to build the image and
promotion of quality-oriented Indonesian cocoa products to protect consumers;• Conducting the application of international standards for cocoa products in order to build awareness for the
high quality of Indonesia cocoa products;• Increasing business partnerships between industry and cooperatives and SMEs (Small and Medium
Enterprises), to promote higher productivity, higher quality cocoa products and effective marketing to targeted demographics;
Masterplan P3EISulawesi Economic Corridor
126

• Developing and strengthening farm groups and cooperatives;• Performing conversion and spatial area for the development of cocoa plantations and its processing
industry.
Connectivity (infrastructure) The development of cocoa requires connectivity (infrastructure) improvement through:• Increasing the capacity of ports in Makassar, Mamuju, and Manado;• Increasing the capacity of storage facilities in trading centers and ports;• Improving road access from the plantations area to the processing industry, ports and regional as well as
export trade centers;• Increasing the capacity of infrastructure (electricity, water, telecommunications) in all areas of cocoa
production and processing industries.
Human Resources and Science & Technology In order to be more effective and efficient, it is necessary to:• Improve education of farmers through the facilitating of education, training, mentoring, counselling and
dissemination of cultivation and processing techniques;• Provide training of GMP, HACCP and ISO in order to enhance the understanding and knowledge of
product quality controls;• Provide Funding Research Programs through incentive research mechanisms for successful cocoa
processing industries, and increase Research and Development (R&D) for the development of cocoa industry.
Indonesia has an important position in the fishery sector. Fishery production growth reached 7 percent per year, placing Indonesia as the largest producer of fishery products in Southeast Asia.
As illustrated in figure 3.E.10, production from fishery activities in Indonesia is based on territory distribution. Sulawesi has the largest marine fish production in Indonesia. The fishery sector is one of the main economic activities for the corridor.
Source: FAO Fisheries and Aquaculture Dept.
The Annual Growth of Fishery Production in Several Countries in Southeast Asia
Fisheries production (Mn tons)
Figure 3.E.10: World Fisheries Production
CAGR
2000 2002 2004 2006 2008
10
8
6
4
2
0
Fishery
Masterplan P3EISulawesi Economic Corridor
127

Currently, fishery contributes approximately 22 percent of the total GRDP of food agriculture sub sector (70 percent catch fisheries and 30 percent aquaculture), of which approximately 20 percent of fishery activity is catch fisheries and the rest is aquaculture. The fisheries sector will continues to grow significantly to accommodate growing global demand.
Even though the fishing reserves is quite abundant, there are problems related to the exploitation ofoverfishing in some areas of sea, which threatens the sustainability of this activity. For example, thereare problems with the exploitation of demersal fish and shrimp fisheries in South Sulawesi, and largepelagic fish in North Sulawesi.
In order to reduce excessive exploitation of fisheries, and to increase fish production, it is important todevelop aquaculture. In connection with the development of aquaculture, pond areas in this corridorare ideal for high-value shrimp culture, in which the resale value is much higher than the selling value ofseaweed that currently dominates aquaculture production. Sulawesi’s local government has expresseddesire to become a center for aquaculture in Indonesia.
Food agriculture GRDP composition of the Regency/City covered by the corridor, 2006
Figure 3.E.12: Production of Fisheries in
Indonesia Region
% share of GRDP sectorxx
100%
80%
60%
40%
20%
0%
Animal Husbandry
Fishery
Estate Crops
Fishery contributes ~ of total food agriculture GRDP1
68%
32%
Fish commodity production by method (Thousand Tons), 2006
Marine 910
1,050
0 500 1,000 1,500
1 Based on 2006 GRDP dataSource: Indonesia’s Investment Coordinating Board (BKPM); NSA; Team Analysis
Aquaculture
14/
Food Crops
Food Agriculture
6.2%
22.3%
25.3%
46.1%
Figure 3.E.13: Sea Water Fisheries in Eastern
IndonesiaSource: Indonesian Port Book, 2009
Overfishing for Big Pelagic fishes in N. Sulawesi and Demersals and Shrimp in S. Sulawesi
M – ModerateU – UncertainO – Over exploitedF – Fully exploited
Body of water Demersal Shrimp Small Pelagic Big Pelagic
Makassar Strait F O M U
Tolo Bay / Banda Sea
U U M M
Tomini Bay / Maluku Sea / Halmahera Sea
M - M F
Sulawesi Sea U - U O
Sulawesi has the largest fishery production volume in Indonesia
Figure 3.E.11: Production of Fisheries in Indonesia Region
Source: Indonesia Fisheries Year Book 2009
SumatraSulawesi Java Bali –Nusa
Tenggara
2.0
1.5
1.0
0.5
0.0
2.01.9
Fisheries Production, 2007 (Mn Tons)
1.6
1.1 1.0
Papua –Kepulauan
Maluku
Kalimantan
0.4
Taking into consideration the above, the development of fishery activities will be prioritized in aquaculture. This is in line with fisheries and marine resources development plans endorsed by the government. Figure 3.E.15 shows the target of fisheries development, where aquaculture development is expected to exceed the target of catch fisheries production.
Masterplan P3EISulawesi Economic Corridor
128

Figure 3.E.15: National Fisheries Production
Target 2011-2015
30
25
20
15
10
5
0
Mn Tons
2009 2010 2011 2012 2013 2014 2015
10.06 10.7612.26
14.86
18.49
22.39
27.32
Catch fishery production Aquaculture production Total Production
However, the development of fisheries face challenges, as follows:• Competition in the global market, including fishery products from Thailand and Vietnam, which have a
more advanced and efficient production process compared to Indonesia;• Competition in the domestic market, in which other regions produce the same kind of fishery products;• Stricter requirements for labelling, packaging, product safety, traceability, green/eco-labelling and BTP
content requirements. It will be a challenge for the fishing industry to further improve quality;• Competition from consumption of other source of animal proteins such as chicken, beef, and eggs;• Income and purchasing ability of consumers. In line with the community’s increasing income levels
and improving of welfare, a shift will occur in their food consumption patterns. The tendency will be in purchasing more “healthy” foods. It is both a challenge and business opportunity for the fishery sector to develop more innovative products, such as fast food, frozen products, canned products, dry products, and added-value of seafood (snapper fillets, tuna loin steak, etc).
Figure 3.E.14: Productivity of Aquaculture in Sulawesi
Source: Indonesia Fisheries Year Book 2009
Source: Indonesia Fisheries Year Book 2009
Shrimp Common carp Nile tilapia Milk fish Seaweed% of total aquaculture production in Sulawesi
3,695
1,050 855 795
209
4,000
3,000
2,000
1,000
0
USD/Tons, 2007
Masterplan P3EISulawesi Economic Corridor
129

Policy and Regulation Based on the potentials and challenges in fishery development as described above, it is necessary to provide regulatory and policy support through:• Increasing the added-value of products with the provision of land conversion subsidies for the manufacturing
of ponds/shrimp culture;• Increasing activities for seaweed processing;• Developing capture fishery-based Minapolitans to accelerate the development of fishery industry zones based
on catch fisheries, as well as developing aquaculture Minapolitans;• Developing a regulatory and supervisory systems that is more strict and enforceable for fishing activities;
• Performing conversion of mangrove areas into shrimp ponds according to the applicable requirements.
Connectivity (infrastructure) Development of the main economic activities of fisheries requires increased connectivity (infrastructure) in the form of:• The development of fish breeding centers/hatcheries to produce quality seeds;• The construction and development of fishing ports;• Development of Fish Processing Unit (Unit Pengolahan Ikan/UPI);• Increasing the capacity of the ports in Makassar and Manado;• Developing/improving access roads from fishing location to the port and a regional trade center;• Developing of marine storage facilities, in the auction places and trading centers;
• Increasing the capacity of infrastructure (electricity, water, telecommunications).
Human Resources and Science & Technology To reach the main economic activity development of sustainable fisheries, necessary efforts are needed as follows:• Providing education to fishermen to ensure the use of better fishing methods for fishery sustainability;• Increasing fishery productivity and processing through training and counselling, provision of capital, transfer of
appropriate technology;• Improving education and access to financial assistance for fishermen;• Enforcing regulations to improve quality;• Providing financial assistance (subsidies) for farmers, particularly new comers to shrimp aquaculture methods;
• Increasing industrial processesing standard, especially for export products so as to achieve optimal value.
Masterplan P3EISulawesi Economic Corridor
130

Indonesia is the fourth of five largest nickel producers, that contributes 60 percent of world nickel production. Indonesia’s nickel production alone reached 190 thousand tons per year. Indonesia has eight percent of world nickel reserves, and therefore, nickel mining and its processing industry is eligible for further development. Sulawesi has the most advanced nickel production in Indonesia. Nickel mining in Sulawesi contributes approximately seven percent of GRDP for Sulawesi. Sulawesi holds 50 percent of the nickel reserves in Indonesia, mostly for export purposes, followed by Maluku and Papua.
As a result of the global recession, the demand for nickel declined in the period of 2006 - 2008. However, the demand for nickel increased in 2010 to meet the needs of China and Taiwan. Estimated selling price of nickel will reach USD 8 per pound in 2012, after reaching its lowest level in 2009 at only USD 6.7 per pound.
In this corridor, other mining commodities found are gold, copper and asphalt. Activities in gold and asphalt are more about optimizing production, while the copper commodity activities will focus on smelter development. The copper smelter will be located in Maros Regency, South Sulawesi with supply of copper raw material ore from outside corridor which is expected to be provided from Papua and Nusa Tenggara.
Four important locations in Sulawesi which have abundant reserves of nickel are:1. Sorowako, East-Luwu Regency, South Sulawesi;2. Morowali Regency, Central Sulawesi;3. Pomalaa, Kolaka Regency, Southeast Sulawesi;4. Konawe Regency, Southeast Sulawesi.
Figure 3.E.16: Source of World NickelSource: International Nickel Study Group
Top 15 nickel-producing countries Mine production, by country (2007)
(Thousand Tons)
Production
Other
Phillipines
Cuba
Brazil
China
Colombia
New Caledonia
Indonesia
Australia
Canada
Russia
1,500
1,000
500
0
Nickel
Top 5 producer
Top 6-15 producer
Masterplan P3EISulawesi Economic Corridor
131

The biggest challenge in the acceleration and expansion of nickel mining activities is on creating downstream industry, especially on the nickel product refining. Indonesia does not have nickel refining facilities, even though refining activities provide high-added-value.
Currently, more than 50 percent of nickel is exported in the form of nickel ore. From 190 thousand tons of nickel ore that Indonesia produce annually, only 80 thousand tons of nickel are exported in the form of nickel matte (the processed nickel ore with nickel content above 75 percent). It is estimated that Indonesia fails to capture approximately USD 200 Million potential added-value revenue each year because of it lacks the ability to further process nickel ore.
Mining Smelting (Upstream) Refining (Downstream)
Extraction of nickel ore including crushing, drying and sorting activities
20 – 25%Margin(%) 30 – 35% 25 – 30%
• Sulawesi has largest reserves in Indonesia
- Reserves are in form of laterite one, which is more costly to extract
• Industry concentrated to a handful of nickel mining companies
• Foreign companies looking to invest to increase nickel output
• Sulawesi mining companies produce nickel matte or ferronickel for export
• Adequate transport infrastructure (i.e. road access, ports, etc.) for transport of ores and mattes
• Refining is done only in 14 countries across the world
• Indonesia currently has no companies that produce refined nickel products
Semi-processed nickel matte or ferronickel to be used for further processing
High grade nickel products with >99%concentration, meant for end use
1 Based on 2008 company annual reports, only for their nickel businesses 2. Based on 2008 world import pricesSource: Company Annual Reports, Analysis Team
Figure 3.E.17: Nickel Mining Value Chain
Figure 3.E.18: Indonesia Nickel Export
250
200
150
100
50
0
USD Bn
2006 2009
Opportunity loss of up to USD200 Mn/yr by not converting mined ore to matte1
200,000
150,000
100,000
50,000
0
Greater than 50% of exported nickel is in the form of Nickel Ore
Indonesia Nickel exports (Tons)
Ni In Fe Ni
Ni+Co in matte
Nickel ore (in equivalent matte tonnes)
2006 2009
17,025
187,227
74,000
98,173113,973
67,129
12,000193,302
1 Comparison made for 2008 price levelsSource: Team Analysis
Another obstacle in nickel mining is the slow advancement from exploration into operation and production stage as well as opening new mine. This is caused by land use overlapping, slow issuance of recommendations from local governments, which results in the slow processing of Forest Land Use Permit (Ijin Pinjam Pakai Hutan) and eventualy resulting in the slow process of Mining Permits.
Masterplan P3EISulawesi Economic Corridor
132

In addition, other challenge, particularly for foreign mining companies, is the inconsistency between central and local government’s regulations on levies and fees.
On the other hand, nickel mining also faces environmental problems including the causing of air pollution, land degradation, and disruption of ecosystems. Social challenges arise due to large number of migrant workers from outside the mining area, and issues of land disputes especially with customary land. These challenges are taken into consideration in applying strategies for the development of nickel industry that must also address environmental, safety and social issues.
Policy and Regulation To alleviate the problems and challenges hindering the development of nickel, the support of the following regulations and policies must be addressed:• Simplification of rules and bureaucracy (among agencies and ministries) to facilitate the activity
initiations, and mine operations;• Improvement of the business process to make investments in nickel mining more attractive, alleviate
pressures associated with inefficiencies in terms of the acquisition of mining and manufacturing contracts;
• Improvement of land-related regulations and clarify land use through spatial planning;• Government support in the form of incentives to investors in capital intensive industries.
Connectivity (infrastructure) The development of Nickel requires support in infrastructure development:• Power plants (energy availability) to meet the processing needs;• Accessible roads between mining areas and processing facilities;• Sea port infrastructure which will serve the delivery of equipment and raw materials from other areas, for
example from Papua – Kepulauan Maluku.
Indonesia is one of the world’s largest oil and gas producing countries. Oil and gas potential is evenly distributed throughout Indonesia. In term of petroleum, the largest potential reserves are in the Province of Riau, and as for natural gas, the largest reserves are found Natuna Regency, Kepulauan Riau. In addition to the two provinces, oil and gas reserves are spread in other regions including Java, Kalimantan, Sulawesi, the Maluku Islands and in Papua.
Sulawesi Economic Corridor has the potential for oil and natural gas development which has not been properly identified and explored. Oil and gas exploitation in Sulawesi is highly difficult and costly due to the geographical condition and the land and sea contours of Sulawesi.
Oil reserves in Sulawesi Economic Corridor is relatively low compared to other regions of Indonesia with an estimated reserve of up to 49.78 MMSTB of the 7,998.49 MMSTB Indonesia total oil reserves, or only 0.64 percent of total reserves of Indonesia.
The natural gas potential of Sulawesi Economic Corridor is also relatively low compared to other regions in Indonesia with an estimated reserves of up to 4.23 TSCF of the total 157.14 TSCF of natural gas reserves in Indonesia, or only 2.69 percent of total reserves in Indonesia.
Oil and gas reserves in Sulawesi Economic Corridor are low, but needs to be put into consideration given the fact that Indonesia’s overall oil reserves continue to decline, particularly in the western part of Indonesia.
Oil and Gas
Masterplan P3EISulawesi Economic Corridor
133

Main economic activities in gas will focus on some of the following:1. Gas exploitation in Donggi Senoro, Banggai Regency, Central Sulawesi2. Petroleum exploitation in Luwuk Regency, Central Sulawesi;3. Gas exploitation in Mamuju Regency, West Sulawesi;4. Gas exploitation in Wajo Regency, South Sulawesi;5. Oil and Gas Field in Karama, West Sulawesi.
Figure 3.E.19:Petroleum Reserve in Sulawesi and
Other Areas in Indonesia
127.21 111.89
3,790.48
909.8
556.2
1,022.35
670
49.78 48.07 94.93
383.35
4,000
3,000
2,000
1,000
0
Ace
h
Sum
atra
Sum
atra
Sum
atra
Nat
una
Kepr
i
Wes
t Jav
a
East
Java
Kalim
anta
n
Sula
wes
i
Mal
uku
Papu
a
Nor
th
Cent
ral
Sout
h
Source: Indonesia Energy Statistic, 2010
Oil Reserves (MMSTB)
Masterplan P3EISulawesi Economic Corridor
134

Policy and Regulation In order to develop oil and gas as the main economic activity, necessary regulatory and policy support should include:• Optimization through enhanced oil and gas exploration and production of local oil and natural gas;• Providing a positive investment climate, enhancement of legislation and licensing of oil and gas
activities;• Increasing the synergies between government and relevant stakeholders;• Providing incentives for the construction of refineries in the country;• Increasing convenience for investors in running their business activities;• Improving information about oil and gas availability.
Connectivity (infrastructure) The development of oil and gas requires increased connectivity (infrastructure) as below:• Improvement and development of oil and gas infrastructure to increase public access to natural gas
and fossil fuel;• Improvement and development of access to new exploration and exploitation areas, both on land
and offshore;• Development of refining oil and gas infrastructure;• Development of infrastructure for fuel storage.
Human Resources and Science & Technology To reach the effective and efficient development of oil and gas production, new low-costs technologies must be utilized for oil and gas exploitation.
Other Economic ActivitiesBesides the main economy activities for Sulawesi Economic Corridor as described above, several other activities that are considered to have development potential include: copper, steel, food-beverage, palm oil, rubber, textiles, timber and tourism that is focused on 5 national tourism destination. These additional activities are expected to also provide contributions to the overall development of Sulawesi Economic Corridor.
Figure 3.E.20: Natural Gas Reserve in Sulawesi
and Other Areas in Indonesia
5.74
1.28
8.56
17.9
3.7 6.4
18.33
4.23
15.22
24.32
51.46
60
50
40
30
20
10
0
Ace
h
Nor
th S
umat
ra
Cent
ral S
umat
ra
Sout
h Su
mat
ra
Nat
una
Wes
t Jav
a
East
Java
Kalim
anta
n
Sula
wes
i
Mal
uku
Papu
a Source: Indonesia Energy Statistic, 2010
Natural Gas Reserves (TSCF)
Masterplan P3EISulawesi Economic Corridor
135

InvestmentThe total new investment plans for main economic activities in Sulawesi Economic Corridor of FoodAgriculture, Cocoa, Fishery, Nickel Mining and Oil & Gas as well as for the supporting required infrastructure,is approximately IDR 309 Trillion. The majority of the investment plan is related to nickel mining.
Figure 3.E.21: Investment Value in Sulawesi
Economic Corridor
Investment Indication in Sulawesi CorridorIDR Tn
SOE
Mix
Government
Private
111 309
199
100
68
1
300
200
100
0
77
70
16
147
Cocoa Oil & Gas Nickel Fishery Food Agriculture
Infrastructure Total
Investment initiatives that were successfully identified are funds collected from Government, Private and SOEs, as well as a combination of all three sources.
In addition to the investments mentioned, there are other investment activities that are not the main economic activities in Sulawesi Economic Corridor but is included in the 22 main economic activities such as copper, steel, food-beverage, palm oil, rubber, textiles, timber, and tourism that is focused on 5 national tourism destination with an estimated total investment of IDR 30.5 Trillion. In addition, there is also an investment of some 22 activities outside the main economic activities developed in Masterplan of Acceleration and Expansion of Indonesia Economic Development such as gold and petrochemical amounting to IDR 15 Trillion.
Masterplan P3EISulawesi Economic Corridor
136

Sulawesi Economic Corridor Strategic Initiatives
Government
SOE
Private
Sulawesi Economic Corridor
Figure 3.E.22: Mapping Investment Based on Industrial Locus in Sulawesi Economic Corridor
IDR 1.95 Tn
Mamuju – Cocoa, Oil & Gas
K4-(15, 21)-4 4
IDR 51.79 Tn
Kendari & Surroundings -
Nickel, Fishery
K4-(6)-1 1
IDR 40.7 Tn
Morowali & Surroundings –
Nickel, Oil & Gas, Fishery
K4-(6,15)-5 5
IDR 55.3 Tn
Luwuk & Banggai – Oil & Gas,
Fishery
K4-(15)-6 6
IDR 18.9 Tn
Luwu - Nickel
K4-(6)-3 3
K4-(11, 15)-2
IDR 17.7 Tn
Makasar & Surroundings –
Food Agriculture, Oil & Gas
2
IDR 3.33 Tn
Kotamobagu & Tomohon –
Oil & Gas; Bitung – Fishery
K4-(22)-7 7
No Code LocusMain Economic
Activity Stakeholder Supporting Infrastructure
InvestmentValue
(IDR Trillion)
Investment Sharing Towards Main Economic Activities in All Corridors
(%)
1K4-(6,22)-1
Kolaka, Konawe, Mandiodo
Nickel SOE, Private Road, Power Plant, Jetty 43.79 24
KendariFishery Government, SOE,
Private- 8.00 20
2K4-(11,15)-2
Makasar, Wajo, Maros
Food Agriculture Government, Private Irrigation, Water Ponds 11.54 11
Wajo Oil & Gas Private - 6.19 1
Capital City/Economic Center
Food Estate Activity Node
Food Agriculture Activity Node Existing Access Road
LNG Area
Fishery Activity Node
Industrial Cluster
Economic Center Connecting LaneNickel Mining Activity Node
Domestic Sailing Network
Sea Port
Masterplan P3EISulawesi Economic Corridor
137
1
2
34
5
6
7

In addition to investments associated with the main economic activities, the Government and SOEs also committed to infrastructure development in Sulawesi Economic Corridor. The following is an indication of the value of infrastructure investment for each type of infrastructure that will be undertaken by the Government, SOEs, and the combinaton of the two.
3 K4-(6)-3 Luwu Nickel Private Power & Energy 18.90 10
4K4-(15,21)-4
MamujuOil & Gas SOE Power & Energy 0.65 0.1
Cocoa SOE , Private - 1.30 100
5K4-(6,15,22)-5
MorowaliNickel SOE , Private Roads, Power & Energy 37.70 21
Oil & Gas SOE , Private - 2.60 0.6
Morowali, Tojo Una-Una
Fishery Government, Private - 0.40 1
6K4-(15,22)-6
Banggai, Luwuk Oil & GasSOE , Private
- 55.10 12
Banggai Fishery - 0.20 0.5
7K4-(15,22)-7
Kotamobagu, Tomohon
Oil & Gas SOE Power & Energy 3.18 0.7
Bitung Fishery Private Fishing Port 0.15 0.4
Figure 3.E.23: Indicative Investment Agglomeration
Figure3.E.24: Infrastructure Indicative Investment by
Government, SOE and Both
In the long run, consistent efforts are needed to develop downstream industries of mining and crops plantation. Downstream industries should be accompanied by strategic marketing activities which will generate optimal value-added that will have affect in increased job opportunities and the competitiveness of products produced.
Spatial structure development is directed with the understanding of goods movement patterns of cocoa, nickel mining, and oil & gas, into the processing and/or industrial areas, which must be transported to ports. Therefore, it is important to prioritize development and maintanance of roads and bridges in all
80
60
40
20
0
6934
0.125
6
5
Road Infrastructure
PortInfrastructure
Power & EnergyInfrastructure
Water Utility ICT Total
Infrastructure Investment Indication by Government, SOE and Mix (IDR Trillion)
No Code LocusMain Economic
ActivityStakeholder Supporting Infrastructure
InvestmentValue
(IDR Trilliun)
Investment Sharing Towards Main Economic Activities in
All Corridors (%)
Masterplan P3EISulawesi Economic Corridor
138

provinces, which will provide reliable transportation along the economic corridor. Similarly, water and energy infrastructure development are undertaken to support production of food crop, cocoa, and mining in each province, and will in the end result in increased benefits and added-value of products.
Sulawesi Economic Development Corridor will develop in line with the future development and current condition of the trans-Sulawesi highway, which will connect south to north of the Sulawesi Economic Corridor. The spatial structure of the corridor is experiencing high dynamics along with the acceleration of the goods and people movement among the growth centers within the Sulawesi economic corridor, as well as between Sulawesi Economic Corridor and other economic corridors in Indonesia. Moreover, puting into consideration that the Sulawesi Economic Corridor is located along the Pacific Ocean rim and international cruise lines, it is important to be able to determine the location of main ports that will serve as an international hubs. Bitung Port in North Sulawesi and Makassar Port in South Sulawesi are deemed suitable to serve as an international hub. A placement of an international hub in the eastern part of Indonesia is expected to accelerate development in island-dominated eastern Indonesia.
Masterplan P3EISulawesi Economic Corridor
139

Bali – Nusa Tenggara Economic Corridor
Development Theme: Consists of 4Economic Centers:
• Denpasar• Lombok• Kupang• Mataram
Gateway for Tourism and National Food Support
Capital City/Economic Center
Animal Husbandry Activity Node
Tourism Activity Node
Fishery Activity Node Sea Port
Domestic Sailing Network
Economic Center Connecting Lane
Existing Access Road
Main Economic Activity:
• Tourism• Fishery• Animal Husbandry
Masterplan P3EIBali – Nusa Tenggara Economic Corridor
140
To Maluku & Papua

Overview of Bali – Nusa Tenggara Economic Corridor The theme of Bali - Nusa Tenggara Economic Corridor is the Gateway for Tourism Industry and National Food Support.
The theme is aimed to improve the people’s welfare in this corridor where 17 percent of the population is below the poverty line and has a relatively high income disparity of IDR 17.7 Million per capita (between the richest and poorest regencies/cities in this corridor). Meanwhile, this corridor has a quite strong social condition which can be seen from the high level of life expectancy at 63 years. The literacy rate in this corridor is 80 percent and the level of GRDP per capita is IDR 14.9 Million, which is higher than the national GDP per capita of IDR 13.7 Million.
This corridor faces various problems including the unequal population distribution, low investment level and limited availability of basic infrastructure. Therefore, this corridor needs acceleration and expansion of economic development, which will focus on 3 main economic activities: tourism, fisheries and animal husbandry.
The following figures show the contribution of tourism as reflected in trade, hotel, restaurants and agriculture sectors, fisheries and animal husbandry on the economies of Bali, West Nusa Tenggara (NTB) and East Nusa Tenggara (NTT).
Figure 3.F.1: GRDP of Bali, NTB, NTT by Sector (2008)
Source: Exposure Presentation “Tourism Development Concept of Bali - NTB - NTT Corridor”, Ministry of Culture and Tourism, 2011
Figure 3.F.1 shows that the main economic activities of tourism, fisheries and animal husbandry significantly contribute to the GRDP of each province by 47 percent (Bali), 36 percent (NTB) and 56 percent (NTT). With an average contribution to GRDP increasing by 11 percent per annum within the last five years, all three of these activities are potential drivers of the economy in Bali - Nusa Tenggara Economic Corridor .
BALI PROVINCE GRDP NTB PROVINCE GRDP NTT PROVINCE GRDP
Agriculture, Livestock, Forestry and Fishery 40%
Mining and Quarrying 1%
Manufacturing Industry 2%
Electricity, Gas & Water Supply 0% Construction
7%Trade, Hotel & Restaurants 16%
Transport and Communication 6%
Finance, Real Estate and Business Services 4%
Services24%
Mining and Quarrying 31%
Agriculture, Livestock, Forestry and Fishery 23%
Services 10%
Finance, Real Estate and Business Services 5%
Transport and Communication 8%
Trade, Hotel & Restaurants 13%
Construction 6%
Electricity, Gas & Water Supply 0%
Manufacturing Industry 4%
Agriculture, Livestock, Forestry and Fishery 18%
Services 15%
Finance, Real Estate and Business Services 8%
Transport and Communication 13%
Mining and Quarrying 1%
Manufacturing Industry 9%
Electricity, Gas & Water Supply 2%
Construction 5%
Trade, Hotel & Restaurants 29%
Masterplan P3EIBali – Nusa Tenggara Economic Corridor
141

Tourism development in Bali - Nusa Tenggara Economic Corridor is focused on the 9 National Tourism Destinations. The services industry has a strategic role to increase workforce absorption, promote equal employment opportunities and achieve equitable national development. It also contributes to the foreign exchange revenues and poverty alleviation.
The increasing number of foreign tourists visit in 2010 has consequently increased the value of tourism’s contribution in the amount of USD 7.6 billion compared to the USD 7.3 billion in 2008. The National Tourism Development Master Plan (Ripparnas) 2011 - 2025 targets foreign tourists visit will increase to 20 million per annum by 2025.
From a national perspective, Bali is the gateway for the main economic activity of tourism in Indonesia. Almost 40 percent of tourist visits in 2010 arrived through Bali. Ngurah Rai International Airport in Bali receives more than 2 million tourists annually. In addition, Bali hotels represent 15 percent of Indonesian total hotel capacity, and 21 percent of national hospitality income came from this corridor. Nationally, tourism absorbed approximately 14 percent of the workforce in 2009, with 6.98 million jobs created as shown in the table below.
Tourism Performance of Indonesia
WORLD (2010) INDONESIA (2010)
Number of foreign tourists visiting 935 Million 7 Million
Growth of foreign tourists visit 6.61 % 10.74 %
Income from foreign tourist USD 3,900 Billion (2008) USD 7.6 Billion
Employment 238 Million Employment 6.98 Million Employment (2009)
In the future, Bali – Nusa Tenggara Corridor will continue to develop tourism as a main economic activity as there are still many tourism potential unrealized at this time. Tourism in this corridor has a very good prospect with Bali as a tourism development center supported by the culture and natural resources from NTB and NTT. Bali has international recognition from respective international institutions with awards such as Best Tourism Island in the World (2005) by TIME magazine; Best Exotic Destinations (2008) by Luxury Travel Magazine, London, England; Best Asian Tourism Island (2009) by CEI Asia Magazine; Best Tourism Destination Island in Asia Pacific (2007, 2009, and 2010) and Best Leisure DestinAsian (2006, 2008) at The Fifth Annual DestinAsian Readers’ Choice Awards.
1 In 2000 constant moneySource: BPS
Almost 40% of foreign flight arrivals are to Bali
Bali
36%
64%
7 Million
International arrivals by flight, 2010
Others Others OthersTotal
8
6
4
2
0
Bali & NT have 15% of national hotel capacity
3%
85%
12%
519,205
Number of hotel beds, 2009
Bali Nusa Tenggara
Total
600,000
400,000
200,000
020%
1%
25
79%
GRDP from hotel sector1 (Rp Bn), 2008
Bali Nusa Tenggara
Total
30
20
10
0
They account for 21% of national hotel income
Figure 3.F.2: Tourism in Bali - Nusa Tenggara
Figure 3.F.3: Performance of Tourism
Indonesia 2010Source: UNWTO and NESPARNAS
Tourism
Masterplan P3EIBali – Nusa Tenggara Economic Corridor
142

In addition, Bali as a center of growth in Bali-Nusa Tenggara Economic Corridor, will continue to have high and stable tourism growth, which is marked with the increasing number of tourist visits, which was 1,328,929 people (2006); 1,741,925 people (2007); 2,081,786 people (2008); 2,384,819 people (2009); and 2,546,023 people (2010), with an average hotel occupancy rate of more than 60 percent. Bali also has sufficient numbers of domestic flights to various destinations in Indonesia and international flights to and from Bali, thus enabling Bali to serve as a gateway as well as distribution center for Indonesian tourism. However, there are still challenges faced by tourism in Bali, which can be seen from: (1) the average tourist spending per day in Bali, which is lower than their spending in Thailand and the Maldives (2) the decreasing average length of tourist stays in Bali as shown in the figure below.
1Only for foreign tourists, excluding flight ticket. Data adjusted for inflation and exchange rate fluctuationSource: BPS; Tourism Authority of Thailand; Maldives Monetary Authority; EIU
Figure 3.F.4: Tourism Challenges in Bali -
Nusa Tenggara
Spend/day/visitor (USD)1
Maldives
Maldives
Thailand
Thailand
Average spend/day in Bali currently below Thailand and Maldives
Length of visit (day)
Length of stay in Bali is shorter
Year Year
Figure 3.F.5: Tourism Profile in Bali - Nusa
Tenggara
DATA Unit
2009 2010
Bali – Nusa Tenggara INDONESIA Bali – Nusa
Tenggara INDONESIA
Number of Direct Foreign Visit
Person2,436,409 6,323,730 2,597,889 7,002,944
38.53% 100% 37% 100%
Average Spend per Visit USD1,353.26 995.93 1,581.84 1,085.75
135.88% 100% 146% 100%
Average Spend per Day USD105.67 129.57 151.30 135.01
82% 100% 112% 100%
Average Length of Stay Day13.19 7.69 10.66 8.04
172% 100% 133% 100%
Description: Data as of 2010 direct foreign tourists visiting Bali-Nusa Tenggara via Ngurah Rai Airport, Port of Padang Bai, Benoa, Port and Airport of Selaparang Benete, El Tari Airport, cross-border Atambua, Port of Maumere and Kupang.
Source: P2DSJ Ministry of Culture and Tourism, BPS
Masterplan P3EIBali – Nusa Tenggara Economic Corridor
143

Several general strategies to increase tourist arrivals and length of stay in Bali and Nusa Tenggara are:• Improving security in Bali - Nusa Tenggara Economic Corridor, among others by a strict security
system implementation;• Tourism marketing and promotion that is more focused with a clear target market. The marketing
strategy will need to be tailored depending on the specific target country of tourists by applying the following theme ”Wonderful Indonesia”, “Wonderful Nature”, ”Wonderful Culture”, ”Wonderful People”, ”Wonderful Culinary”, and ”Wonderful Price“. This marketing and promotion strategy is intended to showcase Bali as the center of tourism in Indonesia and to improve the image of Bali as a leading world-class tourism destination;
• Empowering the Bali Tourism Board to coordinate marketing and promotion efforts of Bali;• Promoting the development of tourism destinations in Bali’s northern region will focus on strategies
to attract and encourage the tourist to stay longer in Bali by provision of increased services and facilities. However any new developments in Bali will be guided by high environmental management standards;
• Improving tourism destinations beyond Bali (“Bali and Beyond”) by encouraging Bali as the main tourism gateway of Indonesia, allowing tourists to experience enormous tourism theme such as beach tourism (Bali, Lombok, East Nusa Tenggara), cultural tourism (Bali), mountainous tourism (East Java, Bali, Lombok), and endangered species tourism (Komodo Island). The key to success of this strategy is access and provision of adequate flight routes to tourism destinations beyond Bali, driven by a strong and targeted marketing strategy;
• Increase services and facilities for the tourists including improved infrastructure such as water supply, electricity, transportation and communication;
• Improving human resources development and tourism awareness in NTB and NTT.
Aside from increasing the number of tourists visiting Bali - Nusa Tenggara Economic Corridor, another factor to obtain higher income from this main economic activity is by increasing spending yield of tourists. The changes in the world’s economic pattern have impacted local tourism. Therefore, the government and the tourism industry stakeholders must proactively identify and explore new markets that can encourage future tourism growth.
Figure 3.F.6: Creation of Tourism Cluster Network
with Addition of Flight Routes
City tourism
Surabaya
YogyakartaMalang
International Arrivals
Mataram
Bima
Opening flight route to Malang & Bima will help channel and more visitors to those tourism clusters
1 hour flight radius
Denpasar
Yogyakarta, Solo, Borobudur, Prambanan
Gili Islands, Sengigi Beach, Mount Rinjani
Komodo Island
Mt. Bromo, Batu, Bentar Beach
Airport (regular service from Bali)
Airport (limited service from Bali)
Airport (no service from Bali)
Tourist destination cluster
Masterplan P3EIBali – Nusa Tenggara Economic Corridor
144

Regulation and Policy In order to implement these general strategies, the following regulatory and policy support is required:• Simplify and broaden issuing of Entry Visa, Visa On Arrival and Visa On Board for foreign tourists and
a visa extension for foreign yachters;• Prepare a development standard for cruise terminals and marinas as port of entry;• Facilitate the implementation of CAIT (Clearance Approval for Indonesian Territory) for foreign
yachters;• Reduce/eliminate the temporary import duties for foreign yachters entering Indonesian waters;• Review the spatial plan of Bali, NTB and NTT to support tourism development plan in Bali;• Prepare Standard Operating Procedure (SOP) for the acceleration of permits and the provision of
Integrated One-Stop Service for all permits to develop tourism area.
Connectivity (infrastructure) Infrastructure needs must be met in order to improve connectivity to support the tourism development as one of the main economic activities by:• Increasing capacity and airport services, such as the airport development in Lombok, which can be
promoted as a “Matahari Kembar” (The Twin Sun) – as a suplement to the Ngurah Rai airport, in order to alleviate the burden of passenger traffic in this corridor which is projected to exceed the Ngurah Rai Airport capacity in 2020;
• Increasing capacity and development of road infrastructure, such as the Nusa Dua - Benoa Toll Road development plan;
• Improving access roads to link the tourism areas outside the southern part of Bali and within the regions of NTB and NTT;
• Developing the Bali Tourism Outer-Ring Railway (long-term plan);• Improving existing harbors and marinas to meet international standards (such as cruise and yachts);• Constructing new power plants that uses renewable and clean fuel such as wind or Compressed
Natural Gas (CNG) will be pursued to increase the availability of electricity for Bali and Nusa
Tenggara.
Source: Euromonitor; Mintel; Equity Analyst (Goldman, UBS); Airlines Business Magazine; Companies’ 10-K, 6-K, Annual Reports; Team Analysis
Figure 3.F.7: Cruises Market Share Growth
in Bali - Nusa Tenggara
Cruise line is still small, but it is the fastest growing category in tourism
Market size (USD Bn), 2003
Cruise
Air travel
Car rental
Entertaintment
Hotel
Tour operator
Market size growth (%),2000-2003
1. Overall cruise number is small2. Number of cruises starting from
Bali is even smaller• Only 3 cruises actually start from Bali• Cruises starting from Bali are small (only
100 pax) compared to typical Australian cruises (2,000 pax)
Number of cruises/year,2010-2011
Passing only
Starting from
Bali
Phuket
Singapore
Hongkong
Florida
New
York
Southampton
Kuala Lumpur
To improve the image of tourism and the development of up-market tourism in this corridor, efforts should be directed to make Bali a major tourist destination for “Meeting-Incentive-Convention-Exhibition” (MICE), cruises and yachts. Nusa Tenggara should be further developed to be a showcase of SMEs-based, ecological, adventure, culture and maritime tourism.
Masterplan P3EIBali – Nusa Tenggara Economic Corridor
145

Fishery is one of the main economic activities that need to be developed in order to provide national food security. Currently, fishery products are a source of animal protein with the largest consumption level in Indonesia. Fisheries product consumption reached 30.4 kg/capita/year, which is 72 percent of animal protein consumption/capita/year, higher than other animal protein sources like chicken, meat and eggs. As an archipelago, Indonesia’s geographical condition strongly supports the development of fishery activities. Indonesia has access to abundant fishery resources in both marine fishery and freshwater fishery, where 76 percent of Indonesia’s surface area is sea-waters, in addition to the 5,500 rivers and lakes found throughout Indonesia.
In general, fishery activities can be divided into two types, namely capture fishery and aquaculture. Fishery activities in Indonesia grew by 10.29 percent per year on average. In the period 2009-2010, aquaculture production increased by 16.34 percent, with the largest production obtained from sea cultivation. The increase was higher than capture fishery production, which increased by only 4.71 percent.
Fishery activities also include marine products, such as seaweed and salt. National seaweed production in 2010 reached 3 million tons. In this corridor, there are 12 regencies which were identified as future locations for the development of seaweed commodities as listed in the Minapolitan program year 2010 to 2014.
Figure 3.F.8: Indonesian Fisheries
Production, Year 2009-2010
FISHERIES PRODUCTION (Tons)Year INCREASING
AVERAGE (%)2009 2010
Catch-Fisheries 5,107,971 5,348,440 4.71
Marine Fish 4,812,235 4,846,880 0.72
Inland Openwater 295,736 501,560 69.60
Aquaculture 4,708,563 5,478,062 16.34
Marine Aquaculture 2,820,083 3,385,552 20.05
Pond Culture (Brackish Water) 907,123 990,403 9.18
Pond Culture 554,067 627,643 13.28
Cage Culture 101,771 117,860 15.81
Floating Net 238,606 272,705 14.29
Paddy-field 86,913 83,900 -3.47
Total 9,816,534 10,826,502 10.29
Catch-Fisheries
Aquaculture
Total Productions (Mn Tons)
2006
7.498.24
8.86
9.8210.83
12
10
8
6
4
2
02007 2008 2009 2010
Mn Tons
Year
Source: AP5I at Penjaringan Aspirasi Sektor, 8-9th of February, 2011
Fisheries
Masterplan P3EIBali – Nusa Tenggara Economic Corridor
146

Although Indonesia has a geographical condition that is potential for the development of salt production, currently Indonesia must import salt in order to meet domestic needs. In 2009-2010, the import of salt for public consumption increased sharply by 500 percent. Increased import quantities of salt can be seen in the below picture.
The government is implementing efforts to increase the production of salt by forming a salt Minapolitan region. The government gives special attention to NTT as the development region of this commodity, since this region has the possibility for extensive land to be allocated for salt production.
For Bali - Nusa Tenggara Economic Corridor, the main economic activities of fisheries currently contributes 13.2 percent GDP from the food agriculture sector. According to current data from Center of Environment, Bogor Agricultural Institute (IPB), main economic activities of fisheries are using less than 25 percent of their marine potential in Indonesia. Increased productivity of marine product will positively impact capture fishery and the development of aquaculture. The NTB area has very strong marine potential. The success of the main economic activities of fisheries can be a driving force for the economy of Bali - Nusa Tenggara Economic Corridor by providing job opportunities.
Figure 3.F.10: Fisheries Activities
It is also one of the drivers for export
Composition of export by sector (%), 2008
Others
Fishery
Bali Nusa Tenggara
Source: National Statistic Agency
Food agriculture GRDP composition of the Regency/City covered by the corridor, 2008
13.2%
22.4%
Food Agriculture
Farming & estate plantation
Animal Husbandry
Fishery
64.4%
Fishery in NT has large untapped potential
Fishery potential in NT(ha), 2008
SeaweedPearl
Potential
Realized
Marine fish
Aquaculture
25,000
20,000
15,000
10,000
5,000
0
Figure 3.F.9: Indonesian Salt Import, Year 2008-2010
Source: Ministry of Industry, 2010
3,000,000
2,500,000
2,000,0000
1,500,000
1,000,000
500,000
0
2008
Salt Import Trend (Tons)
Public Consumption Industrial Consumption
2009 2010 Year
1,700,0001,850,000
2,600,000
Masterplan P3EIBali – Nusa Tenggara Economic Corridor
147

Masterplan P3EIBali – Nusa Tenggara Economic Corridor
148

Factors that influence the development of fishery activities are divided into 3 major aspects: fishing/cultivation, processing, and the distribution of processed fishery. There are several challenges associated with the three aspects of the development of fishing activities, such as:• The potential for marine fishery is not mapped accurately, the control of spatial plan implementation
is weak and land use does not comply with its intended allocation;• Limited supply of marine fisheries which requires production efficiency through the development of
quality seeds of fisheries;• Most of the fishing fleet and equipment is still very simple;• Investor’s lack of interest for the development of fisheries, particularly in processing of fishery and
marine products;• Low economic value-added of processed marine fishery products;• Low quality of human resources in fishery and marine activities, both in capture fishery and
aquaculture production as well as in its processing;• Lack of capital for local communities related to the development of community-based fishery
activities;• Limited distribution channels and marketing of fishery products and processed products;• The need for supporting facilities and infrastructure (including roads, water and electricity), primarily
to serve the marine fishery processing industry, has not been fulfilled. This causes high production cost of fishery products and processed products;
• Lack of access connecting the locations of marine fishery producer with the location of its processing industry, as well as with regional markets and export facilities
To overcome these challenges, common strategies and action plans that will be developed in Bali – Nusa Tenggara Economic Corridor are:1. Increasing the production of fishery products, which include tuna catching, shrimp and seaweed
cultivation. Bali - Nusa Tenggara Economic Corridor has abundant fishery potential, therefore, in order to increase fish production several actions must be undertaken:• Map the potential of fisheries and marine resources;• Monitor the implementation of spatial planning;• Establish seed centers;• Revitalize existing ponds;• Establish training centers for fishermen and provision of certification program; and• Develop high quality seeds and fishing technology
2. Increasing the production of high value-added processed fishery, which include frozen fish, canned fish, fish meal processing, and processing of seaweed flour (Keraginan). Currently, the added value of processed fishery products is very low. Increased economic value added fishery product processing can be accomplished by:• Development of fishery industrial clusters that includes the fishing industry’s raw material
production;• Cooperation with foreign consumers (Japan and Thailand) for the marketing of aquaculture;• Provision of technical assistance to SMEs to enhance their knowledge on fishery processing that
gives high added value, and provision of PNPM Mandiri microcredit schemes through fishing cooperatives.
3. Increasing the production of salt by optimizing land with potential for development. The development of the salt industry is a priority activity at this time because Indonesia has yet to meet domestic needs, and relies heavily on imported salt. In an effort to increase domestic production of salt, salt centers will be developed in the province of East Nusa Tenggara.
Regulation and Policy In order to implement the general strategy of increasing fish production and salt business development, regulatory and policy support is required as follows:• Preparation and supervision of the implementation of spatial planning;• Cooperation with foreign consumers (Japan and Thailand) for the marketing of aquaculture;
• Create cooperation between salt industries with local salt farmers to supply raw materials.
Masterplan P3EIBali – Nusa Tenggara Economic Corridor
149

Connectivity (infrastructure) It is important to fulfill infrastructure needs to improve connectivity to support the increase of fishery production and development of salt, through:• Improvement of the level of service of cross district roads, particularly to NTT, and improve access
from fishing ports to the nearest cross-districts roads;• A review of local port capacity to support industrial activities;• Acceleration of energy expansion program through capacity increase of Power Plants;• Develop the Mbai Airport located at Nagekeo Regency, NTT to transport high value but highly
perishable marine fishery products;• Acceleration of water treatment plants construction, especially in NTT to support the development
of aquaculture and industrial fisheries and marine product processing
Human Resources and Science &Technology The effort to increase fish and/or salt production and business development should be accomplished through:• Establishment of fishermen training centers and provision of certification program;• Development of high quality seeds and fishing technologies;• Provision of technical assistance to SMEs to enhance their knowledge in fishery processing that
has high added value, and provision of PNPM Mandiri micro credit schemes through fishing cooperatives;
• Collaboration with local research institutions and universities for technology development for processing of fishery and marine product that have higher value (with better quality);
• Collaboration with local research institutions and universities for the development of salt cultivation technology (so as not to depend on the weather);
• Establishment of a regency level training center for technical dissemination and the possible integration of salt ponds with fish cultivation.
The main economic activities of animal husbandry contribute approximately 16 percent to the GDP of the food and agriculture sector for the Bali - Nusa Tenggara Economic Corridor. Most of the cattle population in this corridor is consumed locally, only a small amount is marketed to other provinces.
Primary livestock is cow
NTB
Bali
East Java
967
1,711
769
17584
2,000
1,500
1,000
500
0Cow CowPig GoatGoat Buffalo Buffalo HorseHorse
livestock population (thousands), 2008
Most livestock is consumed locally
26
11
2 0100
80
60
40
20
0
livestock consumption in Lombok(%), 2008
Shippedoutside
Consumedlocally
74
89
98 100
Food agriculture GRDP composition of the Regency/City covered by the corridor, 2008
13.2%
22.4%
Farming & estate plantation
Animal Husbandry
Fishery
Food Agriculture
64.4%
Source: National Statistic Agency
Figure 3.F.11: Animal Husbandry
Animal Husbandry
Masterplan P3EIBali – Nusa Tenggara Economic Corridor
150

The type of animal husbandry with the most potential for development in the Bali – Nusa Tenggara Economic Corridor is beef cattle. Cattle can be developed to produce seven types of “gold”, i.e. red gold (meat), white gold (milk), white bullion gold (bone), yellow gold (urine), brown gold (skin), blue gold and green gold (manure). Cow urine can be used as organic fertilizer, while its feces can be used as green manure and biogas energy.
The growth of cattle population in West Nusa Tenggara rose rapidly from 2009 until 2010 but did not grow rapidly in Bali and East Nusa Tenggara. In contrary, production growth in Bali and West Nusa Tenggara decreased in 2008, with West Nusa Tenggara experiencing a steep decline. This production decline is due to the rampant slaughter of productive female cattle, cattle smuggling, as well as reduction in the seed quality for animal husbandry. The biggest challenges in the development of farm activities include the limited infrastructure that can support the distribution of cattle products, lack of venture capital and weak human resources and animal husbandry institutions.
Currently, there are purification and breeding centers in each province, which are generally managed on an individual basis. With the high number of house holds involved in animal husbandry activities, development is expected to be able to support the acceleration of economic development in the Bali-Nusa Tenggara Economic Corridor in the future.
Regulation and Policy In order to implement the development strategy of the main economic activities for animal husbandry, regulatory and policy support required are as follows:• Increase downstream industries by increasing the value-added activities, such as diversifying
products that utilize the skin, bone, blood, faeces, and urine through the strengthening of small industries;
• Provide protection of animal husbandry enterprises with policy intended to gradually reduce imports of meat and introduce meat price control policies;
• Provide ASUH (Safe, Healthy, Intact, and Halal) quality meat;• Develop policy on sustainable rice-livestock integrated system by optimizing the principles of Low
External Input Sustainable Agriculture (LEISA) and zero waste approaches that produce 4F (Food, Feed, Fertilizer & Fuel);
• Provide spatial security for farm land and livestock grazing land;• Facilitate financing access for farmers by strengthening the savings and loan cooperatives;• Apply strict sanctions to those who have been caught slaughtering of productive female cattle.
Source: Exposure Task Forces Bali-Nusa Tenggara Directorate General of Animal Husbandry, Ministry of Agriculture, 2011
2009 2010
3.26 3.263.26
3.4
3.8
6.7
5.5
7.5
5.4
8.6
17.433.3 33.3 33.3
21.15
17.39
-10.2
-5.1
5.18
1.65 -1.21
1.952.72
1.2
Year1.1
Population(r%)
20
18
16
14
12
10
8
6
4
2
0
Cattle Population Growth, Year 2006-2010
Production (r%)
Cattle Production Growth, Year 2006-2010
40
35
30
25
20
15
10
5
0
-5
-10
-15
2009 2010Year
Bali
NTB
NTT
Figure 3.F.12: Population and Production Growth
of Beef Cattle in the Bali – Nusa Tenggara
ACCELERATION STRATEGY1. Condusive Farm Business Climate2. Increase productivity of cattle to achieve self-
sufficiency in meat3. Increase in downstream farms4. Increased regulatory and institutional farms5. Strengthening Infrastructure
DEVELOPMENT OF BEEF CATTLE AGROBUSINESS AREA
NON FOOD ANIMAL INDUSTRY
marketing to consumers
FOOD ANIMAL INDUSTRY
Source: Exposure Task Forces Bali, Nusa Tenggara Directorate General of Animal Husbandry, Ministry of Agriculture, 2011
Figure 3.F.13: Animal Husbandry Acceleration Strategies
Masterplan P3EIBali – Nusa Tenggara Economic Corridor
151

Connectivity (infrastructure) Infrastructure must improve connectivity to support animal husbandry production, which can be accomplished through:• Provision of infrastructure to support farming activities through Public Private Partnership (PPP);• Strengthen roads to transport farm products from the center of the meat and non-meat processing industry for
distribution to the nearest local port;• Strengthen local ports to increase distribution of cattle products to other regions, particularly to Jakarta and
Surabaya. The Marapokot seaport in the Nagekeo Regency will be developed to distribute animal husbandry and fishery products;
• Strengthen the Mbai Airport (also known as Surabaya Airport II) to allow it to transport animal husbandry and fishery products;
• Construct new power plants to increase the availability of electricity, especially for the region of Nusa Tenggara;• Provision of clean water to ensure the availability during the dry season in Nusa Tenggara.
Human Resources and Science & Technology Efforts to improve animal husbandry production and development is possible by:• Ensuring availability of sufficient supply of feed throughout the year by implementing inexpensive feed
technology to encourage domestic meat production;• Providing training and mentoring to farmers for implementation of Good Breeding Practice Programs;• Developing long term technologies to improve the quality of implementing artificial insemination, embryo
transfer or genetic modification.
The main economic activities for animal husbandry development in the Bali – Nusa Tenggara Corridor will be focused on the development of agri-business activities with beef processing (animal food industry) as the main industrial activity, and supporting industries such as bone flour, leather, organic fertilizer, and biogas industries. Animal husbandry products are not only consumed locally, but also distributed to consumers in other regions.
Other Economic ActivitiesIn addition to the main economic activities which are the focus of the Bali – Nusa Tenggara Economic Corridor, there are several other activities that are considered to have the potential to contribute to development in the corridor, e.g. copper mining. These activities are expected to also contribute to the overall development of the Bali-Nusa Tenggara Economic Corridor.
InvestmentNew investment plans for main economic activities of tourism, fisheries, animal husbandry and the supporting infrastructure in Bali – Nusa Tenggara Economic Corridor is estimated to be approximately IDR 133 Trillion. Below is a general description of the investments in the Bali – Nusa Tenggara Economic Corridor:
Figure 3.F.14: Investment in Bali
- Nusa Tenggara Economic Corridor Source: Team Analysis
Investment Indication of Bali – NT Economic CorridorIDR Tn
Mix
SOE
Private
Government
Tourism Fishery Animal Husbandry Infrastructure Total
50
52
16
33
32
67 133
7158
100
150
0
Masterplan P3EIBali – Nusa Tenggara Economic Corridor
152

To Maluku & Papua
The investment initiatives identified are generated from government, private sector and SOEs, as well as from a mix of all three sources.
In addition to the main investments shown above, there are also some investments that are not part of the main economic activities in the corridor, but are part of the 22 national main economic activities, which are copper and oil & gas, with a total investment of IDR 34.9 Trillion. There are also investments of sectors outside the 22 main economic activities developed in MP3EI, such as gold, with a total investment amounting to IDR 42 Trillion.
Figure 3.F.15: Investment Map of Bali - Nusa Tenggara Economic Corridor
Government SOE Private
2K5-(12, 19)-2
IDR 30.12 Tn
Lombok - Tourism, Animal Husbandry
IDR 20.42 Tn
Denpasar - Tourism, Fishery
K5-(12,22)-1 1
IDR 5.79 Tn
Nagekeo - Animal Husbandry, Fishery
K5-(19, 22)-3 3
IDR 0.43 Tn
Flores Timur - Animal Husbandry
K4-(19)-4 4
IDR 0.31 Tn
Kupang - Fishery
K5-(22)-5 5
1 23
4
5
Strategic Initiatives of Bali – Nusa Tenggara Economic Corridor
Bali - Nusa Tenggara Economic Corridor
Capital City/Economic Center
Animal Husbandry Activity Node
Tourism Activity Node
Fishery Activity Node Sea Port
Domestic Sailing Network
Economic Center Connecting Lane
Existing Access Road
Masterplan P3EIBali – Nusa Tenggara Economic Corridor
153

In addition to investments associated with the main economic activities above, the government and SOEs are also committed to infrastructure development in the Bali - Nusa Tenggara Economic Corridor. The following is the value of infrastructure investment identified for each type of infrastructure that will be developed by the government, SOEs, and a combination of the two:
Figures 3.F.16: Investment Agglomeration
Figure 3.F.17: Infrastructure Investment Indication
No Code Locus Main
Economic Activity
Stakeholders Supporting InfrastructureInvestment
Value(IDR Tn)
Investment Sharing Towards Main Economic Activities in All Corridors
(%)
1 K5-(12,22)-1Jimbaran, Bangli, Buleleng Tourism SOE, Private
Port, Nusa Dua - Ngurah Rai - Benoa Airport, Toll Road
20.34 35
Badung Fishery SOE Production Facilities 0.08 0.2
2 K5-(12,19)-2Lombok Tourism SOE, Private Airport 30.00 51
Bima Animal
Husbandry Government Road, Port 0.12 2
3 K5-(19,22)-3
Nagekeo, Ngada, Manggarai Timur
Animal Husbandry
Private Road, Port, Airport 5.30 77
Nagekeo, Ende Fishery Government,
PrivateRoad, Port 0.49 1
4 K5-(19)-4Timor Tengah Selatan, Flores Timur, Timor Tengah Utara
Animal Husbandry
Government, Private
Road, Port 0.43 6
5 K5-(22)-5 Kupang FisheryGovernment,
PrivateRoad, Port 0.31 1
In the long run, tourism activities will continue to be the driving force of economic development in this corridor through continued diversification of tourism-related activities, expansion of tourism areas and the development of tourism destination competitiveness, as well as broadening of markets to high purchasing power markets. Development of tourism destinations in this corridor are aligned with infrastructure development along the Bali - Nusa Tenggara Economic Corridor.
Infrastructure Investment Indication by Government, SOEs, and Mix(IDR Tn)
50
40
30
20
10
0
4
4
3
12
0
1
1 44
TotalOtherInfrastructure
Water Utility
ICTAirportInfrastructure
RailwayInfrastructure
Power & EnergyInfrastructure
PortInfrastructure
19
Road Infrastructure
Masterplan P3EIBali – Nusa Tenggara Economic Corridor
154

Development of farming activities will be pursued through the development of:• Advanced technology to improve high quality of cattle seed;• The integration of animal husbandry and food crop activities to ensure a consistent source of livestock feed;• The development of meat and non-meat processing industry (leather industry, cattle bone industry, biogas
industry and organic fertilizer industry); and • Capacity-building for road and sea port infrastructure for distribution of animal husbandry products.
Marine fishery productivity development should consider the capacity and sustainability of fish populations through the collaborations for seed development, fishery-aquaculture and fishery product processing technologies. In addition, the development of infrastructure and supporting facilities is very important in the development of fishery activities. Downstream animal husbandry and fisheries activities, such as meat processing and canning of fish and other food products, will be consistently supported by the government through the provision of physical infrastructure and provisions of incentives/disincentives as well as deregulation to establish a conducive business climate.
Spatial structure of Bali - Nusa Tenggara Economic Corridor will be developed with emphasis on the connectivity of land, sea and air links between islands, between provinces with consideration to geographical conditions within the archipelago. This connectivity system will support all main economic activities (tourism, animal husbandry, and fisheries) and other activities that have a high investment value, including oil & gas, gold and copper. However, it should be noted that mining exploration is not prioritized in this corridor as it would produce negative impacts on tourism, fishery, and animal husbandry activities. Priority will be given to improve existing sea ports and airports adjacent to the main locus of economic activities as it will be more effective, efficient and in minimizing transportation costs. Spatial plans for provinces and regencies should be able to accommodate and ensure the availability of land for tourism, fisheries, and animal husbandry – primarily for grazing land.
Masterplan P3EIBali – Nusa Tenggara Economic Corridor
155

Papua – Kepulauan Maluku Economic Corridor
Development Theme: Consists of 7 Economic Centers:
• Timika• Jayapura• Merauke
• Sofifi• Ambon• Sorong• Manokwari
Center for Development of Food, Fisheries, Energy, and National Mining
Main Economic Activity:
• Food Agriculture - MIFEE• Copper• Nickel• Oil and Gas• Fishery
Merauke
Sofifi
To Makassar & Surabaya
To Makassar & Surabaya
Teluk Bintuni
Nickel Mining Activity Node
Capital City/Economic Center
Food Agriculture Activity Node
Fishery Activity Node
Copper Mining Activity Node
Oil and Gas Activity Node
Economic Center Connecting Lane
Domestic Sailing Network
Industrial Cluster
Trans Papua Road
Existing Access Road
Sea Port
Masterplan P3EIPapua – Kepulauan Maluku Economic Corridor
156

Papua–Kepulauan Maluku Economic Corridor OverviewPapua - Kepulauan Maluku Economic Corridor consists of Papua, West Papua, Maluku and North Maluku Province. In accordance with its development theme, Papua – Kep. Maluku Economic Corridor is directed to be the center of production for food, fisheries, energy, and national mining development. This Corridor has abundant natural resources. However, there are some problems that should be addressed in order to boost the economy in this corridor, such as:
• The rate of GRDP growth in Papua - Kep. Maluku Economic Corridor from 2006 – 2009 was relatively high at 7 percent, but is relatively low when compared to GRDP in other corridors;
• There are large disparities between districts in Papua. For example, Mimika’s GRDP per capita amounts to IDR 240 Million, while other districts in average are below the national average GDP per capita (IDR 24.26 Million);
Figure 3.G.1: GRDP within Corridors
Figure 3.G.2: GRDP per Capita between Regions in Papua Province
15%
10%
5%
0%
Punc
ak
Jaya
Re
genc
y
Telu
k Bi
ntun
i Re
genc
yTe
luk
Won
dam
a Re
genc
y
Pani
ai
Rege
ncy
Mim
ika
Rege
ncy
Jaya
pura
Nab
ire
Rege
ncy
Jaya
pura
Re
genc
y
Keer
om
Rege
ncy
Sarm
i Re
genc
y
Tolik
ara
Rege
ncy
War
open
Re
genc
y
Man
okw
ari
Rege
ncy
240
23
1712 12 12
5 9 513 13
22
16
PDRB per Capita (IDR Million), 2009
National GRDP per Capita IDR 24.26 Million
Source: NSA
GRDP Growth 2009
240
220
40
20
0
GRDP per Capita GRDP Growth 2009 at 2000 constant price
GRDP CAGR for Regions (2006-2009)
The Growth of Economy in Papua is Higher than National Average
7.0
7.1
4.0
5.9
5.6
5.6National average
Sumatra
Java
Sulawesi
Kalimantan
Papua – Kep. Maluku
Jakarta
-2% 0% 4%2% 6% 8%
1,500
1,000
500
0
Real GDRP across regions, 2009 (IDR Tn)
Source: Province and Regency in Figure, NSA
1,073.0
205.0
422.0
123.0 92.9
SumatraJava SulawesiKalimantan Papua – Kep.
Maluku
Bali – Nusa Tenggara
This Region Also Grew from a Small Economic Base
4.4
Masterplan P3EIPapua – Kepulauan Maluku Economic Corridor
157

• Low investment in Papua due to the high investment risk and a low level of business certainty;• Productivity of the agricultural sector is not optimized due to limited irrigation facilities;• Lack of infrastructure to support economic development;• Low population with high mobility leads to specific challenges in the planning of development program for
Papua.
Papua has a low population density of 12.6 person/km2, much lower than the national average population density (124 person/km2).
The development strategy for Papua - Kep. Maluku Economic Corridor is focused on five main economic activities, which are food agriculture – MIFEE (Merauke Integrated Food and Energy Estate), copper, nickel, oil and gas, and fisheries.
In order to anticipate food and energy crisis, Merauke area has been designated as the center of food and energy reserves in Eastern Indonesia due to its flat terrain and fertile land. The activity is realized in the form of MIFEE (Merauke Integrated Food and Energy Estate) development program. MIFEE is an activity of large-scale cultivation of crops by adopting the concept of agriculture as an industrial system based on science and technology, capital, modern organization and management.
1,100
1,000
200
100
0 12.625
92.5105
1,055
Indonesiaaverage = 124
Papu
a -
Kep.
M
aluk
u
Kalim
anta
n
Sum
atra
Sula
wes
i
Java
Population Density, 2010 (per km2)
Figure 3.G.3: The Population Density between Islands in Indonesia
Figure 3.G.4: Area Map of MIFEE in Papua
Food Agriculture - MIFEE
KSPP on MIFEE Grand Design
VIII
KSPP VIII Tahonji
KSPP VI Wanam
KSPP IX Nakias
KSPP X Selil
KAB. MERAUKE
VI IX
X
IV
II
VVII
IIII
KSPP V OkabaKSPP VII Tubang KSPP II
Kali Kumb
KSPP IGreater Merauke
KSPP IIIYeinan
KSPP IV BianKSPP X Selil
KSPP IX Nakias
KSPP VI Wanam
KSPP VIII Tabonji
Source: Grand Design MIFEE, Ministry of Agriculture, 2010
Source: NSA
Masterplan P3EIPapua – Kepulauan Maluku Economic Corridor
158

MIFEE development is located in an area of 1.2 million hectares, and consists of 10 clusters of Agricultural Production Centers (KSPP). The locations of the KSPPs can be seen in Figure 3.G.4. The short-term development priority of MIFEE (2011-2014) is to develop clusters I to IV, covering an area of 228,023 Ha. The four KSPP clusters being developed are: Greater Merauke, Kali Kumb, Yeinan, and Bian located in the Merauke Regency. The medium term (2015 to 2019) development will be directed at developing areas of agricultural production centers for food crops, horticulture, animal husbandry, plantation, and aquaculture in Clusters Okaba, Ilwayab, Tubang, and Tabonji. Meanwhile, the long term (2020 to 2030) development will be directed at the establishment of a central production area for food crops, horticulture, animal husbandry and fishery and plantation in Clusters Nakias and Selil.
Planting for MIFEE will include rice, corn, soybeans, sorghum, wheat, vegetables and fruits; and livestock for animal husbandry will include chicken, cow, goat and rabbits. As for non-food crops, the program will include sugar cane, rubber, and palm oil.
KSPP Area Commodity
KSPP-1 Greater Merauke 44,239 Ha Rice, corn, padi gogo (prime variant)
KSPP-2 Kali Kumb 50,140 Ha Sugar cane, livestock, corn, ground nut and soybean
KSPP-3 Yeinan 80,717 Ha Corn, ground nut, soybean, fruits and livestock
KSPP-4 Bian 52,926 Ha Ground nut, palm, fruits and livestock
KSPP-5 Okaba 27,705 Ha Rice and livestock
KSPP-6 Wanam 112,599 Ha Fisheries, corn, sago and rice and livestock
KSPP-7 Tubang 295,904 Ha Livestock, rice, sago and livestock
KSPP-8 Tabonji 315,142 Ha Livestock, rice and sago
KSPP-9 Nakias 173,971 Ha Corn, ground nut, soybean, rice and livestock
KSPP-10 Selil 65,280 Ha Palm and livestockFigure3.G.5: Referrals Per Cluster Commodity Production Center of Agriculture (KSPP) in MIFEE Area
Source: Grand Design MIFEE, Ministry of Agriculture, 2010
Sugar and sugar cane production are priority activities in MIFEE which is intended to meet sugar demand. Papua has the potential to become a major producer of sugar cane, having 500,000 hectares of land area for sugar cane production the largest land area outside of Java (that makes it 47 percent of land area for sugar cane in Indonesia other than Java).
In addition to sugar cane, other non-food material to be developed in MIFEE is palm oil. The palm oil industry produces the largest foreign exchange revenue after oil and gas. Indonesia is the largest palm oil producer in the world. It produces 43 percent of the total world production of crude palm oil (CPO). The growth of palm oil production in Indonesia is 7.8 percent per year, higher than that in Malaysia where the production growth is 4.2 percent per year.
Figure 3.G.6: Production of Indonesia and Malaysia Palm Oil
2007
31.0
15.8
15.6
40
30
20
10
0
35.6
17.6
18.0
31.9
15.3
16.6
37.0
17.5
19.5
4.2%
7.8%
2008 2009 2010
Malaysia
Indonesia
Production Growth/Tons
Mn Tons
Masterplan P3EIPapua – Kepulauan Maluku Economic Corridor
159

Although not so widespread compared to other regions in Indonesia, Papua has land that can be used for palm oil plantations, as seen in Figure 3.G.7 below.
When compared to Sumatra and Kalimantan, Papua palm has lower productivity. This is due to the use of low quality seeds, inadequate use of fertilizers, and lack of milling facilities; and long travel time from plantation area to the mill.
Regulation and Policy To carry out MIFEE development, the following regulatory and policy associated matters must be addressed:• Gradual development of food estate land;• Accelerate the process of releasing designated forest land into food estates areas;• Socialization to the local community about the implementation and benefits of the MIFEE program for the
welfare of the community.
Figure 3.G.8: Productivity of CPO in Papua – Kep. Maluku
Economic Corridor
CPO (Tons/Ha)
Based on Multinational Companies ProductivitySource: Indonesian Commercial Newsletter, Team Analysis
Opportunity to increase the productivity of CPO in Papua – Kep. Maluku Economic Corridor
7.0
Average CPO yield in Sumatra
Potential yield
Malaysia average yield
Average CPO yield in Kalimantan
Average CPO yield in Papua – Kep. Maluku
4.6
Figure 3.G.7: Areas for Palm Oil Plantations in
Indonesia
7.5
6.0
4.5
3.0
1.5
0
Mn Ha
Areas for Palm Oil Plantation in Indonesia, 2009
Source: Euromonitor; Consultant Data; AISI; Team Analysis
1.50
1.33
1.20 0.310.49
0.51
0.580.33 0.38
0.24 0.02 0.03 6.92
4%26%70%
Otherregion in Sumatra
NorthSumatra
WestSumatra
Riau Aceh Java TotalSulawesiSouthKalimantan
EastKalimantan
CentralKalimantan
West Kalimantan
Papua
3.5 3.7
2.4 2.33.1
8
6
4
2
02008 2009
3.0
Masterplan P3EIPapua – Kepulauan Maluku Economic Corridor
160

Connectivity (infrastructure) MIFEE Development requires infrastructure support which must include:• Preparation of maintenance and development plans for water resources infrastructure networks and
swamp reclamation;• Development of service and collection-distribution centers for agricultural products;• Development of a sea port in Merauke and the docks along the Kalimaro River and the Bian River;• Development of connectivity routes connecting palm oil plantations to mills and port locations;• Improvement and development of roads and bridges in each Agriculture Production Center Cluster (KSPP);• Rehabilitation and development of Water System in each KSPP;• Development of an Agribusiness Terminal, Storage and Export Port in Serapuh & Wogikel;• Continued development of the Merauke Ocean Fishing Port and the Merauke Port;• Development of Organic Fertilizer Plant in Wasur, Serapuh, Tanah Miring SP VII, Wapeko, Onggay and Sota; as
well as the development of the Ammonia Urea Project in Tangguh;• Development of Biomass-based electricity in Merauke & Tanah Miring.
Human Resources and Science & Technology (IPTEK) In addition to regulatory requirements and infrastructure support improvements, MIFEE development requires the development of human resources and science & technology, such as:• Preparation of quality human resources through manpower training and capacity building for universities;• Provision of capital assistance to farmer groups and agricultural cultivation technology;• Establishment of research & development for agricultural technology, livestock and fisheries in Merauke,
as well as the procurement of agricultural equipment and machinery (tractors, planters, reapers, power threshers, mini combine, water pumps);
• Establishment of Agriculture Vocational Training Center and Agriculture Labor Training Center in each KSPP;• Preparation of cultivation technology for agriculture and plantation-based science & technology (pre-and post-
harvest) in Merauke.
Papua has abundant copper and gold mineral resources. Forty five percent of national copper reserves are found in Papua. Pictured below is the value chain of main economic activity of copper:
Figure 3.G.9: Value Chain of Copper Mining Activities
Mining
Concentrate
Smelting
Anodes
Refining
Cathodes
End-User
Various
Copper
Masterplan P3EIPapua – Kepulauan Maluku Economic Corridor
161

Indonesia plays an important role in the value chain of mining, smelting, and refining. From 2004-2009, the overall Indonesian copper export increased by an average of 0.24 percent annually. The highest average increase was by cathode copper exports at 14.32 percent.
Papua developed the use of non-oil minerals in the form of copper, gold and silver. Copper is a mineral that produces the greatest value in Papua, amounting to USD 4.16 Billion in 2009, as shown in Figure 3.G.11.
Copper production in Indonesia increased sharply in the 1990s. However, recent copper production is stagnated as pictured below.
Copper Production
1,500
1,000
500
0
Thousand Metric Tons
Copper prices
Year from 1990 to 2007
USD/Tons
0
‘00 ‘03 ‘04 ‘05 ‘06 ‘07‘90 ‘955 10 15
8,000
6,000
4,000
2,000
0
Figure 3.G.11: Total Non-Oil Minerals in Papua
Figure 3.G:12: Total Copper Production
of Indonesia
The stagnant condition of copper production in Papua is due to labor problems and the occurrence of natural disasters in mining sites. Currently, exploration and processing of copper in Indonesia is centered largely in Timika (Mimika Regency). The large amounts of capital required for copper mining exploration and the frequent landslide occurrences have both negatively impacted other potential mining sites from being developed. The risk caused by regulatory uncertainty also inhibits the development of copper industry in Papua.
Several matters requiring attention when putting efforts to increase productivity and added value are the utilization of the value chain at the smelting and refining stages, improvement of regulations and planning, encourage sustainability and build a copper processing industrial park.
Figure 3.G.10: Indonesia Copper Exports
(Thousand Tons)
Source: NSA
Source: Ministry of Energy and Mineral Resources
500
Thou
sand
Ton
s
450
400
350
300
250
2004 2005 2006 2007 2008 2009
200
150
100
50
0
Copper Products
Copper Bars (Profile)Copper Sheet (Foil)
Other Copper Products
Copper Cathodes
5,000
4,000
3,000
2,000
1,000
0Copper Gold Silver
152
2,669
4,161
Total non oil-oil gas mining contribution by kind of mineral in Papua (USD Mn), 2009
Masterplan P3EIPapua – Kepulauan Maluku Economic Corridor
162

Currently, Indonesia has only one smelter and refinery in Gresik, East Java and has planned for the construction of three additional smelters in Maros, South Sulawesi in 2013, and in Bontang and Timika in 2014. With the operation of the three new smelters, it is expected that there will be an increase in copper production surplus, which can be used to meet the needs of industry within and outside the country.
Policy and Regulation To implement the development strategy of the main economic activity of copper, there are some matters associated to regulations and policies that must be addressed, which are:• Encourage the implementation of Law No. 4 Year 2009 on Mineral and Coal Mining, by building a
Copper Industrial Park in Timika designated as a location for industrial processing and refining of copper concentrates and other downstream industries (anode, cathode, slabs, billets, powder, wire, wire rod, cable);
• Revise PP No. 62 Year 2008 on Mining Development, to encourage the creation of a favorable investment climate, encourage increased exploration efforts, and ensure the preservation of the environment in mining zones;
• Ensure allocation of mining zones for Papua Province Spatial Plan as well as in regency level spatial planning documents;
• Development of copper smelting and refining plants in Timika;• Development of heavy metal processing factory (TiO2).
Connectivity (infrastructure) Development of the main economic activity of copper also requires supporting infrastructure that includes:• Development of non-diesel power plants and the making of off-grid clean energy facilities for remote
scattered exploration areas;• Improve port facilities such as cargo processing facilities as well as increased connectivity to Jayapura
Airport;• Increase cargo capacity in Timika Seaport;• Improve infrastructure for underground mining in the Block A Area Contract of Work, in Mimika District;• Development of access roads from the Copper Industrial Area to the Timika Port;• Construction of a Hydroelectric Power Plant (HEPP) in Urumuka;• Development of Waste Treatment Plant, Water System, Roads, Drainage and Greenery at the industrial
park and its surroundings;• Development of Information & Telecommunication Network Systems for the Copper Industrial Park in
Timika.
Human Resources and Science & Technology In addition to regulatory requirements and support infrastructure improvements, development of copper industry also needs support from the development of science & technology and human resources, such as:• Establishment of the Center for Design and Copper Engineering in Timika;• Preparation of human resources in the copper industry through education, training and professional
certification centered in Timika;• Facilitate and assist the provision of copper technology equipment.
Indonesian nickel production of 190 thousand tons per year makes Indonesia the 4th of 5 largest nickel producers, which put together contribute 60 percent of world nickel production. Indonesia has 8 percent of world nickel reserves, and therefore, nickel mining and its processing industry is eligible for further development.
Nickel
Masterplan P3EIPapua – Kepulauan Maluku Economic Corridor
163

As a result of the global recession, the demand for nickel declined in the period of 2006 - 2008. However, the demand for nickel increased in 2010 to meet the needs of China and Taiwan. Estimated selling price of nickel will reach USD 8 per pound in 2012, after reaching its lowest level in 2009 at only USD 6.7 per pound.
In Papua - Kep. Maluku Economic Corridor, nickel is found in Weda, Halmahera Tengah Regency, and North Maluku. The biggest challenge in the acceleration and expansion of nickel mining activities is the creation of downstream mining industry, particularly nickel refining of nickel product. Indonesia does not have the nickel refining facilities even though refining activities provide very high added value.
Top 5 Nickel Producer
6th - 15th Largest Nickel Producer
Nickel Mining Production by Country (2007)Nickel producing regions are geographically dispersed
Thousand TonsOthers
Philippines
Cuba
Brazil
China
Colombia
New Caledonia
Indonesia
Australia
Canada
Russia
1,500
1,000
500
0Figure 3:7.13: World
Nickel Source
Figure 3.G.14: Nickel Mining Value Chain
At present, more than 50 percent of nickel is exported in the form of nickel ore. From 190 thousand tons of nickel ore that Indonesia produce annually, only 80 thousand tons of nickel is exported in the form of nickel matte. In addition, nickel processing activities are only limited to nickel mining and smelting, not yet in the form of processing with higher added value. Therefore, it is necessary to develop the higher value nickel processing industries.
Another obstacle in nickel mining is the slow advancement from exploration into operation and production stage as well as opening new mine due to the slow processing of Forest Land Use Permit (Ijin Pinjam Pakai Hutan) or slow issuance of recommendations from local governments.
Some of the challenges of investment in nickel mining are the regulatory issues that are not consistent between central and local governments, and between one ministry with another. In addition, investors still face the problem of nickel mining permit. On the other hand, nickel mining also poses some environmental problems, such as air pollution, land degradation, land disputes, and disruption of ecosystems, as well as social challenges of the many immigrants from outside the region.
Therefore, the main strategy of the development of the nickle industry is increasing activities of nickel mining investment that meets environmental and social aspects.
Nickel ore mining: miling, drying, sorting
Semi-proccesed nickel matte or ferronickel as advanced processing material
result of high-grade nickel products with>99% nickel concentration to the final nickel
Mining Smelting (upstream) Refining (downstream)
Source: International Nickel Study Group
Top 15 Nickel Producer Country
Others
Production
Masterplan P3EIPapua – Kepulauan Maluku Economic Corridor
164

Policy and Regulation To implement the development strategy of nickel, there are some matters associated with regulations and policies that must be addressed, such as:• Simplification of rules and bureaucracy (among agencies and ministries) to make it easier to open new
mines and operate the mines;• Improve regulations towards a coherent land management policy;• Improve institutions to make investments in nickel mining more attractive (at present there are
inefficiencies such as the acquisition of mining, manufacturing contracts, etc);• Improve coordination between various ministries. A good example is the need for coordination between
the Ministry of Energy and Mineral Resources and Ministry of Forestry on the permit to do mining, including in disadvantaged areas;
• Improvement of land use regulations and other regulations in the granting of mining permits to companies;
• Strengthening downstream nickel industries with the facilitation of strong partnerships and synergies between Ferro Nickel industry with its upstream and downstream industries;
• Government support in the form of investment incentives for investors.
Connectivity (infrastructure) the development of Nickel as a main economic activity also requires the infrastructure support that includes:• Power generation (energy availability);• Access road between the mining area and the smelting and refining facilities;• Sea port infrastructure that can serve the transport of equipment and materials from other regions.
Oil and gas sector is the largest contributor to the Indonesian economy. Of the total revenues amounting to IDR 235 Trillion in the energy sector and mineral resources in 2009, the contribution of oil and gas amounted to IDR 182.63 Trillion. The Indonesian government has set high growth targets, which requires energy and investment to realize it. For that, it takes a huge investment to realize this geological potential in line with the shift of oil and gas industry to the eastern regions with greater challenges.
Production of oil and gas is about half of the fossil energy production in Indonesia, not puting into account coal production. In 2008, oil and gas production amounted to 47.64 percent of Indonesia’s fossil energy production, as can be seen in the figure below.
Figure 3.G.15: Indonesian Fossil
Energy Production Source: Ministry of Energy and Mineral ResourcesPetroleum Natural Gas Coal
1,315
1,478
2004 2005 2006 2007 2008
1,095 1,062
1,461
1,746 2,221
1,445
1,006 954
1,369
2,460 2,551
2,343
978
Indonesian Fossil Energy Production Results in Thousands of BOEPD
Oil and Gas
Doc. Antara
Masterplan P3EIPapua – Kepulauan Maluku Economic Corridor
165

Fuel still dominates the national energy consumption, followed by gas, coal, electricity and LPG, as shown in the diagram below.
Figure 3.G.16: The Role of Fuel in The National
Energy Consumption
Oil and Gas has a huge potential to be developed into a strong pillar in the growth of the Papua - Kep. Maluku Economic Corridor. Papua has large reserves of oil and gas, including petroleum reserves near Sorong, West Coast Block Sarmi, Semai, and gas reserves around Teluk Bintuni. Efforts to optimize oil and gas production can be done by balancing the capacity of exports and imports of oil and gas, providing a positive investment climate, fine-tune some legislations and licensing of oil and gas sector, and encouraging the achievement of oil lifting, which in turn affects the price of oil.
Policy and Regulation To carry out oil and gas development strategies, there are some matters associated to regulations and policies that must be addressed, such as:• Increase production reserves through increased exploration and exploitation activities;• Increase the convenience of investors in conducting its business activities;• Increase the availability of information related to the availability of natural gas;• Increase the synergy of government with relevant stakeholders;• Implement single window or one-stop-service in the area of exploration permits and production, so that
cross-cutting issues (overlapping land and environmental impacts) can be resolved quickly and in an integrated manner;
• Create a more attractive Production Sharing Contract (PSC) offering, especially to areas that are difficult to explore (by removing capping of cost recovery and raise the limit on cost recovery);
• Develop agreements and contracts for oil and gas revenue sharing with the local government.
Connectivity (infrastructure) Development of Oil and Gas main economic activities also require supporting infrastructure that includes:• Promote the development of natural gas infrastructure;• Construction of transmission pipelines in the Bintuni Bay area;• Development of distribution network in the Bintuni Bay area;• Construction of Airplane Filling Depot in Sorong;• Development of a City Gas Network in Sorong;• Construction of a LPG Bulk Filling Stations (SPBE) and LPG Bulk Transport and Storage Station (SPPBE) in
some districts that have converted the use of kerosene to LPG.
Human Resources and Science & Technology In addition to regulatory requirements and supporting infrastructure improvements, oil and gas industry will need the support from the development of science & technology and human resources that include:• Establishment of the Oil Information Center at Sorong;• Establishment of the Oil and Gas Research and Development Center in Sorong.
Fuel in National Energy Consumption
Source: Handbook EE 2006Total: 606.13 million Barrels of Oil Equivalent (BOE)
2005
Coal
12%
Gas
16%
Electric
11%
LPG
1%
Petroleum
60%
Masterplan P3EIPapua – Kepulauan Maluku Economic Corridor
166

Indonesia has an important position in the fishery sector. With the breadth of territorial waters in Indonesia, Indonesia is likely to become one of the world’s largest exporters of fishery commodities. Sea food production growth has reached 7 percent per year. These conditions put Indonesia as one of the largest seafood producer in Southeast Asia.
For example, for the production of tuna, Indonesia ranks third in the world’s largest tuna producing countries. This is in line with the increasing fish production in Indonesia from year to year, which is still dominated by catch fisheries. Total fishery production in 2010 reached 10.83 million tons, up 10.29 percent compared to 2009 that was 9.82 million tons.
In period 2009-2010, aquaculture production increased by 16.34 percent, higher than that of catch fisheries production, which itself increased by 4.71 percent. The largest production is obtained from sea cultivation, as presented in the table below.
Although the opportunities in the fisheries sector is quite large, there are some challenges that need to be addressed to develop fisheries sector, which could increase the GDP contribution of the sector in Indonesia and the region in particular.
Source: FAO Fisheries and Aquaculture Dept
FISHErIES PrODUCTIONYear Average
Growth (%)2009 2010*)
Catch Fisheries 5,107,971 5,348,440 4.71Fisheries 4,812,235 4,846,880 0.72Open Water 295,736 501,560 69.60Aquaculture 4,708,563 5,478,062 16.34
Marine Aquaculture 2,820,083 3.385,552 20.05
Fishpond 907,123 990,403 9.18
Pond 554,067 627,643 13.28
Karamba 101,771 117,860 15.81
Floating Net 238,606 272,705 14.29
Rice Field 86,913 83,900 -3.47
Total 9,816,534 10,826,502 10.29Figure 3.G.17: World Fisheries Production Growth
20000
2
4
6
8
10
Indonesia
Annual Growth
Seafood Production (Thousand Tons)
Annual growth of seafood production in several countries in south asia
Philippines
Vietnam
Thailand
2002 2004 2006 2008
7%
6.5%
10%
0.4%
Figure 3.G.18: Total Fisheries Production of Indonesia
Figure 3.G.19: Composition of Indonesian Fisheries Production 2009-2010
2006
Catch Fisheries Aquaculture Total Production
Mn Tons
2007 2008 2009 2010
12
7.498.24
8.869.82
10.83
10
8
6
4
2
4.81 5.04 5.00 5.115.35 5.48
4.713.86
3.192.68
Fishery
Masterplan P3EIPapua – Kepulauan Maluku Economic Corridor
167

Masterplan P3EIPapua – Kepulauan Maluku Economic Corridor
168

Masterplan P3EIPapua – Kepulauan Maluku Economic Corridor
169

According to Indonesia’s spread of fisheries production, Papua - Kep. Maluku Economic Corridor is a region that has the 5th largest marine fishery production in Indonesia.
In Papua - Kep. Maluku Economic Corridor, fishing activity is focused in the Maluku Islands waters because its potential is very large. For that, Maluku has been designated as a National Fish Reserves. Meanwhile, North Maluku, West Papua and Papua do not have fishery potential as large as that in Maluku. Fishery activities in North Maluku are only processing and distribution of fishery products. Development of fisheries in North Maluku will be pioneered by developing the Morotai Mega Minapolitan. West Papua and Papua have only a very small fishing activity and it needs to be further developed based on the existing potential conditions.
In Maluku, the agricultural sector contributed the most to Maluku’s economy for 2009, amounting to 33 percent. Among all sub-sectors of agriculture, the fisheries sector is a sub-sector that experienced the greatest increase amounting to 1.86 percent in 2009.
Maluku Province posted an increase of about 24 percent of fishery production between 2001 and 2006 (KKP, 2006). In the same year, when compared with catch fisheries production data from other provinces, it is seen that the Maluku province has the biggest increase in catch fisheries production in Indonesia. At present, according to the Ministry of Maritime Affairs and Fisheries (KKP), Maluku fishery potential are located at the Banda Sea, the Seram Sea and the Arafura Sea. The three potential sites are called the golden fishing ground. The Ministry of Maritime Affairs and Fisheries will also create fishery industry processing nodes in Maluku, namely in Tual, Ambon and Seram.
Maluku aquaculture posseses tremendous development opportunities as seen from the strategic environment and available potential resources, i.e:• The increasing world population demands more and more supply of fish;• A shift in world consumption pattern to fishery products;• The demand for the supply of high quality food that meet health requirements;• The comparative advantage towards the world market, because of proximity with export destination, e.g.
Japan;• Very large land resources potential, but not yet optimally utilized;• Low quality of processed fish product, resulting in the difficulty to compete in export markets.
Figure 3.G.20: Fisheries Production within
Corridors in IndonesiaSulawesi
2.0
0
2.0
1.5
1.0
0.5
1.91.6
1.11.0
0.4
Sumatra
Fisheries Production, 2007 (Mn Tons)
Java Bali – Nusa Tenggara
Papua –Kep. Maluku
Kalimantan
Masterplan P3EIPapua – Kepulauan Maluku Economic Corridor
170

Challenges faced in developing the fisheries sector in this corridor are:• Difficulty in obtaining capital from the banking sector for small fishing businesses;• Unutilized potential of Maluku as the national fish reserve (1.62 million tons/year);• Un-integrated fishing operations, fish ponds, seaweed farming and processing industry;• Lack of port, power & energy, infrastructure as well as buildings, that can support fishing activities;• Inadequate technology for fishing and processing of fish products.
Strategies that can be focused are to provide micro credit to the fishermen, developing industry of processed fish products, improving the quality of fishery products in local and export markets, maintaining the sustainability of the fisheries sector through empowerment of the fishermen, as well as increasing the capacity of infrastructure.
Policy and Regulation To implement fisheries development strategy, there are some issues associated to regulation and policy that need to be addressed, such as:• Deregulation in the field of Small and Medium Enterprises (SME) credit provision and the introduction of
micro-credit institutions;• Development of Maluku as the National Fish Reserves;• Encourage the publication of regulations concerning the Central Fisheries Industry in Ambon and Tual;• Development of 6 Minapolitan Regions and 6 Seaweed Clusters;• Develop the Mega Minapolitan Program in Morotai;• Increase seaweed processing activities in North Maluku;• Develop production to increase value-added processing;• Improve access to capital from banks and other financial institutions for fishery processing industries.
Connectivity (infrastructure) Development of the main economic activities of fisheries also require supporting infrastructures such as:• Development of marketing infrastructure and facilities for domestic fishery products;• Develop 12 Fishing Ports in Maluku (VAT: Tantui/Ambon &Dumar/Tual, PPI: ERI/Ambon, Taar/Tual,
Amahai, Kayeli/Buru, Ukurlarang/MTB, Klishatu/Wetar, Kalar-kalar/Aru, PPP: Dobo, East Tamher/SBT, Piru/SBB); Fishery Port in North Maluku (Morotai) and Sofifi;
• Provision of fuel depots and power generation infrastructure;• Development of seaweed and fisheries marketing depot in North Maluku;• Facilitate and assist the provision of fishing equipment (boats and fishing nets) equipped with Fishing
Location Information System (satellite);• Infrastructure/Other connectivity linkages that support all activities in the Papua - Kep. Maluku Economic Corridor.
Figure 3.G.21: Marine
Aquaculture Area Available in
Maluku
White Snapper
500
Marine Aquaculture Area Available in Maluku
Thousand Ha
31(6%)
104(21%)
206(42%)
73(15%)
28(6%)
23(5%)
495(100%)
29(6%)
400
300
200
100
0Grouper Seaweed Pearl
OysterSea
CucumberLobster Shellfish Total
Marine aquaculture land available in Maluku Province reaches a total area of 495,300 Ha.
Masterplan P3EIPapua – Kepulauan Maluku Economic Corridor
171

Human Resources and Science & Technology In addition to regulatory requirements and infrastructure support, fishery industry will need support regarding the development of science & technology and human resources, such as:• The development of fish processing units, machinery and processing equipment, laboratory quality tests
and research & development, cold storage, and docking in Maluku and North Maluku;• Establishment of a Research and Development Center for Marine Affairs and Fisheries in Ambon and
Morotai;• Provide technology based fishery resources information center in each fishing village;• Improving the quality of fishery products through training, standardization, and quality control.
Other Main Economic ActivitiesIn addition to Papua - Kep. Maluku Economic Corridor’s main economic activities above, there are also several activities that are considered to have potential for development, such as tourism. These activities are expected to also contribute in the overall development of Papua Corridor - Kep. Maluku.
InvestmentIn relation to the Development of Papua - Kep. Maluku Economic Corridor, the new investment identified for all main economic activities, i.e. oil and gas, nickel, fisheries, food agriculture, copper and supporting infrastructures amounts to a total investment of IDR 622 Trillion.
The following is an overview of identified investment in Papua - Kep. Maluku Economic Corridor:
Investment Indication of Papua - Kepulauan Maluku Economic Corridor
800
600
400
200
0
50
31
89
197
171 622
Government
IDR Trillion
Mix
SOE
Private
TotalInfrastructureCopperFood AgricultureFisheryNickelOil and Gas
Figure 3.G.22: The Value of
Investment in Corridor of Papua
– Kep. Maluku
127
66
391
38
83
Investment in the fisheries sector in Papua - Kep. Maluku Corridor is still very low compared to other key sectors (mining, agriculture, food crops), therefore requiring additional efforts to increase the investment in fisheries. Besides the five main economic activities, there are also identified investments outside the 22 primary economic activities developed in MP3EI, such as activities in gold mining with a total investment amount of IDR 18.80 Trillion.
Masterplan P3EIPapua – Kepulauan Maluku Economic Corridor
172

Government SOE Private
2K6-(6)-2
IDr 83.00 Tn
Halmahera - Nickel
IDr 80.00 Tn
IDr 50.00 Tn
Merauke - Food Agriculture
Trans Papua
K6-(11)-6
K6-(23)-7
6
7
IDr 197.20 Tn
Timika - Copper
K6-(7)-5 5
IDr 0.15 Tn
Ambon - Fisheries
K6-(12)-3 3
IDr 50.00 Tn
Sorong & Teluk Bintuni - Oil and Gas
K6-(15)-4 4
IDr 30.54 Tn
Morotai - Fishery
K6-(12)-1 1
1
2
3
4
7
4
57
7
6
Strategic Initiatives of Papua – Kep. Maluku Economic Corridor
Figure 3.G.23: Investment Mapping Based on Locus Industry In Corridor of Papua – Kep. Maluku
To Makassar & Surabaya
To Makassar & Surabaya
Masterplan P3EIPapua – Kepulauan Maluku Economic Corridor
173

To support all economic activities in Papua - Kep. Maluku Economic Corridor as described above, the required cross-sector infrastructure is as follow:• Improvement and expansion of Sentani Airport, Jayapura Airport, Mopah Airport, Merauke Airport,
Timika Airport, Sorong Airport, Pattimura Airport, Ambon Airport, and Morotai Airport;• Improvement and Expansion of Jayapura and Depapre Port, Manokwari Port, Sorong Port and T. Arar, and
Yos Sudarso Port in Ambon;• Construction of Trans-Papua Road;• Road Improvement for the Kumbe - Okaba - Nakias route (152 km), which are both Provincial and Local
Roads;• Steam Power Plant Construction: Papua - Jayapura, Papua - Timika, Maluku - Ambon and North Maluku;
Figure 3.G.24: Agglomeration of Investment Indication
No Code LocusMain
Economic Activity
StakeholderSupporting
Infrastructures
Investment Value
(IDr Trillion)
Investment Sharing towards Main
Economic Activities in All Corridors (%)
1 K4-(12)-1 Morotai Fishery Government, PrivateSea Port, Power & Energy, Water Utility, Production Facilities
30.54 74
2 K4-(6)-2 Halmahera Nickel SOE, Private - 83 45
3 K6-(12)-3 Ambon Fishery Government, SOE - 0.15 0.4
4 K6-(15)-4Sorong & Teluk Bintuni
Oil and Gas Private Sea Port, Road, Power & Energy 50 11
5 K6-(7)-5 Timika Copper Private Sea Port, Road, Power & Energy 197.20 100
6 K6-(11)-6 MeraukeFood Agriculture
Government, SOE, Private
Sea Port, Road and Bridge, Air Port, Power & Energy
80 83
7 K6-(23)-7 Trans PapuaAcross Sectors
Government - 50.00 3
In addition to investments associated with the main economic activities above, the Government is also committed to develop infrastructure in Papua - Kep. Maluku Economic Corridor. The following is an indication of the value of infrastructure investment for each type of infrastructure that will be done by the Government, SOE, and Mix.
200
150
100
50
0
13 0.2
0.1
259
32162
TotalOther Infrastructure
Water Utility
ICTAir PortsPower and Energy
Sea Ports
Infrastructure Investment Indication by Government, SOE, and Mix (IDR Tn)
57
Figure 3.G.25: Infrastructure
Investment Done by Government
Roads
Masterplan P3EIPapua – Kepulauan Maluku Economic Corridor
174

• Geothermal Power Plant Development in Merauke, Biak, Sorong, Jayapura, Andai, Nabire, North Maluku;• Development of a broadband backbone using fiber-optic submerged cable at the Ambon – Jayapura,
Sorong – Merauke, and Fak-Fak – Saumlaki links;• Development of infrastructure for a coastal fish breeding center (BBIP) at Bacan and a freshwater fish
breeding center (BBIAT) at Jailolo;• Development of Information and Communication Technology (ICT) system supporting network for the
Papua – Kep. Maluku Economic Corridor (Core Network, Network Backhaul, Network Access / Lastmile, Network Operation Center / NOC, Regional Center, Support Center, Service Control Sub-system, etc.)
The development of Papua - Kep. Maluku Economic Corridor is still focused on the development in their respective economic centers. However, the development of connectivity to some specific economic centers, namely sections Sofifi-Sorong and Sofifi-Ambon-Sorong-Manokwari-Bintuni Bay, and Timika need to be improved to support further economic development.
In the economic center in Ambon, it is necessary to develop downstream activities in export-oriented fishing industry that could open jobs opportunities through the creation of industrial value added activities. The economic center in Sofifi needs to be synergized with the potentials of the island of Halmahera as nickel mining and its industrial processing (smelter) centers. At the center for economy in Timika, regional service activities need to be developed, such as education and agriculture services, which can continue to grow longer than the current mining-based economic development in Timika. Meurake economic development center will focus on infrastructure development and connectivity support for MIFEE that can enable MIFEE to start production and expand its market.
The Papua - Kep. Maluku Economic Corridor spatial structure, up to 2015, will focus on the preparation of the connectivity of Sofifi – Ambon – Sorong – Manokwari – Timika. MIFEE in Merauke needs to be supported by an international infrastructure with the construction of air and sea ports near Merauke. Connectivity overland from Timika-Jayapura-Merauke should only be developed after each economic node matures. This is to offset the large amount of investment that must be spent in building this Jayapura-Merauke-Timika connectivity.
Development of Mamberamo area should have started already, because the Mamberamo river has very large potential for electricity generation to supply electricity demand from Papua and even Indonesia. Given that the costs required for the development of this area is very large, it may take the involvement of foreign financial resources. The government could start feasibility studies of development activities for the region, so as to make it easier to market the region to potential investors.
Masterplan P3EIPapua – Kepulauan Maluku Economic Corridor
175


4The Implementation & Governance of MP3EI
The function of coordination, control,
monitoring, and evaluation is the key to
successful implementation of MP3EI. For that,
the mechanism and structure of the strategic
unit entrusted with the responsibility to carry
out these functions are formulated.

A. Implementation Stage
MP3EI is a long term plan for the economic development of Indonesia. A gradual but continuous implementation is a key factor to the success of MP3EI. The implementation of MP3EI is planned in three phases up to year 2025, as follows: 4
As illustrated in Figure 4.1, each phase has a different focus. Phase 1 (2011 – 2015) will focus on theimplementation of MP3EI and the operationalization of the MP3EI implementation committee. The MP3EIimplementation committee will prepare action plans for debottlenecking of various pending regulations,licenses, incentives, as well as commencing the investment commitment (quick-wins). National connectivitywill be strengthened in this phase by assigning primary seaports and airports as international hubs in westernand eastern Indonesia. Human resources development, research facilities, and research activities will befurther developed as a starting point to increase the contribution of research and technology in supportingthe development of main economic activities in every corridor.
On a shorter term, MP3EI will be focusing on the implementation of various action plans which should becompleted by 2014. These action plans will ensure that initiative strategies are well implemented to accelerateand expand the economic development in the coming phases. The establishment and operationalization of aMP3EI Implementation Committee need to be prioritized along with the streamlining of various regulationsand accomplishing various investment projects in main economic activities by all related stakeholders.
Phase 2 (2016 – 2020) will focus on the acceleration of long term infrastructure development, enhancement of innovation to improve competitiveness, improvement of economic governance in various fields, and encouragement of industry which will create added value.
Phase 3 (2021 – 2025) will focus on the enhancement of national industries to compete globally, as well asthe implementation of high level technologies to achieve sustainable development.
Figure 4.1 Implementation Phases of MP3EI
Phase 1: Quick-wins Implementation
Phase 2: Strengthen Economic & Investment Bases
Phase 3: Sustainable Growth Implementation
• To establish and function MP3EI committee• Preparing Action Plans regarding
regulations, debottlenecking, permits, incentives, infrastructure development and implementation of investment commitments (quick-wins)
• The establishment of International hubs: seaports and airports
• Strengthening research and development institutions in every corridor
• Human resource development for the corridor’s main economic activities
• Accelerate the development of long-term infrastructure projects
• Strengthen the innovation ability to increase competitiveness of main economic activities
• Improve economic governance in various fields
• Expand the development of industries creating added value
• Strengthen industrial competitiveness to carry on global challenges
• High-technology adaptation for future sustainable development
2011 2015 2020 2025
Masterplan P3EI The Implementation & Governance of MP3EI
178
The Implementation & Governance of MP3EI

B. Improvement of Regulations and Permits
To attain the acceleration and expansion of the economic development in Indonesia, infrastructure and non–infrastructure development is needed. The implementation, establishment, and improvement of regulations and permits at the regional and national levels are the keys to success for MP3EI.
At the national level, improving cross sector regulations and streamlining permit applications are needed,especially those relating to spatial management, labor, taxation, and the ease of capital investment in Indonesia. At the local level, regulation and permit improvements are needed, especially those concerning the mineral and coal, forestry, and transportation (railways, shipping, aviation) sectors, as well as basic infrastructure.
Regulation and permit improvements should be implemented in order to achieve general objectives as follows:1. Accelerate the completion of law implementation regulation;2. Eliminate the overlap between existing regulations, both at the central and local government levels as well as
among sectors and institutions;3. Revise and establish required regulations to support MP3EI (such as export tax for several commodities);4. Provide incentives for main economic activities that is consistent with MP3EI strategies;5. Accelerate and simplify the process of issuing permits.
Table 4.1, Table 4.2, Table 4.3, Table 4.4 show several pending regulations, incentives, and permits which wereidentified during the preparation of MP3EI. The lists of regulations and permits is subject to change during thedevelopment of action plans.
National Regulations and Permits
The following table shows a list of national regulations and permits which must be revised to support the development of main economic activities:
Table 4.1 List of Laws
No Laws Responsible Institutions Time Target
1 Review Law and Government Regulations related to the application of communal land (tanah ulayat) as an investment component which will enable the land owners to gain higher economic benefits. (this review is needed to support the MIFEE program).
National Land Agency, Ministry of Forestry, Ministry of Home Affairs
December 2011
2 Revise Law No. 13 Year 2003 regarding Man Power → related to articles about employment contract, outsourcing, and severance pay.
Ministry of Manpower and Transmigration
January 2012
3 Revise Law No. 28 Year 2009 regarding Regional Tax and Retribution. Ministry of Finance, Ministry of Home Affairs
December 2011
4 Revise Law No. 4 Year 2009 on Mineral and Coal Mining regarding business uncertainty →business permits are usually given for a certain period of time (20+10+10 years), mechanisms to change a contract status from The Coal Mining Rights Agreement (Perjanjian Karya Pengusahaan Pertambangan Batubara/PKP2B) and working contracts to a business permit.
Note: Judicial review of Law No. 4 Year 2009 is being proposed to the Constitutional Court
Ministry of Energy and Mineral Resources
December 2011
5 Review Law No. 22 Year 2001 on Oil and Gas → Simplification of business patterns, mechanisms of the lex specialist for the application of taxation, the clarity of the national oil reserves asset management.
Note: change of oil and gas mind set from revenue based to economic growth based
Ministry of Energy and Mineral Resources
December 2011
6 In line with Law No. 1 Year 2009 on Aviation and Law No. 17 Year 2008 on Shipping, the separation between regulatory functions (Airport/Port Authority) and operating functions (Enterprise) has to be accelerated. In addition, based on the Law No. 23 Year 2007 on Railways, it is mandated that the Provider of Infrastructure and Rolling Stocks in Railways must be separated.
Ministry of Transportation December 2011
7 Revise Law No. 30 Year 2009 on Electricity to improve private sector participation in providing electricity. This revision is also needed to regulate the development of Renewable Energy (Energi Baru dan Terbarukan/EBT).
Ministry of Energy and Mineral Resources
December 2011
Masterplan P3EI The Implementation & Governance of MP3EI
179

Table 4.3 List of Presidential Regulations (Perpres), Presidential Decree (Keppres), Presidential Instruction (Inpres)
NoPresidential Regulations (Perpres), Presidential Decrees (Keppres),
Presidential Instructions (Inpres)Responsible Institutions Time Target
1 Issue Presidential Regulation following the revision of The Joint Ministries Decree regarding PSO, IMO and TAC of Railways.
Ministry of Transportation, The Ministry of National Development Planning, Ministry of Finance
December 2011
2 Revise Presidential Regulation No. 13 Year 2010 Concerning Government and Private Partnership in the Provision of Infrastructure.
The Coordinating Ministry for Economic Affairs, Ministry of Finance, Ministry of National Development Planning, Indonesia Investment Coordinating Board
July 2011
3 Issue Presidential Decree on the Establishment of Indonesian Tourism Promotion Board (BPPI) as it is mandated by Law No. 10 Year 2009 on Tourism.
Ministry of Culture and Tourism
May 2011
4 Issue regulations regarding Forestry Moratorium. The Coordinating Ministry for Economic Affairs, Cabinet Secretariat
July 2011
5 Issue regulations to encourage infrastructure development in the eastern part of Indonesia. Ministry of Public Work, Ministry of Transportation
December 2011
No Government Regulation Responsible Institutions Time Target
1 Revise Government Regulation No. 38 Year 2003. Tax Exemption for Imported Raw Material to be utilized in Defense Equipment Industries (originally exemption is given for ammunition, and weapon, and it is proposed to be extended to include ammunition, weapon, combat vehicles, aircraft, radar, ships, and optical equipment).
Ministry of Finance December 2011
2 Revise Government Regulation No. 18 jo. PP No. 85 Year 1995 which is to be harmonized with Law No. 32 Year 2009 on Environmental Management which distinguishes B3 waste (Toxic and Hazardous Materials) with special waste in order to facilitate the utilization of industrial wastes by industries as well as by waste producing industries in order to improve the competitiveness of domestic industries.
Ministry of Environment July 2011
3 Revise Government Regulation No. 69 Year 1999 on Food Labeling and Advertising related to the labeling of goods and packages in Indonesian language.
Ministry of Trade, Drug and Food Regulatory Agency
December 2011
4 Revise Government Regulation No. 62 Year 2008 on the Amendment of Government Regulation No. 1 Year 2007 concerning income tax facilities for investment “in specific sectors and or in specific areas” → the establishment of new sub-sectors according to the MP3EI priority which is worth to receive tax allowances (such as, the IRR for Coal Bed Methane gas will not be attractive without any incentives given).
Ministry of Finance December 2011
5 Revise PP No. 68 Year 1998 on Nature Conservation Area and Nature Reserve Area and followed by issuing Perpres regarding underground mining in order to increase geothermal investment.
Ministry of Forestry, Cabinet Secretariat
December 2011
6 Acceleration of draft of Government Regulation for Master Plan of National Tourism Development (Riparnas) 2010-2025.
Ministry of Culture and Tourism
June 2011
7 Prepare technical guidelines under The Ministry of Finance’s regulation to implement the Government Regulation No. 35 Year 2007 on Allocation of Enterprise Revenue in order to Improve Engineering, Innovation, and Diffusion Technology Capability Technical criteria and establishment governance need to be formulated and agreed by all shareholders.
Ministry of Finance, State Ministry of Research and Technology
December 2011
Table 4.2 List of Government Regulation
Masterplan P3EI The Implementation & Governance of MP3EI
180

Table 4.4 List of Ministerial Regulations
No Ministerial Regulations Responsible Institutions Time Target
1 Review Ministry of Finance Regulation (PMK) 67/10 regarding the stipulation of Export Duty for export commodities as well as refund mechanism for the development of relevant sectors through DIPA mechanism. Particularly related to the application of progressive Export Duty for Palm, Rubber, Cocoa, including its derivative industries (e.g. biodiesel industry); and integrated Value-Added Tax in order to avoid double taxation.
Ministry of Finance and Ministry of Trade
August 2011
2 Issue regulations regarding the implementation of DMO for coal, oil and gas supporting the downstream industries for rubber, oil palm, cocoa, and steel.
Ministry of Energy and Mineral Resources, Ministry of Agriculture
December 2011
3 Issue a technical regulation (Ministry of Finance Regulation) on the types of industries which are eligible for tax holiday (based on Government Regulation No. 94 Year 2010 regarding the Calculation of Taxable Income and Income Tax Payment in the Current Year).
Ministry of Finance August 2011
4 Issue technical regulation regarding the development and cultivation of Genetically Modified Organisms (GMO) for food crops and plantations (as the elaboration of Government Regulation No. 21 Year 2005 on Biosafety Genetically Engineered Products).
Ministry of Agriculture and Ministry of Environment
October 2011
5 Issue regulations regarding incentive/facilitation to accelerate investment in centers of agricultural production, animal husbandry, and fishery industries.
Ministry of Finance, Ministry of Agriculture And Ministry of Maritime Affairs and Fishery
August 2011
6 Revise Ministry of Finance Regulation No. 107 Year 2001 regarding the Import Duty exemption for Defense Equipment, which originally had to be supported by a data contract (RIB) but now it is proposed by simply giving a production plan approved by Ministry of Defense.
Ministry of Finance December 2011
7 Revise Ministry of Finance Regulation No. 241 Year 2010 regarding the Imposition of Import Duty for Raw Materials as well as Capital Goods for Manufacturing Pharmaceuticals, Cosmetics, Traditional Medicines, and Machinery Equipment Graphics Industry.
Ministry of Finance August 2011
8 Revise Ministry of Finance Regulation No. 140 Year 2007 regarding Temporary Import. It is proposed that the Import Duty exemption be applied to imported vehicles or specific goods that are used by foreign tourists during their stay and imported equipment that is used only for specific activities in relation to the MICE (meeting, incentive, convention, exhibition).
Ministry of Finance December 2011
9 Issue regulations regarding the utilization of abandoned land. National Land Agency, Ministry of Home Affairs, and Local Governments
July 2011
Masterplan P3EI The Implementation & Governance of MP3EI
181

Regulations and Permits in Regional Level
Below are several identified problems that need further actions in order to improve regulations andpermits at the regional level:1. Finalization of Provincial Spatial Planning (RTRW Propinsi) which will be used as a basis to overcome
potential land use conflict in utilization as forest, plantation, and mining area. BKPRN and Regional Governments should conclude the RTRWs by December 2011.
2. There are still challenges in the security sector which to an extent also concerns tourist destinations. To create a better and safer place for all, local governments need to improve safety and security capabilities through the implementation of strict rules and sanctions for crimes (Law Enforcement).
In addition, there are several other local regulations which have hampered investment activities (e.g.Regional Regulations on Retribution application in several local governments). These regulations need tobe reviewed and aligned to ensure that MP3EI is well implemented.
Masterplan P3EI The Implementation & Governance of MP3EI
182
Doc. Wijaya Karya

C. Monitoring and Evaluation
In order to ensure the implementation of various strategies of acceleration and expansion formulated under MP3EI, a special and dedicated committee will be formed. This committee will be chaired by the President of the Republic of Indonesia in order to enhance efficiency in coordinating, monitoring, evaluating, and taking strategic decisions to deal with various problems that arise during the implementation stage. This committee should comprise of competent stakeholders from the central government, local government and business. At the regional level, the Governor will play a key role in the implementation of regional development programs in each economic corridor. It is expected that Governors are able to establish and enhance the existing governor`s forums to create unity and harmony in inter or intra-economic corridors. This committee will be established under the Presidential Regulation/Decree.
The structure of MP3EI implementation committee will consist of an Implementation Team, Working Team, and a dedicated and professional Secretariat with the following explanations:
1. The Implementation Team shall consist of: Ministers, the Chairman of Non Ministerial Institutions, and representative agencies that shall contribute to the implementation of MP3EI. The Implementation Team is responsible for providing general guidance, approving strategic decisions, and solving strategic issues which may arise during the implementation of MP3EI.
2. The Working Team shall consist of High ranking officials (echelon 1), and key officials from relevant agencies who will be involved in the implementation of MP3EI action plans. The Working Team is responsible for coordinating the implementation of investment projects and infrastructure projects. This team, will be in collaboration with relevant agencies, and is also responsible for solving inter-ministerial problems, and ensuring government support for the implementation of MP3EI.
3. The Secretariat is a dedicated and full time supporting team that is responsible for developing a monitoring and coordinating system for progress of MP3EI’s implementation. The secretariat will actively support the Implementation Team and Working Team by providing them with a clear analysis and technical proposal to overcome the problems arising from daily monitoring.
Masterplan P3EI The Implementation & Governance of MP3EI
183

Acknowledgements
Our deepest appreciation is extended to all parties involved in the preparation of the Masterplan for Acceleration and Expansion of Indonesia Economic Corridor (Masterplan Percepatan dan Perluasan Pembangunan Ekonomi Indonesia - MP3EI). This MP3EI document would not have been possible without the contribution, support, sacrifice, dedication and commitment of various parties, namely:
• Coordinating Ministry for Economic Affairs• Ministry of National Development Planning / National Development Planning Agency• Ministry of Public Works• Ministry of Home Affairs• Ministry of Transportation• Ministry of Energy and Mineral Resources• Ministry of Trade• Ministry of Industry• Ministry of Finance• Ministry of Culture and Tourism• Ministry of Marine Affairs and Fisheries• Ministry of Agriculture• Ministry of Forestry• Ministry of Defense• Ministry of Communications and Information Technology • Ministry of National Education• Ministry of Research and Technology• Ministry of Manpower and Transmigration• Ministry of State-Owned Enterprise • Cabinet Secretariat• Indonesia Investment Coordinating Board• National Statistic Agency• National Land Agency• The Agency for The Assessment and Application of Technology• National Economic Committee• National Innovation Committee• House of Representatives • Local House of Representatives • Provincial Governments• Local Governments• Relevant State-Owned Enterprises• National Chamber of Commerce and Industry• Relevant Professional and Business Associations• Assistance Team for MP3EI Preparation• Steering Committee for MP3EI Preparation• Working Teams for MP3EI Preparation• Secretariat for MP3EI Preparation• The Boston Consulting Group and Other Experts
And other parties that cannot be mentioned one by one who have contributed in the preparation of this MP3EI document.
Masterplan P3EI Acknowledgements
184

Glossary
Masterplan P3EI Glossary
185
AACFTA ASEAN - China Free Trade Area
ADB Asian Development Bank
AFTA ASEAN Free Trade Area
Agglomeration The act or process of gathering into a mass
Agroindustry Industry dealing with the supply, processing and distribution of farm products
ALKI Alur Laut Kepulauan Indonesia; Indonesia Archipelagic Sea Lanes
APA World Port Association Port Authority World Port
APBN Anggaran Pendapatan Belanja Negara; State Budget
APEC Asia-Pacific Economic Cooperation
APK Angka Partisipasi Kasar; Gross Participatory Level
ASEAN The Association of Southeast Asian Nations
ASUH Aman Sehat Utuh dan Halal; Safe Healthy Intact and Halal
ATC Air Traffic Control
BBAU Business As Usual
BBIAT Balai Benih Ikan Air Tawar; Freshwater Fish Breeding Center
BBIP Balai Benih Ikan Pantai; Coastal Fish Breeding Center
Bioenergy Energy contained in living or recently living biological organisms, a definition which specifically excludes fossil fuels
Biogen A hypothetical protein assumed to be the basis of the formation and functioning of body cells and tissues
Bio-Plasma A combination of 12 Cell Salts. Bioplasma can be taken daily to keep our health and energy at their best.
Biotoxins A poisonous substance produced by living cells or organisms (technically, although humans are living organisms, man-made substances created by artificial processes usually are not considered toxins by this definition)
BKPRD Badan Koordinasi Penataan Ruang Daerah; Regional Spatial Planning Coordinating Agency
BKPRN Badan Koordinasi Penataan Ruang Nasional; National Spatial Planning Coordinating Agency
Bn Billion
Bpd Barrels per day
BPN Badan Pertanahan Nasional; National Land Agency
BPPI Badan Promosi Pariwisata Indonesia; Indonesia Tourism Promotion Board
BPPT Badan Pengkajian dan Penerapan Teknologi; Agency for the Assessment and Application of Technology
BPS Badan Pusat Statistik, National Statistic Agency
BRICS Brazil, Russia, India, China, South Africa
BULOG Badan Urusan Logistik; National Food Logistic Agency
BUMN Badan Usaha Milik Negara; State Owned Enterprise
Bureaucracy The body of officials and administrators, especially of a government or government department
CCabotage The transport of goods or passengers between two points in the same country by a vessel or an aircraft
registered in another country
CAGR Compound Annual Growth Rate
CAIT Clearance Approval for Indonesian Territory
Capital Investment The acquisition of a fixed asset that is anticipated to have a long life of use before it has to be replaced or repaired.

Masterplan P3EI Glossary
186
CATS Customs Advance Trade System
CBM Coal-Bed Methane
CBU Central Business Unit
Coal Bed Methane (CBM) Gas Form of natural gas extracted from coal beds. In recent decades it has become an important source of energy in United States, Canada, and other countries
Comparative advantage A situation in which a country, individual, company or region can produce a good at a lower opportunity cost than a competitor
CPE Customer Premises Equipment
CPO Crude Palm Oil
CSR Corporate Social Responsibility
Customs exit Exit tax for goods
CV Caloric Value
DDDI Domestic Direct Investment
Dependency Ratio An age-population ratio of those typically not in the labor force (the dependent part) and those typically in the labor force (the productive part)
DMO Domestic Market Obligation
DWT Dead Weight Tonnage
EEBT Energi Baru dan Terbarukan; New and Renewable Energy
Entrance Fee Entrance tax for goods
EOR Enhanced Oil Recovery
FFDI Foreign Direct Investment
FFB Fresh Fruit Bunches
Fitch's International ratings agency providing issuer and bond ratings, and research banks, corporations, sovereigns, structured and municipal finance
Foreign Investment The net inflows of investment from other countries or foreign investors
FS Feasibilty Studies
GG-20 A group of finance ministers and central bank governors from 20 major economies: 19 countries
plus the European Union, which is represented by the President of the European Council and by the European Central Bank
Gapoktan Gabungan Kelompok Tani; Association of Farmer Groups
Gas Fuel Fuel from gas sources
Gasification Process that converts carbonaceous materials, such as coal, petroleum, biofuel, or biomass, into carbon monoxide and hydrogen by reacting the raw material at high temperatures with a controlled amount of oxygen and/or steam
GDP Gross Domestic Product, the market value of all final goods and services produced within a country in a given period
Geoeconomic The study of the spatial, temporal, and political aspects of economies and resources
Geostrategic A type of foreign policy guided principally by geographical factors as they inform, constrain, or affect political and military planning
GMO Genetically Modified Organism
GMP Good Manufacturing Practice
GRDP Gross Regional Domestic Product
Greater Jakarta Jabodetabek (Jakarta, Bogor, Depok, Tangerang, Bekasi) Region
Green tourism An initiative designed to assist tourism operators to assess and reduce their environmental impact
GT Gross Tonnage

Masterplan P3EI Glossary
187
HHA Hutan Alam; Natural Forest
HACCP Hazard Analysis Critical Control Point
HDI Human Development Index
HEPP Hydroelectric Power Plant
HTI Hutan Tanaman Industri; Industrial Forest Estates
HTR Community Plantation Forest
IICT Information Communication Technology
IMO International Maritime Organization
Import duty tariff Tariff levied to imported goods
Inaportnet Part of an electronic customs system or the National Single Window (NSW) to launch theflow of goods
Indonesian National Standard (SNI)
The only nationally accepted standards in Indonesia. SNI formulated by the Technical Committee and confirmed by National Standardization Agency of Indonesia (BSN)
Insemination The process by which sperm is placed into the reproductive tract of a female by using means other than sexual intercourse or natural insemination. In humans, it is used as assisted reproductive technology, using either sperm from the woman’s male partner or sperm from a sperm donor (donor sperm) in cases where the male partner produces no sperm or the woman has no male partner
IPHHK Industri Primer Hasil Hutan Kayu; Forest Product Utilization
IPTEK Science and Technology
ISO International Organization for Standardization
IUP Izin Usaha Pertambangan; Mining Business License
JJBIC Japan Bank for International Cooperation
JIDES Jaringan Irigasi Desa; village irrigation networks
JITUT Jaringan Irigasi Teknis Usaha Tani; Technical Irrigation Farming
JSS Jembatan Selat Sunda; Sunda Straits Bridge
KKBE Knowledge Based Economy; the use of knowledge technologies (such as knowledge engineering and
knowledge management) to produce goods and services
KE Koridor Ekonomi; Economic Corridor
KFx South Korean project for development of an indigenous fighter aircraft
KKP Kementerian Kelautan dan Perikanan; Ministry of Maritime Affairs and Fisheries
KSN Kawasan Strategis Nasional; National Strategic Zones
KSPP Klaster Sentra Produksi Pertanian; Clusters of Agricultural Production Center
LLaterite iron Extensive chemical weathering of basalts during a period of volcanic activity
Lateritik Low grade iron ore
LEISA Low External Input Sustainable Agriculture
Lex specialist Specific law prevails over general law
Literacy rate The percentage of the population 15 years and older who can read and write
LME Large Marine Ecosystem
LNG Liquid Natural Gas
Lokus A center or focus of great activity or intense concentration

Masterplan P3EI Glossary
188
MMatte A mixture of a metal with its sulfides, produced by smelting the sulfide ores of copper, lead, or nickel
MICE Meeting, Incentive, Convention, Exhibition
Micro credit Schemes for extending loans to small businesses, farmers and other borrowers who cannot get access to normal bank loans
MID Mobile Internet Device
MIFEE Merauke Integrated Food & Energy Estate
Minapolitan The concept of development of marine and fishery based on regional economic management with the motor of marine and fishery sector
Mmcfd Millions of cubic feet per day
MMSCFD Million Metric Standard Cubic Feet per Day
MMSTB Million Metric Stock Tank Barrels
MMSTB Million Stock Tank Barrels
Mn Million
MnT Million Ton
Monopsony A Form of imperfect Competition where a single buyer faces many sellers
Moody's Independent provider of credit ratings based in USA
MP3EI Masterplan Percepatan dan Perluasan Pembangunan Indonesia; The Masterplan for Acceleration and Expansion of Indonesia Economic Development
MRT Mass Rapid Transportation
MSTB Million Stock Tank Barrels
MW Megawatt
NNOC Network Operation Centre
NSW National Single Window
OODA Official Development Assistance
OEM Original Equipment Manufacture
OSS One Stop Service
PPellet Small particles produced by compressing the original material
PFAD Palm Fatty Acid Distilate
Ph.D Philosophy Doctor
PLTA Pembangkit Listrik Tenaga Air; Hydro-electric Power Plant
PLTGU Pembangkit Listrik Tenaga Gas dan Uap; Gas and Coal fired steam power plant
PLTS Pembangkit Listrik Tenaga Surya; Solar power plant
PLTU Pembangkit Listrik Tenaga Uap; Coal fired steam power plant
PMK Peraturan Menteri Keuangan; Ministry of Finance Regulation; Regulation that is issued by Ministry of Finance
PNPM MANDIRI Program Nasional Pemberdayaan Masyarakat MANDIRI; National Community Empowerment Program
PP Peraturan Pemerintah; Government Regulation
PPI Pusat Pelelangan Ikan; Fish Auction Center
PPP Public Private Partnership
Presidential Decree A formal and authoritative order, especially one having the force of law (President)
Production chain Process of creating a product: all the different stages in the process of making, distributing, and selling a product or service
Propellant An explosive charge that propels a rocket
PSC Production Sharing Contract

Masterplan P3EI Glossary
189
PSFP Public Ship Financing Program
PSO Public Service Obligation
QQCD Quality, Cost, and Delivery
RRAN-GRK Rencana Aksi Nasional – Gas Rumah Kaca; National Action Plan-Green House Effect
RBD Refined Bleached Deodorized
REDD+ Reducing Emission From Deforestation and Degradation to include the role of conservation, sustainable management of forests and enhancement of forest carbon stocks
Refinery An industrial plant for purifying a crude substance, such as petroleum or sugar
Render farm Database storage
Recession Significant decline in activity across the economy, lasting longer than a few months
Revitalization Process, how to, act on or reactivate
Ripparnas Rencana Induk Pembangunan Kepariwisataan Nasional; National Tourism Development Master Plan
RKP Rencana Kerja Pemerintah; Government Work Plan
ROI Return on Investment; The earning power of assets measured as the ratio of thenet income (profit less depreciation) to the average capital employed (or equity capital) in a company or project
RPJMN Rencana Pembangunan Jangka Menengah Nasional; National Mid-Term Development Plan
RPJPN Rencana Pembangunan Jangka Panjang Nasional; National Long-Term Development Plan; long-term planning document prepared by National Planning Agency (BAPPENAS)
RTRW Rencana Tata Ruang Wilayah; Regional/Local Spatial Plan
RTRWN Rencana Tata Ruang Wilayah Nasional; National Spatial Plan
RUU Rancangan Undang-Undang; Draft Law
SSEZ Special Economic Zone
SINAS Sistem Inovasi Nasional; National Innovation System; the network of institutions in the public and private sectors whose activities and interactions initiate, import, modify and diffuse new technologies
SISLOGNAS Sistem Logistik Nasional; National Logistic System
SISTRANAS Sistem Transportasi Nasional; National Tranportation System
Slab A flat-shaped semifinished rolled metal ingot with a width not less than 250 mm (10 in.) and a cross-sectional area not less than 105 cm2 (16 in.2)
SLoC Sea Lane of Communication
SME Small and Medium Enterprises
SNI Standar Nasional Indonesia; Indonesia National Standard
SOE State Owned Enterprise
SOP Standard Operating Procedure
South to South The exchange of resources, technology, and knowledge between developing countries, also known as countries of the global South
SPBE Stasiun Pengisian Bulk Elpiji; Bulk LPG Filling Station
Spill over effect Impact/externalities that occur from economic activities
Sponge iron Iron in porous or powder form made without fusion by heating iron ore in a reducing gas or with charcoal
SPPBE Stasiun Pengangkutan dan Penyimpanan Bulk Elpiji; Bulk LPG Transport and Storage Station
Standard & Poor's Independent provider of credit ratings based in USA
Standardization The process of developing and implementing technical standards
Subsidy Financial assistance given by one person or government to another
Sustainability The capacity to endure
SW Software

Masterplan P3EI Glossary
190
TTAC Track Access Charges
Tanah ulayat Communal land
Tax Allowance Part of the income which a person is allowed to earn and not pay tax on
Tax Holiday A temporary reduction or elimination of a tax
Tax Relief A reduction in the amount of tax a person or company has to pay
Taxation The act of laying a tax, or of imposing taxes, as on the subjects of a state, by government, or on the members of a corporation or company, by the proper authority
TCF Trillion Cubic Feet
Technopark An area with a collection of buildings dedicated to scientific research on a business footing
Teledensity The number of landline telephones in use for every 100 individuals living within an area
TKDN Level Content of the Interior
Tn Trillion
TSCF Trillion Standard Cubic Feet
Two Step Loan A loan that have an interest rate that is fixed for the first period of the loan then adjusted to reflect prevailing market rates
UUI User Interface
UNCTAD United Nations Conference on Trade and Development
UNEP United Nations Environmental Programme
USDA United States Department of Agriculture
VValue Added Tax Indirect tax which is imposed on goods and services at each stage of production, starting from raw
materials to final product
Visa on Arrival A visa for leisurely visit only and could be obtained at the designated Airport/Seaport on entry into a country
Visa on Board Immigration document processing services in the form of Visa on Arrival given in the plane
VLCC Very Large Crude Cruiser
WWEF World Economic Forum
WG Working Group
WTO World Trade Organization
WUP Wilayah Usaha Pertambangan; a mining business license area
ZZone An area or a region distinguished from adjacent parts by a distinctive feature or characteristic

AppendixList of Identified Infrastructure Investment in Sumatra Economic Corridor
No Type of Infrastructure Project Name Investment
(IDR Tn) Commencement Completion Location
1 Other Sunda Strait Bridge 150,000 2011 2025Lampung &
Banten
2 Road Trans Sumatra 1,580 km 55,300 2012 Sumatra
3 RailwayRailway development from Kertapati-Simpang-Tanjung Api-api
25,000 2012 2015 South Sumatra
4Information and Communication Technology
Development of backhaul network and management
15,100 2012 2014 Sumatra
5Information and Communication Technology
Development of device for the end-user consumer
9,870 2012 2014 Sumatra
6Information and Communication Technology
Rehabilitation of device for end-user consumer 9,490 2012 2014 Sumatra
7 Toll Road Pekanbaru-Kandis-Dumai (135 km) 8,446 2011 2017 Riau
8 Toll RoadDevelopment of Access Toll Road in Sumatra (Lampung) and Development of Toll Road from Bandar Lampung - Terbagibesar
8,200 2014 2018 Lampung
9Information and Communication Technology
Development of national backbone (Palapa Ring) based on active network sharing
7,510 2012 2014 Sumatra
10 Toll Road Medan - Kualanamu - Tebing Tinggi (60 km) 6,700 2010 2016 North Sumatra
11Information and Communication Technology
Rehabilitation of backhaul network and management
5,440 2012 2014 Sumatra
12 RailwayDevelopment of railway from Sigli-Bireun-Lhokseumawe (172 km)
5,175 2011 2015 Aceh
13Information and Communication Technology
Rehabilitation of national backbone (Palapa Ring) based on active network sharing
2,260 2012 2014 Sumatra
14 RailwayDevelopment of railway from Araskabu - Kualanamu Airport (9 km)
2,150 2013 North Sumatra
15 Road Provincial Road from Berbak - Ujung Jabung 1,400 2015 2020 Jambi
16 Toll RoadMedan-Kuala Namu-Tebing Tinggi (60 km)-and Medan-Kuala Namu-Lubuk Pakam
1,306 2010 2016 North Sumatra
17 OtherDevelopment of Karian Dam (capacity 14.6 m3/sec)
1,300 2010 2016 Banten
18 Port Dumai Port expansion 1,250 2012 2014 Riau
19 Port Lhokseumawe Port expansion 1,250 2012 2014 Aceh
GOVERNMENT
Masterplan P3EI Appendix
191

20 RoadNational Road development from Pekanbaru - Buton phase I. Package VI: Simpang Pusako - Buton
1,111 2013 2014 Riau
21 Toll Road Cilegon – Bojonegara (15.69 km) 920 2015 2018 Banten
22 Port Belawan Port expansion 830 2012 2014 North Sumatra
23 RoadStrategic National Road development from Pekanbaru - Buton and Sungai Tonggak - Simpang Pusako (15.5 km)
822 2012 2014 Riau
24 Railway Coal Railway from South Sumatra to Lampung 802 2013South Sumatra -
Lampung
25 Toll Road Palembang-Indralaya (22 km) 624 2011 2014 South Sumatra
26 Road Road development in Merangin Regency 602 2015 2019 Jambi
27 Port Development of Bakaheuni Krib on the east side 550 2013 2014 Lampung
28 Port Development of Tanjung Api-api Port 516 2012 2014 South Sumatra
29 RoadNational Road development from Pekanbaru - Buton phase I. Package III: Buatan - Dayun (22.5 km)
480 2012 2015 Riau
30 Power & Energy PLTA Simpang Aur (2 x 6 MW) and (2 x 9 MW) 450 2012 2014 Bengkulu
31 Port Development of Bakaheuni Krib on the west side 450 2013 2014 Lampung
32 RoadNational Road development from Pekanbaru - Buton phase I. Package IV: Dayun - Sungai Tonggak (20 km)
427 2012 2015 Riau
33 RailwayRailway development Bandar Tinggi-Kuala Tanjung (18,5 km).
400 2012 2013 North Sumatra
34 RoadRoad improvement Tebing Tinggi - Kisaran - Rantau Prapat - Riau - (326.71 km)
365 2011 2013 North Sumatra
35 RoadAccess Road Kualanamu (14 km) dan Fly Over (2 bridges 1 km)
355 2011 2014 North Sumatra
36 RoadNational Road from Pekanbaru - Buton and Maredan - Buatan (16 km)
342 2012 2014 Riau
37 RoadNational Road from Pekanbaru - Buton phase I. Package VII: Simpang Pusako - Teluk Mesjid (15.69 km)
321 2012 2014 Riau
38 Other Development of 5,000 GT Ferry - 2 units 320 2012 2013 Banten
39 RoadRoad improvement Sorek-Sp.Japura-Rengat-Rumbai Jaya-Kuala Enok (238 km)
295 2011 2014 Riau
40 Port Panjang Port expansion 282 2015 Lampung
41 RoadRoad improvement Wiralaga – Sp.Pematang – (P) (40 Km)
280 2011 2013 South Sumatra
42 RoadProvincial Road development Sp.Lago -Sp. Buatan-Siak Sri Indrapura-Port Buton (91.25 km)
274 2011 2015 Riau
43 Port Pekanbaru Port expansion 265 2012 2014 Riau
44 RoadRoad improvement Lima Puluh - Pematang Siantar - Kisaran (64.15 km)
225 2012 2015 North Sumatra
No Type of Infrastructure Project Name Investment
(IDR Tn) Commencement Completion Location
Masterplan P3EI Appendix
192

45 RoadRoad improvement Pangkalan Heran - Siberida (51 km) and Siberida - Jambi (49 km)
211 2011 2014 Riau
46 Other Land acquisition (2,000 Ha) 200 2013 Jambi
47 Other Development of Vocational High School 200 2013 2014 Jambi
48 Port Merak breakwater development (south side) 200 2013 2015 Banten
49 RoadRoad development Sp. Batang-Lb.Gaung (19.5 km)
195 2011 2015 Riau
50 Port Development of Merak Dock VI 180 2012 2014 Banten
51 Port Development of Bakauheni Dock VI 155 2012 2014 Lampung
52 RoadRoad improvement/layering: Lima Puluh - Simpang Inalum (22 km)
154 2012 2013 North Sumatra
53 RailwayRailway development Sei Mangke - Kota Lima Puluh
150 2011 2013 North Sumatra
54 Road Belawan Access Road development (15 km) 150 2011 2012 North Sumatra
55 Road Road widening: KISM - Limapuluh (10 km) 140 2012 2012 North Sumatra
56 PortTemporary Working Units for construction of Outer Islands seaport facilities
138 2011 2014 Riau Islands
57 RoadRoad improvement Muaro Jambi-Muara Sabak Port (43 km)
129 2011 2014 Jambi
58 Road Provincial Road Dumai-Pelintung (25 km) 125 2011 2015 Riau
59 PortTemporary Working Units for construction of Cerocok Painan seaport facilities
118 2011 2014 West Sumatra
60 PortTemporary Working Units for construction of Dumai passenger dock
115 2011 2014 Riau
61 RoadNational Road improvement Serdang - Bojonegara - Merak (35 km)
105 2011 2014 Banten
62 RoadRoad improvement (rigidpavement 21 km) Sp Kulim-Plb.Dumai (44.37 km), Panjang ruas 48 km
105 2011 2014 Riau
63 RoadRoad widening to tourism area (30 km) (Bangka Island destination development)
100 2011 2015Bangka Belitung
Islands
64 OtherDevelopment of infrastructure and facilities (procurement of 2 crossing ships) Merak - Bakaheuni ferry ports
2,237 2011 2014 Banten, Lampung
No Type of Infrastructure Project Name Investment
(IDR Tn) Commencement Completion Location
Masterplan P3EI Appendix
193

No Type of Infrastructure Project Name Investment
(IDR Tn) Commencement Completion Location
1 Power & Energy PLTU Mulut Tambang Riau 2x300 MW 9,000 2011 2014 Riau
2 Power & Energy PLTU Mulut Tambang 4x150 MW Sumsel 8,400 2011 2016 South Sumatra
3 Power & Energy PLTU Mulut Tambang Sumsel 2x300 MW 7,800 2011 2015 South Sumatra
4 Power & Energy PLTP Sarulla-1 110 MW 6,000 2012 2015 North Sumatra
5 RailwayRailway development from Tj.Enim – Lampung dan Tj.Enim-Kertapati, Increase capacity from 10 million tons to 22.7 million tons/ year
4,000 2010 2014South Sumatra,
Lampung
6 Power & Energy PLTP Lumut Balai Unit 1 & 2 (2x55 MW) 3,484 2007 2014 South Sumatra
7 Power & Energy PLTP Lumut Balai Unit 3 & 4 (2x55 MW) 3,388 2011 2015 Sumatra Selatan
8 Power & EnergyElectricity transmission development at Riau Province (15 spots)
3,119 2011 2015 Riau
9 OtherAddition of vessel fleet Ferry Roro Merak - Bakauheni (13 Units)
3,017 2010 2013Banten - Lampung
10 Power & Energy PLTA Asahan, capacity of 2x87 MW (174MW) 2,880 2011 2014 North Sumatra
11 Power & Energy PLTU Banjarsari 2x100 MW 2,800 2011 2013 South Sumatra
12 Power & Energy PLTU Riau (Tenayan) 2 x 100 MW 2,800 2010 2013 Riau
13 PortInfrastructure and utility capacity increase; including power plant, port, dan water supply
2,790 2011 2013 Banten
14 Power & Energy PLTP 2x55 MW Ulubelu Unit 3 & 4 2,640 2010 2014 Lampung
15 Power & EnergyElectricity transmission development at North Sumatra Province (17 spots)
2,612 2011 2015 North Sumatra
16 Power & EnergyAcceleration of high-scale hydro development (2x87 MW), Porsea North Sumatra (Asahan 3) - 30 Ha
2,610 2011 2013 North Sumatra
17 Power & Energy Power plant and steam 2,400 2011 2013 South Sumatra
18 Power & EnergyElectricity transmission development at West Sumatra Province (6 spots)
2,155 2011 2014 West Sumatra
19 Power & EnergyElectricity transmission development at Jambi Province (7 spots)
1,792 2011 2015 Jambi
20 Power & Energy PLTP Hululais Kapasitas 2x55 MW 1,760 2008 2014 Bengkulu
21 Power & Energy PLTP Sungai Penuh Kapasitas 2x55 MW 1,760 2008 2014 Jambi
22 Power & Energy PLTP 2x55 MW Ulubelu Unit 1&2 1,760 2007 2012 Lampung
23 PortSector Private development at Kualanamu Airport
1,600 2007 2012 North Sumatra
24 Power & EnergyElectricity transmission development at Nangroe Aceh Darussalam Province (16 spots)
1,495 2011 2014 Aceh
25 Power & EnergyElectricity transmission development at Riau and Riau Islands Province (10 spots)
746 2012 2015 Riau, Riau Islands
26 Power & EnergyElectricity transmission development at Lampung Province (11 spots)
589 2011 2015 Lampung
27 Power & Energy Project Sibayak 3 554 2012 2015 North Sumatra
28 Power & Energy PLTU Peranap Kapasitas : 2x10 MW 392 2012 2014 Riau
SOE
Masterplan P3EI Appendix
194
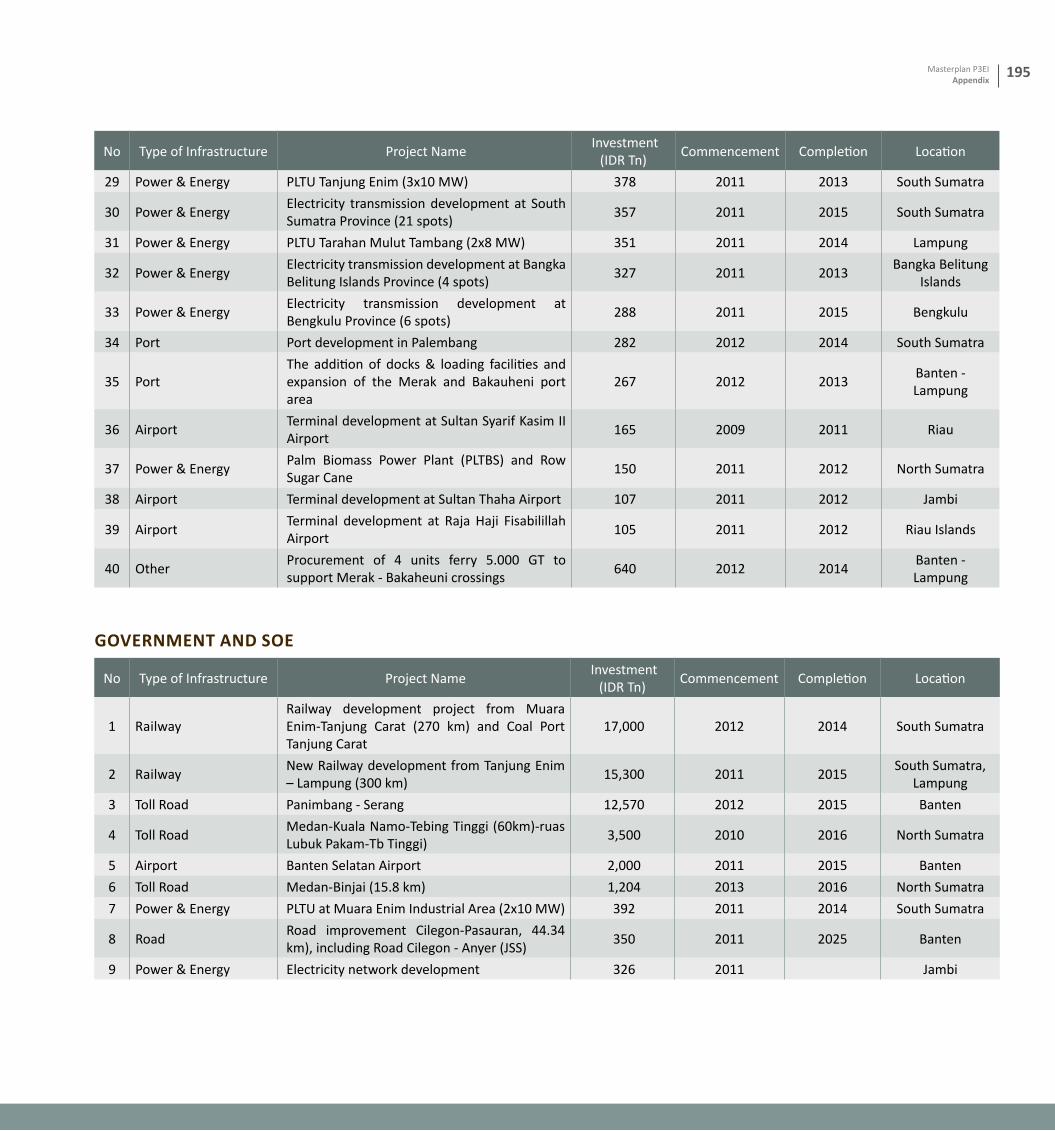
No Type of Infrastructure Project Name Investment
(IDR Tn) Commencement Completion Location
1 RailwayRailway development project from Muara Enim-Tanjung Carat (270 km) and Coal Port Tanjung Carat
17,000 2012 2014 South Sumatra
2 RailwayNew Railway development from Tanjung Enim – Lampung (300 km)
15,300 2011 2015South Sumatra,
Lampung
3 Toll Road Panimbang - Serang 12,570 2012 2015 Banten
4 Toll RoadMedan-Kuala Namo-Tebing Tinggi (60km)-ruas Lubuk Pakam-Tb Tinggi)
3,500 2010 2016 North Sumatra
5 Airport Banten Selatan Airport 2,000 2011 2015 Banten
6 Toll Road Medan-Binjai (15.8 km) 1,204 2013 2016 North Sumatra
7 Power & Energy PLTU at Muara Enim Industrial Area (2x10 MW) 392 2011 2014 South Sumatra
8 RoadRoad improvement Cilegon-Pasauran, 44.34 km), including Road Cilegon - Anyer (JSS)
350 2011 2025 Banten
9 Power & Energy Electricity network development 326 2011 Jambi
GOVERNMENT aNd SOE
29 Power & Energy PLTU Tanjung Enim (3x10 MW) 378 2011 2013 South Sumatra
30 Power & EnergyElectricity transmission development at South Sumatra Province (21 spots)
357 2011 2015 South Sumatra
31 Power & Energy PLTU Tarahan Mulut Tambang (2x8 MW) 351 2011 2014 Lampung
32 Power & EnergyElectricity transmission development at Bangka Belitung Islands Province (4 spots)
327 2011 2013Bangka Belitung
Islands
33 Power & EnergyElectricity transmission development at Bengkulu Province (6 spots)
288 2011 2015 Bengkulu
34 Port Port development in Palembang 282 2012 2014 South Sumatra
35 PortThe addition of docks & loading facilities and expansion of the Merak and Bakauheni port area
267 2012 2013Banten - Lampung
36 AirportTerminal development at Sultan Syarif Kasim II Airport
165 2009 2011 Riau
37 Power & EnergyPalm Biomass Power Plant (PLTBS) and Row Sugar Cane
150 2011 2012 North Sumatra
38 Airport Terminal development at Sultan Thaha Airport 107 2011 2012 Jambi
39 AirportTerminal development at Raja Haji Fisabilillah Airport
105 2011 2012 Riau Islands
40 OtherProcurement of 4 units ferry 5.000 GT to support Merak - Bakaheuni crossings
640 2012 2014Banten - Lampung
No Type of Infrastructure Project Name Investment
(IDR Tn) Commencement Completion Location
Masterplan P3EI Appendix
195

List of Identified Infrastructure Investment in Java Economic Corridor
No Type of Infrastructure Project Name Investment
(IDR Tn) Commencement Completion Location
1 RailwayDevelopment of North-South MRT Phase I and II
40,000 2012 2016 DKI Jakarta
2 Water UtilityDevelopment of Citarum Water Management Program
10,220 2011 2015 West Java
3 RailwayRailway development Manggarai-Bekasi double double track, Bekasi-Cikarang electrification
8,300 2011 2019DKI Jakarta, West
Java
4 Airport Kertajati Airport development 8,299 2007 2020 West Java
5 Water UtilitySPAM Jakarta, Bekasi, and Karawang (Kanal Tarum Barat 5,000 l/s)- BOT
5,200 2011 2014DKI Jakarta, West
Java
6 Other Development of Kanal Banjir Timur (23.5 km) 4,900 2011 2015 DKI Jakarta
7 Water Utility SPAM Regional Jatigede (6,000 l/s)-BOT 3,800 2015 2025 West Java
8 Power & EnergyTransmission development at Jakarta until 2015 (405 kms)
2,697 2012 2015 DKI Jakarta
9 Port Lamongan Port expansion 2,216 2015 East Java
10 Water Utility Umbulan water supply (4000 l/s) 1,900 2011 2014 East Java
11 RailwaySurabaya innercity railway development (Surabaya - Pasar Turi-Bandara Juanda 26 km track-elevated)
760 2011 2015 East Java
12 RailwayRailway development as Lapindo impact subtitute (25 km)
760 2011 2015 East Java
13 Railway Development of Surabaya innercity (50 km) 760 2015 East Java
14 RailwayDoubletrack and electrification development Duri-Tangerang (20 km)
665 2011 2015Banten,
Tangerang
15 Water Utility Development of Jati Barang Dam (1,050 l/s) 559 2011 2014 Central Java
16 Water UtilitySPAM Kabupaten Tangerang (900 l/s)- Concession
503 2011 2014 Tangerang
17 RailwayDevelopment of double track and electrification Serpong-Maja-Rangkasbitung (32 km)
487 2011 2020Banten,
Tangerang
18 Water Utility Development of Sentosa Dam (1,400 l/s) 457 2015 2025 West Java
19 Water Utility SPAM West Semarang City (1,050 l/s) 443 2011 2014 Central Java
20 Port Probolinggo port authority development 406 2011 2014 East Java
21 RailwayElectrification development Padalarang- Bandung-Cicalengka (45 km track), Kiara Condong-Cicalengka (doubletrack 22 km track)
304 2012 2019West Java, Bandung
22 RailwayElectrification development Citayam-Nambo 20 km track (reactivation and betterment (revitalization))
304 2011 2014 West Java
23 Water Utility SPAM Kota Bekasi (450 l/s)-Concession 298 2011 2014 West Java
24 Water Utility SPAM Kota Bekasi (300 l/s)-Concession 224 2011 2014 West Java
GOVERNMENT
Masterplan P3EI Appendix
196

25 Water UtilityDevelopment of Cibatarua, Cilaki, dan Cisangkuy (1,400 l/s)
163 2015 2025 West Java
26 Port Branta Port expansion 158 2011 2014 East Java
No Type of Infrastructure Project Name Investment
(IDR Tn) Commencement Completion Location
No Type of Infrastructure Project Name Investment
(IDR Tn) Commencement Completion Location
1 Tollroad
Development of six Jakarta inner city toll road (Kemayoran-Kp.Melayu; Sunter-Rawa Biaya-Batu Ceper; Pasar Minggu- Casablanca; Sunter-Pulo Gebang-Tambelang; Ulujami-Tanah Abang; Duri Pulo- Kp . Melayu)
40,026 2011 2014 DKI Jakarta
2 Power & EnergyDevelopment of new PLTU of Central Java 2,000 MW
26,000 2013 2019 Central Java
3 Port Kali Baru Utara dock development (Phase 1) 22,000 2011 2019 DKI Jakarta
4 Tollroad Probolinggo - Banyuwangi (215 Km) 13,960 2011 2019 East Java
5 Power & Energy PLTU Pelabuhan Ratu 1,050 MW 13,650 2011 2011 West Java
6 Power & Energy PLTU Indramayu Baru 1,000 MW 13,000 2011 2014 West Java
7 Power & Energy PLTU Indramayu Baru 1,000 MW 13,000 2012 2016 West Java
8 Power & Energy PLTU Jawa Barat Baru 1,000 MW 13,000 2015 2019 West Java
9 Power & Energy PLTU Indramayu 990 MW 12,870 2011 2011 West Java
10 Power & Energy PLTU Teluk Naga/Lontar 945 MW 12,285 2011 2011 Banten
11 Power & Energy PLTU Bojanegara 1,500 MW 12,000 2012 2015 Banten
12 Power & Energy PLTGU Tuban/Cepu 1,500 MW 12,000 2015 2018 East Java
13 Port
Tanjung Priok Port expansion through Kalibaru (warehouse development, loading dock development, strengthening and improvement of yard, strengthening and installation Luffing Rail Gantry Crane
11,700 2011 2014 DKI Jakarta
14 Road Waru-Wonokromo-Tj.Perak (18.6 km) 11,110 2011 2015 East Java
15 RailwayMonorail development: Green Line (14.7 km) with 15 stations
9,100 2011 2014 DKI Jakarta
16 Power & Energy PLTU Tj. Awar-awar 700 MW 9,100 2011 2013 East Java
17 Power & Energy PLTU Paiton 660 MW 8,580 2011 2011 East Java
18 Power & Energy PLTU Cilacap Baru/Adipala 660 MW 8,580 2011 2014 Central Java
19 Power & Energy PLTU Pacitan 630 MW 8,190 2011 2011 East Java
20 Power & Energy PLTU Suralaya 625 MW 8,125 2011 2011 Banten
21 PortHarbor pond dredging and development of container terminals at Teluk Lamong (Tanjung Perak Port expansion)
8,000 2011 2015 East Java
22 Tollroad Bekasi-Cawang-Kp. Melayu (21.04 km) 7,200 2011 2017DKI Jakarta, West
Java
SOE
Masterplan P3EI Appendix
197

23 Power & Energy PLTS Upper Cisokan Pump Storage 1,000 MW 6,500 2011 2014 West Java
24 TollroadSemarang-Ungaran (Section I) ; Ungaran-Bawen-Solo (Section II-V), Total 72 km
6,200 2011 2014 Central Java
25 Power & Energy PLTU Bojonegara 750 MW 6,000 2015 2018 Banten
26 Road Pasuruan - Probolinggo (45.32 Km) 5,960 2011 2018 East Java
27 Power & Energy PLTGU Muara Tawar Add-On 3.4 700 MW 5,600 2011 2016 West Java
28 Power & EnergyTransmission development at West Java until 2015 (2,337 kms)
5,242 2011 2015 West Java
29 Tollroad Depok-Antasari (21.55 km) 4,800 2008 2013DKI Jakarta, West
Java
30 RoadRoad development Cimanggis-Cibitung (25.39 km)
4,400 2011 2025 West Java
31 Power & Energy PLTGU Priok Extension 500 MW 4,000 2011 2011 DKI Jakarta
32 Power & Energy PLTG Grati 800 MW 4,000 2015 2019 East Java
33 Tollroad Tol Access development Tanjung Priok (17 km) 3,900 2011 2014 DKI Jakarta
34 Power & EnergyTransmission development at Central Java until 2015 (1,764 kms)
3,752 2011 2015 Central Java
35 Airport Soekarno-Hatta Airport expansion 3,640 2011 2013Banten,
Tangerang
36 Tollroad Cengkareng - Kunciran (15.22 km) 3,500 2011 2025 DKI Jakarta
37 Power & Energy PS Grindulu PS 500 MW 3,250 2015 2018 East Java
38 Power & Energy PS Grindulu PS 500 MW 3,250 2014 2019 East Java
39 OtherAddition of Ferry Roro LDF (Long Distance Ferrys) 10 units
3,188 2012 2013DKI Jakarta,
Central Java, East Java
40 Power & Energy PLTG Sunyaragi 600 MW 3,000 2015 2018 West Java
41 Tollroad Pandaan-Malang 2,932 2011 2025 East Java
42 Power & Energy Matenggeng PS 443 MW 2,876 2012 2017 Central Java
43 Power & Energy Matenggeng PS 443 MW 2,876 2013 2018 Central Java
44 Power & Energy PLTGU Muara Tawar Add-On2 350 MW 2,800 2011 2013 West Java
45 Tollroad Surabaya - Gempol - Pasuruan (32 Km) 2,800 2010 2015 East Java
46 Tollroad Kunciran Serpong (11.9 km) 2,600 2011 2025 DKI Jakarta
47 Power & EnergyTransmission development at East Java until 2015 (1,147 kms)
2,157 2011 2015 East Java
48 Power & Energy PLTG Muara Karang 400 MW 2,000 2014 2017 DKI Jakarta
49 Power & Energy PLTGU Priok Extension 243 MW 1,944 2011 2012 DKI Jakarta
50 Power & Energy PLTGU Muara Tawar Blok 5 234 MW 1,872 2011 2011 West Java
51 Power & EnergyTransmission development at Banten until 2015 (810 kms)
1,619 2012 2015 Banten
52 Power & Energy PLTGU Muara Karang Repowering 194 MW 1,552 2011 2011 DKI Jakarta
53 Tollroad Bandung (Pasir Koja- Soreang) 10.57 km; 1,430 2011 2015 West Java
54 Power & Energy PLTGU Muara Tawar Add-On 2 150 MW 1,200 2011 2012 West Java
55 Power & Energy PLTP Kamojang Unit 5 1 x 40 MW 960 2011 2014 West Java
No Type of Infrastructure Project Name Investment
(IDR Tn) Commencement Completion Location
Masterplan P3EI Appendix
198

56 Power & Energy PLTA Kalikonto 62 MW 930 2011 2016 East Java
57 Tollroad Gempol-Pandaan (13.61 km) 890 2011 2025 East Java
58 Power & Energy PLTA Kesamben 37 MW 555 2014 2017 East Java
59 Airport Djuanda Airport Improvement 530 2014 East Java
60 Port Tanjung Emas Port modernization 400 2010 2013 Central Java
No Type of Infrastructure Project Name Investment
(IDR Tn) Commencement Completion Location
1 Other Infrastructure development of Kota Baru Maja 130,000 2012Tangerang,
Banten
2 Tollroad
Trans Java (Cikopo -Palimanan, Pejangan-Pemalang, Pemalang-Batang, Batang-Semarang, Semarang-Solo (Semarang-Bawen, Bawen-Solo), Solo-Mantingan, Mantingan - Kertosono, Kertosono - Mojokerto, Mojokerto-Surabaya (619 km)
51,643 2011 2014 Java
3Information and Communication Technology
Increase backbone capacity for Java up to 810 Gbps
32,000 2011 2015 Java
4 Railway Development of East-West MRT 30,000 2015 DKI Jakarta
5 RoadRoad development Cisumdawu (Cileunyi-Sumedang-Dawuan) 60.10 km
10,158 2011 2025 West Java
6 RailwayDoubletrack development for Semarang-Bojonegoro-Surabaya (185 km)
9,500 2013 2018 Java
7 Power & EnergyAcceleration of high scale hydro development (4x250 MW) Upper Cisokan at West Java
8,000 2011 2014 West Java
8 Tollroad Pasteur-Ujung Berung-Cileunyi 8,000 2011 2025 West Java
9 Tollroad Ciawi-Sukabumi 7,800 2011 2025 West Java
10 AirportInternational Airport development in DI Yogyakarta Province
3,700 2013 2018 DI Yogyakarta
11 Railway Development of Soekarno Hatta Airport Railway 2,270 2012 2015 DKI Jakarta
12 RailwayDevelopment of double track railway and supporting facility of Pekalongan-Semarang (87.9 Km)
1,800 2012 2014 Central Java
GOVERNMENT aNd SOE
No Type of Infrastructure Project Name Investment
(IDR Tn) Commencement Completion Location
Masterplan P3EI Appendix
199

List of Identified Infrastructure Investment in Kalimantan Economic Corridor
No Type of Infrastructure Project Name Investment
(IDR Tn) Commencement Completion Location
1 Road Development of Samarinda - Balikpapan Express Way 6,300 2010 2016 East Kalimantan
2 Port Capacity Expansion for Maloy Port 4,800 2011 2013 East Kalimantan
3 Road Trans Kalimantan (385 km) 3,850 2012 Kalimantan
4 Other Development of Balang bentang Island bridge (1,314 m) 3,600 2013 2015 East Kalimantan
5 Airport Acceleration of new Samarinda Airport 1,200 2011 2015 East Kalimantan
6 RoadRoad development from Kotawaringin to the mills (116 km)
1,160 2015 Central Kalimantan
7 Road Road access development to Airport and Port 800 2015 Kalimantan
8 RoadRoad improvement Central Kalimantan Province Tenggarong -Samarinda (357.9 km)
775.33 2011 2014 Central Kalimantan
9 PortBalikpapan International Airport expansion (development of loading terminal Kariangau)
713 2008 2012 East Kalimantan
10 Road Development of Ketapang Road and mills facility (67.6 km) 676 2015 West Kalimantan
11 PortTemporary Working Units for construction of Penajam Pasir Port and Kariangau/Balikpapan seaport facilities
598 2015 East Kalimantan
12 Other Development of Tayan Bridge 575 2011 2014 West Kalimantan
13 Road Road improvement Tj. Selor - Tj. Redeb - Maloy (523 km) 550 2011 2014 East Kalimantan
14 Other Pulau Balang Bentang Bridge Construction (470 m) 488 2008 2011 East Kalimantan
15 RoadRoad improvement Samarinda-Bontang, Sangatta-Maloy (287 km)
481 2011 2014 East Kalimantan
16 PortTemporary Working Units for construction of Palaihari seaport facilities
460 2015 South Kalimantan
17 Port Teluk Melano Port 432 2015 West Kalimantan
18 Road Road widening Samarinda - Tenggarong 400 2011 2015 East Kalimantan
19 PortTemporary Working Units for construction of Maloy/Sangkulirang seaport facilities
357 2015 East Kalimantan
20 Port Pulau Pisau Port Authority Development 345 2015 Central Kalimantan
21 Water Utility Wain Dam Development 290 2015 East Kalimantan
22 RoadNational Road improvement Sampit - Bagendang - Ujung Pandaran (82 km)
246 2011 2014 Central Kalimantan
23 Road Road widening to tourism area (30 km) 200 2011 2015 East Kalimantan
24 Port Sei Nyamuk Port Authority 192 2015 East Kalimantan
25 RoadRoad improvement Sampit - Sp. Runtu - Pangkalan Bun - Kumai - Sp. Runtu - Runtu (399 km)
186 2011 2014 Central Kalimantan
26 Road Pangkalan Bun development (58.5 Km) 178 2015 Central Kalimantan
27 Port Bangkuang Tongkang Port (17 Km) 176 2015 Central Kalimantan
28 Port Tanjung Isuy Tongkang Port (90 Km) 176 2015 East Kalimantan
29 Port Tanah Grogot Port 163 2015 East Kalimantan
GOVERNMENT
Masterplan P3EI Appendix
200

SOE
No Type of Infrastructure Project Name Investment
(IDR Tn) Commencement Completion Location
1Information and Communication Technology
Fiber Optic Coverage and Base Transceiver Station project
18,660 2011 2015 Kalimantan
2 Power & Energy Power Plant East Kalimantan - PLN 7,270 2011 2015 East Kalimantan
3 Power & Energy Power Plant West Kalimantan - PLN 6,819 2011 2015 West Kalimantan
4 Power & Energy Power Plant Central Kalimantan - PLN 4,686 2011 2015 Central Kalimantan
5 Power & Energy Power Plant South Kalimantan - PLN 3,541 2011 2015 South Kalimantan
6 Power & EnergyDevelopment of electricity transmission facility at West Kalimantan - PLN
1,609 2011 2015 West Kalimantan
7 Airport Balikpapan Airport 1,600 2011 2014 East Kalimantan
8 Power & Energy PLTU Sampit (2x25 MW) 1,110 2015 Central Kalimantan
9 Power & EnergyDevelopment for electricity transmission facility at East Kalimantan - PLN
1,035 2011 2015 East Kalimantan
10 Power & EnergyDevelopment for electricity transmission facility at Central Kalimantan - PLN
947 2011 2015 Central Kalimantan
11 Power & EnergyTransmission network development PLN Sampit-Pangkalan Bun
750 2011 2014 Central Kalimantan
12 Power & EnergyTransmission network development at South Kalimantan - PLN
655 2011 2015 South Kalimantan
13 Power & EnergyDevelopment for high voltage transmission 150 KV Palangka Raya- Kuala Kurun
600 2015 Palangkaraya
14 Port Kumai Port capacity bulding at Kumai, Central Kalimantan 400 2015 Central Kalimantan
15 Port Banjarmasin loading terminal development 350 2012 2012 East Kalimantan
16 Power & EnergyDevelopment for high voltage transmission network 150 KV Muara Teweh-Buntok
350 2011 2013 East Kalimantan
17 Power & Energy PLTU Buntok 2 x 7 MW 245 2015 Buntok
18 Power & Energy PLTU 2 x 3 MW Kuala Pembuang 108 2015 Central Kalimantan
19 Port Bumiharjo Port expansion 105 2010 2012 Central Kalimantan
30 Port Nunukan port Authority 152 2015 East Kalimantan
31 RoadRoad development in integrated tourism area (Destination development: Pulau Derawan dan Tanjung Batu)
150 2011 2015 East Kalimantan
32 RoadWater intake and water transmission Palingkau 220 I/s project
126.6 2011 2012 Central Kalimantan
33 Port Pontianak Port expansion (55 Km) 116 2015 West Kalimantan
34 RoadRoad improvement Pontianak - Sei Pinyuh - Sei Duri, 42 km
104 2011 2014 West Kalimantan
No Type of Infrastructure Project Name Investment
(IDR Tn) Commencement Completion Location
Masterplan P3EI Appendix
201

No Type of Infrastructure Project Name Investment
(IDR Tn) Commencement Completion Location
1 Railway Puruk Cahu - Tanjung Isuy (203 km) 20,300 2015 Kalimantan
2 Railway Puruk Cahu - Bangkuang (185 km) 15,000 2015 Central Kalimantan
3 Power & Energy Kalimantan power plant (700 MW) 7,000 2015 Kalimantan
4 Power & Energy PLTU PT IDMU 2 x 100 MW 2,000 2011 Central Kalimantan
5 Power & EnergyPLTGU Bangkanai 120 MW at Barito Utara, Central Kalimantan
1,200 2012 2014 Central Kalimantan
GOVERNMENT aNd SOE
List of Identified Infrastructure Investment in Sulawesi Economic Corridor
No Type of Infrastructure Project Name Investment
(IDR Tn) Commencement Completion Location
1 RoadRoad improvement Siwa - Pare-pare - Barru - Maros - Makassar (293 km)
971 2012 2014 South Sulawesi
2 RoadRoad improvement Parigi - Poso - Tentena - Tidantana (Batas Sulsel) (298 km)
709 2013 2014 Central Sulawesi
3 RoadRoad improvement Kolaka Utara - Lasususa Port (132 km)
294 2012 2014South East Sulawesi
4 Road Road improvement Kendari - Asera 280 2012 2014South East Sulawesi
5 PortTemporary Working Units for construction of Garongkong seaport facilities
252 2011 2014 South Sulawesi
6 RoadRoad improvement Maros-Watampone-Pelabuhan Bajoe (150.74 km)
235 2011 2014 South Sulawesi
7 PortGorongkong seaport facilities development, South Sulawesi
217 2011 2015 South Sulawesi
8 Port Tahuna Port Operation Unit (UPP) 215 2011 2014 North Sulawesi
9 RoadRoad improvement Batas Sultra - Malili - Masamba - Palopo - Siwa (318 km)
213 2012 2014 South Sulawesi
10 PortBungkutok seaport facilities development, South East Sulawesi
186 2011 2014South East Sulawesi
11 Port Lirung Port Operation Unit (UPP) 182 2011 2014 North Sulawesi
12 Port Bitung seaport facilities development, North Sulawesi 173 2011 2015 North Sulawesi
13 RoadRoad improvement Sp-Torobulu-Lainea-Kendari (127 km)
167 2012 2014South East Sulawesi
14 PortPantoloan seaport facilities development, South East Sulawesi
161 2011 2014 Central Sulawesi
15 PortTemporary Working Units for construction of Bitung seaport facilities - North Sulawesi
155 2011 2014 North Sulawesi
16 Port Anggrek seaport facilities development, Gorontalo 142 2011 2013 Gorontalo
GOVERNMENT
Masterplan P3EI Appendix
202

17 Port Gorontalo seaport facilities development 135 2011 2013 Gorontalo
18 Port Bau - Bau Port 126 2011 2014South East Sulawesi
19 Port Raha Port 114 2011 2014South East Sulawesi
20 Road Road improvement Majene - Polewali (49,8 km) 104 2011 2013 West Sulawesi
No Type of Infrastructure Project Name Investment
(IDR Tn) Commencement Completion Location
1 Power & Energy Development of DS LNG project, Kab. Mamuju 5,602 2011 West Sulawesi
2 Power & EnergyPLTM Ratelimbong-Kolaka 2 MW, PLTU Sulsel Baru 2.50 MW, PLTG Sulsel Baru 50 MW & 100 MW, PLTD Selayar 2 MW
5,174 2011 2014 South Sulawesi
3 Power & Energy
PLTM (Sansarino 1 MW; Tomini II 2x1 MW; Sawidago II 1 MW), PLTU (Leok 2x3 MW; Kolonodale 2x3 MW; Ampana 2x3 MW; Toli-toli 2x3 MW; Bangkir 2x3 MW; Tambu 2x3 MW), PLTG Luwuk 10 MW
3,469 2011 2015 Central Sulawesi
4 Power & EnergyPLTP Kotamobagu 4x20 MW, Kab. Kotamobagu, Sulawesi Utara
2,540 2014 2015 North Sulawesi
5 Power & EnergyTransmission network development Central Sulawesi Province (1472 km)
1,888 2011 2015 Central Sulawesi
6 Power & EnergyPLTU (Kendari 2x10MW; Wangi-wangi 2x3 MW; Raha 2x3MW), PLTM Rongi 1MW, PLTD Raha 3 MW
1,020 2011 2015South East Sulawesi
7 Power & EnergyTransmission network development South Sulawesi (757 km)
917 2011 2015 South Sulawesi
8 Power & Energy PLTU Gorontalo Baru (2x25 MW) 880 2011 Gorontalo
9 Power & Energy WKP Marana (20 MW), Central Sulawesi 640 2011 2015 Central Sulawesi
10 Power & EnergyTransmission network development South East Sulawesi Tenggara (1000 km)
554 2011 2013South East Sulawesi
11 Power & Energy Substation development at South Sulawesi 552 2011 2015 South Sulawesi
12 Power & Energy Transmission network development Gorontalo (746 km) 413 2011 2015 Gorontalo
13 Power & Energy Substation development at North Sulawesi 330 2011 2015 North Sulawesi
14 Power & Energy Substation development at Central Sulawesi 322 2011 2015 Central Sulawesi
15 Power & Energy Substation development at South East Sulawesi 273 2011 2014South East Sulawesi
16 Power & EnergyPLTM (Bonehau 2x2MW; Budaong-Budaong 2x1 MW; Kalukku 1 MW, Balla 1 MW),
192 2011 West Sulawesi
17 Power & EnergyTransmission network development North Sulawesi (228 km)
126 2011 2014 North Sulawesi
18 Power & Energy Substation development at Gorontalo 125 2011 2015 Gorontalo
No Type of Infrastructure Project Name Investment
(IDR Tn) Commencement Completion Location
SOE
Masterplan P3EI Appendix
203

No Type of Infrastructure Project Name Investment
(IDR Tn) Commencement Completion Location
1Information and Communication Technology
Development of device for the end-user consumer at Sulawesi
19,110 2012 2014 Sulawesi
2Information and Communication Technology
Development of Backhaul, Access, NOC, Service Center, Ecosystem Development, Infrastructure
10,580 2012 2014 Sulawesi
3Information and Communication Technology
Development of National Backbone Network based on active network sharing, either undersea or terestrial network
3,847 2012 2014 Sulawesi
4 Port Makassar Port expansion 2,220 2011 2014 South Sulawesi
5 TollroadManado-Minut-Bitung/Express Way Manado - Bitung (49 km)
1,732 2011 2014 North Sulawesi
6 PortDevelopment of Bitung supporting facilities for fishery products export
500 2011 2015 North Sulawesi
7 Port Bitung Port expansion 414 2011 2015 North Sulawesi
GOVERNMENT aNd SOE
List of Identified Infrastructure Investment in Bali - Nusa Tenggara Economic Corridor
No Type of Infrastructure Project Name Investment
(IDR Tn) Commencement Completion Location
1 Railway Development of Railways in Bali to Support Tourism 12,100 2012 2017 Bali
2 Water UtilityDevelopment of water transmission network and water intake Guyangan Klungkung springs - 40 l/s
1,108 2011 2011 Bali
3 RoadRoad improvement Bangau-Dompu-Ramba-Lb. Bajo (159.25 Km)
322 2011 2014 East Nusa Tenggara
4 Water UtilityWater treatment plant Ayung (400 l/s) and Paned (300 l/s)
160 2011 2015 Bali
5 RoadRoad improvement Bolok-Tenau-Kupang-Oesau-Oesapa (59.35 Km)
127 2011 2014 East Nusa Tenggara
6 RoadRoad improvement Ende-Maumere (National Road), Maumere-Megapanda (Nasional Strategic Road) (138,293 km)
111 2011 2015 East Nusa Tenggara
7 Water UtilityWater treatment plant Petanu (Tukad Petanu, Gianyar, Badung, and Denpasar) 300 l/s
110 2011 2012 Bali
8 Water Utility Water treatment plant Kab. Kupang (100 l/s) 105 2011 2014 East Nusa Tenggara
GOVERNMENT
Masterplan P3EI Appendix
204

List of Identified Infrastructure Investment in Papua - Kep. Maluku Economic Corridor
No Type of Infrastructure Project Name Investment
(IDR Tn) Commencement Completion Location
1 Road Trans Papua 50,000 2011 Papua
2 Water UtilityDevelopment of irrigation facility at Pulau Buru and Seram Timur
1,111 2011 2014 Maluku
3 Road Trans Maluku 937 2011 2014 Maluku
4 Road Road improvement Manokwari - Kebar (214 km) 924 2012 2014 Papua
5 Road Road improvement Kokas - Fakfak - Bomberai (140 km) 911 2012 2014 West Papua
6 RoadDevelopment of Trans Maluku supporting infrastructure (road and bridge)
784 2011 2014 Maluku
7 Water UtilityRaw water facility development at Pulau Ambon and Lease, and southern islands of Maluku
760 2011 2014 Maluku
8 Road Road improvement Kumbe - Okaba - Nakias (152 km) 760 2011 2015 Papua
GOVERNMENT
No Type of Infrastructure Project Name Investment
(IDR Tn) Commencement Completion Location
1 Toll Road Probolinggo - Banyuwangi (170.36 Km) 8,000 2011 2019 East Java
2 Toll Road Pasuruan - Probolinggo (45.32 km) 5,960 2011 2018 East Java
3Information and Communication Technology
improvement of backbone and fiber optic coverage in the metro region and the deployment of base stations
3,990 2011 2015 Bali-NT
4 Toll Road Surabaya - Gempol - Pasuruan (32 Km) 2,800 2010 2016 East Java
5 Power & Energy Transmission development (786 kms) 2,383 2011 2015 Bali
6 Airport Ngurah Rai Airport expansion 2,050 2011 2013 Bali
7 Toll Road Nusa Dua-Ngurah Rai-Benoa (7.5 km) 1,489 2011 2013 Bali
8 AirportDevelopment and operation preparation of Lombok International Airport
829 2011 2011West Nusa Tenggara
9 Power & Energy WKP Bedugul (10 MW) 320 2013 2013 Bali
10 Power & Energy Transmission development (590 kms) 303 2011 2014 East Nusa Tenggara
11 Power & Energy PLTU NTT Kupang 2X16,5 MW FTP1 241 2008 2012 East Nusa Tenggara
12 OtherAddition of vessel fleet Ferry Ro-ro Ketapang - Gilimanuk cross, 4 units (1500 GT & 3000 GT)
231 2011 2013 Bali NT
13 Power & Energy PLTU NTT Ende FTP1 2x7 MW 188 2008 2011 East Nusa Tenggara
14 Power & Energy Transmission development (324 kms) 157 2011 2014West Nusa Tenggara
15 OtherAddition of vessel fleet Ferry Ro-ro Lembar - Padang Bay cross, 3 units (1.500 GT & 2.000 GT)
126 2011 2012 Bali NT
SOE
Masterplan P3EI Appendix
205

9 Road Road improvement Timika – Nabire (407.7 km) 631 2011 2014 Papua
10 Port Serui Port 567 2011 2014 Papua
11 Road Road improvement Merauke - Muting (204 km) 388 2011 2014 Papua
12 Road Road improvement Manokwari – Bintuni (257 Km) 365 2011 2014 West Papua
13 Port Ambon Port authority 363 2011 2014 Maluku
14 Port Jayapura Port authority 328 2011 2014 Papua
15 PortTemporary Working Units for construction of Raja Ampat and Arar seaport facilities - Sorong
318 2011 2014 West Papua
16 Port Waren Port 306 2011 2014 Papua
17 Port Merauke Ocean Fishing Port developmet 300 2011 2014 Papua
18 Road Road improvement Okaba - Wambi 285 2011 2015 Papua
19 Port Teminabuan Port 261 2011 2014 Papua
20 Port Bade Port 237 2011 2014 Papua
21 Port Buli Port 226 2011 2014 North Maluku
22 Port Jailolo Port 210 2011 2014 North Maluku
23 Port Merauke Port authority 210 2011 2014 Papua
24 Port Tobelo Port 201 2011 2014 North Maluku
25 PortTemporary Working Units for construction of Falabisahaya seaport facilities - North Maluku
201 2011 2014 North Maluku
26 PortPassenger terminal dock and loading dock development of Depapre Port
200 2011 2014 Papua
27 Port Kaimana Port 188 2011 2014 Papua Barat
28 Port Labuha/Babang Port 180 2011 2014 North Maluku
29 Port Sarmi Port 169 2011 2014 Papua
30 Port Biak Port authority 168 2011 2014 Papua
31 Port Nabire Port 160 2011 2014 Papua
32 Port Agats Port 159 2011 2014 Papua
33 Port Saunek Port 153 2011 2014 West Papua
34 Port Ternate Port authority 150 2011 2014 North Maluku
35 Port Kokas Port 145 2011 2014 West Papua
36 Port Amamapare Port Operation Unit 135 2011 2014 Papua
37 Port Gebe Port 134 2011 2014 North Maluku
38 Port Port development at Sorong 129 2011 2014 Papua Barat
39 Road Road improvement Daruba - Wayabula ( 52 km) 126 2011 2014 North Maluku
40 Road Road improvement Habema – Yaguru (110 + Km) 106 2011 2014 Papua
41 Power & Energy Feasibility Study for PLTA Mamberamo development 100 2011 2013 Papua
42 PortDevelopment of General Cargo dock (100 m) at Sofifi Port
100 2011 2014 North Maluku
43 PortDevelopment of General Cargo dock (100 m) at Merauke Port
100 2011 2014 Papua
No Type of Infrastructure Project Name Investment
(IDR Tn) Commencement Completion Location
Masterplan P3EI Appendix
206

No Type of Infrastructure Project Name Investment
(IDR Tn) Commencement Completion Location
1 Power & EnergyDevelopment of geothermal field Jailolo 2 x 5 MW, West Halmahera District
320 2011 2014 North Maluku
2 Power & Energy Development of electricity transmission at Papua 238 2011 2015 Papua
SOE
No Type of Infrastructure Project Name Investment
(IDR Tn) Commencement Completion Location
1 Port Jayapura Port 43,000 2011 2015 Papua
2Information and Communication Technology
Development of backhaul network, access/lastmile, NOC, Sub-system Service Control, OSS/BSS, application platform, development of national or unique scale ecosystem, planning, optimation, and marketing, also regional center, support center and other infrastructure development
14,790 2012 2014 Papua
3Information and Communication Technology
Development of device for the end-user consumer 9,530 2012 2014 Papua
4 Port Merauke Port 9,000 2012 2015 Papua
5Information and Communication Technology
National backbone network development (Palapa Ring) based on active network sharing and core network
7,590 2012 2014 Papua
6 Power & Energy PLTA 300 MW at Urumuka 3,500 2012 2019 Papua
7 Power & Energy Power plant at West Papua 3,097 2011 2015 West Papua
8 Power & Energy Power plant at Maluku 2,073 2011 2015 Maluku
9 Power & Energy Power plant at North Maluku 1,637 2011 2015 North Maluku
10 Power & Energy Power plant at Papua 1,242 2011 2015 Papua
11 RoadRingroad Morotai Island, Sepanjang Road (234.59 km), Sepanjang Bridge (275 m) for supporting fishery and tourism activity
614 2011 2014 North Maluku
12 Port Cargo capacity building at Timika Seaport 500 2011 2015 Papua
13 Power & Energy Songa Wayaua geothermal field development 5 MW 160 2011 2015 North Maluku
14 AirportMorotai Airport rehabilitation including Runway extension
150 2011 2014 North Maluku
GOVERNMENT aNd SOE
Masterplan P3EI Appendix
207


