26
Acceptable Operating Parameters for Steam Assisted Flares at Purge Rates Tom Farmer Flares Applications Engineer Zeeco, Inc. Broken Arrow, Oklahoma, U.S.A.
Acceptable Operating Parameters for Steam Assisted Flares at Purge Rates
Tom Farmer
Flares Applications Engineer
Zeeco, Inc.
Broken Arrow, Oklahoma, U.S.A.
2
Contents Abstract .......................................................................................................................................... 3
Objective ........................................................................................................................................ 4
Overview and Background........................................................................................................... 4
Testing Facility and Instrumentation ......................................................................................... 5
Testing ............................................................................................................................................ 7 Phase 1: Testing Established Guidelines ............................................................................................... 9 Phase 2: Adjusting Test Plan and Building Hypothesis .................................................................... 10 Phase 3: Verifying LHV Hypothesis.................................................................................................... 11
DRE Evaluation .......................................................................................................................... 11
Thermocouple Evaluation .......................................................................................................... 11
Computational Fluid Dynamics ................................................................................................. 14
Results and Conclusions ............................................................................................................. 18
Recommendations ....................................................................................................................... 19
Appendix A: Graphical Analysis ............................................................................................... 20
Appendix B: Numerical Data ..................................................................................................... 22
Appendix C: Testing Procedure ................................................................................................ 25
Appendix D: DRE Equation ...................................................................................................... 26
3
Abstract Flare vendors recommend that cooling steam should always be supplied to the steam injection equipment on steam assisted flare tips. However, the nomenclature of “cooling steam” properly describes only one aspect of this steam flow. Not only does this steam provide thermal protection to the steam injection equipment in the high-heat zone near the tip exit, but this steam flow also ensures the steam supply piping remains heated, preventing condensate formation during large increases in steam flow rates. Unfortunately, during periods of low gas flow rate to the flare system (standby, purge-only, or small continuous flow rate modes) this cooling steam can reduce the hydrocarbon destruction efficiency of the flare system. Currently the Texas Commission on Environmental Quality (TCEQ) is reviewing data from flare testing they commissioned through the University of Texas in 2010. Recent field observations by TCEQ have revealed what appears to be poor flare destruction efficiency by some steam and air assisted flares when operating at turndown condition. Using specialized infrared cameras, unburned hydrocarbons were detected coming from improperly operated flare systems. Despite these findings, the general belief amongst industry flare experts is that through proper operation of existing flares, the destruction efficiency can be very high even at turndown rates. However, meeting proper destruction efficiency requirements with existing flare systems at low gas flow rates will require more clear and detailed training for operations personnel at these facilities.
To help develop this training program, Zeeco performed extensive testing of steam assisted flares at the Zeeco Combustion Research and Test Facility in Broken Arrow, Oklahoma. The testing covered a wide range of operating conditions, specifically focusing on turndown conditions. Testing included emissions plume sampling, as well as real-time data from the same specialized infrared camera currently being used by TCEQ. Computational Fluid Dynamics (CFD) models of the testing were generated and compared to the actual results in order to calibrate the prediction models. The prediction models can then be used to determine if existing flares require any modification to meet current or possible new legislation. The main focus of the testing was aimed at finding and setting the proper operating parameters for steam flares at turndown conditions to allow existing stacks to remain in operation with little or no modification, while still meeting the required destruction and removal efficiencies (DRE). The information obtained from this testing is to be used to develop a training program for flare operators. This paper discusses the approach and results of this testing, as well as recommendations for steam flare operation.

4
Objective The primary objective of the Zeeco steam flare research was to test current Zeeco steam assisted flare tip designs for destruction and removal efficiency of hydrocarbons while firing at American Petroleum Institute (API) 521 recommended purge gas rates with steam injected at Zeeco’s recommended cooling steam rates. A secondary goal was to develop a relationship between the flare tip design, the combined steam and purge gas lower heating value (LHV), and the hydrocarbon destruction and removal efficiency.
Overview and Background In 1982, the Chemical Manufacturers Association began a comprehensive study on the efficiency of flare operations. This study reported that properly operated elevated, open flame flares had a destruction efficiency of 98%. Based on the results of this study, the United States Environmental Protection Agency (EPA) issued the 40 CFR 60.11 to 60.18 regulations and the US EPA AP 42 Chapter 13.5. Since 1982, these documents have formed the basis for permitting flare emissions.
During the fall of 2010, the University of Texas in conjunction with the TCEQ performed tests at the John Zink testing facility located in Tulsa, Oklahoma to determine how air and steam assisted flares perform at turndown rates. The test results suggested that incorrectly designed or operated steam flares have the potential to over-aerate or quench the flame, reducing combustion and destruction efficiency. Rather than destroying hydrocarbons, improperly operated flares vent unburned gases.
In comparison to the TCEQ Flare Study Project, Zeeco performed steam flare testing at API recommended purge rates, which were significantly less than the turndown rates tested at the John Zink facility. Zeeco chose to focus on the specified velocity seal, gas seal, and no seal purge rates given in ISO 23251/API Section 521 Fifth Edition. An outside contractor performed the emissions testing on the flare gas plume. A sample extraction device similar to that used in the TCEQ Flare Study Project was designed to be held by crane above the flare and pull a continuous sample for emissions monitoring.
5
Testing Facility and Instrumentation All testing was performed at the Zeeco Combustion Research and Test Facility in Broken Arrow, Oklahoma. Testing occurred from July 18-22, 2011. Ambient weather conditions could not be controlled, but weather data was recorded. Throughout the week of testing, the temperature ranged from 85 to 110 °F and wind speeds ranged from 2 to 15 mph.
Monitoring devices consisted of a LSI FLIR GasFindIR camera, Sony DCR-SR42, and a Canon Powershot SX130 IS. These instruments were used to monitor the presence of unburned hydrocarbons, to detect the presence of a flame, and to provide still photos of the testing setup, respectively. Zeeco test facility technicians and engineers were responsible for controlling the gas and steam flow rates, operating video recorders, and positioning the sample extraction device.
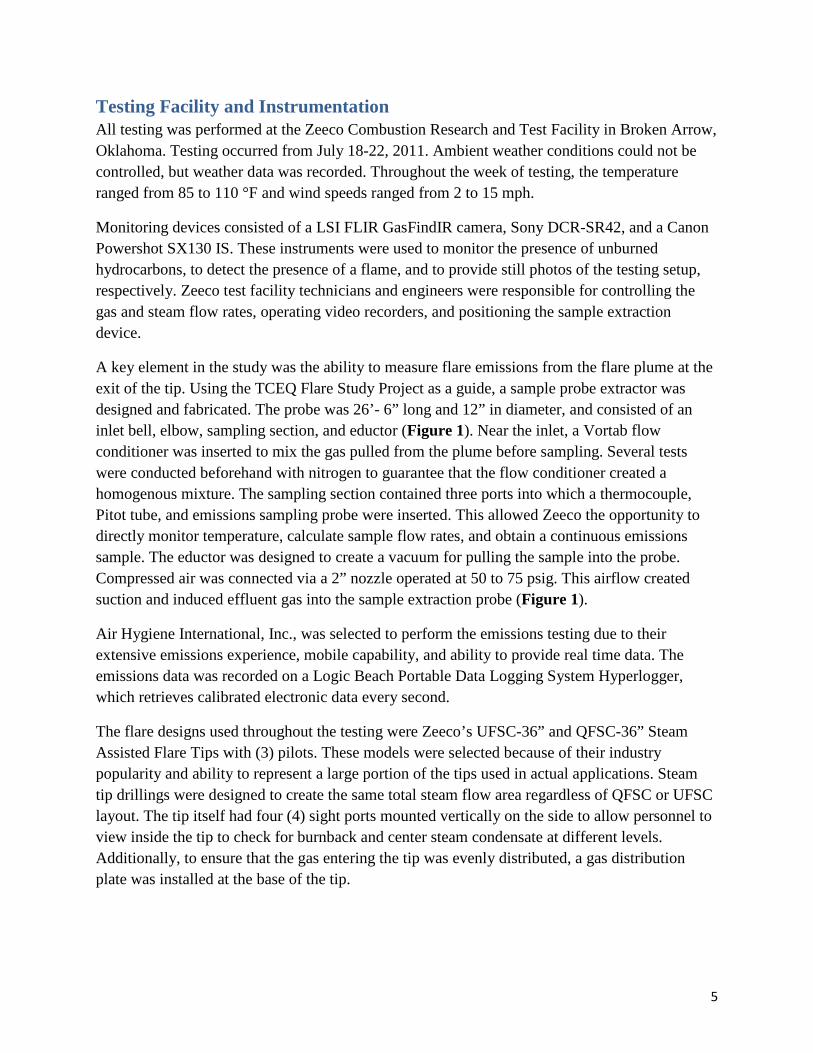
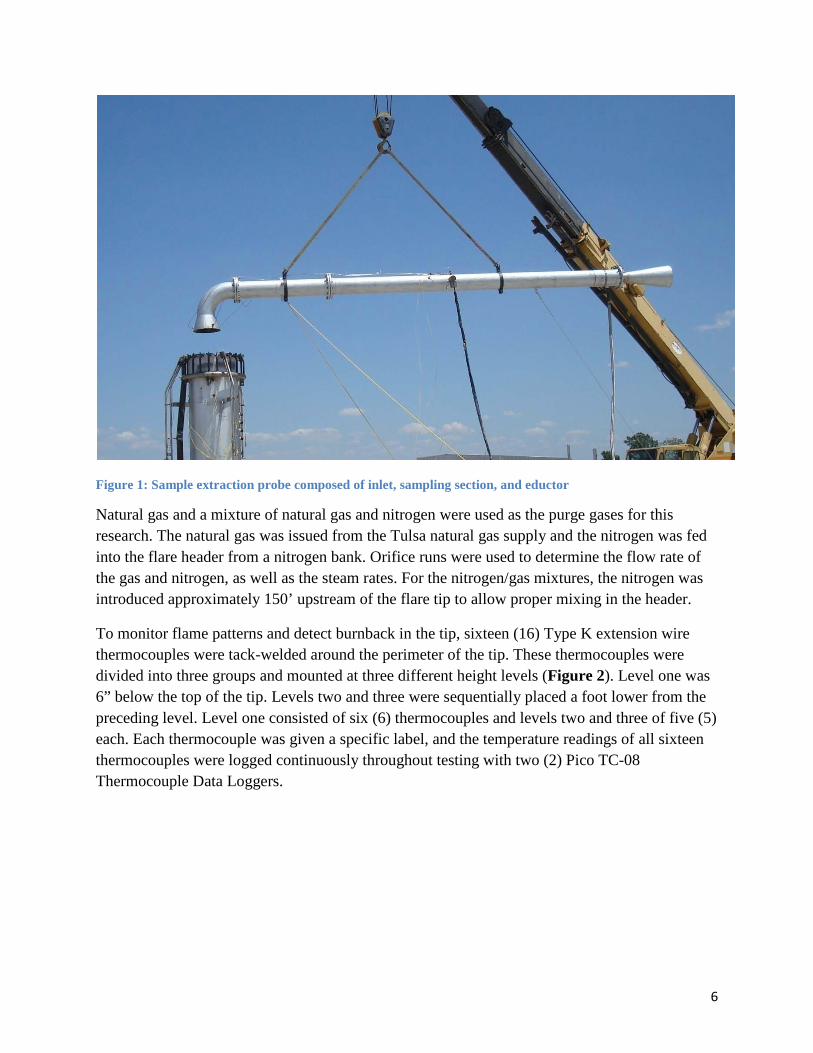
A key element in the study was the ability to measure flare emissions from the flare plume at the exit of the tip. Using the TCEQ Flare Study Project as a guide, a sample probe extractor was designed and fabricated. The probe was 26’- 6” long and 12” in diameter, and consisted of an inlet bell, elbow, sampling section, and eductor (Figure 1). Near the inlet, a Vortab flow conditioner was inserted to mix the gas pulled from the plume before sampling. Several tests were conducted beforehand with nitrogen to guarantee that the flow conditioner created a homogenous mixture. The sampling section contained three ports into which a thermocouple, Pitot tube, and emissions sampling probe were inserted. This allowed Zeeco the opportunity to directly monitor temperature, calculate sample flow rates, and obtain a continuous emissions sample. The eductor was designed to create a vacuum for pulling the sample into the probe. Compressed air was connected via a 2” nozzle operated at 50 to 75 psig. This airflow created suction and induced effluent gas into the sample extraction probe (Figure 1).
Air Hygiene International, Inc., was selected to perform the emissions testing due to their extensive emissions experience, mobile capability, and ability to provide real time data. The emissions data was recorded on a Logic Beach Portable Data Logging System Hyperlogger, which retrieves calibrated electronic data every second.
The flare designs used throughout the testing were Zeeco’s UFSC-36” and QFSC-36” Steam Assisted Flare Tips with (3) pilots. These models were selected because of their industry popularity and ability to represent a large portion of the tips used in actual applications. Steam tip drillings were designed to create the same total steam flow area regardless of QFSC or UFSC layout. The tip itself had four (4) sight ports mounted vertically on the side to allow personnel to view inside the tip to check for burnback and center steam condensate at different levels. Additionally, to ensure that the gas entering the tip was evenly distributed, a gas distribution plate was installed at the base of the tip.
6
Figure 1: Sample extraction probe composed of inlet, sampling section, and eductor Natural gas and a mixture of natural gas and nitrogen were used as the purge gases for this research. The natural gas was issued from the Tulsa natural gas supply and the nitrogen was fed into the flare header from a nitrogen bank. Orifice runs were used to determine the flow rate of the gas and nitrogen, as well as the steam rates. For the nitrogen/gas mixtures, the nitrogen was introduced approximately 150’ upstream of the flare tip to allow proper mixing in the header.
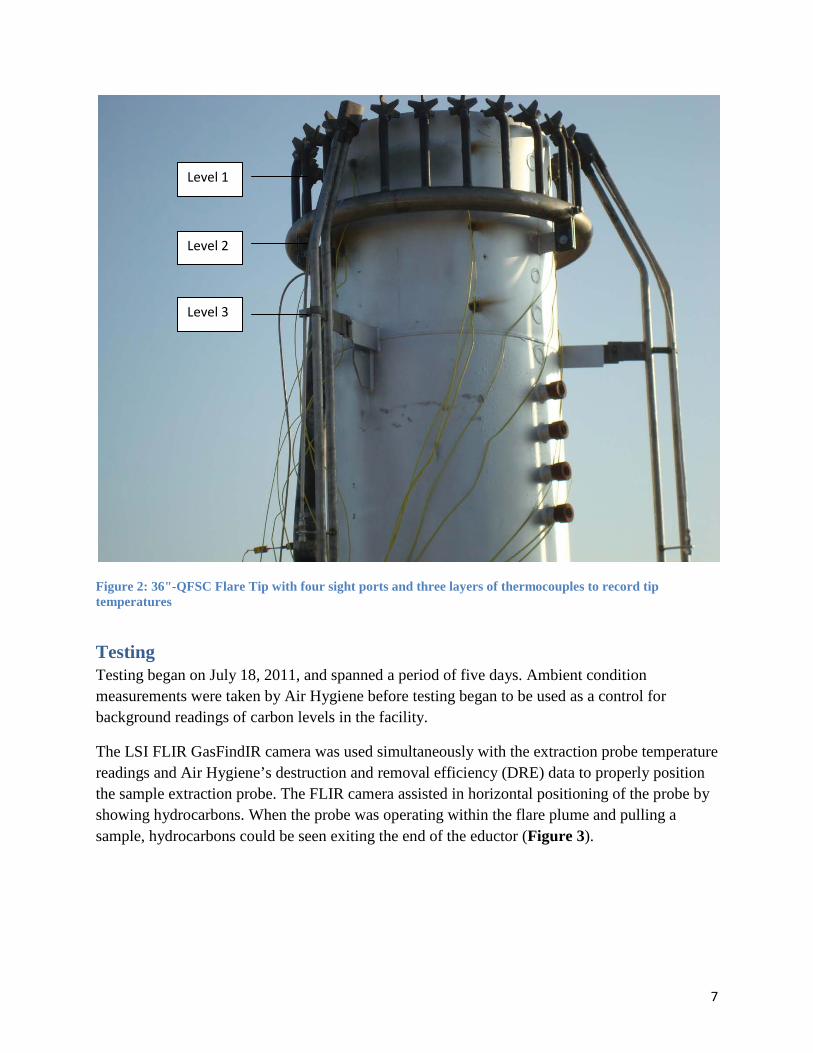
To monitor flame patterns and detect burnback in the tip, sixteen (16) Type K extension wire thermocouples were tack-welded around the perimeter of the tip. These thermocouples were divided into three groups and mounted at three different height levels (Figure 2). Level one was 6” below the top of the tip. Levels two and three were sequentially placed a foot lower from the preceding level. Level one consisted of six (6) thermocouples and levels two and three of five (5) each. Each thermocouple was given a specific label, and the temperature readings of all sixteen thermocouples were logged continuously throughout testing with two (2) Pico TC-08 Thermocouple Data Loggers.
7
Figure 2: 36"-QFSC Flare Tip with four sight ports and three layers of thermocouples to record tip temperatures
Testing Testing began on July 18, 2011, and spanned a period of five days. Ambient condition measurements were taken by Air Hygiene before testing began to be used as a control for background readings of carbon levels in the facility.
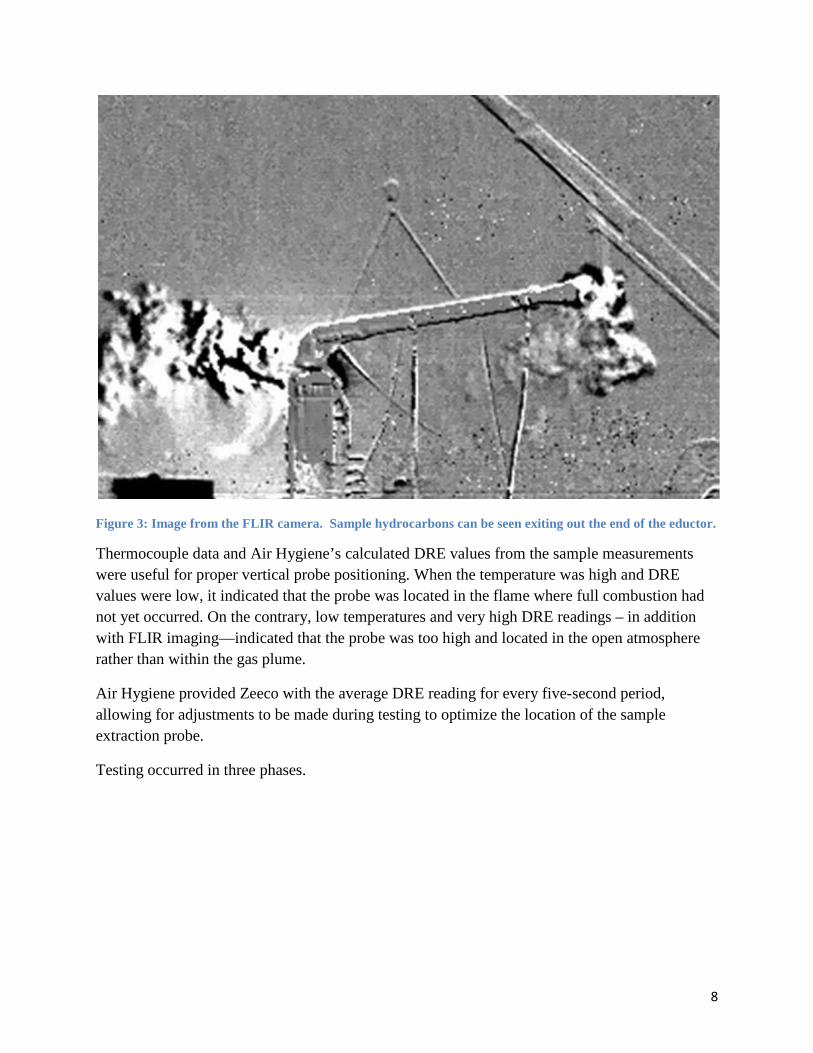
The LSI FLIR GasFindIR camera was used simultaneously with the extraction probe temperature readings and Air Hygiene’s destruction and removal efficiency (DRE) data to properly position the sample extraction probe. The FLIR camera assisted in horizontal positioning of the probe by showing hydrocarbons. When the probe was operating within the flare plume and pulling a sample, hydrocarbons could be seen exiting the end of the eductor (Figure 3).
Level 3
Level 1
Level 2
8
Figure 3: Image from the FLIR camera. Sample hydrocarbons can be seen exiting out the end of the eductor.
Thermocouple data and Air Hygiene’s calculated DRE values from the sample measurements were useful for proper vertical probe positioning. When the temperature was high and DRE values were low, it indicated that the probe was located in the flame where full combustion had not yet occurred. On the contrary, low temperatures and very high DRE readings – in addition with FLIR imaging—indicated that the probe was too high and located in the open atmosphere rather than within the gas plume.
Air Hygiene provided Zeeco with the average DRE reading for every five-second period, allowing for adjustments to be made during testing to optimize the location of the sample extraction probe.
Testing occurred in three phases.

9
Phase 1: Testing Established Guidelines Testing began according to the testing procedure as listed in Appendix C: Testing Procedure, with steam rates and purge rates chosen to meet API 521 specifications. For each purge rate (Velocity Seal, Gas Seal, and No Seal), the fuel flow rate remained constant and the compressed airflow through the eductor was kept constant by maintaining a 75psig pressure. See Table 3, Purge Rates, in Appendix C.
• Velocity Seal The first purge rate tested was that recommended by API 521 for a 36” velocity seal (990 SCFH). Initially, pure natural gas was run through the flare with no steam assist, and the DRE was 98.52%. Zeeco then began to add and vary the center steam flow. As soon as the center steam flow was introduced into the flare tip, the DRE dropped by approximately 28%. Center steam flow was then turned off and upper steam flow was then initiated and varied. For natural gas with upper steam only, the DRE remained stable around 90% DRE. The final testing at velocity seal gas rates included both upper and center steam assist. The center steam was held constant at 500 lb/hr while gradually decreasing the upper steam from 1655 lb/hr down to 0 lb/hr. Under combined steam assist flow conditions; the DRE averaged around 70%.
• Gas Seal Gas seal testing followed the same format as the velocity seal testing (gas only, gas and center steam only, gas and upper steam only, gas and both steam assists). The fuel flow rate remained constant at 250 SCFH of natural gas. Since the gas seal rate is lower than the velocity seal rate, the compressed air which creates the vacuum in the probe was reduced to 50 psig so the natural characteristics of the flame would not be disturbed. Similar to that observed under velocity seal conditions, DRE decreased with the addition of center steam, averaging 75%. Purge gas and upper steam only assist destruction and removal efficiencies ranged from 80.3 to 86.4%, while that of combined steam assist was around 80%.
10
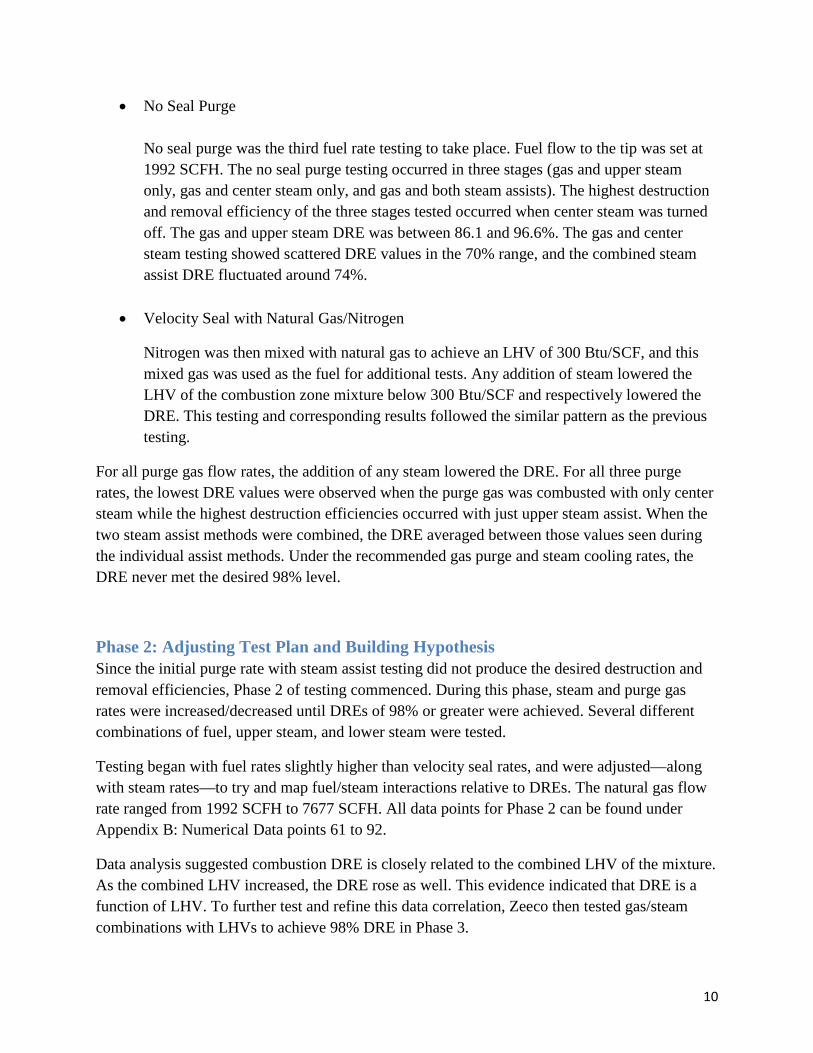
• No Seal Purge No seal purge was the third fuel rate testing to take place. Fuel flow to the tip was set at 1992 SCFH. The no seal purge testing occurred in three stages (gas and upper steam only, gas and center steam only, and gas and both steam assists). The highest destruction and removal efficiency of the three stages tested occurred when center steam was turned off. The gas and upper steam DRE was between 86.1 and 96.6%. The gas and center steam testing showed scattered DRE values in the 70% range, and the combined steam assist DRE fluctuated around 74%.
• Velocity Seal with Natural Gas/Nitrogen
Nitrogen was then mixed with natural gas to achieve an LHV of 300 Btu/SCF, and this mixed gas was used as the fuel for additional tests. Any addition of steam lowered the LHV of the combustion zone mixture below 300 Btu/SCF and respectively lowered the DRE. This testing and corresponding results followed the similar pattern as the previous testing.
For all purge gas flow rates, the addition of any steam lowered the DRE. For all three purge rates, the lowest DRE values were observed when the purge gas was combusted with only center steam while the highest destruction efficiencies occurred with just upper steam assist. When the two steam assist methods were combined, the DRE averaged between those values seen during the individual assist methods. Under the recommended gas purge and steam cooling rates, the DRE never met the desired 98% level.
Phase 2: Adjusting Test Plan and Building Hypothesis Since the initial purge rate with steam assist testing did not produce the desired destruction and removal efficiencies, Phase 2 of testing commenced. During this phase, steam and purge gas rates were increased/decreased until DREs of 98% or greater were achieved. Several different combinations of fuel, upper steam, and lower steam were tested.
Testing began with fuel rates slightly higher than velocity seal rates, and were adjusted—along with steam rates—to try and map fuel/steam interactions relative to DREs. The natural gas flow rate ranged from 1992 SCFH to 7677 SCFH. All data points for Phase 2 can be found under Appendix B: Numerical Data points 61 to 92.
Data analysis suggested combustion DRE is closely related to the combined LHV of the mixture. As the combined LHV increased, the DRE rose as well. This evidence indicated that DRE is a function of LHV. To further test and refine this data correlation, Zeeco then tested gas/steam combinations with LHVs to achieve 98% DRE in Phase 3.
11
Phase 3: Verifying LHV Hypothesis After hypothesizing that LHV is a controlling factor in achieving desired destruction efficiencies of 98% or greater, Zeeco initiated testing to validate this theory using twenty (20) different fuel/steam flow rates.
Tests showed a connection between LHV and DRE. High DRE strongly corresponded with a high LHV. When combined stream LHV’s spanned from 200-250 Btu/SCF, the DRE was typically between 93-97%. For 250-350 Btu/SCF, the DRE was 98-99%. See points 93-112 under Appendix B: Numerical Data points 61 to 92. While test results indicated the steam assist method does impact the DRE, the LHV exerts considerably more influence over achieved DREs.
DRE Evaluation Air Hygiene measured the emissions of CO, CO2, NOx, and THC. With their measurements, DRE was calculated based on the carbon content in the purge gas and the flare plume according to the DRE equation as specified in Appendix D.
Due to the low flow rates tested, visible flames were rare. In contrast to the TCEQ testing, Zeeco drew no correlation between the flame color and DRE. All DRE conclusions were based on purge gas-steam ratios and emissions testing data.
Thermocouple Evaluation The temperature on the top 2’-6” of each flare tip was monitored continuously throughout testing, allowing Zeeco to view burnback within the flare tip as well as determine whether there was any correlation between temperature, probe positioning, and DRE.
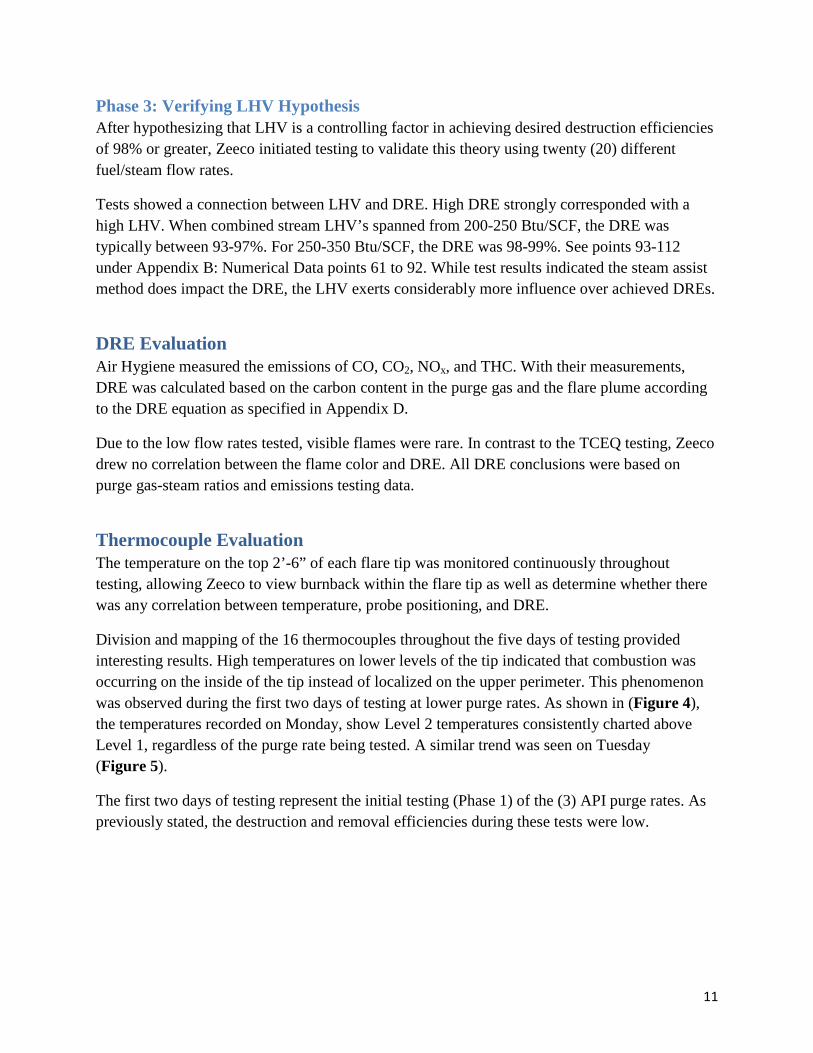
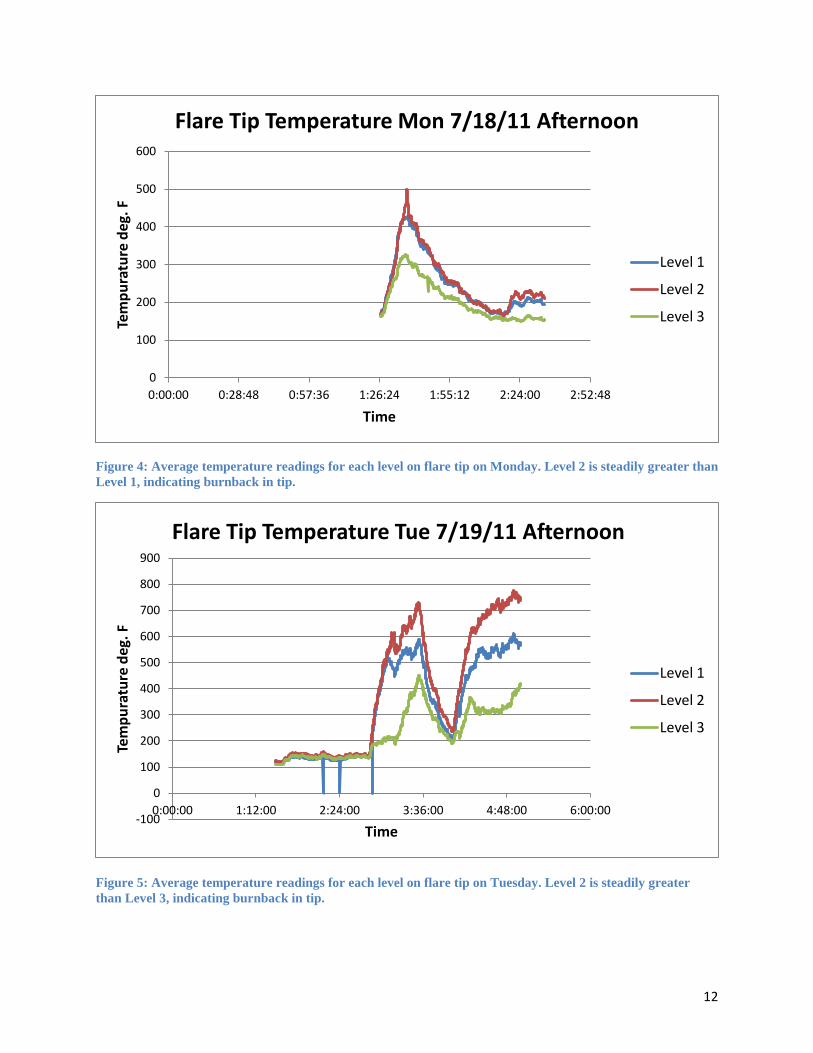
Division and mapping of the 16 thermocouples throughout the five days of testing provided interesting results. High temperatures on lower levels of the tip indicated that combustion was occurring on the inside of the tip instead of localized on the upper perimeter. This phenomenon was observed during the first two days of testing at lower purge rates. As shown in (Figure 4), the temperatures recorded on Monday, show Level 2 temperatures consistently charted above Level 1, regardless of the purge rate being tested. A similar trend was seen on Tuesday (Figure 5).
The first two days of testing represent the initial testing (Phase 1) of the (3) API purge rates. As previously stated, the destruction and removal efficiencies during these tests were low.
12
Figure 4: Average temperature readings for each level on flare tip on Monday. Level 2 is steadily greater than Level 1, indicating burnback in tip.
Figure 5: Average temperature readings for each level on flare tip on Tuesday. Level 2 is steadily greater than Level 3, indicating burnback in tip.
0
100
200
300
400
500
600
0:00:00 0:28:48 0:57:36 1:26:24 1:55:12 2:24:00 2:52:48
Tem
pura
ture
deg
. F
Time
Flare Tip Temperature Mon 7/18/11 Afternoon
Level 1
Level 2
Level 3
-100
0
100
200
300
400
500
600
700
800
900
0:00:00 1:12:00 2:24:00 3:36:00 4:48:00 6:00:00
Tem
pura
ture
deg
. F
Time
Flare Tip Temperature Tue 7/19/11 Afternoon
Level 1
Level 2
Level 3

13
Phase 2 testing data suggested that proper flame retention ring burning leads to higher DRE values. Beginning on Wednesday, July 20, temperature readings indicated proper burning; Level 1 temperature was greater than Level 2 which was simultaneously greater than Level 3 (Figures 6-7). During the testing in which this temperature behavior was observed, a slight increase in DRE was also seen.
Figure 6: Phase 2 thermocouple data from Wednesday. Correct tip temperature sequence indicates no burnback in tip.
Figure 7: Phase 2 thermocouple data from Thursday. Correct tip temperature sequence indicates no burnback in tip.
0
100
200
300
400
500
600
700
800
0:00:00 1:12:00 2:24:00 3:36:00 4:48:00 6:00:00
Tem
pura
ture
deg
. F
Time
Flare Tip Temperature Wed 7/20/11 Afternoon
Level 1
Level 2
Level 3
0
50
100
150
200
250
300
350
400
0:00:00 0:28:48 0:57:36 1:26:24 1:55:12 2:24:00 2:52:48 3:21:36 3:50:24
Tem
pura
ture
deg
. F
Time
Flare Tip Temperature Thu 7/21/11 Afternoon
Level 1
Level 2
Level 3
14
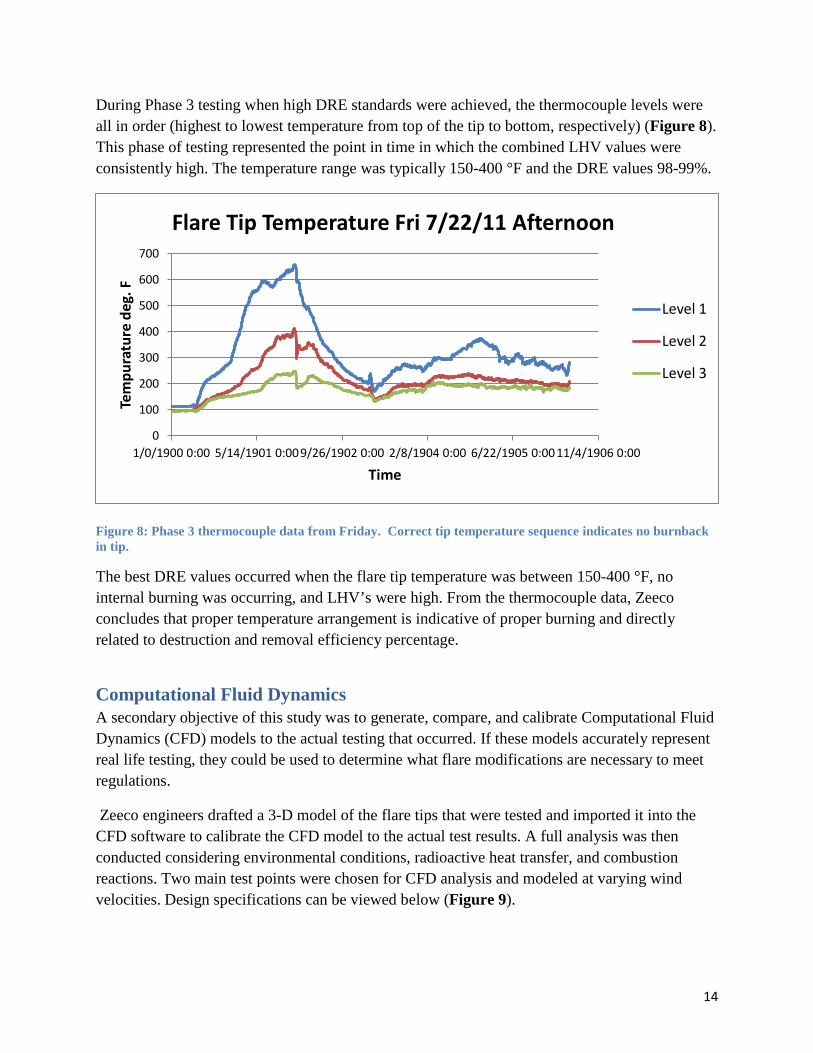
During Phase 3 testing when high DRE standards were achieved, the thermocouple levels were all in order (highest to lowest temperature from top of the tip to bottom, respectively) (Figure 8). This phase of testing represented the point in time in which the combined LHV values were consistently high. The temperature range was typically 150-400 °F and the DRE values 98-99%.
Figure 8: Phase 3 thermocouple data from Friday. Correct tip temperature sequence indicates no burnback in tip.
The best DRE values occurred when the flare tip temperature was between 150-400 °F, no internal burning was occurring, and LHV’s were high. From the thermocouple data, Zeeco concludes that proper temperature arrangement is indicative of proper burning and directly related to destruction and removal efficiency percentage.
Computational Fluid Dynamics A secondary objective of this study was to generate, compare, and calibrate Computational Fluid Dynamics (CFD) models to the actual testing that occurred. If these models accurately represent real life testing, they could be used to determine what flare modifications are necessary to meet regulations.
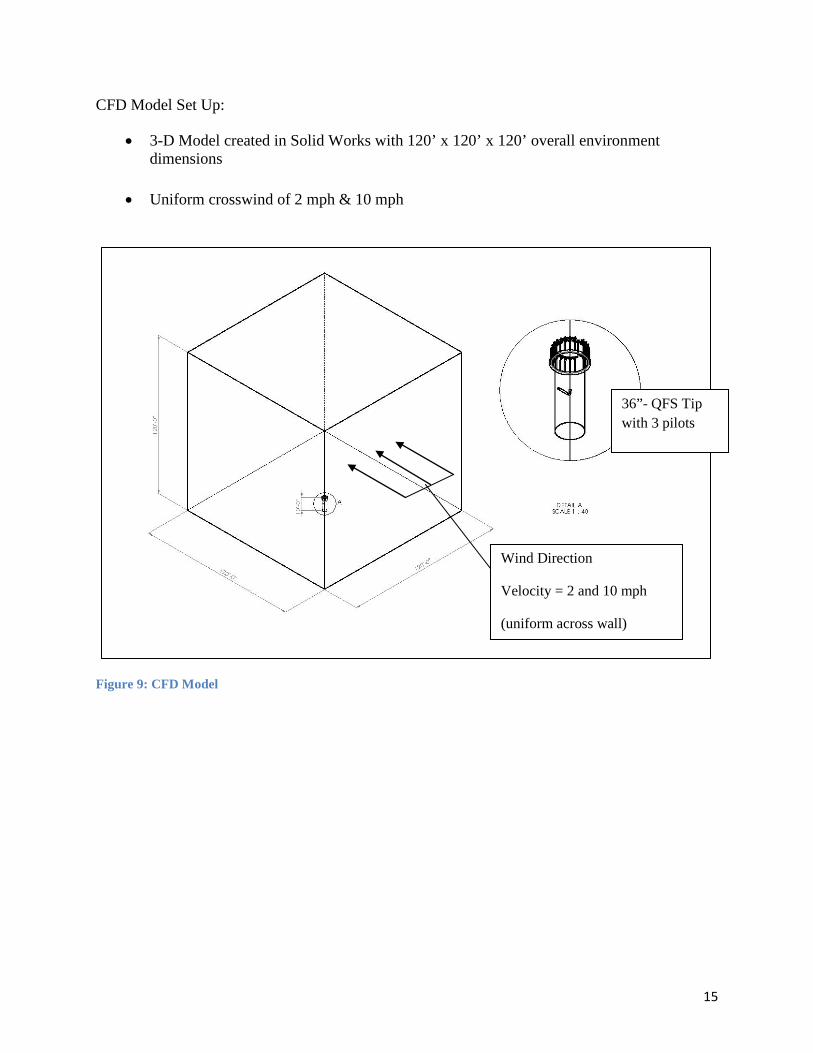
Zeeco engineers drafted a 3-D model of the flare tips that were tested and imported it into the CFD software to calibrate the CFD model to the actual test results. A full analysis was then conducted considering environmental conditions, radioactive heat transfer, and combustion reactions. Two main test points were chosen for CFD analysis and modeled at varying wind velocities. Design specifications can be viewed below (Figure 9).
0
100
200
300
400
500
600
700
1/0/1900 0:00 5/14/1901 0:00 9/26/1902 0:00 2/8/1904 0:00 6/22/1905 0:00 11/4/1906 0:00
Tem
pura
ture
deg
. F
Time
Flare Tip Temperature Fri 7/22/11 Afternoon
Level 1
Level 2
Level 3
15
CFD Model Set Up:
• 3-D Model created in Solid Works with 120’ x 120’ x 120’ overall environment dimensions
• Uniform crosswind of 2 mph & 10 mph
Figure 9: CFD Model
36”- QFS Tip with 3 pilots
Wind Direction
Velocity = 2 and 10 mph
(uniform across wall)
16
Flow Conditions Modeled in CFD
Test Point #14:
• Gas Flow = 990 SCFH (100% CH4) • Upper Steam Flow = 735 lbs/hr • Center Steam Flow = 500 lbs/hr
Test Point #111:
• Gas Flow = 6648 SCFH (100% CH4) • Upper Steam Flow = 530 lbs/hr • Center Steam Flow = 199 lbs/hr
Comparison with actual DRE results was the main method used to determine the accuracy of the CFD modeling. After the CFD design was complete, DRE was calculated through the method described below and compared with the experimental value determined through the outdoor testing. The destruction efficiency for the CFD model was calculated as follows:
• Downwind Wall of environment was separated out
• Mass flow through downwind wall was calculated (from CFD software)
• Mass Fraction of components CH4, CO2, H2O, & Air were also calculated from CFD software)
• Destruction efficiency of downwind wall equal to: Destruction Efficiency = 𝑀𝑎𝑠𝑠𝐹𝑟𝑎𝑐 𝐶𝐻4 𝑥 𝑀𝑎𝑠𝑠 𝑓𝑙𝑜𝑤 𝐷𝑜𝑤𝑛𝑤𝑖𝑛𝑑
𝑇𝑜𝑡𝑎𝑙 𝐶𝐻4 𝑀𝑎𝑠𝑠 𝐹𝑙𝑜𝑤
17
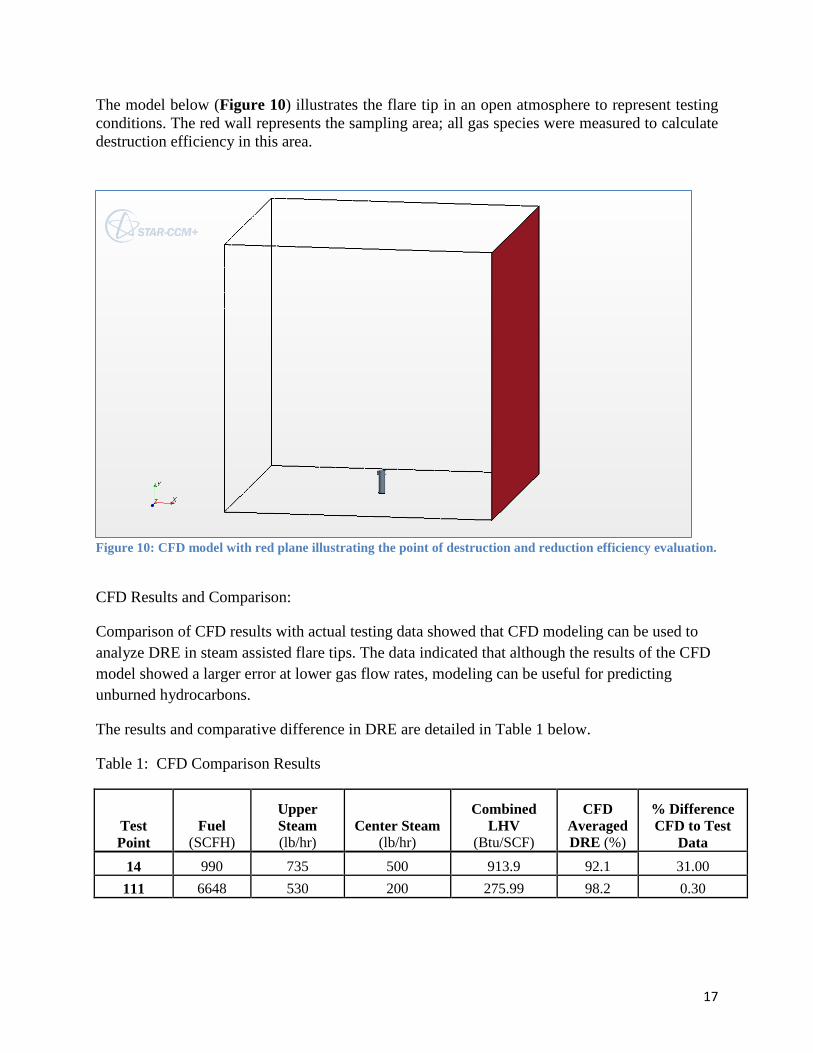
The model below (Figure 10) illustrates the flare tip in an open atmosphere to represent testing conditions. The red wall represents the sampling area; all gas species were measured to calculate destruction efficiency in this area.
Figure 10: CFD model with red plane illustrating the point of destruction and reduction efficiency evaluation.
CFD Results and Comparison:
Comparison of CFD results with actual testing data showed that CFD modeling can be used to analyze DRE in steam assisted flare tips. The data indicated that although the results of the CFD model showed a larger error at lower gas flow rates, modeling can be useful for predicting unburned hydrocarbons.
The results and comparative difference in DRE are detailed in Table 1 below.
Table 1: CFD Comparison Results
Test Point
Fuel (SCFH)
Upper Steam (lb/hr)
Center Steam (lb/hr)
Combined LHV
(Btu/SCF)
CFD Averaged DRE (%)
% Difference CFD to Test
Data 14 990 735 500 913.9 92.1 31.00
111 6648 530 200 275.99 98.2 0.30
18
Developing a link between CFD and testing through tailored combustion parameters will allow engineers to more accurately predict DRE in the future. Zeeco continues to research better ways of analyzing combustion efficiency through CFD.
Results and Conclusions Zeeco has learned that while constant steam injection (cooling steam) provides thermal protection to steam injection equipment, improper steam injection can create downsides. Though steam is an integral part of maintaining the integrity of flare components, improper use can become an impediment to the destruction and removal efficiency of hydrocarbons. Many factors must be considered when utilizing steam for combustion. From this research, Zeeco now believes adequate combustion is not possible when using API 521 specified purge gas and current steam cooling rates.
The data from this testing advocates that the combined steam and gas LHV is a key component for complete combustion. Data consistently showed that the DRE achieved for a mixture followed the same trend as the combined LHV.
Along with LHV, the temperature profile can be useful for determining whether proper combustion is occurring. Profiles with high temperatures along the perimeter and lower temperatures inside indicate little to no tip burnback and help increase DRE.
The emissions calculations and thermocouple logs show that the DRE is influenced not only by the amount of steam introduced into the flare system, but also by the type of steam assist applied to the flare—a theory that is supported by CFD modeling developed in Phase 3.
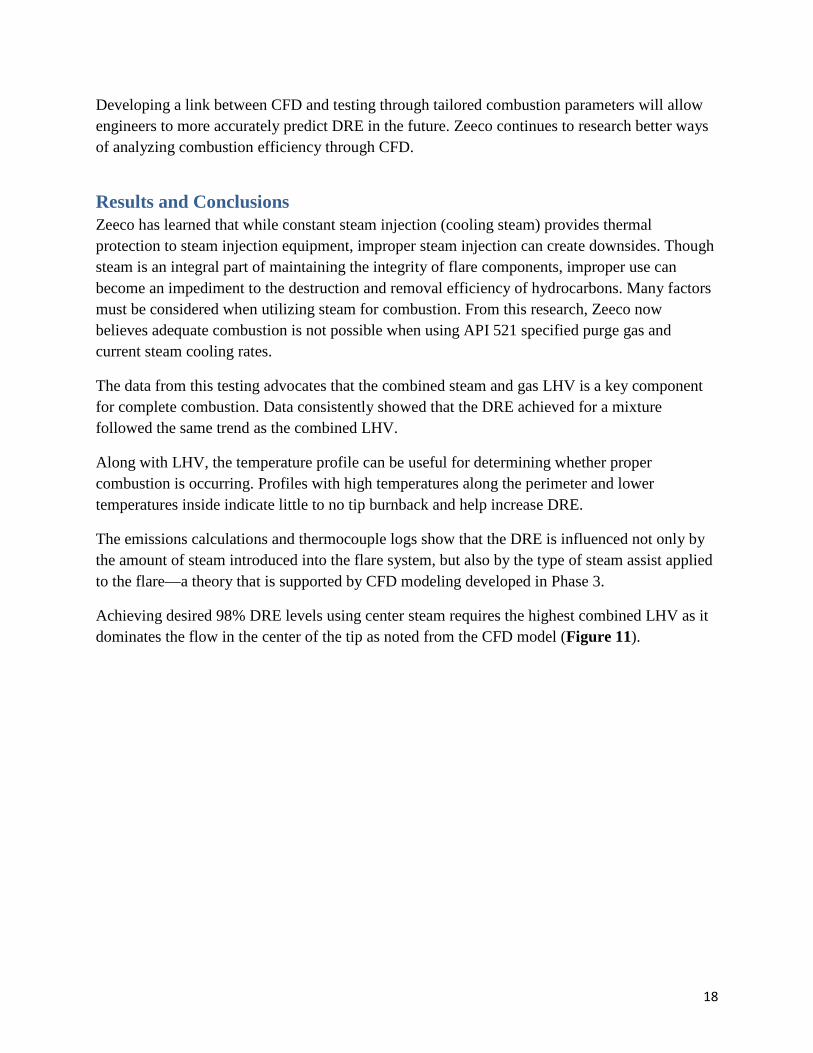
Achieving desired 98% DRE levels using center steam requires the highest combined LHV as it dominates the flow in the center of the tip as noted from the CFD model (Figure 11).
19
Figure 11: CFD model Velocity Magnitude Profile limited to a scale of 50 meters per second.
From this study, we are learning how to operate flares more efficiently as well as the effectiveness of CFD modeling in the design, evaluation, and operation of flares. Proper training for operators will be crucial as the flare industry moves forward.
Recommendations After analyzing the testing data, Zeeco determined that in order to reach desirable DREs either fuel rates will have to be increased or recommended steam rates decreased. Minor reduction of steam rates is possible; however, the necessary reduction to the steam rates will likely result in condensate at the tip. As a result, an increase in the fuel flow rate will be required to raise the overall LHV. As cost of operation is a major factor in any operations, the use of Nitrogen as a purge gas instead of increasing fuel gas may be a more economical decision.
Industrial recommendations are the following:
• An overall LHV of at least 225 Btu/SCF be maintained when using both upper and center steam. This can be accomplished by increasing the fuel flow rate or by decreasing the steam flow rate to ensure proper DRE rates.
• Utilize Nitrogen as a purge gas.
Center Steam flow dominates flow pattern in center region. Some flow on side walls diverts in both up/down directions.
20
Appendix A: Graphical Analysis
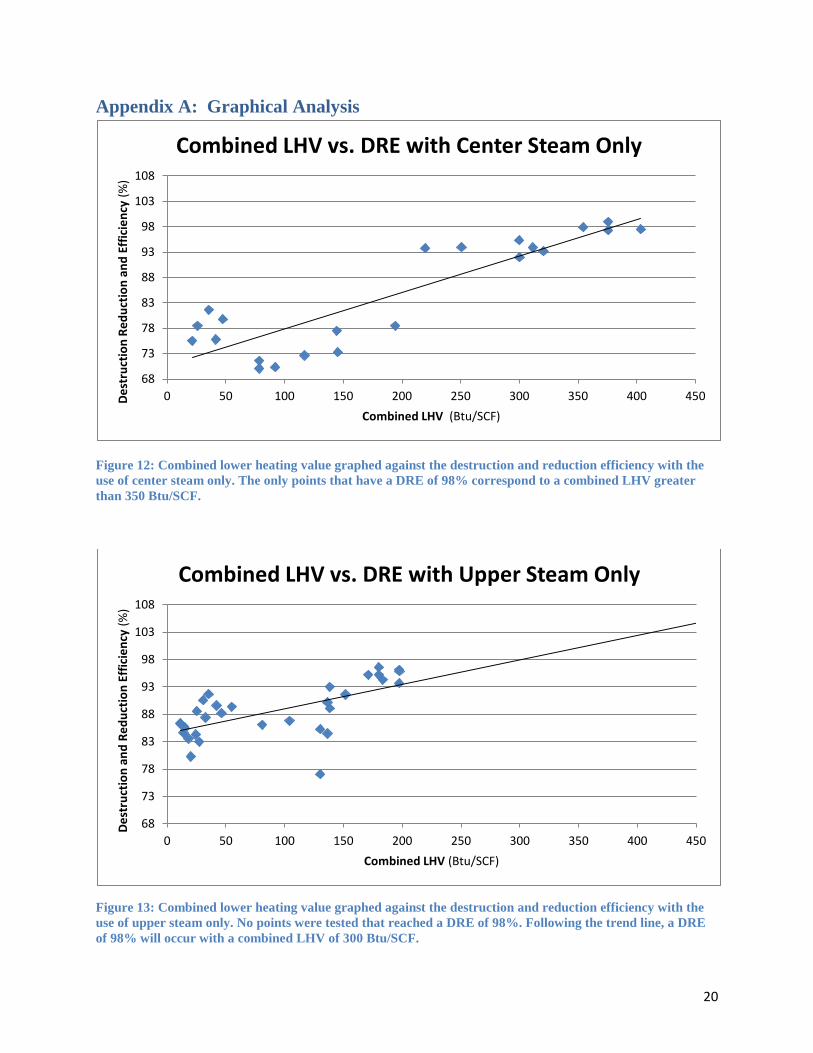
Figure 12: Combined lower heating value graphed against the destruction and reduction efficiency with the use of center steam only. The only points that have a DRE of 98% correspond to a combined LHV greater than 350 Btu/SCF.
Figure 13: Combined lower heating value graphed against the destruction and reduction efficiency with the use of upper steam only. No points were tested that reached a DRE of 98%. Following the trend line, a DRE of 98% will occur with a combined LHV of 300 Btu/SCF.
68
73
78
83
88
93
98
103
108
0 50 100 150 200 250 300 350 400 450 Dest
ruct
ion
Redu
ctio
n an
d Ef
ficie
ncy
(%)
Combined LHV (Btu/SCF)
Combined LHV vs. DRE with Center Steam Only
68
73
78
83
88
93
98
103
108
0 50 100 150 200 250 300 350 400 450
Dest
ruct
ion
and
Redu
ctio
n Ef
ficie
ncy
(%)
Combined LHV (Btu/SCF)
Combined LHV vs. DRE with Upper Steam Only
21
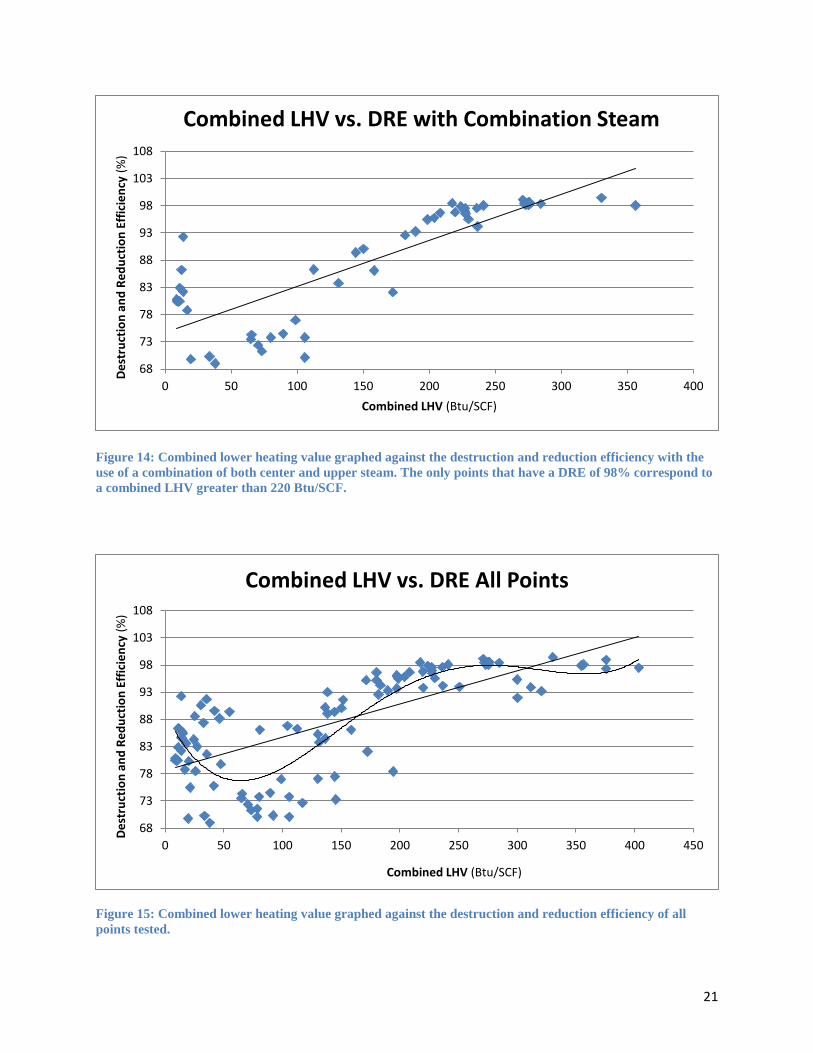
Figure 14: Combined lower heating value graphed against the destruction and reduction efficiency with the use of a combination of both center and upper steam. The only points that have a DRE of 98% correspond to a combined LHV greater than 220 Btu/SCF.
Figure 15: Combined lower heating value graphed against the destruction and reduction efficiency of all points tested.
68
73
78
83
88
93
98
103
108
0 50 100 150 200 250 300 350 400
Dest
ruct
ion
and
Redu
ctio
n Ef
ficie
ncy
(%)
Combined LHV (Btu/SCF)
Combined LHV vs. DRE with Combination Steam
68
73
78
83
88
93
98
103
108
0 50 100 150 200 250 300 350 400 450
Dest
ruct
ion
and
Redu
ctio
n Ef
ficie
ncy
(%)
Combined LHV (Btu/SCF)
Combined LHV vs. DRE All Points
22
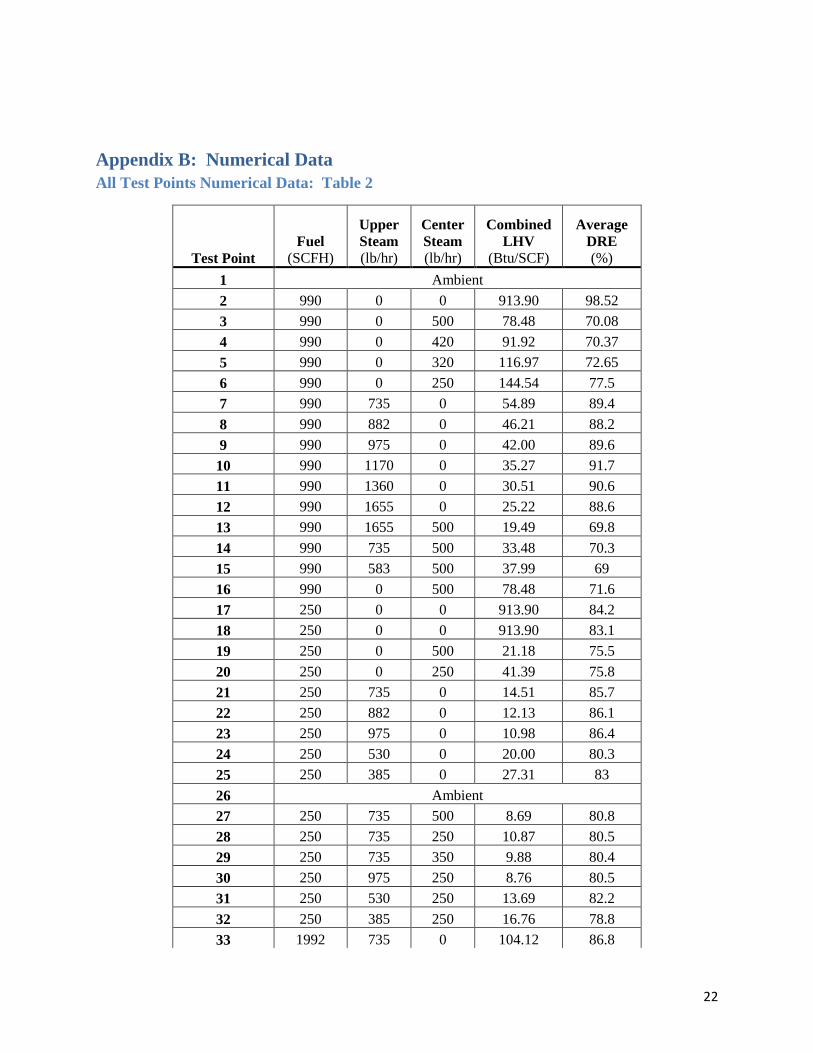
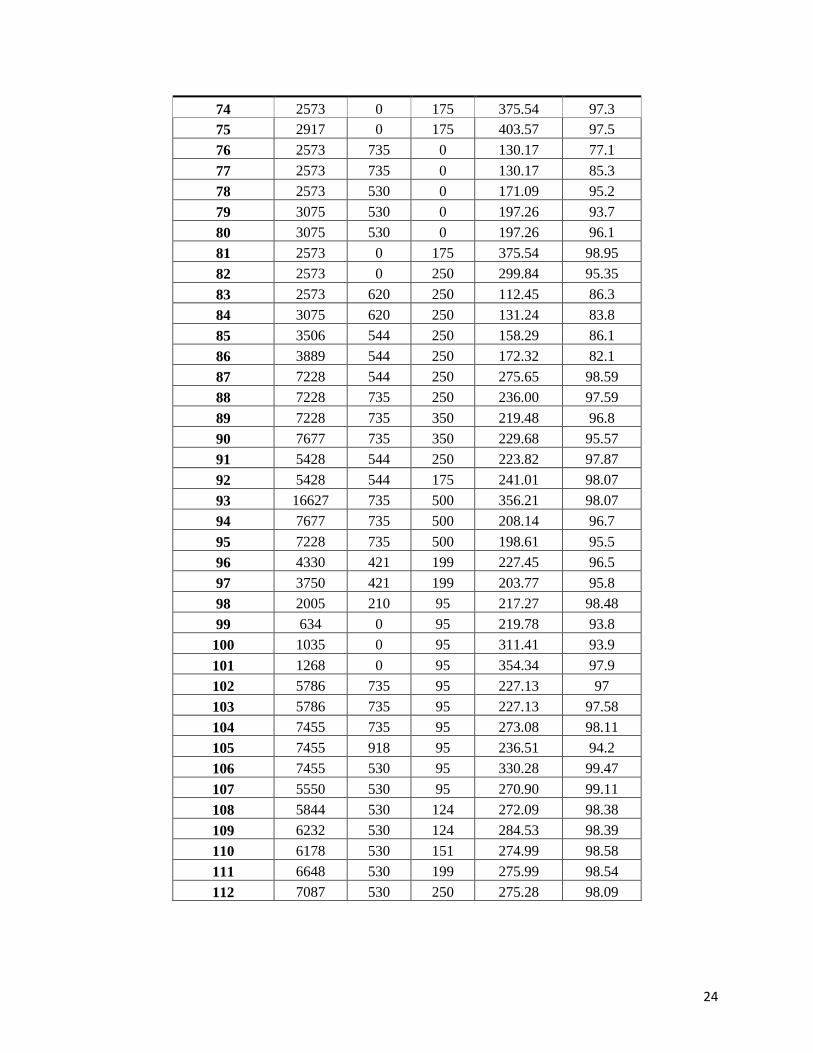
Appendix B: Numerical Data All Test Points Numerical Data: Table 2
Test Point Fuel
(SCFH)
Upper Steam (lb/hr)
Center Steam (lb/hr)
Combined LHV
(Btu/SCF)
Average DRE (%)
1 Ambient 2 990 0 0 913.90 98.52 3 990 0 500 78.48 70.08 4 990 0 420 91.92 70.37 5 990 0 320 116.97 72.65 6 990 0 250 144.54 77.5 7 990 735 0 54.89 89.4 8 990 882 0 46.21 88.2 9 990 975 0 42.00 89.6 10 990 1170 0 35.27 91.7 11 990 1360 0 30.51 90.6 12 990 1655 0 25.22 88.6 13 990 1655 500 19.49 69.8 14 990 735 500 33.48 70.3 15 990 583 500 37.99 69 16 990 0 500 78.48 71.6 17 250 0 0 913.90 84.2 18 250 0 0 913.90 83.1 19 250 0 500 21.18 75.5 20 250 0 250 41.39 75.8 21 250 735 0 14.51 85.7 22 250 882 0 12.13 86.1 23 250 975 0 10.98 86.4 24 250 530 0 20.00 80.3 25 250 385 0 27.31 83 26 Ambient 27 250 735 500 8.69 80.8 28 250 735 250 10.87 80.5 29 250 735 350 9.88 80.4 30 250 975 250 8.76 80.5 31 250 530 250 13.69 82.2 32 250 385 250 16.76 78.8 33 1992 735 0 104.12 86.8
23
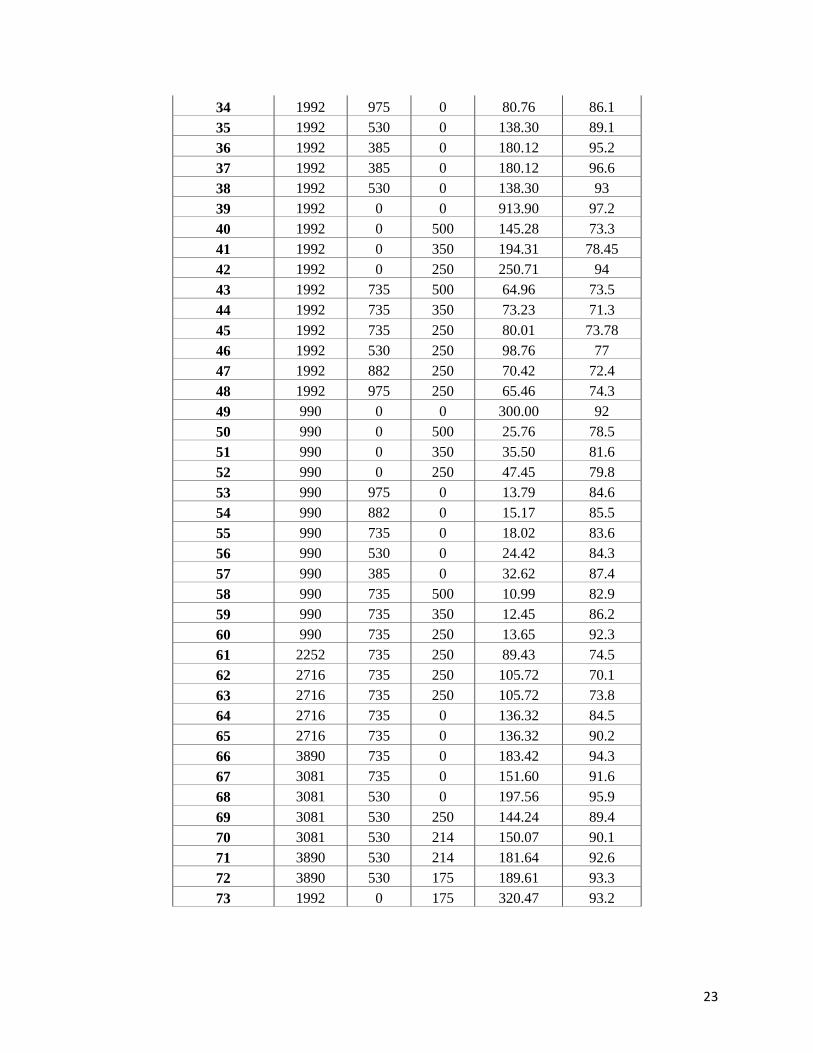
34 1992 975 0 80.76 86.1 35 1992 530 0 138.30 89.1 36 1992 385 0 180.12 95.2 37 1992 385 0 180.12 96.6 38 1992 530 0 138.30 93 39 1992 0 0 913.90 97.2 40 1992 0 500 145.28 73.3 41 1992 0 350 194.31 78.45 42 1992 0 250 250.71 94 43 1992 735 500 64.96 73.5 44 1992 735 350 73.23 71.3 45 1992 735 250 80.01 73.78 46 1992 530 250 98.76 77 47 1992 882 250 70.42 72.4 48 1992 975 250 65.46 74.3 49 990 0 0 300.00 92 50 990 0 500 25.76 78.5 51 990 0 350 35.50 81.6 52 990 0 250 47.45 79.8 53 990 975 0 13.79 84.6 54 990 882 0 15.17 85.5 55 990 735 0 18.02 83.6 56 990 530 0 24.42 84.3 57 990 385 0 32.62 87.4 58 990 735 500 10.99 82.9 59 990 735 350 12.45 86.2 60 990 735 250 13.65 92.3 61 2252 735 250 89.43 74.5 62 2716 735 250 105.72 70.1 63 2716 735 250 105.72 73.8 64 2716 735 0 136.32 84.5 65 2716 735 0 136.32 90.2 66 3890 735 0 183.42 94.3 67 3081 735 0 151.60 91.6 68 3081 530 0 197.56 95.9 69 3081 530 250 144.24 89.4 70 3081 530 214 150.07 90.1 71 3890 530 214 181.64 92.6 72 3890 530 175 189.61 93.3 73 1992 0 175 320.47 93.2
24
74 2573 0 175 375.54 97.3 75 2917 0 175 403.57 97.5 76 2573 735 0 130.17 77.1 77 2573 735 0 130.17 85.3 78 2573 530 0 171.09 95.2 79 3075 530 0 197.26 93.7 80 3075 530 0 197.26 96.1 81 2573 0 175 375.54 98.95 82 2573 0 250 299.84 95.35 83 2573 620 250 112.45 86.3 84 3075 620 250 131.24 83.8 85 3506 544 250 158.29 86.1 86 3889 544 250 172.32 82.1 87 7228 544 250 275.65 98.59 88 7228 735 250 236.00 97.59 89 7228 735 350 219.48 96.8 90 7677 735 350 229.68 95.57 91 5428 544 250 223.82 97.87 92 5428 544 175 241.01 98.07 93 16627 735 500 356.21 98.07 94 7677 735 500 208.14 96.7 95 7228 735 500 198.61 95.5 96 4330 421 199 227.45 96.5 97 3750 421 199 203.77 95.8 98 2005 210 95 217.27 98.48 99 634 0 95 219.78 93.8 100 1035 0 95 311.41 93.9 101 1268 0 95 354.34 97.9 102 5786 735 95 227.13 97 103 5786 735 95 227.13 97.58 104 7455 735 95 273.08 98.11 105 7455 918 95 236.51 94.2 106 7455 530 95 330.28 99.47 107 5550 530 95 270.90 99.11 108 5844 530 124 272.09 98.38 109 6232 530 124 284.53 98.39 110 6178 530 151 274.99 98.58 111 6648 530 199 275.99 98.54 112 7087 530 250 275.28 98.09
25
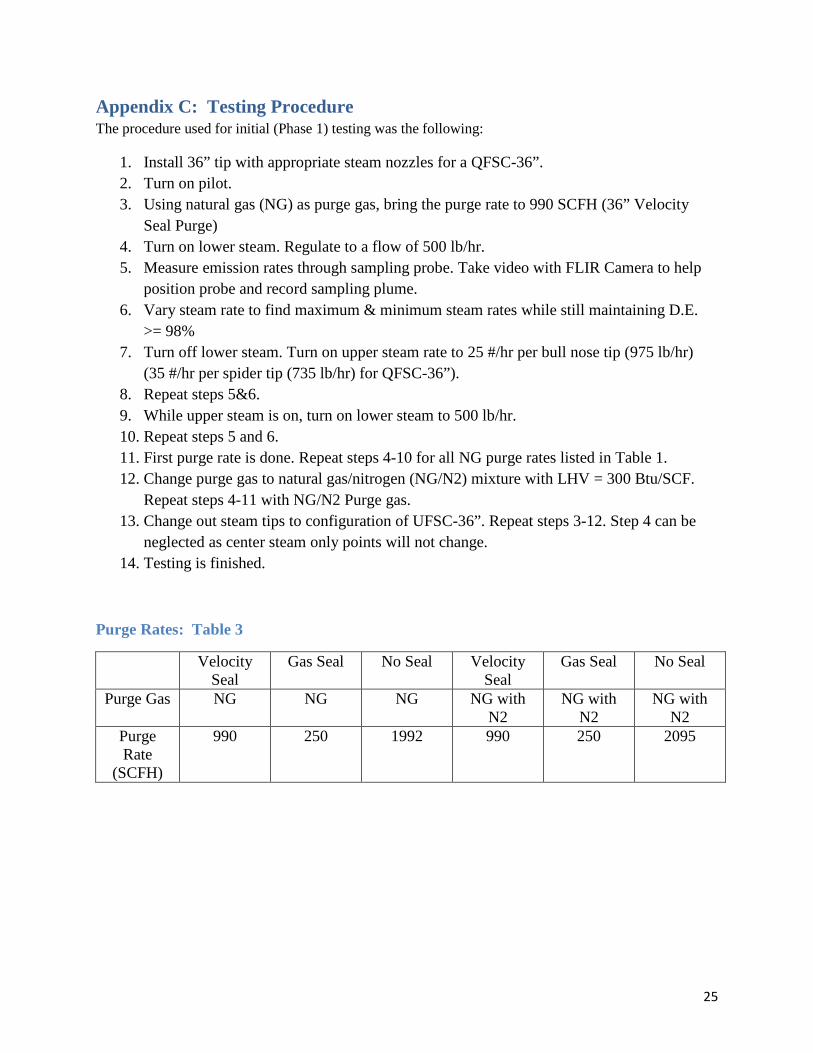
Appendix C: Testing Procedure The procedure used for initial (Phase 1) testing was the following:
1. Install 36” tip with appropriate steam nozzles for a QFSC-36”. 2. Turn on pilot. 3. Using natural gas (NG) as purge gas, bring the purge rate to 990 SCFH (36” Velocity
Seal Purge) 4. Turn on lower steam. Regulate to a flow of 500 lb/hr. 5. Measure emission rates through sampling probe. Take video with FLIR Camera to help
position probe and record sampling plume. 6. Vary steam rate to find maximum & minimum steam rates while still maintaining D.E.
>= 98% 7. Turn off lower steam. Turn on upper steam rate to 25 #/hr per bull nose tip (975 lb/hr)
(35 #/hr per spider tip (735 lb/hr) for QFSC-36”). 8. Repeat steps 5&6. 9. While upper steam is on, turn on lower steam to 500 lb/hr. 10. Repeat steps 5 and 6. 11. First purge rate is done. Repeat steps 4-10 for all NG purge rates listed in Table 1. 12. Change purge gas to natural gas/nitrogen (NG/N2) mixture with LHV = 300 Btu/SCF.
Repeat steps 4-11 with NG/N2 Purge gas. 13. Change out steam tips to configuration of UFSC-36”. Repeat steps 3-12. Step 4 can be
neglected as center steam only points will not change. 14. Testing is finished.
Purge Rates: Table 3
Velocity Seal
Gas Seal No Seal Velocity Seal
Gas Seal No Seal
Purge Gas NG NG NG NG with N2
NG with N2
NG with N2
Purge Rate
(SCFH)
990 250 1992 990 250 2095
26
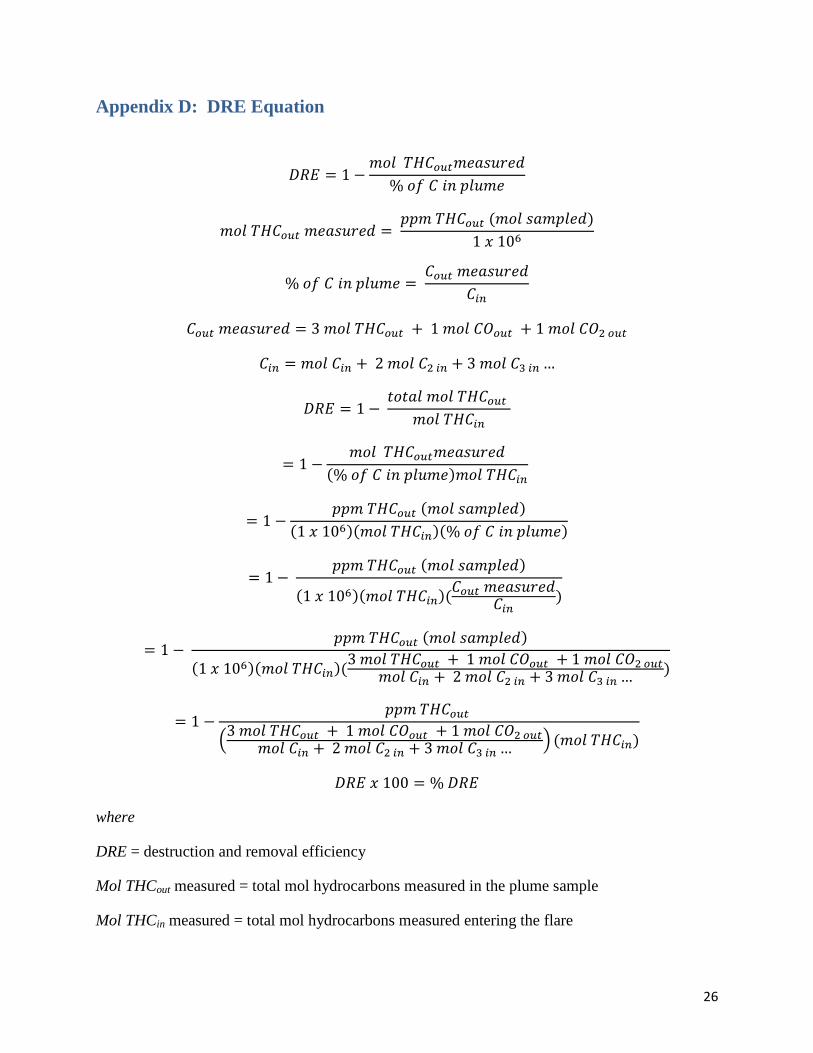
Appendix D: DRE Equation
𝐷𝑅𝐸 = 1 −𝑚𝑜𝑙 𝑇𝐻𝐶𝑜𝑢𝑡𝑚𝑒𝑎𝑠𝑢𝑟𝑒𝑑
% 𝑜𝑓 𝐶 𝑖𝑛 𝑝𝑙𝑢𝑚𝑒
𝑚𝑜𝑙 𝑇𝐻𝐶𝑜𝑢𝑡 𝑚𝑒𝑎𝑠𝑢𝑟𝑒𝑑 = 𝑝𝑝𝑚 𝑇𝐻𝐶𝑜𝑢𝑡 (𝑚𝑜𝑙 𝑠𝑎𝑚𝑝𝑙𝑒𝑑)
1 𝑥 106
% 𝑜𝑓 𝐶 𝑖𝑛 𝑝𝑙𝑢𝑚𝑒 = 𝐶𝑜𝑢𝑡 𝑚𝑒𝑎𝑠𝑢𝑟𝑒𝑑
𝐶𝑖𝑛
𝐶𝑜𝑢𝑡 𝑚𝑒𝑎𝑠𝑢𝑟𝑒𝑑 = 3 𝑚𝑜𝑙 𝑇𝐻𝐶𝑜𝑢𝑡 + 1 𝑚𝑜𝑙 𝐶𝑂𝑜𝑢𝑡 + 1 𝑚𝑜𝑙 𝐶𝑂2 𝑜𝑢𝑡
𝐶𝑖𝑛 = 𝑚𝑜𝑙 𝐶𝑖𝑛 + 2 𝑚𝑜𝑙 𝐶2 𝑖𝑛 + 3 𝑚𝑜𝑙 𝐶3 𝑖𝑛 …
𝐷𝑅𝐸 = 1 − 𝑡𝑜𝑡𝑎𝑙 𝑚𝑜𝑙 𝑇𝐻𝐶𝑜𝑢𝑡
𝑚𝑜𝑙 𝑇𝐻𝐶𝑖𝑛
= 1 −𝑚𝑜𝑙 𝑇𝐻𝐶𝑜𝑢𝑡𝑚𝑒𝑎𝑠𝑢𝑟𝑒𝑑
(% 𝑜𝑓 𝐶 𝑖𝑛 𝑝𝑙𝑢𝑚𝑒)𝑚𝑜𝑙 𝑇𝐻𝐶𝑖𝑛
= 1 −𝑝𝑝𝑚 𝑇𝐻𝐶𝑜𝑢𝑡 (𝑚𝑜𝑙 𝑠𝑎𝑚𝑝𝑙𝑒𝑑)
(1 𝑥 106)(𝑚𝑜𝑙 𝑇𝐻𝐶𝑖𝑛)(% 𝑜𝑓 𝐶 𝑖𝑛 𝑝𝑙𝑢𝑚𝑒)
= 1 − 𝑝𝑝𝑚 𝑇𝐻𝐶𝑜𝑢𝑡 (𝑚𝑜𝑙 𝑠𝑎𝑚𝑝𝑙𝑒𝑑)
(1 𝑥 106)(𝑚𝑜𝑙 𝑇𝐻𝐶𝑖𝑛)(𝐶𝑜𝑢𝑡 𝑚𝑒𝑎𝑠𝑢𝑟𝑒𝑑𝐶𝑖𝑛)
= 1 − 𝑝𝑝𝑚 𝑇𝐻𝐶𝑜𝑢𝑡 (𝑚𝑜𝑙 𝑠𝑎𝑚𝑝𝑙𝑒𝑑)
(1 𝑥 106)(𝑚𝑜𝑙 𝑇𝐻𝐶𝑖𝑛)(3 𝑚𝑜𝑙 𝑇𝐻𝐶𝑜𝑢𝑡 + 1 𝑚𝑜𝑙 𝐶𝑂𝑜𝑢𝑡 + 1 𝑚𝑜𝑙 𝐶𝑂2 𝑜𝑢𝑡𝑚𝑜𝑙 𝐶𝑖𝑛 + 2 𝑚𝑜𝑙 𝐶2 𝑖𝑛 + 3 𝑚𝑜𝑙 𝐶3 𝑖𝑛 … )
= 1 −𝑝𝑝𝑚 𝑇𝐻𝐶𝑜𝑢𝑡
�3 𝑚𝑜𝑙 𝑇𝐻𝐶𝑜𝑢𝑡 + 1 𝑚𝑜𝑙 𝐶𝑂𝑜𝑢𝑡 + 1 𝑚𝑜𝑙 𝐶𝑂2 𝑜𝑢𝑡𝑚𝑜𝑙 𝐶𝑖𝑛 + 2 𝑚𝑜𝑙 𝐶2 𝑖𝑛 + 3 𝑚𝑜𝑙 𝐶3 𝑖𝑛 … � (𝑚𝑜𝑙 𝑇𝐻𝐶𝑖𝑛)
𝐷𝑅𝐸 𝑥 100 = % 𝐷𝑅𝐸
where
DRE = destruction and removal efficiency
Mol THCout measured = total mol hydrocarbons measured in the plume sample
Mol THCin measured = total mol hydrocarbons measured entering the flare


