71


Access and Opportunity Committee Meeting Minutes
Date/Time: June 13, 2017 – 10:30 a.m. – 12:30 p.m.
Place: Everett City Hall 484 Broadway
Everett, MA Committee Members Present: Chair Jill Lacey Griffin Chairman Steve Crosby Commissioner Bruce Stebbins Nader Acevedo Chelan Brown Eddie Corbin Kate Harrison Beverley Johnson Susan Moir John Perez Jennie Peterson Mei-Ling Rodriguez Jason Rosewell Liz Skidmore Shelley Webster Call to Order 10:46 a.m. Chair Jill Griffin called to order the Access and Opportunity Committee Meeting.
All committee members in attendance introduced themselves and their organizations.
Approval of Minutes 10:50 a.m. After some discussion about additional comments that should be included in the
May 9th Minutes regarding apprenticeships with sub-contractors, the Minutes from the Access and Opportunity Committee (“AOC”) meeting held on May 9, 2017 were approved by committee members unanimously.
Wynn’s Report 10:51 a.m. Jill Griffin turned the meeting over to Jennie Peterson, Manager/Development for
Wynn. Highlights included Minority Business Enterprise (“MBE”), Women Business Enterprise (“WBE”) and Veteran Business Enterprise (“VBE”) Participation Goals, Contracts Awarded and Outreach efforts for both Design and

Construction. As far as outreach, Shelley Webster mentioned they are finalizing their bi-weekly email communication and giving final notice to local Chambers of Commerce, Wynn/Suffolk sub-contractor and supplier database, and diverse business group partners: Supplier Diversity Office, GNEMSDC (Greater New England Minority Supplier Development Council), Mass Minority Contractors Association, Center for Women & Enterprise and the Hispanic American Institute. Ms. Peterson went on to say that they are focusing on FF&E and mill work now and have sent requests for those workers. She went through all of the events that they had in May, including the Hispanic American Institute Quarterly Breakfast on May 19th and the Massport Diversity Summit held on May 23rd. Shelley Webster added that they are still looking for participation there. There was also an annual gathering of the Northshore Latino Chamber of Commerce on May 24th. Ms. Peterson presented Wynn’s update on M/W/VBE Construction and Workforce Participation. She provided the participation numbers and reviewed the contracts awarded as of the end of May. A question was asked regarding whether companies have multiple contracts and she said that there are several and the company Broco Oil came to mind.
10:59 a.m. Jennie Peterson went on to talk about the Construction Workforce Outreach
efforts. She said there is ongoing outreach and work with community partners and Career Centers, including monthly reminders about Building Trades Apprentice Application Opportunities. They are continuing referrals for job seekers to apprenticeships and sub-contractors. Shelley Webster started going over all of the outreach events in May, including the YouthBuild OSHA Stand Down event in Roxbury, which involved contributing to the building of a house in Roxbury. As a result of that event they realized the Indian population participation numbers are low, so they will collaborate with them to get those numbers up.
11:03 a.m. Shelley Webster mentioned the Ironworkers Female Apprenticeship Opportunity
event on May 31st and introduced Kevin Collins, who was there to represent the Ironworkers Local 7 in Boston. Mr. Collins introduced himself and explained how he has been working closely with Suffolk and Ms. Webster on this project for a year and a half and went over what their goals are within the union. When asked how long he would be on the site, Mr. Collins answered until the end.
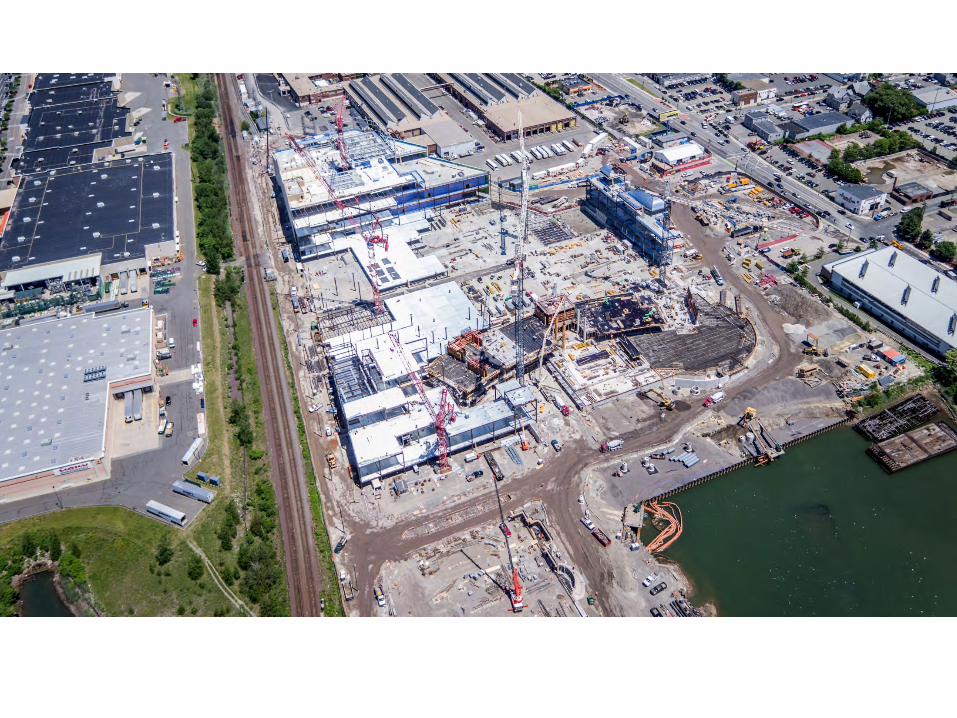
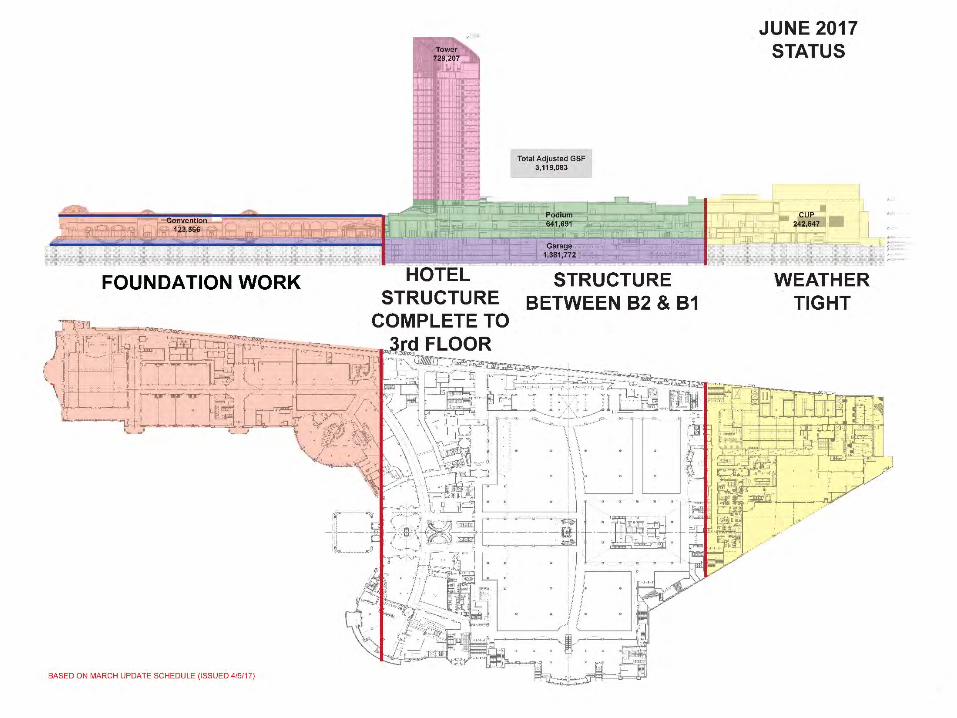
11:09 a.m. Jennie Peterson then showed various photos of the recent events including: the
OSHA Stand Down, the Veteran Job Fair and the Massport Diversity Summit. She also showed current photos of the site, pointing out various structures. She said the key activities are concrete and iron work. She said the garage levels are coming together, as well as the foundation work in the concrete podium. She added the Central Facilities plant is now weather tight. She said by June 2018 both the curtain wall and the Central Facilities Plant will be complete.
11:15 a.m. Both Jennie Peterson and Shelley Webster wrapped up the presentation by going
through the Workforce Data, highlighting the contractors with the best diversity efforts. When the presentation was opened up to questions/comments, there was shared recognition concerning the lower plasterer and cement numbers. When asked why that is Ms. Webster said it’s because they are not on the job yet. When asked about the process about addressing issues like these, Ms. Webster said they have monthly meetings with business agents and these kinds of issues get reported in those meetings. She said that many companies have had the same numbers since

they arrived. She said they ask them to let them know when the numbers change, but some companies (usually highly specialized trades) haven’t brought on other people; it’s been the same people on the job from the start. Ms. Peterson added that they are paying attention to those numbers and addressing issues with those companies.
11:32 a.m. When the meeting was opened up to discussion from the rest of the committee and
community members the following things/concerns/suggestions were addressed: - Using the High Impact Performers Analysis to present Wynn’s
Diversity Workforce Report - The low diversity numbers in apprenticeships: this is a regional issue
and was discussed at length. Jason Rosewell suggested there be a succession plan and that they are trying to facilitate a conversation with business agents to achieve compliance, but it goes beyond that. He said the problem is that the business agents don’t know when the next big job is coming and suggested they have a succession plan to map out where the work is coming from and where it is going. He added that there are challenges like these everywhere noting an example in Las Vegas. There was a suggestion from a community member to bring the business agents and the apprentice directors together.
MGM’s Report 11:56 a.m. Jill Griffin then turned the meeting over to MGM and Chelan Brown, Diversity
Specialist, Construction and Operations. Ms. Brown began their presentation with their update on outreach. She noted Minority Business Enterprise (“MBE”), Women Business Enterprise (“WBE”) and Veteran Business Enterprise (“VBE”) outreach to a list of diverse construction companies. She then provided an update on the Community Partners Network (“CPN”), noting the new membership of the People of Color Coalition in Springfield. She went on to say that they need to reach out more when it comes to membership. She provided an update on the Advocacy Team, noting the Baystate Medical Center project. She then went on to give updates on the Work Readiness/Union Referral Team and who is eligible/non-eligible.
12:02 p.m. Chelan Brown went on to talk about the Diversity Task Force (Team of 4 Union
Members and 4 CPN Members) Meeting on May 10th. She said they are still in the beginning stages but are committed to keeping it going. She then mentioned a Trades Union Meeting on May 25th noting that there were new business agents there. She talked about the CPN and Union Partnership Pledge and the members’ commitment to both the pledge and the task force. She said there was a Union and CPN Information Night on May 31st where the importance and benefits of joining a union were stressed. The four unions represented were: Carpenters, Plumbers, Sheet Metal Workers and Ironworkers.
12:09 p.m. Chelan Brown provided an update on union outreach. She said they saw the need
to meet one on one outside of MGM and business agents and have larger union meetings. Jason Rosewell added that the focus would be on paying it forward for the next project.

12:12 p.m. Ms. Brown then shifted to other diversity work and outreach events. She
mentioned the Building Pathways Program Site Tour on May 5th – 8th and the Chicopee Comprehensive High School Student Site Tour on May 23rd and 25th. She mentioned a few other examples of ongoing diversity work and then showed a video featuring father/daughter teams on the job.
12:20 p.m. The presentation was then turned over to Jason Rosewell who provided both the
union and total diversity statistics as of May 31st, noting they are meeting/exceeding their goals. In the three month look-ahead he said they are working on getting things enclosed. He said the garage pre-cast is done and the garage elevators are going up. He added the interior framing is going up and overall it is starting to take shape. In the projected labor schedule he said they are doing very well and are still on target for a September 2018 opening. He said they are working with companies to be compliant and that they want to recognize the best not the worst efforts. He noted that Mike Langone (Plumbers & Pipefitters Local Union #104) has been doing a fantastic job with union compliance.
12:31 p.m. Jill Griffin announces the next AOC Meeting will be July 11th at Springfield
Technical Community College and the meeting adjourned.
List of Documents and Other Items Used:
1. Massachusetts Gaming Commission Access and Opportunity Committee Notice of Meeting
and Agenda dated June 13, 2017 2. Massachusetts Gaming Commission Access and Opportunity Committee Draft Meeting
Minutes dated May 9, 2017 3. Wynn Boston Harbor Access and Opportunity Committee Monthly Update PowerPoint
Presentation dated May 2017 4. Wynn Boston Harbor - Construction Workforce Diversity, Date Range 9/2015 – 5/31/2017 5. MGM Springfield Access and Opportunity Committee PowerPoint Presentation dated June
13, 2017 6. MGM Springfield Workforce Diversity Report (by Company and by Union) as of May 31,
2017

Access and Opportunity CommitteeJuly 11, 2017

Agenda
1. Outreach Update
2. Construction Workforce
3. Design Commitments
4. Construction Commitments

Outreach Update

OUTREACH UPDATE
4
1. Outreach to MBE, WBE & VBE Companies
2. Community Partners Network
3. Union Partnership & Outreach
4. Other Diversity Outreach Work
5. Upcoming Events

OUTREACH TO MBE, WBE & VBE COMPANIES
5
Construction:Ref Company Location Diversity Status
1 Construction Labor Unlimited West Springfield, MA WBE
2 Dagle Electrical Construction Corp. Melrose, MA WBE
3 Sullivan & Narey Construction Co., Inc. Holyoke, MA VBE
Supplier:4 J.F. Duncan Industries, Inc. – Duray Downer, CA MBE
5 Quinette King Consulting Las Vegas, NV MBE
6 United Personnel Services, Inc. Springfield, MA WBE
Consultant:7 Hyde Business Services Medina, MN WBE

COMMUNITY PARTNERS NETWORK UPDATES
6
Outreach Update
Community Partners Network Update:
• 27 current partners representing community and social service agencies throughout Western Massachusetts
• 1 new community organization joined the CPN in June:
- Women In Business Club
• 2 Steering Committee meetings held in May

COMMUNITY PARTNERS NETWORK UPDATES
7
Sub-Committee Updates
Membership:
• Continuing membership drive for new community based organizations to join the CPN
• Planning CPN Membership Night for July 2017
COMMUNITY PARTNERS NETWORK UPDATES
8
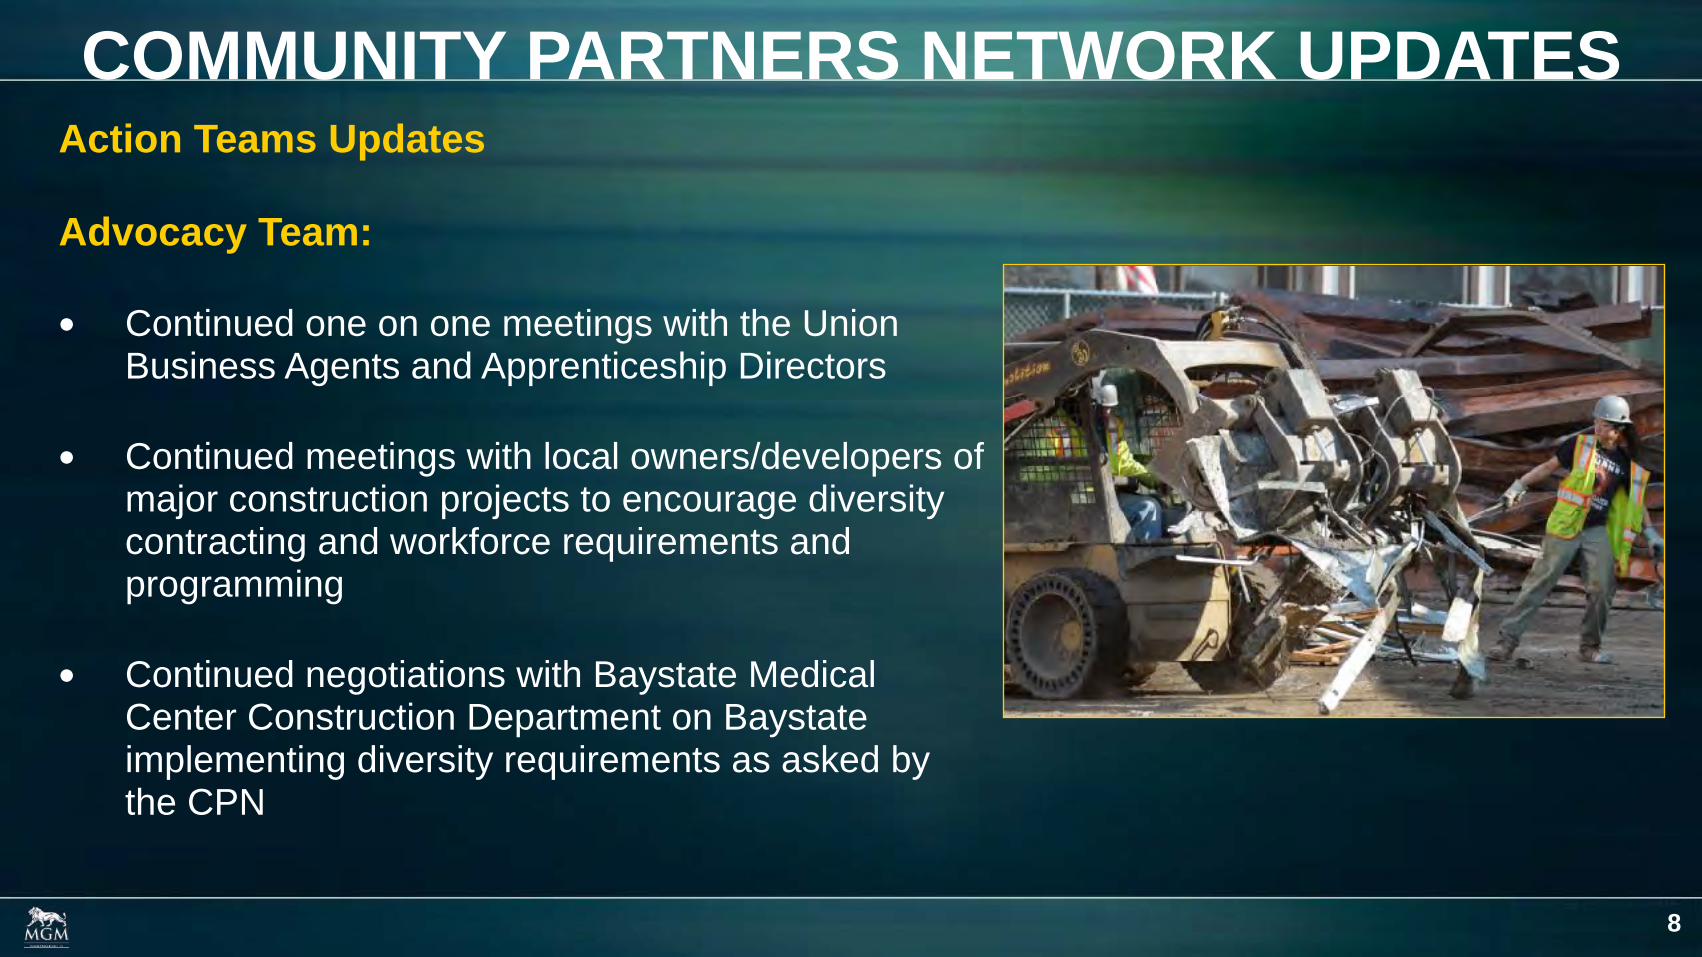
Action Teams Updates
Advocacy Team:
• Continued one on one meetings with the Union Business Agents and Apprenticeship Directors
• Continued meetings with local owners/developers of major construction projects to encourage diversity contracting and workforce requirements and programming
• Continued negotiations with Baystate Medical Center Construction Department on Baystate implementing diversity requirements as asked by the CPN

COMMUNITY PARTNERS NETWORK UPDATES
9
Action Teams Updates
Work Readiness/Union Referral Team:
• 3 sub-teams of the committee - Total Current Caseload: 257
1. Already in the union: 103 Workers
• Working with MGM to place diverse union members on the MGM Springfield project
• MGM Diversity Watch List of New Diverse Apprentices: Tracking new apprentices on our job; paying special attention to women
• Working with unions to identify other work sites that new diverse apprentices and/or union members might be able to find work
• Sharing information on these union members with other general contractors and developers looking for diverse union members. This will be piloted through the Baystate/CPN Partnership soon

COMMUNITY PARTNERS NETWORK UPDATES
10
2. Union Eligible: 50 Eligible Applications
• Working with new diverse union applicants who have been assessed as eligible
• Working with new diverse union applicants who have been assessed and determined to have high likelihood of success at being accepted into the union and in completing union apprenticeship programs
• Providing new union applicants with access to referral sources to help with any issues impeding successful placement in apprenticeship program or work site
3. Non-Eligible: 104 Not Eligible or Pending Assessment
• Working with Applicants/Referrals who were assessed and determined not eligible/ready to apply to a union apprenticeship program or who are still pending assessment
• Team works with these individuals on case management and referral to community and social service organizations to help them get union and/or work ready
• Coordinates the CPN Training/Workshops Calendar

UNION PARTNERSHIP & OUTREACH
11
• CPN Steering Committee members met with three (3) union business managers this month:
- Assistance with targeted diversity recruitment based on the needs of the individual trade union
- Assistance with upcoming new Union Apprentice Enrollment events
- Partnerships on upcoming outreach events
- Addressing challenges of newly accepted union members and working with a community sponsor to assist in retaining new members
Continued meetings and discussions with local trade unions to include:

UNION PARTNERSHIP & OUTREACH
12
• Seven (7) newly identified union members looking for work identified through outreach and added to the MGM Springfield Available Labor Pool list and shared with Tishman Construction and MGM Springfield Sub-Contractors looking for union workers
Continued referrals and tracking of new diverse union applicants in their union application process. To our knowledge, there were 8 new applicants from the Eligible Applicant Pool who put in applications at unions in June.

13
OTHER DIVERSITY WORK & OUTREACH/ EVENTS
Ongoing Diversity Work:
• Diversity Task Force Meeting
• CPN Steering Committee Meetings
• Out of Work Union Members/Contractors Meet & Greet
• New Union Apprentice & CPN Meet & Greet
• CPN Workforce Readiness Training

14
DIVERSITY SUCCESS STORIESDiversity Success Story: July 2017 Spotlight S-Cel-O The Painting Company Springfield Based M/WBE

Construction Workforce

WORKFORCE DIVERSITY STATISTICS - UNION
16
(1) Statistics include all workforce reports that were received by MGM as of June 30, 2017.Notes:
AS OF JUNE 30, 2017
Group Project Goals Project To Date %
Women 6.90% 8.47%
Minority 15.30% 26.67%
Veteran 8.00% 9.36%

WORKFORCE DIVERSITY STATISTICS - TOTAL
17
(1) Statistics include all workforce reports that were received by MGM as of June 30, 2017. (2) The Diversity plan approved by the MGC allows reporting to include hours allocated to multiple diversity categories. 6.41% of total workforce hours are included in two of the
diversity categories and 0.33% of total workforce hours are included in three diversity categories. (3) While this is not a reporting requirement of the approved diversity plan, the total hours worked through 2nd Quarter 2017 is as follows:
• Approximately 38% are from Springfield/ Surrounding Communities • Approximately 59% are from Western Massachusetts • Approximately 81% are from Massachusetts
Notes:
AS OF JUNE 30, 2017
Group Project Goals Project To Date %
Women 6.90% 9.78%
Minority 15.30% 23.52%
Veteran 8.00% 10.20%

18
WORKFORCE 3 MONTH LOOK AHEAD1. Work in Progress - Water/Sewer/Gas/Electric
Infrastructure
2. Work in Progress - Generator Switch Gear Area
3. Work in Progress - Interior Fitout of 95 State
4. Work in Progress - Scaffolding
5. Work in Progress - Spray Fireproofing
6. Work in Progress - Garage Interior MEP, Sprinklers, Storm
7. Work in Progress - MEP Distribution for Podium
8. Work in Progress - Interior Masonry
9. Work in Progress - Garage Elevators
10. Work in Progress - Garage Erection
11. Work in Progress - Concrete Slab on Metal Deck
12. Work in Progress - Podium roofing
13. Work in Progress - Building Enclosure
14. Work in Progress - Exterior Framing
15. Work in Progress - Major Equipment for Central Plant
16. Work in Progress - Interior Framing
17. June 2017 - Hotel MEP
18. July 2017 - Electrical/ Low Voltage
19. August 2017 - Food Service Equipment

19
CONSTRUCTION WORKFORCEPROJECTED LABOR SCHEDULE
0
100
200
300
400
500
600
700
Jul‐17 Aug‐17 Sep‐17 Oct‐17 Nov‐17 Dec‐17 Jan‐18 Feb‐18 Mar‐18 Apr‐18 May‐18 Jun‐18 Jul‐18 Aug‐18 Sep‐18
Construction Workforce: Projected Labor ScheduleGlazers
Insulators
Teamsters
Sheet Metal Workers
Roofers
Plumbers & Pipefitters
Pile Drivers
Painters
Operating Engineers
Laborers
Iron Workers
Floorcoverers
Elevator Constructors
Electrical
Masons
Carpenters
Bricklayers

Design & Construction Commitments

DESIGN & CONSTRUCTION COMMITMENTS
21
(1) Total Commitments through June 30, 2017 are $414.2M. (2) Includes companies that are certified with the following agencies:
• MBE - Massachusetts Supplier Diversity Office or Greater New England Minority Supplier Development Council. • WBE - Massachusetts Supplier Diversity Office or Women’s Business Enterprise National Council. • VBE - United States Department of Veteran Affairs or Massachusetts Gaming Commission.
WBE = Woman-owned Business Enterprise; MBE = Minority-owned Business Enterprise; VBE = Veteran-owned Business Enterprise.
Notes:
AS OF JUNE 30, 2017
Group Project Goals Commitments Variance Company
Count Value
WBE 10.0% 19.5% 9.5% 66 $80.89M
MBE 5.0% 8.9% 3.9% 40 $36.66M
VBE 2.0% 7.6% 5.6% 23 $31.61M

Design & Consulting Commitments

DESIGN & CONSULTING COMMITMENTS
23
(1) Total Commitments through June 30, 2017 are $42.26M. (2) Includes companies that are certified with the following agencies:
• MBE - Massachusetts Supplier Diversity Office or Greater New England Minority Supplier Development Council. • WBE - Massachusetts Supplier Diversity Office or Women’s Business Enterprise National Council.• VBE - United States Department of Veteran Affairs or Massachusetts Gaming Commission.
WBE = Woman-owned Business Enterprise; MBE = Minority-owned Business Enterprise; VBE = Veteran-owned Business Enterprise.
Notes:
AS OF JUNE 30, 2017
Group Project Goals Commitments Company Count Value
WBE 10.0% 16.5% 18 $6.99M
MBE 5.0% 12.7% 16 $5.38M
VBE 2.0% 7.1% 3 $2.99M

DESIGN & CONSULTING COMMITMENTS
24
Ref Company Scope Location Diversity Status
1 AAC Investments, LLC Interior Design Los Angeles, CA WBE2 AFO Project Consulting, LLC Construction Consulting Las Vegas, NV VBE3 Akal Engineering, Inc. MEP Consulting Engineering Services Boylston, MA MBE4 Andelman & Lelek Engineering, Inc. Energy Modeling Norwood, MA WBE5 Blackford, LLC Construction Management Las Vegas, NV VBE6 Black Hawk Group Consulting Engineer Services Philadelphia, PA MBE7 C&C Consulting Engineers, LLC Structural Peer Review Allston, MA MBE8 Calvin Consulting Services, LLC Construction Consulting Las Vegas, NV WBE9 Communications for Design LLC Design and Project Management Support Services Northfield, MN WBE10 Convergent Technologies
Design Group, Inc.Acoustics/ Audio Visual/ IT/ Low Voltage Lockport, NY WBE
11 Copley Wolff Design Group, Inc. Full Landscape Architectural Services Boston, MA WBE12 Desert Construction Consulting, Ltd Estimating and Contractor Bidding Services Henderson, NV MBE13 Desman, Inc. Parking Garage Bridging Documents (LOA) Boston, MA MBE14 Dietz & Company Architects, Inc. Full Service Architecture and Interior Design Springfield, MA WBE15 Engineers Design Group, Inc. Structural Engineering Consulting Services Malden, MA MBE16 Erin Chrusciel Photography, LLC Photography East Longmeadow, MA WBE17 Fernandez & Associates Fire Protection Design and Code Consulting Services Byfield, MA MBE18 Hamilton Anderson Associates, Inc. Architectural Services Detroit, MI MBE
(1) Includes companies that are certified with the following agencies: • MBE - Massachusetts Supplier Diversity Office or Greater New England Minority Supplier Development Council. • WBE - Massachusetts Supplier Diversity Office or Women’s Business Enterprise National Council. • VBE - United States Department of Veteran Affairs or Massachusetts Gaming Commission.
(2) Green highlighted companies have been paid as of May 31, 2017. WBE = Woman-owned Business Enterprise; MBE = Minority-owned Business Enterprise; VBE = Veteran-owned Business Enterprise.
Notes:
AS OF JUNE 30, 2017

DESIGN & CONSULTING COMMITMENTS
25
Ref Company Scope Location Diversity Status
19 Hyde Business Services, LLC Permit and Community Commitment Coordination Medina, MN WBE20 Independent Design, LLC Building Design/ Historic Restoration Quincy, MA WBE21 JoAnn Jones Administrative Services Henderson, NV WBE22 Marshall Moya Design, LLC Architectural Services Washington, DC MBE23 Maryann Thompson Architects Architectural Design Services Henderson, NV WBE24 MCLA, Inc. Lighting Washington, DC WBE25 Nitsch Engineering, Inc. Engineering Services Boston, MA WBE26 Pristine Engineers, Inc. MEP Peer Review Services Raynham, MA MBE27 Renderready, LLC Rendering and Graphic Design Albuquerque, NM MBE28 RSE Associates, Inc. Engineering Design Watertown, MA MBE29 Soden Sustainability Consulting, LLC LEED Winchester, MA WBE30 Spec's Design Group, LLC Interior Design Springfield, MA WBE31 Stevens & Associates Façade Stabilization Design Brattleboro, VT VBE32 Timothy Haahs & Associates, Inc. Architect and Engineer of Record/ Parking Consultant Blue Bell, PA MBE33 Two Twelve Graphic Designer New York, NY WBE34 US Inspection & Consulting, LLC Construction Inspections Lake Havasu City, AZ MBE35 VAV International, Inc. Mechanical Consulting Woburn, MA MBE36 WA Architects, Inc. Architectural Services Cleveland, OH MBE37 YA Construction Services, LLC MEP Peer Review St. Louis, MO WBE
AS OF JUNE 30, 2017
(1) Includes companies that are certified with the following agencies: • MBE - Massachusetts Supplier Diversity Office or Greater New England Minority Supplier Development Council. • WBE - Massachusetts Supplier Diversity Office or Women’s Business Enterprise National Council. • VBE - United States Department of Veteran Affairs or Massachusetts Gaming Commission.
(2) Green highlighted companies have been paid as of May 31, 2017. WBE = Woman-owned Business Enterprise; MBE = Minority-owned Business Enterprise; VBE = Veteran-owned Business Enterprise.
Notes:

Construction Commitments

CONSTRUCTION COMMITMENTS
27
(1) Total Commitments through June 30, 2017 are $371.9M. (2) Includes companies that are certified with the following agencies:
• MBE - Massachusetts Supplier Diversity Office or Greater New England Minority Supplier Development Council. • WBE - Massachusetts Supplier Diversity Office or Women’s Business Enterprise National Council. • VBE - United States Department of Veteran Affairs or Massachusetts Gaming Commission.
WBE = Woman-owned Business Enterprise; MBE = Minority-owned Business Enterprise; VBE = Veteran-owned Business Enterprise.
Notes:
AS OF JUNE 30, 2017
Group Project Goals Commitments Company Count Value
WBE 10.0% 19.9% 48 $73.90M
MBE 5.0% 8.4% 24 $31.28M
VBE 2.0% 7.7% 20 $28.62M
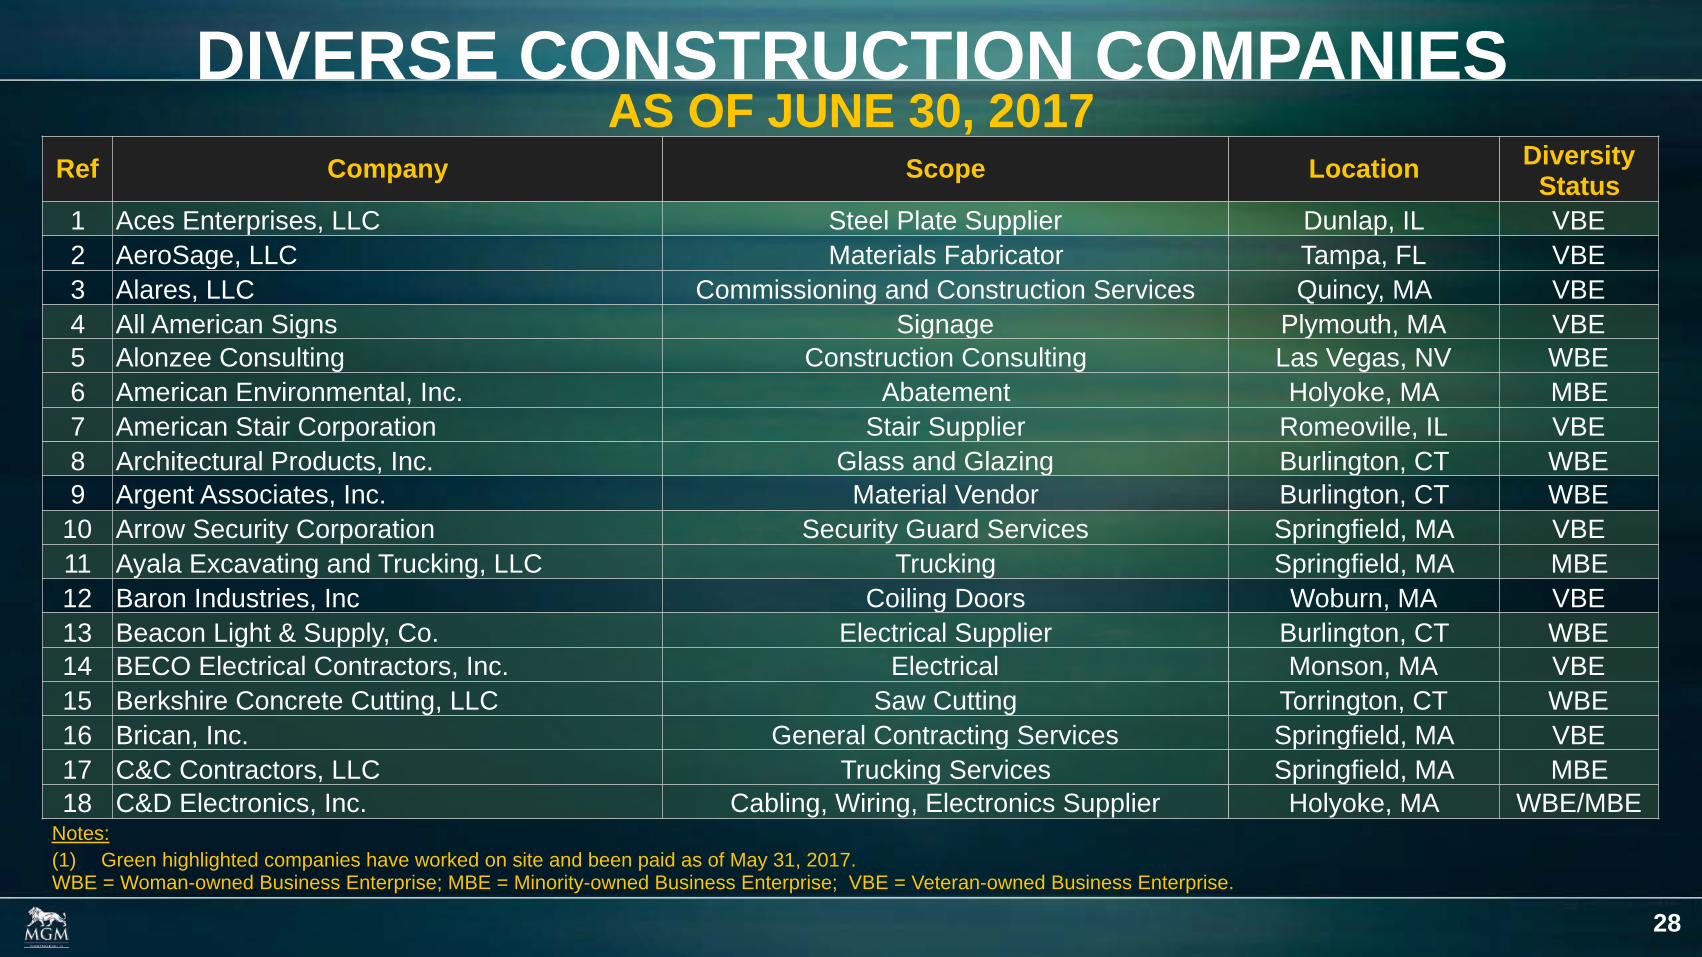
DIVERSE CONSTRUCTION COMPANIES
28
Ref Company Scope Location Diversity Status
1 Aces Enterprises, LLC Steel Plate Supplier Dunlap, IL VBE2 AeroSage, LLC Materials Fabricator Tampa, FL VBE3 Alares, LLC Commissioning and Construction Services Quincy, MA VBE4 All American Signs Signage Plymouth, MA VBE5 Alonzee Consulting Construction Consulting Las Vegas, NV WBE6 American Environmental, Inc. Abatement Holyoke, MA MBE 7 American Stair Corporation Stair Supplier Romeoville, IL VBE8 Architectural Products, Inc. Glass and Glazing Burlington, CT WBE9 Argent Associates, Inc. Material Vendor Burlington, CT WBE
10 Arrow Security Corporation Security Guard Services Springfield, MA VBE11 Ayala Excavating and Trucking, LLC Trucking Springfield, MA MBE 12 Baron Industries, Inc Coiling Doors Woburn, MA VBE13 Beacon Light & Supply, Co. Electrical Supplier Burlington, CT WBE14 BECO Electrical Contractors, Inc. Electrical Monson, MA VBE15 Berkshire Concrete Cutting, LLC Saw Cutting Torrington, CT WBE16 Brican, Inc. General Contracting Services Springfield, MA VBE17 C&C Contractors, LLC Trucking Services Springfield, MA MBE 18 C&D Electronics, Inc. Cabling, Wiring, Electronics Supplier Holyoke, MA WBE/MBE
(1) Green highlighted companies have worked on site and been paid as of May 31, 2017.WBE = Woman-owned Business Enterprise; MBE = Minority-owned Business Enterprise; VBE = Veteran-owned Business Enterprise.
Notes:
AS OF JUNE 30, 2017

DIVERSE CONSTRUCTION COMPANIES
29
Ref Company Scope Location Diversity Status
19 C4 Cables Datacom, Cabling, Fiber Supplier Taunton, MA WBE20 Capasso Restoration, Inc. Masonry Contractor North Haven, CT WBE21 Carol’s Lighting & Supply Company Electrical Supplies Canton, MA MBE22 Certified Connection, Inc. Electrical Supplier Worcester, MA MBE23 Central Ceilings, Inc. Drywall Contractor South Easton, MA VBE24 Chabot & Burnett Construction Co., Inc. Masonry Contractor Agawam, MA WBE25 Charle George Companies, Inc. Solid Waste Disposal, Recycling, Trucking Londonberry, NH WBE26 CK Flooring Solutions, Inc. Carpet Installer Chicopee, MA WBE27 CMJ, LLC Property Management/Maintenance Springfield, MA MBE28 Connecticut Drywall Finishing, Inc. Drywall West Springfield, MA WBE29 Connecticut Temperature Controls, LLC Controls Newington, CT VBE30 Coghlin Electrical Contractors, Inc. Electrical Services Worcester, MA WBE31 C.R. Levesque Trucking Corp. Hauling & Equipment Transportation Monson, MA WBE32 Critical Power Testing and Maintenance, Inc. Commissioning Amesbury, MA VBE33 Dagle Electrical Construction Corp. Electrical Melrose, MA WBE34 Davenport Advisors, LLC Property Management/ Maintenance Boston, MA MBE35 Dependable Masonry Construction Company, Inc. Masonry and Brickpaving North Reading, MA MBE36 Duray/J.F. Duncan Industries, Inc. Food Service Equipment Downey, CA MBE
Notes:
AS OF JUNE 30, 2017
(1) Green highlighted companies have worked on site and been paid as of May 31, 2017.WBE = Woman-owned Business Enterprise; MBE = Minority-owned Business Enterprise; VBE = Veteran-owned Business Enterprise.

DIVERSE CONSTRUCTION COMPANIES
30
Ref Company Scope Location Diversity Status
37 Eagle Elevator Company, Inc. Elevator Repairs, Service, Maintenance Boston, MA VBE38 Eastern General Contractors, Inc. General Contractor - Rigging Springfield, MA MBE39 EDM Construction, Inc. Carpentry & Structural Steel Erection Merrimac, MA WBE40 E L Waterman, Inc. Pipe Supplier Foxboro, MA WBE41 Evermore Light & Power, Inc. Electrical Somerville, MA WBE 42 Fabiano Oil Corp. Fuel & Oil Supplier Wrentham, MA WBE 43 Federal Concrete, Inc. Concrete Services Hopedale, MA WBE44 Fisher Contracting Corporation General Contracting Services Worcester, MA WBE45 Fletcher Sewer & Drain, Inc. Inspection - FEIR Ludlow, MA WBE46 Folan Waterproofing and Construction Company, Inc. Masonry Contractors & Waterproofing South Easton, MA WBE47 Frisoli Electric, Inc. Electrical Holbrook, MA VBE 48 Gomes Construction Co. Inc. Utility Connections Ludlow, MA WBE49 Granite City Electric Supply Company, Inc. Electrical Supplier Quincy, MA WBE 50 Green Insulation, Inc. Insulation Adams, MA WBE51 H B Welding, Inc. Steel, Welding, Iron Work Johnston, RI WBE52 Homeland Mechanical, LLC Pipe Supplier Quincy, MA VBE53 Industrial Flame Cutting, Inc. Steel Plate Supplier Beacon Falls, CT VBE54 JMK Building Supply, Inc Drywall Colchester, CT WBE
Notes:
AS OF JUNE 30, 2017
(1) Green highlighted companies have worked on site and been paid as of May 31, 2017.WBE = Woman-owned Business Enterprise; MBE = Minority-owned Business Enterprise; VBE = Veteran-owned Business Enterprise.

31
DIVERSE CONSTRUCTION COMPANIES
Notes:
AS OF JUNE 30, 2017
(1) Green highlighted companies have worked on site and been paid as of May 31, 2017.WBE = Woman-owned Business Enterprise; MBE = Minority-owned Business Enterprise; VBE = Veteran-owned Business Enterprise.
Ref Company Scope Location Diversity Status
55 JRL Construction, Inc. General Contractor - Demolition Springfield, MA VBE56 Kittredge Equipment Company, Inc. Kitchen Equipment Agawam, MA WBE 57 L.K. Sheet Metal, Inc. Sheet Metal East Hartford, CT WBE 58 Larry's Trucking Co. Trucking Springfield, MA MBE59 Lindon Group Piping Materials East Providence, RI WBE 60 M. Frank Higgins & Co., Inc. Tile and Stone Newington, CT WBE61 Markings Inc. Pavement Marking Services Pembroke, MA WBE62 Medeiros Hydroseeding & Landscaping Construction, Inc. Trucking and Soil Materials Monson, MA MBE 63 Moor Metals, Inc. Sales and Distribution of Metals Holliston, MA MBE64 Ms. Pipe, LLC Procurement of Valves, Pipes and Fittings South Windsor, CT WBE65 New England Foundation Company, Inc. Helical Piles Boston, MA WBE66 Northeastern Steel Corporation Steel Distributor Revere, MA MBE67 Performance Testing & Balancing LLC Testing & Balancing South Hampton, MA VBE 68 Piping Systems, Inc. HVAC Assonet, MA WBE69 Protocol Management Services, Inc. Access Flooring North Attleboro, MA WBE70 R K Insulation Contractors, Inc. Insulation Services Hartford, CT MBE71 Rebars & Mesh, Inc. Concrete Haverhill, MA WBE 72 Regis Steel Corporation Steel Erection/ Reinforcing Fall River, MA MBE73 S&F Concrete Contractors, Inc. Concrete Hudson, MA MBE

Ref Company Scope Location Diversity Status
74 S-Cel-O, LLC Commercial and Residential Painting Springfield, MA MBE75 Security Construction Services, Inc. Fencing Hudson, MA WBE 76 SOS Corporation Construction Cleaning, Selective Interior Demolition Milford, MA WBE77 Steere Engineering, Inc. Engineering Services Warwick, RI WBE78 Strategic Environmental Services, Inc. Environmental Consultants Sutton, MA WBE79 Superior Caulking & Waterproofing Caulking & Waterproofing Palmer, MA VBE80 Supplies Exchange Systems Materials Supplier Dorchester, MA MBE81 Tavares, LLC Fireproofing Providence, RI MBE82 T & M Equipment Corporation Excavating Contractor Springfield, MA VBE83 Titan Roofing Company Roofing Springfield, MA MBE 84 Total Mechanical Service Corp. Mechanical Contractor Plymouth, MA MBE85 Triton Leasing and Rental, Inc. Demolition & Abatement Feeding Hills,MA WBE 86 Turtle & Hughes, Inc. Electrical Supplier Linden, NJ WBE87 United Personnel Services, Inc. Temporary Staffing Services Springfield, MA WBE88 Ultimate Abatement Company, Inc. Abatement Plainfield, MA WBE 89 Welch Associates Land Surveyors, Inc. Land Surveying West Bridgewater, MA WBE90 Willow Tree Outdoor, LLC Landscape Springfield, MA WBE 91 Woodchuck’s Building & Hone Center Construction Supplier Rockland, MA MBE92 Younger Brothers Construction, LLC Materials Supplier Watertown, MA MBE
32
DIVERSE CONSTRUCTION COMPANIES
Notes:
AS OF JUNE 30, 2017
(1) Green highlighted companies have worked on site and been paid as of May 31, 2017.WBE = Woman-owned Business Enterprise; MBE = Minority-owned Business Enterprise; VBE = Veteran-owned Business Enterprise.

MGM Springfield
Workforce Diversity Report (By Company)
As of: June 30, 2017
Reference Company
Employee
Count
This Month's Total
Hours Hours % Hours % Hours %
Employee
Count
Project To Date
Total Hours Hours % Hours % Hours %
1 Acranom Masonry Enterprises, Inc. - 0.00 0.00 0.00% 0.00 0.00% 0.00 0.00% 13 1,580.50 0.00 0.00% 824.50 52.17% 0.00 0.00%2 AeroClean - 0.00 0.00 0.00% 0.00 0.00% 0.00 0.00% 15 2,236.00 0.00 0.00% 1,103.50 49.35% 0.00 0.00%3 Allied Fire Protection, Inc. - 0.00 0.00 0.00% 0.00 0.00% 0.00 0.00% 9 1,354.00 0.00 0.00% 256.00 18.91% 0.00 0.00%4 American Environmental, Inc. 2 32.00 24.00 75.00% 32.00 100.00% 0.00 0.00% 181 32,476.25 2,146.00 6.61% 29,295.75 90.21% 288.50 0.89%5 AmQuip Crane Rental LLC - 0.00 0.00 0.00% 0.00 0.00% 0.00 0.00% 9 1,981.50 0.00 0.00% 966.50 48.78% 0.00 0.00%6 Ardex, L.P. 3 94.00 0.00 0.00% 0.00 0.00% 0.00 0.00% 6 268.50 0.00 0.00% 0.00 0.00% 0.00 0.00%7 Ayotte & King For Tile, Inc - 0.00 0.00 0.00% 0.00 0.00% 0.00 0.00% 24 450.50 0.00 0.00% 4.00 0.89% 0.00 0.00%8 Bay Crane Northeast - 0.00 0.00 0.00% 0.00 0.00% 0.00 0.00% 1 10.00 0.00 0.00% 0.00 0.00% 0.00 0.00%9 Bay State Elevator Co. - 0.00 0.00 0.00% 0.00 0.00% 0.00 0.00% 8 315.00 0.00 0.00% 0.00 0.00% 0.00 0.00%
10 BECO Electrical Contractors, Inc. - 0.00 0.00 0.00% 0.00 0.00% 0.00 0.00% 11 3,433.50 0.00 0.00% 1,116.50 32.52% 2,088.00 60.81%11 Berkshire Concrete Cutting - 0.00 0.00 0.00% 0.00 0.00% 0.00 0.00% 3 24.50 0.00 0.00% 0.00 0.00% 7.50 30.61%12 Berlin Steel Construction Company 16 573.00 40.00 6.98% 61.00 10.65% 22.00 3.84% 83 40,480.00 3,167.00 7.82% 6,004.50 14.83% 3,242.50 8.01%13 BG Mechanical Contractors, Inc. 14 1,371.00 0.00 0.00% 224.00 16.34% 145.00 10.58% 24 4,514.00 0.00 0.00% 496.00 10.99% 898.00 19.89%14 Blakeslee Prestress, Inc. 13 730.50 66.50 9.10% 152.00 20.81% 24.00 3.29% 43 26,221.00 2,475.00 9.44% 3,649.50 13.92% 2,200.50 8.39%15 Blue Construction, Inc. 8 856.00 0.00 0.00% 16.00 1.87% 144.00 16.82% 9 1,573.50 0.00 0.00% 96.00 6.10% 270.00 17.16%16 Capasso Restoration, Inc. 5 475.00 0.00 0.00% 224.00 47.16% 104.00 21.89% 8 902.00 0.00 0.00% 530.00 58.76% 225.00 24.94%17 Central Ceilings, Inc. 35 3,464.00 320.00 9.24% 1,239.50 35.78% 579.50 16.73% 39 5,622.50 536.00 9.53% 1,991.50 35.42% 1,096.00 19.49%18 Chabot & Burnett Construction Co., Inc. 29 2,270.50 229.00 10.09% 813.50 35.83% 210.50 9.27% 73 17,708.50 1,331.00 7.52% 5,448.00 30.76% 1,419.50 8.02%19 Champlain Masonry, Inc. - 0.00 0.00 0.00% 0.00 0.00% 0.00 0.00% 36 5,090.75 100.00 1.96% 1,965.00 38.60% 688.00 13.51%20 Chandler Architectural Products 7 538.50 96.00 17.83% 29.00 5.39% 0.00 0.00% 20 1,074.00 96.00 8.94% 82.00 7.64% 64.00 5.96%21 CIP Concrete, Inc. - 0.00 0.00 0.00% 0.00 0.00% 0.00 0.00% 14 4,273.00 0.00 0.00% 687.00 16.08% 0.00 0.00%22 CK Flooring Solutions, Inc. 12 687.00 144.00 20.96% 204.00 29.69% 118.00 17.18% 24 4,276.00 881.00 20.60% 1,157.00 27.06% 521.50 12.20%23 Coghlin Electrical Contractors, Inc. 21 2,846.00 314.00 11.03% 298.00 10.47% 312.00 10.96% 42 16,121.00 1,774.00 11.00% 1,842.00 11.43% 2,088.00 12.95%24 Collins Electrical 48 4,519.00 304.00 6.73% 568.00 12.57% 178.00 3.94% 82 29,010.50 3,356.00 11.57% 3,901.00 13.45% 2,871.50 9.90%25 Commonwealth Guardrail, Inc. - 0.00 0.00 0.00% 0.00 0.00% 0.00 0.00% 17 690.00 4.00 0.58% 69.00 10.00% 0.00 0.00%26 Connecticut Drywall Finishing, Inc. 3 152.00 0.00 0.00% 0.00 0.00% 0.00 0.00% 23 1,557.50 0.00 0.00% 158.50 10.18% 0.00 0.00%27 Construction Labor Unlimited, Inc. 4 48.00 0.00 0.00% 8.00 16.67% 0.00 0.00% 6 222.00 0.00 0.00% 100.00 45.05% 0.00 0.00%28 Conte Company, LLC - 0.00 0.00 0.00% 0.00 0.00% 0.00 0.00% 3 24.00 0.00 0.00% 0.00 0.00% 8.00 33.33%29 Dependable Masonry Construction Co., Inc. - 0.00 0.00 0.00% 0.00 0.00% 0.00 0.00% 6 439.00 32.00 7.29% 219.00 49.89% 0.00 0.00%30 Division Six Installers, Inc. 2 14.00 0.00 0.00% 0.00 0.00% 0.00 0.00% 2 68.00 0.00 0.00% 0.00 0.00% 0.00 0.00%31 EDM Construction, Inc. 6 336.00 0.00 0.00% 48.00 14.29% 64.00 19.05% 17 2,637.00 156.00 5.92% 579.50 21.98% 550.50 20.88%32 EF Corcoran Plumbing & Heating, Inc. - 0.00 0.00 0.00% 0.00 0.00% 0.00 0.00% 1 16.00 16.00 100.00% 0.00 0.00% 0.00 0.00%33 Evermore Light and Power, Inc. - 0.00 0.00 0.00% 0.00 0.00% 0.00 0.00% 4 613.50 0.00 0.00% 0.00 0.00% 0.00 0.00%34 Federal Concrete, Inc. 17 917.50 118.00 12.86% 16.00 1.74% 80.00 8.72% 73 21,810.50 1,782.50 8.17% 3,460.00 15.86% 1,757.50 8.06%35 Folan Waterproofing & Construction 2 52.00 0.00 0.00% 0.00 0.00% 0.00 0.00% 10 1,323.00 0.00 0.00% 534.50 40.40% 0.00 0.00%36 Fontaine Bros, Inc. 9 967.00 112.00 11.58% 112.00 11.58% 224.00 23.16% 59 10,618.50 1,165.00 10.97% 2,637.00 24.83% 755.00 7.11%37 Food Equipment Installation, Inc. - 0.00 0.00 0.00% 0.00 0.00% 0.00 0.00% 4 116.00 0.00 0.00% 0.00 0.00% 0.00 0.00%38 Frisoli Electric Inc. - 0.00 0.00 0.00% 0.00 0.00% 0.00 0.00% 1 299.00 0.00 0.00% 0.00 0.00% 0.00 0.00%39 Fusion Electric, Inc. - 0.00 0.00 0.00% 0.00 0.00% 0.00 0.00% 2 112.00 0.00 0.00% 104.00 92.86% 0.00 0.00%40 Gagliarducci Construction, Inc. - 0.00 0.00 0.00% 0.00 0.00% 0.00 0.00% 47 4,264.50 635.00 14.89% 709.50 16.64% 906.50 21.26%41 Gomes Construction Company, Inc. - 0.00 0.00 0.00% 0.00 0.00% 0.00 0.00% 4 575.50 0.00 0.00% 0.00 0.00% 0.00 0.00%42 Green Insulation, Inc. - 0.00 0.00 0.00% 0.00 0.00% 0.00 0.00% 4 236.00 0.00 0.00% 16.00 6.78% 0.00 0.00%43 H. Carr & Sons, Inc. 59 5,186.50 379.50 7.32% 1,104.50 21.30% 542.50 10.46% 67 15,813.50 610.50 3.86% 4,160.00 26.31% 1,382.00 8.74%44 Harry Grodsky & Co. 50 4,363.50 56.00 1.28% 450.00 10.31% 666.00 15.26% 92 23,860.50 1,127.50 4.73% 2,507.50 10.51% 1,141.00 4.78%45 Hayward Baker Inc. - 0.00 0.00 0.00% 0.00 0.00% 0.00 0.00% 32 4,465.50 306.50 6.86% 1,170.50 26.21% 775.00 17.36%46 HB Welding - 0.00 0.00 0.00% 0.00 0.00% 0.00 0.00% 17 6,833.00 148.50 2.17% 470.00 6.88% 1,082.00 15.83%47 Heritage Restoration, Inc. 11 494.00 0.00 0.00% 254.00 51.42% 0.00 0.00% 18 4,310.00 82.00 1.90% 1,880.00 43.62% 0.00 0.00%48 Hickman & Sgroi Electric Inc. - 0.00 0.00 0.00% 0.00 0.00% 0.00 0.00% 2 192.00 0.00 0.00% 0.00 0.00% 0.00 0.00%49 Cyn Environmental Services - 0.00 0.00 0.00% 0.00 0.00% 0.00 0.00% 1 24.00 0.00 0.00% 24.00 100.00% 0.00 0.00%50 JDC Demolition - 0.00 0.00 0.00% 0.00 0.00% 0.00 0.00% 23 3,504.00 400.00 11.42% 734.00 20.95% 160.00 4.57%51 John W. Egan 5 204.00 0.00 0.00% 0.00 0.00% 0.00 0.00% 5 233.50 0.00 0.00% 0.00 0.00% 0.00 0.00%52 Jones Engineering LLC - 0.00 0.00 0.00% 0.00 0.00% 0.00 0.00% 2 168.00 0.00 0.00% 0.00 0.00% 0.00 0.00%53 JRL Construction, Inc. 5 367.00 152.00 41.42% 152.00 41.42% 0.00 0.00% 89 28,824.06 5,156.71 17.89% 10,651.00 36.95% 5,272.00 18.29%54 Kleeberg Mechanical Services, LLC 4 204.00 0.00 0.00% 0.00 0.00% 0.00 0.00% 15 1,375.50 0.00 0.00% 0.00 0.00% 0.00 0.00%55 L.K. Sheet Metal, Inc. 22 2,321.50 118.00 5.08% 537.00 23.13% 318.00 13.70% 32 10,744.50 762.50 7.10% 1,775.00 16.52% 854.00 7.95%56 Langan Insulation LLC - 0.00 0.00 0.00% 0.00 0.00% 0.00 0.00% 2 568.00 0.00 0.00% 0.00 0.00% 0.00 0.00%57 Longden Company, Inc. 5 134.00 0.00 0.00% 0.00 0.00% 32.00 23.88% 5 134.00 0.00 0.00% 0.00 0.00% 32.00 23.88%58 M.L. Schmitt, Inc. 5 405.50 108.00 26.63% 48.00 11.84% 109.00 26.88% 14 4,018.75 592.00 14.73% 699.25 17.40% 845.50 21.04%
This Month's Workforce Diversity Statistics Project To Date Workforce Diversity Statistics
Women Minority Veteran Women Minority Veteran

MGM Springfield
Workforce Diversity Report (By Company)
As of: June 30, 2017
Reference Company
Employee
Count
This Month's Total
Hours Hours % Hours % Hours %
Employee
Count
Project To Date
Total Hours Hours % Hours % Hours %
This Month's Workforce Diversity Statistics Project To Date Workforce Diversity Statistics
Women Minority Veteran Women Minority Veteran
59 Marr Scaffold - 0.00 0.00 0.00% 0.00 0.00% 0.00 0.00% 21 638.00 0.00 0.00% 282.00 44.20% 16.50 2.59%60 Marguerite Concrete 20 179.00 0.00 0.00% 17.00 9.50% 26.00 14.53% 61 1,917.00 0.00 0.00% 152.00 7.93% 139.50 7.28%61 Massey's Plate Glass & Aluminum, Inc. 3 448.00 0.00 0.00% 0.00 0.00% 0.00 0.00% 3 1,376.00 0.00 0.00% 0.00 0.00% 0.00 0.00%62 Maxim Crane Works LP - 0.00 0.00 0.00% 0.00 0.00% 0.00 0.00% 9 1,132.00 0.00 0.00% 542.00 47.88% 24.00 2.12%63 Medeiros Hydroseeding & Landscape Construction, Inc. - 0.00 0.00 0.00% 0.00 0.00% 0.00 0.00% 2 17.00 0.00 0.00% 11.00 64.71% 0.00 0.00%64 Moran Sheet Metal, Inc. - 0.00 0.00 0.00% 0.00 0.00% 0.00 0.00% 9 347.75 0.00 0.00% 72.25 20.78% 0.00 0.00%65 NER Construction Management 2 64.00 0.00 0.00% 0.00 0.00% 0.00 0.00% 17 1,737.00 0.00 0.00% 365.00 21.01% 0.00 0.00%66 New England Concrete Cutting, Inc. - 0.00 0.00 0.00% 0.00 0.00% 0.00 0.00% 3 456.00 0.00 0.00% 0.00 0.00% 0.00 0.00%67 New England Foundation Co., Inc. - 0.00 0.00 0.00% 0.00 0.00% 0.00 0.00% 20 2,727.00 0.00 0.00% 587.50 21.54% 226.00 8.29%68 Northeast Lighting Protection, LLC - 0.00 0.00 0.00% 0.00 0.00% 0.00 0.00% 4 219.35 0.00 0.00% 78.14 35.62% 0.00 0.00%69 Northeast Steel Erectors - 0.00 0.00 0.00% 0.00 0.00% 0.00 0.00% 7 1,335.00 34.00 2.55% 183.00 13.71% 393.00 29.44%70 Northeastern Steel Corporation - 0.00 0.00 0.00% 0.00 0.00% 0.00 0.00% 6 64.00 9.00 14.06% 50.00 78.13% 0.00 0.00%71 Northern General 6 436.50 72.00 16.49% 72.00 16.49% 72.50 16.61% 75 26,306.00 1,586.50 6.03% 4,509.50 17.14% 1,197.50 4.55%72 P. Gioioso & Sons Inc. - 0.00 0.00 0.00% 0.00 0.00% 0.00 0.00% 9 834.50 114.50 13.72% 0.00 0.00% 0.00 0.00%73 Palmer Paving Corporation - 0.00 0.00 0.00% 0.00 0.00% 0.00 0.00% 48 708.00 34.50 4.87% 14.00 1.98% 0.00 0.00%74 Performance Testing & Balancing, LLC - 0.00 0.00 0.00% 0.00 0.00% 0.00 0.00% 3 64.00 0.00 0.00% 0.00 0.00% 38.00 59.38%75 Professional Drywall Construction, Inc. 11 541.00 32.00 5.91% 160.00 29.57% 213.00 39.37% 82 6,577.50 366.50 5.57% 1,228.50 18.68% 1,115.00 16.95%76 Regis Steel Corp 2 26.00 0.00 0.00% 0.00 0.00% 0.00 0.00% 63 9,009.50 1,396.50 15.50% 2,169.00 24.07% 289.00 3.21%77 RoadSafe Traffic Systems - 0.00 0.00 0.00% 0.00 0.00% 0.00 0.00% 6 49.00 0.00 0.00% 0.00 0.00% 0.00 0.00%78 S & F Concrete Contractors, Inc. 72 3,224.00 286.50 8.89% 1,181.50 36.65% 322.00 9.99% 300 58,267.00 4,129.50 7.09% 17,476.50 29.99% 5,766.00 9.90%79 Safespan - 0.00 0.00 0.00% 0.00 0.00% 0.00 0.00% 11 780.50 0.00 0.00% 56.00 7.17% 0.00 0.00%80 Safway Services 13 1,052.00 32.00 3.04% 651.00 61.88% 0.00 0.00% 46 10,017.58 402.00 4.01% 6,162.00 61.51% 728.00 7.27%81 Save-On-Wall Co., Inc. - 0.00 0.00 0.00% 0.00 0.00% 0.00 0.00% 9 290.50 45.00 15.49% 45.00 15.49% 8.00 2.75%82 Schindler Elevator Corp 5 229.00 0.00 0.00% 0.00 0.00% 0.00 0.00% 7 1,713.40 112.00 6.54% 112.00 6.54% 112.00 6.54%83 Security Construction Services, Inc. d/b/a: Security Fence Co. - 0.00 0.00 0.00% 0.00 0.00% 0.00 0.00% 14 3,866.00 300.00 7.76% 1,233.25 31.90% 40.00 1.03%84 Soep Painting Corp - 0.00 0.00 0.00% 0.00 0.00% 0.00 0.00% 10 1,475.50 0.00 0.00% 6.00 0.41% 0.00 0.00%85 Stamford Wrecking - 0.00 0.00 0.00% 0.00 0.00% 0.00 0.00% 12 1,693.00 76.00 4.49% 138.00 8.15% 74.00 4.37%86 Superior Caulking & Waterproofing Co., Inc. 3 70.00 0.00 0.00% 13.00 18.57% 0.00 0.00% 14 582.50 0.00 0.00% 221.50 38.03% 0.00 0.00%87 T & M Equipment Corporation 8 605.00 260.00 42.98% 116.00 19.17% 0.00 0.00% 66 28,849.55 3,351.00 11.62% 5,444.55 18.87% 1,448.50 5.02%88 Tavares, LLC 6 556.50 0.00 0.00% 65.00 11.68% 0.00 0.00% 9 1,968.50 254.00 12.90% 326.00 16.56% 0.00 0.00%89 Tech Valley Contracting, LLC - 0.00 0.00 0.00% 0.00 0.00% 0.00 0.00% 8 2,018.00 206.00 10.21% 0.00 0.00% 0.00 0.00%90 Tishman 7 840.00 240.00 28.57% 120.00 14.29% 0.00 0.00% 15 20,541.00 3,621.00 17.63% 4,080.00 19.86% 5,760.00 28.04%91 Titan Roofing Company 33 2,513.75 0.00 0.00% 499.50 19.87% 162.75 6.47% 89 9,226.50 0.00 0.00% 1,525.00 16.53% 794.00 8.61%92 T.J. Conway Company 28 3,792.00 120.00 3.16% 593.00 15.64% 768.00 20.25% 64 21,938.50 1,214.00 5.53% 3,335.00 15.20% 2,681.00 12.22%93 Triton Leasing and Rental, Inc. - 0.00 0.00 0.00% 0.00 0.00% 0.00 0.00% 35 3,187.50 0.00 0.00% 1,547.50 48.55% 239.00 7.50%94 Ultimate Abatement Company, Inc. - 0.00 0.00 0.00% 0.00 0.00% 0.00 0.00% 47 10,430.50 3,632.50 34.83% 10,119.50 97.02% 0.00 0.00%95 Universal Electric Co. - 0.00 0.00 0.00% 0.00 0.00% 0.00 0.00% 18 5,635.00 556.50 9.88% 1,284.50 22.80% 394.00 6.99%96 William Roberts Electric Co., Inc. 3 452.00 0.00 0.00% 0.00 0.00% 0.00 0.00% 10 1,922.50 8.00 0.42% 93.00 4.84% 0.00 0.00%97 Willow Tree Outdoor, LLC - 0.00 0.00 0.00% 0.00 0.00% 0.00 0.00% 5 261.50 0.00 0.00% 105.50 40.34% 0.00 0.00%98 Wolfe House Movers, LLC - 0.00 0.00 0.00% 0.00 0.00% 0.00 0.00% 10 1,194.50 0.00 0.00% 306.00 25.62% 228.00 19.09%99 Wolverine Fire Protection Co 15 1,532.50 227.50 14.85% 467.50 30.51% 240.00 15.66% 18 5,773.50 433.50 7.51% 1,788.50 30.98% 825.00 14.29%
100 Worcester Elevator Co., Inc. - 0.00 0.00 0.00% 0.00 0.00% 0.00 0.00% 2 12.00 0.00 0.00% 0.00 0.00% 6.00 50.00%Total - Unions 659 51,184.25 3,851.00 7.52% 10,546.00 20.60% 5,676.75 11.09% 2,743 598,847.44 50,721.21 8.47% 159,723.69 26.67% 56,031.50 9.36%
101 On-Site Design / Management 92 8,441.75 1,411.00 16.71% 1,842.25 21.82% 757.00 8.97% 361 184,144.03 25,885.35 14.06% 24,474.83 13.29% 23,818.30 12.93%Total 751 59,626.00 5,262.00 8.83% 12,388.25 20.78% 6,433.75 10.79% 3,104 782,991.47 76,606.56 9.78% 184,198.52 23.52% 79,849.80 10.20%
Group Project Goals Project To Date DeltaWomen 6.90% 9.78% 2.88%Minority 15.30% 23.52% 8.22%Veteran 8.00% 10.20% 2.20%
Notes:
(1) Statistics include all workforce reports that were received by MGM as of June 30, 2017.(2) The total number of unique union workers that have worked on site is approximately 2,528. The 2,743 union workers identified above includes workers that have worked for multiple companies.
Totals - Overall

MGM Springfield
Workforce Diversity Report (By Union)
As of: June 30, 2017
Reference Union
Employee
Count
This Month's Total
Hours Hours % Hours % Hours %
Employee
Count
Project To Date
Total Hours Hours % Hours % Hours %
1 AEEF CWA Local #1300 1 40.00 0.00 0.00% 0.00 0.00% 0.00 0.00% 1 40.00 0.00 0.00% 0.00 0.00% 0.00 0.00%2 AFSCME Local #230 0 0.00 0.00 0.00% 0.00 0.00% 0.00 0.00% 1 48.00 0.00 0.00% 48.00 100.00% 0.00 0.00%3 Asbestos Workers #6 0 0.00 0.00 0.00% 0.00 0.00% 0.00 0.00% 30 3,100.50 0.00 0.00% 1,499.50 48.36% 239.00 7.71%4 Boston Plasters' & Cement Masons' - Asphalt Layers' Union #534 13 247.00 0.00 0.00% 85.50 34.62% 0.00 0.00% 85 4,175.50 0.00 0.00% 760.00 18.20% 38.50 0.92%5 Bricklayers Local #1 0 0.00 0.00 0.00% 0.00 0.00% 0.00 0.00% 7 572.00 0.00 0.00% 11.00 1.92% 0.00 0.00%6 Bricklayers Local #3 42 2,693.50 112.00 4.16% 873.50 32.43% 216.00 8.02% 160 29,544.50 810.00 2.74% 6,953.00 23.53% 1,588.50 5.38%7 Carpenters - Local #108 126 10,329.50 850.00 8.23% 2,867.50 27.76% 1,502.00 14.54% 387 82,873.68 7,816.50 9.43% 23,735.50 28.64% 12,537.00 15.13%8 Carpenters Local #107 3 192.00 0.00 0.00% 72.00 37.50% 0.00 0.00% 9 3,613.00 0.00 0.00% 773.00 21.39% 0.00 0.00%9 Carpenters Local #109 0 0.00 0.00 0.00% 0.00 0.00% 0.00 0.00% 1 117.00 117.00 100.00% 117.00 100.00% 0.00 0.00%10 Carpenters Local #210 0 0.00 0.00 0.00% 0.00 0.00% 0.00 0.00% 2 16.00 0.00 0.00% 0.00 0.00% 8.00 50.00%11 Carpenters Local #33 1 136.00 0.00 0.00% 0.00 0.00% 0.00 0.00% 8 600.00 45.00 7.50% 0.00 0.00% 0.00 0.00%12 Carpenters Local #424 0 0.00 0.00 0.00% 0.00 0.00% 0.00 0.00% 1 72.00 0.00 0.00% 72.00 100.00% 65.00 90.28%13 Carpenters Local #475 0 0.00 0.00 0.00% 0.00 0.00% 0.00 0.00% 1 39.00 0.00 0.00% 0.00 0.00% 0.00 0.00%14 Carpenters Local #535 0 0.00 0.00 0.00% 0.00 0.00% 0.00 0.00% 1 328.00 0.00 0.00% 0.00 0.00% 0.00 0.00%15 CT Bricklayers #1 0 0.00 0.00 0.00% 0.00 0.00% 0.00 0.00% 2 41.50 0.00 0.00% 24.00 57.83% 0.00 0.00%16 Floorcoverers Local #2168 12 687.00 144.00 20.96% 204.00 29.69% 118.00 17.18% 30 4,248.50 865.00 20.36% 1,161.00 27.33% 521.50 12.27%17 International Association of Iron Workers Local #7 14 530.00 40.00 7.55% 40.00 7.55% 0.00 0.00% 99 41,028.00 2,466.50 6.01% 5,235.00 12.76% 3,932.00 9.58%18 International Association of Iron Workers Local #15 0 0.00 0.00 0.00% 0.00 0.00% 0.00 0.00% 4 2,211.50 40.00 1.81% 137.00 6.19% 0.00 0.00%19 International Brotherhood of Electrical Workers - IBEW Local #455 0 0.00 0.00 0.00% 0.00 0.00% 0.00 0.00% 3 112.25 50.75 45.21% 112.25 100.00% 0.00 0.00%20 International Brotherhood of Electrical Workers - IBEW Local #7 77 8,222.50 726.00 8.83% 914.00 11.12% 599.00 7.28% 188 61,398.75 6,286.50 10.24% 9,072.25 14.78% 8,287.00 13.50%21 International Brotherhood of Electrical Workers - IBEW Local #35 0 0.00 0.00 0.00% 0.00 0.00% 0.00 0.00% 4 219.35 0.00 0.00% 78.14 35.62% 0.00 0.00%22 International Brotherhood of Electrical Workers - IBEW 2nd District 0 0.00 0.00 0.00% 0.00 0.00% 0.00 0.00% 1 23.00 0.00 0.00% 0.00 0.00% 0.00 0.00%23 International Union of Elevator Constructors Local #4 0 0.00 0.00 0.00% 0.00 0.00% 0.00 0.00% 1 8.00 0.00 0.00% 0.00 0.00% 0.00 0.00%24 International Union of Elevator Constructors Local #41 5 229.00 0.00 0.00% 0.00 0.00% 0.00 0.00% 17 2,040.40 112.00 5.49% 112.00 5.49% 118.00 5.78%25 International Union of Operating Engineers – IUOE Local #4 3 89.00 0.00 0.00% 0.00 0.00% 0.00 0.00% 61 6,646.50 0.00 0.00% 241.50 3.63% 807.00 12.14%26 International Union of Operating Engineers – IUOE Local #5 0 0.00 0.00 0.00% 0.00 0.00% 0.00 0.00% 1 9.00 0.00 0.00% 0.00 0.00% 0.00 0.00%27 International Union of Operating Engineers – IUOE Local #98 15 503.25 144.00 28.61% 21.00 4.17% 63.25 12.57% 174 39,073.55 1,945.00 4.98% 5,801.55 14.85% 2,668.50 6.83%28 International Union of Operating Engineers – IUOE Local #478 1 72.00 0.00 0.00% 72.00 100.00% 0.00 0.00% 3 240.00 0.00 0.00% 72.00 30.00% 0.00 0.00%29 International Union of Painters and Allied Trades - IUPAT District #11 0 0.00 0.00 0.00% 0.00 0.00% 0.00 0.00% 6 125.50 0.00 0.00% 0.00 0.00% 0.00 0.00%30 International Union of Painters and Allied Trades - IUPAT Local #1333 6 661.50 0.00 0.00% 8.00 1.21% 0.00 0.00% 15 1,936.00 0.00 0.00% 37.00 1.91% 64.00 3.31%31 Iron Workers District Council of New England 17 660.50 66.50 10.07% 144.00 21.80% 88.00 13.32% 129 31,030.00 4,131.50 13.31% 7,102.00 22.89% 3,030.00 9.76%32 Laborers' District Council 0 0.00 0.00 0.00% 0.00 0.00% 0.00 0.00% 22 2,574.00 0.00 0.00% 1,136.00 44.13% 15.00 0.58%33 Laborer's International Union of North America - LIUNA Building Wreckers Local #1421 1 4.00 0.00 0.00% 0.00 0.00% 0.00 0.00% 179 28,942.75 3,989.25 13.78% 27,426.75 94.76% 0.00 0.00%34 Laborers Local #138 0 0.00 0.00 0.00% 0.00 0.00% 0.00 0.00% 2 114.00 0.00 0.00% 0.00 0.00% 0.00 0.00%35 Laborers Local #151 2 16.00 0.00 0.00% 0.00 0.00% 0.00 0.00% 3 191.00 0.00 0.00% 0.00 0.00% 0.00 0.00%36 Laborers Local #22 4 258.00 0.00 0.00% 8.00 3.10% 80.00 31.01% 20 6,663.50 0.00 0.00% 486.00 7.29% 1,128.50 16.94%37 Laborers Local #223 0 0.00 0.00 0.00% 0.00 0.00% 0.00 0.00% 3 148.00 0.00 0.00% 54.00 36.49% 0.00 0.00%38 Laborers Local #230 1 8.00 0.00 0.00% 8.00 100.00% 0.00 0.00% 9 911.75 0.00 0.00% 887.25 97.31% 7.50 0.82%39 Laborers Local #243 0 0.00 0.00 0.00% 0.00 0.00% 0.00 0.00% 3 3,502.00 0.00 0.00% 0.00 0.00% 0.00 0.00%40 Laborers Local #39 2 188.50 0.00 0.00% 0.00 0.00% 72.50 38.46% 5 1,397.00 0.00 0.00% 0.00 0.00% 925.00 66.21%41 Laborers Local #455 0 0.00 0.00 0.00% 0.00 0.00% 0.00 0.00% 17 5,004.00 1,463.50 29.25% 5,004.00 100.00% 0.00 0.00%42 Laborers Local #473 0 0.00 0.00 0.00% 0.00 0.00% 0.00 0.00% 9 1,182.00 0.00 0.00% 2.00 0.17% 0.00 0.00%43 Laborers Local #547 3 208.50 0.00 0.00% 0.00 0.00% 0.00 0.00% 7 1,445.00 0.00 0.00% 0.00 0.00% 0.00 0.00%44 Laborers Local #560 0 0.00 0.00 0.00% 0.00 0.00% 0.00 0.00% 1 8.00 0.00 0.00% 0.00 0.00% 0.00 0.00%45 Laborers Local #596 38 2,719.50 397.50 14.62% 932.50 34.29% 252.50 9.28% 159 36,597.25 3,151.50 8.61% 11,856.00 32.40% 982.00 2.68%46 Laborers Local #609 2 16.00 0.00 0.00% 0.00 0.00% 0.00 0.00% 11 402.50 0.00 0.00% 40.00 9.94% 0.00 0.00%47 Laborers Local #610 0 0.00 0.00 0.00% 0.00 0.00% 0.00 0.00% 1 4.00 0.00 0.00% 0.00 0.00% 0.00 0.00%48 Laborers Local #611 0 0.00 0.00 0.00% 0.00 0.00% 0.00 0.00% 1 270.50 0.00 0.00% 270.50 100.00% 0.00 0.00%49 Laborers Local #665 0 0.00 0.00 0.00% 0.00 0.00% 0.00 0.00% 9 1,659.50 32.00 1.93% 1,659.50 100.00% 0.00 0.00%50 Laborers Local #675 0 0.00 0.00 0.00% 0.00 0.00% 0.00 0.00% 1 133.50 0.00 0.00% 133.50 100.00% 0.00 0.00%51 Laborers Local #88 [Tunnel Workers] 0 0.00 0.00 0.00% 0.00 0.00% 0.00 0.00% 4 338.50 0.00 0.00% 8.00 2.36% 41.00 12.11%52 Laborers Local #999 72 5,145.50 849.50 16.51% 1,278.50 24.85% 377.00 7.33% 437 101,013.96 13,723.21 13.59% 33,799.75 33.46% 11,724.50 11.61%53 Laborers Local #1000 0 0.00 0.00 0.00% 0.00 0.00% 0.00 0.00% 3 24.00 8.00 33.33% 8.00 33.33% 0.00 0.00%54 Massachusetts Laborers' District Council 0 0.00 0.00 0.00% 0.00 0.00% 0.00 0.00% 8 700.00 0.00 0.00% 85.00 12.14% 0.00 0.00%55 NY Bricklayers #2 0 0.00 0.00 0.00% 0.00 0.00% 0.00 0.00% 1 4.00 0.00 0.00% 0.00 0.00% 0.00 0.00%56 Operating Engineers Local #4 1 127.00 0.00 0.00% 0.00 0.00% 0.00 0.00% 14 1,413.00 0.00 0.00% 20.00 1.42% 0.00 0.00%57 Operating Engineers Local #478 0 0.00 0.00 0.00% 0.00 0.00% 0.00 0.00% 4 329.50 0.00 0.00% 139.50 42.34% 0.00 0.00%58 Operative Plasterers and Cement Masons International Association, Local 40 11 663.50 0.00 0.00% 229.50 34.59% 24.00 3.62% 11 663.50 0.00 0.00% 229.50 34.59% 24.00 3.62%59 Painters and Allied Trades District Council #35 8 356.00 0.00 0.00% 0.00 0.00% 0.00 0.00% 33 3,173.00 0.00 0.00% 164.50 5.18% 0.00 0.00%60 Pile Drivers Local #56 0 0.00 0.00 0.00% 0.00 0.00% 0.00 0.00% 18 2,114.00 0.00 0.00% 468.50 22.16% 180.50 8.54%61 Plasterers and Cement Masons Local #534 13 124.00 0.00 0.00% 17.00 13.71% 26.00 20.97% 47 2,308.00 0.00 0.00% 881.50 38.19% 98.00 4.25%62 Plumbers & Pipefitters #104 96 9,730.50 176.00 1.81% 1,267.00 13.02% 1,579.00 16.23% 196 51,704.50 2,357.50 4.56% 6,338.50 12.26% 4,720.00 9.13%63 Roofers #248 30 2,388.50 0.00 0.00% 499.50 20.91% 121.50 5.09% 76 8,735.50 0.00 0.00% 1,530.00 17.51% 564.50 6.46%64 Sheet Metal Workers #17 0 0.00 0.00 0.00% 0.00 0.00% 0.00 0.00% 4 116.00 0.00 0.00% 0.00 0.00% 0.00 0.00%
This Month's Workforce Diversity Statistics Project To Date Workforce Diversity Statistics
Women Minority Veteran Women Minority Veteran

MGM Springfield
Workforce Diversity Report (By Union)
As of: June 30, 2017
Reference Union
Employee
Count
This Month's Total
Hours Hours % Hours % Hours %
Employee
Count
Project To Date
Total Hours Hours % Hours % Hours %
This Month's Workforce Diversity Statistics Project To Date Workforce Diversity Statistics
Women Minority Veteran Women Minority Veteran
65 Sheet Metal Workers #40 3 144.00 0.00 0.00% 0.00 0.00% 0.00 0.00% 5 580.00 0.00 0.00% 0.00 0.00% 0.00 0.00%66 Sheet Metal Workers #63 21 2,261.50 118.00 5.22% 537.00 23.75% 318.00 14.06% 49 10,834.75 762.50 7.04% 1,847.25 17.05% 892.00 8.23%67 Sheet Metal Workers #83 0 0.00 0.00 0.00% 0.00 0.00% 0.00 0.00% 1 8.00 0.00 0.00% 0.00 0.00% 0.00 0.00%68 Sprinkler Fitters #669 15 1,532.50 227.50 14.85% 467.50 30.51% 240.00 15.66% 27 7,127.50 433.50 6.08% 2,044.50 28.68% 825.00 11.57%69 Teamsters' #404 0 0.00 0.00 0.00% 0.00 0.00% 0.00 0.00% 9 961.50 114.50 11.91% 32.00 3.33% 0.00 0.00%
Subtotal - Other Unions 659 51,184.25 3,851.00 7.52% 10,546.00 20.60% 5,676.75 11.09% 2,843 598,847.44 50,721.21 8.47% 159,723.69 26.67% 56,031.50 9.36%
70 On-Site Design / Management 92 8,441.75 1,411.00 16.71% 1,842.25 21.82% 757.00 8.97% 361 184,144.03 25,885.35 14.06% 24,474.83 13.29% 23,818.30 12.93%Total 751 59,626.00 5,262.00 8.83% 12,388.25 20.78% 6,433.75 10.79% 3,204 782,991.47 76,606.56 9.78% 184,198.52 23.52% 79,849.80 10.20%
Group Project Goals Project To Date DeltaWomen 6.90% 9.78% 2.88%Minority 15.30% 23.52% 8.22%Veteran 8.00% 10.20% 2.20%
Notes:
(1) Statistics include all workforce reports that were received by MGM as of June 30, 2017.(2) The total number of unique union workers that have worked on site is approximately 2,528. The 2,843 union workers identified above includes workers that have worked for multiple companies and/or multiple unions.
Totals - Overall


1

2
ACCESS & OPPORTUNITY COMMITTEE MONTHLY UPDATE JUNE 2017
Wynn Boston Harbor | July 11, 2017

3
Participation Goals Review
Minority Business Enterprise (MBE): 7.9%
Women Business Enterprise (WBE): 10%
Veteran Business Enterprise (VBE): 1%
Consultant / Contractor Participation – Design Contracts:
Minority Business Enterprise (MBE): 5%
Women Business Enterprise (WBE): 5.4%
Veteran Business Enterprise (WBE): 1%
Contractor Participation – Construction Contracts:
Minorities: 15.3%
Women: 6.9%
Veterans: 3%
Workforce Participation – Construction (% of workforce hours):

4
Design: M/W/VBE Participation
• As of June 30th, 21.0%, $12.0 million, of project design contracts have been awarded to M/W/VBEs.
# Contract
Awards Goal Awarded to
Date $ Awarded to
Date MBE 12 7.9% 8.7% $5.0 M
WBE 11 10.0% 5.2% $3.0 M
VBE 4 1.0% 7.1% $4.0 M
TOTAL 27 18.9% 21.0% $12.0 M

5
Design: M/W/VBE Participation, Contracts Awarded MBE (12) Consultant / Contractor Location Scope
Award Amount ($) % Goal
% of Awarded Contracts
Bryant Associates (Sub to AECOM) Boston, MA Surveying Bukhari Des ign Studio Las Vegas , NV Interior Des ignCrabtree McGrath (Sub to Jacobs) Georgetown, MA Food ServiceC&C Consulting Engineers (Sub to AECOM) Boston, MA SurveyingDREAM Col laborative (Sub to Jacobs) Boston, MA Archi tectureEric Montelongo Irrigation Des ign Orange, CA Irrigation Des ignFernandez & Associates (Sub to Jacobs) Byfield, MA Fire ProtectionMichael Hong Archi tects Inc. Culver Ci ty, CA Themed Archi tectureNobis Engineering (Sub to Bohler) Concord, NH Service Road Des ignThe Radio Frequency Network Company Burbank, CA Network Des ignSAR Engineering (Sub to Jacobs) Quincy, MA MEPShen Mi lsom & Wi lke (Sub to Jacobs) New York, NY Acoustics
TOTAL $5,016,896 7.9% 8.7%
WBE (11)Cleo Des ign Las Vegas , NV Interior Des ignComprehens ive Environmenta l (Sub to AECOMMarlborough, MA Permitting, Envi ronmenta lDes ign Enterprise Las Vegas , NV Interior Des ignKevi l le Enterprises (Sub to AECOM) Boston, MA Schedul ing, Cost EstimatingLumen Studio (Sub to AECOM) Lowel l , MA Lighting Des ignPam Shadley Associates (Sub to Li fescapes) Lexington, MA Landscape Archi tecturePam Shadley Associates (Sub to AECOM) Lexington, MA Landscape Archi tecturePEER Consul tants (Sub to Bohler) Burl ington, MA Construction Adminis trationRegina Vi l la Associates (Sub to AECOM) Boston, MA Publ ic Relations / OutreachRyan Biggs Clark Davis Cl i fton Park, NY Indpendent Structura l ReviewSaam Archi tecture (Sub to Jacobs) Boston, MA Archi tecture
TOTAL $2,960,878 10.0% 5.2%
VBE (4)JBA Consul ting Engineers (Sub to Jacobs) Las Vegas , NV MEP, FP, TelecommJBA Consulting Engineers Las Vegas , NV Audio Visua lEs l ick Des ign Associates Tulsa , OK SignageFort Hi l l Infrastructure (Sub to AECOM) Boston, MA Traffic Engineering
TOTAL $4,064,518 1.0% 7.1%
TOTAL DIVERSE CONTRACTS $12,042,292 18.9% 21.0%
TOTAL QUALIFIED DESIGN AWARDS $57,441,195

6
Construction: M/W/VBE Participation
• As of June 30th, 15.5%, $156.6 million, of construction contracts have been awarded to M/W/VBEs.
• Construction contracts in June included awards to 2 MBEs, 5 WBEs, and 1 VBE.
• Negotiations with additional M/W/VBE sub-contractors and suppliers are underway, following awards to prime tier sub-contractors.
# Contract
Awards Goal Awarded to
Date $ Awarded to
Date MBE 38 5.0% 4.8% $49.1 M
WBE 83 5.4% 9.8% $99.2 M
VBE 26 1.0% 2.6% $26.5 M
TOTAL 131* 11.4% 15.5%* $156.6 M*
Total Qualified Construction Spend = $1,011,967,368 * M/W/VBE contract awards report includes awards made to businesses with more than one diverse classification (i.e. M/WBE). Totals reported deduct any double counting due to awards to businesses with more than one diverse classification.

7
Construction: MBE Participation, 38 Contracts Awarded Sub-Contractor / Supplier Location Scope
Award Amount ($) % Goal
% of Awarded Contracts
Andel la Iron Inc. Chelsea, MA Rebar Insta l lAl l Time Service, Inc. (M/WBE) Jamaica Pla in, MA CleaningAdonai Water (M/WBE) Randolph, MA Water SupplyAdonai Water (M/WBE) Randolph, MA Water SupplyAnvi l Steel & Engineering (M/VBE) Taunton, MA Shear Stud Insta l lationAnvi l Steel & Engineering (M/VBE) Taunton, MA Rebar at main levelASA Environmenta l Products (M/WBE) Stonington, CT Drywal l Materia ls SupplyASA Environmenta l Products (M/WBE) Stonington, CT Drywal l Materia ls SupplyBui lding Enclosure Associates Charlestown, MA Commiss ioningCDP Fastener Group Brockton, MA Ejector Pump Control Panel SupplyCharter Contracting Company Boston, MA RemediationCharter Contracting Company Boston, MA TruckingDependable Masonry Construction North Reading, MA MasonryDon Martin Marshfield, MA PavingDon Martin Marshfield, MA PavingD. Si lva Trucking Carver, MA TruckingDuray J.F. Duncan Industries Downey, CA Food Service EquipmentEdwards Group (M/WBE) Mattapan, MA Ons i te Trucking/Soi l s Haul ingE. G. Fi sher Construction, Inc. Worcester, MA CIP Light RT Wal l Concrete WorkEvermore Light & Power (M/WBE) Tewksbury, MA ALC Insta l lFi sher Contracting Corporation (M/WBE Worcester, MA Living Shore Line EarthworkFL&A Trucking Dorchester, MA TruckingGira Steel (M/WBE) West Columbia , SC Steel FabricationIndependent Pipe Service Houston, TX Dri l l Cas ing SupplyIndependent Pipe Service Houston, TX Pipe Suppl iesJHP Industria l Supply Co. Inc. Syracuse, NY Pipe, Va lves , Fi ttingsMaria Fa l lon Electrica l Services (M/WB Mil l i s , MA Electrica l LaborM-O-N Landscaping North Dartmouth, MA Eros ion ControlMoor Meta ls Inc Hol l i s ton, MA Pipe, Pi les , Ti le & RodMoor Meta ls Inc Hol l i s ton, MA Metal Materia lsPMA Consultants Ann Arbor, MI Change Order ReviewRegis Steel Fa l l River, MA Rebar CagesRichard W. Reid Electrica l Bi l lerica , MA Electrica lRichard W. Reid Electrica l Bi l lerica , MA Hotel Tower Electrica l LaborTavares , LLC Providence, RI Mi l lwork Materia ls & Insta l l ServicesTi tan Roofing (M/VBE) Quincy, MA RoofingUS Inspection & Consul ting Phoenix, AZ Materia ls TestingWood & Wire Fence Lincoln, RI Temporary Fence
TOTAL $49,078,365 5.0% 4.8%

8
Construction: WBE Participation, 83 Contracts Awarded Sub-Contractor / Supplier Location Scope
Award Amount ($) % Goal
% of Awarded Contracts
ABC Soi l s , Inc. Sudbury, MA Soi l TestingAdonai Water (M/WBE) Randolph, MA Water SupplyAdonai Water (M/WBE) Randolph, MA Water SupplyAngel ini Plastering, Inc North Reading, MA Synthetic StuccoAlbanese Brothers , Inc Dracut, MA StoneAlbanese Brothers , Inc Dracut, MA Furnish s tone & gravelAl l iance Detective & Securi ty Everett, MA Si te Securi tyAl l iance Detective & Securi ty Everett, MA Si te Securi tyAl l Time Service, Inc. (M/WBE) Jamaica Pla in, MA CleaningAppl ied Insulation Pla is tow, NH HVAC Pipe & Duct Insta l lationArchi tectura l Products Burl ington, CT Glass & Glazing Materia lsASA Environmenta l Products (M/WBE) Stonington, CT Drywal l Materia ls SupplyASA Environmenta l Products (M/WBE) Stonington, CT Drywal l Materia ls SupplyBack Bay Concrete Wakefield, MA Place and Finish Concrete SlabBrennan Consul ting Burl ington, MA SurveyingBOSS Steel Everett, MA Steel ErectionBoston Bridge & Steel Methuen, MA Catwalk Ra i l ing FabricationChapman Electric (W/VBE) Sandwich, MA ALC Insta l lationCoghl in Electrica l Worcester, MA Medium Voltage Electrica lCoghl in Electrica l Worcester, MA Podium North Electrica lConsol idated Brick Suppl ies Avon, MA Masonry AccessoriesCharles George Trucking Londonderry, NH TruckingDagle Electrica l Construction Woburn, MA Electrica lDelucca Fence Company Methuen, MA FencingDelucca Fence Company Methuen, MA FencingEdwards Group (M/WBE) Mattapan, MA Ons i te Trucking/Soi l s Haul ingEvermore Light & Power (M/WBE) Tewksbury, MA ALC Insta l lFabiano Oi l Corp Wrentham, MA Fuel SupplyFabiano Oi l Corp Wrentham, MA Fuel SupplyFabiano Oi l Corp Wrentham, MA Fuel SupplyFisher Contracting Corporation (M/WBE Worcester, MA Living Shorel ine Earthwork, ConcreteGenera l Safety Services Corp. Canton, MA Safety Equipment & Materia lGira Steel (M/WBE) West Columbia , SC Steel FabricationGranite Ci ty Electrica l Quincy, MA Electrica l Suppl iesGranite Ci ty Electrica l Quincy, MA Electrica l Suppl iesGranite Ci ty Electrica l Quincy, MA Electrica l Suppl iesHat Creek Outfi t Rockland, MA HVAC Suppl iesHat Creek Outfi t Rockland, MA Pipe, Fi tting Va lves Suppl ierHat Creek Outfi t Rockland, MA Pipe, Fi tting Va lves Suppl ierHeri tage Construction Watertown, MA Suppl iesImex Cargo East boston Trucking & Freight

9
Construction: WBE Participation (cont.), 83 Contracts Awarded
Sub-Contractor / Supplier Location ScopeAward
Amount ($) % Goal% of Awarded
ContractsInters tate Steel Sa les , Inc. Orchard Park, NY Materia ls - Plates , ChannelsJackson Glass Ros l indale, MA Curta in Wal l Ins ta l lationJ F Shine Mechanica l West Roxbury, MA Plumbing InsulationJMD Bui lding Products New York, NY Pipe suppl iesJ. Rego Trucking Taunton, MA TruckingKevi l le Enterprises Boston, MA Construction InspectionsL&L Contracting Bra intree, MA Materia lsLub-O-Line Industria l Oi l Somervi l le, MA Lube & Fuel Suppl ierLynn Ladder & Scaffolding Lynn, MA ScaffoldingMelo's Rodbusters South Dartmouth, MA Reinforcing Steel SupplyModulease Corporation Pla invi l le, MA Site Office Tra i lerModulease Corporation Pla invi l le, MA Storage Conta inerNobscot Supply Company Framingham, MA Suppl iesNovel Iron Works Amesbury, MA Steel FabricationPest End Inc Methuen, MA Pest ControlP J Spi l lane Everett, MA WaterproofingP J Spi l lane Everett, MA WaterproofingP J Spi l lane Everett, MA WaterproofingRamco West Bridgewater, MA Stakes , Hay Ba les , FenceRebars & Mesh Haverhi l l , MA Rebar SupplyRebars & Mesh Haverhi l l , MA Rebar SupplyRebars & Mesh Haverhi l l , MA Rebar SupplyRebars & Mesh Haverhi l l , MA Rebar at Lower GarageSOS Corporation Mi l ford, MA Labor - Pre-Cast MasonrySOS Corporation Mi l ford, MA Labor - Pre-Cast MasonrySouthcoast Suppl ies Fa i rhaven, MA CMU, Mortar, and GroutStadium Fuel Peabody, MA FuelTa ibi Equipment Wakefield, MA Equipment Renta lTaycam LLC Plymouth, MA Equipment Renta lThompson Company E. Weymouth, MA Doors , Frames , HardwareThompson Company E. Weymouth, MA Doors , Frames , HardwareTools Unl imited Stoughton, MA Smal l tools supplyTools Unl imited Stoughton, MA Tools & Hanging Materia lsTools Unl imited Stoughton, MA Saw Blades , Smal l Tools , PPETurtle & Hughes Linden, NJ Commodities / GearUrban Insulation Sal i sbury, MA Furnish, Insta l l Pipe InsulationVi l lanova Construction Ros l indale, MA Suppl ierWelch Associates Land Surveyors West Bridgewater, MA Layouts , As -bui l t SurveysWelch Associates Land Surveyors West Bridgewater, MA Layouts , As -bui l t SurveysWang Commiss ioning West Roxbury, MA Bui lding Commiss ioningWi l l iam G. Moore Freehold, NJ Timber Pi les SupplyWynco Dis tributors of New England Wi lmington, MA Carpet Pad Vendor
TOTAL $99,186,800 5.4% 9.8%

10
Construction: VBE Participation, 26 Contracts Awarded
Sub-Contractor / Supplier Location ScopeAward
Amount ($) % Goal% of Awarded
ContractsAnvi l Steel Engineering (M/VBE) Taunton, MA Shear Stud Insta l lationAnvi l Steel & Engineering (M/VBE) Taunton, MA Rebar at main levelArrow Securi ty Springfield, MA Site Securi tyBroco Oi l North Reading, MA Fuel SupplyBroco Oi l North Reading, MA Fuel SupplyBroco Oi l North Reading, MA Fuel SupplyBroco Oi l North Reading, MA Fuel SupplyBroco Oi l North Reading, MA Fuel SupplyBroco Oi l North Reading, MA Fuel SupplyBroco Oi l North Reading, MA Fuel SupplyChapman Electric (W/VBE) Sandwich, MA ALC Insta l lationCobiax Dedham, MA Stud Rai l SupplyEastern Exterior Wal l Al lentown, PA Pre-Engineered Wal lsFrisol i Electric Holbrook, MA Grounding Materia ls SupplyHomeland Mechanica l Quincy, MA Furnish, Insta l l Trench Dra insHomeland Mechanica l Quincy, MA Pipe Fi tter LaborJ Rams East Wareham, MA Sign Insta l lationKWL Inc. Frankl in, MA Trucking, FreightOsprey Construction Supply Sharon, MA Pipe Hanger & Fastener SupplyOsprey Construction Supply Sharon, MA Pipe Hanger & Fastener SupplyRecon Outfi tters Sturbridge, MA Water/s lurry tanksSourcing Solutions Tigard, OR Crane Mat Suppl ierSwag Tools Waltham, MA Miscel laneous Suppl iesTansey Electric Manchester, NH Electrica l LaborTi tan Roofing (M/VBE) Quincy, MA RoofingThompson & Lichtner, Inc. Canton, MA Materia ls Testing
TOTAL $26,460,313 1.0% 2.6%

11
Construction: Workforce Participation
• As of June 30th, 718,290 hours of work had been completed on the project site by 1,967 workers.
• 468 minorities, 123 females, and 96 veterans have performed construction work on the project.
# Workers*
# Diverse Workforce
Hours* Goal
% Diverse Workforce
Hours to Date Minority 468 187.587.3 15.3% 26.1%
Female 123 50,664.5 6.9% 7.1%
Veteran 96 49,242.0 3.0% 6.9%
*Individual workers, and the hours worked by those individuals, may be counted in more than one diverse category.

12
Construction Workforce: Outreach
• Ongoing outreach and work with community partners and Career Centers, including monthly reminders about upcoming Building Trades Apprentice Application Opportunities. Continuing referrals for career seekers to apprenticeship programs and on-site sub-contractors.
• On-site sub-contractors notifications sent to all union walk-on applicants.
• 6/1: Urban League Job Fair
• 6/2: Building Pathways Class Site Tour
• 6/26: IBEW Business Agent, Training Director Meeting – discussed upcoming needs and workforce diversity goals
• 6/27: Malden Job Fair
• 6/29: Boston Neighborhood Career Fair – East Boston

13


19

20
21

22

23
24

Page 1 of 4
Total # Workers
Hours # Workers % # Workers Hours %Total #
Workers# Workers Hours % # Workers % # Workers Hours %
0 0.0 0 0.0% 0 0.0 0.0% 4 3 511.0 90.4% 0 0.0% 0 0.0 0.0%3 0.0 0 0.0% 0 0.0 0.0% 3 0 0.0 0.0% 0 0.0% 0 0.0 0.0%3 21.0 0 0.0% 1 21.0 38.9% 12 6 991.0 60.7% 0 0.0% 1 549.5 33.7%
11 16.0 1 8.6% 0 0.0 0.0% 35 2 316.5 15.8% 2 1.7% 2 82.5 4.1%0 0.0 0 0.0% 0 0.0 0.0% 71 21 5,290.5 24.0% 3 6.4% 3 1,399.5 6.4%5 100.0 0 0.0% 0 0.0 0.0% 5 2 100.0 36.8% 0 0.0% 0 0.0 0.0%0 0.0 0 0.0% 0 0.0 0.0% 2 0 0.0 0.0% 0 0.0% 0 0.0 0.0%0 0.0 0 0.0% 0 0.0 0.0% 21 5 1,326.0 63.1% 0 0.0% 1 462.5 22.0%
15 584.0 1 8.3% 0 0.0 0.0% 19 7 1,295.0 35.3% 1 6.7% 0 0.0 0.0%0 0.0 0 0.0% 0 0.0 0.0% 15 0 0.0 0.0% 1 3.8% 1 116.5 5.2%
11 306.5 1 9.0% 1 150.0 8.9% 11 2 754.5 26.5% 1 6.4% 1 518.0 18.2%0 0.0 0 0.0% 0 0.0 0.0% 4 1 8.0 1.6% 0 0.0% 0 0.0 0.0%
16 128.0 1 7.5% 0 0.0 0.0% 17 4 203.0 9.4% 1 5.0% 0 0.0 0.0%0 0.0 0 0.0% 0 0.0 0.0% 26 3 462.0 13.6% 0 0.0% 0 0.0 0.0%
93 894.0 7 6.2% 7 596.0 7.7% 105 12 3,453.0 14.6% 7 5.8% 9 3,504.0 14.8%1 0.0 0 0.0% 0 0.0 0.0% 32 6 135.0 15.7% 1 1.9% 1 24.0 2.8%0 0.0 0 0.0% 0 0.0 0.0% 6 2 203.0 24.3% 0 0.0% 0 0.0 0.0%8 27.5 0 0.0% 0 0.0 0.0% 20 8 218.5 39.7% 0 0.0% 1 12.0 2.2%0 0.0 0 0.0% 0 0.0 0.0% 9 2 181.0 41.3% 0 0.0% 0 0.0 0.0%1 0.0 0 0.0% 0 0.0 0.0% 2 0 0.0 0.0% 0 0.0% 0 0.0 0.0%
13 316.0 1 9.0% 3 360.0 26.4% 18 3 397.0 21.9% 2 9.9% 4 457.0 25.2%0 0.0 0 0.0% 0 0.0 0.0% 13 1 27.0 4.6% 0 0.0% 0 0.0 0.0%
25 581.0 2 8.4% 1 113.0 4.3% 40 8 2,719.0 20.5% 3 9.1% 2 674.5 5.1%0 0.0 0 0.0% 0 0.0 0.0% 7 1 8.0 0.8% 0 0.0% 0 0.0 0.0%6 120.0 1 18.8% 0 0.0 0.0% 10 2 490.0 23.9% 3 25.9% 1 276.0 13.4%0 0.0 0 0.0% 0 0.0 0.0% 2 0 0.0 0.0% 0 0.0% 0 0.0 0.0%0 0.0 0 0.0% 0 0.0 0.0% 2 0 0.0 0.0% 0 0.0% 0 0.0 0.0%
10 143.0 0 0.0% 0 0.0 0.0% 50 14 1,937.0 20.5% 2 2.6% 1 365.5 3.9%0 0.0 0 0.0% 0 0.0 0.0% 44 6 2,839.5 15.8% 2 6.5% 6 4,205.0 23.5%0 0.0 0 0.0% 0 0.0 0.0% 0 0 0.0 0.0% 0 0.0% 0 0.0 0.0%0 0.0 0 0.0% 0 0.0 0.0% 2 0 0.0 0.0% 0 0.0% 1 8.0 47.1%
30 753.5 4 14.5% 4 515.0 14.7% 91 15 22,967.0 21.9% 10 9.0% 9 9,119.5 8.7%17 1,288.0 2 8.4% 1 70.0 4.3% 22 16 2,564.0 67.9% 3 17.6% 1 376.0 10.0%11 112.0 0 0.0% 0 0.0 0.0% 25 5 1,258.0 29.1% 0 0.0% 1 285.0 6.6%20 253.0 2 11.0% 0 0.0 0.0% 34 4 2,907.0 13.5% 2 15.4% 3 1,055.0 4.9%0 0.0 0 0.0% 0 0.0 0.0% 1 0 0.0 0.0% 0 0.0% 0 0.0 0.0%0 0.0 0 0.0% 0 0.0 0.0% 11 4 780.0 88.2% 0 0.0% 0 0.0 0.0%0 0.0 0 0.0% 0 0.0 0.0% 0 0 0.0 0.0% 0 0.0% 0 0.0 0.0%7 101.5 0 0.0% 0 0.0 0.0% 29 8 2,682.0 27.6% 1 4.4% 1 120.5 1.2%6 35.0 0 0.0% 2 70.0 34.1% 9 1 161.0 19.0% 0 0.0% 2 269.0 31.8%
15 16.0 1 55.9% 0 0.0 0.0% 17 4 50.0 7.7% 1 76.1% 0 0.0 0.0%0 0.0 0 0.0% 0 0.0 0.0% 6 0 0.0 0.0% 0 0.0% 0 0.0 0.0%
79 2,418.5 9 9.6% 2 182.0 2.1% 187 50 25,239.5 26.8% 20 9.3% 4 2,790.0 3.0%2 0.0 0 0.0% 0 0.0 0.0% 14 2 1,986.0 27.8% 2 9.2% 1 1,217.0 17.0%0 0.0 0 0.0% 0 0.0 0.0% 1 0 0.0 0.0% 0 0.0% 0 0.0 0.0%
61 3,351.0 4 6.8% 4 540.0 7.1% 91 33 16,738.0 37.7% 9 5.4% 4 3,094.0 7.0%24 131.0 1 5.1% 3 254.0 11.6% 25 3 253.0 5.2% 1 2.3% 3 1,053.5 21.7%1 4.0 0 0.0% 0 0.0 0.0% 36 2 34.0 1.5% 1 5.0% 0 0.0 0.0%
13 358.5 1 8.8% 2 254.0 17.1% 38 6 3,574.5 20.2% 1 4.7% 2 1,985.0 11.2%8 225.0 1 15.8% 0 0.0 0.0% 12 2 418.0 21.7% 1 9.6% 0 0.0 0.0%4 0.0 1 27.4% 0 0.0 0.0% 5 0 0.0 0.0% 1 25.4% 0 0.0 0.0%5 152.0 1 11.5% 1 46.0 9.1% 10 2 781.0 24.4% 1 7.6% 1 205.0 6.4%
Workforce Summary ReportWYNN BOSTON HARBORConstruction Workforce DiversityDate Range: 9/2015 - 6/30/2017
JUNE 2017 PROJECT TO DATEMINORITY - Goal: 15.3% FEMALE - Goal: 6.9% VETERAN - Goal: 3.0% MINORITY - Goal: 15.3% FEMALE - Goal: 6.9% VETERAN - Goal: 3.0%
Total Hours
Hours
Andella Iron Inc. 0.0 0 0.0% 0.0 565.0 0.0
CONTRACTORTotal Hours
# Workers
% Hours
67.0 0.0Anvil Steel Engineering, Inc. 54.0 1 38.9% 0.0 1,632.5 0.0Angelini Plastering, Inc. 67.0 0 0.0% 0.0
2,002.5 33.5BOSS Steel Inc. 0.0 0 0.0% 0.0 22,036.8 1,406.0Back Bay Concrete Corp. 93.0 2 17.2% 8.0
272.0 0.0Cashman Dredging & Marine Contracting 0.0 0 0.0% 0.0 200.0 0.0Capco Steel Erection Company 272.0 2 36.8% 0.0
2,102.5 0.0Century Drywall, Inc. 1,623.0 5 36.0% 134.0 3,673.5 246.0Cavalieri Construction Company, Inc. 0.0 0 0.0% 0.0
2,223.5 84.0Coghlin Electrical Contractors, Inc. 1,682.0 2 18.2% 151.0 2,847.5 183.0Coastal Marine Construction 0.0 0 0.0% 0.0
499.5 0.0Costa Brothers Masonry, Inc. 1,376.5 3 9.3% 103.5 2,152.0 107.5Construction Drilling, Inc. 0.0 0 0.0% 0.0
3,401.0 0.0Daniel Marr and Son Co. 7,783.0 12 11.5% 484.0 23,686.5 1,373.5Dagle Electrical Construction Corporation 0.0 0 0.0% 0.0
857.5 16.0Dependable Masonry Construction Co. 0.0 0 0.0% 0.0 836.5 0.0DeLucca Fence Company 8.0 0 0.0% 0.0
550.5 0.0D's Welding 0.0 0 0.0% 0.0 438.0 0.0Don Martin Corporation 74.0 3 37.2% 0.0
51.0 0.0E.M. Duggan, Inc. 1,363.0 3 23.2% 123.0 1,810.0 179.0E.H. Marchant Co. Inc. 10.0 0 0.0% 0.0
582.0 0.0Edward G. Sawyer Co., Inc. 2,631.5 6 22.1% 220.0 13,259.0 1,211.5Easton Concrete Cutting & Drilling LLC 0.0 0 0.0% 0.0
996.0 0.0Fisher Contracting Corporation 783.0 1 15.3% 147.0 2,054.0 533.0Fischbach & Moore Electric Group, LLC 0.0 0 0.0% 0.0
72.5 0.0Griffin Door dba Overhead Door Specialities 0.0 0 0.0% 0.0 112.0 0.0Geologic Earth Exploration, Inc. 0.0 0 0.0% 0.0
9,463.0 250.0Hub Foundation Co., Inc. 0.0 0 0.0% 0.0 17,917.5 1,164.0Hayward Baker Inc. 255.0 6 56.1% 0.0
0.0 0.0J Rams Inc 0.0 0 0.0% 0.0 17.0 0.0J & M Brown Company, Inc. 0.0 0 0.0% 0.0
104,810.9 9,461.5J.C. Cannistraro 1,624.0 14 79.3% 136.0 3,774.0 664.0J. Derenzo Co. 3,503.5 6 21.5% 509.0
4,327.0 0.0J.F. White Contracting Company, Inc 2,531.0 3 10.0% 279.0 21,548.0 3,310.5J.C. Higgins Corp 672.0 2 16.7% 0.0
40.0 0.0JR Vinagro Corp. 0.0 0 0.0% 0.0 884.0 0.0John W. Egan Co., Inc. 0.0 0 0.0% 0.0
0.0 0.0K&H Electrical Systems, Inc. 593.0 1 17.1% 0.0 9,706.0 425.5K Safe Corp 0.0 0 0.0% 0.0
845.5 0.0LCN, Inc. 272.0 2 5.9% 152.0 645.5 491.5K&M Fire Protection Services, Inc. 205.0 1 17.1% 0.0
96.0 0.0Liberty Construction Services 8,760.5 21 27.6% 837.5 94,005.5 8,744.0Leading Way Construction Co., Inc. 0.0 0 0.0% 0.0
7,141.0 655.0Lockwood Remediation 0.0 0 0.0% 0.0 32.0 0.0Liberty Equipment and Supply 124.0 0 0.0% 0.0
44,373.5 2,400.0M.L. McDonald Sales Company, LLC 2,182.0 2 6.0% 112.0 4,850.5 112.0Lund Rebar Services, Inc. 7,584.0 23 44.2% 516.0
2,241.0 112.0Maxim Crane Works, L.P. 1,482.5 3 24.2% 130.0 17,692.5 827.5Mass Bay Electrical Corp. 4.0 1 100.0% 0.0
1,923.0 185.0McGregor Industries, Inc. 584.0 0 0.0% 160.0 1,480.0 376.0McCusker-Gill, Inc. 709.0 2 31.7% 112.0
3,199.0 242.0McPhee Electric Ltd. 504.0 1 30.2% 58.0

Page 2 of 4
Total # Workers
Hours # Workers % # Workers Hours %Total #
Workers# Workers Hours % # Workers % # Workers Hours %
JUNE 2017 PROJECT TO DATEMINORITY - Goal: 15.3% FEMALE - Goal: 6.9% VETERAN - Goal: 3.0% MINORITY - Goal: 15.3% FEMALE - Goal: 6.9% VETERAN - Goal: 3.0%
Total Hours
HoursCONTRACTORTotal Hours
# Workers
% Hours
2 16.0 0 0.0% 1 16.0 33.3% 6 4 1,151.0 55.6% 0 0.0% 1 515.0 24.9%0 0.0 0 0.0% 0 0.0 0.0% 1 0 0.0 0.0% 0 0.0% 0 0.0 0.0%0 0.0 0 0.0% 0 0.0 0.0% 7 0 0.0 0.0% 0 0.0% 0 0.0 0.0%0 0.0 0 0.0% 0 0.0 0.0% 37 11 5,834.0 31.2% 3 1.6% 2 1,169.5 6.3%0 0.0 0 0.0% 0 0.0 0.0% 10 8 254.0 88.5% 0 0.0% 0 0.0 0.0%7 0.0 0 0.0% 0 0.0 0.0% 9 0 0.0 0.0% 0 0.0% 0 0.0 0.0%4 128.0 0 0.0% 0 0.0 0.0% 36 35 7,746.5 99.4% 4 18.1% 1 164.0 2.1%0 0.0 0 0.0% 0 0.0 0.0% 2 1 12.0 32.4% 0 0.0% 0 0.0 0.0%
12 13.0 1 4.0% 0 0.0 0.0% 17 2 33.0 7.9% 1 7.2% 0 0.0 0.0%0 0.0 0 0.0% 0 0.0 0.0% 10 3 154.0 24.5% 0 0.0% 0 0.0 0.0%2 0.0 0 0.0% 0 0.0 0.0% 2 0 0.0 0.0% 0 0.0% 0 0.0 0.0%0 0.0 0 0.0% 0 0.0 0.0% 2 0 0.0 0.0% 0 0.0% 0 0.0 0.0%1 0.0 0 0.0% 0 0.0 0.0% 1 0 0.0 0.0% 0 0.0% 0 0.0 0.0%0 0.0 0 0.0% 0 0.0 0.0% 24 6 1,415.5 22.5% 3 9.8% 0 0.0 0.0%0 0.0 0 0.0% 0 0.0 0.0% 3 2 16.0 47.1% 0 0.0% 0 0.0 0.0%0 0.0 0 0.0% 0 0.0 0.0% 4 0 0.0 0.0% 0 0.0% 1 8.0 23.5%
218 10,348.0 11 5.1% 11 1,724.0 5.1% 291 76 44,837.0 30.7% 12 4.9% 13 7,422.5 5.1%0 0.0 0 0.0% 0 0.0 0.0% 18 1 27.0 6.5% 0 0.0% 0 0.0 0.0%1 0.0 0 0.0% 0 0.0 0.0% 1 0 0.0 0.0% 0 0.0% 0 0.0 0.0%
19 207.5 1 1.3% 2 174.5 8.8% 20 2 308.5 10.9% 1 0.9% 2 326.5 11.6%3 48.0 0 0.0% 0 0.0 0.0% 3 1 184.0 52.0% 0 0.0% 0 0.0 0.0%0 0.0 0 0.0% 0 0.0 0.0% 3 0 0.0 0.0% 0 0.0% 0 0.0 0.0%0 0.0 0 0.0% 0 0.0 0.0% 21 2 1,308.0 11.3% 3 9.1% 2 1,225.0 10.6%
25 484.0 2 12.0% 0 0.0 0.0% 25 8 484.0 37.9% 2 11.9% 0 0.0 0.0%0 0.0 0 0.0% 0 0.0 0.0% 85 22 15,285.5 26.0% 7 6.9% 3 2,630.0 4.5%0 0.0 0 0.0% 0 0.0 0.0% 9 1 116.0 16.9% 0 0.0% 0 0.0 0.0%5 24.0 0 0.0% 1 120.0 41.7% 32 3 1,802.3 13.4% 3 4.9% 4 1,557.5 11.6%0 0.0 0 0.0% 0 0.0 0.0% 15 1 356.5 8.6% 1 9.6% 0 0.0 0.0%0 0.0 0 0.0% 0 0.0 0.0% 2 1 4.0 50.0% 0 0.0% 0 0.0 0.0%
823 23,704.5 57 7.2% 47 5,205.5 5.9% 1,967 468 187,587.3 26.1% 123 7.1% 96 49,242.0 6.9%
MinorityFemaleVeteran
Melo's Rodbusters, Inc. 48.0 1 33.3% 0.0 2,070.5 0.032.0 0.0
MON Landscaping Inc. 0.0 0 0.0% 0.0 96.0 0.0Midnight Iron Construction Management Inc. 0.0 0 0.0% 0.0
18,672.5 302.0MTK Construction Services, Inc. 0.0 0 0.0% 0.0 287.0 0.0Moretrench 0.0 0 0.0% 0.0
827.5 0.0NewRoads Environmental 128.0 4 100.0% 0.0 7,793.5 1,412.0NER Construction Mgmnt 315.0 0 0.0% 0.0
37.0 0.0Otis Elevator Company 250.8 2 5.2% 10.0 418.3 30.0NorthStar Contracting Group, Inc 0.0 0 0.0% 0.0
629.0 0.0Pick Crane Service, Inc. 36.0 0 0.0% 0.0 47.0 0.0P.J. Spillane Company, Inc. 0.0 0 0.0% 0.0
48.0 0.0Rapid Flow Inc. 74.5 0 0.0% 0.0 1,346.0 0.0R.J. Cobb LTD 0.0 0 0.0% 0.0
6,283.5 613.0Richard W. Reid Electric Company Inc. 0.0 0 0.0% 0.0 34.0 0.0Regis Steel Corporation 0.0 0 0.0% 0.0
34.0 0.0S&F Concrete Contractors, Inc. 34,118.5 63 30.3% 1,753.0 145,831.0 7,133.5S&A Cranes LLC 0.0 0 0.0% 0.0
416.0 0.0SOS Corporation 32.0 0 0.0% 0.0 139.0 0.0Silverback Construction Inc. 0.0 0 0.0% 0.0
2,824.0 25.5T&T Electrical Contractors, Inc. 96.0 1 50.0% 0.0 354.0 0.0Sunrise Erectors, Inc. 1,987.0 2 10.4% 25.5
68.5 0.0The Welch Corporation 0.0 0 0.0% 0.0 11,582.5 1,057.0The Railroad Associates Corporation 0.0 0 0.0% 0.0
1,278.0 152.0TREVIICOS CORPORATION 0.0 0 0.0% 0.0 58,881.0 4,090.5Titan Roofing, Inc. 1,264.5 8 38.3% 152.0
688.0 0.0Vynorius Piledriving Inc. 288.0 1 8.3% 0.0 13,437.3 657.5UTEC Constructors LLC 0.0 0 0.0% 0.0
4,134.0 398.0Wood & Wire Fence Co. Inc 0.0 0 0.0% 0.0 8.0 0.0WES Construction Corp 0.0 0 0.0% 0.0
718,290.2 50,664.5
SUMMARY PERFORMANCE: PROJECT TO DATE
# Workers Hours Goal Project to Date
TOTAL 88,047.8 210 26.9% 6,312.5
96 49,242.0 3.0% 6.9%123 50,664.5 6.9% 7.1%468 187,587.3 15.3% 26.1%

Page 3 of 4
Total Hours
Hours # Workers Hours %Total #
Workers# Workers Hours % # Workers # Workers Hours %
0.0 0.0 0 0.0 0.0% 0 0 0.0 0.0% 0 0 0.0 0.0%0.0 0.0 0 0.0 0.0% 2 0 0.0 0.0% 0 0 0.0 0.0%
1,021.5 103.5 0 0.0 0.0% 26 4 336.0 12.3% 1 0 0.0 0.0%369.5 0.0 0 0.0 0.0% 2 0 0.0 0.0% 0 0 0.0 0.0%550.0 0.0 0 0.0 0.0% 3 3 1,650.5 100.0% 0 0 0.0 0.0%881.0 0.0 0 0.0 0.0% 5 3 1,726.5 76.2% 0 0 0.0 0.0%546.0 0.0 0 0.0 0.0% 8 2 971.0 46.9% 0 0 0.0 0.0%
8,382.5 1,005.0 4 750.0 8.9% 85 26 13,196.0 29.4% 9 6 3,467.5 7.7%177.0 0.0 0 0.0 0.0% 3 1 324.0 24.4% 0 0 0.0 0.0%435.0 0.0 0 0.0 0.0% 4 0 0.0 0.0% 0 0 0.0 0.0%
5,630.0 214.5 3 524.0 9.3% 45 8 6,231.0 22.5% 2 3 3,196.5 11.6%620.5 0.0 0 0.0 0.0% 3 0 0.0 0.0% 0 0 0.0 0.0%238.5 0.0 1 166.5 69.8% 2 0 0.0 0.0% 0 1 318.5 43.8%393.0 0.0 0 0.0 0.0% 4 1 160.0 7.4% 0 0 0.0 0.0%209.5 0.0 0 0.0 0.0% 3 0 0.0 0.0% 0 0 0.0 0.0%
1,372.0 104.0 2 123.0 9.0% 27 5 2,187.0 33.6% 2 2 390.0 6.0%1,582.0 0.0 1 32.0 2.0% 12 5 3,805.5 42.6% 0 1 293.0 3.3%
8.0 0.0 0 0.0 0.0% 1 0 0.0 0.0% 0 0 0.0 0.0%5,782.5 581.0 3 309.0 5.3% 171 33 7,690.5 21.2% 7 5 1,518.0 4.2%
0.0 0.0 0 0.0 0.0% 18 1 116.0 11.1% 1 0 0.0 0.0%250.8 10.0 0 0.0 0.0% 24 3 610.3 24.6% 1 1 569.5 22.9%
0.0 0.0 0 0.0 0.0% 0 0 0.0 0.0% 0 0 0.0 0.0%17,001.5 1,160.0 13 1,173.0 6.9% 341 89 29,831.0 28.7% 23 18 9,062.0 8.7%
59.5 0.0 0 0.0 0.0% 5 2 72.5 5.8% 0 0 0.0 0.0%229.5 0.0 0 0.0 0.0% 8 2 1,032.0 82.9% 0 0 0.0 0.0%
0.0 0.0 0 0.0 0.0% 0 0 0.0 0.0% 0 0 0.0 0.0%128.0 0.0 0 0.0 0.0% 33 32 7,581.5 99.4% 4 1 164.0 2.1%
0.0 0.0 0 0.0 0.0% 0 0 0.0 0.0% 0 0 0.0 0.0%1,468.0 0.0 0 0.0 0.0% 29 5 5,563.5 36.1% 2 0 0.0 0.0%2,017.0 0.0 1 207.0 10.3% 24 9 5,777.5 63.8% 0 1 835.0 9.2%
14,752.5 1,930.5 2 230.0 1.6% 296 88 44,357.5 32.9% 40 9 4,150.0 3.1%2,033.0 0.0 0 0.0 0.0% 30 10 4,589.0 31.5% 0 0 0.0 0.0%
0.0 0.0 0 0.0 0.0% 0 0 0.0 0.0% 0 0 0.0 0.0%165.0 0.0 0 0.0 0.0% 5 0 0.0 0.0% 0 0 0.0 0.0%414.5 0.0 0 0.0 0.0% 10 4 1,597.0 52.2% 0 0 0.0 0.0%435.5 0.0 0 0.0 0.0% 11 4 773.5 25.0% 0 0 0.0 0.0%
0.0 0.0 0 0.0 0.0% 1 0 0.0 0.0% 0 0 0.0 0.0%1,437.0 112.0 2 222.0 15.4% 14 1 229.0 6.8% 1 2 1,021.5 30.3%
136.0 0.0 1 32.0 23.5% 2 0 0.0 0.0% 0 1 32.0 23.5%201.0 0.0 0 0.0 0.0% 2 0 0.0 0.0% 0 0 0.0 0.0%
0.0 0.0 0 0.0 0.0% 0 0 0.0 0.0% 0 0 0.0 0.0%0.0 0.0 0 0.0 0.0% 1 0 0.0 0.0% 0 0 0.0 0.0%0.0 0.0 0 0.0 0.0% 0 0 0.0 0.0% 0 0 0.0 0.0%
608.0 0.0 0 0.0 0.0% 12 4 2,003.5 46.1% 0 0 0.0 0.0%0.0 0.0 0 0.0 0.0% 0 0 0.0 0.0% 0 0 0.0 0.0%
1,509.0 0.0 1 48.0 3.2% 26 6 4,060.5 41.9% 0 2 458.0 4.7%533.5 0.0 0 0.0 0.0% 11 3 91.0 2.1% 0 0 0.0 0.0%
0.0 0.0 0 0.0 0.0% 0 0 0.0 0.0% 0 0 0.0 0.0%0.0 0.0 0 0.0 0.0% 0 0 0.0 0.0% 0 0 0.0 0.0%0.0 0.0 0 0.0 0.0% 0 0 0.0 0.0% 0 0 0.0 0.0%
302.5 0.0 0 0.0 0.0% 6 2 67.5 2.4% 0 0 0.0 0.0%36.0 0.0 0 0.0 0.0% 10 2 2,017.0 93.6% 0 0 0.0 0.0%
0.0 0.0 0 0.0 0.0% 38 5 1,864.0 11.0% 1 1 641.5 3.8%
JUNE 2017 PROJECT TO DATE
Workforce Summary Report
WYNN BOSTON HARBORConstruction Workforce DiversityDate Range: 9/2015 - 6/30/2017
MINORITY - Goal: 15.3% FEMALE - Goal: 6.9% VETERAN - Goal: 3.0%
LOCAL TRADE UNIONTotal #
Workers# Workers Hours % # Workers %
MINORITY - Goal: 15.3% FEMALE - Goal: 6.9% VETERAN - Goal: 3.0%Total Hours
Hours %
Asbestos Workers Local 6 0 0 0.0 0.0% 0 0.0% 0.0 0.0 0.0%Boilermakers Local 29 0 0 0.0 0.0% 0 0.0% 64.0 0.0 0.0%Bricklayers Local 3 Eastern Mass. 16 1 16.0 1.6% 1 10.1% 2,729.0 107.5 3.9%Carpenters Local 107 2 0 0.0 0.0% 0 0.0% 1,980.0 0.0 0.0%Carpenters Local 108 3 3 550.0 100.0% 0 0.0% 1,650.5 0.0 0.0%Carpenters Local 111 5 3 568.0 64.5% 0 0.0% 2,266.5 0.0 0.0%Carpenters Local 1305 4 2 282.0 51.6% 0 0.0% 2,070.0 0.0 0.0%Carpenters Local 218 55 15 2,330.5 27.8% 6 12.0% 44,876.0 5,142.0 11.5%Carpenters Local 26 2 1 118.0 66.7% 0 0.0% 1,327.0 0.0 0.0%Carpenters Local 275 3 0 0.0 0.0% 0 0.0% 3,311.5 0.0 0.0%Carpenters Local 33 36 8 1,285.5 22.8% 2 3.8% 27,643.5 1,284.5 4.6%Carpenters Local 40 3 0 0.0 0.0% 0 0.0% 2,961.0 0.0 0.0%Carpenters Local 424 2 0 0.0 0.0% 0 0.0% 726.5 0.0 0.0%Carpenters Local 475 3 0 0.0 0.0% 0 0.0% 2,176.0 0.0 0.0%Carpenters Local 535 2 0 0.0 0.0% 0 0.0% 281.5 0.0 0.0%Carpenters Local 624 15 4 414.0 30.2% 1 7.6% 6,505.0 392.0 6.0%Carpenters Local 67 11 5 589.0 37.2% 0 0.0% 8,941.0 0.0 0.0%Carpenters Local 94 1 0 0.0 0.0% 0 0.0% 40.0 0.0 0.0%Electricians Local 103 I.B.E.W. 67 14 1,209.0 20.9% 5 10.0% 36,268.0 2,553.5 7.0%Electricians Local 104 I.B.E.W 0 0 0.0 0.0% 0 0.0% 1,041.5 112.0 10.8%Elevator Constructors Local 4 12 2 13.0 5.2% 1 4.0% 2,483.0 30.0 1.2%Floorcoverers Local 2168 0 0 0.0 0.0% 0 0.0% 0.0 0.0 0.0%Iron Workers Local 7 174 39 4,382.0 25.8% 12 6.8% 103,919.8 6,168.5 5.9%Laborers Local 133 2 1 35.5 59.7% 0 0.0% 1,248.0 0.0 0.0%Laborers Local 138 4 2 212.0 92.4% 0 0.0% 1,245.5 0.0 0.0%Laborers Local 14 0 0 0.0 0.0% 0 0.0% 0.0 0.0 0.0%Laborers Local 1421 (Wreckers) 4 4 128.0 100.0% 0 0.0% 7,628.5 1,412.0 18.5%Laborers Local 146 0 0 0.0 0.0% 0 0.0% 0.0 0.0 0.0%Laborers Local 151 12 4 471.0 32.1% 0 0.0% 15,407.0 2,324.0 15.1%Laborers Local 175 13 7 1,384.0 68.6% 0 0.0% 9,057.0 0.0 0.0%Laborers Local 22 104 30 4,244.0 28.8% 17 13.1% 135,017.4 18,308.0 13.6%Laborers Local 223 13 3 409.0 20.1% 0 0.0% 14,566.0 0.0 0.0%Laborers Local 230 0 0 0.0 0.0% 0 0.0% 0.0 0.0 0.0%Laborers Local 243 2 0 0.0 0.0% 0 0.0% 3,147.0 0.0 0.0%Laborers Local 271 4 1 200.0 48.3% 0 0.0% 3,057.5 0.0 0.0%Laborers Local 385 3 2 220.5 50.6% 0 0.0% 3,097.5 0.0 0.0%Laborers Local 39 0 0 0.0 0.0% 0 0.0% 10.0 0.0 0.0%Laborers Local 401 14 1 123.0 8.6% 1 7.8% 3,374.5 112.0 3.3%Laborers Local 401E 2 0 0.0 0.0% 0 0.0% 136.0 0.0 0.0%Laborers Local 429 1 0 0.0 0.0% 0 0.0% 2,406.5 0.0 0.0%Laborers Local 455 0 0 0.0 0.0% 0 0.0% 0.0 0.0 0.0%Laborers Local 473 0 0 0.0 0.0% 0 0.0% 162.5 0.0 0.0%Laborers Local 547 0 0 0.0 0.0% 0 0.0% 0.0 0.0 0.0%Laborers Local 560 4 0 0.0 0.0% 0 0.0% 4,343.0 0.0 0.0%Laborers Local 596 0 0 0.0 0.0% 0 0.0% 0.0 0.0 0.0%Laborers Local 609 14 4 473.0 31.3% 0 0.0% 9,694.0 0.0 0.0%Laborers Local 610 4 0 0.0 0.0% 0 0.0% 4,331.0 0.0 0.0%Laborers Local 611 0 0 0.0 0.0% 0 0.0% 0.0 0.0 0.0%Laborers Local 665 0 0 0.0 0.0% 0 0.0% 0.0 0.0 0.0%Laborers Local 675 0 0 0.0 0.0% 0 0.0% 0.0 0.0 0.0%Laborers Local 721 4 1 9.5 3.1% 0 0.0% 2,794.5 0.0 0.0%Laborers Local 876 3 1 17.0 47.2% 0 0.0% 2,156.0 0.0 0.0%Laborers Local 88 (Tunnel Workers) 0 0 0.0 0.0% 0 0.0% 16,918.5 44.0 0.3%

Page 4 of 4
Total Hours
Hours # Workers Hours %Total #
Workers# Workers Hours % # Workers # Workers Hours %
JUNE 2017 PROJECT TO DATEMINORITY - Goal: 15.3% FEMALE - Goal: 6.9% VETERAN - Goal: 3.0%
LOCAL TRADE UNIONTotal #
Workers# Workers Hours % # Workers %
MINORITY - Goal: 15.3% FEMALE - Goal: 6.9% VETERAN - Goal: 3.0%Total Hours
Hours %
0.0 0.0 0 0.0 0.0% 0 0 0.0 0.0% 0 0 0.0 0.0%6,410.0 537.0 7 889.0 13.9% 286 44 26,072.0 15.9% 12 22 16,978.0 10.3%
58.0 0.0 0 0.0 0.0% 13 3 45.0 10.5% 0 0 0.0 0.0%1,175.5 0.0 0 0.0 0.0% 95 13 4,585.0 13.2% 8 9 4,633.5 13.3%
712.0 0.0 0 0.0 0.0% 14 3 325.0 18.2% 0 0 0.0 0.0%2,640.5 32.0 0 0.0 0.0% 88 10 1,091.5 9.4% 1 2 118.5 1.0%2,957.0 259.0 4 430.0 14.5% 53 21 3,894.0 47.6% 5 6 1,118.0 13.7%1,207.5 152.0 0 0.0 0.0% 26 8 484.0 37.1% 2 0 0.0 0.0%
766.0 112.0 0 0.0 0.0% 17 2 418.0 21.0% 1 0 0.0 0.0%0.0 0.0 0 0.0 0.0% 0 0 0.0 0.0% 0 0 0.0 0.0%
205.0 0.0 2 70.0 34.1% 9 1 161.0 19.0% 0 2 269.0 31.8%0.0 0.0 0 0.0 0.0% 2 0 0.0 0.0% 0 1 8.0 50.0%0.0 0.0 0 0.0 0.0% 0 0 0.0 0.0% 0 0 0.0 0.0%0.0 0.0 0 0.0 0.0% 1 0 0.0 0.0% 0 0 0.0 0.0%
88,047.8 6,312.5 47 5,205.5 5.9% 1,967 468 187,587.3 26.1% 123 96 49,242.0 6.9%
MinorityFemaleVeteran
Laborers Local 999 0 0 0.0 0.0% 0 0.0% 0.0 0.0 0.0%Operating Engineers Local 4 65 10 902.0 14.1% 4 8.4% 164,198.5 9,647.5 5.9%Painters & Allied Trades D.C. #35 3 1 8.0 13.8% 0 0.0% 427.0 0.0 0.0%Piledrivers Local 56 18 7 236.0 20.1% 0 0.0% 34,829.0 1,775.0 5.1%Pipe Fitters Local 537 12 3 152.0 21.3% 0 0.0% 1,785.0 0.0 0.0%Plasterers & Cement Masons Local 33 4 415.0 15.7% 1 1.2% 11,648.0 72.0 0.6%Plumbers & Gasfitters Local 12 30 16 1,564.0 52.9% 3 8.8% 8,177.0 843.0 10.3%Roofers & Slaters Local 33 20 8 484.0 40.1% 2 12.6% 1,303.5 152.0 11.7%Sheet Metal Workers Local 17 13 2 225.0 29.4% 1 14.6% 1,993.5 185.0 9.3%Shop and Mill Cabinet Local 51 0 0 0.0 0.0% 0 0.0% 0.0 0.0 0.0%Sprinkler Fitters Local 550 6 1 35.0 17.1% 0 0.0% 845.5 0.0 0.0%Teamsters Local 25 0 0 0.0 0.0% 0 0.0% 16.0 0.0 0.0%Union Number 0 0 0.0 0.0% 0 0.0% 0.0 0.0 0.0%Woodframe Local 723 0 0 0.0 0.0% 0 0.0%
718,290.2 50,664.5 7.1%
SUMMARY PERFORMANCE: PROJECT TO DATE
# Workers Hours Goal Project to Date
8.0 0.0 0.0%Total 823 210 23,704.5 26.9% 57 7.2%
96 49,242.0 3.0% 6.9%123 50,664.5 6.9% 7.1%468 187,587.3 15.3% 26.1%


