Page 1
ACCESS TO DRINKING WATER:
CASE OF TANKERFED VILLAGES IN THANE
DISTRICT, MAHARASHTRA
MTech Dissertation Stage I
M Tech in Technology and Development
By
Kirubaharan J
10335002
Under the guidance of
Prof. Milind Sohoni
Centre for Technology Alternatives for Rural Areas (CTARA)
Indian Institute of Technology Bombay, Powai 400076
November, 2011
Page 3
i
Certificate/ Dissertation Approval
This is to certify that the dissertation titled “Access To Drinking Water: Case Of
Tankerfed Villages in Thane District, Maharashtra” submitted in partial fulfilment of the
course TD 695 is an original effort carried out by Kirubaharan J (10335002).
Prof. Purushottam Kulkarni
(Examiner)
Prof. N.G.Shah
(Chair Person)
Prof. Milind Sohoni
(Project Guide)
Date:
Place: Mumbai
Page 4
ii
Declaration
I declare that this written submission represents my ideas in my own words and where
other„s ideas or words have been included, I have adequately cited and referenced the original
sources. I also declare that I have adhered to all principles of academic honestly and integrity
and have not misrepresented or fabricated or falsified any ideas, data, facts or sources in my
submission. I understand that any violation of the above will be cause of disciplinary action
by the institute and evoke penal action from the sources which have thus not been properly
cited or from whom proper permission has not been taken when needed.
Date:
Place:
Kirubaharan J
10335002
Page 5
ii
Acknowledgement
I am grateful to CEO of Thane district for his support and encouragement in carrying
out this project work in Thane district. I thank Mr. Lalit kumar and Mr .Ravi sagar for their
efforts in collection and digitising the secondary data. I am also grateful to Ms. Anuja Shukla,
for her efforts in compiling the final database and teaching me the data analysis tools. I also
thank Mr, Nachiket Sakhadeo and Ms. Pooja Prasad for their help in the field work.
I am also thankful to Mr.Phatak, Deputy Engineer-ZP, Shahapur , Mr Vikas Jadav,
Assistant Engineer ZP, Shahapur, Sarpanch of Dhakne, Dhamni, Vihigaon and Vashala gram
panchayats for providing valuable information during the field work. I also extend my thanks
to all the respondents who patiently answered our questions to gain valuable insight into the
problem.
I would like to express my since gratitude towards Prof. Milind Sohoni for his
valuable guidance and support, critical review of the report and above all the moral support
he provided to me at all stages of work. I am also grateful to Prof. Bakul Rao for her valuable
suggestions and insights which helped me to improve my project work.
I am also grateful to my family and friends for their great support and encouragement
throughout the project work.
Kirubaharan J
(10335002)
Page 6
iii
Abstract
Access to drinking water plays a key role in development as it not only improves the
human health but also frees their time for involvement in economic activities. The purpose of
the study is to understand the drinking water problems faced in rural India through a
representative sample study in Thane district, Maharashtra. The objective of the study is to
understand the causes of failures in achieving drinking water security for rural households.
The study is necessary to understand the causes of failures and underlying socio-economic
patterns for better planning in our efforts towards achieving the millennium development goal
of providing safe drinking water to all. The study initially focussed on analysing the
secondary data available and then field visits were carried out to validate the data and collect
primary data. From the observations of the field visit the framework for the analysis formed
and the factors which differentiate tankerfed villages and non tankerfed villages are
established. The existing provisions available within the government schemes for providing
safe drinking water were found out through literature review. The study revealed that the
factors like size of the population in a village, illiteracy rate, and marginal worker population
are higher in tankerfed villages than non tankerfed villages. Hence these factors could be the
causes of failure in achieving access to drinking water. The tankerfed scheme is also not a
viable alternative to follow as there is no storage structure in village for distributing the water
in summer months.
Page 7
iv
Table of Contents
Contents
Declaration ................................................................................................................. ii
Acknowledgement ...................................................................................................... ii
Abstract .....................................................................................................................iii
Table of Contents ....................................................................................................... iv
List of Figures ............................................................................................................ vi
List of Tables ............................................................................................................ vii
List of Graphs .......................................................................................................... viii
List of Appendices ..................................................................................................... ix
1 Introduction ............................................................................................................ 1
1.1 Objectives .................................................................................................... 3
1.2 Study Area ................................................................................................... 3
1.3 Description of the Dataset............................................................................. 4
1.3.1 Government of Maharashtra (GoM) ........................................................ 5
1.3.2 Department of Drinking Water Supply .................................................... 6
1.3.3 Census 2001 ........................................................................................... 7
1.4 Methodology .............................................................................................. 10
1.4.1 Data Collection ..................................................................................... 10
1.4.2 Data Analysis ....................................................................................... 10
1.5 Structure of the report ................................................................................. 12
2 Literature Review ................................................................................................. 13
2.1 Access to Drinking Water and Norms ......................................................... 13
2.2 National Rural Drinking Water Programme (NRDWP) .............................. 14
2.3 Habitat ....................................................................................................... 16
2.4 Bharat Nirman ............................................................................................ 16
Page 8
v
2.5 Multi Village systems (MVS) ..................................................................... 17
2.5.1 Social and Institutional issues ............................................................... 18
2.5.2 Infrastructure Issues .............................................................................. 19
2.5.3 Access to Water Services ...................................................................... 19
2.5.4 Financial Viability ................................................................................ 19
2.5.5 Environmental Issues ............................................................................ 20
2.5.6 Driving Factors for Community managed Multi-Village Project ........... 20
2.6 Community participation: Experience of Maharashtra ................................ 21
2.7 Tankerfed problem in Ahmedenagar: Case of Manhere watershed .............. 21
3 Data Analysis ....................................................................................................... 23
3.1 Elementary Analysis ................................................................................... 23
3.2 Textual Analysis ......................................................................................... 24
3.3 Census Analysis ......................................................................................... 26
3.3.1 Social Factors ....................................................................................... 26
3.3.2 Population size of the village ................................................................ 30
3.3.3 Impact of women population ................................................................ 31
3.3.4 Impact of marginal workers .................................................................. 32
3.3.5 Impact of Agricultural labour ................................................................ 33
4 Field Work ........................................................................................................... 35
4.1 Selection criteria ......................................................................................... 35
4.2 Findings and Observation ........................................................................... 35
5 Conclusion ........................................................................................................... 37
5.1 Conclusion ................................................................................................. 37
5.2 Future work ................................................................................................ 37
6 Bibliography......................................................................................................... 39
7 Appendix .............................................................................................................. 41
Page 9
vi
List of Figures
Figure 1:1: Thane Taluka Map ................................................................................... 4
Figure 1:2: Description of datasets ............................................................................. 5
Figure 1:3: Data analysis levels ............................................................................... 11
Figure 2:1: Multi Village System ............................................................................. 18
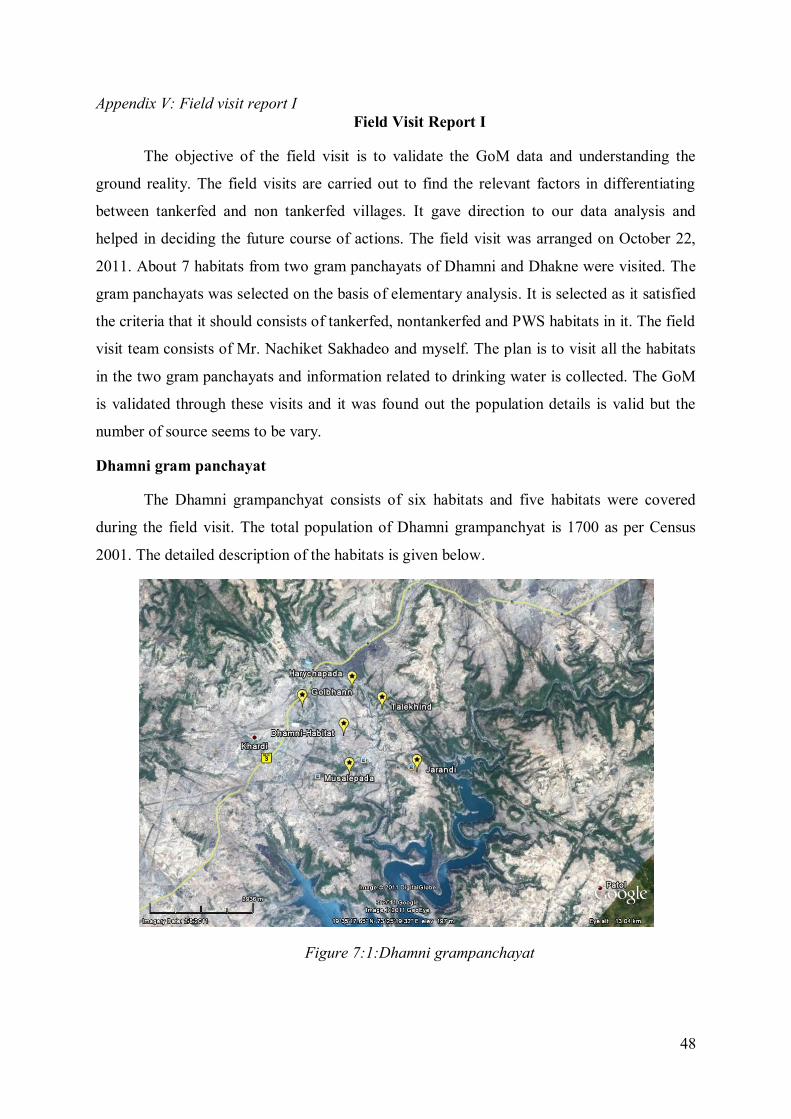
Figure 7:1:Dhamni grampanchayat .......................................................................... 48
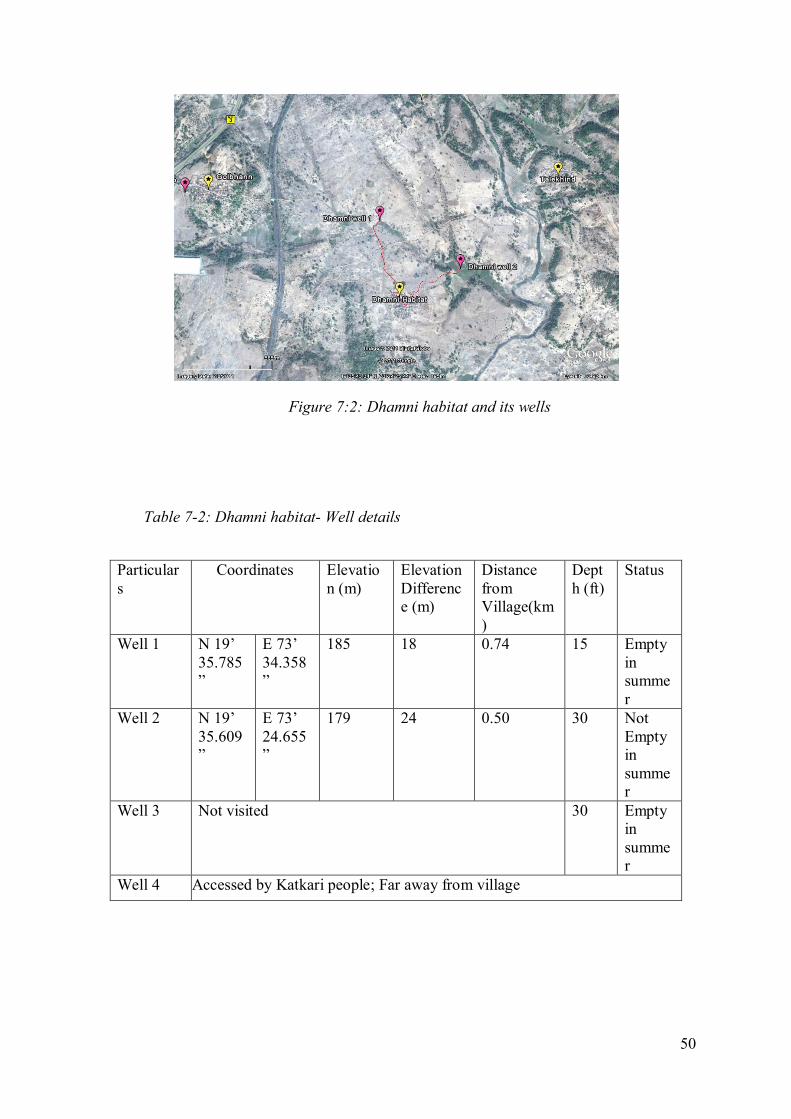
Figure 7:2: Dhamni habitat and its wells .................................................................. 50
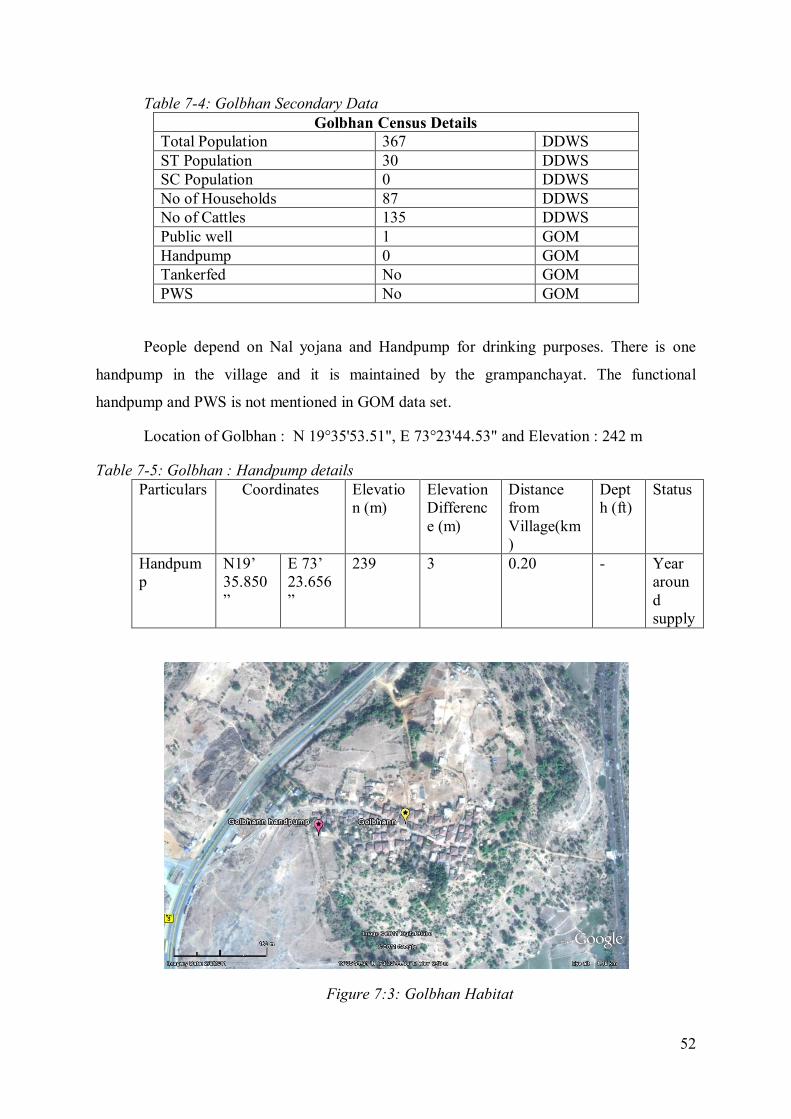
Figure 7:3: Golbhan Habitat .................................................................................... 52
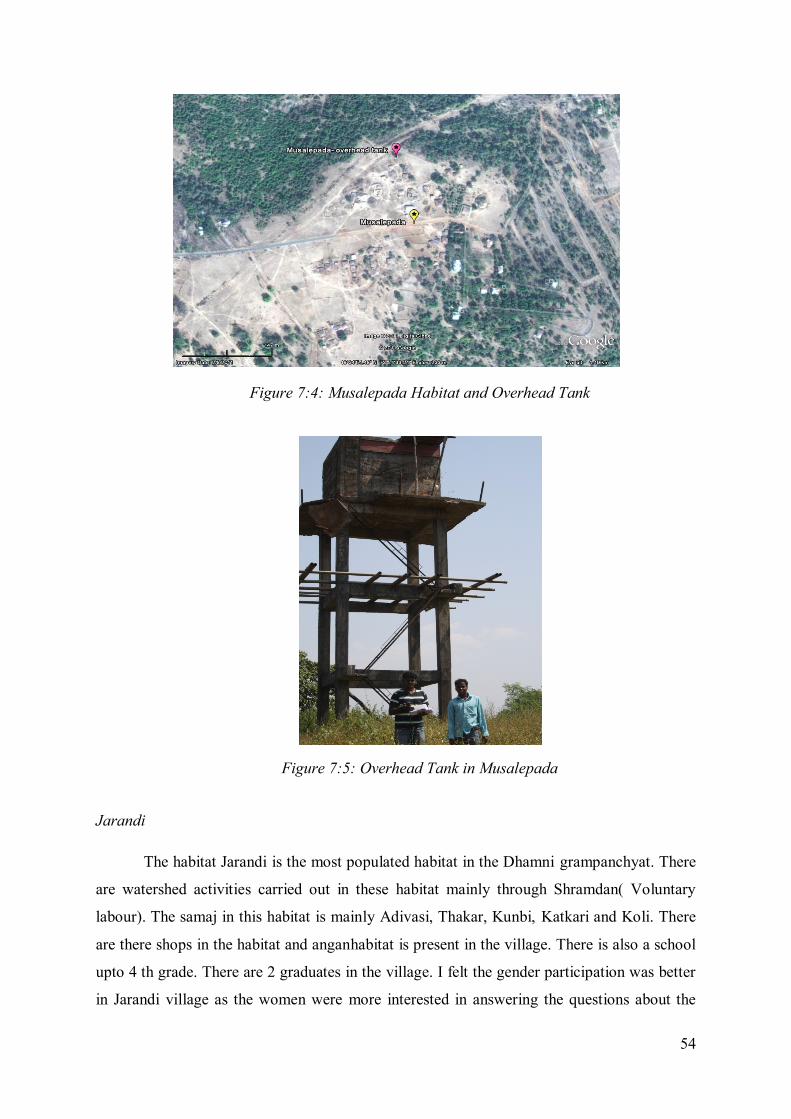
Figure 7:4: Musalepada Habitat and Overhead Tank ................................................ 54
Figure 7:5: Overhead Tank in Musalepada ............................................................... 54
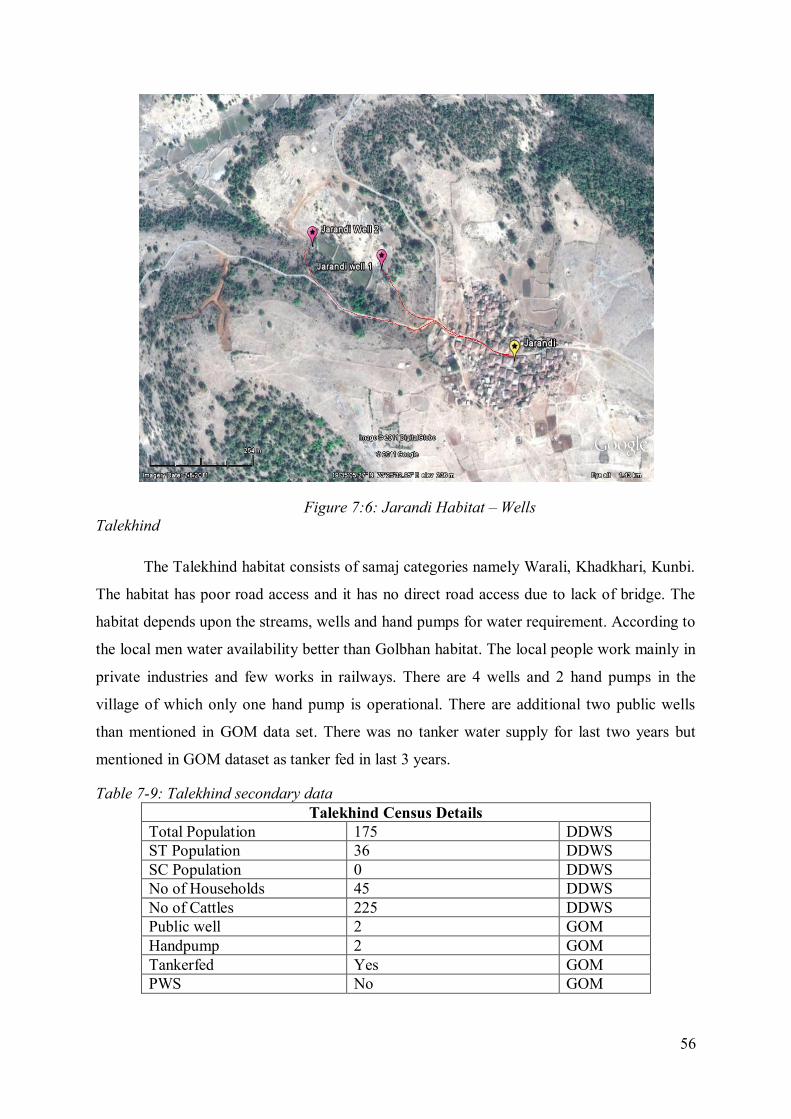
Figure 7:6: Jarandi Habitat – Wells .......................................................................... 56
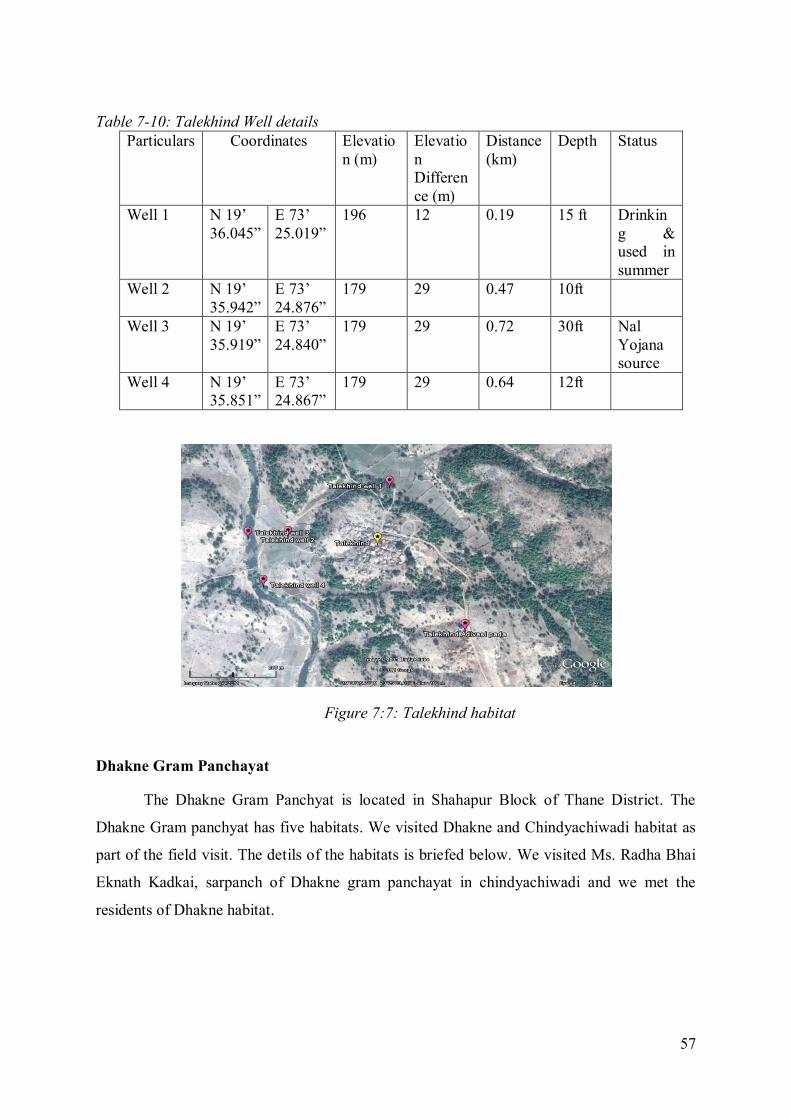
Figure 7:7: Talekhind habitat ................................................................................... 57
Figure 7:8: Dhakne gram panchayat ......................................................................... 58
Figure 7:9:Dhakne habitat wells .............................................................................. 59
Figure 7:10: Vihigaon Grampanchayat .................................................................... 61
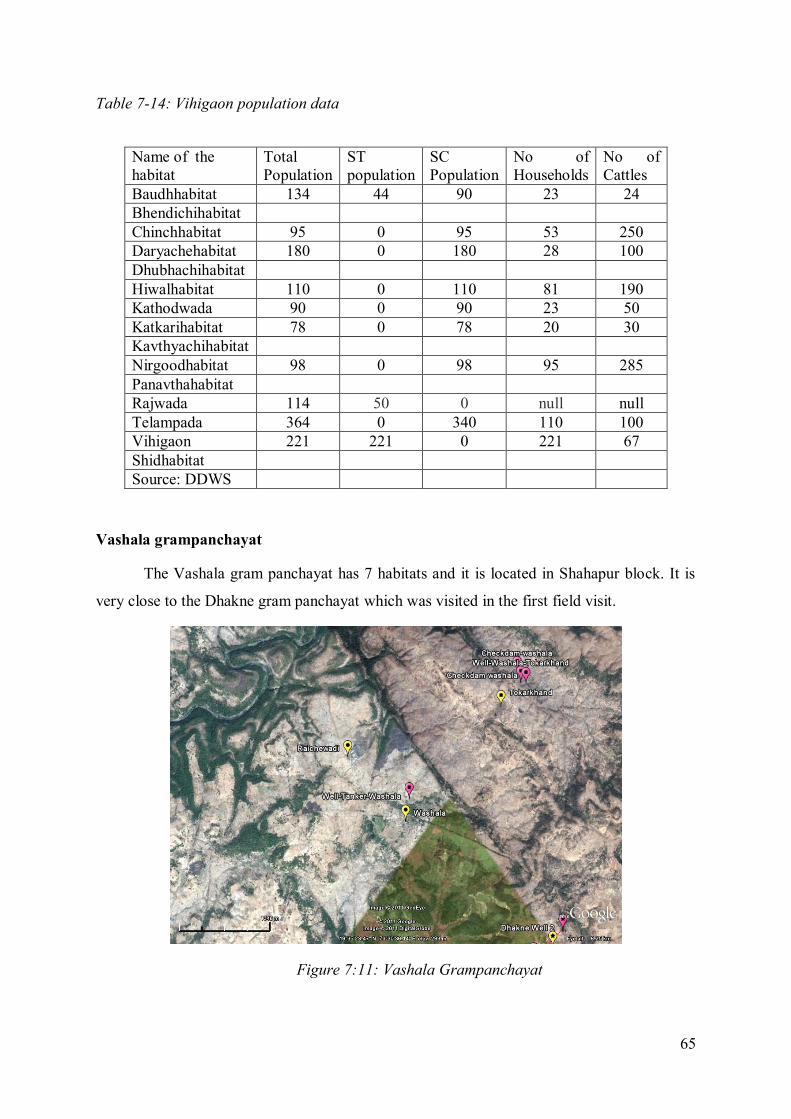
Figure 7:11: Vashala Grampanchayat ...................................................................... 65
Page 10
vii
List of Tables
Table 1-1: Access to Water services in 2002 .............................................................. 1
Table 1-2: Census Description ................................................................................... 8
Table 2-1: State Level Fund Allocation for NRDWP ............................................... 14
Table 3-1: Blockwise Tankerfed Habitat Distribution .............................................. 23
Table 3-2: Textual analysis findings ........................................................................ 25
Table 7-1:Dhamni grampanchayat Habitat Details ................................................... 49
Table 7-2: Dhamni habitat- Well details................................................................... 50
Table 7-3: Dhamni Secondary Data ......................................................................... 51
Table 7-4: Golbhan Secondary Data ........................................................................ 52
Table 7-5: Golbhan : Handpump details ................................................................... 52
Table 7-6: Musalepada Secondary Data ................................................................... 53
Table 7-7: Jarandi Secondary Data........................................................................... 55
Table 7-8: Jarandi Well Details ................................................................................ 55
Table 7-9: Talekhind secondary data........................................................................ 56
Table 7-10: Talekhind Well details .......................................................................... 57
Table 7-11: Dhakne habitat well details ................................................................... 59
Table 7-12: Dhakne gram panchayat details ............................................................. 59
Table 7-13: Vihigaon secondary data ....................................................................... 64
Table 7-14: Vihigaon population data ...................................................................... 65
Table 7-15: Vashala secondary data ......................................................................... 67
Table 7-16: Vasala population data ......................................................................... 67
Page 11
viii
List of Graphs
Graph 3-1: Female Illiteracy rate distribution ........................................................... 26
Graph 3-2: Male illiteracy rate distribution .............................................................. 27
Graph 3-3: ST population to total population ratio ................................................... 28
Graph 3-4: SC population to total population ratio ................................................... 29
Graph 3-5: Total population variation between tankerfed and nontankerfed villages 30
Graph 3-6: Women population to total population ratio ........................................... 31
Graph 3-7: Non workers female to total female ratio ................................................ 32
Graph 3-8: Marginal workers to total population ratio.............................................. 32
Graph 3-9: Agricultural to total population ratio ...................................................... 33
Page 12
ix
List of Appendices
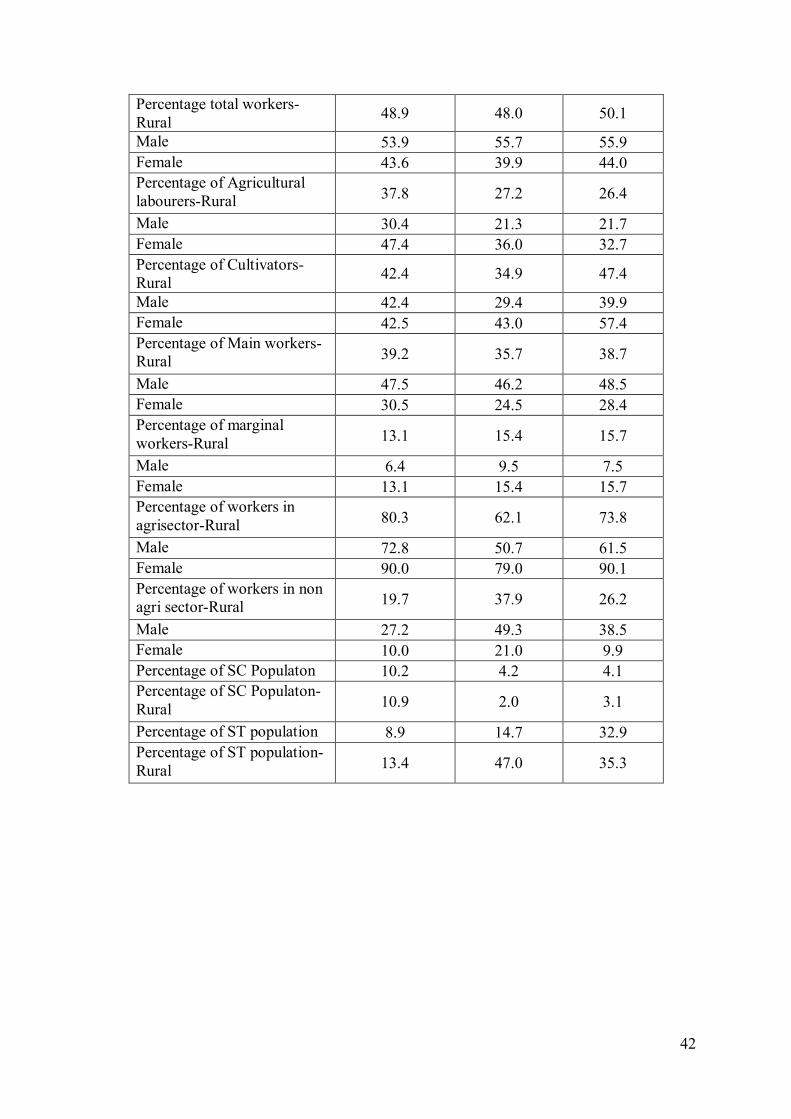
Appendix I: Demographic Parameters (2001) for State Maharashtra and Thane ....... 41
Appendix II: Village Level Findings ........................................................................ 43
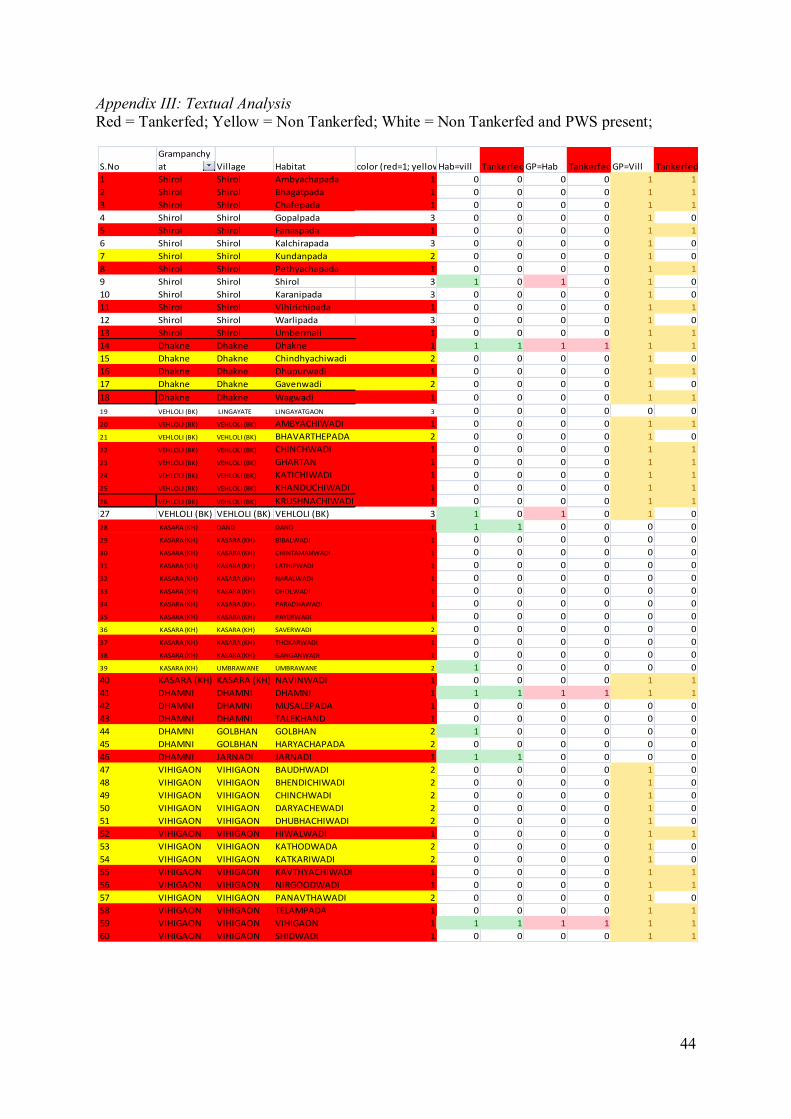
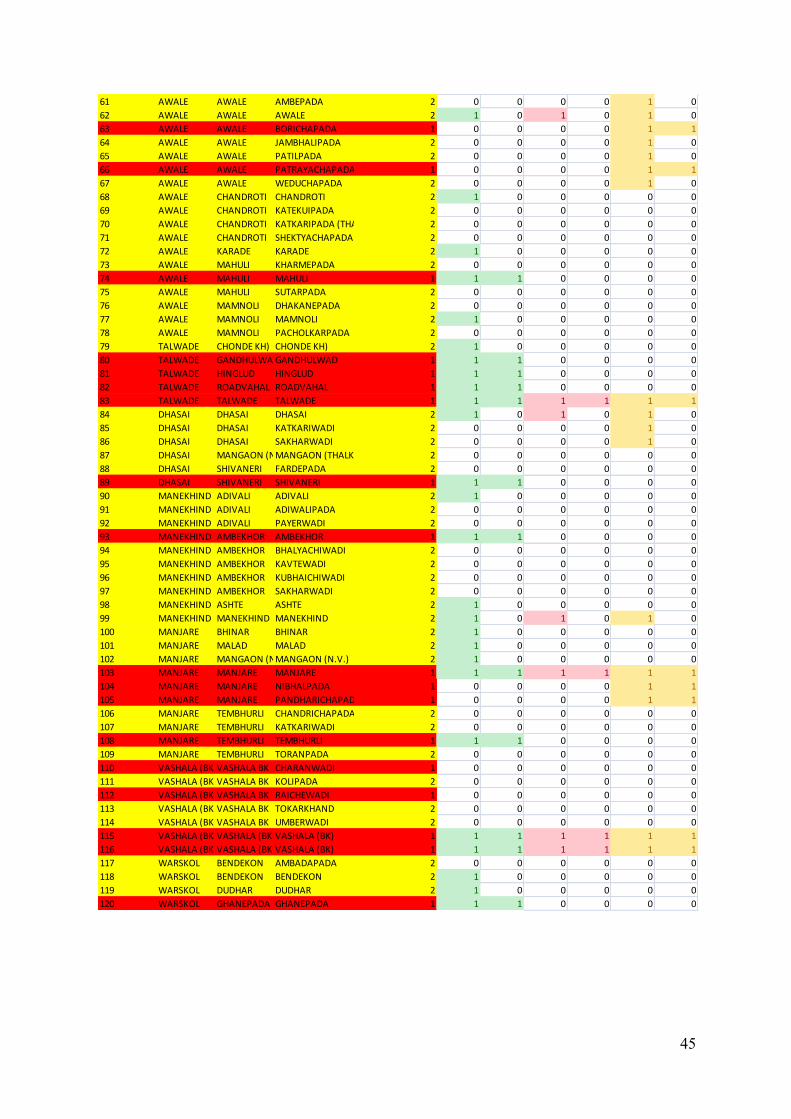
Appendix III: Textual Analysis ................................................................................ 44
Appendix IV: Contact Details .................................................................................. 47
Appendix V: Field visit report I ............................................................................... 48
Appendix VI: Field visit report II............................................................................. 61
Appendix VII: Semi structured questionnaire........................................................... 68
Page 14
1
1 Introduction
Water is the primary life-giving resource and its availability is an essential component
in socio-economic development and poverty reduction. The famous Tamil poet Thiruvalluvar
explains about the importance of water as:
“No life on earth can exist without water,
And the ceaseless flow of that water cannot exist without rain.”
Availability of potable water in rural areas is strongly interlinked with rural
development and growth and displays direct, positive results for human health and well
being, especially for women and children. As the burden of obtaining drinking water is
shouldered by young girls, easy availability results in better school attendance among girl
children. Women tend to benefit from the reduced drudgery and improved quality of life.
(Bapat, et al., 2007). The methods of delivering drinking water in rural India include dug
wells, handpumps, and pipe water schemes such as single village schemes, multi village
schemes sourced from ground water, surface water, near and far. The World Bank‟s estimate
of access to drinking water in 2002 is as given below:
Table 1-1: Access to Water services in 2002 Particulars Population (In lakhs) Percentage Share
Unserved Population (rural) 560 8
Hand Pump 3350 44.6
Open Dug wells 1290 17
Mini Water Schemes for group
of households 470 6
Single Village schemes 1650 22
Multi village schemes 180 2.4
Total Rural Population 7500 100
Source: (Bapat, et al., 2007)
As per the Department of Drinking Water Supply (DDWS), the drinking water
coverage in India is about 84.2 percent but only 12 % of the population has individual
household tap connections. The overall situation of India is better in drinking water coverage
when compared with the sanitation coverage. However, the quality of drinking water service
Page 15
2
is poor and most users counted as having access to water receive poor quality water and only
on an intermittent basis (Central Statistical Organisation, 2009).
As envisaged in the Eighth Five Year Plan (1992–97), that the government
enumerated the following principles:
(i) Water should be managed as a commodity.
(ii) The provision of rural water supply and sanitation (RWSS) services should be
based on expressed demand.
(iii) Emphasis should be placed on decentralization, user participation and private
sector involvement.
(iv) Operation and maintenance should be managed at the local level with
emphasis on financial sustainability.
(v) Sanitation programmes should be integrated with those of water supply.
The role of water in development is recognized by including it in the Millennium
Development Goals. The goal 7C of the Millennium Development Goals (MDGs) is to halve
the proportion of the people without sustainable access to safe drinking water and basic
sanitation by 2015. As per the report of Central statistical organization the MDG target by the
year 2015 for goal 7C has been achieved by the year 2007-08 and it also claims the rural
coverage improved from 61% in 1992-93 to 79.6% in 2007-08. (Central Statistical
Organisation, 2009).
The effect of a safer drinking water intervention is not only to reduce the water borne
diseases, but also to improve the access of drinking water in terms of time and energy utilised
in collection and treatment. In many locations, people have to travel considerable distances to
collect water for drinking and domestic water usage. Most interventions in rural areas could
serve both purposes. Time released for other activities through time savings in terms of
accessing and treating water has been found to be substantial (G. Hutton, 2006), (Z.S. Wang,
1989).
Provision of safer and more accessible water could also have an influence on school
enrolment and attendance especially for young girls. It is widely believed that greater
schooling of girl children leads to late marriage, greater birth spacing. The girls themselves
and the next generation of children will have lower mortality and morbidity rates and hence
savings in public sector provision of health care and welfare support (Thornton, 2003).
Page 16
3
The WHO study showed that investments in sanitation in drinking water would bring
returns up to 3-34 times the amount invested as economic benefits. These benefits are
calculated by considering
Health care savings by health agencies and individuals.
Productive days gained per year and increased school attendance.
Time savings resulting from better access to services.
Value of deaths averted (WHO/UN Water, 2010).
Hence investing resources both financial and academic could have positive impacts on the
society on multiple fronts and aid in overall development of the society.
1.1 Objectives
The objectives of this study are as follows:
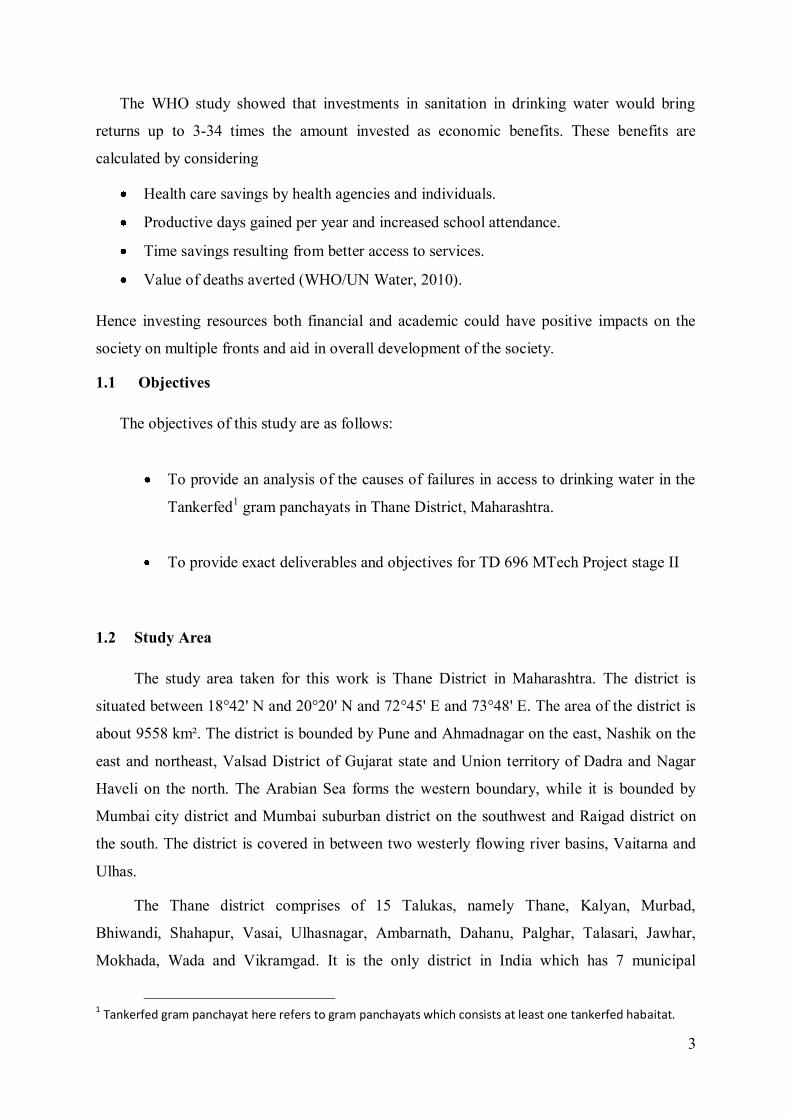
To provide an analysis of the causes of failures in access to drinking water in the
Tankerfed1 gram panchayats in Thane District, Maharashtra.
To provide exact deliverables and objectives for TD 696 MTech Project stage II
1.2 Study Area
The study area taken for this work is Thane District in Maharashtra. The district is
situated between 18°42' N and 20°20' N and 72°45' E and 73°48' E. The area of the district is
about 9558 km². The district is bounded by Pune and Ahmadnagar on the east, Nashik on the
east and northeast, Valsad District of Gujarat state and Union territory of Dadra and Nagar
Haveli on the north. The Arabian Sea forms the western boundary, while it is bounded by
Mumbai city district and Mumbai suburban district on the southwest and Raigad district on
the south. The district is covered in between two westerly flowing river basins, Vaitarna and
Ulhas.
The Thane district comprises of 15 Talukas, namely Thane, Kalyan, Murbad,
Bhiwandi, Shahapur, Vasai, Ulhasnagar, Ambarnath, Dahanu, Palghar, Talasari, Jawhar,
Mokhada, Wada and Vikramgad. It is the only district in India which has 7 municipal
1 Tankerfed gram panchayat here refers to gram panchayats which consists at least one tankerfed habaitat.
Page 17
4
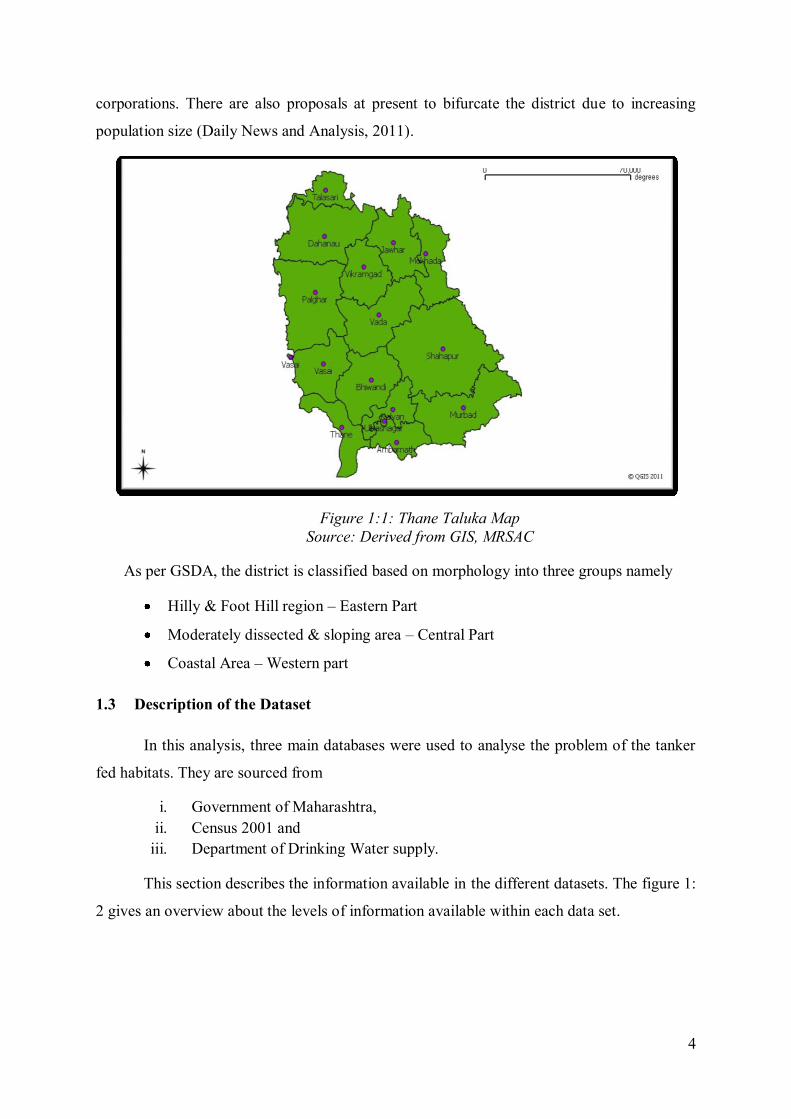
corporations. There are also proposals at present to bifurcate the district due to increasing
population size (Daily News and Analysis, 2011).
Figure 1:1: Thane Taluka Map
Source: Derived from GIS, MRSAC
As per GSDA, the district is classified based on morphology into three groups namely
Hilly & Foot Hill region – Eastern Part
Moderately dissected & sloping area – Central Part
Coastal Area – Western part
1.3 Description of the Dataset
In this analysis, three main databases were used to analyse the problem of the tanker
fed habitats. They are sourced from
i. Government of Maharashtra,
ii. Census 2001 and
iii. Department of Drinking Water supply.
This section describes the information available in the different datasets. The figure 1:
2 gives an overview about the levels of information available within each data set.
Page 18
5
Figure 1:2: Description of datasets
As we know, the hierarchy of the habitations is given by the sequence: habitat–
village-grampanchayat-block. However, most datasets do not follow the complete hierarchy.
1.3.1 Government of Maharashtra (GoM)
The Thane district administration handled us with two datasets: i) A hardcopy list
which contains the name of 163 tankerfed habitats. ii) The GoM dataset for Thane district
which consists of 96 datafields. Only 147 habitats from the list of 163 were found in the GoM
dataset. It is the primary means to identify the tankerfed habitats in the district.
It contains the following data fields: name of the block, name of the gram panchayat,
name of the habitat, total population, number of households, individual Public Water System
(PWS), functional PWS, regional PWS, supply, annual expenditure on operation and
maintenance of functional PWS, non functional PWS, energy arrear, habitat without PWS,
number of hand pumps and wells, mini water supply/pump, tankerfed status, Nirmal gram
status, and water quality test status etc. From this information, tankerfed status, number of
hand pumps and wells were used in the final database.
For functional schemes, the following information was given: number of individual
household connections, number of standposts, stages of pumping, number of days per month
of water supply, pump discharge and energy consumption, operation and expenditure details.
Page 19
6
For the non-functional schemes, the following information is given: Year since non-
functional, reasons for non-functionality. This information for functional and non- functional
are available at habitat and gram panchayat level.
This dataset did not have the name of the village for the habitat and only the name of
the gram panchayat was provided. Hence the automatic pairing2 with DDWS dataset was not
successful using typical database processing. Since it does not contain the village name, the
entries could not be paired with the census data. Therefore details about the number of hand
pump, well and tankerfed status are taken into account for the final database.
The lack of village name and the presence of large number of „no value data‟ entries
prompted our habitat analysis to use the habitat name particulars from DDWS dataset.
Another problem was that the name of the habitat did not match with the habitat name
available in the DDWS dataset. For example, in the case of Vashala village it is written as
Washala and Vashala at different datasets.
The revised guidelines from as of 2009, emphasises the need for using census names
for the villages and GPS location measurement of water sources. It also allocates 100%
funding for creation of GIS system for drinking water supply management. (Department of
Drinking Water Supply, 2010)
1.3.2 Department of Drinking Water Supply
The dataset is obtained from the publicly accessible Management Information
System3 (MIS) managed by the DDWS Ministry. It contains information about the
administrative structure of the village, like name of the revenue village, gram panchayat, total
population, ST population, SC population, number of cattle, number of households, Type of
source-(groundwater, surface water) and information about the schemes in individual habitat.
The information is available at habitat level and the population details are as of 01/04/09.
Two variants of this dataset were obtained and one was used for automatic pairing and
another dataset was created by requesting the data from the DDWS-MIS and manually
compiling it. The manually compiled data set was used for the analysis of the habitats. There
2 Automatic Pairing refers to combining the two datasets based on the common attributes like habitat name, gram panchayat name using the SQL programming language. 3 Management Information System can be accessed from
http://indiawater.gov.in/imisweb/reports/searchprofile/rep_searchprofile.aspx?rep=Y
Page 20
7
are few identical habitat names in the dataset, for example the entry “adivasipada” was found
in different gram panchyats.
The name of the habitat did not match with that available in the GoM dataset, hence
automatic pairing could not be done. The total population, ST population, SC population,
Type of source, Number of cattle at habitat level from this dataset was used for the final
analysis.
1.3.3 Census 2001
The census 2001 data was obtained from the Census Department. The census
information is summarized in the given table (Census, 2001). It consists of information like
total population, ST population, SC population, households, literates, illiterates, workers, non
workers, main workers, marginal workers, cultivator, agricultural labourer, household
industry worker and other workers. The information is available at the village level and also
based on gender (male and female).
The census data which was used in our analysis is called as Part-I dataset which
contains demographic information. There is also another dataset called Part-II, which is
available and contains information about household assets, drinking water source and
distance etc. Since the Part-II data is available only at block level, it was not used in the
analysis.
The census dataset follows the hierarchy: village-block. Hence the analysis is done for
the village level instead of the gram panchayat level. However these villages belong to
tankerfed gram panchayats. This allows differentiating between the tankerfed villages and
nontankerfed villages within tankerfed gram panchayats.
The name of the villages should be taken from census so that it is in standard format
in every database. This helps in inter-operability, comparison and analysis by combining
different database.
Page 21
8
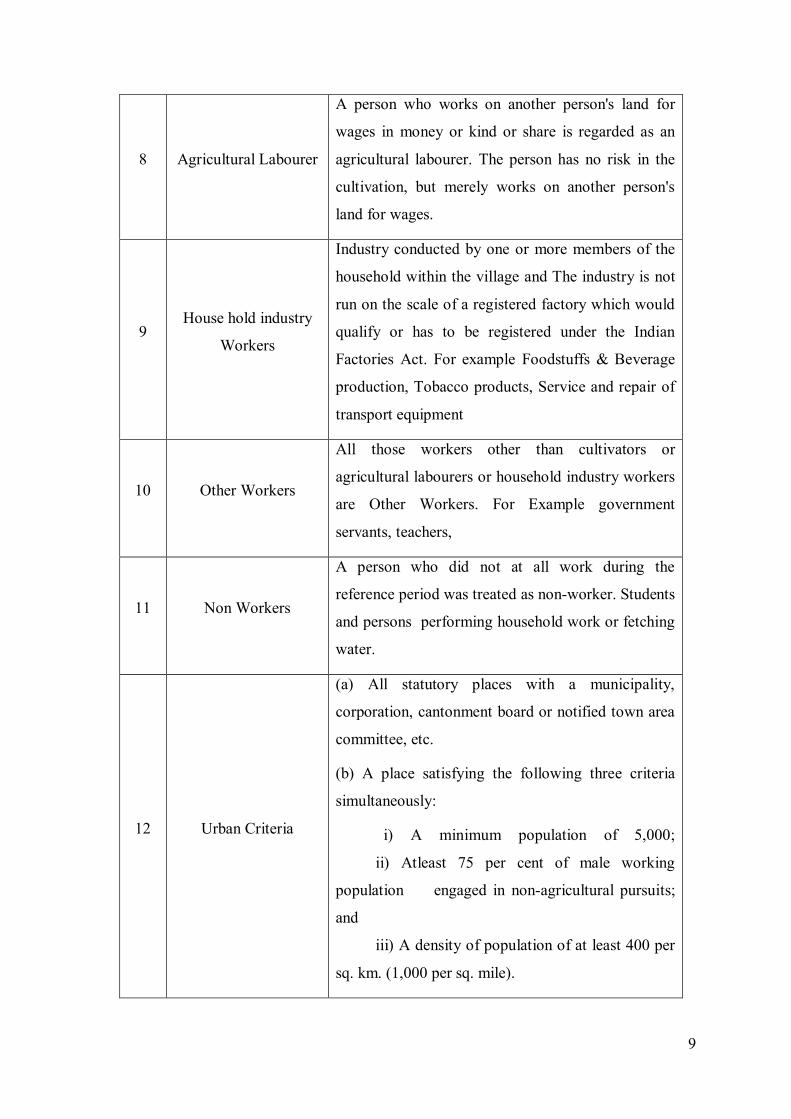
Table 1-2: Census Description
S.No Name of the data field Description
1 Household
A 'household' is usually a group of persons who
normally live together and take their meals from a
common kitchen unless the exigencies of work
prevent any of them from doing so
2 Literates
A person aged 7 years and above who can both read
and write with understanding in any language has
been taken as literate.
3 Workers
Participation in any economically productive activity
with or without compensation, wages. Includes
effective supervision and direction of work. All
persons engaged in 'work' as defined above are
workers.
4 Reference Period
Reference period for determining a person as worker
and non-worker is one year preceding the date of
enumeration.
5. Main workers The workers who had worked for the major part
4 of
the reference period are termed as Main Workers.
6 Marginal Workers
The workers who had not worked for the major part
of the reference period are termed as Marginal
Workers.
7 Cultivator
If the person is engaged in cultivation of land owned
or held from Government or held from private
persons or institutions for payment in money, kind
or share. Cultivation includes effective supervision
or direction in cultivation.
4 Major part of the reference period refers to 6 months of the year before enumeration.
Page 22
9
8 Agricultural Labourer
A person who works on another person's land for
wages in money or kind or share is regarded as an
agricultural labourer. The person has no risk in the
cultivation, but merely works on another person's
land for wages.
9 House hold industry
Workers
Industry conducted by one or more members of the
household within the village and The industry is not
run on the scale of a registered factory which would
qualify or has to be registered under the Indian
Factories Act. For example Foodstuffs & Beverage
production, Tobacco products, Service and repair of
transport equipment
10 Other Workers
All those workers other than cultivators or
agricultural labourers or household industry workers
are Other Workers. For Example government
servants, teachers,
11 Non Workers
A person who did not at all work during the
reference period was treated as non-worker. Students
and persons performing household work or fetching
water.
12 Urban Criteria
(a) All statutory places with a municipality,
corporation, cantonment board or notified town area
committee, etc.
(b) A place satisfying the following three criteria
simultaneously:
i) A minimum population of 5,000;
ii) Atleast 75 per cent of male working
population engaged in non-agricultural pursuits;
and
iii) A density of population of at least 400 per
sq. km. (1,000 per sq. mile).
Page 23
10
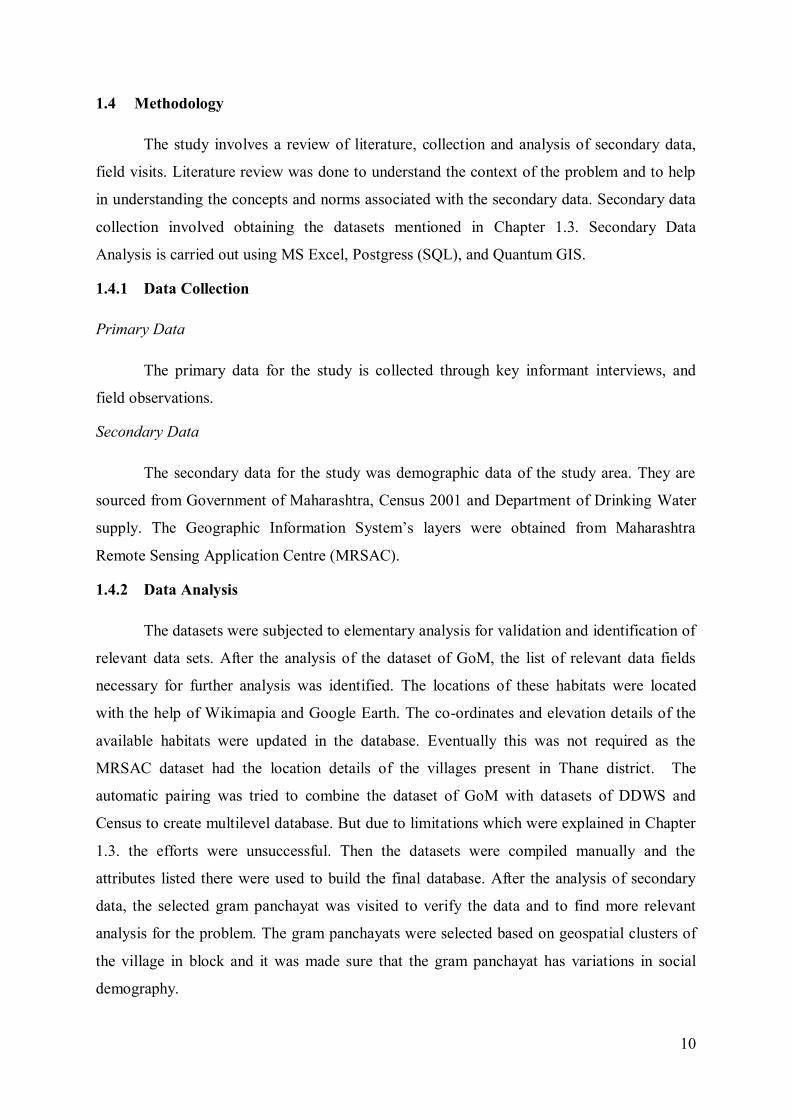
1.4 Methodology
The study involves a review of literature, collection and analysis of secondary data,
field visits. Literature review was done to understand the context of the problem and to help
in understanding the concepts and norms associated with the secondary data. Secondary data
collection involved obtaining the datasets mentioned in Chapter 1.3. Secondary Data
Analysis is carried out using MS Excel, Postgress (SQL), and Quantum GIS.
1.4.1 Data Collection
Primary Data
The primary data for the study is collected through key informant interviews, and
field observations.
Secondary Data
The secondary data for the study was demographic data of the study area. They are
sourced from Government of Maharashtra, Census 2001 and Department of Drinking Water
supply. The Geographic Information System‟s layers were obtained from Maharashtra
Remote Sensing Application Centre (MRSAC).
1.4.2 Data Analysis
The datasets were subjected to elementary analysis for validation and identification of
relevant data sets. After the analysis of the dataset of GoM, the list of relevant data fields
necessary for further analysis was identified. The locations of these habitats were located
with the help of Wikimapia and Google Earth. The co-ordinates and elevation details of the
available habitats were updated in the database. Eventually this was not required as the
MRSAC dataset had the location details of the villages present in Thane district. The
automatic pairing was tried to combine the dataset of GoM with datasets of DDWS and
Census to create multilevel database. But due to limitations which were explained in Chapter
1.3. the efforts were unsuccessful. Then the datasets were compiled manually and the
attributes listed there were used to build the final database. After the analysis of secondary
data, the selected gram panchayat was visited to verify the data and to find more relevant
analysis for the problem. The gram panchayats were selected based on geospatial clusters of
the village in block and it was made sure that the gram panchayat has variations in social
demography.
Page 24
11
For the final database, the entries were selected by the following process. Based on
the tankerfed habitats, the corresponding gram panchayats were identified and the rest of the
gram panchayats were termed as Non-tankerfed and left out of the analysis. From the
Tankerfed grampanchayats the list of tankerfed villages and nontankerfed villages was
identified. This list of villages was combined with the census data and used in village level
analysis. From the Tankerfed gram panchayat‟s list the habitat wise list for individual villages
(tankerfed and nontankerfed) was prepared. The habitat list was combined with the DDWS
and GoM datasets and used for the habitat analysis. The village level list was combined with
the Census data and village level database was prepared for the whole district as well as for
the individual blocks.
Figure 1:3: Data analysis levels
Habitat
Village
Gram panchayat
Block
District Thane
Taluk/Block
Tankerfed Gram
Panchayat
Tankerfed Village
Tankerfed Habitat
Non Tankerfed Habitat
Non Tankerfed Village
Non Tankerfed Gram
Panchayat
Page 25
12
1.5 Structure of the report
Chapter 2 is literature review and deals with the review of existing drinking water
schemes carried out by the state government and central government from the available
literature. It also consists of information about the different types of schemes like single
village and multi village scheme etc. Chapter 3 is data analysis and consists of information
about the findings of the secondary data analysis. It consists of information about the factors
which differentiate or link tankerfed and non tankerfed village/habitat. It consists of
information about the elementary data analysis finding and also findings of village level and
habitat level data analysis. It also describes the available GIS data and future data analysis.
Chapter 4 is case studies and consists of compilation of field visit observations. It also
describes the ground reality, gap between the available data and real time situations. Chapter
5 is conclusion and gives overview about the findings and provides deliverables for TD 696
MTP stage II. It also lays out the scope for the future work needs to be done for the solution
of the tankerfed problem.
Page 26
13
2 Literature Review
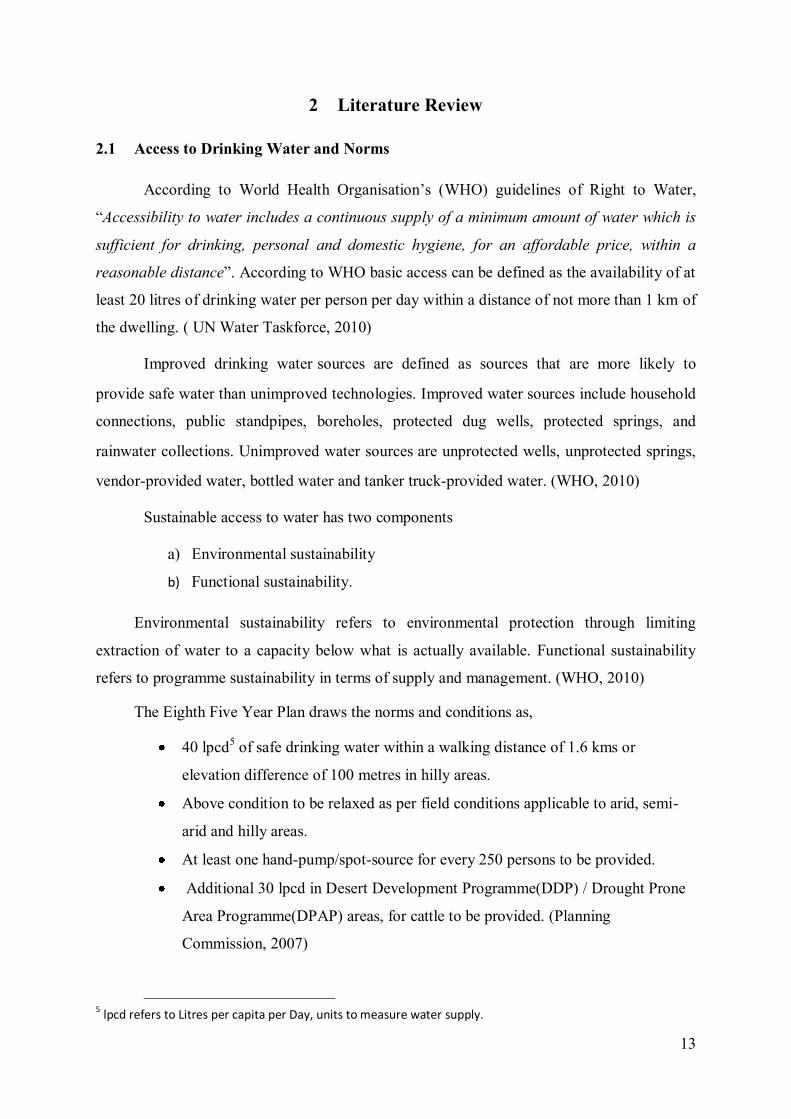
2.1 Access to Drinking Water and Norms
According to World Health Organisation‟s (WHO) guidelines of Right to Water,
“Accessibility to water includes a continuous supply of a minimum amount of water which is
sufficient for drinking, personal and domestic hygiene, for an affordable price, within a
reasonable distance”. According to WHO basic access can be defined as the availability of at
least 20 litres of drinking water per person per day within a distance of not more than 1 km of
the dwelling. ( UN Water Taskforce, 2010)
Improved drinking water sources are defined as sources that are more likely to
provide safe water than unimproved technologies. Improved water sources include household
connections, public standpipes, boreholes, protected dug wells, protected springs, and
rainwater collections. Unimproved water sources are unprotected wells, unprotected springs,
vendor-provided water, bottled water and tanker truck-provided water. (WHO, 2010)
Sustainable access to water has two components
a) Environmental sustainability
b) Functional sustainability.
Environmental sustainability refers to environmental protection through limiting
extraction of water to a capacity below what is actually available. Functional sustainability
refers to programme sustainability in terms of supply and management. (WHO, 2010)
The Eighth Five Year Plan draws the norms and conditions as,
40 lpcd5 of safe drinking water within a walking distance of 1.6 kms or
elevation difference of 100 metres in hilly areas.
Above condition to be relaxed as per field conditions applicable to arid, semi-
arid and hilly areas.
At least one hand-pump/spot-source for every 250 persons to be provided.
Additional 30 lpcd in Desert Development Programme(DDP) / Drought Prone
Area Programme(DPAP) areas, for cattle to be provided. (Planning
Commission, 2007)
5 lpcd refers to Litres per capita per Day, units to measure water supply.
Page 27
14
2.2 National Rural Drinking Water Programme (NRDWP)
Rural drinking water supply is a State subject as per the Constitution of India. To
accelerate the pace of coverage of problem villages with respect to provision of drinking
water, the Government of India introduced the Accelerated Rural Water Supply Programme
(ARWSP) in 1972–73, to aid financial and technical assistance to the state government in
implementing drinking water supply schemes in such villages. The Rural Drinking Water
Supply Guidelines have been revised in 2009 to address issues like sustainability and water
quality in drinking water schemes. The revised program is known as National Rural
Drinking Water Programme (NRDWP).
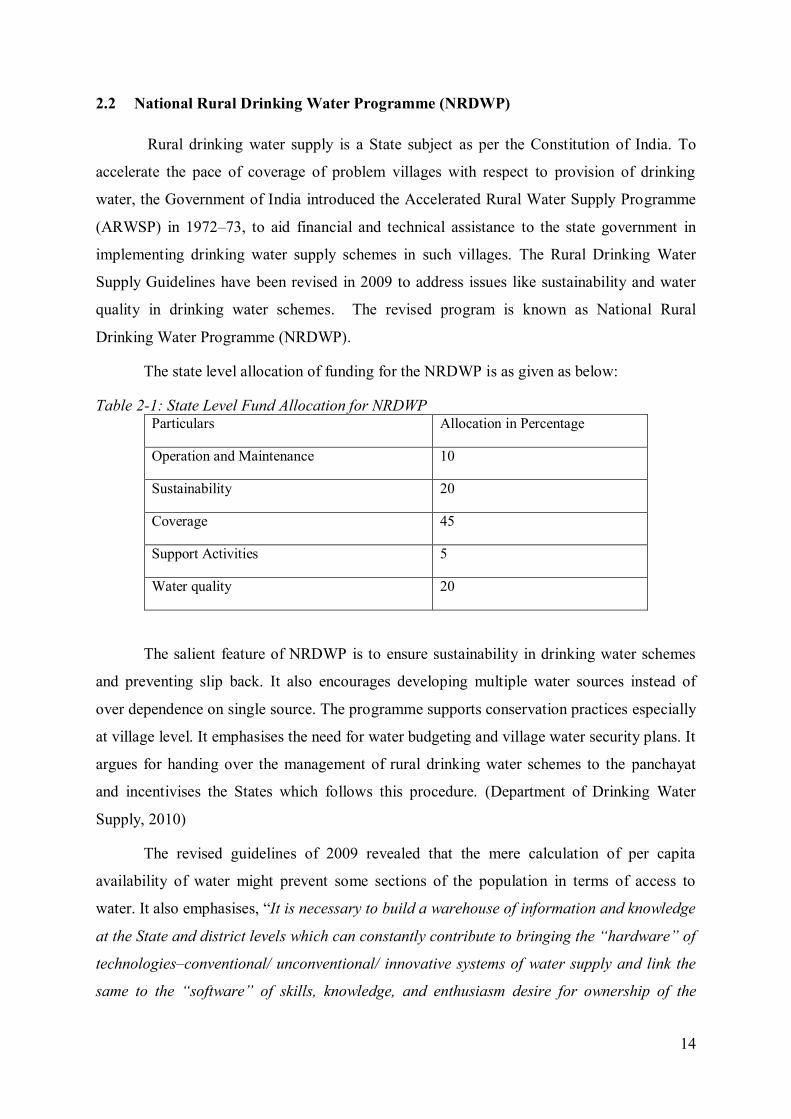
The state level allocation of funding for the NRDWP is as given as below:
Table 2-1: State Level Fund Allocation for NRDWP Particulars Allocation in Percentage
Operation and Maintenance 10
Sustainability 20
Coverage 45
Support Activities 5
Water quality 20
The salient feature of NRDWP is to ensure sustainability in drinking water schemes
and preventing slip back. It also encourages developing multiple water sources instead of
over dependence on single source. The programme supports conservation practices especially
at village level. It emphasises the need for water budgeting and village water security plans. It
argues for handing over the management of rural drinking water schemes to the panchayat
and incentivises the States which follows this procedure. (Department of Drinking Water
Supply, 2010)
The revised guidelines of 2009 revealed that the mere calculation of per capita
availability of water might prevent some sections of the population in terms of access to
water. It also emphasises, “It is necessary to build a warehouse of information and knowledge
at the State and district levels which can constantly contribute to bringing the “hardware” of
technologies–conventional/ unconventional/ innovative systems of water supply and link the
same to the “software” of skills, knowledge, and enthusiasm desire for ownership of the
Page 28
15
water supply projects by the communities and panchayati Raj Institutions themselves.”. This
stresses the need of academic institutions and researchers to work towards in safeguarding
water security in rural India and also creating sense of ownership for the sustained success of
development initiatives.
The norms of revised guidelines also clearly indicate the role of government as a
facilitator and its responsibility to bring NGO, civil society for capacity building of local
panchayats. It outlines the role of state for bringing water to the village and responsibility of
the Village Water and Sanitation Committee for local management of drinking water supply.
It also encourages data inputs for ensuring the equitable investments to all habitations and
sections of the society and priority should be given for habitations with no investments in the
past. It gives due importance for women in water management and advises involvement of
women association for community participation, (Department of Drinking Water Supply,
2009).
For building sustainability projects in drinking water supply, DDWS has issued a
manual on „Mobilising Technology for Sustainability‟. The funds to the states are allocated
from the Central government with increased weightage (60%) for rural population. If this
method of allocation is followed in state distribution to the districts and then districts like
Thane which has higher urban population of 72% as per the Census 2001, might get lesser
fund allocation. The twelfth finance commission has recommended grants to panchayats to
meet the operation and maintenance for ensuring drinking water supply. In addition to these
grants about 10% of the NRDWP fund allocated to the states should be used only for
operation and maintenance of the schemes. The guidelines also stated that 25% of the
NRDWP funds should be used for coverage in ST dominant habitations and 10% for SC
habitations. This could also be increased if the state has higher proportion of SC/ST
population.
The NRDWP also emphasized support activities for drinking water programme. It
allocates funds for states to achieve the long term goal of the drinking water sector. The
support activities cover information, education and communication, human resource
development, water quality monitoring and surveillance, setting up water testing laboratories
and involving state technical agency and national expert groups for preparation of projects,
technical scrutiny and evaluation of rural water supply schemes. This can be taken up under
the 5% support fund of NRDWP. It also supports satellite-data imagery; GIS mapping
systems, use of GPS system for unique identification of habitations and water sources and
Page 29
16
delivery points, support deploying the central online monitoring system. The states are
required to set up a Water and Sanitation Support Organization (WSSO) to take up these
support activities.
The programme gives highest priority to sustainability of drinking water sources and
systems to prevent slippages. The sustainability measures include water conservation and
rainwater harvesting lead to in-situ remediation of water quality. For this purpose 20% of the
NRDWP allocation is made available to the states on a 100% grant-in-aid basis.
The NRDWP tries to achieve drinking water security at household level and shifting
the paradigm of mere coverage of habitation. It is a clear shift from „supply-driven‟ approach
towards „demand-managed‟ approach as it also has mechanisms and incentives for
management at decentralised panchayat level.
2.3 Habitat
The rural habitation is often a unit of differentiation used to define a community based
on caste and creed and also by members who share common language and cultural
characteristics. Often, people from the socially backward classes living in a cluster were not
able to access water from the common water supply schemes located in the main village.
(Department of Drinking Water Supply, 2010). In the data analysis process habitat forms the
smallest unit of analysis. Because before 1996 census village was the lowest unit but it was
found out that the large numbers of satellite habitations were without adequate drinking water
facilities although the main village was shown fully covered.
2.4 Bharat Nirman
Bharat Nirman is a programme launched by the Government of India in 2005. Its
main purpose is to build rural infrastructure. It has two phases, Phase I is implemented from
2005-06 to 2008-09 while Phase II is being implemented from 2009-10 to 2011-12. There are
six components under Bharat Nirman namely water supply, housing, telecommunications and
information technology, roads, electrification, and irrigation. The water supply component is
briefed as below:
Page 30
17
The goal of Bharat Nirman water supply component is to provide safe source of
drinking water to every habitation. It focuses on uncovered habitations, slipped back
habitations due to source failure and/or water quality problem.
Responsible actors for meeting the goal are Ministry of Rural Development,
Department of Drinking Water Supply, and State Governments. The programme is centrally
sponsored scheme of Accelerated Rural Water Supply Programme. (Government of India,
2005) The norms for coverage in addition to usual 40 lpcd for human beings and 30 lpcd for
cattles are as follows
One hand pump or stand post for every 250 persons
The water source should exist within 1.6 km in the plains and within 100 metres
elevation in the hilly areas
The programme classifies the village for implementation into three categories as
1. Uncovered habitat,
2. Slipped- back habitat and
3. Habitat affected with a problem of water quality.
The factors responsible for slipped back were states as due to sources going dry or
lowering of the ground water table and sources becoming quality affected.
2.5 Multi Village systems (MVS)
The need for Multi village distribution systems arises when local sources are scarce
and not fit for drinking, hence the option available to bring water from an outside source. If
this source is far away then the economy of scale indicates that more than one village be
served by the system. In general MVS depend on surface water sources like rivers, reservoirs.
This presents a unique challenge for these types of schemes as the sources are usually far
away from the group of villages to be served .It also involves construction and operation of
complex installations such as head works, pumping stations, water treatment plants,
distribution network. A typical multi-village system is explained in the figure below.
Page 31
18
Figure 2:1: Multi Village System
Source: (World Bank, 2001)
As per the field report on South American countries prepared by the Water and
Sanitation Programme, World Bank, following issues have been identified. (World Bank,
2001)
2.5.1 Social and Institutional issues
Legal status
There is a need for proper legal framework to ensure sustainability of water user
associations.
Accountability to users
Effective communication and strong leadership are required in co-ordinating between
villages that don‟t have existing social ties and separated between long distances. The
employment of local staff is a way to improve the customer relations and accountability to
users. Understanding the local context enables the utility to utilize flexible payment schemes
that reduces disconnection and non payment of tariff.
Institutional models
For larger schemes a combination of national or regional agency for planning,
construction and delivery of bulk supplies and village water user association for local
distribution and day-to-day management. For smaller schemes, multi-village association is
needed.
Page 32
19
2.5.2 Infrastructure Issues
Technical Expertise
The high level of technical expertise required for planning and construction of larger
multi-village systems may necessitate the involvement of state or regional authorities.
Water losses
Multi-village systems are relatively large and complex. Production is not often known
and the risk of pipe breaks is high. Unaccounted for water6 may be due to illegal connections
in places where the pipelines stretch between villages. It is also difficult to detect cause of
problems in one part of the system which may lie away from the problem area.
2.5.3 Access to Water Services
In the systems covered in the field report, the tariff schedule is based on the family
income. In the case studies presented in the field report, it was observed that the poor
households could not afford connection fee and also the system did not provide any public
standposts. To overcome this obstacle the connection fee could be reduced through the
integration with the tariff schedule.
2.5.4 Financial Viability
Investment Financing
Financing for new infrastructure and rehabilitation due to large multi village systems
present a major investment barrier which is difficult to cross for local communities without
financial support. The investment cost per capita is higher than the single village schemes but
the quality of service delivery is much better.
Financial Autonomy and ability to finance expanding coverage
Even if the revenues were able to cover the operation and maintenance costs, proper
planning is needed for long term replacements or new investments to meet the growing
demand. The initial connection fees played an important role in achieving financial viability
in the cases observed by the field report of the World Bank.
Staff requirements per connection
6 Unaccounted for water refers to amount of water that has been produced and lost before it reaches the end
user.
Page 33
20
In case of multi village scheme the infrastructure serving many villages is usually
limited to one source, one treatment plant. Hence staff requirements per connection are less
when compared with a single village scheme.
Demand Management
In larger systems demand management could be achieved through metering and
appropriate tariff design.
2.5.5 Environmental Issues
Allocation of Water Resources
There is a need to adapt command area approach to the allocation and optimized use
of available water resources. State or regional agency is needed to identify the most suitable
water resources for a given area.
Source Protection
A single source serving many communities requires greater protection of the water
sources. Community management of sources and conservation measures could bring in better
protective measures and also sense of ownership among the community.
2.5.6 Driving Factors for Community managed Multi-Village Project
Multi Village systems usually come about through joint community initiatives
beginning with the search for a solution to the common problem of water scarcity. A multi
village scheme might come due to following reasons (World Bank, 2001):
Coverage
In areas with few water sources, multi village systems provide a wider coverage to
neighbouring villages.
Leadership
In order to initiate a water supply project, strong negotiating skills are required to
open dialogue with support agencies and to mobilize financial resources and community
participation. These leadership qualities are often lacking in small villages and it is better
when it comes to group of villages.
Page 34
21
Quality of service
The option of piped system is unlikely to be available to a small rural community but
may be possible when villages join together. In addition to this, community need to make
informed choices about the type of system and level of service that they will be able to
maintain. Professional services may be contracted by the multi village system when required.
2.6 Community participation: Experience of Maharashtra
The case of Water and Sanitation project undertaken in Jalgaon and Dhule district
throws light on how problems arise when roles assigned to intermediary agencies get
increased or expended and the agencies were not in a position to accept new roles
(Manikutty, 1998). In this case it was planned that officials of Zilla Parishads would carry
Community participation work like formation water committees. The training to the officials
was assigned to Tata Institute of Social Sciences (TISS). But the training process took much
longer time to complete so it was decided that the TISS would do Community Participation
activity in 10 % of the villages to be covered under the project. These model villages were
made for learning experience of the officials. But this plan also did not work out as TISS
team was handled the responsibility of doing the activity for all the villages. The TISS team
was understaffed and it resulted in delays in formation of water committees and site selection.
The outcome of the project was that water was not delivered to the village even five years
after the implementation even though other aspects of the project were better when compared
with the other water and sanitation projects analysed in the report.
2.7 Tankerfed problem in Ahmedenagar: Case of Manhere watershed
The tankerfed problem is not confined to Thane district alone and it was found in
other districts of Maharashtra too. This case study presents a similar situation and the
measures taken for increasing access to drinking water.
A project on Integrated Watershed Development Project took place in Manhere area,
Akole taluka of Ahmednagar district, Maharashtra. It was implemented during 1993 to 1999
in the villages Manhere, Ambevangan, Titvi and Kodani. The project was supported under
Indo-German Watershed Development Programme (IGWDP), which emphasized mainly on
soil conservation through mechanical and vegetative measures.
Page 35
22
In all the main villages, community dug wells were the main supply source, which
invariably uses to dry up for 2- 3 months in summer. The habitats have been dependant on
the spring water or the irrigation dug wells, which are located normally in the deep valleys.
(H.Kulkarni,2000)
During summer the Zilla Parishad tankers used to supply water to main villages in a
limited quantity. However the habitats had no option other than to collect the water by
wandering during the nights which added to the drudgery of women and also losing the
crucial wage earning days. The villagers had to walk for distance more than 5 to 10 kms to
fetch drinking water in summer. Although the watershed project had no provision for
drinking water supply the conservation measures helped augment the springs and dug wells,
which particularly solved the problem of the habitats. The period of scarcity was reduced in
the main villages. It was evident from that the tanker supply period being reduced from 2-3
months to 15-20 days in a year. The surface water storage structures such as check dams, roof
water harvesting tanks and spring development from the non-project sources improved the
access for the people. The habitats now have yearly water availability through the perennial
springs. In the year 1999-2000 the piped water supply scheme has been provided by the
Government in Manhere village and is under progress in Ambevangan and Titvi.
Page 36
23
3 Data Analysis
3.1 Elementary Analysis
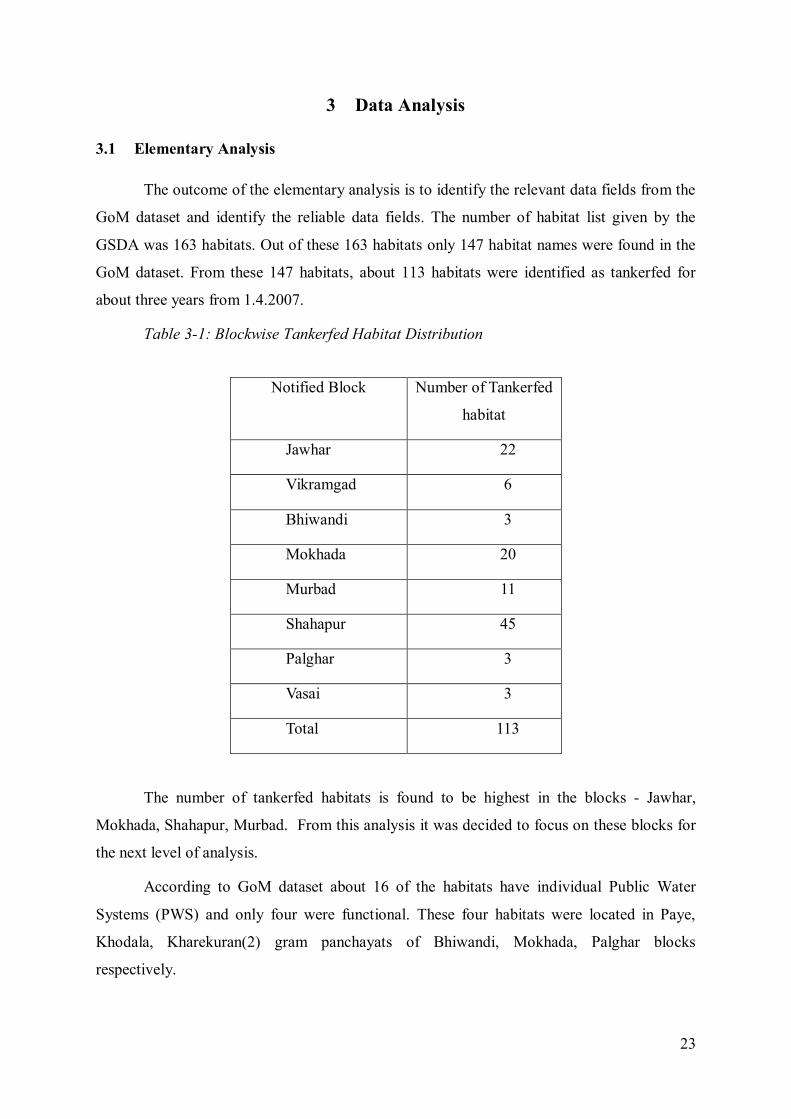
The outcome of the elementary analysis is to identify the relevant data fields from the
GoM dataset and identify the reliable data fields. The number of habitat list given by the
GSDA was 163 habitats. Out of these 163 habitats only 147 habitat names were found in the
GoM dataset. From these 147 habitats, about 113 habitats were identified as tankerfed for
about three years from 1.4.2007.
Table 3-1: Blockwise Tankerfed Habitat Distribution
Notified Block Number of Tankerfed
habitat
Jawhar 22
Vikramgad 6
Bhiwandi 3
Mokhada 20
Murbad 11
Shahapur 45
Palghar 3
Vasai 3
Total 113
The number of tankerfed habitats is found to be highest in the blocks - Jawhar,
Mokhada, Shahapur, Murbad. From this analysis it was decided to focus on these blocks for
the next level of analysis.
According to GoM dataset about 16 of the habitats have individual Public Water
Systems (PWS) and only four were functional. These four habitats were located in Paye,
Khodala, Kharekuran(2) gram panchayats of Bhiwandi, Mokhada, Palghar blocks
respectively.
Page 37
24
The lack of village name and the presence of large number of „no value data‟ entries
prompted our habitat analysis to use the habitat name particulars from DDWS dataset. The
name of the habitat did not match up with the habitat name available in the DDWS dataset.
For example the case of Vashala village is written as Washala and Vashala in different
datasets. It was observed from the field visits that the number of source seems to have
changed because of government schemes. So the number of sources was included in the final
database but the analysis on the source as of now was not done.
The other data fields and description is already explained in the Section 1.3.1. From
this information data fields like tankerfed status, number of hand pumps and wells were
entered in the final database manually.
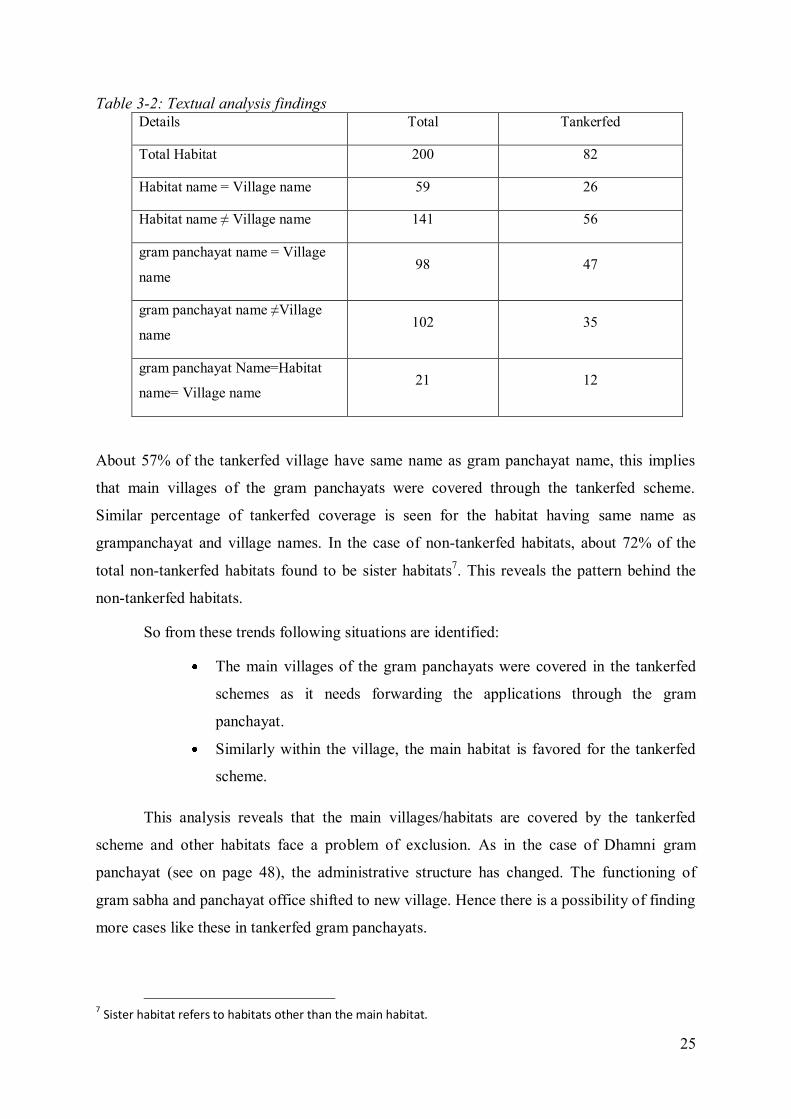
3.2 Textual Analysis
The main aim of this textual analysis is to check whether the main village is only
covered by tankers and the other habitats are left out of the process. This analysis is done by
checking whether the name of the habitat is same as village or gram panchayat. The habitats
were given colour codes like red for tankerfed, yellow for non tankerfed and white for PWS.
The colour codes were then given numbers like one for red, two for yellow, and three for
PWS. The names of the habitats were corrected to match with the similar names of
village/gram panchayat. For example habitat name Washala was changed to village and gram
panchayat name Vashala. Then using the logical formulas like IF, AND, TRUE, FALSE the
textual analysis was performed. The dataset used in the textual analysis is given in the
appendix.
The 147 habitat list was expanded to gram panchayat level to include all the habitats
of tankerfed gram panchayats. There are 200 habitats in this extended list and out of these
200 habitats, 82 habitats are tankerfed. This analysis covers four blocks namely Jawhar,
Mokhada, Murbad, and Shahapur. Further textual analysis of the 200 habitat reveals
following trends as shown in below table 3.2
Page 38
25
Table 3-2: Textual analysis findings Details Total Tankerfed
Total Habitat 200 82
Habitat name = Village name 59 26
Habitat name ≠ Village name 141 56
gram panchayat name = Village
name 98 47
gram panchayat name ≠Village
name 102 35
gram panchayat Name=Habitat
name= Village name 21 12
About 57% of the tankerfed village have same name as gram panchayat name, this implies
that main villages of the gram panchayats were covered through the tankerfed scheme.
Similar percentage of tankerfed coverage is seen for the habitat having same name as
grampanchayat and village names. In the case of non-tankerfed habitats, about 72% of the
total non-tankerfed habitats found to be sister habitats7. This reveals the pattern behind the
non-tankerfed habitats.
So from these trends following situations are identified:
The main villages of the gram panchayats were covered in the tankerfed
schemes as it needs forwarding the applications through the gram
panchayat.
Similarly within the village, the main habitat is favored for the tankerfed
scheme.
This analysis reveals that the main villages/habitats are covered by the tankerfed
scheme and other habitats face a problem of exclusion. As in the case of Dhamni gram
panchayat (see on page 48), the administrative structure has changed. The functioning of
gram sabha and panchayat office shifted to new village. Hence there is a possibility of finding
more cases like these in tankerfed gram panchayats.
7 Sister habitat refers to habitats other than the main habitat.
Page 39
26
3.3 Census Analysis
In this analysis census 2001 dataset (see on page 7) is analysed and the variation
between the tankerfed and nontankerfed village interms of social attributes is briefed in this
section. In this, the parameters are also compared with the block level to get an idea about the
normal situation prevailing in the block. All the parameters belong to rural category as
defined in the census.
3.3.1 Social Factors
The social factors which were taken into consideration are female illiteracy rate, male
illiteracy rate, ST population to total population ratio, SC population to total population ratio.
The block ratio values are calculated from the block level census data 2001 available at block
level.
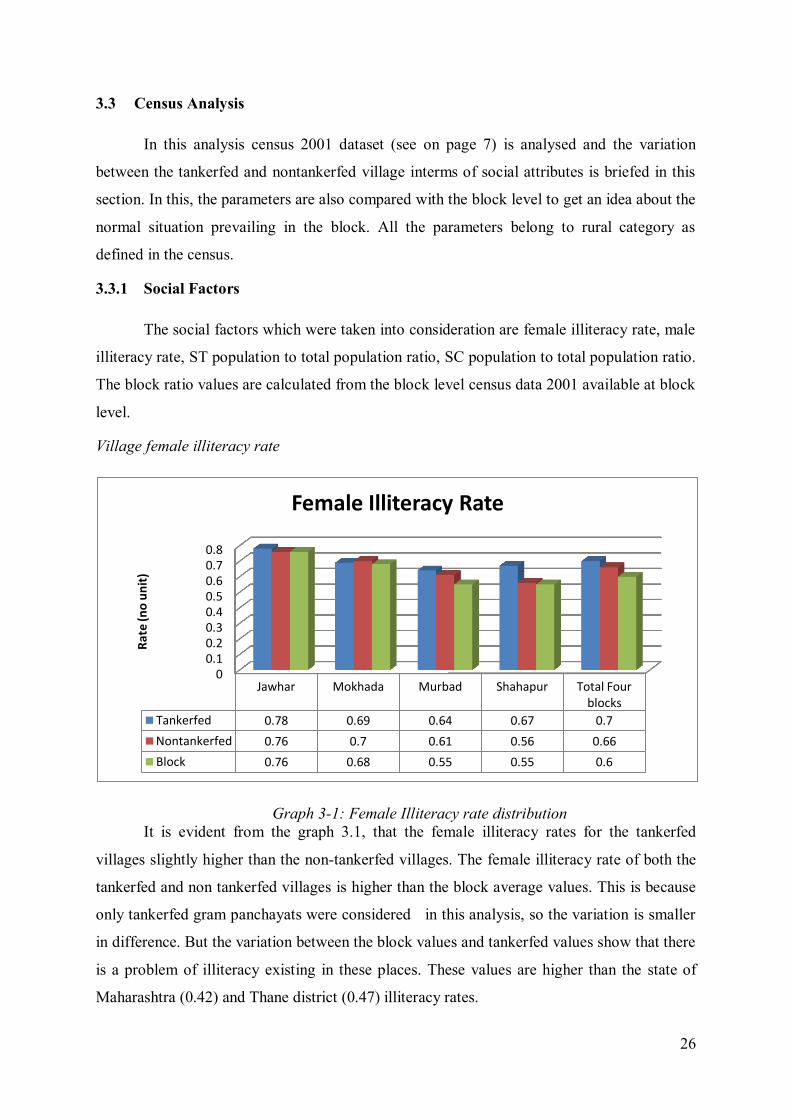
Village female illiteracy rate
Graph 3-1: Female Illiteracy rate distribution
It is evident from the graph 3.1, that the female illiteracy rates for the tankerfed
villages slightly higher than the non-tankerfed villages. The female illiteracy rate of both the
tankerfed and non tankerfed villages is higher than the block average values. This is because
only tankerfed gram panchayats were considered in this analysis, so the variation is smaller
in difference. But the variation between the block values and tankerfed values show that there
is a problem of illiteracy existing in these places. These values are higher than the state of
Maharashtra (0.42) and Thane district (0.47) illiteracy rates.
0 0.1 0.2 0.3 0.4 0.5 0.6 0.7 0.8
Jawhar Mokhada Murbad Shahapur Total Four blocks
Tankerfed 0.78 0.69 0.64 0.67 0.7
Nontankerfed 0.76 0.7 0.61 0.56 0.66
Block 0.76 0.68 0.55 0.55 0.6
Rat
e (n
o u
nit
)
Female Illiteracy Rate
Page 40
27
Ths study conducted in Gujarat revealed the correlation between the water scarcity
and higher literacy rates. Higher literacy levels and educational attainments improve the
access of people to other social services (Rajiv.K.Gupta, 2003). This problem of illiteracy
might be a cause or effect of lack of drinking water access in our study region. Lack of access
to safe drinking water which results in time lost in collecting water, effects of head loading
on women‟s and girl children‟s health and burden of household responsibilities have
detrimental effect on their health, general family welfare and income earning capabilities.
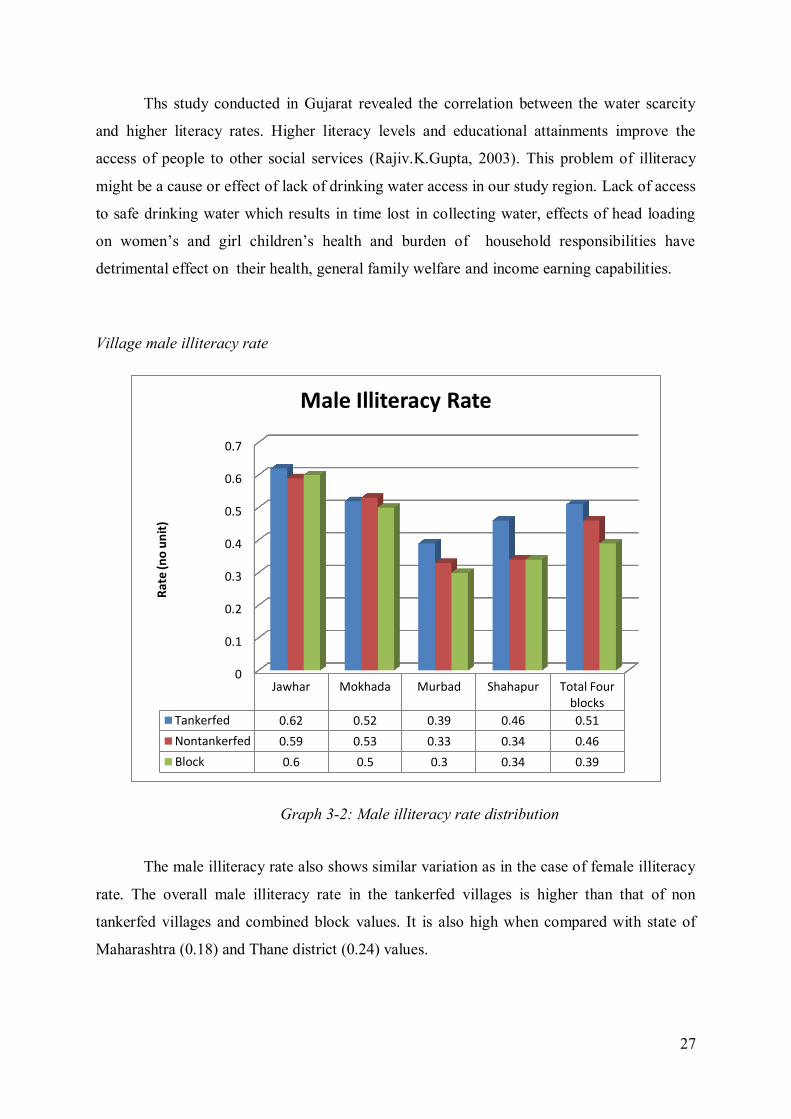
Village male illiteracy rate
Graph 3-2: Male illiteracy rate distribution
The male illiteracy rate also shows similar variation as in the case of female illiteracy
rate. The overall male illiteracy rate in the tankerfed villages is higher than that of non
tankerfed villages and combined block values. It is also high when compared with state of
Maharashtra (0.18) and Thane district (0.24) values.
0
0.1
0.2
0.3
0.4
0.5
0.6
0.7
Jawhar Mokhada Murbad Shahapur Total Four blocks
Tankerfed 0.62 0.52 0.39 0.46 0.51
Nontankerfed 0.59 0.53 0.33 0.34 0.46
Block 0.6 0.5 0.3 0.34 0.39
Rat
e (n
o u
nit
)
Male Illiteracy Rate
Page 41
28
ST population to total population ratio
The ST population to total population ratio is calculated to check whether there is
social exclusion is happening in the tankerfed villages or non tankerfed villages from the
administration.
Graph 3-3: ST population to total population ratio
In case of blocks like Jawhar (0.97), Mokhada(0.91) which have high rural tribal
population, the variation between tankerfed and non tankerfed villages is not showing much
variation. But in the case of blocks Shahapur and Murbad the villages which have tribal
population is covered by tankerfed schemes. The total rural ST population ratio at state level
is 0.13 and district level is 0.47.
For better understanding we have to see the Jawhar and Mokhada blocks as separate
as they are tribal blocks. In Jawhar and Mokhada the non tankerfed villages have higher ST
population to the tankerfed villages and there is slight deviation from the average block
values (0.97&0.91). But in the case of Murbad and Shahpur, both the tankerfed and non
tankerfed values show higher than block average values. This shows that affected gram
panchayats has higher ST population. The tankerfed villages show higher ST population
when compared with the non tankerfed villages of the same block. This shows that mainly
villages having higher ST population are left out of the drinking water schemes and made to
depend on the tankers for drinking water requirement in summer months.
0 0.1 0.2 0.3 0.4 0.5 0.6 0.7 0.8 0.9
1
Jawhar Mokhada Murbad Shahapur Total Four blocks
Tankerfed 0.97 0.93 0.74 0.62 0.78
Nontankerfed 0.99 0.97 0.32 0.42 0.72
Block 0.97 0.91 0.24 0.35 0.5
Rat
io (n
o u
nit
)
ST population to total population
Page 42
29
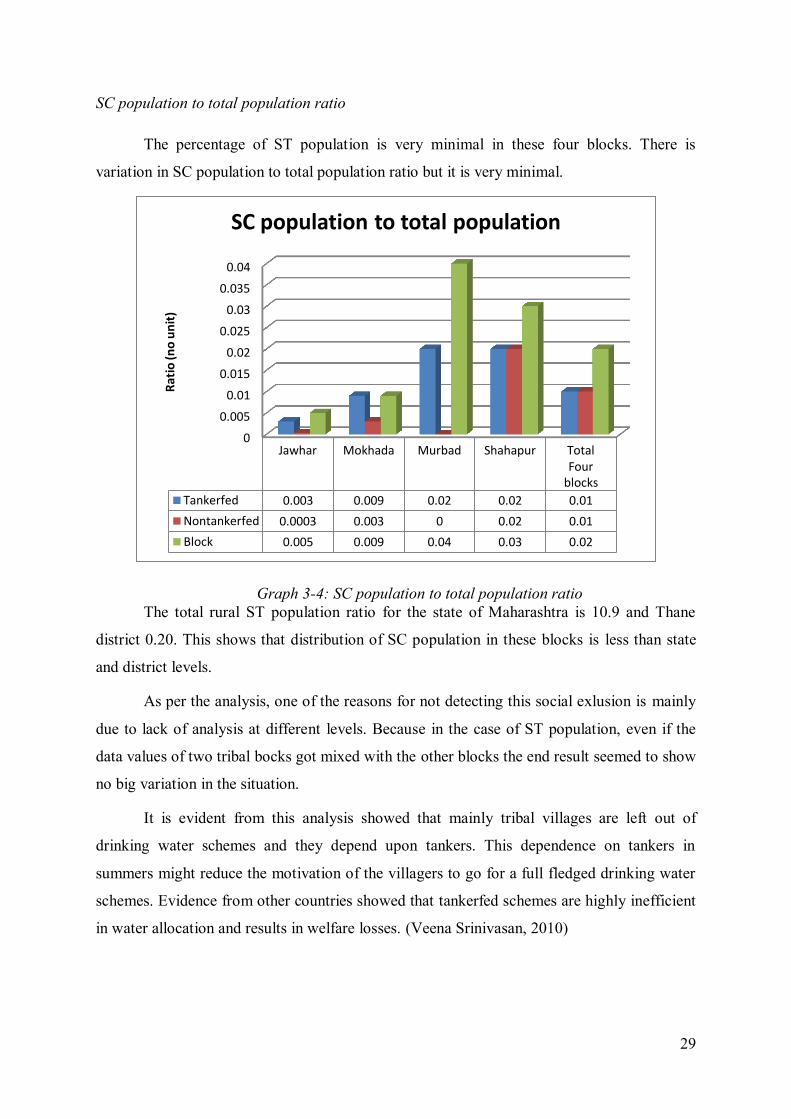
SC population to total population ratio
The percentage of ST population is very minimal in these four blocks. There is
variation in SC population to total population ratio but it is very minimal.
Graph 3-4: SC population to total population ratio
The total rural ST population ratio for the state of Maharashtra is 10.9 and Thane
district 0.20. This shows that distribution of SC population in these blocks is less than state
and district levels.
As per the analysis, one of the reasons for not detecting this social exlusion is mainly
due to lack of analysis at different levels. Because in the case of ST population, even if the
data values of two tribal bocks got mixed with the other blocks the end result seemed to show
no big variation in the situation.
It is evident from this analysis showed that mainly tribal villages are left out of
drinking water schemes and they depend upon tankers. This dependence on tankers in
summers might reduce the motivation of the villagers to go for a full fledged drinking water
schemes. Evidence from other countries showed that tankerfed schemes are highly inefficient
in water allocation and results in welfare losses. (Veena Srinivasan, 2010)
0
0.005
0.01
0.015
0.02
0.025
0.03
0.035
0.04
Jawhar Mokhada Murbad Shahapur Total Four
blocks
Tankerfed 0.003 0.009 0.02 0.02 0.01
Nontankerfed 0.0003 0.003 0 0.02 0.01
Block 0.005 0.009 0.04 0.03 0.02
Rat
io (n
o u
nit
)
SC population to total population
Page 43
30
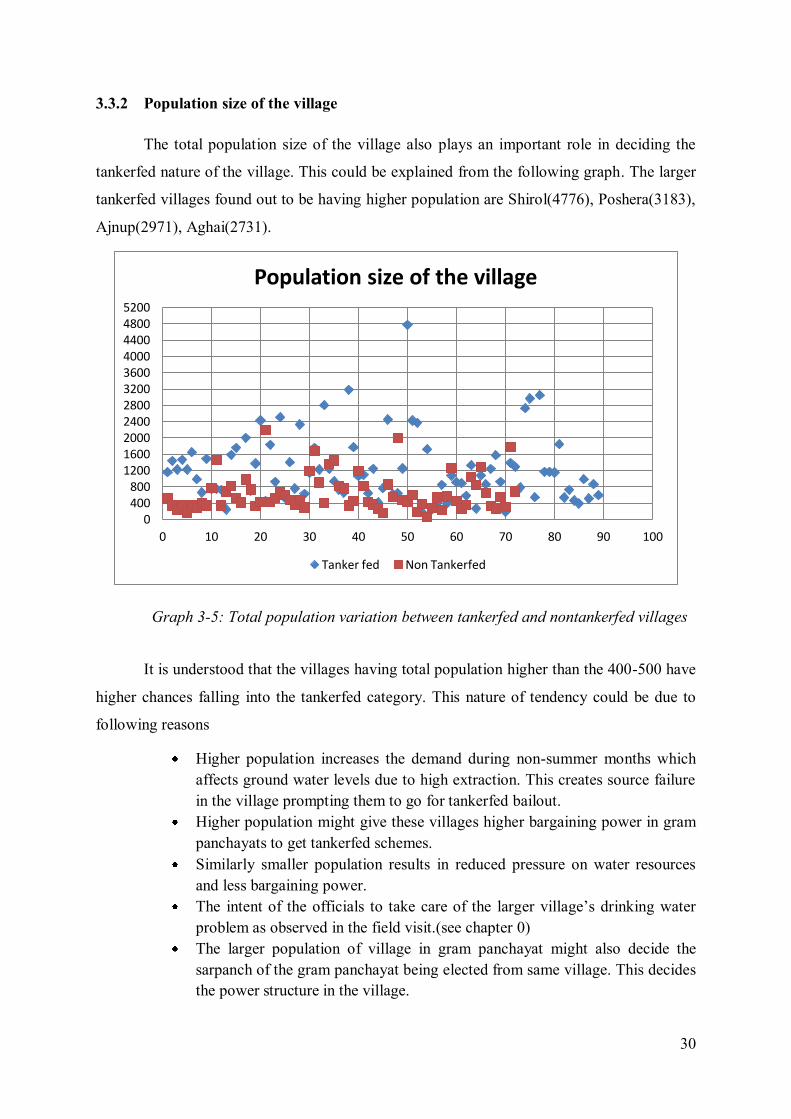
3.3.2 Population size of the village
The total population size of the village also plays an important role in deciding the
tankerfed nature of the village. This could be explained from the following graph. The larger
tankerfed villages found out to be having higher population are Shirol(4776), Poshera(3183),
Ajnup(2971), Aghai(2731).
Graph 3-5: Total population variation between tankerfed and nontankerfed villages
It is understood that the villages having total population higher than the 400-500 have
higher chances falling into the tankerfed category. This nature of tendency could be due to
following reasons
Higher population increases the demand during non-summer months which
affects ground water levels due to high extraction. This creates source failure
in the village prompting them to go for tankerfed bailout.
Higher population might give these villages higher bargaining power in gram
panchayats to get tankerfed schemes.
Similarly smaller population results in reduced pressure on water resources
and less bargaining power.
The intent of the officials to take care of the larger village‟s drinking water
problem as observed in the field visit.(see chapter 0)
The larger population of village in gram panchayat might also decide the
sarpanch of the gram panchayat being elected from same village. This decides
the power structure in the village.
0 400 800
1200 1600 2000 2400 2800 3200 3600 4000 4400 4800 5200
0 10 20 30 40 50 60 70 80 90 100
Population size of the village
Tanker fed Non Tankerfed
Page 44
31
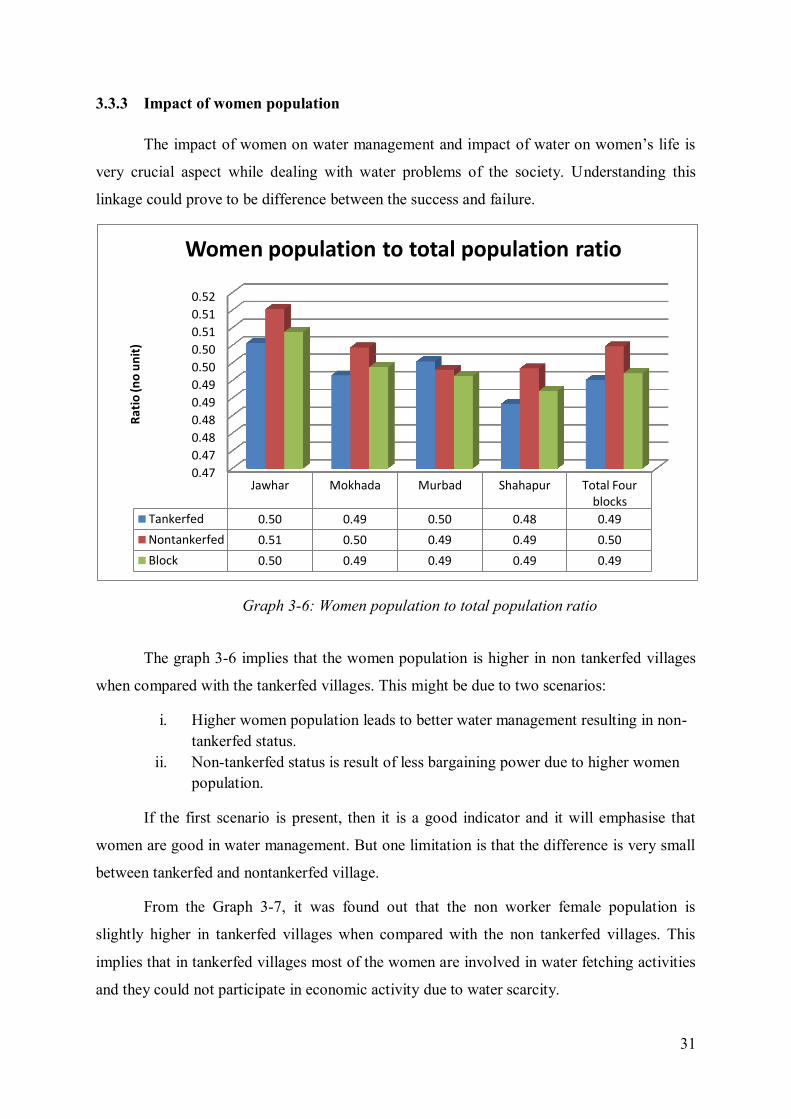
3.3.3 Impact of women population
The impact of women on water management and impact of water on women‟s life is
very crucial aspect while dealing with water problems of the society. Understanding this
linkage could prove to be difference between the success and failure.
Graph 3-6: Women population to total population ratio
The graph 3-6 implies that the women population is higher in non tankerfed villages
when compared with the tankerfed villages. This might be due to two scenarios:
i. Higher women population leads to better water management resulting in non-
tankerfed status.
ii. Non-tankerfed status is result of less bargaining power due to higher women
population.
If the first scenario is present, then it is a good indicator and it will emphasise that
women are good in water management. But one limitation is that the difference is very small
between tankerfed and nontankerfed village.
From the Graph 3-7, it was found out that the non worker female population is
slightly higher in tankerfed villages when compared with the non tankerfed villages. This
implies that in tankerfed villages most of the women are involved in water fetching activities
and they could not participate in economic activity due to water scarcity.
0.47
0.47
0.48
0.48
0.49
0.49
0.50
0.50
0.51
0.51
0.52
Jawhar Mokhada Murbad Shahapur Total Four blocks
Tankerfed 0.50 0.49 0.50 0.48 0.49
Nontankerfed 0.51 0.50 0.49 0.49 0.50
Block 0.50 0.49 0.49 0.49 0.49
Rat
io (n
o u
nit
)
Women population to total population ratio
Page 45
32
Graph 3-7: Non workers female to total female ratio
3.3.4 Impact of marginal workers
Graph 3-8: Marginal workers to total population ratio
It is evident from the Graph 3-8, that the marginal workers distribution is higher in
non-tankerfed villages than tankerfed villages except in the case of Murbad block. It implies
that tankerfed villages have high economical activity when compared with the non tankerfed
villages. Higher economic activity increases the access to better social services
(Rajiv.K.Gupta, 2003), so that tankerfed villages have better access to gaining the tankerfed
services due to its better economic activity.
0.00 0.10 0.20 0.30 0.40 0.50 0.60
Jawhar Mokhada Murbad Shahapur Total Four blocks
Tankerfed 0.47 0.47 0.47 0.51 0.49
Nontankerfed 0.43 0.46 0.45 0.50 0.47
Block 0.47 0.50 0.51 0.56 0.52
Rat
io (n
o u
nit
)
Female non workers to total female ratio
0.00 0.02 0.04 0.06 0.08 0.10 0.12 0.14 0.16 0.18 0.20
Jawhar Mokhada Murbad Shahapur Total Four blocks
Tankerfed 0.14 0.12 0.11 0.13 0.13
Nontankerfed 0.19 0.12 0.04 0.15 0.14
Block 0.15 0.13 0.10 0.11 0.12
Rat
io (n
o u
nit
)
Marginal workers to total population ratio
Page 46
33
3.3.5 Impact of Agricultural labour
Graph 3-9: Agricultural to total population ratio
The impact of agricultural labour on the tankerfed status is less or negligible as there
is very little variation between tankerfed and non tankerfed villages. This value of
agricultural labour includes both the values of main labourers and marginal labourers.
0.00
0.05
0.10
0.15
0.20
0.25
0.30
Jawhar Mokhada Murbad Shahapur Total Four blocks
Tankerfed 0.27 0.19 0.13 0.16 0.19
Nontankerfed 0.25 0.23 0.18 0.14 0.20
Block 0.26 0.21 0.13 0.13 0.16
Rat
io (n
o u
nit
)
Agricultural labour to total population ratio
Page 48
35
4 Field Work
The field work part in this study is done to understand the problem more clearly and it
helped to look the problem from different perspectives. The field work was done to collect
primary data required for the study. The tools used for collecting the data were key informant
interviews and field observation. The objective of the field visits is to validate the GoM
dataset and facilitate the direction of data analysis. Adding to the data collection work, the
habitats and its water sources were tagged by GPS during field work. Two field visits were
arranged on 22.10.2011 and 19.11.2011. The first field visit covered two gram panchayats -
Dhamni and Dhakne, covering seven habitats. The second field visit covered two gram
panchayats -Vashala and Vihigaon. It was found out that the population details of habitat
from GoM dataset was valid but the information about the water source changed. It might be
due to recent efforts taken by the government.
4.1 Selection criteria
The gram panchayats for the field work was selected from the elementary analysis of
the GoM dataset. The criteria for selecting the gram panchayat are that it should have the
tankerfed, non tankerfed and PWS habitats and its habitats should have diversity in social
demography. This was done so that the field work helps in better understanding the different
habitats and to guide the analysis in figuring out what makes the tankerfed village distinct
from other villages. The gram panchayats Dhamni and Dhakne were selected satisfied the
criteria. The gram panchayats of Vihigaon and Vashala were visited on the request of
engineers from ZP.
4.2 Findings and Observation
In Dhamni gram panchayat the Golbhan habitat is the main village and acts as
administrative centre for the gram panchayat.
The road access to Dhamni and Musalepada habitat is in bad states which are
tankerfed habitats while non tankerfed habitat Golbhan has better road access.
The water supply through the tankers had little benefits as any of the habitats have no
proper storage structure and tanker water is stored in the wells which are already
failed during summer.
Page 49
36
The tankerfed status changes for each habitat every year depending on the application
procedure. But the gram panchayat as a whole remains tankerfed because of these
habitats.
Urbanization is taking place along the National Highway and railway lines. The
places near Khardi station and Kasara station is experiencing change in real estate
scenario.
In case of Musalepada, literacy rate is identified as an important factor in the village
dynamics as the habitat has high illiteracy rates and it is tankerfed.
Similarly from Golbhan, the road access and economic activity and literacy rate is
identified as a important factor in the village dynamics.
In the case of Dhakne gram panchayat, the habitat Chindyachiwadi has succeeded in
implementing the Nal Yojana Scheme but the scheme failed in the habitat of Dhakne.
The two habitats are on the two sides of the stream. The presence of Sarpanch of
Dhakne gram panchayat in Chindyachiwadi habitat could be an influencing factor in
success of the scheme.
The habitat Chindyachiwadi and Dhakne gram panchayat also has women sarpanch.
Hence the analysis takes into consideration the population of women, women literacy
rate as an indirect indicator for the women participation and gender agency.
Agricultural labour population to the total population ratio will be considered as
indicator of urbanization. As per the census norms the villages having more than 75%
of male working population involved in non agricultural activities is one of the
criteria for urban area.
The marginal agricultural population, non workers to the total population ratio and the
non-agricultural population as the indicator for economic activity.
These Indicators will be compared with villages where the schemes are functional and
tankerfed habitats.
The conservation measures such as source protection for existing water sources could
be carried out in the villages. Source protection measures includes construction of
side walls for well, platform for well and protection from cattle usage.
The new schemes are implemented without yield tests which might result in source
failure due to over exploitation. This was observed in the case of Chindyachiwadi
located in Dhakne gram panchayat.
Page 50
37
5 Conclusion
5.1 Conclusion
The variation between tankerfed village and non tankerfed village is very less but
some factors like population size of the village, ST population, illiteracy rate, non worker
population have significant impact on this issue. Since the tankerfed villages and non
tankerfed villages were compared without considering status of neighbouring village status
the variation is less. That is, a tankerfed village and non-tankerfed village which are very
nearby might share very close society structure. It is found out that the villages having higher
population and share of ST population are mostly tankerfed. The high illiteracy rate found in
tankerfed village might be a cause or effect of the tankerfed problem. The higher non worker
female population in Jawhar and Murbad indicates that more women population is engaged
with the water fetching activity. The tankerfed scheme distributes the water to village in
summer months by discharging into the wells. This practice is not a viable option as there is
no proper storage or distribution infrastructure in the villages.
5.2 Future work
For the future work following options might be considered
Designing GIS based information system for the ZP for management drinking
water schemes to help in monitoring and forecasting the problems.
Designing drinking water scheme for any one of the gram panchayats-
Dhakne, Vihigaon, Vashala.
.
Page 52
39
6 Bibliography
UN Water Taskforce. (2010). Monitoring progress in the water sector. Retrieved
October 25, 2011, from UNESCO:
http://www.unesco.org/water/wwap/wwdr/indicators/pdf/UNTFIMR_Final_report_for_report
ing_to_UNWater.pdf
Bapat, J., P. A., Kumar, A., S. M., N. M., Nayar, V., et al. (2007). India Infrastructure
Report : Rural Infrastructure. (P. Kalra, & A. Rastogi, Eds.) Retrieved November 20, 2011,
from http://3inetwork.org/reports/IIR2007/IIR_2007.html
Census. (2001). Retrieved October 10, 2011, from Census India:
http://censusindia.gov.in/Metadata/Metada.htm#2w
Central Statistical Organisation. (2009). Millennium Development Goals - India
Country Report. Ministry of Statistics and Programme Implementation.
Daily News and Analysis. (2011, April 24). Thane politicians seek consensus on
bifurcation of district. Daily News and Analysis .
Department of Drinking Water Supply. (2009). Movement Towards Ensuring People's
Drinking Water Security in Rural India : Framework for Implementation 2008-2012.
Department of Drinking Water Supply. (2010). National Rural Drinking Water
Programme : Framework for Implementation. Retrieved 11 20, 2011, from
http://waterwiki.net/index.php/Rural_Drinking_Water_Guidelines_for_India
G. Hutton, L. H. (2006). Economic and health effects of increasing coverage of low-
cost water and sanitation interventions. Human Development Report Office Occasional
Paper 2006/33,UNDP.
Government of India. (2005). Bharat Niraman. Retrieved November 17, 2011, from
bharatnirman.gov.in/download.pdf
H.Kulkarni, Kakade, B., Marathe, A., Petare, K., Neelam, G., & Nagargoje, P. (n.d.).
ntegration of drinking water supply- sanitation and watershed develoopment. Retrieved
November 17, 2011, from 2000:
www.nri.org/.../wss.../WHiRL%20working%20paper%205_final.pdf
Manikutty, S. (1998). Community Participation: Lessons from Experiences in Five
Water and Sanitation Projects in India. Development Policy Review , 16 (4), 373-404.
Page 53
40
Planning Commission. (2007). Eighth Five Year Plan : Volume 2. Retrieved
November 17, 2011, from Planning commission:
http://planningcommission.nic.in/plans/planrel/fiveyr/8th/vol2/8v2ch14-1.htm
Rajiv.K.Gupta. (2003). Dams and water development for poverty reduction and
regional development : Issues and options for Gujarat state. In I. Unver, R. K. Gupta, & A.
Kibaroglu (Eds.), Water Development and Poverty Reduction (pp. 199-230). Kluwer
Academic Publishers.
Thornton, R. J. (2003). Early female marriage in the developing world. Gender,
development and marriage .
Veena Srinivasan, S. M. (2010). Factors determining informal tanker water markets in
Chennai, India. Water International , 35 (3), 254-269.
WHO. (2010). WHOSIS. Retrieved November 17, 2011, from WHO:
http://www.who.int/whosis/indicators/compendium/2008/2wst/en/
WHO/UN Water. (2010). Retrieved 10 30, 2011, from UN Water:
http://www.unwater.org/downloads/UN-Water_GLAAS_2010_Report.pdf.
World Bank. (2001). Multi-Village Rural Water Supply Schemes : An Emerging
Challenge. Washington SC.
Z.S. Wang, D. S. (1989). Reduction of enteric infectious disease in rural China by
providing deep-well tap water. Bull World Health Organ , 171-180.
Page 54
41
7 Appendix
Appendix I: Demographic Parameters (2001) for State Maharashtra and Thane
Indicators Maharashtra Thane Shahapur
Total population 96,878,627 8,131,849 273,304
Male 50,400,596 4,377,747 140,547
Female 46,478,031 3,754,102 132,757
Rural population 55,777,647 2,229,376 231,741
Male 28,458,677 1,148,123 118,879
Female 27,318,970 1,081,253 112,862
Female population as
percentage of total
population(%) 47.98 46.17 48.57
Rural Female population as
percentage of total rural
population 48.98 48.50 48.70
Sex Ratio 922 858 945
Sex Ratio-Rural 960 942 949
Population Density(sq.km) 103.3 850 -
No of Literates 63,965,943 5.635.799 -
Male 37,184,963 3.295,251 -
Female 26,780,980 2,340,548 -
No of Literates-Rural 33,313,270 1,197,007 -
Male 19,711,796 724,560 -
Female 13,601,474 472,447 -
Literacy Rate 76.9 80.7 69.3
Male 86 87 81
Female 67 73 57
Literacy Rate-Rural 70.4 64.4 66.9
Male 82 76 79
Female 58 53 54
Gender gap in literacy rate 19 14 1.4
Gender gap in literacy rate-
Rural 24 23 1.5
Total Workers 41,173,351 3,179,981 128,704
Male 28,852,095 2,443,327 76,918
Female 14,321,256 736,654 51,786
Total Workers- Rural 27,261,431 1,070,883 116,194
Male 15,348,636 639,172 66,483
Female 11,912,795 431,711 49,711
Percentage total workers 42.5 39.1 47.1
Male 53.3 55.8 54.7
Female 30.8 19.6 39
Page 55
42
Percentage total workers-
Rural 48.9 48.0 50.1
Male 53.9 55.7 55.9
Female 43.6 39.9 44.0
Percentage of Agricultural
labourers-Rural 37.8 27.2 26.4
Male 30.4 21.3 21.7
Female 47.4 36.0 32.7
Percentage of Cultivators-
Rural 42.4 34.9 47.4
Male 42.4 29.4 39.9
Female 42.5 43.0 57.4
Percentage of Main workers-
Rural 39.2 35.7 38.7
Male 47.5 46.2 48.5
Female 30.5 24.5 28.4
Percentage of marginal
workers-Rural 13.1 15.4 15.7
Male 6.4 9.5 7.5
Female 13.1 15.4 15.7
Percentage of workers in
agrisector-Rural 80.3 62.1 73.8
Male 72.8 50.7 61.5
Female 90.0 79.0 90.1
Percentage of workers in non
agri sector-Rural 19.7 37.9 26.2
Male 27.2 49.3 38.5
Female 10.0 21.0 9.9
Percentage of SC Populaton 10.2 4.2 4.1
Percentage of SC Populaton-
Rural 10.9 2.0 3.1
Percentage of ST population 8.9 14.7 32.9
Percentage of ST population-
Rural 13.4 47.0 35.3
Page 56
43
Appendix II: Village Level Findings
Block Name Derived parameters
Tankerfed Village Nontankerfed Village
Block
Jawhar
Female illiteracy 0.78 0.76 0.76
Male illiteracy 0.62 0.59 0.60
ST population to total population
0.97 0.99 0.97
SC population to total population
0.003 0.0003 0.005
Mokhada
Female illiteracy 0.69 0.70 0.68
Male illiteracy 0.52 0.53 0.50
ST population to total population
0.93 0.97 0.91
SC population to total population
0.009 0.003 0.009
Murbad
Female illiteracy 0.64 0.61 0.55
Male illiteracy 0.39 0.33 0.30
ST population to total population
0.74 0.32 0.24
SC population to total population
0.02 0 0.04
Shahapur
Female illiteracy 0.67 0.56 0.55
Male illiteracy 0.46 0.34 0.34
ST population to total population
0.62 0.42 0.35
SC population to total population
0.02 0.02 0.03
Total Four blocks
Female illiteracy 0.70 0.66 0.60
Male illiteracy 0.51 0.46 0.39
ST population to total population
0.78 0.72 0.50
SC population to total population
0.01 0.01 0.02
Page 57
44
Appendix III: Textual Analysis
Red = Tankerfed; Yellow = Non Tankerfed; White = Non Tankerfed and PWS present;
S.No
Grampanchy
at Village Habitat color (red=1; yellow=2; white=3;Hab=vill TankerfedGP=Hab TankerfedGP=Vill Tankerfed
1 Shirol Shirol Ambyachapada 1 0 0 0 0 1 1
2 Shirol Shirol Bhagatpada 1 0 0 0 0 1 1
3 Shirol Shirol Chafepada 1 0 0 0 0 1 1
4 Shirol Shirol Gopalpada 3 0 0 0 0 1 0
5 Shirol Shirol Fanaspada 1 0 0 0 0 1 1
6 Shirol Shirol Kalchirapada 3 0 0 0 0 1 0
7 Shirol Shirol Kundanpada 2 0 0 0 0 1 0
8 Shirol Shirol Pethyachapada 1 0 0 0 0 1 1
9 Shirol Shirol Shirol 3 1 0 1 0 1 0
10 Shirol Shirol Karanipada 3 0 0 0 0 1 0
11 Shirol Shirol Vihirichipada 1 0 0 0 0 1 1
12 Shirol Shirol Warlipada 3 0 0 0 0 1 0
13 Shirol Shirol Umbermali 1 0 0 0 0 1 1
14 Dhakne Dhakne Dhakne 1 1 1 1 1 1 1
15 Dhakne Dhakne Chindhyachiwadi 2 0 0 0 0 1 0
16 Dhakne Dhakne Dhupurwadi 1 0 0 0 0 1 1
17 Dhakne Dhakne Gavenwadi 2 0 0 0 0 1 0
18 Dhakne Dhakne Wagwadi 1 0 0 0 0 1 1
19 VEHLOLI (BK) LINGAYATE LINGAYATGAON 3 0 0 0 0 0 0
20 VEHLOLI (BK) VEHLOLI (BK) AMBYACHIWADI 1 0 0 0 0 1 1
21 VEHLOLI (BK) VEHLOLI (BK) BHAVARTHEPADA 2 0 0 0 0 1 0
22 VEHLOLI (BK) VEHLOLI (BK) CHINCHWADI 1 0 0 0 0 1 1
23 VEHLOLI (BK) VEHLOLI (BK) GHARTAN 1 0 0 0 0 1 1
24 VEHLOLI (BK) VEHLOLI (BK) KATICHIWADI 1 0 0 0 0 1 1
25 VEHLOLI (BK) VEHLOLI (BK) KHANDUCHIWADI 1 0 0 0 0 1 1
26 VEHLOLI (BK) VEHLOLI (BK) KRUSHNACHIWADI 1 0 0 0 0 1 1
27 VEHLOLI (BK) VEHLOLI (BK) VEHLOLI (BK) 3 1 0 1 0 1 0
28 KASARA (KH) DAND DAND 1 1 1 0 0 0 0
29 KASARA (KH) KASARA (KH) BIBALWADI 1 0 0 0 0 0 0
30 KASARA (KH) KASARA (KH) CHINTAMANWADI 1 0 0 0 0 0 0
31 KASARA (KH) KASARA (KH) LATHIFWADI 1 0 0 0 0 0 0
32 KASARA (KH) KASARA (KH) NARALWADI 1 0 0 0 0 0 0
33 KASARA (KH) KASARA (KH) OHOLWADI 1 0 0 0 0 0 0
34 KASARA (KH) KASARA (KH) PARADHAWADI 1 0 0 0 0 0 0
35 KASARA (KH) KASARA (KH) PAYERWADI 1 0 0 0 0 0 0
36 KASARA (KH) KASARA (KH) SAVERWADI 2 0 0 0 0 0 0
37 KASARA (KH) KASARA (KH) THOKARWADI 1 0 0 0 0 0 0
38 KASARA (KH) KASARA (KH) GANGANWADI 1 0 0 0 0 0 0
39 KASARA (KH) UMBRAWANE UMBRAWANE 2 1 0 0 0 0 0
40 KASARA (KH) KASARA (KH) NAVINWADI 1 0 0 0 0 1 1
41 DHAMNI DHAMNI DHAMNI 1 1 1 1 1 1 1
42 DHAMNI DHAMNI MUSALEPADA 1 0 0 0 0 0 0
43 DHAMNI DHAMNI TALEKHAND 1 0 0 0 0 0 0
44 DHAMNI GOLBHAN GOLBHAN 2 1 0 0 0 0 0
45 DHAMNI GOLBHAN HARYACHAPADA 2 0 0 0 0 0 0
46 DHAMNI JARNADI JARNADI 1 1 1 0 0 0 0
47 VIHIGAON VIHIGAON BAUDHWADI 2 0 0 0 0 1 0
48 VIHIGAON VIHIGAON BHENDICHIWADI 2 0 0 0 0 1 0
49 VIHIGAON VIHIGAON CHINCHWADI 2 0 0 0 0 1 0
50 VIHIGAON VIHIGAON DARYACHEWADI 2 0 0 0 0 1 0
51 VIHIGAON VIHIGAON DHUBHACHIWADI 2 0 0 0 0 1 0
52 VIHIGAON VIHIGAON HIWALWADI 1 0 0 0 0 1 1
53 VIHIGAON VIHIGAON KATHODWADA 2 0 0 0 0 1 0
54 VIHIGAON VIHIGAON KATKARIWADI 2 0 0 0 0 1 0
55 VIHIGAON VIHIGAON KAVTHYACHIWADI 1 0 0 0 0 1 1
56 VIHIGAON VIHIGAON NIRGOODWADI 1 0 0 0 0 1 1
57 VIHIGAON VIHIGAON PANAVTHAWADI 2 0 0 0 0 1 0
58 VIHIGAON VIHIGAON TELAMPADA 1 0 0 0 0 1 1
59 VIHIGAON VIHIGAON VIHIGAON 1 1 1 1 1 1 1
60 VIHIGAON VIHIGAON SHIDWADI 1 0 0 0 0 1 1
Page 58
45
61 AWALE AWALE AMBEPADA 2 0 0 0 0 1 0
62 AWALE AWALE AWALE 2 1 0 1 0 1 0
63 AWALE AWALE BORICHAPADA 1 0 0 0 0 1 1
64 AWALE AWALE JAMBHALIPADA 2 0 0 0 0 1 0
65 AWALE AWALE PATILPADA 2 0 0 0 0 1 0
66 AWALE AWALE PATRAYACHAPADA 1 0 0 0 0 1 1
67 AWALE AWALE WEDUCHAPADA 2 0 0 0 0 1 0
68 AWALE CHANDROTI CHANDROTI 2 1 0 0 0 0 0
69 AWALE CHANDROTI KATEKUIPADA 2 0 0 0 0 0 0
70 AWALE CHANDROTI KATKARIPADA (THAKURPADA) 2 0 0 0 0 0 0
71 AWALE CHANDROTI SHEKTYACHAPADA 2 0 0 0 0 0 0
72 AWALE KARADE KARADE 2 1 0 0 0 0 0
73 AWALE MAHULI KHARMEPADA 2 0 0 0 0 0 0
74 AWALE MAHULI MAHULI 1 1 1 0 0 0 0
75 AWALE MAHULI SUTARPADA 2 0 0 0 0 0 0
76 AWALE MAMNOLI DHAKANEPADA 2 0 0 0 0 0 0
77 AWALE MAMNOLI MAMNOLI 2 1 0 0 0 0 0
78 AWALE MAMNOLI PACHOLKARPADA 2 0 0 0 0 0 0
79 TALWADE CHONDE KH) CHONDE KH) 2 1 0 0 0 0 0
80 TALWADE GANDHULWADGANDHULWAD 1 1 1 0 0 0 0
81 TALWADE HINGLUD HINGLUD 1 1 1 0 0 0 0
82 TALWADE ROADVAHAL ROADVAHAL 1 1 1 0 0 0 0
83 TALWADE TALWADE TALWADE 1 1 1 1 1 1 1
84 DHASAI DHASAI DHASAI 2 1 0 1 0 1 0
85 DHASAI DHASAI KATKARIWADI 2 0 0 0 0 1 0
86 DHASAI DHASAI SAKHARWADI 2 0 0 0 0 1 0
87 DHASAI MANGAON (N.V.)MANGAON (THALKYACHA PADA) 2 0 0 0 0 0 0
88 DHASAI SHIVANERI FARDEPADA 2 0 0 0 0 0 0
89 DHASAI SHIVANERI SHIVANERI 1 1 1 0 0 0 0
90 MANEKHIND ADIVALI ADIVALI 2 1 0 0 0 0 0
91 MANEKHIND ADIVALI ADIWALIPADA 2 0 0 0 0 0 0
92 MANEKHIND ADIVALI PAYERWADI 2 0 0 0 0 0 0
93 MANEKHIND AMBEKHOR AMBEKHOR 1 1 1 0 0 0 0
94 MANEKHIND AMBEKHOR BHALYACHIWADI 2 0 0 0 0 0 0
95 MANEKHIND AMBEKHOR KAVTEWADI 2 0 0 0 0 0 0
96 MANEKHIND AMBEKHOR KUBHAICHIWADI 2 0 0 0 0 0 0
97 MANEKHIND AMBEKHOR SAKHARWADI 2 0 0 0 0 0 0
98 MANEKHIND ASHTE ASHTE 2 1 0 0 0 0 0
99 MANEKHIND MANEKHIND MANEKHIND 2 1 0 1 0 1 0
100 MANJARE BHINAR BHINAR 2 1 0 0 0 0 0
101 MANJARE MALAD MALAD 2 1 0 0 0 0 0
102 MANJARE MANGAON (N.V.)MANGAON (N.V.) 2 1 0 0 0 0 0
103 MANJARE MANJARE MANJARE 1 1 1 1 1 1 1
104 MANJARE MANJARE NIBHALPADA 1 0 0 0 0 1 1
105 MANJARE MANJARE PANDHARICHAPADA 1 0 0 0 0 1 1
106 MANJARE TEMBHURLI CHANDRICHAPADA 2 0 0 0 0 0 0
107 MANJARE TEMBHURLI KATKARIWADI 2 0 0 0 0 0 0
108 MANJARE TEMBHURLI TEMBHURLI 1 1 1 0 0 0 0
109 MANJARE TEMBHURLI TORANPADA 2 0 0 0 0 0 0
110 VASHALA (BK)VASHALA BK CHARANWADI 1 0 0 0 0 0 0
111 VASHALA (BK)VASHALA BK KOLIPADA 2 0 0 0 0 0 0
112 VASHALA (BK)VASHALA BK RAICHEWADI 1 0 0 0 0 0 0
113 VASHALA (BK)VASHALA BK TOKARKHAND 2 0 0 0 0 0 0
114 VASHALA (BK)VASHALA BK UMBERWADI 2 0 0 0 0 0 0
115 VASHALA (BK)VASHALA (BK)VASHALA (BK) 1 1 1 1 1 1 1
116 VASHALA (BK)VASHALA (BK)VASHALA (BK) 1 1 1 1 1 1 1
117 WARSKOL BENDEKON AMBADAPADA 2 0 0 0 0 0 0
118 WARSKOL BENDEKON BENDEKON 2 1 0 0 0 0 0
119 WARSKOL DUDHAR DUDHAR 2 1 0 0 0 0 0
120 WARSKOL GHANEPADA GHANEPADA 1 1 1 0 0 0 0
Page 59
46
121 WARSKOL GHANEPADA INDHANPADA 1 0 0 0 0 0 0
122 WARSKOL PIMPALPADA DONGARIPADA 1 0 0 0 0 0 0
123 WARSKOL PIMPALPADA PIMPALPADA 2 1 0 0 0 0 0
124 WARSKOL PIMPALPADA SUGAON 2 0 0 0 0 0 0
125 WARSKOL WARSKOL KUBHAICHAPADA 2 0 0 0 0 1 0
126 WARSKOL WARSKOL WARSKOL 2 1 0 1 0 1 0
127 TEMBHA AMBIVALI TARF DAHIGAMBIVALI TARF DAHIG 3 1 0 0 0 0 0
128 TEMBHA AMBIVALI TARF DAHIGBHOSPADA 1 0 0 0 0 0 0
129 TEMBHA AMBIVALI TARF DAHIGJAMBHULPADA 1 0 0 0 0 0 0
130 TEMBHA AMBIVALI TARF DAHIGMORANEPADA 2 0 0 0 0 0 0
131 TEMBHA AMBIVALI TARF DAHIGUMBERACHAPADA 2 0 0 0 0 0 0
132 TEMBHA BALWANDI BALWANDI 1 1 1 0 0 0 0
133 TEMBHA BELWAD BELWAD 2 1 0 0 0 0 0
134 TEMBHA BELWAD BHALYACHA PADA 2 0 0 0 0 0 0
135 TEMBHA BELWAD GANGADPADA 2 0 0 0 0 0 0
136 TEMBHA BELWAD KHARPADEPADA 2 0 0 0 0 0 0
137 TEMBHA BELWAD ROJPADA 2 0 0 0 0 0 0
138 TEMBHA TEMBHE KHAIRPADA 2 0 0 0 0 0 0
139 TEMBHA TEMBHA MADHVIPADA 1 0 0 0 0 1 1
140 TEMBHA TEMBHA MEGALPADA 3 0 0 0 0 1 0
141 TEMBHA TEMBHA TEMBHA 3 1 0 1 0 1 0
142 TEMBHA TEMBHA VAITERNA 3 0 0 0 0 1 0
143 TEMBHA TEMBHA WARCHA-TEMBHA 3 0 0 0 0 1 0
144 VELUK PATOL PATOL 1 1 1 0 0 0 0
145 VELUK PATOL PATOLPADA 1 0 0 0 0 0 0
146 VELUK PATOL TELAMPADA 1 0 0 0 0 0 0
147 VELUK PINGALWADI PINGALWADI 2 1 0 0 0 0 0
148 VELUK SUSARWADI KHARMYACHAPADA 2 0 0 0 0 0 0
149 VELUK SUSARWADI SUSARWADI 1 1 1 0 0 0 0
150 VELUK VELUK DHENGANMAL 1 0 0 0 0 1 1
151 VELUK VELUK KATKARIWADI 2 0 0 0 0 1 0
152 VELUK VELUK PATKICHAPADA 2 0 0 0 0 1 0
153 VELUK VELUK VELUK 1 1 1 1 1 1 1
154 DHADRE BELWALI TARF JADAIBELWALI TARF JADAI 3 1 0 0 0 0 0
155 DHADRE BELWALI TARF JADAIBHINGURLIPADA 2 0 0 0 0 0 0
156 DHADRE BELWALI TARF JADAIHUMBYACHAPADA 2 0 0 0 0 0 0
157 DHADRE DHADRE DHADRE 1 1 1 1 1 1 1
158 DHADRE DHADRE FANASWADI 1 0 0 0 0 1 1
159 DHADRE DHADRE KERPETWADI 1 0 0 0 0 1 1
160 DHADRE DHADRE RIKAMWADI 1 0 0 0 0 1 1
161 DHADRE DHADRE UMBERWADI 1 0 0 0 0 1 1
162 VANDRE KHOR KHOR 1 1 1 0 0 0 0
163 VANDRE VANDRE ALANPADA 2 0 0 0 0 1 0
164 VANDRE VANDRE BAYAJIPADA 2 0 0 0 0 1 0
165 VANDRE VANDRE DODKEPADA 2 0 0 0 0 1 0
166 VANDRE VANDRE GHATALPADA 2 0 0 0 0 1 0
167 VANDRE VANDRE KAKADPADA 2 0 0 0 0 1 0
168 VANDRE VANDRE MEGHLEPADA 2 0 0 0 0 1 0
169 VANDRE VANDRE RAMJIPADA 2 0 0 0 0 1 0
170 VANDRE VANDRE SATHEPADA 2 0 0 0 0 1 0
171 VANDRE VANDRE THAKURPADA 2 0 0 0 0 1 0
172 VANDRE VANDRE VANDRE 1 1 1 1 1 1 1
173 MAL MAL AMBYACHAPADA 2 0 0 0 0 1 0
174 MAL MAL KAVTHYACHIWADI 2 0 0 0 0 1 0
175 MAL MAL MAL 2 1 0 1 0 1 0
176 MAL MAL PATILPADA 2 0 0 0 0 1 0
177 MAL MAL SHIDWADI 2 0 0 0 0 1 0
178 MAL MAL WARGHADWADI 2 0 0 0 0 1 0
179 SAKADBAV BABREWADI BABREWADI 3 1 0 0 0 0 0
180 SAKADBAV DEVGAON (N.V.)DEVGAON (N.V.) 2 1 0 0 0 0 0
181 SAKADBAV JULAWANI JULAWANI 2 1 0 0 0 0 0
182 SAKADBAV JULAWANI KHARALI 2 0 0 0 0 0 0
Page 60
47
Appendix IV: Contact Details
S.
No
Name Particulars Contact No
1 Mr. Eknath Shankar Bharat Golbhan Maji-sarpanch 92701357611
2 Mr. Vishnu Jannu Paradhi Dhamni- Grampancahyat sarpanch
(Musalepada)
9270141288
3 Mr. Eknath Ramachandra
Manje
Resident - Jarandi 9273368278
4 Mr. Bhagwan Sankar Boire Resident- Talekhind 9271969741
5 Ms. Radha Bhai Eknath
Kadkai
Dhakne- Grampanchayat sarpanch
(Chindhyachihabitat)
9545345513
6 Mr. Tukaram Wagh Vihigaon Grampanchayat -
sarpanch
9158870314
7 Mr. Phatak Deputy Engineer- ZP 9763709139
8 Mr. Vikas Jadav Assistant Engineer- ZP 9870232351
183 SAKADBAV JULAWANI POKLYACHIWADI 1 0 0 0 0 0 0
184 SAKADBAV JULAWANI RUMALPADA 2 0 0 0 0 0 0
185 SAKADBAV JULAWANI SHIDPADA 2 0 0 0 0 0 0
186 SAKADBAV SAKADBAV GERHYCHIWADI 1 0 0 0 0 1 1
187 SAKADBAV SAKADBAV JIVYACHIWADI 1 0 0 0 0 1 1
188 SAKADBAV SAKADBAV PARADHAWADI 1 0 0 0 0 1 1
189 SAKADBAV SAKADBAV PAYERWADI 1 0 0 0 0 1 1
190 SAKADBAV SAKADBAV SAKADBAV 1 1 1 1 1 1 1
191 MADH HAL HAL 2 1 0 0 0 0 0
192 MADH HAL ISAMEPADA 1 0 0 0 0 0 0
193 MADH HAL KASHIWALEPADA 2 0 0 0 0 0 0
194 MADH MADH MADH 1 1 1 1 1 1 1
195 TAHARPUR DIMBHE DIMBHE 2 1 0 0 0 0 0
196 TAHARPUR DIMBHE GAVITPADA 2 0 0 0 0 0 0
197 TAHARPUR DIMBHE MORASPADA 2 0 0 0 0 0 0
198 TAHARPUR TAHARPUR TAHARPUR 2 1 0 1 0 1 0
199 TAHARPUR VEDVAHAL PALICHAPADA 2 0 0 0 0 0 0
200 TAHARPUR VEDVAHAL VEDVAHAL 2 1 0 0 0 0 0
Page 61
48
Appendix V: Field visit report I
Field Visit Report I
The objective of the field visit is to validate the GoM data and understanding the
ground reality. The field visits are carried out to find the relevant factors in differentiating
between tankerfed and non tankerfed villages. It gave direction to our data analysis and
helped in deciding the future course of actions. The field visit was arranged on October 22,
2011. About 7 habitats from two gram panchayats of Dhamni and Dhakne were visited. The
gram panchayats was selected on the basis of elementary analysis. It is selected as it satisfied
the criteria that it should consists of tankerfed, nontankerfed and PWS habitats in it. The field
visit team consists of Mr. Nachiket Sakhadeo and myself. The plan is to visit all the habitats
in the two gram panchayats and information related to drinking water is collected. The GoM
is validated through these visits and it was found out the population details is valid but the
number of source seems to be vary.
Dhamni gram panchayat
The Dhamni grampanchyat consists of six habitats and five habitats were covered
during the field visit. The total population of Dhamni grampanchyat is 1700 as per Census
2001. The detailed description of the habitats is given below.
Figure 7:1:Dhamni grampanchayat
Page 62
49
Table 7-1:Dhamni grampanchayat Habitat Details Name of
the habitat
Individ
ual PWS
Regio
nal PWS
No of
Handpump
No of
functional
handp
ump
No of
public well
No of
functional
public
well
Tanker
fed
Populat
ion
Eleva
tion (m)
Dhamni No No 3 3 1 1 Yes 317 203
Musalep
ada
No No 1 1 1 1 Yes 150 239
Talekhin
d
No No 2 2 2 2 Yes 175 207
Golbhan No No 0 0 1 1 No 367 242
Haryach
apada
No No 0 0 1 1 No 64 197
Jarandi No No 2 2 1 1 Yes 627 246
Source: GOM
Dhamni
The main occupation of Dhamni habitat is Agriculture and about significant share of
the population is employed in private sector. The road access to dhamni is poor and has a
narrow and Katcha road. The main samaj present were Kunbhi, Katkari, Warali. There is no
NREGA work is undertaken currently in this habitat and the last NREGA work was carried
out in 2009. Even though the name of the grampanchayat was Dhamni, the Panchyat office is
located in Golbhan and the gram sabha were held in Golbhan due to better road access. The
village has four wells and Nal Yojana scheme is not implemented. The Jalswarajya scheme is
currently under construction and it started from 2009. The persons interviewed were: farmer,
teacher and women. The streams located close to the habitat is seasonal and dries up in
summer. The tanker frequency is once in a day. The reason for scarcity as told by the
villagers was in scarce conditions people from nearby villages/habitats access water from
here.
Location & Elevation: N 19‟ 35.505”, E 73‟.24.433” and 203 m
Page 63
50
Figure 7:2: Dhamni habitat and its wells
Table 7-2: Dhamni habitat- Well details
Particular
s
Coordinates Elevatio
n (m)
Elevation
Differenc
e (m)
Distance
from
Village(km
)
Dept
h (ft)
Status
Well 1 N 19‟
35.785
”
E 73‟
34.358
”
185 18 0.74 15 Empty
in
summe
r
Well 2 N 19‟
35.609
”
E 73‟
24.655
”
179 24 0.50 30 Not
Empty
in
summe
r
Well 3 Not visited 30 Empty
in
summe
r
Well 4 Accessed by Katkari people; Far away from village
Page 64
51
Table 7-3: Dhamni Secondary Data
Dhamni Census Details
Total Population 317 DDWS
ST Population 38 DDWS
SC Population 0 DDWS
No of Households 73 DDWS
No of Cattles 240 DDWS
Public well 1 GOM
Handpump 3 GOM
Tankerfed Yes GOM
PWS No GOM
The GOM data showed details about only one public well but there are actually four
public wells in use at present.
Golbhan
Golbhan is the main habitat of Dhamni gram panchayat. The gram panchayat office is
located in Golbhan. The habitat has a very good road access and it lies very close to the NH 3
than the other habitats. The habitat has about 4 shops and good number of two wheelers
which we can assume it as a sign of economic growth of residents. The main samaj present in
the habitat were Kunbhi, Katkari and Warali. According to Maji Sarpanch the literacy is at
very good level in this habitat. The NREGEA scheme is carried out in this habitat to do road
related works. The frequency of tanker is one tanker per day. About half of the population in
the habitat is employed in the private sector and a good number of people work in
government sector. There are about three reservoirs namely Bhatsa, Vaitarna, Tansa located
within 16 km radius from the habitat.
The Nal yojana scheme was implemented in the village and It is part of the Khardi
regional water supply scheme. The water tax is about 150 Rs per household per year. The
main income for the gram panchayat is by land tax and the gram Panchyat works on funds
received as Grants from ZP.
Page 65
52
Table 7-4: Golbhan Secondary Data
Golbhan Census Details
Total Population 367 DDWS
ST Population 30 DDWS
SC Population 0 DDWS
No of Households 87 DDWS
No of Cattles 135 DDWS
Public well 1 GOM
Handpump 0 GOM
Tankerfed No GOM
PWS No GOM
People depend on Nal yojana and Handpump for drinking purposes. There is one
handpump in the village and it is maintained by the grampanchayat. The functional
handpump and PWS is not mentioned in GOM data set.
Location of Golbhan : N 19°35'53.51", E 73°23'44.53" and Elevation : 242 m
Table 7-5: Golbhan : Handpump details
Particulars Coordinates Elevatio
n (m)
Elevation
Differenc
e (m)
Distance
from
Village(km
)
Dept
h (ft)
Status
Handpum
p
N19‟
35.850
”
E 73‟
23.656
”
239 3 0.20 - Year
aroun
d
supply
Figure 7:3: Golbhan Habitat
Page 66
53
Musalepada
The musalepada habitat is located very close to the privately owned township and the
samaj is Warali Samaj. The sarpanch of the village Mr. Vishnu Jannu Paradhi was
interviewed during the fieldwork. The Maharashtra Rojgar Yojana was implemented in the
village. The main occupation is agriculture and there are no people employed in government
jobs from this village. There are no shops in the village and it has a school till 4th
standard.
There is a problem of literacy rate in this village according to local people. The people
depend on well, bawdi and handpump for their water requirements. They have heard about
Pan adwa- Pani Jirwa. The well is located about 1.5km from the habitat and its about 35 feet
deep extended from 20 ft due to Nal Yojana scheme.
The Nal yojana scheme was implemented but not completed because the funds were
stopped. As a part of the scheme overhead tanks and plastic syntax tanks were built near the
school. The scheme is non functional as the grants were stopped in middle of the scheme
implementation.
Table 7-6: Musalepada Secondary Data
Musalepada Census Details
Total Population 150 DDWS
ST Population 150 DDWS
SC Population 0 DDWS
No of Households 39 DDWS
No of Cattles 135 DDWS
Public well 1 GOM
Handpump 1 GOM
Tankerfed Yes GOM
PWS No GOM
The overhead tank as part of the Nal yojana scheme was constructed but it was
incomplete. It present status can be seen in the. The coordiantes of overhead tank is N 19‟
34.984” E 73‟ 24.539” and elevation 239m
Page 67
54
Figure 7:4: Musalepada Habitat and Overhead Tank
Figure 7:5: Overhead Tank in Musalepada
Jarandi
The habitat Jarandi is the most populated habitat in the Dhamni grampanchyat. There
are watershed activities carried out in these habitat mainly through Shramdan( Voluntary
labour). The samaj in this habitat is mainly Adivasi, Thakar, Kunbi, Katkari and Koli. There
are there shops in the habitat and anganhabitat is present in the village. There is also a school
upto 4 th grade. There are 2 graduates in the village. I felt the gender participation was better
in Jarandi village as the women were more interested in answering the questions about the
Page 68
55
water problem. Both the men and women were involved in fetching water as men are
responsible for bringing water for cattles using bullock carts. The road access is not as bad as
in the case of dhamni. There are two wells and two handpumps in the habitat and only one is
functional at present. This habitat faces the severe water scarcity problem in summer
according to the nearby villages. There are about 4 check dams in the habitat. The water is
available till March in the checkdams. There is presence of NGO but the details about the
NGO were unknown to the local people.
The Nal yojana scheme was carried out in the habitat with the budget of about Rs 22
Lakhs . But the scheme was not completed. Only the wells were deepened using the funds
and it helped in making the seasonal wells into perennial in few cases. The Pani committee
was allotted 13 lakhs to repair the wells which were not utilized as told by local people. The
people are unaware about the Jal Swarajya scheme. They were made to think that it is normal
to left out of the schemes because their habitat is remote and small in proportion.
Table 7-7: Jarandi Secondary Data
Jarandi Census Details
Total Population 627 DDWS
ST Population 324 DDWS
SC Population 0 DDWS
No of Households 64 DDWS
No of Cattles 425 DDWS
Public well 1 GOM
Handpump 2 GOM
Tankerfed Yes GOM
PWS No GOM
Table 7-8: Jarandi Well Details
Particulars Coordinates Elevat
ion
(m)
Elevatio
n
differen
ce (m)
Distan
ce
(km)
Depth
(ft)
Status
Well 1 N 19‟
35.112”
E 73‟
25.476”
223 22 0.35 15
Well 2 30
Well 3 N 19‟
35.131”
E 73‟
25.392”
216 29 0.56 30 Drinking
water
Page 69
56
Figure 7:6: Jarandi Habitat – Wells
Talekhind
The Talekhind habitat consists of samaj categories namely Warali, Khadkhari, Kunbi.
The habitat has poor road access and it has no direct road access due to lack of bridge. The
habitat depends upon the streams, wells and hand pumps for water requirement. According to
the local men water availability better than Golbhan habitat. The local people work mainly in
private industries and few works in railways. There are 4 wells and 2 hand pumps in the
village of which only one hand pump is operational. There are additional two public wells
than mentioned in GOM data set. There was no tanker water supply for last two years but
mentioned in GOM dataset as tanker fed in last 3 years.
Table 7-9: Talekhind secondary data
Talekhind Census Details
Total Population 175 DDWS
ST Population 36 DDWS
SC Population 0 DDWS
No of Households 45 DDWS
No of Cattles 225 DDWS
Public well 2 GOM
Handpump 2 GOM
Tankerfed Yes GOM
PWS No GOM
Page 70
57
Table 7-10: Talekhind Well details
Particulars Coordinates Elevatio
n (m)
Elevatio
n
Differen
ce (m)
Distance
(km)
Depth Status
Well 1 N 19‟
36.045”
E 73‟
25.019”
196 12 0.19 15 ft Drinkin
g &
used in
summer
Well 2 N 19‟
35.942”
E 73‟
24.876”
179 29 0.47 10ft
Well 3 N 19‟
35.919”
E 73‟
24.840”
179 29 0.72 30ft Nal
Yojana
source
Well 4 N 19‟
35.851”
E 73‟
24.867”
179 29 0.64 12ft
Figure 7:7: Talekhind habitat
Dhakne Gram Panchayat
The Dhakne Gram Panchyat is located in Shahapur Block of Thane District. The
Dhakne Gram panchyat has five habitats. We visited Dhakne and Chindyachiwadi habitat as
part of the field visit. The detils of the habitats is briefed below. We visited Ms. Radha Bhai
Eknath Kadkai, sarpanch of Dhakne gram panchayat in chindyachiwadi and we met the
residents of Dhakne habitat.
Page 71
58
Figure 7:8: Dhakne gram panchayat
Dhakne
The main occupation of the Dhakne habitat is agriculture. The samaj of Dhakne
habitat consists of Katkari, kunbi, Thakur, Warali. The NREGA works have been carried out
in the habitat and check dams were constructed as part of the scheme. The habitat has better
road access. There are about five shops in the village and hospital is present near the habitat.
There are about 10-13 graduates in the habitat. There are five wells in the habitat about which
2 were used for drinking and 3 were used for domestic uses. The handpump is present in the
habitat but it is not functional even after the efforts of local Gram Panchayat. The water
availability in the habitat is till April end. There are no buffalos in the habitat as it is a symbol
of sufficient water availability. The watershed works was not carried out in this village. The
Nal yojana scheme was implemented but failed and become non functional. According to the
local people of Dhakne, Chindyachiwadi and Gavenwadi have functional Nal yojana
schemes. The reason for the failure of the scheme is due to contractor‟s fault as per the local
people. The people in the habitat do not prefer to go for outside work as this is a mountainous
terrain.
Page 72
59
Table 7-11: Dhakne habitat well details
Particul
ars
Coordinates Elevation
(m)
Elevatio
n
Differen
ce (m)
Distan
ce
(km)
Depth
(ft)
Status
Well 1 N 19‟
34.604”
E 73‟
31.626”
272 20 0.32 25 Drinking &
used till
April end.
Well 2 N 19‟
34.824”
E 73‟
31.859”
282 10 0.33 30 Drinking
Table 7-12: Dhakne gram panchayat details
Name of the
habitat
Indiv
idual
PWS
Regi
onal
PWS
No of
Handp
ump
No of
functional
handpump
No of
public
well
No of
functional
public well
Tank
erfed
Dhakne No No 0 0 1 1 Yes
Chindyachiwadi No No 0 0 1 1 No
Gavenwadi No No 0 0 1 1 No
Wagwadi No No 1 1 1 1 Yes
Dhupurwadi No No 1 1 1 1 Yes
The functional well used for drinking water is 2 but the GSDA dataset is showing
only one functional well.
Figure 7:9:Dhakne habitat wells
Page 73
60
Chindyachiwadi
The Chindyachiwadi samaj consists of Koli and Thakur. There are about 2 shops in
the habitat. The sarpanch of the Dhakne Gram Panchayat resides in Chindyachiwadi. There is
a secondary school near the habitat. The interviewed person was Sarpanch of
GramPanchayat. The NREGA activities were Road work. The main occupation in the habitat
is agriculture. The watershed development works were carried out in the habitat. The BAIF
NGO has constructed check dams for water supply to cattles. There are no buffalos in the
habitat as it is a symbol of sufficient water availability. Nal yojana scheme was implemented
in the village and it is functional. There is a issue of water conflict between the two habitats
Dhakne and Chindyachiwadi. Last year the habitat is tankerfed eventhough the habitat is
mentioned as not tankerfed. The habitat also has a water supply scheme
Table : Chindyachiwadi – Secondary Data
Chindyachiwadi Census Details
Total Population 157 DDWS
ST Population 157 DDWS
SC Population 0 DDWS
No of Households 71 DDWS
No of Cattles 71 DDWS
Public well 1 GoM
Handpump 0 GoM
Tankerfed No GoM
PWS No GoM
The Chindyachiwadi habitat is reported as non-tankerfed, but the tankers came during
last year. The Nal Yojana and the scheme details were missing GoM dataset.
Page 74
61
Appendix VI: Field visit report II
Field Visit Report II
Shahpur taluka is one of the larger talukas in Thane district which faces severe
drinking water stress in summer and pre-summer months and has a large number of tanker
fed habitats. A field trip was planned on Saturday, 19th
November 2011 to visit this taluka
along with some engineers from the water supply department. The team for the field work
consists of Prof. Milind Sohoni (CTARA), Ms. Pooja Prasad and myself. The engineers from
ZP joined with us from Kharadi and accompanied with us during the field visit.
Our initial plan was to visit the Dhamni gram panchayat (GP) in Shahpur district,
visited during first field visit on October 22, 2011. Our objective for the field visit was to
have some questions answered and explore some possible solutions for this area. However,
the engineers had a different plan. They wanted us to visit Vihigaon GP and Vashala GP as
they thought that those were the GPs which had the most severe problem. The gram
panchayats of Kasara, Vashala and Dhakne, all within Shahpur taluka, have been tanker fed
for 40 years. The water department had been unable to find a solution based on their current
practices and requested CTARA to explore drinking water solutions for these areas.
Vihigaon gram panchayat
The Vihigaon gram panchyat consists of fifteen habitats and two habitats were
covered during the field visit. The total population of Vihigaon grampanchyat is 1726 as per
Census 2001. The detailed description of the habitats is given below.
Figure 7:10: Vihigaon Grampanchayat
Page 75
62
There is a well in Vihigaon gavthan (main Vihigaon) which also serves Kathodhabitat
and Katkarihabitat (~200 homes based on the people there). This well dries up by Jan/Feb.
There is a village water committee which applies for tankers. There is a single water
committee for all padas. The river vaitarna is two km away from this location and it is
perennial. A piped scheme has not been feasible as the cost per capita not fitting into norms.
There is an ongoing rehabilitation project right next to this well to relocate a habitat.
The construction of vaitarna dam will submerge the existing location of that habitat. It is
expected that people from that habitat would move into this rehabilitation housing within two
months on condition that water must be made available to them. The BMC has promised that
it will provide a scheme to bring water to the rehabilitation colony in 2-3 years. But until
then a temporary plan needs to be in place to cover the rehab colony as well as Vihigaon.
We went to the sarpanch Shri Tukaram Lakshman Wagh‟s house. Other villagers too
joined in for a discussion. Some points from our
discussion
The vihigaon GP covers 1722 people and
375 homes
Rs 47 lakhs have been granted to the GP
for a temporary scheme. The tentative plan
for the scheme is to pump water from the
vaitrna river and dump the water in the well. Prof. Sohoni suggested that a good
portion of the water will percolate if water was dumped into the well and hence a
storage tank should be used instead.
The tanker water is also dumped in this well during summer months.
There is a second well uphill from Vihigaon main village, closer to two tribal habitats
– Nirgoonwadi and Dharyachiwadi. This
well which we visited has water all 12
months but is in a poor condition.
A borewell was dug close to this well,
which struck water but went bad. A second
borewell with a handpump was made next
to it. The handpump is operational.
Page 76
63
The well was in a state of disrepair. There was a small spring flowing next to the well.
The well has water all round the year but currently cattle use this water and so the
water is not sufficient for the people and women have to go all the way to the river for
fetching water.
We walked upstream from the well towards a
check dam that was built close to the village
school. The checkdam present in the village
has foundation problem and the baseflow
exists along the checkdam but there is no
water storage.
NREGA work is done in the village but they seem to work on other activities –
perhaps fixing the check dam could be done through NREGA labour.
The sarpanch said that the uphill well water is only sufficient for the two uphill
habitats and not for the other habitats. Prof. Sohoni suggested that people should be
asked to stop taking their cattle to this well and perhaps then there would be sufficient
water available. But the sarpanch thought that the people would not follow this
instruction.
Prof. Sohoni suggested that the uphill well seemed to be very delicately placed and it
would not be advisable to deepen it or do any blasting there. He, however, suggested
that that access to the well should be improved and that it could be broadened. He did
not recommend using this well as a source for a single village drinking water scheme.
The sarpanch of the village is quite aware of the Ralegaon Siddhi village and its
developmental activities.
The ZP rationale for capital cost allocation were Rs.2300 per capita for tribal
population and Rs.1800 for Non-Tribal population.
Page 77
64
Table 7-13: Vihigaon secondary data
Name of the
habitat
Indivi
dual
PWS
Regio
nal
PWS
No of
Hand
pump
No of
functi
onal
hand
pump
No of
public
well
No of
functio
nal
public
well
Tank
er fed
Popula
tion
Eleva
tion
(m)
Baudhhabitat No No 0 0 0 0 No 134
Bhendichiha
bitat
No No 0 0 0 0 No 90
Chinchhabita
t
No No 0 0 0 0 No 95
Daryachehab
itat
No No 1 1 1 1 No 180
376
Dhubhachiha
bitat
No No 0 0 0 0 No 97
Hiwalhabitat No No 0 0 0 0 Yes 110
Kathodwada No No 0 0 1 1 No 90
Katkarihabita
t
No No 0 0 1 1 No 78
Kavthyachih
abitat
No No 0 0 1 1 Yes 110
Nirgoodhabit
at
No No 0 0 0 0 Yes 98
352
Panavthahabi
tat
No No 0 0 0 0 No 110
Rajwada No No 0 0 0 0 No 114
Telampada No No 0 0 2 2 Yes 364
Vihigaon No No 0 0 1 1 Yes 221 369
Shidhabitat No No 1 1 0 0 Yes 92
Source: GOM
Page 78
65
Table 7-14: Vihigaon population data
Name of the
habitat
Total
Population
ST
population
SC
Population
No of
Households
No of
Cattles
Baudhhabitat 134 44 90 23 24
Bhendichihabitat
Chinchhabitat 95 0 95 53 250
Daryachehabitat 180 0 180 28 100
Dhubhachihabitat
Hiwalhabitat 110 0 110 81 190
Kathodwada 90 0 90 23 50
Katkarihabitat 78 0 78 20 30
Kavthyachihabitat
Nirgoodhabitat 98 0 98 95 285
Panavthahabitat
Rajwada 114 50 0 null null
Telampada 364 0 340 110 100
Vihigaon 221 221 0 221 67
Shidhabitat
Source: DDWS
Vashala grampanchayat
The Vashala gram panchayat has 7 habitats and it is located in Shahapur block. It is
very close to the Dhakne gram panchayat which was visited in the first field visit.
Figure 7:11: Vashala Grampanchayat
Page 79
66
Vashala (bk) has about 150 homes. There is a river ½ km away where women go to
wash clothes. This river is expected to dry in a month (by Dec/Jan) after which they will have
to go ~3km away to Bhatsa river. The drinking water source of the village is well and people
use the river, nallah for washing. In this village a spring is present and each household is
given number. This number is used to determine the queue to access water from the spring.
Tokarkhand is a non tankerfed
habitation. It has a check dam that was built
10 years ago which has been successful.
There are two checkdams near Tokarkhand,
the one constructed by the gram panchyat
appears to be in good condition and water is
available.
There is water in this reservoir all 12
months however this water is not fit
for drinking because it is made dirty
by improper use (clothes washing
etc).
There is a well downstream from this
check dam which has water till about
May-Jun.
A second check dam was built downstream from this well, but it turned out to be a
failure. We could spot cracks in the wall of the check dam and it is possible that it was
not deep enough. The one constructed by the ZP is poorly constructed and has no
water in it and also it is in the downstream of gram panchayat check dam.
Page 80
67
Table 7-15: Vashala secondary data
Name of
the habitat
Indivi
dual
PWS
Regio
nal
PWS
No of
Hand
pump
No of
functi
onal
hand
pump
No of
public
well
No of
functio
nal
public
well
Tank
er fed
Popula
tion
Elevati
on (m)
Charanwad
i
No No 0 0 1 1 Yes 55
Kolipada No No 0 0 1 1 No 150
Raichewadi No No 0 0 1 1 Yes 75 280
Tokarkhan
d
No No 2 2 2 2 No 620
294
Umberwadi No No 0 0 1 1 No 50
Vashala
(Bk)
No No 0 0 4 4 Yes 382
303
Vashala
(Kh)
No No 0 0 1 1 Yes 275
Source: GOM
Table 7-16: Vasala population data
Name of the
habitat
Total
Population
ST
population
SC
Population
No of
Households
No of
Cattles
Charanwadi
Kolipada 150 0 0 39 0
Raichewadi 75 0 0 19 0
Tokarkhand 260 0 503 195 100
Umberwadi 50 0 0 13 200
Vashala (Bk) 382 71 157 99 215
Vashala (Kh) 275 23 221 33 0
Source: DDWS
Page 81
68
Appendix VII: Semi structured questionnaire
Name of Habitat:
Name of Gram Panchayat:
Location: (Coordinates):
Name of Sarpanch:
Name of Gram Sevak:
Number of households:
Number and types of communities:
Number of shops in the wadi:
Presence of school: Yes/No
Type of school:
Literacy rate:
Activity pertaining to NREGA:
Main Occupation :
List of water sources:
Coordinates of drinking water sources:
Seasonality of drinking water sources:
Number of private borings or handpumps:
Average amount of water per person:
Activities of water shed development:
Functionality of the hand pumps:
Tankerfed status:
When the tanker did last come to the habitat?
Where is the tanker water stored and how it was distributed?
Number of people working for private companies (labourers):
Number of people with government jobs:
Awareness about jalswarajya and other related projects:
Contacts in the wadi