Page 1
Access to Electronic Thesis Author: Mr Sifat Momen
Thesis title: Design and Modelling of Decentralised Task Allocation Mechanisms In Groups of Mobile Agents
Qualification: PhD
This electronic thesis is protected by the Copyright, Designs and Patents Act 1988. No reproduction is permitted without consent of the author. It is also protected by the Creative Commons Licence allowing Attributions-Non-commercial-No derivatives. If this electronic thesis has been edited by the author it will be indicated as such on the title page and in the text.
Page 2
THE UNIVERSITY OF
SHEFFIELD
DESIGN AND MODELLING OF DECENTRALISED TASK
ALLOCATION MECHANISMS IN GROUPS OF MOBILE
AGENTS
SIFAT MOMEN
October 2011
Submitted for the Degree of Doctor of Philosophy
Department of Computer Science
The University of Sheffield
Page 3
1
Declaration
I declare that this report is composed by myself and the work contained herein is my
own except where explicitly stated otherwise in the text. This work has not been
submitted for any other degree or professional qualification except as specified.
Sifat Momen
Page 4
2
Dedicated to my parents,
Professor A.M. Mominul Huq (Abbu) and
Mrs Rehana Nazneen (Ammu)
for their endless support and motivation
Page 5
3
Abstract
Division of labour is a fundamental field of research within the context of multi-
agent (particularly swarm based systems) and multi-robot systems. Eusocial insects,
for instance ants and bees, are known to display remarkable capabilities of allocating
tasks to nest mates when the colony gets perturbed by any internal and/or external
factors. Proper understanding of the underlying mechanisms of division of labour
among these social insects would enable more effective designing and developing of
artificial swarm based systems which in turn can be used in tackling various real
world problems. At the same time, a properly built model can be used to serve as a
platform for the biologists to test their research hypotheses. These key benefits have
been the prime motivations of this thesis. The thesis is based on the behaviour of ant
colonies and especially on how they allocate tasks in different situations. The
objectives of the thesis are twofold: (1) to develop an artificial simulated system that
is ant-like and (2) to explore, identify, develop and analyse task allocation strategies
within the realms of colony performance.
The first objective of the thesis is approached by investigating the behaviour of ant
colonies from the existing literature and modelling their behaviours using an agent
based modelling approach. To determine whether the model has met the first
objective, three questions are posed: (A) Is the emergent system scalable? (B) Is the
emergent system flexible? and (C) Is the system robust? For a system to be ant-like,
the system has to not only give the appearance of ant-like behaviour but also has to
meet these three criteria. As a part of the second objective of the thesis, three task
allocation strategies based on ant colony behaviour are proposed. Furthermore, the
Page 6
4
strategies are critically analysed to investigate the benefits of each of the strategies
and also to discover under what circumstances which strategies would perform
better. The research reported in this thesis is intended to provide a better
understanding of the design issues of task allocation strategies thus enabling
researchers to use this as a guide to design effective task allocation strategies within
the concerned multi-agent systems.
Page 7
5
Acknowledgements
It has been over three and half years since I started my PhD and I am delighted that it
is finally over! During my time here, I have come across many beautiful people,
whose support and encouragement has always been a key source of inspiration to
achieve my goal. This thesis would not be complete without their generous help.
First and foremost, I would like to express my gratitude to Dr. Amanda Sharkey, my
PhD supervisor. It is simply impossible to thank her using mere words. She was
extremely patient, prompt and thorough while reading the thesis. Over the past three
and half years, she has been very kind and generous. I truly appreciate the constant
guidance and the freedom to choose my research direction that she gave during the
PhD period.
After the completion of my MSc, I approached Dr. Bala P. Amavasai for a research
job within his lab. I would like to thank Bala for giving me the opportunity to work
with him. It was during this time, I got involved with modelling of natural systems
and became interested in artificial life and particularly Swarm Intelligence that really
led me to make up my mind to pursue PhD studies in this field.
I am also extremely grateful to my PhD advisor, Professor Noel E. Sharkey.
Discussions with Noel have always helped me to generate new ideas. His critical
remarks, suggestions and vision have played a very important role in shaping my
thesis. Thank you Noel.
Many thanks to Professor Nigel R. Franks for kindly signing me up as a visiting
researcher at AntLab, based in School of Biological Sciences, University of Bristol.
It was great working with him. Thanks a lot to Elizabeth Franklin for showing me
how biologists conduct experiments and also participating in joint experiments with
Page 8
6
me. I am also thankful for various reasons to other lab members including Tom
Richardson, Dr. Ana Sendova-Franks, Dr. Silvia Perez-Espona and Dr. Nathalie
Stroeymeyt.
Within Sheffield, I was blessed with a lot of research colleagues who made my stay
here very enjoyable:
• Gandong Hou: Thank you Gandong for all the discussions we used to have
about ants.
• Kumutha Swampillai: Kumutha, thanks a lot for motivating me in many
ways. You were always there in the lab during the late nights giving me the
assurance that I am not the only one working at this hour.
• Wei Wei Cheng: Thanks Wei Wei for everything. I will miss the lunch break
we used to have together everyday.
• Jiaming Zhang: Many thanks, Jiaming, for everything you did for me.
• Dr. Gang Lu, Dr. Sanaz Jabbari and Dr. Miguel Salas: Thanks a lot for your
supports and the motivation you gave me.
I am grateful to the Department of Computer Science and to all the members here
especially Prof. Phil Green, Prof. Roger Moor, Dr. Dawn Walker, Dr. Richard
Clayton, Dr. Siobhan North, Dr. Victoria Uren, Dr. Stuart Wrigley, Dr. Gordon
Manson and Dr. Guy Brown who have supported and/or encouraged me in various
ways. I am also grateful to the department for awarding me the ‘University of
Sheffield Fee Scholarship’ – without which it would have been impossible for me to
undertake this programme. Thank you University of Sheffield for awarding me the
‘Excellence Exchange Scheme Award’ that allowed me to visit AntLab.
Page 9
7
I would like to thank my parents to have always had faith in me and supported me in
times of distress. It is impossible to fully express my gratitude to you. Thank you for
everything.
Finally, I would like to thank Almighty Allah for His help in everything.
Page 10
8
Table of Contents
1 Introduction 21
1.1 Inspiration from biological behaviour 24
1.2 Thesis 25
1.3 Contributions 29
1.4 Organisation of the thesis 30
2 Swarm Intelligence and Self-Organisation in Multi-Agent
Systems
31
2.1 Swarm Intelligence 32
2.2 Self Organisation 33
2.2.1 Basic Ingredients of self-organisation 35
2.2.2 Direct and Indirect Communication 37
2.3 Examples of self-organisation in natural systems 37
2.3.1 Flocking of Birds 37
2.3.2 Slime Mold Aggregation 39
2.3.3 Spreading of Rumours 40
2.3.4 Flashing of fireflies 43
2.3.5 Nicaraguan sign language 45
2.3.6 Crowd Dynamics 45
2.4 Self Organisation in Social Insects 46
2.4.1 Social Behaviour in insects 46
2.4.2 Foraging behaviour in Ants 48
2.4.3 Nest Construction in ants 51
Page 11
9
2.4.3.1 A mathematical model for the wall
construction of L. albipennis
52
2.4.4 Honeybees 54
2.4.5 Mound building by termites 55
2.5 Swarm Robotics 57
2.5.1 Features of Swarm-Robotic System 59
2.5.2 Approaches to swarm robotics research 60
2.5.2.1 Simulation Approach 60
2.5.2.2 Real Robot Approach 61
2.5.3 Collective and cooperative behaviour in swarms of robots 62
2.5.3.1 Self Organised task allocation/Collective foraging 62
2.5.3.2 Nest Construction 65
2.5.3.3 Stick Pulling Experiment 67
A. Algorithm 67
B. Communication 69
2.5.3.4 Cooperative Box Pushing 70
2.5.3.5 Animal-Robots Collective Intelligence 71
2.6 Summary and Conclusion 75
3 Task Allocation in Multi-Agent Systems 77
3.1 Division of labour in Social Insects 78
3.1.1 Sociality in Insect Societies 79
3.1.2 Division of labour in ants 80
3.1.2.1 Worker Polymorphism (Physical Castes) 81
3.1.2.2 Age Polyethism 81
Page 12
10
3.1.2.3 Individual Variability 82
3.2 Models of Division of labour in ants 82
3.2.1 Fixed response threshold model 83
3.2.2 Specialisation 87
3.2.3 Physiological Specialisation 88
3.2.4 Foraging for work model 88
3.3 Task Partitioning and division of labour 89
3.3.1 Categories of tasks 91
3.3.2 Examples of Task partitioning 92
3.3.2.1 Tasks not partitioned 92
3.3.2.2 Tasks sometimes partitioned 92
3.3.2.3 Transfer at the foraging area 93
3.3.2.4 Transfer at the nest 93
3.3.3 Direct and Indirect transfer of food between transporters
and foragers
93
3.3.3.1 Costs and benefits in task partitioning 94
3.3.4 Bucket brigading in social insects 95
3.4 Task preference in relation to caste 96
3.5 Task allocation in robotics 100
3.6 Intentional task allocation approach 109
3.7 Summary and Conclusion 111
4 A Flexible Task Allocation Model for a Swarm of Simulated
Agents
114
4.1 Modelling Approaches 116
Page 13
11
4.1.1 Modelling Environment 119
4.2 Description of the Model 120
4.2.1 Nest 122
4.2.2 Behavioural Rules 123
4.2.2.1. Brood 123
4.2.2.2. Brood Carers 126
4.2.2.3. Foragers 126
4.3 Task switching mechanism 127
4.4 Parameters Used 130
4.5 Measure of Performance 132
4.6 Results Obtained 136
A. Is the system scalable? 136
B. Is the system flexible? 138
C. Is the system robust? 147
4.7 Discussion 149
4.8 Conclusion 150
5 Performance Analysis of Explicit and Indirect Communication 152
5.1 Communication in eusocial insects 153
5.1.1 Visual Communication 155
5.1.2 Acoustic communication 155
5.1.3 Magnetic orientation 156
5.1.4 Tactile communication 157
5.1.5 Chemical communication 158
5.1.6 Classification of communication methods 159
Page 14
12
5.2 Communication and Specialisation 160
5.3 Proposed Model 164
5.4 Experiments and Results 169
5.4.1 Performance Measure 171
5.4.2 Results 173
5.4.3 Variation of the state of the agents with respect to the
demand of the colony
185
5.5 Conclusion 187
6 Task Allocation Model for a Swarm of Hybrid Agents 189
6.1 Proposed Model 192
6.1.1 Behavioural Rules 192
6.2 Experiments and Results 196
6.3 Conclusion 205
7 Discussion 207
7.1 Results 208
7.1.1 Implications of the results 210
7.2 Comparison of our models with other relevant
models/experiments in the literature
211
7.2.1 Differences 211
7.2.2 Similarities 212
7.3 Conclusion 217
Page 15
13
8 Conclusions 218
8.1 Approach to the problem 219
8.2 Summary of the thesis 220
8.3 Contributions 224
8.4 Future Works 227
Bibliography 229
Page 16
14
List of Publications
The following list includes the list of publications made by the author which are
related to this thesis:
Conferences
Momen, S. and Sharkey, A.J.C. (2008), An ant-like task allocation model for
heterogeneous groups of robots, IUSSI 2008: 4th
European Meeting for the
International Study of the Social Insects, 117.
Momen, S. and Sharkey, A.J.C. (2009), An ant-like task allocation model for a
swarm of heterogeneous robots, The 2nd
Swarm Intelligence Algorithms and
Applications Symposium, 31 – 38.
Momen, S. and Sharkey, A.J.C. (2009), Strategies of division of labour for
improving task efficiency in multi-robot systems, IEEE World Congress on Nature
and Biologically Inspired Computing (NABIC’09), 672 – 677.
Momen, S. and Sharkey, A.J.C. (2010), From ants to robots: a decentralised task
allocation model for a swarm of robots, The 3rd
Swarm Intelligence Algorithms and
Applications Symposium, 3 – 11.
Momen, S. and Sharkey, A.J.C. (2010), Design and analysis of a decentralised task
allocation model for a swarm of simulated mobile robots, Amorphous Computing
and Complex Biological Networks, 3.
Page 17
15
Posters
Momen, S. and Sharkey, A.J.C. (2009), An ant like task allocation model for a
swarm of heterogeneous robots, Poster presented at the research away day, Sheffield
University, Sheffield, UK.
Momen, S. and Sharkey, A.J.C. (2010), Flexible task allocation model inspired by
ant colony behaviour, Poster presented at the research away day, Sheffield
University, Sheffield, UK.
Page 18
16
List of Figures
1.1 Examples of self-organised collective behaviour 22
2.1 Formation of Bénard convection cells 34
2.2 Pattern formation in the B-Z reaction 34
2.3 Proportion of passers-by looking up as a function of the size of the
stimulus group
36
2.4 Flock of simulated boids 38
2.5 Slime mold aggregation 40
2.6 Propagation of rumours 42
2.7 Spreading of rumour as a function of time 43
2.8 Synchronous flashing of fireflies building up over night 45
2.9 Ant foraging Mechanism 50
2.10 Dropping/picking function with respect to r when DM = 5, PM = 4 and
r0 = 3
53
2.11 Snapshots of the building of termite mounds 57
2.12 Experimental Setup [Krieger and Billeter, 2000] 63
2.13 Basic Mission Cycle of a robot [Krieger and Billeter, 2000] 64
2.14 Finite state machine for the blind bulldozer controller [Parker et al.,
2003]
66
2.15 Flowchart of the algorithm 68
2.16 Schematic diagram of the stick pulling experiment 69
2.17 The Experimental Setup [Halloy et al., 2007] 74
3.1 Variation of response threshold function with respect to the stimulus 86
3.2 Response threshold function as a function of stimulus and threshold 86
Page 19
17
3.3 A schematic diagram of a two – stage partitioned task 90
3.4 Various form of foraging retrieval 96
3.5 Possible task switching transition for red harvester ants 99
4.1 Snapshot of the model 122
4.2 Hunger rate distribution across brood members of the brood in one of
the runs
124
4.3 Shouting chemical emitted by hungry brood members 124
4.4 Hunger level of a brood member as a function of time 125
4.5 Average hunger level of the brood 135
4.6 Average hunger level of the brood as a function of the swarm size 137
4.7 QQ plot for brood size = 5 and (a) S = 20, r = 0.2, (b) S = 20, r = 0.5,
(c) S = 30, r = 0.5, (d) S = 30, r = 0.9
142
4.8 Variation of foragers and brood carers in order to respond to the
changing demand by the brood
146
4.9 Robustness of the model 148
5.1 State transition for foragers and brood carers 166
5.2 Average hunger level of the brood 173
5.3 Average hunger level for both types of communication (brood size =
5, r = 0.9)
177
5.4 Average hunger level for both types of communication (brood size =
15, r = 0.9)
177
5.5 Average hunger level for both types of communication (brood size =
25, r = 0.9)
178
5.6 Variation of the numbers of foragers and brood carers 186
6.1 Finite state machine for biased brood carers 194
Page 20
18
6.2 Average hunger level for Nb = 20 199
6.3 Average hunger level for Nb = 60 199
6.4 Average hunger level for Nb = 80 200
6.5 Average hunger level for Nb = 20 (harsh) 204
6.6 Average hunger level for Nb = 60 (harsh) 204
6.7 Average hunger level for Nb = 80 (harsh) 205
7.1 Variation of foragers and brood carers 216
Page 21
19
List of Tables
2.1 Classification of Insect Societies 48
3.1 Costs of direct transfer and indirect transfer of food 94
3.2 Different strategies of foraging 103
4.1 Parameters used in the model 132
4.2 Mean Hunger Level 139
4.3 Mean Hunger Level 139
4.4 Normality tests on data sets with brood size = 5 141
4.5 Kruskal Wallis Tests for brood size = 5 144
5.1 Classification of simple and complex societies 161
5.2 Parameters used in the experiments 170
5.3 Mean Hunger Level (Indirect communication) 173
5.4 Mean Hunger Level (Indirect communication) 174
5.5 Mean Hunger Level (Explicit communication) 174
5.6 Mean Hunger Level (Explicit communication) 174
5.7 Results for the Kruskal Wallis test 176
5.8 Mann Whitney tests between indirect and explicit communication
for brood size = 5
180
5.9 Mann Whitney tests between indirect and explicit communication
for brood size = 15
181
5.10 Mann Whitney tests between indirect and explicit communication
for brood size = 25
183
5.11 Summary of the significance tests between the performance of
the explicit and indirect communication techniques
183
Page 22
20
6.1 List of Parameters 198
6.2 Average hunger level at the end of the simulation 198
6.3 Result of the Mann Whitney tests for Nb = 20 201
6.4 Result of the Mann Whitney tests for Nb = 60 202
6.5 Result of the Mann Whitney tests for Nb = 80 203
6.6 Average hunger level after the 5000th simulation time step (harsh
condition)
205
Page 23
21
Chapter 1
Introduction
Flocks of birds meandering in the evening light, armies of ants marching for
foraging, herds of buffalos congregating to avoid predators, synchronised flashes
from male fireflies tempting to attract the female ones or even pods of dolphins
dancing up and down in unison are some of the spectacular examples of collective
behaviours [Camazine et al., 2001; Garnier et al., 2007; Momen and Sharkey, 2010;
Sumpter 2010, 2006] that animals display. Their behaviours are not only enthralling
to watch (figure 1.1) but are also some of the finest examples of how individuals
form groups which allow them to work as a whole [Sumpter and Brännström, 2008]
to carry out tasks that would otherwise not be accomplished by a single individual
with the same efficiency. Individuals in a swarm system neither possess any global
template of the environment nor follow any particular leader. Instead, they behave as
reactive individuals trying to synchronise with the immediate neighbours through
some simple local interactions. Such local cohesion among the agents facilitates the
tendency to become a part of a group which consequently benefits the animal
societies in numerous ways including (1) the possibility of minimizing danger from a
potential predator, (2) accomplishing tasks that are otherwise difficult to carry out,
(3) improving the chances of finding a mate and also (4) transferring vital
information within the group quickly [Alcock, 2001; Hamilton, 1971, Krause and
Ruxton, 2002].
Page 24
22
a
B
c d
Fig 1.1: Examples of self-organised collective behaviour. a) a team of ducks (provided by Nafi
Ahmed), b) a flock of birds in Milan, c) a crowd of people in front of Notre Dame Cathedral, Paris, d)
traffic flow in busy Beijing. Photos (b) – (d) are provided by Lei Ye. All photos used with permission.
Research studies pertaining to animal behaviour provide many key strategies and
techniques for various engineering problems and applications and thus have inspired
many engineering and applied disciplines for many years. Use of similar biological
principles in various research fields resulted in many interdisciplinary researches
across those disciplines. Swarm intelligence (SI) [Bonabeau et al., 1999] and swarm
robotics (SR) [Beni, 2005a; Sharkey, 2007, 2006], the robotics application of SI, are
one such field of science that emerged, in recent times, as a result of these
interdisciplinary studies. The concept of SI is strongly inspired by the collective
behaviour of animals and especially by that of the eusocial insects [Wilson, 1971]
and studies how a large number of relatively simple agents use repeated local
interactions between the neighbouring individuals and with the environment in the
vicinity to create a collectively intelligent system.
Page 25
23
A swarm system can be regarded as a subset of multi agent systems (MAS) having
the following features [Şahin, 2005]:
Autonomous agents: The agents are fully autonomous i.e. they operate without
others having any direct control over their actions and internal state.
Large number of agents: There should ideally be a large number of homogeneous
agents in a swarm system. A system can be heterogeneous but each heterogeneous
group should ideally have large number of redundant agents.
Simple agents: The abilities of individual agents are extremely limited in the sense
that they either cannot carry out a particular task on their own and even if they can,
the deployments of swarms of agents dramatically improve the performance of the
system.
Local interactions: Ideally, no agents should have a global view of the environment.
They can only communicate with each other and with the environment within a short
radius compared to the size of the environment and that there should not be any
single agent that controls the execution of other agents. This ensures that 1) the
behaviour that emerges is not a product of a single individual rather a cumulative
effect of many local interactions between individuals and 2) there is no dependency
on any particular agent i.e. there is no single point of failure (and hence the system is
robust to individual failure).
Page 26
24
Emergent Behaviour: This property is the hallmark of any swarm system [Gilbert
and Troitzsech, 2005]. By the process of multiple interactions and the behavioural
rules individuals follow, a collective behaviour is produced. Individual agents
behave as “dumb” agents unaware of the global environment but the behaviour that
emerges out through this process is an intelligent one that enables the agents to
adjust themselves to the changing environment.
1.1 Inspiration from biological behaviour
Natural systems (in our case, the collective behaviour of animals), by the process of
natural selection [Darwin, 1859], have been evolving for over hundreds of millions
of years and by now it is expected that they have built strategies that would allow
them to develop systems that are extremely stable and adaptive to the changing
environment. Systems developed by mimicking these biological behaviours within
an artificial environment provide engineers and scientists with some inherent
benefits including:
Robustness: Robustness refers to the ability of a system to continue to operate
despite failures by the individuals or any perturbations in the environment [Şahin,
2005]. A large number of redundant identical agents coupled with decentralised
coordination allows a swarm system to be robust.
Flexibility: Individuals in the environment are not fixed to any particular task but
are flexible. This allows the system as a whole to adapt and hence react to any
perturbations caused during the course of its operation.
Page 27
25
Scalability: Since the system is completely decentralised, it is easy to either add or
remove agents without affecting the overall operation of the system.
On the other hand, the swarm systems developed by engineers can provide a unique
platform that allows the biologists to formulate theoretical concepts underlying the
principles of collective behaviour within animal groups [Webb, 2008; Webb, 2000].
1.2 Thesis
This thesis looks into the area of task allocation (TA) in a multi-agent system. Task
allocation refers to the way tasks are chosen, assigned, subdivided and coordinated
within a colony and are often referred to as a salient feature underlying the
organisation and the success of a society [Anderson and McShea, 2001; Bourke and
Franks, 1995; Jeanson et al., 2007; Momen and Sharkey, 2009a; Smith, 1776;
Wilson and Hölldobler, 2008]. It is known to be an extremely important and
fundamental area of research within the context of multi-agent and multi-robot
systems. Eusocial insects (such as ants and bees) are known to display remarkable
capabilities of allocating tasks to nest mates within a changing environment [see for
example Gordon, 1999; Schmickl and Crailsheim, 2008a, b, c; Wilson and
Hölldobler, 2008]. A proper understanding of the underlying mechanisms of task
allocation within social insects would lead to effective design and development of
task allocation in multi-agent systems (more specifically swarm based systems)
which in turn could be used in many real world problems. At the same time, such
effective designs are envisioned to provide a new platform for biologists to
theoretically test their research hypotheses. These advantages that a properly
Page 28
26
designed task allocation system can possibly bring have motivated us to undertake
research in this direction. Social insects and typically ant colonies are known to
display a wide range of task allocation strategies under different circumstances. This
thesis, therefore, is strongly inspired by the mechanisms by which ant colonies
distribute and re-distribute work forces within a stochastic environment. The
objectives of this thesis are twofold: (1) To develop an ant-like system which is
flexible, scalable, robust and decentralised, and (2) to explore, identify, develop and
analyse task allocation strategies within the realms of colony efficiency. The first
objective of the thesis is approached by investigating the behaviour of ant colonies in
the existing literatures and modelling their behaviours using agent based modelling
approach. Agent based modelling approach enables us to visualise how the colony as
a whole behaves with the given set of rules. To establish whether the model has met
the first objective, three questions are considered: (A) Is the emergent system
scalable? (B) Is the emergent system flexible? and (C) Is the system robust? For a
system to be ant-like, the system not only has to give the appearance of ant-like
behaviour, but also has to meet these three criteria. As a part of the second objective
of the thesis, three task allocation strategies developed in the light of ant colony
behaviour, have been proposed. Furthermore, the strategies are also empirically
investigated in order to establish the circumstances under which they work better.
This research could help engineers select appropriate strategies for the particular
task allocation problem they are encountering as well as helping biologists to
understand the underlying mechanisms of social insect behaviour and the benefits
that different task allocation strategies can bring.
Although it is common to find that engineers (and especially the roboticists) model
the behaviours of social insects on swarms of simple robots in order to analyse and
Page 29
27
understand the animal behaviour as well as to solve engineering problems, the
purpose of this thesis is not such. The models developed on robots tend to be fairly
simple due to various limitations of the current technologies in robotics and
electronics. This, however, becomes a limitation for understanding more complex
behaviours that are available in nature. Hence we have chosen not to explore the
mechanisms using real robots. However, in future, we intend to translate the models
developed in this thesis within the realms of robotics for practical applications. It
should also be noted that the models developed in this thesis are not specific to any
particular ant specie. Rather, it is in line with one of the main objectives of the thesis
i.e. to identify and incorporate ant-like behaviour exhibited by different species of
ants and design a flexible, scalable, robust and decentralised system.
The three task allocation strategies can be briefly outlined as follows. Ant colonies
exhibit various strategies and mechanisms to divide labour (on the fly) depending on
the task demand. Three mechanisms have been derived from the observations of the
social insects which are then evaluated in terms of the performance yielded:
Strategy 1 (Indirect communication): Within the first strategy, the agents interact
with each other locally but only via the environment. Such sort of indirect
communication (i.e. communication via the environment; also called stigmergic
interaction) is a very common mechanism in social insects [Grassé, 1959].
Strategy 2 (Explicit communication): In this strategy, the agents not only
communicate with each other indirectly but also communicate explicitly when some
sort of crisis is experienced. Such behaviour has been reported in many social insects
Page 30
28
including Leptothorax albipennis while house hunting and red harvester ants,
Pogonomyrmex barbatus. Direct communication comes in many forms [Jackson,
2006] including tactile, visual, acoustic, waving antennae and also touching
antennae. However, one of the common forms of direct communication is that of the
antennae to antennae communication in order to access a nest mate’s cuticular
hydrocarbon profile to know what task the other agent is carrying out. For the second
strategy, the mechanism of antennae- antennae interaction has been adopted in the
model for direct communication.
Strategy 3 (Hybrid System): In this strategy, a heterogeneous system has been
developed within a particular caste. Two types of brood carers (i.e. two different
control architectures) have been developed. In one case, the brood carers are not
affected by the need for switching to foraging task (type A brood carers). These
brood carers are dedicated to their own principal tasks (i.e. feeding brood members
when required). The second type of brood carers, type B brood carers, is flexible and
can switch tasks whenever required. The hybrid system contains both the kinds of
brood carers. A detailed description of the control structures of the two types can be
found in Chapter 6.
These three strategies have been developed within a 2D artificial world. Once the
models are developed, it allows us to explore the models and critically investigate
the advantages of the different strategies in different circumstances.
Page 31
29
1.3 Contributions
The following list highlights the main contributions of the thesis:
(1) A simulation environment has been developed that permits the exploration of
several questions about the way task allocation can be accomplished in a multi-agent
system and their effect on the performance of the colony. Furthermore, a set of
behavioural rules for the agents have been established by taking inspirations from the
behaviour of social insects (particularly ants). The experimental results are then
analysed and were found that the emergent behaviour that arises from these simple
behavioural rules share similar features to that of the real ant colonies (scalability,
flexibility and robustness).
(2) Three task allocation strategies have been identified, implemented and afterwards
analysed to investigate the effect of each of the strategies on the performance of the
colony.
(3) The performance of the colony is critically analysed to understand and
investigate the strengths of different task allocation strategies.
The investigation that has been made in this thesis would help researchers in two
main ways: (1) it would enable researchers to easily change many parameters as well
as the strategies of task allocation to see how would these effect the colony and (2) it
would also shed light to understand the advantages of different task allocation
strategies under various conditions – allowing researchers to effectively choose task
allocation strategy within their domain.
Page 32
30
1.4 Organisation of the thesis
The thesis has been subdivided into eight chapters: the first one of which is the
introduction. Chapter 2 introduces the background concepts of swarm intelligence
and self organisation. It discusses the key ingredients of self organisation and
provides a set of examples of self organised behaviour exhibited in nature. Following
chapter 2, in chapter 3 a detailed discussion related to division of labour in social
insects and swarm robotics has been made. Chapter 4 introduces the model and
analyses the behaviour that emerges out of it. Chapter 4 discusses the behaviours of
the agents in detail, and provides an account of the behavioural rules that lead to a
self-organised adaptive system. In chapter 5, the model presented in chapter 4 is
extended by incorporating direct communication between agents (which can be
found in many ant species). Furthermore, a detailed comparison between the two
models (the one in which agents exhibit indirect communication only and the other
in which agents exhibit explicit communication) is undertaken in order to understand
the benefits of each strategy. Chapter 6 discusses the development of the third
strategy where some agents within a particular caste are made less flexible. The
chapter also empirically investigates if the total degree of flexibility in agents always
leads to a better performance within the colony than that of a heterogeneous system
where some agents have limited degree of flexibility. Chapter 7 reviews and reflects
on the results obtained in chapters 4 – 6. Furthermore, it compares the results
obtained in our model with that found in the literature. Finally, chapter 8 concludes
the thesis with discussions about possible future directions.
Page 33
31
Chapter 2
Swarm Intelligence and Self-Organisation in
Multi-Agent Systems
The research presented in this thesis is strongly inspired by the self-organising
behaviour of social insects in which individual agents follow some specific rules to
create a collectively intelligent system. Before a description of our models and the
experimental results are given, an understanding of the key ideas regarding self-
organisation is deemed necessary. This chapter along with Chapter 3 serves that
purpose. In this chapter, the concepts of swarm intelligence and self-organisation are
explained. The remainder of the chapter is organised as follows: Section 2.1
introduces the concept of swarm intelligence followed by the principles of self-
organisation. Section 2.3 looks into a wide range of self-organising behaviour
noticeable in nature followed by some specific examples of self-organising
behaviour exhibited by social insects (section 2.4). Recently, there has been
enormous interest among researchers within the robotics community in incorporating
the self-organising behaviour observed in the natural world into robotics research.
This is due to the fact that natural swarms suggest some key solutions to various
design issues. On the other hand, swarm robotics (robotics application of swarm
intelligence) research provides biologists with a unique platform to rigorously test
their hypotheses. In section 2.5, we turn our attention to see how some of the
Page 34
32
biological behaviours have been incorporated into swarm robotics research. Finally,
a summary and conclusion of the chapter is drawn in section 2.6.
2.1 Swarm Intelligence
Swarm intelligence has been defined as “a paradigm for designing ‘intelligent’
systems as a result of cooperation among a relatively small number of simple,
identical, autonomous units, interacting without common clock, typically at short
range and without centralised control”[Beni 2005b]. Although Beni’s definition
describes the number of autonomous units involved as small (he described units in
the range of 102 and 10<<23 as small since he compared the number of units involved
with respect to Avogadro Constant), it is generally considered to be large by many
other researchers [Camazine et al., 2001; Şahin, 2005]. Furthermore, Beni considers
the units involved to be identical (i.e. homogeneous in nature), but heterogeneous
mixtures of agents are prevalent in natural systems and fit well within the swarm
intelligence paradigm. Şahin suggests that a heterogeneous mixture in a swarm
system does not violate swarm intelligence paradigm given that there are relatively
large number of agents in each group [Şahin, 2005]. Beni pointed out that the word
‘intelligence’, in context of swarm intelligence, is actually to be used in a limited
sense [Beni, 2005a]. He suggested restricting “intelligence” to two of the qualities of
intelligence while describing swarm intelligence: (1) the ability to produce
something ordered from the unordered and (2) the unpredictability of the outcome.
There are numerous examples of swarm intelligent systems in nature [some of them
are discussed below]. The process by which these individual units (agents), with
limited capabilities, create an emergent behaviour is referred to as self-organisation
and is at the heart of any swarm intelligent system.
Page 35
33
2.2 Self Organisation
The term “self-organisation” was first coined by Ross Ashby [Ashby, 1947] in the
context of contemporary science and has been widely adopted by many researchers
and scientists in order to understand the aggregate behaviour in animal societies.
Self-organization can be seen as a pattern formation process in both physical and
chemical and also biological systems. Examples of physical and chemical pattern
formation include the circular pattern formation by the iron filings around a straight
current carrying conductor, size segregation of granular mixture of particles when
shaken [Rosato et al., 1987], the formation of Bénard convection cells (Fig. 2.1)
when heat is applied evenly to the bottom of the tray filled with a thin sheet of
viscous oil transforms and the spiral pattern formation by the Belousov-Zhabotinsky
reaction (Fig. 2.2). Biological pattern formation, on the other hand, is widely found
in nature and includes the v-shaped structure created by migrating geese, the
pulsating wave created by slime molds while aggregating and synchronous rhythmic
flashes created by fireflies.
Page 36
34
Fig 2.1: Formation of Bénard convection cells. Reprinted from [Getling and Brausch, 2003].
Fig 2.2: Pattern formation in the B-Z reaction
Camazine et al. [Camazine et al., 2001] define self-organization in the context of
biological systems as “a process in which pattern at the global level of a system
emerges solely from numerous interactions among the lower-level components of the
Page 37
35
system. Moreover, the rules specifying interactions among the system’s components
are executed using only local information, without reference to the global pattern.”
This means that each agent (lower-level component) follows some simple rules and
can interact only with the neighbouring agents and the environment in its vicinity.
The agents neither have any particular leader nor any prior knowledge of the global
template of the system. Following numerous interactions among the agents and the
environment in the vicinity, a pattern seems to emerge at the global level of the
system.
2.2.1 Basic ingredients of self-organisation
Various researchers [e.g. Bonabeau et al., 1997 and Camazine et al., 2001] have
pinpointed four constituents of self-organisation:
1. Positive feedback (amplification): It is a simple behavioural rule of thumb
that promotes the creation of a structure/pattern. Examples of positive
feedback include the recruitment and reinforcement process in social insects.
Simple positive feedback like “I go where you go” in birds, “I signal when
you signal” in fireflies and even “I do what you do” in humans play a major
role in building group patterns [Camazine et al., 2001]. In each of the cases,
the behaviour of an agent is affected by its surrounding neighbours. An early
investigation of whether such positive feedback mechanism is applicable in
humans or not was carried out by [Milgram and Toch, 1969]. In this
experiment, a stimulus group of people was planted to look up at a supposed
point of interest on a busy street and observed how many passers-by also
look up at the point to find out the interesting thing. Milgram and Toch found
Page 38
36
that the proportion of passers by who looked up (P) is a function of the size
of the stimulus group (C) (equation 2.1) (Fig. 2.3).
04.104.1
04.1
22.192.0
C
CP
+×
= (2.1)
Fig 2.3: Proportion of passers-by looking up as a function
Of the size of the stimulus group
2. Negative feedback: While positive feedback helps building up the pattern,
negative feedback helps stabilizing the pattern. Clearly if too many agents
move in one direction, it would soon result in an overcrowding of agents and
might even be a reason for the system to collapse. Such disaster is prevented
by negative feedback. Clearly, it is the mechanism by which a system is
regulated. For example, in slime mold aggregation, when too many slime
molds aggregate, they prevent themselves from further aggregation by
inhibiting the cAMP (cyclic adenosine 3’ 5’ monophosphate) receptors
(discussed later).
3. Multiple interactions: All cases of self-organisation rely on multiple
interactions as it enables to stabilize a pattern over time.
0
0.1
0.2
0.3
0.4
0.5
0.6
0.7
0.8
0.9
0 2 4 6 8 10 12 14 16
Size of the crowd
Pro
po
rtio
n l
oo
kin
g u
p
Series1
Page 39
37
4. Amplification of fluctuations: Self-organization relies on the amplification
of fluctuations as well. For self-organization, randomness is crucial since it
enables the discovery of new solutions, and fluctuations can act as seed from
which structures nucleate and grow [Bonabeau et al., 1997].
2.2.2 Direct and indirect communication
In a swarm system, agents communicate either directly or indirectly. Direct
communication by an agent/individual involves simple signalling mechanisms to
other agents without the need of any intermediary medium. Such signalling
mechanisms (in animal societies) come in various forms including that of chirping,
touching, visual pointing and even dancing. Indirect communication (also commonly
referred to as stigmergic interactions [Grassé, 1959]), on the contrary, involves
communication between agents via the environment. In stigmergic communication,
the signs left in the environment by an action (of an agent) stimulate the performance
of the next action by the same and/or different agents. Such interactions include the
use of chemicals to guide other agents or even simple bumping into some objects
triggering some behaviour.
2.3 Examples of self-organisation in natural systems
2.3.1 Flocking of Birds
Reynolds, in 1987, first developed a simulation model to mimic the flocking of birds
[Reynolds, 1987]. In his model, the boids (Reynolds called the generic simulated
flocking creatures "boids") exhibit three simple steering behaviours:
Page 40
38
1) Separation: steering to avoid crowding of local flock mates
2) Alignment: steering towards the average heading of local flock mates
3) Cohesion: steering to move towards the average position of the local flock mates
Using these three simple steering behaviours, boids are able to mimic the flocking of
birds. In the model, each boid behaves like an autonomous agent. Whenever it finds
agents within its range (flock mates), it adjusts its heading towards the average
heading of the flock mates (alignment) and then coheres towards the average
position (centre of mass) of the flock mates (cohesion). However, each agent
maintains a minimum separation distance. Therefore, if any agent comes too close
and the distance between the two agents becomes less than the minimum separation
distance needed to be maintained by the agents, they steer away from each other
(separation). In this way the agents maintain flying close to each other but not so
close that they collide with each other. Figure 2.4 shows the snapshots of the
flocking behaviour produced by boids using the netlogo simulator [Wilensky,
1998a].
a
b
Fig 2.4: Flock of simulated boids. a) the initial random position of the boids, b) the flocking
behaviour produced after some repeated interaction between the agents
Couzin and his colleagues [Couzin et al., 2002] proposed a model in which the
agents maintain three zones (zone of repulsion, zone of attraction and zone of
Page 41
39
orientation) and mapped the corresponding behaviour depending on the zone the
agent is in. By varying the radii of the three zones, they were able to show different
patterns.
Momen and colleagues [Momen et al., 2007] extended the Reynold’s model and
developed a model within the realms of heterogeneous groups of robots by taking
inspiration from mixed species flocking commonly observed among forest birds.
Other interesting flocking model include that by Ke Cheng and colleagues [Cheng et
al., 2009], Gokce and Şahin [Gokce and Şahin, 2009], Möslinger and colleagues
[Möslinger et al., 2010] and Celikkanat and Şahin [Celikkanat and Şahin, 2010].
2.3.2 Slime Mold aggregation
Slime mold is a unicellular organism that is popularly known for exhibiting a
remarkable interplay between unicellular and multicellular behaviour [Bonner, 1967,
1983; Camazine et al., 2001; Goldbeter, 1996; Schmickl and Crailsheim, 2007]. In
nature, the amoebas of the slime mold Dictyostelium discoideum feed on bacteria
and move randomly [Resnick, 1997]. However, if there is a scarcity of food and they
are starved, they change their behaviour dramatically and start to aggregate towards
each other, forming complex spatial patterns. It has been found that when slime
molds are starved, they generate a chemical substance called cyclic adenosine 3’, 5’
– monophospate (cAMP) which they release to their outside environment. The
amoebas then use the cAMP gradient to navigate towards each other forming a
multicellular organism called a slug. The cAMP produces a positive feedback and
helps in aggregating towards each other. It has also been found that higher cAMP
concentration leads to higher cAMP production. However if they continue
Page 42
40
aggregating this way, they soon will collapse down to a single point. Therefore, in
order to have stabilisation in the pattern, there must be a mechanism for negative
feedback. Although there is some disagreement among researchers, a popular belief
about the negative feedback is based on the assumption that high concentrations of
cAMP desensitize the cAMP receptor i.e. when the concentration of cAMP increases
above a threshold value, it seizes from aggregating further. Figure 2.5 shows the
snapshots of the resulting slime mold aggregation behaviour [Wilensky, 1998b]
formed by the positive feedback of the CAMP.
a b
Fig 2.5: Slime mold aggregation. a) Slime molds moving on their own when there is plenty of food
b) Slime molds aggregating into clusters when starved
2.3.3 Spreading of Rumours
Rumours are a form of social communication and their spreading often has severe
consequences on the perception of celebrities, financial markets and even a society
[Nekovee et al., 2007]. They can cause panic during wars and can create disaster in
stock markets. They can also be manipulated intentionally to disrupt competitor
Page 43
41
organizations. In recent times, economists have started looking at rumour from a
theoretical and an empirical point of view [Kosfeld, 2005].
Interestingly, the propagation of rumours exhibits self-organisation behaviour. This
was first suggested by Daley and Kendal [Daley and Kendal, 1965] at the University
of Cambridge and is now popularly known as the Daley –Kendal model (in short, the
DK model).
The DK model considers a closed homogeneously mixed population of size 1+N
where the members can fall into one of the three categories:
1. Ignorants (X): These are the members of the population who are currently not
aware of the rumour. Initially i.e. at time NXt == ,0 i.e. the model assumes
that initially there is only one rumour spreader and the rest are ignorant of the
rumour.
2. Spreaders (Y): These are the members of the population who are currently
actively involved in spreading the rumour to its neighbours. At 1,0 == Yt .
3. Stiflers (Z): These are the members of the population who have heard the
rumour but have stopped spreading it. (Initially, Z = 0).
Also, the model assumes that the population size is fixed i.e. at any time
1,0 +=++≥ NZYXt .
The rules of the model are as follows:
1. A spreader spreads rumour to one of its neighbours (who is an ignorant) at
each time step (positive feedback).
Page 44
42
2. An ignorant who hears the rumour becomes a spreader.
3. A spreader becomes a stifler whenever the spreader encounters another active
spreader or a stifler.
4. A stifler knows the rumour but refrains from spreading it (negative
feedback).
Positive and negative feedback on the course of the propagation of the rumours is
what creates an emergent pattern.
A similar model shows how the rumour is spread in a population (Wilensky, 1998c)
(Fig 2.6):
Fig 2.6: Propagation of rumours
Page 45
43
The graph below shows a fast spreading rate is followed by a slow spreading rate
over time. This is because as the rumour spreads in about half the population, the
number of ignorants becomes relatively less and hence the slow spreading rate.
`
Fig 2.7: Spreading of rumour as a function
of time
2.3.4 Flashing of fireflies
The flashing of fireflies has been one of the most hypnotic and wonderful
experiences for explorers and naturalists over hundreds of years. It is also one of the
classic examples of self-organization in biological systems. For North American
rover fireflies, the synchronous flashing is a result of the courtship that involves a
Morse-like code of alternating signals between the male and its mate [Camazine et
al., 2001].
In another specie (Pteroptyx malaccae), a Thai specie firefly, the synchronized
flashing is performed entirely by males and unlike the roving fireflies does not
involve any Morse-like communication. In fact, all the males appear to flash
simultaneously producing a stunning collective behaviour. The male P. malaccae
Page 46
44
resides on individual leaves causing the tree to glow at one instant and then go dark
in the next instant.
Experimental studies on the CNS of the male fireflies revealed that the rhythmic
flashing of the male fireflies is controlled by neural timing mechanisms in the brain
that oscillates at a constant frequency [Bagnoli et al., 1976, Case and Buck, 1963,
Case and Strause, 1978, Hanson et al., 1971]. Two techniques (Phase Advanced
Synchronization and Phase Delay Synchronization) have been found to be adopted
by these fireflies that result in synchronous flashing. Details of these two techniques
are available in [Camazine, et al. 2001] and [Buck, 1988].
Wilensky uses the concept of the neural timing mechanism to explain the
synchronous flashing of fireflies. In his model, each firefly maintains a clock of a
specific cycle length (species specific). Flashing occurs at the beginning of each
cycle and the clock is reset to zero once it has reached the maximum [Wilensky,
1998d]. At the start of the simulation, the fireflies were at a different point of their
cycle-length thus creating an irregular flashing throughout. But as the simulation
runs a more coherent flashing is observed. Each firefly looks at its neighbours to see
when they are flashing. When it perceives flashes from other fireflies, it resets its
clock to try to synchronize with the neighbouring fireflies. Over the time, fireflies
become more synchronized in flashing creating such hypnotic experience. Fig 2.8
depicts this behaviour.
Page 47
45
Fig 2.8: Synchronous flashing of fireflies building
up over night
2.3.5 Nicaraguan sign language
Nicaraguan sign language [Senghas and Coppola, 2001] is perhaps one of the most
fascinating examples of self organization in linguistics. Before the 1970s, there were
no deaf communities in Nicaragua. The deaf people were largely isolated and used
simple home signs to communicate with the family members. After the Sandinista
revolution, the government decided to form a community for deaf people in a place
called Managua. Although initially the Spanish sign language was introduced, the
project failed miserably. The participants were unable to understand the Spanish sign
language. However, as they started living in there, the school children started
communicating with each other through different gestures and over time that has
evolved into a new language.
2.3.6 Crowd Dynamics
Crowd dynamics have been studied for over three decades [Helbing et al., 2005;
Moussaϊd et al., 2010; Pelechano et al., 2008] and it is only recently that the self-
organization effects occurring in pedestrian crowd have been appreciated. Helbing
and colleagues [Helbing et al., 2001] used the self-organization mechanism to
Page 48
46
explain the principle of lane formation in oppositely moving pedestrians. In his
model, he described how pedestrians moving against the stream encounter frequent
and strong interactions. In each interaction, the encountering pedestrians move a
little aside in order to pass each other. A pedestrian also has strong affinity to other
pedestrians moving towards the same goal. These positive and negative forces form
lanes in a crowd of oppositely moving pedestrians. Similar lane formation
techniques were found to be displayed in the army ants [Couzin and Franks, 2002].
2.4 Self Organisation in Social Insects
So far, the concept of self-organization and how self-organization promotes structure
of pattern in biological systems have been explored. Now we turn our attention
towards the collective behaviour of social insects i.e. how social insects like ants,
bees and termites self-organise and participate in a decision making process. The
discussion begins by classifying insects in terms of their social behaviour and is
followed by a discussion of the collective behaviour of some of these insects. It
might be noted that there is an enormous number of examples of self organising
behaviour in social insects – however, only a few popular ones have been chosen to
depict the collective behaviours they exhibit.
2.4.1 Social behaviour in insects
Edward O. Wilson, in 1971, proposed to classify insect societies into four broad
categories based on the following social behaviours they exhibit:
Page 49
47
1. Cooperative brood care: In this case, adults cooperate in caring for the
young brood.
2. Reproductive castes: In this case, the sterile individuals work on behalf of
the fecund individuals. Reproductive caste is the most basic form of division
of labour in social insects. However, with the increase in the complexity of
the colony, sophistication among non-reproductive workers increases
[Anderson and McShea, 2001; Bourke, 1999].
3. Overlap between generations: That is parents and offspring live together
during some period of life.
Based on these displays, Wilson classified insects into four distinct groups (Wilson,
1971):
Solitary: This group of insects do not show any of the three behaviours i.e. the
degree of social behaviour in this category of insects is minimal.
Quasisocial: Insects in this category participate in cooperative brood caring but
neither have any workers available to assist the fecund workers nor does any
overlapping between generations exist.
Semisocial: Semisocial insects participate in caring for the brood and also have
reproductive castes (i.e. a worker caste cares for the young of the reproductive
castes).
Page 50
48
Eusocial: Eusocial insects exhibit all the three social behaviours as outlined by E.O.
Wilson (Wilson, 1971) and therefore are regarded as having the highest degree of
social behaviour.
Degrees of Sociality Cooperative Brood
Care
Reproductive Castes Overlap between
generations
Solitary
N/A
N/A
N/A
Quasisocial
Y
N/A
N/A
Semisocial
Y
Y
N/A
Eusocial
Y
Y
Y
Table 2.1: Classification of Insect Societies
The four categories of insects have been outlined in Table 2.1. Following in this
section are some of the examples of collective behaviours that eusocial insects
display.
2.4.2 Foraging behaviour in Ants
Ants are eusocial insects of the family formicidae of the order Hymenoptera. They
are extremely small in size and weigh very little.
One of the most fascinating behaviour found in many species of ants is the ability of
mass recruitment of nest-mates for foraging (by the trail laying mechanism).
Page 51
49
Although the foraging behaviour differs between species of ants, the mechanism of
trail laying as a guide for the nestmates towards the food source is considered to be a
unique trait. Ants do not possess any global knowledge of the environment – they
only follow a set of simple behavioural rules to communicate with each other. Each
ant behaves like an autonomous agent and moves randomly at their initial stage of
their journey. When a food source is found, she picks up a piece of food from the
food source and moves towards the nest. As they move towards the nest they keep
on dropping chemicals called pheromones. The pheromone can diffuse in the
environment (positive feedback) as well as evaporate (negative feedback). When
other ants searching for food sense the pheromones, they sniff the chemicals of
highest concentration and move up the pheromone gradient (stigmergic
communication). As they reach the food source, they pick up a piece of food and go
back to the nest. On their way back to the nest, they continue dropping pheromones
as well thus reinforcing and hence establishing the pheromone trails between the
food source and the nest (positive feedback). Such means of directing a mass amount
of nest-mates towards a global objective (food) is often called the recruitment
process.
The combination of multiple interactions along with positive and negative feedback
mechanism establishes a pheromone trail between the food source and the nest
enabling them to carry the food to the nest effectively. Figure 2.9 depicts this
mechanism [Wilensky, 1998e].
Page 52
50
A
B C
D
E F
G
H I
Fig 2.9: Ant foraging Mechanism
Page 53
51
2.4.3 Nest Construction in ants
Lepthothorax albipennis (formerly known as Leptothorax tuberointerruptus) are one
of the species of ants that exhibit impressive collective behaviour in constructing
nests around them. These species dwell in flat cavities (In England, their nests are
found on the Southern part on the rocky hillsides), in a colony comprising a single
queen, about 500 workers and a similar number of brood [Camazine et al., 2001,
Franks and Deneubourg, 1997], and use the roof and the floor of the cavities for their
dwelling place [Franks and Deneubourg, 1997].
Building efficient nests is very important for Leptothorax albipennis as they are
extremely vulnerable to intra-specific enemies and also to socially parasitic ants such
as Chalypoxenus and Epimyrma [Buschinger, 1986, 1989]. They have also been
found to be targeted by certain species of ants that attack L. albipennis with the
intention of capturing the working pupae to raise up as useful slaves. Apart from
biological enemies, these ants are also vulnerable to physical factors including
flooding of water that can drown the inhabitants. Therefore, L. albipennis ants need
to create an efficient defensive structure in order to survive. They have been found to
use extremely simple rules to construct nests to surround the queen and the brood.
The nests usually have single narrow entrance whose size is proportional to the size
of the colony [Camazine et al., 2001]. This makes sure that the nest is neither too
large to be subjected from external attack nor too small so that the members of the
colony find difficulty residing in the nest.
The species divide the workers into two types: internal workers and external
workers. External workers typically collect the building materials (e.g. stones) from
outside while the internal workers regulate the nest size. The ants have been found to
Page 54
52
use the following behavioural rules to construct a nest around the queen and the
brood members [Camazine et al., 2001]:
1. The external workers collect building materials (which can be as large as
their entire head) and return with it to the nest.
2. The ants carrying the stones (building material) tend to release the stone after
they make direct contact with a cluster of their internal worker nest-mates or
other stones that have been previously deposited.
3. The external workers rarely pick up a stone that they have dropped inside the
nest.
4. The internal workers pick up the stones and bulldoze them outwards if the
stones are too close to the brood or the queen.
2.4.3.1 A mathematical model for the wall construction of L. albipennis
A mathematical model for the formation of the wall by L. albipennis has been
described by Camazine and colleagues [Camazine et al., 2001]. In their model, an
unladen ant can pick up a stone and become a laden ant. The probability of picking
up a stone depends on the distance from the centre of the stone i.e. P(r). The
probability of a laden ant to drop a stone is given by D(r)Q where Q = 0 when there
is no free space to drop a stone at that node and Q = 1 when all the space in the area
is free. The function for dropping a stone is maximal at r = r0 whereas r0 is the
desired radius of the nest while minimum at the centre of the nest. The following
equation describes such behaviour:
2
0 )(1)(
rr
DrD M
−+=
τ (2.4)
Page 55
53
where DM is the maximum value of the dropping function and τ represents the
thickness of the wall.
The function for picking up a stone is minimum at r = r0 while maximum at the
centre of the nest i.e. if there is any stone close to the brood members and the queen,
the internal workers pick them up. For r > r0, the function for picking up a stone
increases with the value of r. The following equation depicts this behaviour.
( )
−+−= 21
11)(
o
Mrr
PrPτ
(2.5)
Figure 2.10 shows how the dropping function, D(r), and the picking function, P(r),
varies with r, the distance from the centre of the nest.
Fig 2.10: Dropping/picking function with respect to r
When DM=5, PM = 4, r0 = 3 and τ = 1
Dropping and Picking functions
0
1
2
3
4
5
6
-6 -4 -2 0 2 4 6
r
D(r
)/P
(r)
Picking function
Dropping function
Page 56
54
2.4.4 Honeybees
The choice of food source by a swarm of honeybees is another striking example of
how insects participate in group decision making. The study of such astonishing and
quick group decision making in honeybees was first investigated by an Austrian
zoologist called Karl Von Frisch. In 1917, while studying the bees’ sense of colour,
Frisch discovered that they continue to visit a recently emptied food dish, as if they
were monitoring the contents of the dish [Munz, 2005]. When he replenished the
dish’s supply, it was found that a lot of bees quickly appeared at the dish. He
pursued this observation for a couple of years and in the early 1920’s observed that
after locating the food source, the bees return to the beehive and make one of the two
kinds of dances – a round dance or a waggle dance. He mistakenly conjectured that
the two kinds of dances represent the types of food the bees visited (round dance for
the nectar and the waggle dance for the pollen) [Frisch, 1923]. However, in the early
1950’s, he carried out an experiment with the same setup as in [Frisch, 1923] but this
time he varied the distance between the food source and the hive. In this experiment
it was found that when the food source is at a closer proximity to the beehive, the
bees round dance but as the distance between the hive and the source is increased,
the returning bees start waggle dancing [Frisch, 1953] thus the dancing indicates the
distance between the source and the hive and not the type of food which he assumed
previously.
He later also found that the honeybee uses the sun to indicate the direction of the
food source. Furthermore the returning bee allows other bees in the hive to taste
portions of the food collected thus giving them an idea of the quality of the food. For
Page 57
55
his discovery of honey bee dancing and recruitment process, Karl von Frisch was
awarded the Nobel Prize in Physiology/Medicine in 1973 along with his colleagues
Konrad Lorenz and Nikolaas Tinbergen.
The information conveyed by the forager bees (quality of the food, distance and
direction to the food source) then influences the nectar-receiving bees to choose a
particular food source and fly in that direction.
2.4.5 Mound building by termites
Termites are another excellent example of decentralized and self-organized systems
available in nature. They belong to the group of social insects usually classified at
the taxonomic rank of order Isoptera. They are famously known for their
architectural artefacts in building mounds of as high as 9 metres (Britannica) in the
savannas.
More amazingly, these termites act as autonomous agents, are assumed to follow
simple behavioural rules and use only local interaction to build such fascinating
structures.
Resnick [Resnick, 1997] proposed a model for the mound building of termites. In his
model, each agent follows extremely simple rules to collect wood chips from a
randomly scattered environment and build a single pile from there. The rules of the
model are as follows:
1. If a termite does not carry any wood chip, it continues moving randomly.
Page 58
56
2. If it bumps into any wood chip, it picks the chip up and continues to wander
randomly.
3. If it is already carrying a wood chip and bumps into another wood chip, it
finds a nearest empty space and drops the wood chip off there.
Figure 2.11 shows the snapshots of the termites [Wilensky, 1998f] following the
above local rules resulting in the creation of 2D termite mounds from randomly
spread wood chips.
Page 59
57
Fig 2.11: Snapshots of the building of termite mounds
It can be well observed that although the wood chips were initially randomly
scattered, the termites manage to put the chips in a single pile using the simple
behavioural rules.
2.5 Swarm Robotics
The term swarm robotics (SR) was first coined by Gerardo Beni and Jing Wang in
1989 while describing a class of cellular robots [see [Beni, 2005a] for a brief
history]. SR is closely related to swarm intelligence (SI) [Beni and Wang, 1989] in
the sense that they both were predominantly inspired by the studies of social insects
[Sharkey, 2006]. Currently, this field of robotics has seen a great deal of popularity
among researchers in the areas of robotics, artificial intelligence (AI) and
psychology. As a discipline, it has attracted a significant number of research groups
contributing to this field [Beni, 2005a].
The reasons for the popularity in this area can be seen as threefold:
Page 60
58
1. The field offers the benefits of solving a number of applications which are
otherwise difficult /hard to solve.
2. Because of its biological inspiration, the field is equally important to
ethologists interested in the investigation of animal behaviour as to
roboticists interested in developing multi-robot systems. Robots provide new
platforms for the biologists to experimentally investigate their hypotheses.
3. Swarm systems have potential applications in various disciplines (for
instance biology, engineering, computation etc...). Because of its
interdisciplinary nature, there has been enormous interest between different
disciplines in exchanging ideas to solve a common engineering problem.
SR can be formally defined as [Şahin, 2005]:
The study of how large number of relatively simple physically embodied agents can
be designed such that a desired collective behaviour emerges from the local
interactions among agents and between the agents and the environment.
The definition points out that in a swarm robotic system, a large number of robots
(agents) are involved with each robot interacting with other neighbouring robots and
the environment in its vicinity. No single robot has global knowledge of the
environment and numerous interactions among the robots and between the robots
and the environment set a collective pattern in their behaviour.
Swarm robotics draws its inspiration from biological swarms and hence is an area of
interest to both biologists and engineers (especially roboticists). For the biologists,
the modelling of biological behaviour in real and/or simulated robots often provides
better understandings of the decision making process within the animal societies.
Furthermore, it gives a unique platform to investigate the effect of different
Page 61
59
conditions on the decision making process. On the other hand, for the roboticists it
provides good designing architectures to solve real world complex problems and also
exploit some key benefits (e.g. building a decentralised system which is scalable,
flexible as well as robust) of the natural swarms.
2.5.1 Features of Swarm-Robotics System
In this section, some of the features of swarm robotic systems, as highlighted by
several researchers [Beni, 2005a; Şahin, 2005; Sharkey, 2007] are highlighted:
Autonomous Robots: The robots are not controlled by any central controller/
supervisor i.e. there exist no special leader robots. The robots are completely
autonomous and follow some simple behavioural rules.
Large number of Robots: A large number of robots should ideally be involved in a
swarm robotic system. Unfortunately, this means that the costs associated with a
swarm robotic system are very high. However, as the costs of the hardware
decreases, it is expected that the cost of the individual robots would also fall.
Simple Robots: The abilities of an individual robot are usually limited i.e. no single
robot on its own would be able to carry out a task in an efficient manner. It should
also be noted that the simplicity of the robot is in terms of its behaviour, local
perception and communication. For instance, there has been some interest among
researchers in using miniature helicopters to mimic the flocking motion of birds
[Nardi and Holland, 2007]. Although a helicopter on its own is a complex system it
could be viewed as simple in terms of its behaviour, local perception and
Page 62
60
communication. In such cases, flocks of helicopters would not violate the swarm
intelligence paradigm.
Local interactions: No robot should have any prior knowledge of the environment.
They can only communicate with each other and with the environment within a short
radius compared to the size of the environment. This facilitates a lot of agents to
operate with low bandwidth. The means of communication can be direct (e.g. simple
signalling) and/or indirect (stigmergic).
Emergent Behaviour: By the process of multiple interaction, positive feedback and
negative feedback, a collective behaviour is expected to emerge.
2.5.2 Approaches to swarm robotics research
Experiments involved in swarm robotics are currently approached in one of the
following two ways:
• Simulation Approach
• Real-Robot Approach
2.5.2.1 Simulation Approach
This is probably the most common approach towards conducting swarm robotics
experiments. Some of the reasons for the popularity of this approach are as follows:
Less Expensive: The only cost involved in this approach is perhaps the license of
the simulators. On one end some simulators (e.g. Webots1 ) need to be bought while
1 http://www.cyberbotics.com/
Page 63
61
on the other hand simulators such as Player/Stage2, YAKS3 and teambots are
available without any license fee.
Less Time Cost: The time cost in simulating is usually much less than building
robots. Furthermore, the cost increases with the number of robots involved in the
experiment.
Performance: Simulators, such as Webots, are sufficiently faithful for the
controllers to be transferred to real robots without changes and for the robots’
behaviour to be qualitatively similar to those of the real robots. However the same
performance cannot always be guaranteed as it highly depends on the environment of
the real world including the level of noise and interference.
2.5.2.2 Real Robot Approach
In this approach, real robots are used instead of only simulations (see for instance
[Krieger and Billeter, 2000]). The number of robots used in this approach, however,
is usually limited since it increases the cost and at the same time degrades the
performance due to overcrowding effects. Compared to the behaviour of real ants,
the scalability in real robots is greatly limited due to (1) the bigger size of robots
compared to the environment and (2) greater interference between robots. Real ants,
on the other hand, have shown impressive capabilities of coping with high density of
individuals (e.g. a density of up to 2254 foraging ants per m2 has been recorded in
yellow crazy ants [Abbott, 2005] and a massive swarm raid by 200,000 workers
raiding over a width of 15 m or more and sweeping over 1500 m2 per day has been
2 http://playerstage.sourceforge.net/ 3 http://www.his.se/templates/vanligwebbsida2.aspx?id=18551
Page 64
62
observed in army ants Eciton burchelli [Camazine et al., 2001]). However, the use of
real robots shows realistic capabilities of the swarm within the context of robotics.
Also, with progression of technology, as the size of the robot shrinks, we expect to
greatly increase the ratio of the size of the environment to that of the robot. This
would subsequently make it possible to accommodate more robots in a given
environment with little interference.
2.5.3 Collective and cooperative behaviour in swarms of robots
In this section, some examples of the use of real robots to make collective and
cooperative behaviour are presented. Collective behaviours include the cases where
the robots need to work together as a group in order to carry out some tasks whereas
cooperative behaviours include the cases where two or more robots need to
cooperate with each other in order to do a particular task.
2.5.3.1 Self Organised task allocation / Collective foraging
Self organized task allocation is currently a very active research area within swarm
robotics. The problem of task allocation can be described as follows: If there are n-
robots and m-tasks present in the environment, how would the m-tasks be distributed
among the n-robots in order to carry out the operations effectively. Further details of
self organised task allocation can be found in chapter 3.
In 2000, Krieger and Billeter devised a means of self organized task allocation to
control when a robot should come out of the nest and forage [Krieger and Billeter,
2000; Krieger et al., 2000]. Figure 2.12 shows the experimental set up.
Page 65
63
Fig 2.12: Experimental Setup [Krieger and Billeter, 2000]. Reprinted with permission.
In this experiment, the robots equipped with gripper turrets reside in the nest. They
come out of the nest only when the nest energy level (broadcasted inside the nest) is
low enough that it stimulates the robots to go for foraging. Figure 2.13 shows the
basic mission cycle of a particular robot:
Page 66
64
Fig 2.13: Basic Mission Cycle of a robot [Krieger and Billeter, 2000]. Reprinted with permission.
The robots initially reside in the nest and keep listening to the control station’s radio
message that periodically updates the nest-energy level. Each robot has some fixed
threshold (randomised) for foraging. When the nest-energy level falls below the
threshold of the robot, the robot is stimulated to leave the nest and go to the exit lane,
to come out of the nest and start random search for the food. Once it finds the food, it
loads the food, goes to the nest entrance and then unloads the food in a bucket.
Krieger and Billeter carried out experiments with up to 12 mobile robots in
environment where (1) food is distributed evenly and robots do not participate in
recruiting other robots for foraging, (2) food is clustered around the environment and
robots do not recruit other robots for foraging or (3) food is clustered and robots
recruit other robots for foraging. In all the three cases, they observed that the relative
colony energy (i.e. mean energy per robot) to be low at small and large number of
robots. The relative colony energy is high with intermediary number of robots.
Page 67
65
Furthermore, they also found that recruitment of other robots improve the foraging
efficiency significantly.
In other studies, the robots change their tasks dynamically from resting stage to
foraging stage and vice versa by updating their thresholds which might depend on a
number of environmental factors like the overcrowding of robots in the search space
and the successful searching of food item [for further details, refer to Labella, 2007;
Liu, 2008; Liu et al., 2007a; Liu et al., 2007b]. One of the problems with Krieger and
Billeter’s approach is that the system is not fully decentralised but rather depends on
the centralised control station’s radio message which fits less well with the swarm
intelligence paradigm in this respect.
2.5.3.2 Nest Construction
In this case study, a discussion is presented on the creation of sites using swarms of
robots. NASA has predicted that teams of multiple robots would be required in
distant planets such as Mars for tasks such as site preparation which would be
essential for later mission objectives like constructing solar arrays [Parker et al.,
2003]. This would require swarms of robots to create the equivalent of a nest site out
of the gravels.
Construction in teams of multiple robots can be viewed in either of the following
ways:
1. Accumulation of materials: In this approach, individual robots wander about the
environment, collect building materials, carry it to the construction site and add it in
Page 68
66
an orderly fashion. Such approaches are inspired by the behaviour of insects like that
of wasps [Theraulaz and Bonabeau, 1995].
2. Removal of materials: In this alternative strategy, robots would be required to
remove the materials from the nest preparation site. Such approaches are often
observed in ants such as in the ant species Leptothorax albipennis described
previously.
Parker and his colleagues [Parker et al., 2003] embrace the second strategy for nest
site preparation using robots. The robots need only two sensors to carry out this task:
one would be required to measure the force exerted on the robots by the rocks (e.g.
using a bump sensor) that it is ploughing and the other would be required to detect
collisions with other robots in the nest. The controller of the robot, which they call
the blind bulldozer controller, can be shown as a three state finite state machine (Fig.
2.14).
Fig 2.14: Finite state machine for the blind bulldozer controller [Parker et al., 2003].
Robots are initially in the ploughing state. In this state, robots move in a straight line
and simply plough up any material (gravel) on its way. If the force of the gravel on
the robot reaches a threshold, the robot switches to the finishing state. When the
robot is in the finishing state, it simply turns through a random amount and reverts to
Collision with robot
delay
Colliding
Ploughing
Finishing
Page 69
67
the ploughing state. Upon detecting collisions with other robots, the robot switches
to the collision state. Just like the finishing state, robots in the collision state, also
turn through a random angle and revert to the ploughing state. Using such simple
rules, robots are capable of creating a simple nest site. Experiments with real and
simulated robots reveal that nest size grows quickly at the initial stage followed by
slow growth of the nest size (since over time, thickness of the wall of the nest starts
increasing resulting slow growth rate at the latter stage) and also the initial shape of
the nest is preserved over time since every time the robot ploughs, it pushes gravel
only by a small amount.
2.5.3.3 Stick Pulling Experiment
The stick pulling experiment [Ijspeert et al., 2001] was carried out in a circular arena
delimited by a white wall. In this experiment, groups of 2 to 6 khepera robots
equipped with gripper turrets are used to pull sticks out of the ground. Because of the
length of the stick, it is not possible for one single robot to pull out a stick
completely off the ground (Fig. 2.16). Instead, two robots were needed to work
together to complete the task. The experiment is carried out both in real khepera
robots and Webots, a 3D simulator.
A. Algorithm
Initially the robots start moving randomly in search of the stick. When a robot finds
a stick and there is no other robot holding the stick, it grips the stick, pulls out half of
the stick from the ground, starts a timer and waits for the second robot to come. If no
other robot comes to help within some defined time period, it releases the grip,
moves randomly and starts looking for the stick. If a second robot comes within the
Page 70
68
defined time period, it makes a second grip, pulls out the stick completely and makes
a success dance to indicate successful task completion (see figures 2.15 and 2.16).
Fig. 2.15: Flowchart of the algorithm. Reprinted with permission.
Page 71
69
Fig. 2.16: Schematic diagram of the stick pulling experiment. Reprinted with permission.
B. Communication
Initially very little or almost no communication between the robots was used. It was
however appreciated that a simple signalling scheme would improve the
performance. To investigate this, a simple signalling scheme has been implemented
as follows:
1. When the first robot grips the stick, it sends a continuous signal in a 600 cone
through its frontal emitter
Page 72
70
2. Robots which are in this arena and are looking for sticks respond to this signal by
performing phototaxis towards it until they detect an object.
It was found that a simple signalling scheme improves the rate of collaboration
between the robots.
2.5.3.4 Cooperative Box Pushing
Kube and Bonabeau [Kube and Bonabeau, 2000] devised a simple mechanism to
push a brightly lit box from one place to another. The box is too heavy for one robot
to be able to push it. However, collectively the robots would be able to push the box.
Simple Braitenberg mechanisms [Braitenberg, 1986] were used to avoid robots from
colliding with each other and at the same time to keep them moving towards the
brightly lit box to push it. The result demonstrated a simple cooperation between the
robots without the necessity for any direct communication. The work of Kube and
Bonabeau [Kube and Bonabeau, 2000] and also Kube and Zhang [Kube and Zhang,
1994] employed simple stagnation recovery strategies that many ant species use to
effectively transport box. Sometimes during group transportation of an object, the
object’s motion fail to progress any further owe to a number of factors including (1)
that the force applied to the object has cancelled each other out, (2) the group has
encountered an obstacle or (3) due to significant heterogeneity on the substrate
[Bonabeau et al., 1999]. Many ant species are known to exhibit realigning and
repositioning behaviours [Sudd, 1965, 1960] upon encountering such deadlock
situation. Inspired by this behaviour that many ant species display, Kube and
Bonabeau employed four strategies while transporting the box: (1) transportation
without stagnation recovery, (2) employing realignment of the pushing angle, (3)
Page 73
71
employing repositioning the pushing force and (4) employing both realignment of
the pushing angle and repositioning the pushing force. Kube and Bonabeau found
that the reliability (success percentage) and the efficiency (measured in terms of the
time required to transport the item) of transportation of the box depends on the
number of robots involved. They found that the controller reliability improved with
the incorporation of stagnation recovery strategies. For controller reliability, strategy
(2) works out to be the best for small group size while strategy (3) works out to be
the best for large group size. Strategies 1 and 4 were found to be the fastest for small
and large group size respectively.
2.5.3.5 Animal-Robots Collective Intelligence
Collective Intelligence (CI) is at the core of the swarm systems. It emerges from the
collaboration of many individuals. For instance, in ants, it would be very difficult for
a single individual to forage for the entire colony. But through collaborations
(reinforcement of pheromone trails), ants of many species are able to establish a path
between the nest and the food source enabling other foragers to find food quickly
and more efficiently.
Collaborations are also noticeable in robots (e.g. in the pulling of stick from a hole
[Ijspeert et al., 2001], in the cooperative transport of objects [Kube and Bonabeau,
2000] and in collaborative foraging (for instance [Krieger and Billeter, 2000; Liu et
al., 2007a])).
Recently, researchers and scientists have investigated whether it is possible for a
collective intelligence to emerge between completely two distinct social groups: for
Page 74
72
instance between animals and robots i.e. whether it would be possible for robots to
interact with animals and also vice versa. This would certainly bring a number of
benefits (mentioned below) in the field of ethology and artificial intelligence
[Schutter et al., 2001]:
1. Experimental Ethology: If robots and animals can interact with each other, then it
would provide an elegant way for ethologists to investigate how animal societies
function.
2. Pest Management: Animal pests like rats, locusts, starlings etc. are highly social
species. A controlled interaction with these social groups would make it possible to
control the spatial distributions of these animals and thus to manage them more
efficiently.
3. Managing Endangered and Invasive Species: A greater degree of management
means that species can be better controlled in terms of their behaviour and spatial
distributions. Endangered species are one of the greatest threats to biological
diversity. Most of these endangered species are highly social and therefore they
might be also managed more efficiently through controlled interactions with the
robots.
4. Development of robots: Continuous interaction with animals would contribute in
developing behaviour algorithms in robots which might help them to be better by the
course of time.
Page 75
73
Although we see a number of benefits in the areas of ethology and artificial
intelligence, the key questions remain unanswered. Is such integration of different
social groups possible? Can animals really interact with robots?
Niko Tinbergen, in the early 1950’s, was the first to show that animals and machines
can interact with each other [Tinbergen, 1951]. In the 1950’s, Tinbergen observed a
very strange behaviour in one of his aquarium fishes; a male stickleback. Every day
at the same hour, the stickleback exhibited a specified sequence of territorial
displays; just as if his territory was challenged by some other male stickleback. This
behaviour puzzled Tinbergen for some time. Later he realised that the other male
stickleback was not a stickleback but a post truck which passes every day at the same
hour in front of the lab window. But how was it that the stickleback confused a post
truck with a male stickleback? Tinbergen proposed that during the courtship period,
the male stickleback displays its red belly to differentiate itself from the female ones.
It happens that the post truck was red in colour which was the source of the
confusion.
In 2007, Halloy et al. [Halloy et al., 2007; also see Garnier et al., 2005] showed that
groups of robots can interact with groups of cockroaches and can also participate in
collective decision making process.
The experimental setup consists of a circular arena endowed with two shelters. Each
of the shelters is large enough to host the entire group. When the shelters are
identical, it has been found that all the cockroaches tend to rest under one shelter
rather than splitting into two groups and resting in both shelters. When one of the
Page 76
74
shelters is made darker relative to the other, it has been observed that cockroaches
prefer to rest under the darker shelter.
Fig 2.17: The Experimental Setup [Halloy et al., 2007]. Reprinted with permission.
It was then decided to use robots to interact with the cockroaches and investigate
whether they could take part in the collective decision making process. The
acceptance of robots within a cockroach society depends on the ability of robots to
bear the correct chemical signal and to behave appropriately. Chemical analyses and
behavioural tests were then performed to identify the main molecules constituting
the odour that carries the cockroach identity. This odour was then selected from male
cockroaches and was applied to robots in such a way that each robot carries equal
concentration of odour as that on one individual cockroach. Initially the robots were
programmed to prefer darker shelter compared to lighter one and behave similarly to
the cockroaches.
Similar behaviour in the robots and the cockroaches allowed the robots to be
accepted within the cockroach society. As robots become members of their groups, it
is expected that they could possibly take part in and influence dynamically the
Page 77
75
collective decision making process. To verify this, the robots are programmed to
prefer the lighter shelter as opposed to that of the cockroaches. It was found that the
shelter previously less preferred by cockroaches was selected by mixed groups in
61% of the trials versus only 27% of the trials done without robots confirming that
robots could actually participate in collective decision making process.
Other projects that involve interaction of robots with animals include the Robot
Sheepdog Project (RSP) in which robots are used to control the spatial distribution of
ducks [Vaughan et al., 2000].
2.6 Summary and Conclusion
This chapter provides the first part of the literature review. Although the thesis is
focussed on task allocation behaviour, a general understanding of swarm intelligence
and the mechanism through which agents self organise is deemed necessary before
looking and critically analysing the task allocation mechanisms. This chapter serves
that purpose. This chapter begins with the concept of swarm intelligence followed by
the mechanisms through which simple agents can create such collective intelligent
systems. A number of examples from different fields have been selected to analyse
the underlying mechanism of the collective behaviour. Following this, attention was
then turned towards social insects since they (more appropriately “ants”) have been
our prime source of inspiration. Degrees of sociality in insect societies have been
discussed in terms of the social behaviours the insects exhibit. A number of
examples regarding the self organising behaviour of social insects are then described
and analysed. Finally some examples of self organising behaviour in the context of
Page 78
76
swarm robotics have been discussed. In totality this chapter looks into the concept
and examples of self organisation in biology and in robotics.
Page 79
77
Chapter 3
Task Allocation in Multi-Agent Systems
The previous chapter demonstrated many examples of how agents (both natural and
artificial agents) can use simple rules and limited perceptions and capabilities to
interact with each other numerously resulting in the creation of a self-organised
complex system. One of the interesting features that are noticeable in many self
organised systems (especially in eusocial insects) is that there exist many systems
where agents can adapt to the environmental changes leading to an effective division
of labour without the need of any centralised controller. This capability is extremely
interesting within the biological field (e.g. in understanding the underlying
mechanisms of animal behaviour and evolution) and has many applications within
the engineering field. This chapter, therefore, is dedicated in understanding the
concept of division of labour within the realms of multi-agent systems.
Division of labour (DOL) (or task allocation), within multi agent systems and
especially within social insects, is often referred to as one of the most conspicuous
features of the organisation and the success of a colony. Two main types of task
allocation techniques are prominent in the literature [Bonabeau et al., 1999]: (1) self-
organised task allocation (prevalent in social insects) and the (2) intentional task
allocation approaches. Both the approaches have their own merits and drawbacks in
terms of robustness, efficiency and scalability. Self organised task allocation
approaches are widely exhibited in eusocial insects where agents via multiple
interactions collectively decide how to effectively divide the labour. On the other
hand, intentional task allocation approaches are mainly inspired by the auctioning
Page 80
78
concepts in market economy. This chapter describes the two task allocation
approaches and looks into various recent work carried out by the researchers in these
fields.
The rest of the chapter is organised as follows: Self organised task allocation
approaches are described first. Ant colonies are well known for demonstrating self
organised task allocation behaviour and thus have been used as examples to describe
this approach. After describing the division of labour in ants, several models
pertaining to their behaviour are discussed. Following this, task partitioning in social
insects (a phenomenon related to division of labour in social insects) is analysed and
described. Allocations of tasks in social insects (especially ants) have been a strong
inspiration in the field of robotics. Many models have been developed to
dynamically allocate tasks within the realms of robotics. Detailed discussions of
some of the key models in robotics are then presented. Following this, intentional
task allocation approaches are discussed and analysed. Comparisons between the two
approaches are then presented and finally the chapter is concluded with a brief
summary.
3.1 Division of labour in Social insects
Ants are classified as eusocial insects belonging to the family of Formicidae of the
order Hymenoptera. They are perhaps the most successful living beings that have
made their mark on the earth. They are extremely small in size and weigh very little
yet live at large and weigh (total weight) as much as all human beings on the earth
[Hölldobler and Wilson, 1994]. Ants are extremely diverse in terms of their colony
size, organization of tasks and also cooperation among the nest mates for the benefit
Page 81
79
of the colony. There are currently over 12,000 known species of ants, each
maintaining highly organized colonies and nests with colony size ranging from a few
individuals to 20,000,000 individuals [Beckers et al., 1989]. Why are these tiny
insects so successful at maintaining colonies of different sizes? What techniques
have they embraced that enable them to be socially so successful? Various
researchers have argued that of all the behaviour of eusocial insects, the feature of
dividing labour is significantly responsible for the massive organisational success
[Bourke and Franks, 1995; Gordon, 1999; Franks, 2003; Hölldobler and Wilson,
1990; Hölldobler and Wilson, 2008; Momen and Sharkey, 2009a,b; Robinson et al.,
2009; Oster and Wilson, 1978] they achieve.
3.1.1 Sociality in Insect Societies
Eusocial insects, of all insects, show the highest degree of social behaviour and
therefore stand out as some of the best examples of collectively intelligent systems.
They are well known for their behaviour of cooperating with each other to
accomplish tasks that are beyond the capabilities of a single individual (e.g. as
reviewed in Chapter 2, termites building large and complex mounds, bees
performing waggle dances to recruit hive mates and army ants undertaking massive
raids to collect prey). Of the three social behaviours that eusocial insects display (see
Chapter 2), division of labour is the most conspicuous feature responsible for the
organization and the success of the colony. It is also the underlying framework for
the incredible ecological success they accrue [Bourke and Franks, 1995; Hölldobler
and Wilson, 1990; Hölldobler and Wilson, 1994; Hölldobler and Wilson, 2008;
Wilson, 1971]. Social insects like ants display efficient ways of dividing their task
Page 82
80
and improving the task efficiency for the overall benefit of the colony they belong to.
Sophistication of allocating tasks (i.e. evolution of specialised castes), in ants, is
found to increase as a function of the size of the colony [Anderson and McShea,
2001; Jeanson et al., 2007]. Ant colonies are sometimes referred to as “factories
within fortresses” [Bourke and Franks, 1995; Hölldobler and Wilson, 1990] to
capture the notion of the existence of the specialised castes.
3.1.2 Division of labour in ants
Ants display the feature of dividing tasks within the colony members and carrying
them out in parallel. This phenomenon is what is termed as division of labour.
Although the term was first coined by the economist Adam Smith in 1776 in his
influential book “Wealth of Nations” within the context of specialised skills and
industrial productivity [Smith, 1776], ants seem to have been using more
sophisticated and yet simple mechanisms to organise, specialise and carry out tasks
for over millions of years. The basic form of division of labour exhibited by ants is
the reproductive division of labour where a few individuals (often limited to only
one individual – the queen) are responsible for reproductive tasks while the
remaining are classed as workers. Beyond this basic form of division of labour, there
exists further division of labours among workers. Bonabeau and his colleagues, in
1999 [Bonabeau et al., 1999], proposed that the division of labour among worker
ants can take three (not necessary mutually exclusive) basic forms:
1) Worker Polymorphism (also called physical castes),
2) Age Polyethism, and
3) Individual Variability
Page 83
81
3.1.2.1 Worker Polymorphism (Physical Castes)
Physical castes evolve due to the existence of anatomically distinct ants within the
same colony. They are also found to be biased towards some sets of tasks depending
on their morphology. For instance queens (♀) in a colony are usually the largest in
size having a generalized hymenopterous thorax and deciduous wings [Hölldobler
and Wilson, 1990] and work principally as the only reproductive female of the
colony. The other females, called “workers”, tend to adhere to the tasks depending
on their sizes. In most of the ant species, the workers are categorised as either majors
or minors - however there are some species where an intermediary caste is also
found (often called media workers). Major workers are characterised by
disproportionately large heads and often have sharp mandibles. They tend to
specialise in carrying out tasks that require physical strengths like guarding nests
against foreign intruders (in Pheidole ants [Hölldobler and Wilson, 1990; Wilson,
1984] for instance) and transporting items back to the nest. Minor workers, on the
contrary, are characterised by being smaller in size and are responsible for carrying
out tasks (e.g. nest cleaning, foraging, brood caring etc…) that are not very labour
intensive.
3.1.2.2 Age Polyethism
Age polyethism embraces the ideology that the task carried out by ants is not fixed
over its lifetime but a function of their age i.e. the workers in a colony tend to change
the tasks they carry out depending on their age. Many species of ants exhibit age
Page 84
82
polyethism including Pogonomyrmex barbatus, Cataglyphis bicolor and Oecophylla
smaragdina [Bourke and Franks, 1995; Gordon and Hölldobler, 1987; Ingram et al.,
2005]. The orders in which these ants switch tasks tend to follow some centrifugal
direction away from the nest. For instance, the callow workers (newly emerged
workers) tend to work in close proximity to the queen and the brood and work as
brood carers, slightly older workers tend to work closer to the nest entrance and
prefer to work as nest cleaners whereas the oldest workers work outside the nest and
act as foragers.
3.1.2.3 Individual Variability
Even within age or morphological castes, individual differences towards task
preferences exist. The difference in individuals in the preference for task selection is
a result of many factors including that of past experience [Deneubourg et al., 1987;
Plowright and Plowright, 1988; Theraulaz et al., 1998], variation in the genes
[Oldroyd and Fewell, 2007; Myerscough and Oldroyd, 2004; Page and Robinson,
1991; Robinson and Page, 1989] and physiology [Robinson et al., 2009]. Grouping
the individuals with respect to their task preferences generate what are called
behavioural castes.
3.2 Models of division of labour in ants
The last three decades have witnessed the development of a number of models trying
to establish the mechanisms of the selection of tasks in social insects such as ants.
These models differ from each other in many aspects including worker-worker
Page 85
83
interactions, genetic basis of task selection, motivational state of the worker, spatial
arrangement of the workers in the nest and also learning parameters [Beshers and
Fewell, 2001]. Beshers and Fewell, in 2001, grouped the factors that play integral
roles in choosing the task to be carried out under two major umbrellas - internal
factors and external factors based on whether they are generated as a result of the
internal state of the individual or via interactions with the colony environment.
Internal factors include the genetic, hormonal and neural factors and also the effect
of experience whereas the external factors include the worker-worker interactions
and the stimuli that affect task performance. Both these internal and external factors
affect the performance of task and effective division of labour.
The remaining part of this section describes some of the popular models of division
of labour in social insects (typically that of ants).
3.2.1 Fixed response threshold model
The model assumes that each agent has some fixed thresholds for every task. If the
stimulus of a particular task exceeds the corresponding threshold of the agent, the
agent reacts by selecting the task and performing it. Execution of the task lowers the
stimulus for that particular task. Thus, if an agent A has lower threshold for a
particular task T than another agent B, then A not only responds sooner to the task T
but also reduces the stimulus of the task – thus it can so happen that the stimulus of
task T never exceeds the threshold of agent B and therefore B never performs that
task. Thus, small variations of response threshold can result in the difference in the
frequency of task performance and give rise to the behavioural castes. Page, in 1997,
Page 86
84
discusses one such behaviour seen in honeybees [Page, 1997] where the stimulus of
the task results in task performance. In honeybees, when the nestmates die within the
nest, the corpses result in increasing the stimulus of the task which attracts
“undertaker” honeybees to drag the corpses of their nestmates, fly away with them
and leave them at some distance from the nest. Similarly, the removal of the corpses
causes the stimulus of the task to fall and hence attracting fewer honeybees to
undertake this behaviour. Eventually when there are no more corpses left, the
number of honeybees attracted to carry out this task falls to zero. Seeley [Seeley,
1992] showed that if a honey bee takes too long to unload her nectar to a storer bee,
then she gives up foraging and instead starts tremble dancing to recruit storer bees.
On the other hand, if her search time is within an acceptable bound, then she recruits
foragers through waggle dancing. Similar examples can be found in the ant species
Novomessor albisetosus and Novomessor cockerelli while transporting large prey
items [Hölldobler et al., 1978]. When a scout discovers a large prey item, she
releases a poison gland secretion to attract nestmates in close proximity. However, if
this does not attract enough nestmates to carry the prey item, the scout abandons
short range recruitment and instead starts travelling back to the nest dropping
pheromones on its way in order to recruit more ants. Other examples include the rise
and fall of the number of brood carers with the associated stimulus of the larval
demand [Bonabeau et al., 1999]. Theraulaz and colleagues, in 2002, shows how a
fixed threshold based mechanism can be used to explain the behaviour of ponerine
ants [Theraulaz et al., 2002]. Neotropical ponerine ants, Ectatomma ruidum, hunt by
stinging fruitflies and transporting them back to the nest. Two types of behaviours
are associated with the foraging mechanism of this ant specie: (1) stinging [Lachaud,
1990; Schatz et al., 1997] the fruitflies and (2) transportation of the dead flies. The
Page 87
85
live prey increases the stimulus for the stinging behaviour to be carried out attracting
the ponerine ants to attack the prey. Once the prey becomes motionless and falls to
the ground, the dead corpses now increase the stimulus of the transportation
behaviour resulting increasing number of transporters to come and pick them up.
Bonabeau and his colleagues [Bonabeau et al., 1996; Bonabeau et al., 1998; also see
Bonabeau et al., 1999] developed an analytical model of the response threshold
mechanisms based on assumptions made by Page and Mitchell [Page and Mitchell,
1991]. In their model, every individual i has a response threshold θij for a particular
task j. The probability, ����,of carrying out task j depends on the stimulus of the task
as well as the response threshold of the individual for carrying out the task and is
given by
n
ij
n
j
n
j
s
sT
ij θθ
+= (3.1)
where n > 1 and determines the steepness of the curve. From equation (3.1), if the
stimulus sj >> θij, then the probability approaches to 1. Similarly if sj << θij, the
probability approaches to 0. Another suitable response threshold function [Bonabeau
et al., 1999] is given by:
ij
j
ij
s
eTθ
θ
−
−=1 (3.2)
Figure 3.1 shows the curves for the threshold function with n = 2 for equation (3.1)
and θij = 7 for both equation (3.1) and (3.2).
Page 88
86
Fig. 3.1: Variation of the response threshold function with respect to the stimulus
Figure 3.2 shows how the response threshold function varies with different values of
the threshold for equation 3.1.
Fig. 3.2: Response threshold function as a function of stimulus and threshold
Arcaute and colleagues [Arcaute et al., 2009] described the division of labour in ant
colonies in terms of attractive fields created by tasks. In their model, they used the
distance between the ant i and task j as a metric to evaluate the probability of a
particular ant to engage in the task. The mathematical model proposed by them is:
Response threshold function
0
0.2
0.4
0.6
0.8
1
1 2 3 4 5 6 7 8 9 10 11 12 13 14 15 15 17 18 19 20
stimulus
Pro
bab
ilit
y o
f ta
sk s
ele
cti
on
-3.1
-3.2
Response threshold function
0
0.2
0.4
0.6
0.8
1
1.2
1 2 3 4 5 6 7 8 9 10 11 12 13 14 15 15 17 18 19 20
stimulus
Pro
bab
ilit
y o
f ta
sk s
ele
cti
on
theta = 2
theta = 14
theta = 7
Page 89
87
( )
( ) ( )( ) j
i
jjji
i
ji
j
trtr
tkS Θ
+
+−= ψφ
δtanh (3.3)
Where i
jS is the probability of an ant i located at the position vector ir at time t to
engage in performing task j located at the position vector jr at time t. The model
allows certain number of ants to be engaged with the same task at the same time.
This is encoded in ( )i
jj ψϕ + . For further details, please refer to [Arcaute et al.,
2009].
3.2.2 Specialisation
The fixed response threshold model assumes that the response threshold of a worker
is fixed and does not change over time. However, many studies show that this is not
entirely true. It can be true over short time scales where the response threshold is
fairly constant. However, in many ant species, over the duration of the workers
lifetime this couldn’t be holding true. Division of labour in social insects is known to
be affected by a number of factors including age polyethism [Bonabeau et al., 1999;
Calderone and Page, 1996; Robinson et al., 1994], learning [Brutschy et al., 2011;
Chittka and Muller, 2009; Franks et al., 2007; Ravary et al., 2007; Spencer et al,
1998] as well as physiology [Robinson et al., 2009]. Many ant species are known to
change their task preference over their lifetime [e.g. Ingram et al., 2005] which
would mean that the response threshold for the task is also changing over time. It is
highly evident in many ant species that the probability of carrying out a task
increases upon successful completion of the task and/or frequent interactions with
other ants engaged in a particular task [Greene and Gordon, 2007] indicating that the
Page 90
88
thresholds might not be just fixed but are rather adaptive. Theraulaz and colleagues
[Theraulaz et al., 1998] extended the concept of fixed response threshold model to
accommodate this flexibility. In their model, when a worker performs a task
successfully, the threshold for the particular task is reduced by the learning factor
t∆ξ . Similarly if the worker is unsuccessful in accomplishing a task or not receiving
stimuli for a long time, the worker would reduce the probability of carrying out the
particular task for the next time. This is implemented by increasing the threshold for
the task by the factor t∆ϕ often called the forgetting parameter. The constant
learning and forgetting of task eventually results in the specialisation of workers
within the colony.
3.2.3 Physiological specialisation
Recently, Robinson and colleagues [Robinson et al., 2009] used Temnothorax
albipennis ants to test if there is any effect of the ant’s physiology on deciding what
task to carry out. They argue that the physiological state of an ant can be more
important than age for determining task thresholds. Corpulence or the amount of fat
stored in an ant’s body has been correlated to one’s physiological state. Experiments
with T. albipennis shows that leaner ants most often take the task of foraging
supporting the hypothesis that there exist some physiological thresholds which
determine what tasks should be carried out.
3.2.4 Foraging for work model
In the foraging for work model [Tofts, 1992; Tofts and Franks, 1993], tasks are
connected functionally in a production line and arranged spatially in series of zones
Page 91
89
– a simplification of the radial arrangement of the nest structures. The input task for
the upstream zone comes from the output from the downstream one. An ant performs
tasks in the zone she resides in. Once the task is completed, she tends to perform
another task within the same zone. However, if there are no more tasks available in
the current zone, she moves to the adjacent zone depending on the relative number of
ants in the adjacent zone and the amount of task available to be carried out. Foraging
for work can theoretically generate temporal polyethism. However, the model has
been highly controversial [e.g. see Robinson et al., 1994; Robson and Beshers, 1997;
Traniello and Rosengaus, 1997] owing to the fact that the model assumes no intrinsic
effect of task performance. Despite much controversy, the foraging for work
algorithm remains a very important model for dynamic allocation of tasks.
3.3 Task Partitioning and division of labour
Both division of labour and task partitioning (TP) characterize the organization of
work in insect societies. Traditionally the concept of division of labour was adopted
[Jeanne, 1986] and focussed on individuals and the task they perform over a period
ranging from hours to the whole working life of the worker [Jeanne, 1986; Oster and
Wilson, 1978; Ratnieks and Anderson, 1999; Robinson, 1992]. On the other hand the
concept of task partitioning, a term first coined by Jeanne in 1986, is focussed on
situations in which two or more individuals contribute sequentially to a particular
task [Anderson and Ratnieks, 1999; Jeanne, 1986; Robinson, 1992].
A simple example of task partitioning can be seen in nectar collection in honey bees
[Ratnieks and Anderson, 1999] where honey bee foragers bring nectar to the beehive
Page 92
90
and transfer the nectar to the bees working in the nest (known as storers or receivers)
which in turn bring nectar to the respective cells. Another example of task
partitioning that is highly noticeable is in the ponerine ants, Ectatomma ruidum,
which are abundant in coffee or cocoa plantations where they prey on a wide variety
of anthropods [Lachaud, 1990]. These species of ants divide the foraging tasks into
two phases. In the first phase, a group of this specie (called stingers) kills prey (e.g.
fruit flies) by stinging them which causes the flies to become motionless and fall
onto the ground. Once the flies are dead, they are picked up by a second group of
workers, often called transporters [Theraulaz et al., 2002].
With very few exceptions, almost all the examples of task partitioning in social
insects are related to foraging perhaps due to the deficiencies in the survey of the
literature in other areas or due to the literature itself being biased towards the studies
of foraging.
Fig 3.3: A schematic diagram of a two-stage partitioned task. The
solid lines represent the flow of materials while the dotted lines
represent the flow of collectors and users [Ratnieks and Anderson, 1999]. Reprinted with permission.
Page 93
91
3.3.1 Categories of tasks
Anderson and Franks [Anderson and Franks, 2001] classified tasks into four broad
categories:
1. Individual task, where a single individual carries out a task without any
cooperation from other individuals.
2. Partitioned task, where a task is divided sequentially among two or more
subtasks. Examples include the collection and storage of nectar by the honey
bee. Figure 3.3 shows such a schematic diagram.
3. Group task, where a group of workers cooperate in a concurrent fashion to
carry out a task successfully. There is no division of labour within the group
i.e. each individual carries out the same task.
4. Team task, in which a group of workers not only work concurrently but also
coordinate their different contributions. The key difference between group
tasks and team tasks is that in group tasks, several workers cooperate by
carrying out the same action concurrently whereas in team tasks, the workers
need to cooperate with different actions to complete the task. Consequently, a
team task needs to be divided into two or more distinct sub-tasks in order to
successfully complete the task. A good example of a team task is the
construction of nests by Oecophylla smaragdina ants. These ants build nests
by gluing leaves together. The construction of the nest is divided into three
Page 94
92
sub-tasks. One group of individuals pull leaves together and hold them in
place, another group produce glue (silk produced by larvae) while a third
group of individuals hold the larvae and use them as a tube of glue to bond
the leaves together [Anderson and Franks, 2001]. All these three tasks are
carried out concurrently in order to build the nest and hence the construction
of nests by Oecophylla smaragdina ants is regarded as a team task.
3.3.2 Examples of Task partitioning
For the purpose of extensive discussion, some examples of task partitioning
categories found in social insects are described here:
3.3.2.1 Tasks not partitioned
Foraging without task partitioning is extremely common in social insects. In this
case, foragers do not transfer food to any transporters, but rather collect the food,
carry it all the way to the nest and deposit there. Bumble bees collecting nectars from
foraging areas, have often been reported to behave in this manner [Anderson and
Ratnieks, 1999, Michener, 1974].
3.3.2.2 Tasks sometimes partitioned
In some social insects, tasks are not always partitioned; rather partitioning is a
function of the size of the colony. For instance, E. ruidum ants do not partition tasks
when the colony size is less than 16 workers. With colony size less than 16 workers,
the ants hunt the food and transport it back to the nest by themselves. However when
the colony size exceeds 20 workers, the task becomes partitioned between hunting
by “stingers” and transferring the prey back to the nest by transporters.
Page 95
93
3.3.2.3 Transfer at the foraging area
It has been found that some species of eusocial insects transfer food in the foraging
area. For instance, the minor workers of Oecophylla longinoda, African weaver ant,
transfer honeydew at the foraging area directly to the major workers for transporting
it back to the nest. Another example is the foraging mechanism of leaf cutter ants
Atta [Hart et al., 2002]. Some individuals climb up a tree, cut leaves and drop to the
ground whereas the transporters gathers beneath the tree, collect the leaves and
transport them all the way back to the nest.
3.3.2.4 Transfer at the nest
Many ant species carry food back to the nest and place it at a dump area inside the
nest. Other ants working inside the nests are then responsible for carrying the food
from the dump area back to the brood members. The transfer of food between
foragers and the transporters can either be direct or indirect depending on what kind
of food is being transferred.
3.3.3 Direct and indirect transfer of food between transporters and foragers
Direct transfer of the food (e.g. liquids) means that the transporter ant takes the food
regurgitated from the mouth of the forager. In case of the indirect transfer, the
forager puts the food in a designated place (often called a “dump” or a “cache”) and
the transporter collects the food from the cache and takes it back to the nest. Direct
Page 96
94
transfer often results in a queuing delay [Anderson and Ratnieks, 1999] as the
forager may have to wait for a transporter.
If the food is solid, the transfer of food can either be direct or indirect. However, if
the food is liquid e.g. water, the transfer of food must be direct.
3.3.3.1 Costs and benefits in task partitioning
Task partitioning in foraging has both costs and benefits. Potential benefits include
an increase in the task efficiency. Potential costs are shown in Table 3.1.
For Direct Transfer For Indirect Transfer
Time is wasted between the transfer of
food items between the individuals
Energy is wasted to load/unload the
food at the dump site
Material is lost while regurgitation is
taking place
Time is taken to locate the dump site
May incur queuing delays i.e. the
forager needs to wait for a receiver to
be free at the transferring area
Table 3.1: Costs of direct transfer and indirect transfer of food
Page 97
95
3.3.4 Bucket brigading in social insects
In almost every case, transfer of food takes place at some predetermined locations
such as at the foraging area (as in Oecophylla longinoda), at a trail junction or at the
nest entrance.
However some ants (e.g. seed-harvesting ant, Messor barbatus, African stink ant,
Pachycondyla tarsata, and the grass cutting ant Atta vollenweideri) transfer food in
an opportunistic fashion i.e. at non-predetermined locations. These ants grab the food
from the foraging sites and go towards the nest until they find unladen ants. They
then transfer the food to the unladen ants by direct means. The unladen ant which has
just received the food (now laden) in turn takes the food and starts moving towards
the nest until it finds another unladen ant. When the ant becomes unladen, it starts
following the pheromone trails and moving towards the foraging site. This multi-
stage transportation technique is what is called bucket brigading [Anderson, et al.,
2002].
Figure 3.4 shows some of the foraging retrieval techniques and the corresponding
task partitioning produced in transferring the food items from the source to the nest.
Page 98
96
Fig 3.4: Various form of foraging retrieval. a) In this case individual ants
carry piece of food from the source to the nest without transferring
the food item in any intermediate places which means there is no
task partitioning, b) in this case ants transfer food items at no predefined
locations and therefore it represents bucket brigading, c) A multi-staged
partitioned task with indirect transfer of food items
[Anderson et al., 2002]. Reprinted with permission.
3.4 Task preference in relation to caste
Many ant species show high degree of correlation between tasks chosen by
individual worker and the caste the worker belongs to. P. barbatus ants, for instance,
show some degree of task preferences in the range of tasks they are involved in. P.
barbatus ants are known to have four behavioural castes (patrollers, foragers, nest
Page 99
97
maintenance workers and midden workers), each having their corresponding primary
jobs. The ants of this specie use cuticular hydrocarbon profiles to communicate with
nest-mates. It is believed that hydrocarbon profiles dissipated on the exoskeleton of
the insect (cuticle) gives rise to the existence of the castes in the specie.
Hydrocarbons are by far found to be the most abundant class of chemicals to coat the
cuticle of insects [Jackson and Blomquist, 1976; Nelson and Blomquist, 1995;
Provost et al., 2008]. They provide various benefits to insects including (1) providing
barrier against water loss preventing lethal dessication (alkanes are mostly
responsible for this function [Gibbs, 2002]), (2) protection against infection and (3)
facilitating chemical communication (alkenes are found to be mostly responsible for
this function). Hydrocarbons play important roles in various contexts of insect
biology including that of the regulation of reproduction, nest-mate recognition, task
allocation and many more. Researchers have found that in many species of ants the
difference in the composition or concentration of cuticular compounds give rise to
the castes within a specie. For instance in Camponotus floridanus ants, the foragers
and the callow workers are found to have different hydrocarbon profile [Lavine et
al., 1990]. Howard and colleagues [Howard et al., 1982] experimented on termite
specie Reticulitermes verginicus found that the specie has four distinct castes
(worker, soldier, nymph and neotenic) each having the same hydrorbon profile but of
different concentration. Wagner and colleagues [Wagner et al., 1998, Wagner et al.,
2001] found that foragers and patrollers of Pogonomyrmex barbatus ants have same
hydrocarbon composition but both categories have higher proportion of straight-
chain alkanes and alkenes than nest maintenance workers. Different composition and
concentration of hydrocarbon compounds can arise due to several factors including
temperature and the humidity of the environment, genes as well as interaction
Page 100
98
between workers which consequently can give rise to a different behaviour in a
group of ants from its nestmates thus resulting a caste formation. Such caste
formations normally are classed under the category of behavioural castes.
The following is a summary of the functionality of the four castes of Pogonomyrmex
barbatus.
1. Patrollers: These ants are one of the first groups of ants to emerge out of the
nest. They come out very early in the morning moving around the nest and
evaluating whether it will be safe to forage or not. The successful return of
the patrollers triggers foragers to come out of the nest and forage.
2. Foragers: The successful return of the patrollers triggers the foragers to
emerge out of the nest in search of food. Foragers use the direction chosen by
patrollers by following the pheromone trails laid by the patrollers and
sometimes even completely ignoring the food sources that are not explored
by the patrollers. Once they find food (seed), they pick it up and head
towards the nest. The successful return of the foragers trigger further foraging
activity in the colony.
3. Nest Maintenance Workers: The castes reside in different chambers of the
nest and it is the job of the nest maintenance workers to constantly repair,
clean and maintain the chambers inside the nest. During untoward situations
e.g. the damage of the nest by flood or wind, the activity of the nest
maintenance workers are found to increase.
Page 101
99
4. Midden Workers: They usually sort and pile the refuse pile or midden. The
actual behaviours of midden workers are not well known [Gordon, 1999] but
they are found to move midden from one side of the mound to another.
Although the different castes of the P. barbatus have different tasks to do, they show
a remarkable ability to adapt to the situations as required [Gordon et al., 2008].
When there is a need for one task, some of the ants from other castes are found to
switch from their original task to meet the changing demand. However, every task
switching transition is not evident indicating that the probability of task selection by
an individual worker depends on the caste she belongs to. For instance if there is a
need for foraging, nest maintenance workers, midden workers and patrollers can
switch their task to foraging task however if there is a need for more patrollers, only
the nest maintenance workers are found to switch their task to patrolling (refer to
figure 3.5 for details).
Fig 3.5: Possible task switching transitions for red harvester ants
Page 102
100
It is possible that this variation in task preferences is a result of the setting of the
individual’s threshold values. Deneubourg explains this using the fixed response
threshold model (personal comm.). Deneubourg argues that it has quite often been
observed that an individual ant which is found to often perform a particular task
always gets triggered when the stimulus of that task is found. He says that it is
possible that the particular ant has a very low threshold for that particular task. This
results in the ant being more sensitive to that particular task. Whenever there is a
stimulus for the task and the stimulus exceeds the threshold value, the ant gets
activated. It is then not difficult to imagine result when an ant is exposed to two tasks
(TA and TB). If a particular ant has low threshold for TA and high threshold for TB, it
is more likely that the ant will almost all the time perform TA and very little of TB
and therefore a difference in the threshold creates a bias in its task preferences. In
some extreme cases, it is possible to find that a particular ant is so biased towards a
particular task (extreme specialisation) that it seldom switches task even when there
would be a benefit to the colony for it to switch tasks. Such examples of task
preferences among the castes within the same species can be found in many other ant
species including that of Ectatomma ruidum [Theraulaz et al., 2002] and Pheidole
pallidula [Detrain and Pasteels, 1992; Hölldobler and Wilson, 1990].
3.5 Task allocation in robotics
Task allocation is a fundamental area in the field of swarm robotics [Ducatelle et al.,
2009; Groß et al., 2008; Jones and Matarić, 2003; Momen et al., 2009a, Yongming et
al., 2009, Zhang et al., 2007]. Much of the work pertaining to the dynamic allocation
of labour in response to the change in the environment or demand of a particular task
Page 103
101
is strongly inspired by the behaviour of the social insects. An early example of the
work carried out in this area is that by Krieger and colleagues [Krieger and Billeter,
2000; Krieger et al., 2000]. Although their work was mentioned in chapter 2, we feel
the necessity of mentioning it briefly again for the completion of this chapter. Their
work was strongly inspired by the fixed threshold response model of the social
insects. The robots (kheperas) were assigned some fixed thresholds for foraging from
uniform distribution between ¾ and full initial nest energy. The robots in the nest
periodically communicate with the control station and update the nest energy level.
When the radioed nest energy level is below the activation threshold (or threshold
for foraging), the robot leaves the nest and starts foraging. It is a simple mechanism
of using a fixed threshold response to dynamically allocate tasks. However, one
deficiency of this approach was the use of a centralised control station to
communicate the nest energy level to the robots. Such a mechanism does not provide
a fully decentralised system. Subsequent studies by Labella [Labella, 2007] and
Wenguo Liu and colleagues [Liu et al., 2007a, b] worked towards building a fully
decentralised system for allocating tasks. Furthermore, their studies were strongly
inspired by the way social insects specialise.
Labella [Labella, 2007] proposes variable delta learning algorithm for automatically
adjusting the ratio of the number of foragers to resters for foraging robots. His model
was inspired by Deneubourg’s learning model [Deneubourg et al., 1987] which has
been developed to explain the foraging patterns observed in the Pachycondyla
apicalis ants.
In the original model, Deneubourg et al. (1987) assume that each ant has a
probability (say P1) of leaving the nest. They further assume that there are N possible
Page 104
102
foraging sites and that each ant has the probability of Qi to go to the ith foraging site.
Each site is assumed to have a probability, ri, of containing a prey.
The model works in the following way:
• If a trip to the site i is successful, the ant increases both P1 and Qi by +∆P and
+∆Q respectively.
• If the trip is unsuccessful, the ant decreases both P1 and Qi by −∆P and −∆Q
respectively.
Labella modified the model by keeping track of consecutive success and failures of
the robots. The range of P1 has been limited to [Pmin, Pmax] to ensure that the value of
P1 becomes neither too high nor too low. Labella calls this algorithm “variable delta
algorithm” since the algorithm does not increment or decrement the value of P1 by
any fixed value (unlike Deneubourg’s model).
Liu and colleagues [Liu et al., 2007a,b] used similar mechanisms but updated the
searching time and resting time thresholds depending on three different cues
(internal cues, environmental cues and social cues). They then introduced four
different strategies of foraging by using different combinations of the cues outlined
in Table 3.2.
Variable Delta Algorithm: Initialization: succ ← 0; fail ← 0, P1 ← Pinit If success then if failure then succ ← succ + 1 succ ← 0 fail ← 0 fail ← fail + 1 P1 ← min{Pmax, P1 + succ × ∆ } P1 ← max{Pmin, P1 - fail× ∆ } fi fi
Page 105
103
Strategies
With internal cues
With
environmental cues
With social cues
S1 × × ×
S2 √ × ×
S3 √ × √
S4 √ √ √
Table 3.2: Different strategies of foraging
The internal cue allows the robot to reward itself when it is successful in foraging.
For instance, if a robot is successful in bringing a food item back to the nest, the
robot reduces it’s threshold of resting thus increasing the time spent for foraging.
The environmental cue takes the case of collision with other robots into
consideration. When a robot is outside the nest and collides with other robots, it
reduces its threshold of searching and increases its threshold of resting thus
increasing the time of resting within the nest and decreasing the time of searching.
This is because when a robot collides, it assumes that there are more robots out in the
environment foraging and hence it does not need to contribute towards foraging. For
social cues, a successful robot sends a broadcast message to other robots inside the
nest and they consequently increase their thresholds of searching and reduce their
thresholds of resting. In their works the greater the threshold for searching is the
longer is the time of searching and vice versa (unlike the way the biologists and
other roboticists use thresholds). For further details, please refer to [Liu et al.,
2007a, b; Liu and Winfield, 2010].
Page 106
104
Yongming and colleagues [Yongming et al., 2010] used a fixed response threshold
model to develop a system where simulated robots can autonomously decide whether
to leave the nest and forage or not. Their model assumes that there are NI items of
food in the home (nest) initially which get consumed at a particular rate leaving nt
items of food after time t. All robots have the same fixed threshold (�) and a random
value of n (bounded within a fixed range) for making robots to respond differently to
the stimulus. Each robot can then determine whether to switch to a foraging state or
not depending on the amount of food available in the home. The lower the amount of
food available in the nest is, the greater is the propensity for the robot to leave the
nest and start foraging. Equation (3.4) shows the probability that of a robot to
undertake the foraging task(Pf).
Pf = { ( )( )
It
nn
tI
n
tI
It
Nn
nN
nN
Nn
<
+−
−≥
,
,0
θ (3.4)
Zhuang and Yin [Zhuang and Yin, 2008] used a similar technique (taking inspiration
from the behaviour of honeybees) to allocate tasks in a simulated stochastic
environment.
Jones and Matarić [Jones and Matarić, 2003] used a simple adaptation rule to vary
the propensity for foraging for two types of pucks (red puck and green puck)
depending on the ratio of their availability. The pucks are scattered in the arena. The
robots at any time, t, can either be a Robotred or Robotgreen. If it is Robotred, it forages
for the red pucks and vice versa. At any time, t, a robot can either continue foraging
Page 107
105
for a particular type of puck or decide to switch its state and forage for the other type
of puck. The underlying algorithm is expressed by the following equations:
P(Green � Red) otherwise
GPGRifGPGPGR
0
)1(*)({
>−−= (3.5)
P(Red � Green)otherwise
RPRRifRPRPRR
0
)1(*)({
>−−= (3.6)
Where P(Green � Red) and P(Red � Green) are the probabilities of robots foraging
green and red pucks deciding to change their foraging states to red and green pucks
respectively. All robots use two history windows (limited and constant sized) to store
the state information. One of the history windows contain recent observed pucks in
the arena while the other history window observes the neighbouring robot’s foraging
state from the colour of the beacon the robot is emitting (if the foraging state of a
robot is to forage red pucks, then it emits beacon coloured red and vice versa). RR
and RP are the proportion of Robotred entries and Puckred entries in the Robot History
and Puck History respectively. Similarly GR and GP are the proportion of Robotgreen
entries and Puckgreen entries in the Robot History and Puck History respectively. The
robots then use the two history windows to determine their chances of switching
their foraging state. Jones and Matarić showed that the simple algorithm proves to be
adaptive to the stimulus demand. To test the flexibility of the algorithm, they
changed the distribution of the pucks in the middle of the simulation and found the
robots to adjust their thresholds accordingly. Galstyan and Lerman, in 2004,
analysed the algorithms presented by Jones and Matarić analytically using an
approximation of the stochastic Master equation and found the results to be in
agreement with the simulation results [Galstyan and Lerman, 2004].
Page 108
106
Ducatelle and colleagues [Ducatelle et al., 2011, Ducatelle et al., 2009] presented
two task allocation methods (light based task allocation method and gossip based
task allocation method) for two types of heterogeneous robots working together to
complete a task. The types of robots involved are Footbots (which are the wheeled
robots) and Eyebots (the flying robots). The Eyebots execute high level search to find
targets in a bounded environment. Once the target is found, Eyebots visit the targeted
site and attract the Footbots to come to the area to carry out the tasks. In the light
based task allocation method, the robots use multi-coloured LEDs placed around
their bodies to influence others’ behaviour. For instance, once the Eyebot visits the
target area, it changes the colour of the LEDs to yellow. Footbots are programmed to
be attracted to the yellow light and repelled by green light. So, once the Footbots
detect yellow light in their vicinity using their omnidirectional camera, they start
travelling towards the yellow light (in this case, the target). Using green and yellow
lights, Eyebot can control the number of Footbots travelling to the targeted region.
Also, as the Footbot perceives yellow and green light simultaneously, it increases the
frustration level of the Footbot. When the frustration level exceeds some threshold,
the Footbot performs an escape movement. In the gossip based task allocation
strategy, Eyebot sends the announcement of the task to the nearby Footbots and
corresponding Footbots each transmit messages to the Footbots near it. In this way,
the announcement of the task is propagated throughout. Each message contains
information about all tasks a robot knows about which include:
• Robot ID: the ID of the transmitting robot.
• Number of tasks: Number of tasks the sending robot has information about.
• For each task:
o Task ID: ID of the task
Page 109
107
o Required Workers: the number of workers required for the task
o Hops: the number of hops to the task.
o Route length: the distance to the task following the hops.
o Age: the age of the information about the task.
Each receiving robot then recalculates most of the messages before forwarding the
message to any other robots [See Ducatelle et al., 2009 for further details]. The robot
uses the number of hops and the route length as the first two criteria to decide if it is
going to commit to the task. If the age exceeds some threshold, the robot assumes
that the information is stale and decides to drop the message.
Experiments with different experimental setups reveal that the gossip based task
allocation method almost always works better than the light based task allocation
method. However, if the numbers of robots present are enough, the two task
allocation methods yield almost the same performance.
Hoeing and colleagues [Hoeing et al., 2007] developed a prototype system called
COMSTAR (Co-operative Multi-Agent Systems for TArget Recognition) where a
swarm of simulated unmanned aerial vehicles (UAV) can identify a task (target) and
cooperatively carry out the task. In their model, each UAV initially roams around the
environment in search of any target. Upon recognising a target the UAV emits a
certain amount of synthetic pheromones (where concentration of the pheromone is
related to the urgency of the task) to mark the location and the priority of the task.
This facilitates other UAVs that are roaming around in search of a target to come to
the target place. Once the desired numbers of UAVs reach the target place, they
carry out the task. The authors also developed a corresponding intentional task
Page 110
108
allocation model for this problem. Within the intentional task allocation model, once
the simulated UAV finds the target, it starts auctioning. The other UAVs which can
take up the task participate in the bidding process. The bidding mechanism is
explained in further details in Section 3.5. Once the auctioning is over, the UAV that
started the bidding process selects the top n bidders (where n = number of UAVs
required to accomplish the task) to carry out the task.
Zecca and colleagues [Zecca et al., 2009] proposed a model in which the
environment is populated with robots and RFID tags. RFID tags include instructions
for the robots and their next destination. Thus distributing the RFID tags within the
environment enables the robots to distribute themselves and allocate tasks. However,
such a mechanism does not take changes in the environment into consideration and
hence is not flexible to changing demands.
All the studies presented above look into developing systems that allocate tasks in a
dynamic fashion. However, in most cases the complexity of the environment is fairly
simple. Some even used a centralised control station [Krieger and Billeter, 2000,
Krieger et al., 2000] for communication purposes. The natural world, on the other
hand, provides much more complex strategies that facilitate effective task allocation
using threshold based approaches in a more stochastic environment. This thesis
looks into possibilities of understanding and using some of the strategies that nature
provides to develop systems which would allow the agents to effectively allocate
tasks in a much more stochastic environment. The thesis also looks into empirical
evaluation of the strategies to understand when and in what conditions does a
particular technique benefit the multi-agent system.
Page 111
109
3.6 Intentional task allocation approach
In contrast to the self-organised task allocation approaches, in intentional task
allocation approaches, agents tend to be more complex and to coordinate with each
other with the explicit intent of achieving the team goal [Kalra and Martinoli, 2006].
Market based approaches are one class of popular intentional task allocation
approaches in which the agents act as self interested agents participating in a virtual
market economy with the intention of winning a bid. Unlike the self-organised task
allocation approaches, the allocations of tasks in market based approaches are carried
out by some centralised supervisor agents (called auctioneers). Matarić and
colleagues [Matarić et al., 2003] devised a simple task domain in the simulation to
study task allocation approaches for multi-robot system. The model environment is
comprised of 10 X 10 grid inhabited by 10 robots (agents) and some events (tasks)
scattered within the environment. When an event needs to be allocated to one of the
robots, the auctioneer advertises the task to all the robots present. The robots that are
free and can take up the task participate in the bidding process by conveying their
position to the auctioneer. The auctioneer evaluates the bids by determining which
robot is closest to the event. Once evaluated, the auctioneer declares the winner by
broadcasting the id of the winner. Gerkey and Matarić [Gerkey and Matarić, 2000]
introduced a novel mechanism (MURDOCH) to dynamically allocate tasks to a
group of heterogeneous robots. MURDOCH implements a publish/subscribe
messaging technique which in turn depends on subject based addressing. In subject
based addressing, when robots having some facilities need to be addressed, the
auctioneer tags a message with a subject or sets of subjects as necessary and
publishes it to the network. For instance, for a particular event to be handled, if the
Page 112
110
robot needs some facilities, say gripper and camera, then the auctioneer tags a
message with the subject (gripper camera) and publishes it to the network. The
robots /agents on the other hand subscribe to only those messages which they can
serve. For instance, when the message with the subject (gripper camera) is published
in the network, the robots that do not have these features simply discard the
messages. The others which are free and have a pair of grippers and camera respond
to the auctioneer by giving some fitness value. The auctioneer then evaluates all the
fitness values it has received from the candidate robots. After the evaluation process,
the auctioneer sends a message to declare the winning robot. Parker [Parker, 1998]
introduced the ALLIANCE architecture which enables robots to allocate tasks
through two motivation states: impatience and acquiescence. Each robot
communicates its progress to all other robots. The robot’s impatience increases when
it finds another robot trying to carry out a particular task is failing to execute it
properly. On the other hand, if the robot is failing to execute its task properly, its
level of acquiescence increases. If the robot’s level of impatience exceeds some
threshold, it starts carrying out that particular task. On the other hand, if its level of
acquiescence exceeds some threshold, the robot becomes frustrated with the task it is
carrying out and leaves the task it was currently executing.
Kalra and Martinoli [Kalra and Martinoli, 2006] performed a comparative study
between the two approaches of allocating tasks. Both the approaches have some
benefits. For instance, the self-organised approaches do not need the explicit
communication of the intentional task allocation approaches and consequently suffer
from low communication and computational complexity. On the other hand, market
based approaches tend to allocate tasks more efficiently and are consequently found
Page 113
111
to be able to be able to handle more tasks than the threshold-based counterparts.
However, if the amount of noise is more and the task estimation is imperfect, the
performance of market based approaches starts to fall. Another problem with the
intentional task allocation approaches (for instance in the ALLIANCE architecture)
is that the approach might not be scalable in the order of thousands of robots due to
the fact that the robots need to constantly communicate their progress to all other
robots and also to keep track of the progress of all other robots. On contrary, self
organised task allocation approaches theoretically tend to be more robust owe to the
fact that they are completely decentralised and need less communication among
themselves.
3.7 Summary and Conclusion
This chapter discusses the task allocation approaches adopted by many researchers.
Self organised task allocation approaches are strongly inspired by the behaviour of
eusocial insects and in many cases tend to allocate tasks by means of threshold based
mechanisms. The agents in self organised task allocation approaches use only local
sensing and communication to decide what task to accomplish. On the contrary,
intentional task allocation approaches are strongly inspired by market economy
where each agent participates in bidding for a particular task. Communication either
tends to be between all agents or there exists a need for a centralised controller to
allocate tasks. In general, intentional task allocation approaches are found to allocate
tasks more efficiently than the self-organised counterparts but also suffer from high
computational and communication complexity. Furthermore, the performance of
Page 114
112
intentional task allocation approaches is strongly affected by the amount of noise and
interferences.
This thesis is strongly motivated by threshold based mechanisms exhibited by social
insects to design a multi-agent system that can allocate tasks dynamically in response
to the changing demand. A number of multi-agent systems have been designed and
developed by researchers in the past. Howerver, we find a number of limiting factors
in the existing literatures: for instance 1) the models developed by previous
researchers usually tend to be simple in terms of the number of agents involved,
stochasticity, stigmergic interactions as well as in terms of the number of tasks
involved, 2) many models, although inspired by eusocial insects, have failed to
capture all the necessary features that eusocial insects display, 3) some models (e.g.
Krieger et al., 2000; Krieger and Billeter, 2000) even used centralised system for
transmitting messages and others such as Liu et al., 2007a,b relied on broadcasting
signals rather than local interactions in certain cases, 4) many simulation lack the
issue of embodiment while modelling the interaction between the agents and the
environment, and 5) in many models the task allocation was not driven by the need
of the colony. For example Liu and colleagues [Liu et al., 2007a,b] used a number of
simulated robots that collect food items from the outside environment. The
motivation of foraging is influenced by the internal, environmental and social cues
and is not driven by the need of the colony. In reality such need for adaptation is a
result of the demand created from the inner core of the colony. This thesis intends to
fill these gaps while designing the multi-agent system.
In this chapter, the literature in the field of Entomology has been explored to
understand how social insects and in particular ants behave and allocate tasks.
Detailed understanding of their mechanism then led to the design and development
Page 115
113
of three models of allocation of tasks. In all the models, the worker agents use three
thresholds and a competition between the thresholds decides what task they are
going to perform. A stochastic environment (in terms of the number of agents
involved, interactions among the agents and between the agents and the environment
and the behavioural rules followed by the agents) has been presented in the models
to analyse how well agents can self-organise and allocate tasks in a changing
environment.
The first model proposed (described in chapter 4) is based on simple, local and
stigmergic interactions between the individuals. In chapter 5, direct local
communications between the agents have been used along with the stigmergic
interactions already described in chapter 4. Very little work has been done
previously to analyse the impact of incorporating direct communication along with
the indirect ones. However, in natural swarms, direct communications do play an
important part over the performance of the swarm. Chapter 5 empirically evaluates
the benefits of colony efficiency when the direct communication is incorporated
under various situations. Chapter 6 extends the idea of threshold based mechanisms
to the role of mixed agents (dedicated and flexible) on the performance of the
swarm. To the best of our knowledge, this research is the first to explore the role of
dedicated (biased) agents in the performance of the colony.
Page 116
114
Chapter 4
A Flexible Task Allocation Model for
a Swarm of Simulated Agents
Dividing labour and allocating tasks on the fly can be considered as a benchmark
problem in the field of multi-agent systems where more than one agent works
together collectively in order to carry out a range of tasks. Effective task allocation
strategies that allow task specialisation and execution of tasks in parallel fashion are
expected to yield better performance compared to those that execute tasks
sequentially and do not have any provision for task specialisation [Hölldobler and
Wilson, 2008; Oster and Wilson, 1978]. Social insects are known to exhibit some
effective task allocation strategies that allow them to schedule and re-schedule tasks
without the need of any centralised controller. Such task allocation ability is often
referred to as the most prominent feature of the organisation and the success of
colonies [Bourke and Franks, 1995; Hölldobler and Wilson, 2008, 1994, 1990;
Momen and Sharkey, 2009a,b; Robinson et al., 2009] (also see Chapter 3) enabling
many species (and ants in particular) to effectively maintain colonies of as many as
20,000,000 individuals [Beckers et al., 1989] (see Chapter 3 for further details).
Flexible task allocation strategies allow assigning tasks and redistributing part of the
workforce in response to the changing demand. Such mechanisms are extremely
Page 117
115
important as they enable the agents not only to carry out their operation but also to
adapt to the changing environment and allow them to re-organise themselves in such
a way so as to meet the changing demand. In a perfectly stable environment, once
the workers distribute tasks among themselves, it might not be necessary to re-
distribute tasks at some future time. However, in most complex systems, the
environments are dynamic and unpredictable which consequently requires workers
to make decisions about what task to carry out next and to redistribute the workforce
in proportion to the demand of the tasks.
In this chapter, a task allocation model suitable for a swarm of agents is presented.
The agents are considered to be simple in terms of their behaviour, completely
autonomous with limited sensing and communication capabilities and having no
prior knowledge of the environment. The work is strongly inspired by the ant colony
behaviour and especially the plasticity of behaviour that many ant species exhibit.
The remainder of the chapter is organised as follows: first a brief discussion of the
modelling approaches that have been embraced is provided, followed by a detailed
description of the environment of the model. Behavioural rules for the agents are
then established taking inspiration from the behaviour of the individual ants in a
colony. A discussion of how the performance of the colony is evaluated is then given
followed by the results that were obtained. We then compare the simulated results
obtained with the behaviour that real ants display in nature. Finally, the chapter is
concluded with comments on the next set of experiments.
Page 118
116
4.1 Modelling Approaches
One of the objectives of this research is to develop and analyse a flexible, scalable
and robust task allocation model for a swarm of agents. The work, as previously
mentioned, is strongly inspired by ant colony behaviour since ants are known to
display efficient task allocation strategies (more details can be found in Chapter 3)
that work well with various colony sizes. Therefore, the approach we adopt to build
the model is to mimic the behaviour of “real world” ants to establish the behaviour
of individual agents and analyse whether similar colony behaviour (as observed in
nature) emerges as a result or not. This leaves us with three possible ways of gaining
better understanding of their behaviour:
(1) Using real ants: One of the possibilities is obviously to use real ants in a
laboratory controlled experiments and analyse how the colony behaviour
changes with different task demands. Thorough analyses of the behaviour of
ant colonies then allow the researchers to model their behaviour. Although,
this approach is popular among biologists, there exist a number of
disadvantages with this approach: it is (1) time consuming, (2) costly and
most importantly (3) a wide number of parameters (e.g. the pheromone
diffusion rate, the rate of food availability, size of the swarm) are difficult to
vary for the purpose of analysis. However, such approaches are capable of
providing much deeper insights about how collective behaviour emerges
within the colony under investigation.
Page 119
117
(2) Using robots: The use of real robots to mimic the behaviour of individual
ants [e.g. Krieger and Billeter, 2000; Kube and Bonabeau, 2000; Parker et al.,
2003] and analysing how the colony behaviour emerges out of the numerous
local interactions among robots has been another popular approach in recent
times. Unfortunately this approach is limited due to a number of factors: (1)
the size of the swarm that can be used is limited due to the cost involved, (2)
the performance of the robot swarm has been reported to decrease with the
increase in the swarm density largely due to the interference between robots
[e.g. Krieger and Billeter, 2000; Liu et al., 2007a,b; Rybski et al., 2008] that
arises mainly due to the usually limited dimension of the size of the
environment compared to that of a single robot and (3) limitations in the
sensor and other technologies makes it almost impossible to mimic every
aspect of the real ant. For instance, the commonly occurring stigmergic
interactions (i.e. communication between agents via the environment) in ants
are very difficult to incorporate into real robot behaviour.
(3) By developing computer models: In recent times, the use of simulators to
develop models has proven to be another useful technique for solving such
kinds of problems. Such simulators usually can accommodate massively
parallel agents carrying out sets of instructions concurrently. The benefits of
using a computer model are manifold, including (1) the ease by which
parameters can be varied, (2) the environmental conditions can easily be
altered and (3) ease of repeating simulations several times and analyse the
results obtained. The approach is also relatively less expensive when
compared to the other two approaches mentioned.
Page 120
118
Within the domain of modelling social phenomena, two kinds of modelling
techniques have been embraced by researchers: (1) macroscopic modelling and (2)
microscopic modelling. Macroscopic modelling involves describing the overall
collective behaviour of the system and not the specific rules of the individual agents.
Often macroscopic modelling is expressed in terms of rate equations derived by
analysing flow in compartmental frameworks [Gold, 1977; Lerman et al., 2005] and
focuses on the dynamics between large groups of entities. Rate equations are
commonly used but not the only approach to modelling the collective behaviour
when adopting the macroscopic modelling techniques. Schmickl and colleagues
[Schmickl et al., 2009], for instance, presented two approaches (namely stock and
flow model and spatial model of self propelled particles) to macroscopic modelling
of robotic swarms. One of the biggest disadvantages with this type of modelling
techniques is that it does not take the individual variability into account [Lehmann,
2009] and often tends to smooth out fluctuations – although under certain conditions
fluctuations can be amplified [Bonabeau, 2002].
On the other hand, microscopic modelling is a bottom up approach involving
detailing the behavioural rules and local interactions of the individual agents and
capturing the emergent phenomenon that arises over time. Agent based modelling
(ABM), otherwise known as individual based modelling (IBM), is an example of
such a microscopic modelling approach. Bonabeau identifies three key benefits of
agent based modelling over other modelling techniques [Bonabeau, 2002]: (1) ABM
captures emergent phenomenon, (2) ABM provides a natural description of the
Page 121
119
system and (3) ABM is flexible in the sense that the number of agents involved and
their behavioural rules can be easily programmed.
For the purposes of our research, we look into how simple individuals, with given
rule sets, interact with each other and the environment in the vicinity to carry out
tasks collectively and redistribute part of the workforce, as needed, in response to the
task demand. Our approach is thus a bottom up, microscopic approach and involves
describing and establishing behavioural rules of the agents and capturing any
emergent pattern that arises. Hence, the agent based modelling technique has been
taken as an approach to solving the problem.
4.1.1 Modelling Environment
Netlogo [Wilensky, 1999], a programmable modelling environment for simulating
natural and social phenomena, was chosen as the platform to develop the agent based
model described here. The following are some of the features of netlogo that
prompted its choice as the modelling environment:
(1) Netlogo is well suited for modelling complex systems that develop over time.
Many naturally occurring phenomena evolve over time i.e. the emergent
property stabilises with numerous local interactions. In case of the model
presented in this chapter, agents collectively decide how to divide their
workforce depending on the task demand. The collective decision made by
the agents is an emergent property that arises through numerous interactions
between the agents.
(2) Netlogo is capable of deploying hundreds and thousands of autonomous
agents all following their behavioural rules concurrently.
Page 122
120
(3) Direct interactions between agents as well as stigmergic interactions between
the agents and the environment can be easily implemented.
(4) Netlogo comes with a powerful interface builder which facilitates the
parameters to be varied easily.
(5) It also has a behaviour space tool which can collect data from multiple runs
of a model. This can later be used to analyse the effect of different
parameters on the performance of the system.
4.2 Description of the Model
One of the main objectives of this research is to design and develop a decentralised,
flexible, robust and scalable task allocation model for a swarm of agents that can self
organise by following some simple behavioural rules and allocate tasks dynamically
in response to the needs of the colony. Similar models, in this area have been
presented by other researchers (for further description of these models see chapter 3):
however in most of these models, the number of tasks involved, the level of
communication and the number of agents used in the simulations were limited. In
this chapter, a more complex system (in terms of the communication, number of
agents and tasks) has been designed and analysed to see how agents perform in such
situations. Furthermore the models presented in this thesis use a number of novel
strategies to improve the efficiency of the colony. A threshold based approach has
been utilised in the design of the model. The microscopic behaviours of the agents
were formulated on the basis of inspiration from the behaviour of ant individuals,
and their tendency to vary their propensity for carrying out a task depending on (1)
how successful or unsuccessful they were in carrying out tasks, (2) the task demand
(stimuli of the task) and (3) interaction with other individuals.
Page 123
121
The model, used in chapters 4 and 5, consists of an environment (2D grid world)
populated with three types of agents (dynamic foragers and brood carers and static
brood members), a nest comprising four chambers (dump area, brood carer chamber,
brood chamber and foragers’ resting area), stimuli (chemical signals, chambers’
odour) and food items initially located at the top right hand corner of the
environment. The topology of the world is non-torroidal – more specifically referred
to as “box” as the world is bounded in all dimensions. The space is treated in discrete
patches (71 × 51) however the movement of the dynamic agents is modelled in
continuous space so that at each time step t, each agent’s floating point coordinate is
mapped to an integer type coordinate of the local patch. Chemical signals
(pheromones and shouting chemical) are emitted by agents (laden foragers while
returning to the nest and hungry brood members) while unique odours are emitted
from the different chambers of the nest. Each agent possesses orientation and follows
simple local rules as described later. Brood members are immobile and can either be
in the hungry or non-hungry state depending on the hunger level of the individual.
Foragers and brood carers, on the other hand, are mobile and can dynamically switch
their roles depending on the need of the colony.
The remaining of this section gives a more detailed description of the components of
the model.
Page 124
122
4.2.1 Nest
The model consists of a nest (located at the bottom of the environment) comprising
four separate chambers: one for each type of agent (brood chamber, brood carers’
chamber and foragers’ resting area) and a dump area for temporary storage of food
(figure 4.1). The dimensions of the four chambers are as follows:
Brood chamber and brood-carer chamber: 27 × 7
Foragers’ resting area: 9 × 7, and
Dump area (DA): 10 × 6
Such nest designs (consisting of separate chambers) are evident in many species of
ants including that of the red harvester ants, Pogonomyrmex barbatus [Gordon,
1999] and leaf cutter ants, Atta colombica. Each of the chambers has its own odour.
The odour is spread over the environment in such a way that its intensity falls
linearly from its respective centre (the intensity of local stimuli is modelled discrete).
Thus each of the four types of smells/ odours creates a potential gradient uphill
towards their respective centre of the chamber.
Fig 4.1: Snapshot of the model
Brood chamber
Brood-carer chamber
food
pheromones
DA
Foragers’ resting area
Page 125
123
4.2.2 Behavioural Rules
Individual agents have limited perception and communication range and follow
simple local rules. This section describes the behavioural rules each agent type
follows using indirect communication.
4.2.2.1 Brood
Each brood member can be in one of the two states: hungry or non-hungry. Initially
all the brood members are in the non-hungry state having a randomised hunger level.
At every simulation time step, the hunger level of each brood member increases by
its hunger rate (eq. 4.1) which is distributed randomly between 0 and 1 across the
population of brood members (Fig. 4.2). The difference in the hunger rate in
individuals allows the brood members to get hungry at different instants – thus
making the demand for feeding more stochastic. Furthermore, this is in line with real
ants where the hunger rate of the brood members has been found to be a function of
a number of factors including their appetite, the ability to communicate their hunger
to the workers and also the life-stages of the brood members [Cassill and Tschinkel,
1999]. When the hunger level of a brood member exceeds some threshold (thh), it
switches its state to hungry, and seeks the attention of the brood carers by emitting a
chemical signal instantaneously (termed ‘shouting chemical’ here) (Fig. 4.3). The
strength of the shouting chemical is modelled to fall linearly with the distance from
the hungry brood member so as to have its maximum strength at the location of the
hungry brood member and its minimum at the periphery of the shouting-radius. The
strength of the chemical is zero if the distance between a patch and the hungry brood
member is more than the shouting-radius (eq. 4.3). If a hungry brood member is fed
Page 126
by a brood carer, the hunger level of the brood member decreases by some constant
value (Efood; see Table 4.1)
its state back to the non
members are fed upon request i.e. the non
Fig 4.2: Hunger rate dis
Fig 4.3: Shouting chemica
HLt+1
where 10 ≤≤ HR
=tHS
0
0.2
0.4
0.6
0.8
1
1.2
1 2
Hunger-
rate
124
by a brood carer, the hunger level of the brood member decreases by some constant
; see Table 4.1) and when it falls below thh, the brood member switches
its state back to the non-hungry state (eq. 4.2) (Fig. 4.4). In the model, brood
members are fed upon request i.e. the non-hungry brood members are not fed.
Hunger rate distribution across brood members of the brood in one of the runs
houting chemical emitted by hungry brood members (hungry brood member and the
shouting chemical are shown in pink)
HRHLt +=1 (4.1)
= {ht
ht
thHL
thHL
<
≥
,0
,1 (4.2)
Hunger rate distribution
3 4 5 6 7 8 9 10 11 12 13 14 15 16 17
Brood
by a brood carer, the hunger level of the brood member decreases by some constant
, the brood member switches
In the model, brood
hungry brood members are not fed.
tribution across brood members of the brood in one of the runs
(hungry brood member and the
18 19 20
Page 127
125
Where,
1+tHL is the new hunger level (i.e. at time step t + 1) of the brood member,
tHL is the previous hunger level (i.e. at time step t) of the brood member,
HR is the hunger rate of the brood,
tHS is the hunger state (at time step t) of the brood member;
1 = hungry state and 0 = non-hungry state, and
hth is the threshold parameter of the hunger level.
=SCC {srx
srxBxA
>
≤−
,0
, (4.3)
where,
SCC is the concentration level of the shouting chemical,
x is the Euclidian distance from the centre of the hungry brood,
sr is the shouting radius, and
A = sr , B = 1.
Fig 4.4: Hunger level of a brood member as a function of time (the reduction of the hunger level is
due to being fed by brood carers; the pink line indicates the threshold level of the brood member to
get hungry)
Hunger Level of an individual larva
0
100
200
300
400
500
600
700
800
1 183 365 547 729 911 1093 1275 1457 1639 1821 2003 2185 2367 2549 2731 2913 3095
Simulation step
Hu
ng
er
Le
ve
l
Page 128
126
4.2.2.2 Brood Carers
Brood carers update their thresholds as a response to the stimuli perceived. Once a
brood carer makes the decision to feed a hungry brood member (the decision making
process is discussed later in this chapter), it goes to the dump area (DA) of the nest in
search of food. It uses its local sensing to smell the scent of the dump area at its
immediate patch ahead, patch left and ahead and patch right and ahead. The brood
carer then compares the relative strength of the scents in the three directions and
moves in the direction of the strongest scent. If the scents in all the three directions
are equally high, the brood carer goes forward. This simple local interaction with the
environment allows the brood carer to locate the DA. Once the agent reaches the
dump area, it moves randomly within it to find a piece of food and when successful
(i.e. when it is on the same location as that of the food item), picks the food item up
and travels towards the brood chamber following the odour of the brood chamber in
search of a hungry brood member.
When the brood carer reaches the brood chamber, it uses the potential gradient of the
shouting chemical to go uphill in order to locate a hungry brood member. After
locating a hungry brood member, the brood carer feeds it causing the brood
member’s hunger level to be reduced by a constant value (in the simulation, it is
assumed that all food items provide the same energy).
4.2.2.3 Foragers
The principal task of foragers is to collect food items from the environment. They
start from their chamber and travel randomly in search of food items. If an agent
Page 129
127
finds a piece of food, it picks the food item up, becomes laden, rotates 1800 and
travels towards the dump area of the nest. While travelling, both foragers and brood
carers wiggle (i.e. move its heading by small random angles). Wiggling allows the
movement of the foragers and brood carers to be ant like. Laden foragers use local
sensing to navigate around potential gradient to reach the dump area. When a forager
picks up a food item, the amount of food available in the environment decreases. If
the amount of food present in the environment falls below some specific value (10
units in the model), a random amount of food (between 1 and 20) is produced in the
environment (in random location). Thus the amount of food available in the
environment never falls to zero. As the laden agent travels towards the nest, it drops
simulated chemicals called pheromones (that both diffuse and evaporate) in the
environment. Once the agent reaches the DA, it leaves the food item there, evaluates
what action to carry out next and starts executing the task to be carried out. When
unladen agents find pheromones in the environment, they use the chemical signal to
travel uphill towards the food source. If there is not enough food available in the
environment it would result long searching time for the forager to find a food item. If
the forager takes too long to find a food item, she abandons the foraging task, goes
back to her chamber and rests for a predefined time.
4.3 Task switching mechanism
Behavioural plasticity is one of the desirable features in a multi-agent system since it
enables agents to redistribute the workforce (as required) in a highly stochastic
environment enabling the system to be extremely adaptive to changing environment.
In this model, for instance, if there is less food (than some minimum threshold
Page 130
128
parameter) available in the dump area then task switching of some brood carers to
foragers would help in coping with the changing environment. Similarly, when more
brood members are hungry, switching of some foragers to brood carers and
strengthening the brood carer workforce would also be a desirable behaviour. This
behavioural plasticity has been implemented by means of a threshold based
mechanism.
The mobile agents, at any time t, can carry out any of the three tasks: foraging, brood
caring or resting. Each of the mobile agents maintains three threshold parameters: tf
(threshold for foraging), tr (threshold for resting) and tbc (threshold for brood caring).
Threshold values, in the simulations, are constantly updated to meet the changing
demand. Updating the thresholds updates the probability for a particular task to be
chosen by an agent depending on the demand of the task and is a widely used
technique for allocating tasks on the fly [e.g. Bonabeau et al., 1996; Labella et al.,
2004, Liu et al., 2007a,b; Momen and Sharkey, 2008, 2009a,b, 2010]. We use a
simple but effective principle (as observed from the behaviour of social insects) for
updating the thresholds:
(1) The threshold value for a particular task is decreased (i.e. the probability for
carrying out the particular task is increased) if either the agent has successfully
completed the task (and hence is motivated to carry out the same task further) or has
received a stimulus for that task.
(2) The threshold value for a particular task is increased if either an agent has been
unsuccessful in carrying out the task or hasn’t experienced a stimulus for a long
time.
Page 131
129
The above two principles are built on the behaviour that many ant species are
reported to have displayed [e.g. Greene and Gordon, 2007, Gordon, 2002, Theraulaz
et al., 2001].
The selection of which task to carry out next is modelled in the following way:
(1) Let },,min{arg bcrfxtcarryoutne tttT = where Tcarryoutnext is the next task candidate.
(2) A random number, R, is generated between 0 and 1. If R <= 0.7, Tcarryoutnext is
selected otherwise the agent would continue carrying out the task it is currently
doing.
Thresholds of mobile agents are constantly been updated in the model (described
previously) over the simulation period. Whenever a threshold value needs to be
changed (either increased or decreased), it is adjusted by a small value (adaptation-
rate = 0.09; Table 4.1). Using the principles adopted for updating thresholds, the
following behavioural rules for foragers and brood carers are formulated:
(1) If an agent perceives the shouting chemical, it realises that a brood
member needs to be fed. The stimulus of feeding the brood member
causes the agent to reduce its tbc.
(2) When an agent is at the DA, it knows the amount of food available
there from the cumulative smell of it. If the amount of food at DA is
below the lower threshold of food, more food needs to be
accumulated – hence it reduces its tf and increases the tr.
(3) Similarly, if the amount of food at DA exceeds the upper threshold of
food, it does not need to do further foraging as there is already enough
Page 132
130
food present in the DA. Rather the agent should carry out other tasks.
Hence it increases the tf and reduces the tbc and tr.
(4) When a brood carer goes to the DA of the nest to pick up a piece of
food in order to feed a hungry brood member, it finds the food by
walking randomly inside the DA. It also keeps track of how long it is
searching for food inside the dump area. If the searching time exceeds
some critical allowed time (50 time steps), it reduces its tf and
increases tbc since there is not just enough food in the DA.
(5) If a forager is searching for a food item for a long time and is
unsuccessful, it assumes that there is not enough food in the
environment. Hence it reduces the tr and increases its tf.
(6) Both foragers and brood carers keep timing records of how long they
have rested for inside the chamber. If the resting time exceeds some
allowed time (50 time steps), they increase their tr (for both foragers
and brood carer) and reduce the tf (if it is a forager).
(7) If a forager is successful in bringing a food item back to the
environment, it gets a positive reward and reduces its tf.
At any time the thresholds are bounded between -5 and +5. If the threshold exceeds
+ 5, that threshold is set to the maximum possible value for the threshold (+5).
Similarly if the threshold value is below -5, it is set to the lowest possible value of
the threshold which is -5.
4.4 Parameters Used
The list of parameters used is outlined in table 4.1.
Page 133
131
Parameter Meaning Value(s) used
Nb Number brood members 5 – 20, 50
S Number of mobile agents
(i.e. number of foragers
[Nf] + number of brood
carers [Nbc])
20 – 100
Rf-bc Initial ratio of foragers to
brood carers. This can be
used to determine the
number of foragers and
brood carers as follows:
SRN bcff ×= −
fbc NSN −=
0.2, 0.5, 0.9
Epheromones Evaporation rate of
pheromones
5%
Dpheromones Diffusion rate of
Pheromones
60%
Adaptation-rate The rate at which the
thresholds are adapted
0.09
Shouting-radius The number of patches
the brood member can
shout when it gets hungry
7
Esc Evaporation rate of
shouting chemical
50%
Page 134
132
Ufood Upper threshold of food 40
Lfood Lower threshold of food 5
max-separate-turn The maximum angle an
agent can turn when
avoiding another agent
1.250
Efood Energy provided by the
food which causes the
hunger level of the brood
member fed to decrease
100
Thh Threshold parameter of
the hunger level
500
Table 4.1: Parameters used in the model
4.5 Measure of Performance
The performance of the task allocation strategy is measured by the mean hunger
level of the brood at the end of the simulation. As an example, if there are 5 brood
members and their corresponding hunger levels at the end of the simulation are 510,
515, 520, 500 and 500, then the mean hunger level would be
b
membersbrood
n
HL∑−∀ = 509
52545
=
For the purpose of evaluating the performance of the task allocation strategy, the
following measure has been used:
bh
memberbrood
nth
HL
LHA×
=∑
−∀...
(4.4)
Page 135
133
where thh is the threshold parameter of the hunger level and A.H.L. is the average
hunger level of the brood. It needs to be noted here that since our objective is to
regulate the hunger level of the brood, the lower the value for A.H.L. we obtain, the
better is the performance of the strategy used.
Figure 4.5 shows how the characteristic curve for A.H.L. varies under different sets
of parameters. As evident from figure 4.5, the A.H.L. initially increases linearly
followed by a non-linear curve indicating that the system is trying to regulate the
hunger level. The initial linear increase of the A.H.L. is due to the linear rise of the
hunger level of the brood members (below the Thh) during the initial duration for the
brood carers to start bringing food items back to the hungry brood member. When
the hunger level is below Thh, brood members do not advertise that they are hungry.
However when the hunger level of the brood member exceeds Thh, it advertises its
hunger by emitting shouting chemical. As hungry brood members are being fed, the
overall rate of hunger level falls resulting the nonlinear curve in figure 4.5. Finally as
the agents are able to meet the requirements of the hungry brood members, the curve
starts getting more and more flat. However, there is always some fluctuation due to
the constant increase of the hunger level of the brood members at their
corresponding hunger rate.
Page 136
134
a. Nb = 25, S = 60, Rf-bc = 0.2
b. Nb = 25, S = 60, Rf-bc = 0.9
0
0.2
0.4
0.6
0.8
1
1.2
1.4
0
11
1
22
2
33
3
44
4
55
5
66
6
77
7
88
8
99
9
11
10
12
21
13
32
14
43
15
54
16
65
17
76
18
87
19
98
21
09
22
20
23
31
24
42
25
53
Av
ea
ge
hu
ng
er
lev
el
Simulation time steps
Average Hunger Level
0
0.2
0.4
0.6
0.8
1
1.2
1.4
0
97
.5
19
5
29
2.5
39
0
48
7.5
58
5
68
2.5
78
0
87
7.5
97
5
10
72
.5
11
70
12
67
.5
13
65
14
62
.5
15
60
16
57
.5
17
55
18
52
.5
19
50
20
47
.5
21
45
22
42
.5
Av
era
ge
hu
ng
er
lev
el
Simulation time steps
Average Hunger Level
Page 137
135
c. Nb = 5, S = 30, Rf-bc = 0.2
d. Nb = 15, S = 40, Rf-bc = 0.2
Fig 4.5: Average hunger level of the brood (Nb = number of brood members, s = number of foragers
and brood carers and Rf-bc = initial ratio of foragers to brood carers)
0
0.2
0.4
0.6
0.8
1
1.2
1.4
0
26
2.5
52
5
78
7.5
10
50
13
12
.5
15
75
18
37
.5
21
00
23
62
.5
26
25
28
87
.5
31
50
34
12
.5
36
75
39
37
.5
42
00
44
62
.5
47
25
49
87
.5
52
50
55
12
.5
57
75
60
37
.5
Av
era
ge
hu
ng
er
lev
el
Simulation time steps
Average Hunger Level
0
0.2
0.4
0.6
0.8
1
1.2
1.4
0
91
.5
18
3
27
4.5
36
6
45
7.5
54
9
64
0.5
73
2
82
3.5
91
5
10
06
.5
10
98
11
89
.5
12
81
13
72
.5
14
64
15
55
.5
16
47
17
38
.5
18
30
19
21
.5
20
13
21
04
.5
Av
era
ge
hu
ng
er
lev
el
Simulation time steps
Average Hunger Level
Page 138
136
4.6 Results Obtained
The model is designed by taking inspirations from the behaviour of ant colonies and
is expected to build a system that would be scalable, flexible as well as robust. In
order to test if the behavioural rules designed (discussed in Section 4.2 and 4.3) lead
to such a system, a series of experiments have been conducted. Each simulation, for
a particular experiment, is run 20 times for 5000 simulation time steps. The mean
readings from the 20 simulations runs are then calculated from which the
performance of the task allocation mechanism is evaluated. Experiments were
conducted to obtain the answers to the following questions: Is the system that
emerges (1) scalable?, (2) flexible? and (3) robust?
A. Is the system scalable?
A system is said to be scalable if it can operate under wide range of group sizes
[Şahin, 2005]. The performance of the swarm can vary with the number of agents
involved – however increases or decreases should not prevent the system from
operating. Swarm intelligence systems are highly decentralised systems which
ensure the scalability of the swarm. To test if the system is scalable, experiments
have been carried out with various swarm and brood sizes. The results are presented
in figure 4.6.
Page 139
137
Fig 4.6: Average hunger level of the brood as a function of the swarm size (where x-axis represents
the total number of foragers and brood carers and A.H.L. = average hunger level at the end of the
simulation run)
From figure 4.6, it is evident that an increase in the size of the swarm reduces the
average hunger level of the brood members and hence improves the performance of
the system. It can also be seen from figure 4.6 that with greater number of brood
members the average hunger level increases and vice versa. However, with the
increase in the number of foragers and brood carers, the average hunger level
decreases and hence the system performs better. Furthermore, it should be noted that
the operation of an individual agent is not dependent on any other agent(s) – hence
the system functions fully with different group sizes – however the performance of
the system depends on a number of factors including swarm size, availability of food
and the hunger level of the brood members. For the purpose of scalability tests, the
number of dynamic agents is varied between 20 and 100 (for other tests, the number
is limited between 20 and 60) to check if the average hunger level unexpectedly
increase with the number of dynamic agents or not.
0
0.5
1
1.5
2
2.5
3
3.5
4
20 30 40 50 60 70 80 90 100
A.H
.L.
Average Hunger Level
b = 5
b = 15
b = 25
Page 140
138
Since (1) the agents are completely decentralised and (2) the performance improves
with the increase in the number of worker agents, the swarm exhibit scalability.
B. Is the system flexible?
A system can be called flexible if it has the ability to distribute agents dynamically in
response to the changing demand. The system might start with some initial
configuration (for instance with some particular ratio of the agents allocated to the
tasks) but it should be able to adapt the number of agents in response to the task
demand.
In order to test the flexibility of the system, experiments were conducted with the
same value of S (number of foragers + number of brood carers) but different Rf-bc
(initial ratio of foragers to brood carers)[0.2, 0.5, 0.9]. Each experiment was repeated
20 times for 5000 simulation steps and the average hunger level for every run was
recorded. The experiment is then repeated in this fashion but with different values of
S (ranging between 20 and 60) and brood sizes (5, 15, 25).
Now, if the system is flexible, it should be expected that a similar A.H.L. should be
obtained for the same brood and swarm sizes even if there is a difference in the
initial ratio of the foragers to brood carers. The system modelled is highly stochastic
and hence statistical measures have to be taken into account in order to scrutinise the
differences. The mean values of the A.H.L. of the brood with different values of S
and Rf-bc (“r” is used for simplicity) are shown in Table 4.2 and Table 4.3.
Page 141
139
S=20,
r=0.2
S=20,
r=0.5
S=20,
r=0.9
S=30,
r=0.2
S=30,
r=0.5
S=30,
r=0.9
S=40,
r=0.2
S=40,
r=0.5
S=40,
r=0.9
Nb = 5 2.21 2.59 2.25 1.43 1.47 1.54 0.97 1.07 1.08
Nb = 15 3.37 2.78 3.34 2.11 2.51 2.11 1.85 1.82 1.76
Nb = 25 3.73 3.55 3.75 2.74 2.93 3.10 2.24 2.40 2.47
Table 4.2: Mean Hunger Level
S= 50,
r = 0.2
S= 50,
R = 0.5
S= 50,
r = 0.9
S= 60,
r = 0.2
S= 60,
r = 0.5
S= 60,
r = 0.9
Nb = 5 0.91 1.03 1.02 0.94 1.05 1.16
Nb = 15 1.19 1.40 1.51 0.94 0.82 1.08
Nb = 25 1.43 1.90 1.68 1.26 1.40 1.50
Table 4.3: Mean Hunger Level
Each of the mean values shown in Table 4.2 and 4.3 are the results of average of 20
trials. If the system is flexible, it is expected that the initial ratio of the agents (i.e. r)
should not influence the A.H.L. rather the agents would constantly switch tasks to
serve the demand of the system. To test the flexibility, therefore, a significance test
needs to be carried out.
There are two types of statistical tests (namely parametric and non-parametric tests)
that can be conducted on the data sets to check if they significantly differ from each
other or not. One of the differences between the two tests is that the parametric test
assumes that the data sets are normally distributed whereas on the other hand, non-
parametric tests do not make any assumption on the distribution of the data.
Therefore, in order to decide which test to carry out, the data sets need to go through
normality tests.
To check for normality, one can either conduct Kolmogorov-Smirnov test (also
called KS test) or Shaprio-Wilk test. KS test is usually preferred for large sample
size whereas Shapiro-Wilk test is preferred for sample size < 50 although it can be
Page 142
140
applied to large sample sizes. In our case, the sample size is less than 50 and
therefore the Shapiro-Wilk test is preferred to check for normality.
SPSS (statistical package for social science) is used to carry out all statistical
analyses. Table 4.4 indicates the results for the normality tests carried out on the data
sets with brood size = 5.
Tests of Normality
Kolmogorov-Smirnov
a Shapiro-Wilk
Statistic df Sig. Statistic Df Sig.
B=5 s =20
r = 0.2 .148 20 .200
* .932 20 .172
B=5 s=20
r=0.5 .207 20 .025 .850 20 .005
B=5 s=20
r=0.9 .118 20 .200
* .967 20 .699
B=5 s=30
r=0.2 .179 20 .091 .921 20 .104
B=5 s=30
r=0.5 .212 20 .019 .755 20 .000
B=5 s=30
r=0.9 .223 20 .011 .734 20 .000
B=5 s=40
r=0.2 .213 20 .017 .853 20 .006
B=5 s=40
r=0.5 .396 20 .000 .666 20 .000
B=5 s=40
r=0.9 .273 20 .000 .797 20 .001
Page 143
141
B=5 s=50
r=0.2 .260 20 .001 .808 20 .001
B=5 s=50
r=0.5 .321 20 .000 .688 20 .000
B=5 s=50
r=0.9 .283 20 .000 .790 20 .001
B=5 s=60
r=0.2 .337 20 .000 .744 20 .000
B=5 s=60
r=0.5 .334 20 .000 .560 20 .000
B=5 s=60
r=0.9 .312 20 .000 .644 20 .000
a. Lilliefors Significance Correction
*. This is a lower bound of the true significance.
Table 4.4: Normality tests on data sets with brood size = 5
Shapiro-Wilk test assumes that if the significant value (the last column of table 4.4)
is greater than 0.05, then the data is normally distributed otherwise the data
significantly deviates from normal distribution. From table 4.4, it is evident that
although for some data sets the significance value is greater than 0.05 (i.e. the data
set is normally distributed), there are also some data sets where Shapiro-Wilk’s
significance value is less than 0.05 and hence the data sets deviate significantly from
the normal distribution. Since some data sets deviate significantly from normal
distribution, it is preferred to refrain from assuming any distribution of the data.
Hence, non-parametric tests are preferred to that of the parametric tests. Figure 4.7
shows quantile-quantile (Q-Q) plots of some of the data sets that were tested for
normality.
Page 144
142
A
B
C
D
Fig 4.7: QQ plot for brood size = 5 and (a) S = 20, r = 0.2, (b) S = 20, r = 0.5, (c) S = 30, r = 0.5, (d) S
= 30, r = 0.9
QQ plots also show how closely the data sets resemble normal distribution. If the
data sets on the QQ plot are close to the diagonal line, the data set can be considered
to be normally distributed. The data sets in figure 4.7 (A) & (B) are close to the
diagonal line and hence can be said to conform normal distribution. However, the
data sets in figure 4.7 (C) & (D) are clearly distant from the diagonal line and
Page 145
143
therefore the data sets in figure 4.7(C) and (D) do not follow normal distribution.
This graphical interpretation is in agreement with the results shown in Table 4.4.
Now, that it has been confirmed that some data sets deviate significantly from
normal distribution, the use of non-parametric tests compared to that of the
parametric tests is strongly justified.
From this onwards, in matters of using statistical tests, the following principles are
adopted. The principles adopted are in line of standard statistical practices [Greene
and D’Oliviera, 2006; Sokal and Rohlf, 1981].
1. Non parametric tests are used since no assumption is made regarding the
nature of the distribution of data. Use of parametric tests could have been
well justified if the distributions of the datasets follow normal distribution.
However, the results presented above shows that many of the data for
average hunger level significantly deviate from normal distribution and hence
the use of non-parametric tests is preferred.
2. If there exists more than two experimental conditions, a Kruskal Wallis test
using Bonferroni correction is performed to check if the data sets across the
experimental conditions significantly differ from each other or not. However,
if the experimental conditions tested are limited to only two, a planned
comparison using Mann Whitney tests is performed.
3. If the Kruskal Wallis test (using Bonferroni correction) reveals significant
difference in the data sets across the experimental conditions, planned
comparison Mann Whitney tests are performed to analyse if two chosen data
sets significantly vary from each other or not.
Page 146
144
4. For data sets that reject the null hypothesis on Mann Whitney tests, a
Bonferroni correction is furthermore used to find which data sets reject null
hypothesis under a very stringent test.
If the system is flexible, the average hunger level (A.H.L.) should not significantly
differ as long as the brood size and the number of agents stay the same (whatever the
initial ratio of the foragers to brood carers be). A Kruskal-Wallis test was chosen to
check if such is the case or not. Table 4.5 summarises the results obtained using the
Kruskal-Wallis test.
Test Statisticsa,b
Data
Chi-Square 1.517
Df 2
Asymp. Sig. .468
a. Kruskal Wallis Test
b. Grouping Variable: r
I.
Test Statisticsa,b
Data
Chi-Square .035
Df 2
Asymp. Sig. .982
a. Kruskal Wallis Test
b. Grouping Variable: r
II
Test Statisticsa,b
Data
Chi-Square .260
Df 2
Asymp. Sig. .878
a. Kruskal Wallis Test
b. Grouping Variable: r
III
Test Statisticsa,b
Data
Chi-Square .744
Df 2
Asymp. Sig. .689
a. Kruskal Wallis Test
b. Grouping Variable: r
IV
Test Statisticsa,b
Data
Chi-Square 2.908
Df 2
Asymp. Sig. .234
a. Kruskal Wallis Test
b. Grouping Variable: r
V
Table 4.5: Kruskal-Wallis tests for brood size = 5 and (I) S = 20, r = 0.2, 0.5, 0.9, (II) S = 30, r = 0.2,
0.5, 0.9, (III) S = 40, r = 0.2, 0.5, 0.9, (IV) S = 50, r = 0.2, 0.5, 0.9, (V) S = 60, r = 0.2, 0.5, 0.9.
Page 147
145
Kruskal-Wallis test assumes:
H0 (null hypothesis): 321 MMM == i.e. the medians do not significantly vary
H1 (alternative hypothesis): the median of the three data sets significantly deviate
from each other.
If the p-value of the Kruskal-Wallis test < 0.05, then H0 is rejected. The significant
value is always found to be greater than 0.05 (table 4.5). Therefore the null
hypothesis is accepted and it is concluded that data sets do not significantly vary
from each other for the same swarm size but different initial ratio of the foragers to
the brood carers. Consequently, it means that the ratio (r) is irrespective with the
mean hunger level i.e. whatever the initial configuration is, the agents self organise
depending on the task demand (which means the system is highly flexible). Tests
with brood size = 15 and 25 also reveals that initial ratio (r) does not affect the
average hunger level of the brood.
Figure 4.8 (a and b) depicts two situations in which agents constantly switch their
states in order to respond to the changes in the hungry broods’ demands.
Page 148
146
a
b
Fig 4.8: Variation of foragers and brood carers in order to respond to the changing demand by the
brood: a) brood size = 10, total number of foragers and brood carers = 40; b) brood size = 20, total
number of foragers and brood carers = 40.
The agents constantly switch their states in order to meet the changing demand.
Initially, there are low numbers of brood carers since brood members are initially not
hungry. But as the number of hungry brood increases, more agents start switching
from the foraging task to the brood caring task resulting in an increase in the number
of brood carers. When the demand for brood caring is high, as in Fig 4.8 (b)
compared to that of Fig 4.8 (a), the number of agents switching to foraging task is
Page 149
147
also high – thus trying to regulate the demands. The reader is advised to refer to
Chapter 5 (Section 5.4) for a further explanation of this behaviour.
Since it has been found that there is no statistical difference between the average
hunger level of the colony despite different initial ratio of foragers to brood carers, it
implies that the agents can switch comfortably to meet the demand of the colony i.e.
the swarm exhibits flexibility.
C. Is the system robust?
Robustness refers to the ability of the system to continue to operate (although at
lower performance) despite failures of the individuals or perturbations in the
environment [Şahin, 2005]. Self-organised systems are, in general, robust due to a
number of factors including (1) decentralised coordination, which ensures that the
system does not depend on any particular agent and hence does not suffer from any
bottlenecks, (2) redundant homogeneous agents, which ensures that even if some
agents do not function properly, there would be other agents to take up the job and
(3) numerous local interaction between the individuals, which allows the stimulus of
any task to propagate within the swarm even if some agents do not function properly.
The model presented in this chapter has these three attributes (i.e. decentralised
coordination, redundant homogeneous agents and numerous local interactions
between the agents) and therefore can be expected to operate in a robust manner.
To establish whether the model is robust or not, the model presented initially has
been altered in the following ways:
1. The agents operate normally in the way described in the original model.
Page 150
148
2. Except that at the 500th simulation time step, 10 random agents (foragers or brood
carers or a mixture of both) are removed.
3. Experiments were carried out with brood size = 15 in the same manner as previous
experiments (i.e. each experiment was repeated 20 times and the average hunger
level has been recorded). Experiments were repeated with S = {20, 30, 40, 50} each
repeated 20 times.
Figure 4.9 shows the comparisons of the results obtained when 10 agents
malfunction in the middle of the operation to the results obtained from the original
model where all the agents continue to function fully.
Fig 4.9: Robustness of the model (s = total number of foragers and brood carers and A.H.L. = average
hunger level of the colony at the end of the simulation)
It is apparent from Figure 4.9, that the model continues to operate (although at a
slightly reduced performance) even when 10 agents malfunction during the course of
the experiments, indicating that the model presented is robust. Furthermore, it is
evident from figure 4.9 that the robustness of the system improves with the number
of the dynamic agents. This is because when there is greater number of redundant
Average Hunger Level
0
0.5
1
1.5
2
2.5
3
3.5
4
4.5
20 30 40 50
S
A.H
.L.
Model when Perturbed
Original model
Page 151
149
agents available, then the likelihood of another agent taking up the job of a
malfunctioned agent is more.
4.7 Discussion
It is claimed that the results obtained from this model are coherent with what is
observed in the real ant-world. Ant colonies are known to be extremely flexible and
hence adaptive to the changing demand. For example, Greene and Gordon reported
that they extracted and isolated the cuticular hydrocarbons of the patrollers of the red
harvester ants [Greene and Gordon, 2007]. Patroller mimics were then created by
coating a bead with one ant equivalent of hydrocarbons. The beads with coated
hydrocarbon profile were then thrown in front of the nest entrance to see if the
patroller mimics caused the ants in the nest to come out and forage [In red harvester
ants, the return of successful patrollers trigger foraging activity]. When the rate of
simulated patroller return was increased, the rate of foragers coming out of the nest
was found to increase. Gordon, in another experiment, changed the condition of the
environment by placing a pile of toothpicks in front of the nest entrance. This causes
a barrier for the foragers and patrollers to come out of the nest and carry out the
foraging task. Gordon reported that in such conditions, it was found that there was an
increase in the number of nest maintenance workers i.e. workers residing deep inside
the nest were found to be shifted to nest cleaning work indicating that they were
flexible towards the changing environment. Theraulaz et al., in 2001, discusses
flexibility observed in the ponerine ants. The workers of E.ruidum ant species work
as either stingers or transporters depending on the circumstances. When live
drosphila (fruit flies) are presented to the colony, the ants start behaving as stingers.
As more drosphilas fall off, the need for transporting these increases and
Page 152
150
consequently the ants shift part of the work force from stingers to transporters in
order to meet the demand for transporting the drosphilas. This shows how easily ant
individuals can adapt to the changing demand.
The model shows close resemblance to the behaviour of ant colonies in many ways
including the emergence of a system that is (1) scalable, (2) robust and (3) flexible.
The threshold based techniques employed in this model are similar to the adaptive
threshold based techniques employed in various models. However, in our models
each agent uses three thresholds and the competition between the thresholds gives
rise to the task the agent is going to carry out next. Furthermore, unlike many early
models, the model described in this chapter captures all the basic features of eusocial
insects as described by Wilson [Wilson, 1971] (i.e. division of labour, overlapping of
generations (e.g. brood and workers) and cooperative brood caring for the hungry
brood members).
4.8 Conclusion
A task allocation and task switching model for a simulated swarm of autonomous
mobile agents has been presented here. The model contains a rich set of interactions
between agents. The communication between agents, presented in this model, is
stigmergic. The model employs a threshold based approach for adapting to changing
demands and is strongly inspired by the behaviour of eusocial insects. Simple local
rules have been developed for the agents that allow them to self organise and adapt
to the changing environment as needed by the colony. With the simple behavioural
rules, the modelled swarm demonstrates:
Page 153
151
(1) An improved performance with increases in the size of the swarm (which makes
it scalable)
(2) Flexibility between workers, and
(3) Robustness to the perturbations of the environment
A performance measure for the model has also been presented which will be used in
later chapters (Ch-5 and Ch-6) when comparing different task allocation strategies.
Page 154
152
Chapter 5
Performance Analysis of Explicit and Indirect
Communication
Effective communication is an extremely vital element for the enormous success that
insect colonies accrue. Social insects constantly face numerous challenges including
environmental disruptions (e.g. nest damages by flood, wind etc…), predator attacks,
pathogens and even inter-colonial disturbances. Besides external perturbations,
insect societies also face constant challenges from within the colony (including the
need for nurturing the young brood members, cleaning and repairing of nests, food
retrieval and processing, guarding nests and so on). In order to cope with both
external and internal challenges, ant colonies need to develop effective
communication mechanisms. In fact insect societies are known to employ wide range
of communication mechanisms depending on need and circumstances. Means and
strategies of communication usually vary from one colony to another and depend on
a wide number of factors (including environmental conditions, nest complexity, size
of the colony and urgency of the task that is needed to be carried out).
Of various communication mechanisms, indirect communications among nest-mates
stand out as being very common. In indirect communication, nest-mates usually
communicate with each other via the environment (e.g. through the deposition of
Page 155
153
volatile chemicals as a means of signalling other nest-mates). Intriguingly, many ant
species are also found to use explicit communication in conjunction with indirect
communication. Explicit communications are exhibited within a shorter radius than
that of indirect communication and involve the use of one-to-one direct
communication between the individuals. Unfortunately, in contrast to indirect
communication, research related to the benefits of explicit communication is very
limited. In this chapter, an attempt is made to investigate the benefits of explicit and
indirect communication in a simulated colony of ants. Particularly, the question that
is posed in this chapter is whether the use of explicit communication along with that
of indirect communication would bring any benefit to the colony in relation to
circumstances in which they use indirect communication alone.
The rest of the chapter is organised as follows: Section 5.1 begins with a detailed
discussion of various modalities of communication used by eusocial insects
(typically ants). After the discussion of communication in social insects, an
investigation of the various strategies of communication across a range of genus is
highlighted. Following this, in section 5.3, a description of the proposed model is
given. The results obtained from section 5.3 are analysed in section 5.4. Finally, in
section 5.5, the chapter is concluded with some remarks on the results obtained.
5.1 Communication in eusocial insects
Social insects demonstrate a wide range of communication modes [Billen, 2006;
Jackson and Ratnieks, 2006] that include at least visual, acoustic, tactile, magnetic
and chemical means. Mechanisms of communication between individuals are mostly
Page 156
154
local and are exhibited through the transmission of signals (which can be of various
forms). A signal, in biological aspects, can be formally defined as any act or
structure which alters the behaviour of other organisms, which evolved because of
the effect, and which is effective because the receiver’s response has also evolved
[Smith and Harper, 2003]. The definition has some implications and therefore needs
some explanation. When signalling occurs, the behaviour of the receiver tends to
alter in a way that is favourable to the signaller. For instance, if a stag pushes another
stag backwards, it cannot be considered as a signal rather can be referred to as
coercion. However, if the stag roars and this causes the other stag to retreat, then it
can be referred to as a signal. This is because the action of the retreating stag
depended on the evolved properties of the brain and the sense organs of the receiver
[Smith and Harper, 2003]. The definition also clearly separates signal from cue, a
term first coined by Lorenz [Lorenz, 1939]. A widely accepted definition of cue was
provided by Hasson where he defined cue as any feature of the world, animate or
inanimate, that can be used by an animal as a guide to future action [Hasson, 1994].
Hölldobler and Wilson consider a cue to be a stimulus that can be used to convey
information but has not been shaped by natural selection to serve as communication
signal [Hölldobler and Wilson, 2008].
For the remaining of this section, different communication mechanisms exhibited by
eusocial insects (and typically ants) are discussed.
Page 157
155
5.1.1 Visual communication
Evidence for visual communication in ants and other social insects is weak in
comparison to the rich evidence of tactile and chemical communication [Billen,
2006; Hölldobler and Wilson 2008]. However there exist some species, such as the
genus Cataglyyphis and Gigantiops, with large eyes that are known to use vision to
detect moving prey, although unfortunately the actual mechanism for such
communication is not very well understood. Some species of ants are known to use
visual cues to navigate. Desert ants, for instance, are not keen on using chemical
signals to navigate due to the high rate of evaporation of the chemicals in hot desert.
Instead it is believed that these species use the polarized light of the sun [Wehner,
2003] to reach their destination. It is also known that bees use visual cues (such as
the sun) to find new hive during house hunting.
5.1.2 Acoustic communication
Many ant species are known to use vibrational signals in conjunction with other
commonly used signals (such as the chemical signals) to communicate. Two forms
of vibrational signals are often noticeable in various species: (1) body rapping
against substratum and (2) stridulation (i.e. rubbing of specialised body parts to
produce a “chirp”) [Hölldobler and Wilson, 1990]. The vibration of sound waves
through air as a means of communication is found to be the least probable. Instead,
in most cases the medium of vibration happens to be via the soil, nest wall or other
solid substratum. This is most likely due to the fact that most ants are nearly deaf to
airborne vibrations but sensitive to vibrations through substratum [Fielde and Parker,
Page 158
156
1904; Haskins and Enzmann, 1938]. Entomologists believe to have pinpointed at
least three functions of stridulation in various species and castes of ants [Hölldobler
and Wilson, 1990].
1. Leaf cutter ants, Atta are found to have used stridulation as an underground
alarm system in conjunction with other signals such as high concentrated
volatile chemicals.
2. Young queens of Pogonomyrmex (harvester ants) ants are often found to use
stridulation during the mating process. These ants usually gather in the
vegetation or ground during their nuptial flight where stridulation would be
effective. During the mating process, when the spermathecae of the queens
become filled, they stridulate vigorously signalling the male ants to stop the
courtship procedure. To the best of our knowledge, not a single case has so
far been encountered where the queens use stridulation as a means of
attracting the male ants.
3. Some species of ants (for instance, Leptogenys and Messor genus) are found
to employ stridulation in conjunction with pheromones to recruit nestmates
for foraging.
5.1.3 Magnetic orientation
Banks and Srygley suggested the possibility for leaf cutter ants to use magnetic cues
[Banks and Syrgley, 2003; also see Riveros and Srygley, 2008] to orient during
Page 159
157
foraging. In experiments with leaf cutter ants (Atta colombica), they tested the
orientation of the ants under magnetic fields of reversed polarity. With the sun’s disc
unobstructed by the cloud, ants were not found to be affected by the reversed
polarity of the magnetic field. However, in gloomy environments, the experimental
treatment was found to have significantly shifted their mean orientation both in
comparison with controls and reversed-polarity ants under the sky. Although a total
reversal in orientation was not obtained, they consider that the possibility of the use
of magnetic cues to navigate still remains. The ability of other ant species to perceive
earth’s magnetic field has also been demonstrated by many researchers [e.g. see
Anderson and Meer, 1993; Avalos et al., 1999].
5.1.4 Tactile communication
Tactile communication is one of the most frequently used communication techniques
in ant species. Ants (such as Pogonomyrmex barbatus) often use brief antennal-
antennal contact to access the cuticular hydrocarbon profile of another to determine
the task it is carrying out [Greene and Gordon, 2003]. Other forms of tactile
communication include grooming brood members, tapping the abdomens of the
leaders during tandem running [Franks and Richardson, 2006] and also during
trophallaxis (exchange of liquid food from the crop of one ant to the alimentary tract
of the other ant). All these forms of tactile communication are believed to be used to
transmit messages. Antennae-antennae interaction, for instance, is a means to
quickly propagate the information about the available tasks within a colony. Tandem
running is a technique adopted by many species of ants whereby one ant leads
another ant towards a particular destination. For instance, during house hunting in
Page 160
158
Leptothorax albipennis ants, they display a range of interesting behaviours. Initially
ants repeatedly explore the potential nest site to decide if the new nest site is a
plausible habitat or not. They also recruit naive nest-mates via tandem running from
the old nest to the new one so that they can participate in nest evaluation and
subsequent recruitment. After a quorum of decision makers at the new nest is
reached and they collectively decide to emigrate to the new nest, ants switch from
the slow process of leading other ants via tandem running to a much faster process of
carrying the nest-mates at their back. Ants are also found to exhibit brief antennal
contact when visiting and assessing a candidate nest. For further information, refer to
[Pratt, 2005].
Trophallaxis in ants is believed to serve two main purposes:
1. To inform the individual colony members of the nutritional state of the
colony as a whole. It results in conveying messages to the foragers of what
type of food is required.
2. To transmit pheromones with the liquid as it is ingested or regurgitated.
5.1.5 Chemical communication
Chemical communication is the most frequently used communication mode in social
insects. Ants are the masters at using chemical signals to talk to other fellow nest
mates. They use chemical signals for a wide range of activities. Some of them
include recruitment of nestmates for foraging, in alerting nestmates from intruders or
Page 161
159
any possible dangers (alarm pheromones), to distinguish between friend and foe, to
attack intruders by stinging venomous chemicals onto the body of the intruders (e.g.
by fire ants Solenopsis invicta) and also in communicating the individual’s hunger
level.
5.1.6 Classification of communication methods
All these forms of communication can however be classified under two categories:
1) Indirect communication and 2) Explicit communication. In indirect
communication, ants do not communicate with each other directly but rather make
use of the environment to pass messages. This passive means of interacting with
each other is extremely common in social insects and is often referred to as
stigmergic interaction [Grassé, 1959]. Direct communication on the other hand
includes passing a message or signalling directly to another ant without any
intermediary medium. In the previous chapter (Chapter 4), a model for decentralised
task allocation was proposed that is based on the behaviour of eusocial insects. The
communication mechanisms employed in that model were indirect. However, in
biological ant colonies, some degree of explicit communication takes place between
colony members. In this chapter, the model proposed in chapter 4 is extended to
include some degree of explicit communication and investigate whether, when
explicit communication is used, any benefit is obtained over the commonly used
indirect communication only. For explicit communication, the virtual ants use direct
communication with each other along with the stigmergic interaction. In indirect
communication, however, there is no direct communication between individuals.
Page 162
160
5.2 Communication and Specialisation
Bourke, in 1999 [Bourke, 1999], used the term “simple” and “complex” to categorise
ant species based on the following four criteria: (1) morphological differences
between reproductive individuals and workers, (2) existence of physical castes
polymorphisms among workers, (3) nest complexity and (4) communication
systems. Anderson and McShea expanded the Bourke’s cluster to include several
aspects of colony life [Anderson and McShea, 2001] that was previously not taken
into account. Table 5.1 shows the classification introduced by Anderson and
McShea.
Simple Societies Complex Societies
I Introduction
Colony Size Low High
II Polyphenism
Worker polymorphism Low High
Individual specialization None � behavioural
�physiological
� morphological
Types of specialization Temporary Permanent
III Totipotency
Functionality of ovaries High Low
Morphological skew Low High
Worker policing Absent Present
Intracolony conflict High Low
Physiological constraints Low High
Individual complexity High Low
IV Organization of work
Colony control Centralised Decentralised
System redundancy Low High
Homeostasis Low High
Page 163
161
Groups and teams Absent Present
Task partitioning Absent Present
Nest complexity Low High
Colony-constructed nest No Yes
Number of chambers One Many
Foraging strategy Solitary � tandem running �
mass
�trunk trail � group hunting
Defence Generalists non-sacrificial
workers
Specialists sacrificial
defenders
Tempo Low(“cool”) High(“hot”)
Individual competence High Low
Most complex task type Individual � group� Team & partitioned
Efficiency High Low
V Communication and
Functional Integration
Average system
Connectedness
High Low
Use of cues Low High
Use of modulatory
Signals
Low High
Heterogeneity of
Interaction
Low High
Table 5.1: Classification of simple and complex societies
From Anderson and McShea’s classification, it is evident that the social organisation
of ant species varies greatly depending on how complex the colony is. Simple
societies constitute societies having lack of division of labour (and hence low degree
of specialisation), small colony size and high intra-colony conflict. The colony
members are mostly monomorphic and exhibit very simple communication
techniques. Complex societies, on the other hand, constitute of colonies having large
Page 164
162
colony size, low intra-colony conflict, task partitioning and effective division of
labour as well as the existence of polymorphism and teams in carrying out tasks. It is
also evident from the classifications made by Bourke [Bourke, 1999] and Anderson
and McShea [Anderson and McShea, 2001] that the communication strategies
adopted by the colony are themselves the result of an evolutionary strategy and
depend on a wide number of factors (including the size and the organisation of the
colony). Communications among nest-mates tend to be more complex, diverse and
sophisticated with the increasing complexity of the colony. Simple societies tend to
use very simple communications such as signalling and reactive behaviour.
However, with the increase in the complexity of the colony, many different task
allocation strategies start emerging: e.g. the emergence of dividing tasks into a
number of sub-tasks and also the existence of teams [Anderson and Franks, 2001;
Franks, 1986] where individuals not only work concurrently but also coordinate their
different contributions [see Anderson and Franks, 2001; Franks et al, 2001; Franks,
1986]. Jeanson and colleagues [Jeanson et al., 2007] used monte carlo simulation
techniques to analyze how increased group size and its correlates (demand and the
number of tasks) affected the intensity of the division of labour. Using a fixed
response threshold model, Jeanson and colleagues showed that the division of
labour, under most conditions, are strongly correlated with the group size.
The general trend that is observed in ant colonies in terms of the communication
techniques employed by them is that as the complexity of the colony increases the
individual insects tend to adopt more sophisticated communication strategies. They
tend to use redundant signals, modulatory signals as well as more cues to keep the
colony running. Heterogeneity of interaction between insects increases and in
Page 165
163
extreme situations evolution of teams are observed. It seems likely that the
employment of sophisticated strategies is a necessity for running more complex
colonies. This is in line with the biological observation that individual social insects
tend to be more simple in simpler societies and vice versa.
In the model proposed in chapter 4 and further extended in this chapter (see section
5.3), two kinds of communication strategies have been implemented: (1) indirect
communication – where the agents communicate with each other via the
environment and (2) explicit communication – where the agents communicate both
directly and indirectly. We argue that the employment of direct communication
along with indirect communication will help to transmit task demands (e.g. a need
for feeding the brood) within the colony quickly, resulting in a better performance. It
is suggested here that the adoption of explicit communication would be useful in
stressful situations. Situations that are already well managed would probably not
benefit much from explicit communication. This means that in cases where dynamic
agents are already able to quickly serve brood members without direct
communication, the employment of direct communication would probably not be
very helpful (particularly advantageous). However, in more stressful cases where
dynamic agents are not able to quickly serve the needs of the colony, an employment
of direct communication might help to propagate the demand quickly to the dynamic
agents which consequently would result a better performance. In order to explore
this possibility, a series of experiments have been designed.
In the model developed for this thesis, demand is created by brood members. The
larger the number of brood is the more the colony becomes stressed. On the other
Page 166
164
hand, the larger the number of dynamic agents is the more the agents can satisfy the
need and hence the less stressed the colony becomes. From the discussion made
above, we would expect explicit communication strategies to benefit colonies in
more stressful situations. In order to test the arguments, models have been
implemented and tests have been conducted (over a range of number of agents:
dynamic agents ranging from 20 – 60 while static brood members ranges between 5
and 25)to evaluate the effect of the communication strategies on the average hunger
level of the colony.
5.3 Proposed Model
The main communication mode of ants is chemical signalling. This is perhaps one of
the many reasons that led early researchers to mainly focus on stigmergic
interactions. However, in recent times various researchers have started to investigate
explicit communication in ants [see e.g. Franks and Richardson, 2006; Leadbeater et
al., 2006; Momen and Sharkey, 2010]. In this chapter, we explore whether, and
when, the use of explicit communication offers any added advantages to the
performance of the system. In order to do so, the model proposed in chapter 4 has
been extended to incorporate some explicit communication between the agents based
on the forms of explicit communication that are found in complex ant societies.
The environment of the model (including the nest size, nest complexity, agent size
and food distribution) (Figure 4.1) is kept unchanged.
The only change that has been made in order to accommodate the explicit
communication between the dynamic agents is the addition of four behavioural rules
Page 167
165
(Rule #8 – Rule #11) to the repertoire described in section 4.3. The additional four
rules are as follows:
(8) If an agent perceives shouting chemical, it not only reduces its own
tbc, but also participates in the direct transmission of the message (for
a brief period; 80 simulation time steps), “urgent brood caring
needed” (Ubc), to other foragers and brood carers lying within twice
its body size.
(9) When other agents receive the message Ubc, they also reduce their
threshold for brood caring. However these agents refrain from further
transmission of messages.
(10) Similarly, when an agent is in the dump area of the nest and
perceives that the amount of food in the dump area is below some critical
threshold (set to 5 throughout the experiment), it not only executes rule #
2 (see section 4.3) but also send a message Uf (urgent foraging needed) to
other agents that lie within 2 patches from the transmitting agent for a
brief period (80 simulation time steps).
(11) When other agents receive the message Uf, they react by reducing
their own threshold for foraging. However, they refrain themselves from
further transmission of the Uf messages.
Page 168
166
Fig 5.1: State transition for foragers and brood carers
Page 169
167
It is well known that many species of ants make use of more than a single mode of
communication in situations that need urgent attention (e.g. the use of direct
transmission of messages through frequent direct interactions). For instance the leaf
cutter ants Atta colombica are well known to use both stridulation and alarm
pheromones in order to alert nest-mates about possible intruders. The use of more
than one communication mechanism for signalling has a number of benefits
including:
(1) Quick transmission of appropriate messages within the colony, and
(2) To make use of redundant signals to amplify the need and hence attracting
more ants.
In this model, it can be argued that there exist two cases of urgency: (1) when the
number of food items present in the dump area is too low (in which case, more
foragers would be required to bring food items from outside) and (2) When the brood
members get hungry. The hunger of brood members has direct consequences on the
performance of the colony and hence should be one factor that the agents need to
minimise. Therefore, when either of these two cases is perceived, agents use both the
communication strategies (i.e. indirect as well as direct communication) to
communicate. Indirect communication makes use of the environment only to convey
messages to other agents whereas in the explicit communication agents not only use
the environment to pass on the messages but also transmit messages directly to other
agents by various means (e.g. via tactile communication, smell and even through
sounds in many species). Such “indirect + direct communication” is what is referred
to as explicit communication.
Page 170
168
A finite state automaton (FSA) for dynamic agents using either indirect or explicit
communication is shown in Figure 5.1. The agents use the same FSA for either types
of communication.
If the agent is a forager, it starts moving randomly in search of food until it finds
some. Once the forager discovers a food source, it picks the food item up, becomes
laden and goes back to the nest. As it goes back to the nest, it keeps on dropping
simulated chemicals (called pheromones) on its way for other unladen ants to use as
a guide to navigate towards the food source. As foragers travel randomly in search of
food, they also avoid collisions with other agents by moving in a random direction if
the distance between two agents becomes less than the body length of a single agent.
Brood carers, on the other hand, are activated when brood members get hungry.
Brood carers first reach the dump area of the nest in order to collect food items.
Once a brood carer reaches the dump area, it moves randomly within the area until it
bumps into a food item. When it discovers a food item inside the dump area, it picks
the food item up and then traverses towards the brood chamber. The brood carer then
uses the shouting chemical signalled by the hungry brood member to eventually
reach the hungry brood member. Once it reaches the hungry brood member, the
brood carer feeds the brood member with the food it was carrying. Detailed
explanation of the traversal and threshold updating mechanisms were provided in
chapter 4. Both foragers and brood carers are constantly updating their thresholds by
following the 11 behaviour rules (for explicit communication) and 7 behavioural
rules (in case of indirect communication) described above. When the state transition
of either the forager or the brood carer reaches the “decision box” state, the agent
decides what role to play (i.e. whether it will act as forager or brood carer or whether
Page 171
169
will it rest) next depending on the three thresholds (tf, tr, tbc). The procedure for the
next task selection is as follows:
(1) Let },,min{arg bcrfxtcarryoutne tttT = where Tcarryoutnext is a candidate of the task to
carry out next.
(2) A random number, R, is generated between 0 and 1. If R <= 0.7, Tcarryoutnext is
selected otherwise the agent continues carrying out the task it was already carrying
out.
5.4 Experiments and Results
The parameters used in experiments are listed in table 5.2
Parameter Meaning Value(s) used
Nb Number brood members 5, 15, 25
S Number of mobile agents
(i.e. number of foragers
[Nf] + number of brood
carers [Nbc])
20 – 60
r = Rf-bc Initial ratio of foragers to
brood carers. This can be
used to determine the
number of foragers and
brood carers as follows:
0.2, 0.5, 0.9
Page 172
170
SRN bcff ×= −
fbc NSN −=
Epheromones Evaporation rate of
Pheromones
5%
Dpheromones Diffusion rate of
Pheromones
60%
Adaptation-rate The rate at which the
thresholds are adapted
0.09
Shouting-radius The number of patches
the brood member can
shout when it gets hungry
7
Esc Evaporation rate of
shouting chemical
50%
Ufood Upper threshold of food 40
Lfood Lower threshold of food 5
max-separate-turn The maximum angle an
agent can turn when
avoiding another agent
1.250
Efood Energy provided by the
food which causes the
hunger level of the brood
member fed to decrease
100
Thh Threshold parameter of
the hunger level
500
Table 5.2: Parameters used in the experiments
Page 173
171
5.4.1 Performance Measure
Simulations are all carried out in the Netlogo environment. Each experiment runs for
5000 simulation time steps and is repeated 20 times. The average reading is then
calculated from the 20 trials.
Performance of the algorithms is measured in terms of the average hunger level (see
equation 1) of the brood after the 5000th time step. Figure 5.2 shows how the average
hunger level of the brood varies with simulation time steps (when using explicit
communication).
bh
memberbrood
nth
HL
LHA×
=∑
−∀... (1)
a. Nb = 25, r = 0.9, S = 60
0
0.2
0.4
0.6
0.8
1
1.2
1.4
0
72
14
4
21
6
28
8
36
0
43
2
50
4
57
6
64
8
72
0
79
2
86
4
93
6
10
08
10
80
11
52
12
24
12
96
13
68
14
40
15
12
15
84
16
56
Av
era
ge
hu
ng
er
lev
el
Simulation time steps
Average Hunger Level
Page 174
172
b. Nb = 15, r = 0.9, S = 30
c. Nb = 15, r = 0.2, S = 40
0
0.2
0.4
0.6
0.8
1
1.2
1.4
0
99
19
8
29
7
39
6
49
5
59
4
69
3
79
2
89
1
99
0
10
89
11
88
12
87
13
86
14
85
15
84
16
83
17
82
18
81
19
80
20
79
21
78
22
77
Av
era
ge
hu
ng
er
lev
el
Simulation time steps
Average Hunger Level
0
0.2
0.4
0.6
0.8
1
1.2
1.4
0
85
.5
17
1
25
6.5
34
2
42
7.5
51
3
59
8.5
68
4
76
9.5
85
5
94
0.5
10
26
11
11
.5
11
97
12
82
.5
13
68
14
53
.5
15
39
16
24
.5
17
10
17
95
.5
18
81
19
66
.5
Av
era
ge
hu
ng
er
lev
el
Simulation time steps
Average Hunger Level
Page 175
173
d. Nb = 25, r = 0.5, S = 40
Fig. 5.2: Average hunger level of the brood (Nb = size of the brood, r = initial foragers to brood carer
ration and S = number of foragers + number of brood carers)
5.4.2 Results
Tables 5.3 and 5.4 show the resulting average hunger level of brood after 5000th time
step (for indirect communication).
S=20,
r=0.2
S=20,
r=0.5
S=20,
r=0.9
S=30,
r=0.2
S=30,
r=0.5
S=30,
r=0.9
S=40,
r=0.2
S=40,
r=0.5
S=40,
r=0.9
Nb = 5 2.21 2.59 2.25 1.43 1.47 1.54 0.97 1.07 1.08
Nb = 15 3.37 2.78 3.34 2.11 2.51 2.11 1.85 1.82 1.76
Nb = 25 3.73 3.55 3.75 2.74 2.93 3.10 2.24 2.40 2.47
Table 5.3: Mean Hunger level (indirect communication) (Nb = number of brood members, s =
number of foragers + number of brood carers, r = initial ratio of the foragers to brood carers)
0
0.2
0.4
0.6
0.8
1
1.2
1.4
0
84
16
8
25
2
33
6
42
0
50
4
58
8
67
2
75
6
84
0
92
4
10
08
10
92
11
76
12
60
13
44
14
28
15
12
15
96
16
80
17
64
18
48
19
32
Av
era
ge
hu
ng
er
lev
el
Simulation time steps
Average Hunger Level
Page 176
174
S= 50,
r = 0.2
S= 50,
R = 0.5
S= 50,
r = 0.9
S= 60,
r = 0.2
S= 60,
r = 0.5
S= 60,
r = 0.9
Nb = 5 0.91 1.03 1.02 0.94 1.05 1.16
Nb = 15 1.19 1.40 1.51 0.94 0.82 1.08
Nb = 25 1.43 1.90 1.68 1.26 1.40 1.50
Table 5.4: Mean hunger level (indirect communication) (Nb = number of brood members, s = number
of foragers + number of brood carers, r = initial ratio of the foragers to brood carers)
However when explicit communication is employed along with indirect
communication, the following results are obtained (tables 5.5 and 5.6)
S=20,
r=0.2
S=20,
r=0.5
S=20,
r=0.9
S=30,
r=0.2
S=30,
r=0.5
S=30,
r=0.9
S=40,
r=0.2
S=40,
r=0.5
S=40,
r=0.9
Nb = 5 1.69 1.89 1.88 0.99 1.26 1.14 0.83 1.11 1.03
Nb = 15 2.51 2.96 2.65 1.84 1.77 1.59 1.18 1.28 1.23
Nb = 25 3.06 3.09 3.48 2.18 2.50 2.49 1.87 1.93 1.98
Table 5.5: Mean hunger level (explicit communication) (Nb = number of brood members, s = number
of foragers + number of brood carers, r = initial ratio of the foragers to brood carers)
S= 50,
r = 0.2
S= 50,
R = 0.5
S= 50,
r = 0.9
S= 60,
r = 0.2
S= 60,
r = 0.5
S= 60,
r = 0.9
Nb = 5 0.88 0.91 1.05 0.84 0.88 1.08
Nb = 15 1.14 1.14 1.17 1.01 0.98 0.99
Nb = 25 1.47 1.32 1.66 1.40 1.39 1.24
Table 5.6: Mean hunger level (explicit communication) (Nb = number of brood members, s = number
of foragers + number of brood carers, r = initial ratio of the foragers to brood carers)
Both explicit and indirect communication mechanisms show a decrease in the
average hunger level with the increase in the number of the dynamic agents. For
instance if we consider the explicit communication mechanism for brood size = 25
and r (the initial ratio of foragers to brood carers) = 0.9, the mean hunger level varies
Page 177
175
from 3.48 to 1.24 showing a decrease in the hunger level (and hence an improvement
in the performance of the system) with an increase in the number of the dynamic
agents (see Table 5.5 and Table 5.6 – the two values are in bold font). In order to test
if the increase in the performance with increasing number of dynamic agents (due to
the reduction of the average hunger level) is statistically significant or not, a kruskal
wallis test can be employed. The result for the kruskal wallis test using Bonferroni
correction (obtained using SPSS) is shown in table 5.7.
Kruskal-Wallis Test
Ranks
S N Mean Rank
VAR00001 20 20 86.90
30 20 62.85
40 20 48.60
50 20 36.00
60 20 18.15
Total 100
Test Statisticsa,b
VAR00001
Chi-Square 65.058
Df 4
Asymp. Sig. .000
a. Kruskal Wallis Test
Page 178
176
Test Statisticsa,b
VAR00001
Chi-Square 65.058
Df 4
Asymp. Sig. .000
a. Kruskal Wallis Test
b. Grouping Variable: S
Table 5.7: Results for the Kruskal Wallis test
Kruskal-Wallis test assumes:
H0 (null hypothesis): 321 MMM == i.e. the medians of average hunger level do not
significantly vary, and
H1 (alternative hypothesis): the median of the data sets significantly deviate from
each other.
Since p-value is found to be 0.000 which is less than 0.01 (0.05 / 5; here 5 is the
number of tests made), the null hypothesis, H0 is rejected using Bonferroni
correction which means that the increase in the number of dynamic agents (i.e. the
number of foragers + number of brood carers) significantly reduces the average
hunger level of the colony.
To determine whether explicit communication has improved the performance of the
colony in comparison to that of indirect communication mechanisms, a graph of
average hunger level (on the y-axis) against the number of dynamic agents, s, (on the
Page 179
177
x-axis) is plotted. In most of the cases, it is found that the average hunger level,
when incorporating the explicit communication, is lower than in the cases when
indirect communication was only used alone indicating that the use of explicit
communication improves the performance of the swarm.
Fig 5.3: Average hunger level for both types of communication (brood size = 5, x-axis represents the
number of dynamic agents and the initial ratio, r, of the foragers to brood carers = 0.9)
Fig 5.4: Average hunger level for both types of communication (brood size = 15, x-axis represents the
number of dynamic agents and the initial ratio, r, of the foragers to brood carers = 0.9)
0
0.5
1
1.5
2
2.5
3
3.5
4
20 30 40 50 60 70 80 90 100
A.H
.L.
Average Hunger Level
Indirect
Explicit
0
0.5
1
1.5
2
2.5
3
3.5
4
20 30 40 50 60 70 80 90 100
A.H
.L.
Average Hunger Level
Indirect
Explicit
Page 180
178
Fig 5.5: Average hunger level for both types of communication (brood size = 25, x-axis represents the
number of dynamic agents and the initial ratio, r, of the foragers to brood carers = 0.9)
To test if the improvement in the performance in the case of explicit communication
as compared to indirect communication alone is statistically significant, a series of
planned comparisons (using Mann-Whitney U tests) between the two
communication types were made.
Mann-Whitney test assumes the following hypotheses:
H0: MedianA = MedianB (i.e. the two data sets A and B are not statistically different).
H1: MedianA ≠ MedianB (i.e. the two data sets are statistically different)
With brood size = 5 and the initial ratio of foragers to brood carers = 0.9, the Mann-
Whitney test produces the following results:
0
0.5
1
1.5
2
2.5
3
3.5
4
20 30 40 50 60 70 80 90 100
A.H
.L.
Average Hunger Level
Indirect
Explicit
Page 181
179
Test Statisticsb
VAR00001
Mann-Whitney U 123.000
Wilcoxon W 333.000
Z -2.083
Asymp. Sig. (2-tailed) .037
Exact Sig. [2*(1-tailed Sig.)] .038a
a. Not corrected for ties.
b. Grouping Variable: VAR00002
A. s = 20
Test Statisticsb
VAR00001
Mann-Whitney U 163.000
Wilcoxon W 373.000
Z -1.001
Asymp. Sig. (2-tailed) .317
Exact Sig. [2*(1-tailed Sig.)] .327a
a. Not corrected for ties.
b. Grouping Variable: VAR00002
B. s = 30
Test Statisticsb
VAR00001
Mann-Whitney U 177.000
Wilcoxon W 387.000
Z -.622
Asymp. Sig. (2-tailed) .534
Exact Sig. [2*(1-tailed Sig.)] .547a
a. Not corrected for ties.
b. Grouping Variable: VAR00002
C. s = 40
Test Statisticsb
VAR00001
Mann-Whitney U 152.000
Wilcoxon W 362.000
Z -1.298
Asymp. Sig. (2-tailed) .194
Exact Sig. [2*(1-tailed Sig.)] .201a
a. Not corrected for ties.
b. Grouping Variable: VAR00002
D. s = 50
Test Statisticsb
VAR00001
Mann-Whitney U 167.000
Wilcoxon W 377.000
Z -.893
Page 182
180
Asymp. Sig. (2-tailed) .372
Exact Sig. [2*(1-tailed Sig.)] .383a
a. Not corrected for ties.
b. Grouping Variable: VAR00002
E: s = 60
Table 5.8: Mann Whitney tests between indirect and explicit communication for brood size = 5
The results for brood size = 15 and 25 are shown in tables 5.9 and 5.10 respectively.
For all the comparison, the initial ratio of foragers to brood carers is kept the same
(0.9).
Test Statisticsb
VAR00001
Mann-Whitney U 69.000
Wilcoxon W 279.000
Z -3.544
Asymp. Sig. (2-tailed) .000
Exact Sig. [2*(1-tailed Sig.)] .000a
a. Not corrected for ties.
b. Grouping Variable: VAR00002
A. s = 20
Test Statisticsb
VAR00001
Mann-Whitney U 108.000
Wilcoxon W 318.000
Z -2.489
Asymp. Sig. (2-tailed) .013
Exact Sig. [2*(1-tailed Sig.)] .012a
a. Not corrected for ties.
b. Grouping Variable: VAR00002
B. s = 30
Test Statisticsb
VAR00001
Mann-Whitney U 68.000
Wilcoxon W 278.000
Test Statisticsb
VAR00001
Mann-Whitney U 119.000
Wilcoxon W 329.000
Page 183
181
Z -3.571
Asymp. Sig. (2-tailed) .000
Exact Sig. [2*(1-tailed Sig.)] .000a
a. Not corrected for ties.
b. Grouping Variable: VAR00002
C. s = 40
Z -2.191
Asymp. Sig. (2-tailed) .028
Exact Sig. [2*(1-tailed Sig.)] .028a
a. Not corrected for ties.
b. Grouping Variable: VAR00002
D. s = 50
Test Statisticsb
VAR00001
Mann-Whitney U 153.000
Wilcoxon W 363.000
Z -1.271
Asymp. Sig. (2-tailed) .204
Exact Sig. [2*(1-tailed Sig.)] .211a
a. Not corrected for ties.
b. Grouping Variable: VAR00002
E. s = 60
Table 5.9: Mann Whitney tests between indirect and explicit communication for brood size = 15
Test Statisticsb
VAR00001
Mann-Whitney U 142.000
Wilcoxon W 352.000
Z -1.569
Test Statisticsb
VAR00001
Mann-Whitney U 107.000
Wilcoxon W 317.000
Z -2.516
Page 184
182
Asymp. Sig. (2-tailed) .117
Exact Sig. [2*(1-tailed Sig.)] .121a
a. Not corrected for ties.
b. Grouping Variable: VAR00002
A. s = 20
Asymp. Sig. (2-tailed) .012
Exact Sig. [2*(1-tailed Sig.)] .011a
a. Not corrected for ties.
b. Grouping Variable: VAR00002
B. s = 30
Test Statisticsb
VAR00001
Mann-Whitney U 85.000
Wilcoxon W 295.000
Z -3.111
Asymp. Sig. (2-tailed) .002
Exact Sig. [2*(1-tailed Sig.)] .001a
a. Not corrected for ties.
b. Grouping Variable: VAR00002
C. s = 40
Test Statisticsb
VAR00001
Mann-Whitney U 193.000
Wilcoxon W 403.000
Z -.189
Asymp. Sig. (2-tailed) .850
Exact Sig. [2*(1-tailed Sig.)] .862a
a. Not corrected for ties.
b. Grouping Variable: VAR00002
D. s = 50
Test Statisticsb
VAR00001
Mann-Whitney U 129.000
Wilcoxon W 339.000
Z -1.921
Asymp. Sig. (2-tailed) .055
Exact Sig. [2*(1-tailed Sig.)] .056a
Page 185
183
a. Not corrected for ties.
b. Grouping Variable: VAR00002
E. s = 60
Table 5.10: Mann Whitney tests between indirect and explicit communication for brood size = 25
If p-value < 0.05, (α = 0.05, level of significance), the null hypothesis, H0, is
rejected. The results obtained from the series of Mann-Whitney tests are summarised
in table 5.11.
S 20 30 40 50 60
Nb = 5 √ × × × ×
Nb = 15 √+ √ √+ √ ×
Nb = 25 × √ √+ × ×
Table 5.11: Summary of the significance tests between the performances of the explicit and indirect
communication techniques
where
× represents those cases in which the performance of the explicit and indirect
communication do not vary significantly, and
√ represents those cases in which the performance of the two communication
strategies vary significantly
+ represents the data sets that show significant difference using the very conservative
Bonferroni tests.
Since the mean hunger level for explicit communication strategy is always found to
be lower than that of the indirect communication strategy, the symbol √ also
represents a statistically significant improvement of the performance when explicit
Page 186
184
communication has been employed. On the other hand, × indicates that although
there was an improvement in the performance it was not statistically significant.
For the experiments with the number of brood = 5, the demand of brood caring is
lower than when the number of brood are 15 and 25 respectively. The higher the
number of brood is, the greater is the demand for brood caring and vice versa. For
lower number of brood (i.e. when the demand for brood caring is low), a statistically
significant improvement has been found when the number of dynamic agents is 20.
For a higher number of dynamic agents, the use of explicit communication did not
result in a statistically significant improvement over that of the indirect
communication. This is most likely due to the fact that when the demand for brood
caring is low, the increase in the number of dynamic agents is enough to meet the
demand for hungry brood members. Further direct communication was not necessary
and hence did not improve the results significantly. However with a greater number
of brood members (for number of brood members = 15), the use of explicit
communication improved the performance of the swarm significantly (for
5020 ≤≤ agentsdynamicofnumber ). The performance, however, did not improve
significantly with 60 dynamic agents where there were already enough dynamic
agents to meet the demand of the hungry brood. This suggests that for a moderately
higher number of brood members, the use of explicit communication helps to
propagate the required message (i.e. either to feed the brood members or to collect
food items from outside the nest) and hence suppress the average hunger level of the
colony. However for large number of dynamic agents (60 dynamic agents), explicit
communication is not needful as there already is a sufficient number of agents to
satisfy needs of the colony. With NB (number of brood members) = 25, a statistically
Page 187
185
significant improvement of the performance of the colony is found (when using the
explicit communication in contrast to the indirect communication) with numbers of
dynamic agents ranging from 30 – 40. The use of explicit communication, on the
other hand, did not significantly improve the performance of the colony with number
of dynamic agents (s) = 20, 50 and 60. With brood size = 25, there is a high demand
for brood feeding and consequently foraging (since the increase in the rate of feeding
the brood members result in quickly diminishing the number of food items available
in the dump area of the nest). When the number of dynamic agents = 20, the colony
did not have enough agents to feed the hungry brood members and keep the hunger
level lower. However with the increase in the number of dynamic agents, the hunger
level was moderated. Furthermore, for brood size = 25 (i.e. when the demand for
feeding is high), the use of explicit communication improved the performance of the
colony by keeping the hunger level lower until the number of dynamic agents is
enough so as to the use of explicit communication did not result in any further
advantages. The results obtained are in line with the assumption that was made
before carrying out the experiment – that in a stressful situation it is likely that the
incorporation of explicit communication would yield better performance of the
colony.
5.4.3 Variation of the state of the agents with respect to the demand of the
colony
The previous sections illustrate the rules followed by the individual agents, the
communication modes the agents use and also how the performance of the colony
varies with the size of the swarm and the strategy the swarm uses. It is already
Page 188
186
known both from this chapter as well as the preceeding chapter that the agents
dynamically change their states from foraging to brood caring and vice versa to meet
the demand of the colony. This sub-section however illustrates a pictorial depiction
of how the states of the agents vary throughout the simulation process. Time step is
measured from the time the first brood member gets hungry. The section takes the
example of one of the cases however the similar type of results can be obtained from
different initial configurations illustrating that the agents dynamically change their
states to meet the demand of the colony.
a
b
Fig 5.6: Variation of the numbers of foragers and brood carers
0
5
10
15
20
25
30
35
1 3 5 7 9 11 13 15 17 19 21
Nu
mb
ers
Time Steps
Foragers and Brood carers
foragers
brood carers
hungry
food
0
5
10
15
20
25
30
35
40
45
1 4 7 10 13 16 19 22 25 28 31 34 37 40 43 46 49 52 55
Nu
mb
ers
Time Steps
Foragers and Brood Carers
foragers
brood carers
hungry
food
Page 189
187
In this particular case, there are same number of foragers and brood carers (initial
value). As brood members start getting hungry, the number of brood carers increases
to meet the changing demand (Figures 5.6a, 5.6b). Consequently the amount of food
available in the dump area of the nest decreases (Figure 5.6b) triggering brood carers
to switch to the foraging task. This behaviour will keep on repeating over the rest of
the simulation period but this single cycle itself explains how agents constantly
change their states in order to meet the demand of the colony.
5.5 Conclusion
This chapter looks at the effects of using explicit communication in a simulated
colony of ants, and at the circumstances in which it improves performance. Ants are
popularly known to use indirect communication to signal other nest mates. However,
in many situations, ants have been found to use explicit local communication with
the nest mates. This chapter analyzes the advantages of using a combination of direct
communication and indirect communication. The model for task allocation described
in chapter 4 has been extended (in this chapter) in order to incorporate the explicit
communication in ants. Experiments were carried out with brood size ranging from 5
– 25 and number of dynamic agents (number of foragers + number of brood carers)
ranging from 20 – 60. In most of the cases it was found that the performance is
improved by the use of explicit communication in comparison to indirect
communication.
Before the experiment was carried out, it was predicted that the use of explicit
communication would benefit the colony under stressful conditions (i.e. when the
Page 190
188
number of brood members is high). The use of explicit communication is always
found to be of benefit when there is moderate level of demand (from the brood
carers) and a low – medium number of dynamic agents. In case of high demand from
brood members (i.e. when number of brood = 25), the use of explicit communication
tends to improve performance for a moderate number of dynamic agents. This is in
line with the prediction that was previously made – that the use of explicit
communication would turn out to be useful in situations where the colony is under
greater stress (i.e. in situations where there are less dynamic agents to feed the brood
members and a greater demand for feeding). In nature, the greater the colony
complexity is, the more is the demand for the colony to run and consequently the
workers in complex societies use more sophisticated communication strategies
compared to that of the simpler societies to effectively meet the demand of the
colony. This is in line with the results obtained from our simulations (i.e. under
stressful conditions, use of explicit communication improves the performance of the
colony significantly compared to that of the indirect communication)
Page 191
189
Chapter 6
Task Allocation Model for a Swarm of
Hybrid Agents
This chapter presents an extension of the models presented earlier (in chapters 4 and
5 respectively). The two models in chapters 4 and 5 assume that agents are simple in
nature (i.e. follow simply rules and fairly homogeneous in terms of behaviour) and
react only to the stimulus (signal) that they receive. However, in many complex
situations, a number of factors besides stimulus have been found to affect the
propensity of task selection. Some of these include location of the individuals within
the nest, genetic factors, age, morphology and also physiology. It is quite often the
case that castes within a colony are more biased towards certain tasks than others.
This chapter uses and extends the concept of task preference within a caste to see if
such bias and heterogeneous mixture within the society serves any advantage to the
colony.
Although evidence exists of task preferences among castes in many ant species (see
section 3.5), little work has really been done in investigating the benefits for the
colony of such preferences. In this chapter, we examine the question of whether such
task preferences within a caste (i.e. by the formation of sub-castes) would have any
advantage on the performance of the overall colony. To provide us with an insight
Page 192
190
into the advantage, if any, of the biasness (i.e. preference in task execution) within
the castes of the colony, a heterogeneous mixture within the brood carers caste has
been made. In this model, two types of brood carers exist: (1) flexible brood carers
and (2) biased brood carers. The flexible brood carers can update their thresholds.
They are not biased to any particular task and can take up any of the three tasks: (A)
brood caring, (B) resting and (C) foraging. However biased brood carers are
dedicated to the brood caring task only and refrain from undertaking any foraging or
resting tasks. It should be noted here that the default state of a biased brood carer is
to rest within its chamber (it only reacts to the shouting signal of the brood members)
although in this case we refrain from denoting resting as a task. This is because the
biased brood carers do not choose to rest by updating the threshold of resting rather
they only rest because the shouting signal of the brood members is not enough to
make them (the biased brood carers) react.
In order to establish whether the existence of biased brood carers has any impact on
the performance of the colony, the number of brood members and the ratio of the
biased brood carers to the flexible brood carers are varied and the average hunger
level of the colony at the end of the simulation is recorded. Two conditions for the
experiment were introduced: (1) a benign condition and (2) a harsh condition. In the
benign condition, the food in the environment grows adequately so that there is no
scarcity of food in the environment and consequently it is easy for the forager to find
a food item. On the other hand in the harsh condition, food in the environment grows
at a much slower rate causing difficulty for foragers to find a food item relative to
that of the benign condition. As the number of brood members is increased the
average hunger level is expected to increase. In the harsh condition, we do not expect
Page 193
191
the existence of biased brood carers will improve the performance of the colony.
Moreover, we believe that as the ratio of the biased brood carers to that of the
flexible brood carers is increased, the consequence would be a deterioration in the
performance of the colony. This is because as more and more brood carers become
dedicated to brood caring, the foraging task is under resourced (since there are less
foragers and on the top of that it is relatively more difficult to foraging due to the
lower growth of food in the environment). However, in case of the benign condition,
a different result is expected. Since there is adequate food in the environment in the
benign condition, the foraging task can be carried out relatively easily. In this case
the existence of some biased brood carers might actually help them to improve the
brood caring tasks and consequently the performance of the colony. However, if the
ratio of the biased brood carers to that of the flexible brood carers is too high, this
could create underresourcing of foraging tasks resulting in poor performance.
Therefore we would speculate that in the benign condition, the performance of the
colony should improve with the increase in the ratio of the biased brood carers to
that of the flexible brood carers but only upto some critical ratio beyond which the
performance would decrease.
The rest of the chapter is organised as follows: in section 6.1, the new model
investigating this strategy is proposed. The model is described along with the
behavioural rules the agents follow. Section 6.2 explains the experiments carried out
along with the results that are obtained from them. Finally, in section 6.3 the chapter
concludes with a brief description of likely future work.
Page 194
192
6.1 Proposed Model
The environment of the model is similar to that as described in section 4.2 of chapter
4. One key difference in this model is that the food items in the environment grow at
a particular rate (3 X 10⁻⁴ units per unit time if the condition is benign or 3 X 10⁻⁵
units per unit time if the condition is harsh; further discussion of this is made later in
the chapter). Another vital difference in this model is the inclusion of two types of
brood carers. The following subsection discusses this to further details.
6.1.1 Behavioural rules
The three groups of agents (static brood members and the dynamic brood carers and
foragers) behave in the similar fashion as outlined in chapters 4 and 5 of the thesis.
However, in the realms of this model some modification to the behaviour brood
carers has been made. Therefore, in this section we provide brief description to the
behaviours of brood carers only. To refer to the descriptions of the behaviours of
other agents (foragers and brood) please refer to section 4.2 of chapter 4.
The brood carers in this model are heterogeneous rather than homogeneous in the
sense that they do not follow the same sets of rules. Two kinds of brood carers exist
in this model: (i) adaptive brood carers and (ii) biased brood carers. Adaptive brood
carers switch tasks and adapt to the changing environment as required (between
foraging, brood caring and resting). Biased brood carers, on the other hand, have
preferences in terms of which tasks they like to execute and have a more limited
degree of flexibility. In this model, such brood carers refrain from taking up the
foraging task and hence are limited to either brood caring or resting. All brood
carers, when triggered to feed the brood members, use the potential gradient of the
Page 195
193
scent of the dump area to reach the dump area first. Once they reach the dump area,
they move randomly within the dump area for a stipulated length of time. During this
time, if they find a piece of food, they pick the food items up and then move towards
the brood chamber by following the scent of the brood chamber. Once the brood
carer reaches the brood chamber, it uses the shouting chemical emitted by a hungry
brood member to reach it and feed the hungry brood member.
Foragers and adaptive brood carers follow behavioural rules (11 sets of rules) as
described in Sections 4.3 and 5.3. However, one key difference of this model is the
presence of the biased brood carers which do not participate in carrying out all the
tasks. Rather, these brood carers are biased towards one particular task only (i.e.
brood caring). Biased brood carers reside within the brood carer’s chamber and keep
on listening for the shouting of the brood members. Upon receiving the signal from
the brood members for feeding them, these brood carers decide whether to activate
brood caring task or not. The finite state machine (FSM) for biased brood carers is
presented in figure 6.1.
Page 196
194
Fig 6.1: Finite state machine for biased brood carers
The agents use a set of action sequences in order to carry out their task effectively.
These action sequences are explained as follows:
Keep Listening: In this phase, the brood carer stays in its chamber but keeps on
listening for any indication of a need to feed the brood members.
Measure Signal Strength: Upon receiving signals from the brood members that
feeding is required, it measures how much signal strength it has received.
Bc-activation: Depending on the signal strength the brood carer has received, it
decides whether to activate brood caring task or not. If the signal strength received
by the brood carer is less than the cumulative signals that can be sent by 3 brood
members, the brood carer refrains from switching its task to brood caring and
keeps on listening for further signal from brood members. This ensures that the
Page 197
195
brood carers are not too sensitive to feeding brood members and prevents one
brood member’s signal from activating several brood carers
Find DA: When the brood carers respond to the demands of the brood members,
they need to first pick up a food item from the dump area. To do this, they use the
gradient of the scent of the dump area chamber to reach the dump area of the nest.
Once a brood carer reaches the dump area, it moves randomly within it in search
of food.
Pick food: When a brood carer finds a piece of food, the brood carer picks it up
and heads towards the brood chamber.
Go back to chamber: If there is not enough food in the dump area it might take
the brood carer too long to find a piece of food. If it takes longer that the time
allowed for it to search, it gives up finding food there and instead use the potential
gradient of the scent of the brood carers chamber to head towards the chamber.
Once it reaches its chamber, it resumes listening for any further signal from the
brood members.
Go to brood chamber: If a brood carer has successfully picked up a food item
from the dump area, it heads towards the brood chamber by following the potential
gradient of the scent of the brood chamber.
Feed brood: Upon entering the brood chamber, the brood carer uses the shouting
chemical of the hungry brood members to locate a brood member that needs
Page 198
196
feeding. Once the brood carer reaches the hungry brood member, it feeds the
brood member which results a lowering of the brood member’s hunger level. Once
the brood member has fed the brood carer, it heads towards its chamber and
resumes listening to further signals from the brood members.
6.2 Experiments and Results
The objective of this chapter is to investigate what advantages, if any, are there on
the performance of the colony as a whole when some groups of agents are biased
towards certain tasks: specifically, when some agents are biased towards brood
caring. To investigate this, the ratio of the number of biased brood carers and the
dynamic brood carers is varied in order to test how the degree of flexibility for brood
caring affects the performance of the system. The experiment has been conducted
within two environmental modes: (1) within benign conditions and (2) within harsh
conditions. To test our speculations (as mentioned before) experiments have been
carried out using agent based methodology within the Netlogo environment (refer to
chapter 4 for further details). Each experiment was run for 5000 simulation time
steps and was repeated 20 times. The average reading was then calculated from the
20 trials. The performance of the system is calculated in terms of the average hunger
level of the colony after the end of the simulation i.e. at 5000th simulation time step.
The list of parameters used is outlined in Table 6.1.
Parameter Meaning Value(s) used
Nb Number of brood
members
20, 60, 80
Page 199
197
Nf Initial number of foragers 10
Ntbc Total number of brood
carers
25
Epheromones Evaporation rate of
Pheromones
5%
Dpheromones Diffusion rate of
Pheromones
60%
Adaptation-rate The rate at which the
thresholds are adapted
0.09
Shouting-radius The number of patches
the brood member can
shout when it gets hungry
7
Esc Evaporation rate of
shouting chemical
50%
Ufood Upper threshold of food 40
Lfood Lower threshold of food 5
max-separate-turn The maximum angle an
agent can turn when
avoiding another agent
1.250
Efood Energy provided by the
food which causes the
hunger level of the brood
member fed to decrease
100
Thh Threshold parameter of
the hunger level
500
Page 200
198
R Ratio of the number of
biased brood carer to the
total number of brood
carers
0, 0.12, 0.16, 0.2, 0.4,
0.8, 1
Food-growth Probability of food
growth
3 X 10⁻⁴ (benign),
3 X 10⁻⁵ (harsh)
Table 6.1: List of parameters
When the probability with which the food grows in the environment is kept at 3 X
10-4, food remains abundant in the environment. Such a condition is referred to as
a “benign” condition. However, when the probability of food growth is reduced to
3 X 10⁻⁵, the availability of the food growth outside in the environment is reduced
and hence it becomes more difficult for foragers to find food to bring back to the
nest. Subsequently, this affects the hunger level of the brood members and hence
the performance of the colony. Such a condition is referred to as “harsh”
condition.
Table 6.2 illustrates the average hunger level of the brood (i.e. average of 20
experimental readings in the benign condition) after the 5000th time step
R 0 0.12 0.16 0.2 0.4 0.8 1.0
Nb = 20 1.21 0.97 0.94 0.94 1.00 2.58 3.94
Nb = 60 2.81 2.58 2.58 2.54 3.24 4.17 4.64
Nb = 80 3.40 3.01 3.02 3.17 3.55 4.36 4.77
Table 6.2: Average hunger level at the end of the simulation(here R = ratio of the number of biased
brood carers to the total number of brood carers and Nb = number of brood members)
Page 201
199
Figure 6.2 – 6.4 shows how the average hunger level of the brood members varies
with the ratio of the number of biased brood carers to the total number of brood
carers (R) during the benign conditions.
Fig 6.2: Average hunger level for Nb = 20 (Nb = Number of brood members)
Fig 6.3: Average hunger level for Nb = 60(Nb = Number of brood members)
0
0.5
1
1.5
2
2.5
3
3.5
4
4.5
0 0.12 0.16 0.2 0.4 0.8 1
A.H
.L.
ratio
Average Hunger Level
0
1
2
3
4
5
0 0.12 0.16 0.2 0.4 0.8 1
A.H
.L.
ratio
A.H.L.
Page 202
200
Fig 6.4: Average hunger level for Nb = 80(Nb = Number of brood members)
From figures 6.2 – 6.4 it is evident that introducing preference towards some tasks
has some impact on the performance of the colony. When the ratio in the graphs is
zero, there are no biased brood carers. However increasing the ratio of the number of
biased brood carers to the total number of brood carers can be seen to reduce the
average hunger level (i.e. improve the performance) of the colony upto some critical
ratio beyond which the average hunger level starts increasing. For instance when the
brood size is 20, the average hunger level reduces from 1.21 to 0.94 as the ratio
increases from 0 to 0.2. When the ratio is increased further, the average hunger level
also increases with it (figure 6.2). Similarly, it is evident from figure 6.3 where the
brood size is 60, the average hunger level reduces from 2.81 to 2.54 as the ratio
increases from 0 to 0.2 beyond which the average hunger level increases. When the
brood size is 80, the average hunger level has been found to reduce from 3.40 to 3.02
as the ratio increases from 0 to 0.16 beyond which the hunger level starts increasing.
To investigate if the lowest hunger level found due to the introduction of some
biased brood carers is a significant improvement over when there were no biased
brood carers (i.e. ratio = 0), a series of Mann-Whitney test has been conducted.
Tables 6.3 - 6.5 shows the results found from the Mann-Whitney tests.
0
1
2
3
4
5
6
0 0.12 0.16 0.2 0.4 0.8 1
A.H
.L.
ratio
Average Hunger Level
Page 203
201
Test Statisticsb
VAR0000
1
Mann-Whitney U 123.000
Wilcoxon W 333.000
Z -2.083
Asymp. Sig. (2-tailed) .037
Exact Sig. [2*(1-tailed
Sig.)] .038a
a. Not corrected for ties.
b. Grouping Variable: VAR00002
Table 6.3: Result of Mann Whitney tests for Nb = 20
Test Statisticsb
VAR0000
1
Mann-Whitney U 118.000
Wilcoxon W 328.000
Z -2.218
Asymp. Sig. (2-tailed) .027
Exact Sig. [2*(1-tailed
Sig.)] .026a
a. Not corrected for ties.
Page 204
202
Test Statisticsb
VAR0000
1
Mann-Whitney U 118.000
Wilcoxon W 328.000
Z -2.218
Asymp. Sig. (2-tailed) .027
Exact Sig. [2*(1-tailed
Sig.)] .026a
a. Not corrected for ties.
b. Grouping Variable: VAR00002
Table 6.4: Result of Mann Whitney tests for Nb = 60
Test Statisticsb
VAR0000
1
Mann-Whitney U 91.000
Wilcoxon W 301.000
Z -2.948
Asymp. Sig. (2-tailed) .003
Exact Sig. [2*(1-tailed
Sig.)] .003a
Page 205
203
a. Not corrected for ties.
b. Grouping Variable: VAR00002
Table 6.5: Result of Mann Whitney tests for Nb = 80
For each of the cases the p-value is found to be less than 0.05 implying that the
reduction of hunger level due to the introduction of biased brood carers is a
significant improvement over the flexible brood carers. For a brood size of 80, the
improvement of performance (at an alpha level of 0.1) is found to be significant
even under the conservative Bonferroni test (as p-value, 0.003, is found to be less
than �.�
�= 0.0048).
When the condition of the system is switched to “harsh” instead of “benign”, the
average hunger level does not improve with the introduction of biased brood
carers (figures 6.5 to 6.7 show the graphical output of the results for harsh
conditions while table 6.6 summarises the results for the harsh condition). This can
probably be explained as being due to the fact that in the harsh condition, there is a
greater need for foraging than in the benign condition and limiting the foraging
ability by the introduction of biased brood carers does not help in lowering the
average hunger level.
Page 206
204
Fig 6.5: Average hunger level for Nb = 20 (Nb = Number of brood members)
Fig 6.6: Average hunger level for Nb = 60 (Nb = Number of brood members)
0
0.5
1
1.5
2
2.5
3
3.5
4
4.5
0 0.2 0.4 0.6 0.8 1 1.2
.Av
era
ge
Hu
ng
er
Lev
el
Ratio
Variation of hunger level in "harsh"
condition
0
1
2
3
4
5
6
0 0.2 0.4 0.6 0.8 1 1.2
Av
era
ge
Hu
ng
er
Lev
el
ratio
Variation of Hunger Level with ratio
Page 207
205
Fig 6.7: Average hunger level for Nb = 80 (Nb = Number of brood members)
R 0 0.12 0.16 0.2 0.4 0.8 1.0
Nb = 20 2.5 3.27 3.32 3.58 3.7 4.12 4.23
Nb = 60 3.81 4.25 4.42 4.56 4.44 4.58 4.81
Nb = 80 4.13 4.51 4.65 4.68 4.73 4.79 4.95
Table 6.6: Average hunger level after the 5000th simulation time step (harsh condition)
6.3. Conclusion
This chapter provides the third strategy for allocating tasks and analyses the effect of
the strategy on the performance of the colony. This model is inspired by the
behaviour of many ant species that show preferences in task selection. In the
previous models presented in this thesis, the agents select tasks based purely on the
stimuli (signals) they receive. This model, however, introduces an internal parameter
(which in natural world can be due to many factors including genes, age,
morphology and so on) that influences the selection of tasks in agents. Experiments
4
4.2
4.4
4.6
4.8
5
0 0.2 0.4 0.6 0.8 1 1.2
Av
era
ge
Hu
ng
er
Lev
el
Ratio
Variation of Average Hunger Level
with Ratio
Page 208
206
were carried out in the Netlogo environment. The results obtained are then
statistically evaluated to see if such task preferences have any benefit or not. It was
speculated before carrying out the experiments that such strategy (i.e. the
introduction of biased brood carers) in benign conditions would actually improve the
performance of the colony up to some critical ratio. On the other hand, it was
expected that this strategy would not provide any benefit to the performance of the
colony in harsh condition but rather would be detrimental to the performance.
Experimental investigation using agent based methodology shows the outcome of
the result is in agreement with our initial speculation. It is concluded that the third
strategy for task allocation can improve performance of the colony. Reducing the
flexibility of task allocation, and having some dedicated brood carers improves the
performance in benign conditions, when there is plenty of food available. It is
interesting to note that such biased task allocations are found in nature in complex
societies living in hospitable environment.
Page 209
207
Chapter 7
Discussion
This chapter reflects on the results presented in chapters 4 – 6 and critically reviews
the impact of different task allocation strategies (mentioned in chapters 4 – 6) on the
performance of the colony. Furthermore, this chapter makes qualitative comparisons
between the results produced in the models and others described in the literature.
This includes a discussion of both the similarities and the differences of our models
with those in related papers and of the extent to which the implications of the present
findings are found consistent with other research.
The rest of the chapter is structured as follows: in section 7.1, a discussion of the
results presented in chapters 4 – 6 is articulated. This includes some observations
about the effects of different strategies on colony performance. Furthermore, the
implications of the results are carefully reviewed. Section 7.2 compares our models
(and results) with the findings of other researchers and discusses the ways the
models we developed resemble and/or are different from them. Finally, the chapter is
concluded in section 7.3 with a summary of its main points.
Page 210
208
7.1 Results
Chapter 4 presents a base model for this thesis from which other strategies of task
allocation presented in chapters 5 and 6 are developed. The model described in
chapter 4 uses stigmergic interactions between agents to meet colony demand. For
detailed information about the model, please refer to Chapter 4 of the thesis. The key
questions explored in the chapter include whether the system that emerges out of the
simple rules (specified in section 4.3) is (1) scalable, (2) flexible and (3) robust. To
check if the system is scalable, the number of dynamic agents (i.e. number of
foragers + number of brood carers) is varied between 20 and 100 for brood size = 5,
15 and 25. For each set of parameters, experiments are repeated 20 times and then
the average hunger level of the brood over the 20 runs is determined. The results
show increasing average hunger level with brood size. Moreover, as the number of
dynamic agents is increased, the average hunger level decreases thus improving the
performance of the colony. Improvement of the performance of the colony with the
size of the number of dynamic agents suggests that the system is scalable.
Dynamic agents use threshold based mechanisms to adapt to the changing demand.
To address the question of flexibility, the initial ratio of the number of foragers to
brood carers is varied as follows: 0.2, 0.5 and 0.9. If the system is flexible, then the
initial ratio of foragers to brood carers would not affect the result as long as the total
number of dynamic agents and the brood size stays the same. For the number of
dynamic agents varying between 20 and 60, initial ratio of foragers to brood carers
varying as 0.2, 0.5 or 0.9 and the brood size varying between 5 and 25, the change in
the average hunger level is found to remain statistically insignificant as long as the
Page 211
209
total number of dynamic agents and that of brood size remain the same. This
illustrates that the initial ratio of foragers to brood carers has no effect on the final
average hunger level of the brood indicating that the dynamic agents are flexible
enough to adapt themselves over the simulated time period.
To check if the system is robust (i.e. that the system continues to operate despite the
malfunction of some of the agents), experiments were carried out where 10 random
agents (foragers and/or brood carers) die at the 500th simulation time steps (the
simulation runs for up to 5000 simulation time steps). When the agents die, they are
instantly removed from the model. Experiments with brood size = 15 and initial
number of dynamic agents = {20, 30, 40, 50} reveal that the perturbed model
generates a slightly greater average hunger level than that of the non-perturbed
model. But the overall operation of the system does not cease. Furthermore, the
difference in the average hunger level between the perturbed and the non-perturbed
model decreases with increasing number of dynamic agents indicating that greater
number of dynamic agents contribute to a more robust system.
Chapter 5 presents another strategy for task allocation, that is noticeable in many
social insects, where agents not only interact with each other indirectly via the
environment but also communicate directly when in need. This kind of
communication is referred to as explicit communication in the thesis. The chapter
presents a comparison between explicit and indirect communication strategies within
the realms of the colony performance. Experiments reveal that for both the strategies,
the increase in the number of dynamic agents reduces the average hunger level of the
colony (i.e. improves the colony performance). The chapter further concludes that
Page 212
210
explicit communication almost always resulted in better colony performance than
that of the indirect communication counterpart. However, the performance of the
explicit communication is found to be more useful under stressful conditions.
Chapter 6 presents the third and final strategy of task allocation developed in the
thesis wherein the brood carer agents can be one of the two types: (i) adaptive brood
carers and (ii) biased brood carers. Adaptive brood carers behave in the same fashion
as outlined in Chapter 5 whereas biased brood carers are dedicated to only one kind
of work i.e. feeding hungry brood members when needed. Experimental results
reveal that during benign conditions (i.e. when food items are available in
abundance), having a slight proportion of biased brood carers always improves the
performance of the colony.
7.1.1 Implications of the results
The results from chapters 4 – 6 imply that there is no particular task allocation
strategy that works best for every situation but that the best strategy is a function of
various factors including those of the environmental constraints, number of agents
involved and the demand of the colony. However, the results do show some general
trends for the three task allocation strategies explored. For instance, incorporation of
direct communication along with that of indirect communication is found to improve
the performance of the colony. But the improvement of the performance becomes
more prominent when colonies are placed under much more stressful conditions.
Chapter 6 of the thesis further reveals that the performance, under benign conditions,
Page 213
211
can further be improved by employing some biased agents (biased brood carers)
along with the dynamic brood carers.
7.2 Comparison of our models with other relevant models/experiments in the
literature
This section compares some of the relevant work found in the literature with the
research reported in this thesis. The comparison includes both differences and
similarities between the models and/or results presented in chapters 4 – 6 with other
notable works mentioned in chapters 2 and 3.
7.2.1 Differences
The models we presented differ from many other related works in two main ways:
(1) approach and (2) strategies.
A number of researchers have adopted other approaches unlike the agent based
modelling used in this thesis. Mathematical modelling [e.g. see the works of Arcaute
et al., 2009; Galstyan and Lerman, 2004; Halloy et al., 2007, Schmickl et al., 2009]
for example, is one such approach wherein a set of identical individuals are treated
as a population and the interaction between different populations are formulated
using partial or ordinary differential equations. Such methods generally ignore the
differences within the members of the population and consequently limit the
understanding of how patterns are formed. However, these methods have proved to
be a useful vehicle to systematically study complex systems. Other mathematical
Page 214
212
modelling techniques that are prominent in the literature include the use of
probabilistic approaches to mathematical modelling [Lerman et al., 2005; Liu and
Winfield, 2010] involving geometric means to predict transition probabilities [Liu,
2008].
Another popular approach is the use of simulated and/or real robots [e.g. see Krieger
and Billeter, 2000; Labella, 2007; Liu, 2008; Liu et al., 2007a,b; Yongming et al.,
2010] to understand and capture the emergent properties noticeable in biological
systems. Such systems often incorporate physical properties such as sensor and
actuator characteristics. However, the approach has been found to be limiting in
terms of the number of agents that can be used. Furthermore, such approaches also
suffer from the difficulty of properly replicating many of the behaviours that animals
and in particular social insects display. Unlike such approaches, our models
incorporate a greater number of agents and tasks and also contain a richer set of
behavioural rules.
Another important way our models differ from those of other researchers is the
development of a number of task allocation strategies (three) and the exploration of
the benefits that different task allocation strategies bring.
7.2.2 Similarities
The models developed in this thesis are found to bear close resemblance (in terms of
the results generated) with the behaviour of many insect societies. Gordon, for
instance, carried out a number of experiments where she and her colleagues
Page 215
213
perturbed colonies of red harvester ants in various ways and found that the social
insects are resilient to external perturbations [Gordon, 2002; Gordon et al. 2008;
Greene and Gordon, 2003]. It is known that in red harvester ants, the return of
successful patrollers lead to increase in the foraging activity. Greene and Gordon
extracted the cuticular hydrocarbons of patrollers and used it to coat beads [Greene
and Gordon, 2007], which in turn were placed in front of the nest – thus artificially
increasing the rate of returning patrollers. This consequently increased the foraging
activity indicating that insect societies are extremely responsive to the stimulus
received. Experiments with ponerine ants result in similar outcomes. The workers of
ponerine ants, E. ruidum, act either as stingers where they kill the live drosphillas
(prey) by the act of stinging, or transporters where they carry dead drosphillas from
the ground to the nest [Theraulaz et al., 2001]. The ratio of stingers to transporters
was found to vary with the stimulus (i.e. live dropsphillas trigger stinging operation
and dead drosphillas trigger transporting operation) which further shows that social
insects are extremely adaptive to the changing demands. Schmickl and Crailsheim
[Schmickl and Crailsheim 2008a, b, c] used an agent based modelling approach to
develop task selection models for honeybees. They then carried out a number of
perturbations to different castes of simulated honeybees and investigated the effect
of each perturbation on the colony. The general observation that can be made is that
each perturbation causes the colony to react so as to meet the extra demand created
by the perturbations. For instance, a sudden increase in the brood size in the
simulation results in an increase in the number of nurse bees (since more nurse bees
would be required to feed the brood members). Similarly the removal of the brood
members results in the decrease in the number of nurse bees.
Page 216
214
The model developed in this thesis also shows similar resilience to the dynamic
changes in the environment. Figures 5.6a and 5.6b depict this and show how the
number of foragers and brood carers (initially there were an equal number of
foragers and brood carers) varies with time. When the brood members get hungry,
the number of brood carers increases – thus meeting the demand of the brood
members. Figure 5.6b also shows that when the amount of food items present in the
dump area is considerably reduced, some brood carers switch to the foraging task in
order to meet the foraging demand.
To provide further insights into the way that external perturbations result in dynamic
allocations of tasks (as seen in social insects) so as to meet the changing demand, the
following alterations have been made to the model described in chapter 5.
1. The model (with initial brood size = 5 and number of dynamic agents = 50) is
run undisturbed for the first 1000 time steps to allow the colony to reach an
equilibrium state.
2. At 1000 time steps, some new brood members are added (either 10, 20 or 30)
which causes an increase in the demand for brood feeding.
Each experiment is repeated 20 times and the average result is illustrated in the
accompanying figure (figure 7.1). The result of the undisturbed colony is also
shown in figure 7.1.
Page 217
215
a
b
0
5
10
15
20
25
30
35
40
45
50
1
17
8
35
5
53
2
70
9
88
6
10
63
12
40
14
17
15
94
17
71
19
48
21
25
23
02
24
79
26
56
28
33
Nu
mb
er
of
ind
ivid
ua
ls
Simulation time steps
foraging
brood caring
0
5
10
15
20
25
30
35
40
45
50
1
17
8
35
5
53
2
70
9
88
6
10
63
12
40
14
17
15
94
17
71
19
48
21
25
23
02
24
79
26
56
28
33
Nu
mb
er
of
ind
ivid
ua
ls
Simulation time steps
foraging
brood caring
Page 218
216
c
d
Fig 7.1: Variation of foragers and brood carers: a) undisturbed colony, b) 10 new brood members are
added, c) 20 new brood members are added, d) 30 new brood members are added.
Figure 7.1a shows a typical variation of foragers and brood carers when the colony is
left undisturbed by any external perturbations. After the 500th time step, brood
0
5
10
15
20
25
30
35
40
45
50
1
17
8
35
5
53
2
70
9
88
6
10
63
12
40
14
17
15
94
17
71
19
48
21
25
23
02
24
79
26
56
28
33
Nu
mb
er
of
ind
ivid
ua
ls
Simulation time steps
foraging
brood caring
0
5
10
15
20
25
30
35
40
45
50
1
17
8
35
5
53
2
70
9
88
6
10
63
12
40
14
17
15
94
17
71
19
48
21
25
23
02
24
79
26
56
28
33
Nu
mb
er
of
ind
ivid
ua
ls
Simulation time steps
foraging
brood caring
Page 219
217
members gradually start getting hungry (as the threshold of hunger level of brood
members is fixed to 500; for further details, refer to chapters 4 and 5) thus resulting
in an increase in the number of brood carers after the 500th time steps. After an initial
increase in the number of brood carers, the number of foragers and brood carers then
fluctuates over time and constantly adapts to the changing environment. When the
colony is perturbed by the insertion of additional brood members, the number of
brood carers is also found to increase and exceed the number of foragers for a
considerable time period (unlike the situation with undisturbed colonies) to meet the
additional demand created. This is in line with the observations made in insect
societies including the results obtained by Schmickl and Crailsheim where an
increase in the brood size in honeybees results in an increase in the size of the
nursing cohort [Schmickl and Crailsheim, 2008b].
7.3 Conclusion
This chapter presented a critical review of the results reported in the experimental
chapters. The results obtained in chapters 4 – 6 were carefully examined and
compared. Furthermore, the models developed in the thesis were compared to other
related research work highlighting the similarities and the differences in terms of
approach, results and implications. The comparisons indicated that the behaviour of
the simulated agents in our models bore close resemblances with that found in many
social insects.
Page 220
218
Chapter 8
Conclusions
Division of labour (DOL), in the context of multi-agent and multi-robot systems, is
considered to be one of the most important areas for managing work distributions.
Multi-agent systems are usually populated with groups of homogeneous and/or
heterogeneous agents that typically engage themselves in carrying out one or more
tasks. Many approaches have so far been used by researchers in dealing with multi-
agent systems. One of the most recent and successful approaches that has lately been
embraced by many researchers is that of swarm intelligence that studies how a large
number of relatively simple agents can use repeated local interactions between the
neighbouring individuals and with the environment in the vicinity to create a
collectively intelligent system. The field is strongly inspired by the collective
behaviour of animals and especially by that of the social insects (mostly that of ants,
bees, termites and wasps) that show some remarkable displays of swarm intelligence.
A crucial problem in most multi-agent systems and especially the self-organised
systems is the effective allocation of tasks among the agents. In most cases, the
environment within the self-organised system continuously changes and therefore
the demand for tasks also continuously changes. So, in order that the agents can meet
the demands, they need to continuously adapt to the changing environment. Self
organised systems and particularly that exhibited by the eusocial insects are very
well known to display effective allocation of tasks in response to the dynamic
Page 221
219
changes in the environment and the demands within the colony. This thesis is
strongly inspired by such capabilities of eusocial insects (particularly ants) and
devoted to understanding how tasks can be allocated effectively in a dynamic fashion
to the agents in a self-organised multi-agent system. The author delves into the
literature of entomology to investigate the different strategies ant colonies adopt
under different circumstances to allocate tasks. In particular, three strategies of task
allocations (by taking inspirations from the behaviour of ant colonies) are proposed
and modelled in line with the behaviour of ant colonies. The strategies are then
critically analysed to understand the effectiveness of the strategies in terms of colony
performance under different circumstances.
8.1 Approach to the problem
The best way to model and analyse strategies for a system is perhaps by observing
and understanding how other similar systems work. Since nature provides us with
plenty of self organised systems, a good approach would be to understand how these
systems work under various situations. Once these natural systems are well
understood, they can be modelled and various strategies the natural agents use then
can be simulated to see how well they perform under different circumstances. This
has principally been our approach for designing and investigating task allocation
models for swarm based multi-agent systems. Social insects and more particularly
ants, were chosen to understand the strategies for decentralised task allocation since
ants are very well known for displaying numerous examples of decentralised
division of labour.
Page 222
220
There are currently over 12,000 known species of ants, each maintaining highly
organized colonies and nests with colony size ranging from a few individual to
20,000,000 individuals [Beckers et al., 1989; Momen and Sharkey, 2009b]. Different
species often have different strategies for task execution – thus providing us with the
possibility of developing and understanding different task allocation techniques.
Furthermore ants are remarkable in managing tasks as well. Ants use simple yet
sophisticated means of allocating tasks allowing them to manage colonies with such
wide range of nestmates. All these points have prompted the decision to model and
analyse task allocation strategies based on the behaviour of ants.
8.2 Summary of the thesis
In this thesis, we analyse and reason about how ants behave in various situations.
This has led to an understanding of how ants behave, and more importantly how they
allocate tasks among themselves without having a global view of template of the
environment. Furthermore, three strategies for task allocation are suggested based on
the understanding of their behaviour. In order to see if the suggested strategies are
ant-like, it was necessary to model them and observe the dynamics involved. To
realise this, agent based modelling techniques have been adopted to model their
behaviour. The primary reasons for choosing agent based modelling techniques are
(1) it allows us to see the dynamics of their behaviour, (2) it makes it possible to
change behavioural rules quickly (if needed be) and to visually watch how it affects
the collective behaviour of the agents and (3) it makes it possible to experiment with
wide range of parameters.
Page 223
221
This thesis is comprised of eight chapters. Chapter 1 provides an introduction to the
thesis and sets out the goals and objective of the thesis. Chapters 2 and 3 provide a
detailed literature review that acts as a base for the thesis. Chapter 2 mostly discusses
the self-organising system in various systems in nature including that of ants while
chapter 3 specifically discusses the task allocation strategies in self organised and
market based systems.
The first model proposed was presented in Chapter 4 of the thesis. This chapter
includes a detailed discussion of the behavioural rules of the agents, the topology of
the environment, the communication strategies between the agents and the
constituents of the environment. The chapter also discusses in good detail how the
performance of the colony can be evaluated and presents a series of experiments and
their results in different circumstances. The chapter, furthermore, shows that the
behavioural rules that were used generate a system that is scalable, robust and
decentralised. The chapter uses the concept of simple thresholds to enable agents to
respond to a particular task.
Chapter 5 extends the model that was presented in chapter 4. The communication
method that was used in chapter 4 was entirely stigmergic i.e. agents do not directly
communicate rather only communicate indirectly via the environment. However, in
real ants, it is very well established that ants use direct communication in
conjunction with stigmergic communication. This concept has been adopted and
used in modelling the behaviour of agents. In this version of the model, the ants use
explicit communication (i.e. indirect communication + direct communication under
certain condition) and we analyse whether, and when, this helps to improve the
Page 224
222
colony efficiency. A series of experiments were created with different conditions and
settings to see if explicit communication at all benefits the performance of the
colony. Statistical tests were carried out to analyse whether the performance for
explicit communication between the agents is a significant improvement over that of
the indirect communication. Our results indicate that explicit communication has an
advantage over sole indirect communication but the performance of the colony that
exhibits explicit communication is not necessarily always a significant improvement
over that of the indirect communication. This finding is remarkable because it gives
us an indication why many colonies of ants use purely stigmergic communication
while there are many that exhibit explicit communication.
Chapter 6 looks into the concept of heterogeneous mixture within a particular caste.
This work intends to see how the performance of the colony is affected if a caste is
slightly biased towards a particular task. The ratio of bias can be varied by varying
the number of biased agents within that caste. It has been interestingly found that
some degree of bias within the caste significantly improves the performance of the
colony. A series of experiments have again been carried out to see if the
improvement of the performance of the colony due to slight biasness is always true
or not. Two conditions of the environment (benign and harsh) have been developed
and a detailed analysis has been made about the effect of biasness on the colony and
also when the incorporation of biasness can improve the performance significantly.
All these experiments led us to conclude that there is no universal best strategy for
task allocation. Rather the optimal task allocation strategy is a function of many
factors including the condition of the environment (e.g. food availability), the
Page 225
223
number of agents involved and the demand of the colony (e.g. hungry brood
members). The results of the experiments indicate the situations when a particular
task allocation strategy can be expected to benefit the colony and hence can be
employed while designing similar multi-agent systems.
Discussion and comparison of the results from three models is critically analysed and
reviewed in chapter 7.
The task allocation strategy used in chapter 4 use stigmergic communication
between agents. The model presented in chapter 5 uses explicit communication
between the agents for allocating tasks. Use of explicit communication is always
found to yield better colony performance compared to the indirect communication.
However, when the results were statistically evaluated, it was found that explicit
communication works better under stressed conditions. The results obtained were in
line with the predictions made. The third strategy looks into a mixture of
heterogeneous agents having different task preferences towards brood caring. It was
found that a slight bias (preference) towards a particular task always improves the
performance of the colony. This result is in line with the observation of natural ant
colonies where we find different castes to emerge within the colony. The results
found suggest that a slight biasness within the colony results in a greater colony
performance. From the results obtained, it can be suggested that while designing a
similar multi agent system, it is important to evaluate the condition of the system.
For instance, if the environment is simple and less stressful, stigmergic
communication between the agents could yield a good performance of the colony.
However, if the system is more complex and stressful (i.e. there is a more frequent
Page 226
224
need to meet the demand), incorporating explicit communication would yield better
colony performance. Finally, the performance of the colony can possibly be
enhanced further by introducing the right mixture of heterogeneity among the agents.
8.3 Contributions
A number of contributions have been made in this thesis. The main contributions of
the thesis include:
1. A detailed simulation environment that facilitates a deeper
understanding of task allocation mechanisms in groups of mobile agents
is developed and described: In order to capture the dynamics involved and
to better understand the task allocation mechanisms, it was essential to
develop a simulation environment that would make it possible to vary the
parameters easily and to investigate how well the task allocation mechanisms
perform under different circumstances.
A bottom up approach (using agent based modelling techniques) was used to
model the system rather than a top down approach since it allows the detailed
modelling of local interactions among the neighbouring agents and also
between the agents and the environment in the vicinity – thus enabling the
capture of the emergent phenomena from the simple interactions of the
agents. A top down approach would not have allowed the modelling of such
local interactions between the individuals. Rather it would mainly involve
modelling at the aggregate level i.e. looking at how the populations of agents
behave as a whole. The bottom up approach adopted in this thesis provides a
Page 227
225
natural description of the system and is flexible in terms of experimentations
with varying parameters [Bonabeau, 2002].
The simulation environment takes many aspects of ant colonies and ant
behaviour into consideration at a level of detail usually not found in other
models of ant colony behaviour. The number of agents and the range of tasks
involved are larger than those usually involved in swarm robotic research.
The simulated environment also captures a high degree of eusociality.
Although many researchers describe their work as being inspired by the
social behaviour of insects, they often fail to take all the key aspects of social
behaviours as mentioned by [Wilson, 1971] into consideration. The models
presented in this thesis capture the fundamental aspects of eusocial behaviour
(i.e. cooperative brood caring, overlapping of generations and division of
labour) as outlined by [Wilson, 1971] and are unusual and more ant like in
that respect.
2. Three task allocation strategies in the light of ant colony behaviours are
proposed: Three task allocation strategies have been designed and developed
in this thesis. The task allocation strategies are all inspired by how ant
colonies behave. The first strategy, presented in Chapter 4, uses only
stigmergic interactions between the agents to communicate with and also to
influence other agents to take up some particular task. In Chapter 5, a second
strategy of task allocation was presented. In this strategy, the agents use both
direct and indirect communication to allocate tasks among themselves.
Finally, in Chapter 6, a third strategy was presented where a heterogeneous
mixture of agents participates in the allocation of tasks. In previous
Page 228
226
investigations of task allocation, the strategies that have been modelled, or
investigated, have mostly involved the use of indirect communication. The
present thesis is unusual in its development and exploration of explicit
measures of communication and their advantages under different
circumstances. The exploration of the advantage of bias in the colony is a
further novel contribution of this thesis. Such biases are noticeable in
complex colonies but to our knowledge no work has previously been done to
understand the benefit of them by means of modelling techniques such as
those presented here.
3. As a consequence of the detailed simulation environment and the
modelling of different task allocation strategies, a better understanding
of the strengths of different task allocation strategies under different
circumstances has been achieved: This thesis takes a systematic approach
to investigating the relative strengths of the three task allocation mechanisms
under different circumstances. Although it can be concluded that there is no
universal best task allocation strategy, the thesis finds some general trends
that indicate the circumstances under which a particular task allocation
strategy would be expected to work better. For instance, chapter 5 of the
thesis indicates that although agents using explicit communication almost
always perform better than those using only indirect communication, their
performance is significantly better under stressful condition (please refer to
chapter 5 for further details). In chapter 6, the role of bias towards brood
caring in the colony was investigated and it was found that a slight bias under
benign conditions tends to improve the performance of the colony. Such
identifications of the relative strengths of different task allocation strategies
Page 229
227
should help researchers to design more effective task allocation mechanisms
for multi-agent systems.
8.4 Future Works
This thesis has explored the design and modelling of task allocation behaviour
for swarm systems. The thesis takes its inspiration from the way the eusocial
insects allocate tasks in response to the changing demands. Three task allocation
strategies, in the light of how ant colonies behave, have been developed and
analysed. The results obtained from the analyses made could be used to guide
researchers to choose effective task allocation strategies for the systems they are
involved with. In future, we intend to carry out further investigations that would
lead us to understand task allocation strategies and the effect of the strategies on
the colony performance better. We intend to carry out further investigations into
the following research areas that will improve our understanding of the effects of
the task allocation strategies on the colony performance:
A. Effect of parameters on the performance of the colony:
The experiments reported in chapters 4, 5 and 6 varied some of the
parameters of the model to investigate the effect of the parameters on the
performance of the colony. For our future work, it would be interesting to do
a complete sweep of parameter space to investigate the effect of each of the
parameters on the colony performance and also to find the set of parameters
that result in maximum performance. Use of genetic algorithms (GA) to
determine optimal or near-optimal solution would also be an interesting
approach for finding optimal solutions.
Page 230
228
B. Stronger model validation:
The models developed have captured many aspects of the behaviour of ant
colonies including cooperative brood caring, foraging techniques, task
allocation techniques using threshold based mechanism and decentralised
mechanism. The results obtained from the simulation experiments show
similar behaviour to that of the real ant colonies (in terms of robustness,
flexibility and scalability). Therefore, in one way the model is validated. But
the stronger the validation of the model is the stronger would be the
reliability of the model. Therefore, for our future work, we intend to move
towards more rigorous validation of the model. One way of doing this would
be to compare the behaviour that we obtain from experimenting with real
robots with that of the simulated behaviour to give us an understanding how
close the models are.
C. Extend the task allocation models:
In future, we would like to model more task allocation strategies that ants
exhibit and create a library for task allocation for users. Such libraries could
then be used to analyse the impact of the different task allocation strategies
on the performance of the colony. This in turn would help to make it possible
to quickly use different known task allocation strategy in different situations
and analyse how it affects the performance of the colony.
Page 231
229
Bibliography
Abbott, K. L. (2005). Supercolonies of the invasive yellow crazy ant, Anoplolepis
gracilipes, on an oceanic island: Forager activity pattern, density and biomass.
Insectes Sociaux, 52 (3): 266 – 273.
Alcock, J. (2001). Animal behaviour: an evolutionary approach, Sinauer Associates.
Anderson, C. (2003). Linking micro – to macro – level behaviour in the aggressor –
defender – stalker game. Workshops of Mathematics and Algorithms of Social
Insects (MASI),
Anderson, C., Boomsma, J.J., Bartholdi III, J.J. (2002). Task partitioning in insect
societies: bucket brigades. Insectes Sociaux, 49: 171 – 180.
Anderson, C. and Franks, N.R. (2001). Teams in animal societies. Behavioural
Ecology 12(5): 534 – 540.
Anderson, C. and McShea, D.W. (2001). Individual versus social complexity, with
particular reference to ant colonies. Biol. Rev. 76: 211 – 237.
Anderson, C. and Ratnieks, F.L.W. (1999). Task partitioning in foraging: general
principles, efficiency and information reliability in queuing delays. In C.Detrain, J.L.
Deneubourg and J.M. Pasteels (Eds) Information processing in social insects, 31 –
50.
Anderson, J.B. and Meer, V.R.K. (1993). Magnetic orientation in the fire ant,
Solenopsis invicta. Naturwissenschaften 80: 568 – 570.
Arcaute, E., Christensen, K., Franks, A.S., Dahl, T., Espinosa, A., Jensen, H.J.
(2009). Division of labour in ant colonies in terms of attractive fields. Ecological
Complexity, 6: 396 – 402.
Page 232
230
Ashby, W.R. (1947). Principles of self-organizing dynamic systems, Journal of
General Psychology, 37: 125 – 128.
Avalos, A.D., Wajnberg, E., Oliveira, P.S., Leal, I., Farina, M., Esquivel, D.M.S.
(1999). Isolation of magnetic nanoparticles from Pachycondyla marginata ants.
Journal of Experimental Biology, 202: 2687 – 2692.
Bagnoli, P., Brunelli, M., Magni, F., Musumeci, D. (1976). Neural mechanisms
underlying spontaneous flashing and its modulation in the firefly. Journal of
Comparative Physiology A: Neuroethology, Sensory, Neural and Behavioural
Physiology, 108: 133 – 156.
Banks, A.N. and Srygley, R.B. (2003). Orientation by magnetic field in leaf-cutter
ants, Atta colombica (Hymenoptera: Formicidae). Ethology, 109: 835 – 846.
Beckers, R., Goss, S., Deneubourg, J.L., Pasteels, J.M. (1989). Colony size,
communication and ant foraging strategy. Psyche, 96: 239 – 256.
Beni, G. (2005a). From swarm intelligence to swarm robotics. In Erol Şahin and
William M. Spears (Eds) Swarm Robotics, LNCS 3342, Springer Verlag, 1 – 9.
Beni, G. (2005b). Order by disordered action in swarms. In Erol Şahin and William
M. Spears (Eds) Swarm Robotics, LNCS 3342, Springer Verlag, 153 – 171.
Beni, G. And Wang, J. (1989). Swarm Intelligence in Cellular Robotic Systems.
Proceeding of NATO Advanced, Workshop on Robots and Biological System.
Beshers, S.N. and Fewell, J.H. (2001). Models of division of labour in social insects.
Annu. Rev. Entomol., 46: 413 – 440.
Billen, J.(2006). Signal variety and communication in social insects. In the
proceeding of Neth.Entomol.Soc.Meet., 17: 9 – 25
Page 233
231
Bonabeau (2002). Agent based modelling: Methods and techniques for simulating
human systems. Proceeding of National Academy of Science, U.S.A., 99
(Supplement 3): 7280 – 7287.
Bonabeau, E., Dorigo, M. and Theraulaz, G. (1999). Swarm Intelligence: From
natural to artificial systems. Oxford University Press.
Bonabeau, E., Theraulaz, G., Deneubourg, J.L. (1998). Fixed response thresholds
and the regulation of division of labour in insect societies. Bull. Math. Biol, 60: 753
– 807.
Bonabeau, E., Theraulaz, G., Deneubourg, J.L., Aron, S., Camazine, S. (1997). Self-
organization in social insects. Trends in Ecology and Evolution, 12(5):188 – 193.
Bonabeau, E., Theraulaz, G., Deneubourg, J.L.(1996). Quantitative study of fixed
threshold model for the regulation of division of labour in insect societies.
Proceedings of the Royal Society of London B., 263: 1565 – 1569.
Bonner, J.T. (1983). Chemical signals of social amoebae. Scientific American,
248:114 – 120.
Bonner, J.T. (1967). The cellular slime molds. Princeton University Press.
Bourke, A.F.G. (1999). Colony size, social complexity and reproductive conflict in
social insects. Journal of Evolutionary Biology, 12:245 – 257.
Bourke, A.F.G. and Franks, N.R. (1995). Social evolution in ants. Princeton
University Press.
Braitenberg, V. (1986). Vehicles: Experiments in Synthetic Psychology. MIT Press.
Brutschy, A., Tran, N.L., Baibourn, N., Frison, M., Pini, G., Roli, A., Dorigo, M.,
Birattari, M. (2011). Costs and benefits of behavioral specialization. In Roderich
Groβ, Lyuba Alboul, Chris Melhuish, Mark Witkowski, Tony, Prescott, Jacques
Page 234
232
Penders (Eds) Towards Autonomous Robotic Systems, LNAI 6856, Springer Verlag,
90 – 101.
Buck, J.B. (1988). Synchronous rhythmic flashing of fireflies II. The quarterly
review of Biology. 63(3): 265 – 289.
Buschinger, A. (1989). Evolution, Speciation and inbreeding in the parasitic ant
genus Epimyrma (Hymenoptera, Formicidae). Journal of Evolutionary Biology, 2:
265 – 283.
Buschinger, A. (1986). Evolution of social parasitism in ants. Trends in Ecology and
Evolution, 1: 155 – 160.
Calderone, N.W. and Page, R.E. (1996). Temporal polyethism and behavioural
canalization in the honey bee, Apis mellifera. Animal Behaviour, 51: 631 – 643.
Camazine, S., Deneubourg, J.L., Franks, N.R., Sneyd, J., Theraulaz, G. and
Bonabeau, E., (2001). Self-organisation in biological systems. Princeton University
Press.
Case, J.F. and Buck, J.B. (1963). Control of flashing in fireflies II. Role of central
nervous system. Biological Bulletin, 125: 234 – 250.
Case, J.F. and Strause, L.G. (1978). Neurally controlled luminescent systems. In P.J.
Herring (Eds) Bioluminescence in action, Academic Press.
Cassill, D.L. and Tschinkel, W.R. (1999). Regulation of diet in the fire ant,
Solenopsis invicta. Journal of Insect Behaviour, 12(3): 307 – 328.
Celikkanat, H. and Şahin, E. (2010). Steering self-organised robot flocks through
externally guided individuals. Neural computing and Applications Journal,
19(6):849 – 865.
Page 235
233
Cheng, K., Wang, Y., Dasgupta, P. (2009). Distributed area coverage using robot
flocks. IEEE World Congress on Nature and Biologically Inspired Computing
(NABIC’09), 678 – 683
Chittka, L. and Muller, H. (2009). Learning, specialization, efficiency and task
allocation in social insects. Communicative & Integrative Biology, 2(2): 151 – 154.
Couzin, I.D. and Franks, N.R. (2002). Self-organized lane formation and optimized
traffic flow in army ants. Proceedings of the Royal Society, London B, 270: 139 –
146.
Couzin, I.D., Krause, J., James, R., Ruxton, G.D., Franks, N.R. (2002). Collective
memory and spatial sorting in animal groups. Journal of Theoretical Biology, 218:1
– 11.
Daley, D.J. and Kendal, D.G. (1965). Stochastic rumours. J.Inst. Maths Applics,
1(1):42 – 55.
Darwin, C. (1859). On the origin of species by means of natural selection. John
Murray, London.
Deneubourg, J.L., Goss, S., Pasteels, J.M., Fresneau, D., Lachaud, J.P. (1987). Self-
organization in ant societies (III): Learning in foraging and division of labour. In
J.M. Pasteels and J.L. Deneubourg (Eds) From individual to collective behaviour in
social insects, 54: 177 – 196.
Detrain, C. and Pasteels, J.M. (1992). Caste polyethism and collective defence in the
ant, Pheidole pallidula: the outcome of quantitative differences in recruitment.
Behavioural Ecology Sociobiology, 29: 405 – 412.
Ducatelle, F., Di Caro, G.A., Pinciroli, C., Gambardella, L.M. (2011). Self-organized
cooperation between robotic swarms. Swarm Intelligence
Page 236
234
Ducatelle, F., Föerster, A., Di Caro, G.A., Gambardella, L.M. (2009). New task
allocation for robotic swarms. Proceedings of the 9th
IEEE/RAS Conference on
Autonomous Robot Systems and Competitions.
Fielde, A.M. and Parker, G.H. (1904). The reactions of ants to material vibrations.
Proceedings of the Academy of Natural Sciences of Philadelphia, 56(2): 642 – 650.
Franks, N.R. (2003). Ants. In V.H. Resh and R.T. Cardé (Eds) Encyclopaedia of
Insects, 29 – 32.
Franks, N.R. (1986). Teams in social insects: group retrieval of prey by army ants
(Eciton burchelli, Hymenoptera: Formicidae). Behavioural Ecology and Sociology,
18: 425 – 429.
Franks, N.R., Hooper, J.W., Dornhaus, A., Aukett, P.J., Hayward, A.L., Berghoff,
S.M. (2007). Reconnaissance and latent learning in ants. Proceedings of The Royal
Society B, 274: 1505 – 1509.
Franks, N.R. and Deneubourg, J.L. (1997). Self-organising nest construction in ants:
individual worker behaviour and nest’s dynamics. Animal Behaviour, 54: 779 – 796.
Franks, N.R. and Richardson, T. (2006). Teaching in tandem running ants. Nature,
439: 153.
Franks, N.R., Sendova-Franks, A.B., Anderson, C. (2001). Division of labour within
teams of New World and Old World army ants. Animal Behaviour, 62: 635 – 642.
Frisch, K.V. (1923). Ǜber die Sprache der Bienen. Eine tierpsychologische
Untersuchung. Zoologische Jahrbücher. Abteilung für allgemeine Zoologie and
Physiologie, 40: 439 – 446.
Frisch, K.V. (1953). Sprache’ oder ‘Kommunication’ der Bienen? Psychologische
Rundschau, 4: 235 – 236.
Page 237
235
Galstyan, A. and Lerman, K. (2004). Analysis of a stochastic model of adaptive task
allocation in robots. In S. Breuckner, G. Di Marzo Serugendo, A. Karageorgos, R.
Nagpal (Eds) Engineering Self Organizing Systems: Methodology and Applicationsy.
Garnier, S., Gautrais, J. and Theraulaz, G. (2007). The biological principles of
swarm intelligence. Swarm Intelligence, 1(1): 3 – 31.
Gerkey, B.P. and Matarić, M. (2000). Murdoch: Publish/Subscribe task allocation
for heterogeneous agents, Agents 2000, 203 – 204.
Getling, A.V. and Brausch, O. (2003). Cellular flow patterns and their evolutionary
scenarios in the three-dimensional Rayleigh-Bénard convection. Physical Review E,
67(046313):1 – 4.
Gibbs, A. (2002). Lipid melting and cuticular permeability: new insights into an old
problem. J.Ins.Physiol., 48: 391 – 400.
Gilbert, N. and Troitzsch, K.G. (2005). Simulation for the social scientist. Open
University Press.
Gokce, F. and Şahin, E. (2009). To flock or not to flock: pros and cons of flocking in
long range “migration” of mobile robot swarms. 8th
International conference on
autonomous agents and multiagent systems, 65 – 72.
Gold, H.J. (1977). Mathematical modelling of biological systems. Wiley-Interscience
publication.
Goldbeter, A. (1996). Biochemical oscillations and cellular rhythms. Cambridge
University Press.
Gordon, D.M. (2002). The regulation of foraging activity in red harvester ant
colonies. American Naturalist, 159: 509 – 518.
Page 238
236
Gordon, D.M. (1999). Ants at work: how an insect society is organized. The Free
Press.
Gordon, D.M., Holmes, S., Nacu, S. (2008). The short-term regulation of foraging in
harvester ants. Behavioural Ecology, 19(1): 217 – 222.
Gordon, D.M. and Hӧlldobler (1987). Worker longevity in harvester ants. Psyche,
94: 341 – 346.
Grassé, P.P. (1959). La reconstruction du nid et les coordinations inter-individuelles
chez Bellicositermes Natalensis et Cubitermes sp La théorie de la stigmergie: essai
d’interprétation du comportment des termites constructeur. Insectes Sociaux, 6: 41 –
80.
Greene, J. And D’Oliviera, M. (2006). Learning to use statistical tests in psychology.
3rd
Edition. Open University Press.
Greene, M.J. and Gordon, D.M. (2007). How patrollers set foraging direction in
harvester ants. American Naturalist, 170: 943 – 948.
Greene, M.J. and Gordon, D.M. (2003). Cuticular hydrocarbons inform task
decisions. Nature, 423:32.
Groß, R., Nouyan, S., Bonani, M., Mondada, F., Dorigo, M. (2008). Division of
labour in self-organised groups. Proceedings of the 10th
International Conference on
Simulation of Adaptive Behaviour, SAB2008, volume 5040 of Lecture Notes in
Artificial Intelligence, 426 – 436.
Halloy, J., Sempo, G., Caprari, G., Rivault, C., Asadpour, M., Tâche, F., Saïd, I.,
Durier, V., Canonge, S., Amé, J.M., Detrain, C., Correll, N., Martinoli, A., Mondada,
F., Siegwart, R., Deneubourg, J.L. (2007). Social integration of robots into groups of
cockroaches to control self-organised choices. Science, 318: 1155 – 1158.
Page 239
237
Hamilton, W. (1971). Geometry of the selfish herd. Journal of theoretical biology,
31: 295 – 311.
Hanson, F.E., Case, J.F., Buck, E., Buck, J. (1971). Synchrony and flash entrainment
in a new Guinea firefly. Science, 174: 161 – 164.
Hart, A.G., Anderson, C., Ratnieks, F.L.W. (2002). Task partitioning in leafcutting
ants. Acta ethol., 5: 1 – 11.
Haskins, C.P. and Enzmann, E.V. (1938). Studies of certain sociological and
physiological features in the Formicidae. Annals of the New York Academy of
Sciences, 37(2): 97 – 162.
Hasson, O. (1994). Cheating signals. Journal of theoretical biology, 167: 223 – 238.
Helbing, D., Buzna, L., Johansson, A., Werner, T. (2005). Self-organized pedestrian
crowd dynamics: experiments, simulations and design solutions. Transportation
Science, 39 (1): 1 – 24.
Helbing, D., Molnar, P., Farkas, I.J., Bolay, K. (2001). Self-organizing pedestrian
movement. Envrionment and Planning B: Planning and Design, 28: 361 – 383.
Hoeing, M., Dasgupta, P., Petrov, P., O’Hara, S. (2007). Auction-based multi-robot
task allocation in COMSTAR. The Sixth International Conference on Autonomous
Agents and Multi-Agent Systems (AAMAS), 1436 – 1442.
Hölldobler, B., Stanton, R.C., Markl, H. (1978). Recruitment and food retrieving
behaviour in Novomessor (Formicidae: Hymenoptera) I. Chemical Signals. Behav.
Ecol. Sociobiol., 4: 163 – 181.
Hölldobler, B. and Wilson, E.O. (2008). The Super-organism: the beauty, elegance
and strangeness of insect societies. W.W. Norton.
Page 240
238
Hölldobler, B. and Wilson, E.O. (1994). Journey to the ants: A story of scientific
exploration. The Belknap Press of Harvard University Press, Cambridge,
Massachusetts London, England.
Hölldobler, B. and Wilson, E.O. (1990). The ANTS. The Belknap Press of Harvard
University Press Cambridge, Massachusetts.
Howard, R.W., McDaniel, C.A., Nelson, D.R., Blomquist, G.J., Gelbaum, L.T.,
Zalkow, L.H. (1982). Cuticular hydrocarbons of Reticulitermes virginicus (Banks)
and their role as potential species- and caste-recognition cues. J.Chem.Ecol., 8:1227
– 1239.
Ijspeert, A.J., Martinoli, A., Billard, A., Gambardella, L.M (2001). Collaboration
through expoitation of local interactions in autonomous collective robotics: The stick
pulling experiment. Autonomous Robots, 11: 149 – 171.
Ingram, K.K., Oefner, P., Gordon, D.M. (2005). Task-specific expression of the
foraging gene in harvester ants. Molecular Biology, 14: 813 – 818.
Jackson, D. and Ratnieks, F.L.W. (2006). Communication in ants. Current Biology,
16: 570 – 574.
Jackson, L.L. and Blomquist, G.J. (1976). Insect Waxes. In P.E. Kolattukudy (Ed)
Chemistry and Biochemistry of natural waxes, 201 – 223.
Jeanne, R.L. (1986). The evolution of the organization of work in social insects.
Monit. Zool. Ital., 20: 119 – 133.
Jeanson, R., Fewell, J.F., Gorelick, R. and Bertam, S.M. (2007). Emergence of
increased division of labour as a function of group size. Behav. Ecol. Sociobiol. 62:
289 – 298.
Page 241
239
Jones, C. and Matarić, M. (2003). Adaptive division of labour in large-scale
minimalist multi-robot systems. In IEEE/RSJ International Conference on Intelligent
Robots and Systems, 1969 – 1974.
Kalra, N. and Martinoli, A. (2006). A comparative study of market-based and
threshold-based task allocation. Proceedings of the 8th
International Symposium on
Distributed Autonomous Robotics Systems (DARS).
Kosfield, M. (2005). Rumours and markets. Journal of Mathematical Economics, 41:
646 – 664.
Krause, J. and Ruxton, G.D. (2002). Living in groups. Oxford University Press.
Krieger, M.J.B. and Billeter, J.B. (2000). The call of duty: Self-organised task
allocation in a population of up to twelve mobile robots. Robotics and Autonomous
Systems, 30: 65 – 84.
Krieger, M.J.B., Billeter, J.B., Keller, L. (2000). Ant-like task allocation and
recruitment in cooperative robots. Nature, 406: 992 – 995.
Kube, C.R. and Bonabeau, E. (2000). Cooperative transport by ants and robots.
Robotics and Autonomous Systems, 30: 85 – 101.
Kube, C.R. and Zhang, H. (1994). Stagnation recovery behaviours for collective
robotics. IEEE/RSJ/GI International Conference on Intelligent Robots and Systems,
1883 – 1890.
Labella, T.H. (2007). Division of labour in groups of robots. PhD thesis, Universite
Libre De Bruxelles.
Labella, T.H., Dorigo, M., Deneubourg, J.L. (2004). Efficiency and task allocation in
prey retrieval. BioADIT 2004 (Eds) A.J. Ijspeert et al., LNCS 3141, 274 – 289.
Page 242
240
Lachaud, J.P. (1990). Foraging activity and diet in some neotropical ponerine ants. I.
Ectatomma ruidum Roger (Hymenoptera: Formicidae). Folia Entomológica
Mexicana, 78: 241 – 256.
Lavine, B.K., Morel, L., Vander-Meer, R.K., Gunderson, R.W., Han, J.H., Bonanno,
A., Stine, A. (1990). Pattern recognition studies in chemical communication:
nestmate recognition in Camponotus floridanus. Chemometrics and Intelligent
Laboratory Systems, 107 – 114.
Leadbeater, E., Raine, N.E., Chittka, L. (2006). Social learning: Ants and the
meaning of teaching. Current Biology, 16(9): 323 – 325.
Lehmann, H. (2009). On the applicability of agent based modelling in behavioural
ecology. PhD thesis, University of Bath.
Lerman, K., Martinoli, A., Galstyan, A. (2005). A review of probabilistic
macroscopic models for swarm robotics systems. In Erol Şahin and William M.
Spears (Eds) Swarm Robotics Workshop, 143 – 152.
Liu, W. (2008). Design and modelling of adaptive foraging in swarm robotic
systems. PhD thesis, University of West of England.
Liu, W. and Winfield, A.F.T. (2010). Modeling and optimization of adaptive
foraging in swarm robotic systems. The International Journal of Robotics Research,
1 – 18.
Liu, W., Winfield, A.F.T., Sa, J., Chen, J., Dou, L. (2007a). Strategies for energy
optimisation in a swarm of foraging robots. Adaptive behaviour, 15(3): 289 – 305.
Liu, W., Winfield, A.F.T., Sa, J., Chen, J., Dou, L. (2007b). Towards energy
optimisation: Emergent task allocation in a swarm of foraging robots. (Eds) Erol
Şahin, William M. Spears and Alan F.T. Winfield, Swarm Robotics LNCS 4433, 14 –
26.
Page 243
241
Lorenz, K. (1939). Vergleichende Verhaltensforschung. Zoologische Anzeiger,
Supplement. 12: 69 – 102.
Matarić, M. Sukhatme, G.S., Østergaard, E.H. (2003). Multi-robot task allocation in
uncertain environments. Autonomous Robots, 14: 255 – 263.
Michener, C.D. (1974). The social behaviour of bees: a comparative study. Harvard
University Press, Cambridge.
Milgram, S. and Toch, H. (1969). Collective behaviour: crowds and social
movements, In G.Lindzey and E.Aronson (Eds) The handbook of social psychology
Volume IV.
Momen, S. and Sharkey, A.J.C. (2010). From ants to robots: A decentralised task
allocation model for a swarm of robots. In Cyrille Bertelle, Gerard H.E. Duchamp
and Rawan Ghnemat (Eds) Proceedings of Swarm Intelligence and Applications
Symposium, AISB convention, 3 – 11.
Momen, S. and Sharkey, A.J.C. (2009a). An ant-like task allocation model for a
swarm of heterogeneous robots. Proceedings of Swarm Intelligence and Applications
Symposium, AISB convention, 31 – 38.
Momen, S. and Sharkey, A.J.C. (2009b). Strategies of division of labour for
improving task efficiency in multi-robot systems. IEEE World Congress on Nature
and Biologically Inspired Computing (NABIC’09), 672 – 677.
Momen, S. and Sharkey, A.J.C. (2008). An ant-like task allocation model for
heterogeneous groups of robots. IUSSI 2008: 4th
European Meeting of the
International Union for the Study of Social Insects, 117.
Momen, S., Amavasai, B.P. and Siddique, N.H. (2007). Mixed species flocking for
heterogeneous robotic swarms. IEEE Eurocon 2007: The International Conference
on Computer as a Tool, 2329 – 2336.
Page 244
242
Möslinger, C, Schmickl, T., Crailsheim, K. (2010). A minimalist flocking algorithm
for swarm robots. Proceeding of the 10th
European Conference on Artificial Life
Moussaϊd, M., Perozo, N., Garnier, S., Helbing, D., Theraulaz, G. (2010). The
walking behaviour of pedestrian social groups and its impact on crowd dynamics.
PLoS ONE, 5(4): 1 – 7.
Munz, T. (2005). The Bee Battles: Karl von Frisch, Adrian Wenner and the
honeybee dance language controversy. Journal of History of Biology, 38: 535 – 570.
Myerscough, M.R. and Oldroyd, B.P. (2004). Simulation models of the role of
genetic variability in social insect task allocation. Insect. Soc., 51: 146 – 152.
Nardi, R. D. and Holland, O. (2007). Ultraswarm: A further step towards a flock of
miniature helicopters. In Erol Şahin, William M. Spears and Alan F.T. Winfield
(Eds) Swarm Robotics, LNCS 4433, Springer Verlag, 116 – 128.
Nekovee, M., Moreno, Y., Bianconi, G., Marsili, M. (2007). Theory of rumour
spreading in complex social networks. Journal of Physica A, 374: 457 – 470.
Nelson, D.R. and Blomquist, G.J. (1995). Insect Waxes. In R.J. Hamilton (Ed)
Chemistry, Molecular Biology and Functions, 1 – 90.
Oldroyd, B.P. and Fewell, J.H. (2007). Genetic diversity promotes homeostasis in
insect colonies. Trends in Ecology and Evolution, 22(8): 408 – 413.
Oster, G.F. and Wilson, E.O. (1978). Castes and ecology in social insects. Princeton
University Press, Princeton.
Page, R.E.J. (1997). The evolution of insect societies. Endeavour, 21: 114 – 120.
Page, R.E.J. and Robinson, G.E. (1991). The genetics of division of labour in honey
bee colonies. Adv. Insect Physiol., 23: 117 – 169.
Page 245
243
Parker, C.A.C., Zhang, H., Kube, C.R. (2003). Blind bulldozing: multiple robot nest
construction. Proceedings of the 2003 IEEE/RSJ Conference on Intelligent Robots
and Systems, 2010 – 2015.
Parker, L. E. (1998). ALLIANCE: An architecture for fault tolerant multi-robot
cooperation. IEEE transaction on Robotics and Automation, 14(2): 220 – 240.
Pelechano, N., Allbeck, J., Badler, N. (2008). Virtual crowds: methods, simulation
and control. Synthesis Lectures on Computer Graphics and Animation.
Plowright, R.C. and Plowright, C.M.S. (1988). Ellitism in social insects: A positive
feedback model. In R.L. Jeanne (Ed) Interindividual behavioural variability in social
insects, Boulder CO: Westview Press, 419 – 431.
Pratt, S. (2005). Quorum sensing by encounter rates in the ant Temnothorax
albipennis. Behavioural Ecology, 16(2): 488 – 496.
Provost, E., Blight, O., Tiard, A., Renucci, M. (2008). Hydrocarbons and insects’
social physiology. In Rayan P. Maes(Ed) Insect Physiology: New Research, 19 – 72.
Ratnieks, F.L.W. and Anderson, C. (1999). Task partitioning in insect societies.
Insectes Sociaux, 46: 95 – 108.
Ravary, F., Lecoutey, E., Kaminsky, G., Châline, N., Jaisson, P. (2007). Individual
experience alone can generate lasting division of labour in ants. Current Biology, 17:
1308 – 1312.
Resnick, M. (1997). Turtles, Termites and Traffic jams: Exploration in massively
parallel microworlds. MIT Press.
Reynolds, C.W. (1987). Flocks, herds and schools: a distributed behavioural model.
Computer Graphics, 21:25 – 34.
Page 246
244
Riveros, A.J. and Srygley, R.B. (2008). Do leafcutter ants, Atta colombica, orient
their path integrated vector with a magnetic compass? Animal Behaviour, 75(4):
1273 – 1281.
Robinson, E.J.H., Feinerman, O., Franks, N.R. (2009). Flexible task allocation and
organization of work in ants. Proceedings of the Royal Society B, 276: 4373 – 4380.
Robinson, G.E. (1992). Regulation of division of labour in insect societies. Annual
Review Entomology, 37: 637 – 665.
Robinson, G.E. and Page, R.E.J. (1989). Genetic basis for division of labour in an
insect society. In M.D. Breed and R.E.J. Page (Eds) The Genetics of Social
Evolution, Boulder, CO: Westview, 61 – 80.
Robinson, G.E., Page, R.E.J., Huang, Z.Y. (1994). Temporal polyethism in social
insects is a developmental process. Animal Behaviour, 48: 467 – 469.
Robson, S.K. and Beshers, S.N. (1997). Division of labour and ‘foraging for work’:
simulating reality versus reality of simulations. Animal Behaviour, 53: 214 – 218.
Rosato, A., Strandburg, K.J., Prinz, F., Swendsen, R.H. (1987). Why the Brazil nuts
are on top: size segregation of particulate matter by shaking. Physical Review
Letters, 58(10):1038 – 1040.
Rybski, P.E., Larson, A., Veeraghavan, H., Anderson, M., Gini, M. (2008).
Performance evaluation of a multi-robot search & retrieval system: Experiences with
MinDART. Journal of Intelligent Robot System, 52: 363 – 387.
Şahin, E. (2005). Swarm robotics: From sources of inspiration to domains of
application. In Erol Şahin and William M. Spears (Eds) Swarm Robotics, LNCS
3342, Springer Verlag, 10 – 20.
Page 247
245
Schatz, B., Lachaud, J.P., Beugnon, G. (1997). Graded recruitment and hunting
strategies linked to prey weight in the neotropical ant, Ectatomma ruidum. Behav.
Ecol. Sociobiol., 40: 337 – 349.
Schmickl, T. and Crailsheim, K. (2008a). An individual-based model of task
allocation in honeybees. SAB 2008, LNAI 5040, 383 – 392.
Schmickl, T. and Crailsheim, K. (2008b). Analysing honeybees’ division of labour
in broodcare by a multi-agent model. Artificial Life XI, 529 – 536.
Schmickl, T. and Crailsheim, K. (2008c). TaskSelSim: A model of self-organization
of division of labour in honeybees. Mathematical and Computer Modelling of
Dynamical Systems, 14 (2): 101 – 125.
Schmickl, T. and Crailsheim, K. (2007). A navigation algorithm for swarm robotics
inspired by slime mold aggregation. In Erol Şahin, William M. Spears and Alan F.T.
Winfield (Eds) Swarm Robotics, LNCS 4433, Springer Verlag, 1 – 13.
Schmickl, T., Hamann, H., Wörn, H., Crailsheim, K. (2009). Two different
approaches to a macroscopic model of a bio-inspired robotic system. Robotics and
Autonomous Systems, 57: 913 – 921.
Schutter, G.D., Theraulaz,G., Deneubourg, J.L.(2001). Animal-robots collective intelligence. Annals of Mathematics and Artificial Intelligence, 31: 223 – 238.
Seeley, T.D. (1992). The tremble dance of the honey bee: message and meanings.
Behav. Ecol. Sociobiol., 31: 375 – 383.
Senghas, A. and Coppola, M. (2001). Children creating language: How Nicaraguan
sign language acquired a spatial grammar. Psychological Science, 12: 323 – 328.
Sharkey, A.J.C. (2007). Swarm robotics and minimalism. Connection Science, 19(3):
245 – 260.
Page 248
246
Sharkey, A.J.C. (2006). Robots, Insects and Swarm Intelligence. Artificial
Intelligence Review, 26: 255 – 268.
Smith, A. (1776). The Wealth of Nations. Books I-III. Reprinted: 1986. Penguin
Harmondworth, UK.
Smith, J.M. and Harper, D. (2003). Animal Signals. Oxford Series in Ecology and
Evolution, Oxford University Press.
Sokal, R.R. and Rohlf, F.J. (1981). Biometry – The principles and practice of
statistics in biological research. 2nd Edition. W.H. Freeman and Company.
Spencer, A., Couzin, I.D., Franks, N.R. (1998). The dynamics of specialization and
generalization within biological populations. Journal of Complex Systems, 1: 1 – 14.
Sudd, J.H. (1965). The transport of prey by ant. Behaviour, 25: 234 – 271.
Sudd, J.H. (1960). The transport of prey by an ant Pheidole crassinoda. Behaviour,
16: 295 – 308.
Sumpter, D.J.T. (2010). Collective animal behaviour. Princeton University Press.
Sumpter, D.J.T. (2006). The principles of collective animal behaviour. Phil. Trans.
R. Soc. B, 361: 5 – 22.
Sumpter, D.J.T. and Brännström, Å. (2008). Synergy in Social Communication. In
D’Ettore and Hughes (Eds) Social Communication, Oxford University Press, 191 –
208.
Theraulaz, G. and Bonabeau, E. (1995). Modelling the collective building of
complex architectures in social insects with lattice swarms. Journal of Theoretical
Biology, 177: 381 – 400.
Page 249
247
Theraulaz, G., Bonabeau, E., Deneubourg, J.L. (1998). Threshold reinforcement and
the regulation of division of labour in insect societies. Proceedings of Royal Society
London B, 265: 327 – 335.
Theraulaz, G., Bonabeau, E., Solé, R.V., Schatz, B., Deneubourg, J.L. (2002). Task
partitioning in ponerine ant. Journal of theoretical biology, 215: 481 – 489.
Tinbergen, N. (1951). The study of instinct. Oxford University Press.
Tofts, C. (1992). Algorithms for task allocation in ants (a study of temporal
polyethism: theory). Bull. Math. Biol., 55: 891 – 918.
Tofts, C. and Franks, N.R. (1993). Doing the right thing – ants, honeybees and naked
mole-rats. Trends Ecol. Evol., 7: 346 – 349.
Traniello, J.F.A. and Rosengaus, R.B. (1997). Ecology, evolution and division of
labour in social insects. Animal Behaviour, 53: 209 – 213.
Vaughan, R., Sumpter, N., Henderson, J., Frost, A., Cameron, S. (2000).
Experiments in automatic flock control. Robotics and Autonomous Systems, 31: 109
– 117.
Wagner, D., Brown, M.J.F., Broun, P., Cuevas, W., Moses, L.E., Chao, D.L.,
Gordon, D.M. (1998). Task-related differences in the cuticular hydrocarbon
composition of Harvester ants, Pogonomyrmex barbatus. J.Chem.Ecol., 24: 2021 –
2037.
Wagner, D., Tissot, M., Gordon, D.M. (2001). Task-related environment alters the
cuticular hydrocarbon composition of harvester ants. J.Chem.Ecol., 27: 1805 – 1819.
Webb, B. (2008). Using robots to understand animal behaviour. Advances in the
study of behaviour, 38: 1 – 58.
Page 250
248
Webb, B. (2000). What does robotics offer animal behaviour? Animal Behaviour, 60:
545 – 558.
Wehner, R. (2003). Desert ant navigation: how miniature brains solve complex tasks.
Journal of Comparative Physiology, 189: 579 – 588.
Wilensky, U.(1999). Netlogo. Center for Connected Learning and Computer-Based
Modelling, Northwestern University.
Wilensky, U.(1998a). Netlogo Flocking Model. Center for Connected Learning and
Computer-Based Modelling, Northwestern University.
Wilensky, U.(1998b). Netlogo Slime Model. Center for Connected Learning and
Computer-Based Modelling, Northwestern University.
Wilensky, U.(1998c). Netlogo Rumour Mill Model. Center for Connected Learning
and Computer-Based Modelling, Northwestern University.
Wilensky, U.(1998d). Netlogo Fireflies Model. Center for Connected Learning and
Computer-Based Modelling, Northwestern University.
Wilensky, U.(1998e). Netlogo Ant Trail Model. Center for Connected Learning and
Computer-Based Modelling, Northwestern University.
Wilensky, U.(1998f). Netlogo Termites Model. Center for Connected Learning and
Computer-Based Modelling, Northwestern University.
Wilson, E.O. (1984). The relation between caste ratios and division of labour in the
ant genus Pheidole (Hymenoptera: Formicidae). Behav. Ecol. Sociobiol. 16: 89 – 98.
Wilson, E.O. (1971). The Insect Societies. Belknap Press of Harvard University
Press, Cambridge, Massachusetts London, England.
Page 251
249
Yongming, Y., Xihui, C., Qingjun, L., Yantao, T. (2010). Swarm robots task
allocation based on local communication. International Conference on Computer,
Mechatronics, Control and Electronic Engineering, 415 – 418.
Yongming, Y., Zhou, C., Yantao, T. (2009). Swarm robots task allocation based on
response threshold model. Proceedings of the 4th
International Conference on
Autonomous Robots and Agents, 171 – 176.
Zecca, G., Couderc, P., Banâtre, M., Beraldi, R. (2009). Swarm robot
synchronization using RFID tags. IEEE International Conference on Pervasive
Computing and Communications, 1 – 4.
Zhang, D., Xie, G., Yu, J., Wang, L. (2007). Adaptive task assignment for multiple
mobile robots via swarm intelligence approach. Robotics and Autonomous Systems,
55: 572 – 588.
Zhuang, X., Yin, B. (2008). A model of self-adaptive task allocation for multi-agents
inspired by social insects. IEEE First International Conference on Intelligent
Networks and Intelligent Systems, 77 – 80.


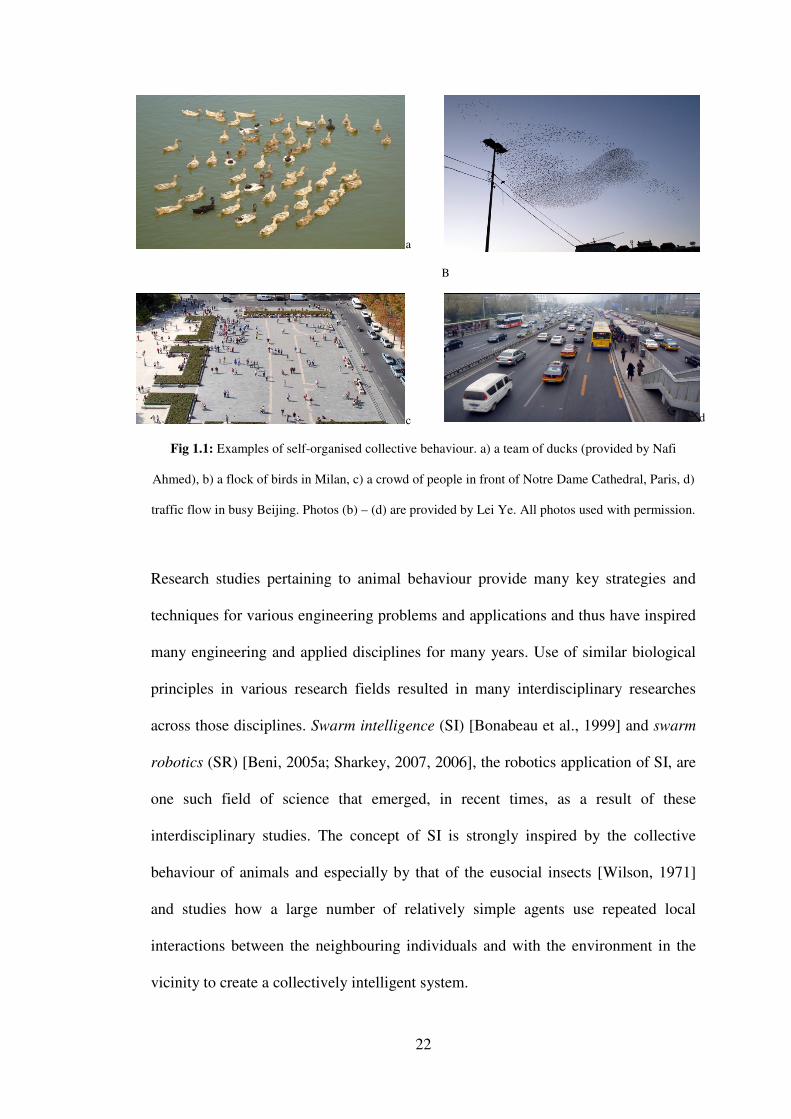


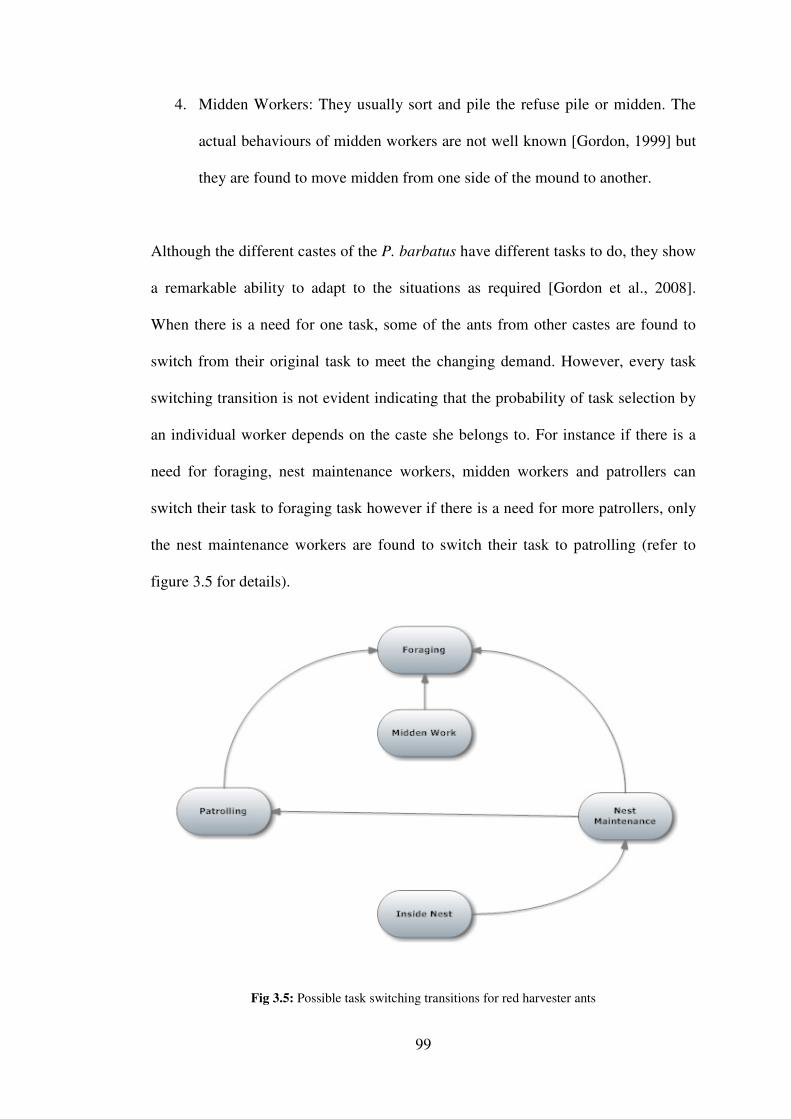


![Daniel Defoe 1719 [Robinson Crusoe]](https://static.documents.pub/doc/80x56/577d2baa1a28ab4e1eab0991/daniel-defoe-1719-robinson-crusoe.jpg)


