Portland State University Portland State University PDXScholar PDXScholar Urban Studies and Planning Faculty Publications and Presentations Nohad A. Toulan School of Urban Studies and Planning 4-2019 Access to Opportunity Project: Final Report Access to Opportunity Project: Final Report Shawn Flanigan San Diego State University Emily Lieb Seattle University Lisa K. Bates Portland State University, [email protected]Raphael Bostic University of Southern California Sheryl V. Whitney Whitney Jennings LLC Follow this and additional works at: https://pdxscholar.library.pdx.edu/usp_fac Part of the Public Policy Commons, Urban Studies Commons, and the Urban Studies and Planning Commons Let us know how access to this document benefits you. Citation Details Citation Details Flanigan, Shawn; Lieb, Emily; Bates, Lisa; Bostic, Raheal; and Whitney, Sheryl V. (2019) Access to Opportunity Project: Final Report. The Judith and John Bedrosian Center on Governance and the Public Enterprise, Sol Price School of Public Policy University of Southern California. This Report is brought to you for free and open access. It has been accepted for inclusion in Urban Studies and Planning Faculty Publications and Presentations by an authorized administrator of PDXScholar. Please contact us if we can make this document more accessible: [email protected].
Transcript
Portland State University Portland State University
PDXScholar PDXScholar
Urban Studies and Planning Faculty Publications and Presentations
Nohad A. Toulan School of Urban Studies and Planning
4-2019
Access to Opportunity Project: Final Report Access to Opportunity Project: Final Report
Follow this and additional works at: https://pdxscholar.library.pdx.edu/usp_fac
Part of the Public Policy Commons, Urban Studies Commons, and the Urban Studies and Planning
Commons
Let us know how access to this document benefits you.
Citation Details Citation Details Flanigan, Shawn; Lieb, Emily; Bates, Lisa; Bostic, Raheal; and Whitney, Sheryl V. (2019) Access to Opportunity Project: Final Report. The Judith and John Bedrosian Center on Governance and the Public Enterprise, Sol Price School of Public Policy University of Southern California.
This Report is brought to you for free and open access. It has been accepted for inclusion in Urban Studies and Planning Faculty Publications and Presentations by an authorized administrator of PDXScholar. Please contact us if we can make this document more accessible: [email protected].
Acknowledgments We wish to thank the many people who have encouraged and informed our work as we moved through this research. First, to our Obama Administration colleagues at the Department of Hous-ing and Urban Development whose work in Fair Housing provided the impetus for the study, your tireless efforts to eradicate discrimination and poverty were an inspiration. To our col-leagues old and new in Seattle/King County, Portland/Multnomah County, San Diego/San Diego County, there are not enough words to thank you for the many hours spent in consultation, edu-cation, and spirited debate. Without your voices, we could not have gotten off first base. Your deep and personal work on behalf of poor families was not only encouraging but also let us know we were asking the right questions. To our research partners—particularly Dr. Lisa Bates of Portland State University, Dr. Shawn Flanigan of San Diego State University, and Dr. Emily Lieb of Seattle University—your inspired work on a complex set of studies is appreciated be-yond measure. Finally, we want to express our appreciation to the JP Morgan Chase and Open Society Founda-tions for taking a chance on a decidedly West Coast view of anti-poverty work in the United States. Your resources permitted the exploration of promising practices that we believe can aid and inform many other parts of the country. Dr. Raphael Bostic University of Southern California/The Federal Reserve Bank of Atlanta Sheryl V. Whitney Whitney Jennings LLC
2
Access to Opportunity Project This project’s goal is to lift up promising approaches, suggest new strategies and encourage hon-est conversations that result in public policy solutions to income and racial segregation and pov-erty. The overarching question that motivates this work is:
• What are effective policies and strategies that promote access to high-opportunity ameni-ties for low-income families?
BACKGROUND
As a first step, the researchers surveyed efforts on the ground in the metropolitan areas encom-passing Seattle, Washington; Portland, Oregon; and San Diego, California, to determine whether there were any candidates for deeper study. We selected these three metropolitan areas for sev-eral reasons. First, prior interaction revealed that attention had been given to this question and that parties in each had embarked on purposeful efforts to make progress. Second, they represent a diverse array of communities that vary in significant ways, including along key economic, de-mographic, and social dimensions, and in some regards are bellwethers for changes beginning to take place in many parts of the country. As a consequence, experiences and successes in these places could potentially be applied to a diverse set of other urban areas across the United States. Diversity of the Selected Metro Areas Demographic Diversity The three regions are among the largest in the United States, with Seattle and Portland being the largest in their respective states and San Diego third in California (behind Los Angeles and the Bay Area). Despite their size, they differ in important ways that result in different social and po-litical dynamics prevailing in each location. First, their circumstance within their metropolitan areas varies significantly, with Portland repre-senting nearly 80 percent of the county population as compared with Seattle and San Diego, both of which represent less than half of their county populations. This city/suburb contrast can intro-duce political dynamics that can either facilitate or inhibit meaningful regional policy engage-ment, and potentially more so where race and equity are concerned. The city of Seattle is far more densely populated than any of the other geographies that we studied. Demographically, the three regions are quite different. Both Portland and Seattle have majority white populations. In Seattle, Asians represent the largest minority group, followed by Latinos and African Americans. In Portland, Latinos are the biggest minority group, with Asians and Af-rican Americans being second and third largest. The Asian presence in both of these cities is greater than the national average. San Diego is far more ethnically diverse and immigrant-ori-ented, perhaps not surprising given its geographic location on the U.S. border with Mexico. The city is majority minority, with Latinos comprising nearly one-third of the county’s population
3
and immigrants representing about one-quarter of the city and county populations. Nearly 40 per-cent of San Diego residents speak a language other than English, which places the region among those with the highest percentages in this category. However, both Seattle and Portland have pro-portions of families speaking a non-English language that exceed national averages. San Diego households are on average nearly 25 percent larger than the households in Seattle or Portland. This in part reflects two facts. First, Latino families have tended to have more children than others. Second, there is a cultural norm among Latino families of living with extended fam-ily members (Chapa and De La Rosa 2004). That noted, we see only small differences in the age distribution across the three regions. Economic Diversity In considering access to opportunity, one must understand the opportunities that are available in order to tailor skill-building efforts and investments in “connective infrastructure,” such as mass transit and suburban affordable housing, so that they are maximally effective. From an economic perspective, the three regions are quite different, which means that the approaches observed across the regions will potentially vary in measurable ways. Metropolitan Seattle, home of Microsoft, Amazon, and Boeing, is one of the leading technology and innovation centers in the United States, which has resulted in an affluence that is reflected by the high median income for both the city and county. Seattle’s medians exceed the U.S. median income by nearly 20 percent. San Diego is also quite affluent, driven in part by the heavy mili-tary presence in the county and the healthy trade and commerce that occurs due to its proximity to the border. Portland is economically the weakest of the three regions. The median household income is slightly below the national median, which places it about 20 percent lower than the San Diego and Seattle city median incomes. The King County median is fully 30 percent higher. This relationship is mirrored when we look at the poverty rates in the three regions. At 11.9 and 12.5 percent, respectively, San Diego and Seattle have poverty rates close to the national rate of 12.3 percent.1 By contrast, Portland’s poverty rate, at 16.2 percent, is almost 4 percentage points higher than the national average. Thus, despite its image as a relatively affluent area, the Portland area includes significant levels of distress and need. Project Selection In each metropolitan area, we sought the counsel of key governmental, practitioner, academic, and philanthropic players. During the course of our initial visits to each region, we met with and interviewed almost 80 people—28 in Seattle, 26 in Portland, and 24 in San Diego. Through these conversations, we identified 27 projects—nine in each metropolitan area—as being promising examples of cases where lower-income families may have achieved increased access to high-op-portunity amenities.
1 San Diego poverty rate: https://www.census.gov/quickfacts/sandiegocountycalifornia; Seattle poverty rate: https://www.census.gov/quickfacts/fact/table/seattlecitywashington/PST045217. National poverty rate: https://www.census.gov/library/publications/2018/demo/p60-263.html
4
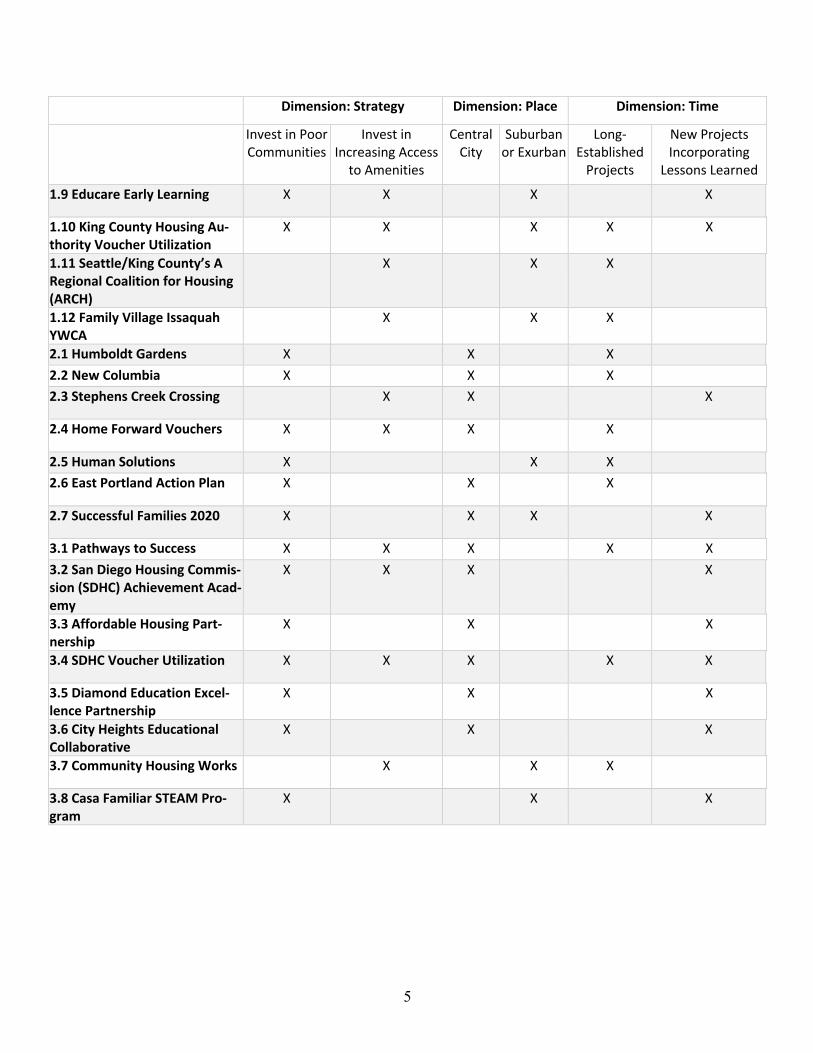
To decide which of these 27 projects to select for a first round of deeper examinations, we relied on an opportunity-creation framework that emerged from our conversations. As Table 1 shows, the framework features three dimensions and incorporates strategy, place, and time.
Table 1. Framework for categorizing efforts to increase access to opportunity
Dimension 1: Strategy Dimension 2: Place Dimension 3: Time Investment in poor com-munities
Projects in the central city Long-established projects
Investment in increasing access to amenities
Projects in suburban or exur-ban communities
New projects that incorporate lessons learned
Regarding strategy, the two alternatives are direct links to approaches promoted by community development professionals, who often advocate for investing in and transforming poor communi-ties, and fair housing practitioners, who often advocate for giving poor people better access to communities that are amenity-rich.2 In terms of place, given the broad literature detailing the dis-tinct challenges of pursuing projects in the central city as opposed to in suburban or exurban communities (see, for example, Goetz 2000), we took on the degree of “urbanness” as an im-portant factor to consider. Finally, projects could either represent long-standing efforts to effect change or new innovative approaches incorporating lessons revealed by prior efforts to increase access to opportunity. Table 2 arrays the initial 27 projects along these three dimensions.
Table 2. Candidate projects mapped along the three framework dimensions
Dimension: Strategy Dimension: Place Dimension: Time
Invest in Poor Communities
Invest in Increasing Access
to Amenities
Central City
Suburban or Exurban
Long-Established
Projects
New Projects Incorporating
Lessons Learned
1.1 NewHolly X X X 1.2 Rainier Vista X X X 1.3 Yesler Terrace X X X 1.4 Seattle Housing Authority (SHA) Stepping Forward
X X X X
1.5 SHA Voucher Utilization X X X X X
1.6 Emerald City Commons X X X
1.7 Greenbridge and Seola Gar-dens
X X X
1.8 Rapid Rehousing X X X
2 Fair housing practitioners often describe their strategy as a “mobility” strategy.
5
Dimension: Strategy Dimension: Place Dimension: Time
Invest in Poor Communities
Invest in Increasing Access
to Amenities
Central City
Suburban or Exurban
Long-Established
Projects
New Projects Incorporating
Lessons Learned
1.9 Educare Early Learning X X X X
1.10 King County Housing Au-thority Voucher Utilization
X X X X X
1.11 Seattle/King County’s A Regional Coalition for Housing (ARCH)
X X X
1.12 Family Village Issaquah YWCA
X X X
2.1 Humboldt Gardens X X X 2.2 New Columbia X X X 2.3 Stephens Creek Crossing X X X
2.4 Home Forward Vouchers X X X X
2.5 Human Solutions X X X 2.6 East Portland Action Plan X X X
2.7 Successful Families 2020 X X X X
3.1 Pathways to Success X X X X X 3.2 San Diego Housing Commis-sion (SDHC) Achievement Acad-emy
X X X X
3.3 Affordable Housing Part-nership
X X X
3.4 SDHC Voucher Utilization X X X X X
3.5 Diamond Education Excel-lence Partnership
X X X
3.6 City Heights Educational Collaborative
X X X
3.7 Community Housing Works X X X
3.8 Casa Familiar STEAM Pro-gram
X X X
6
THE PROJECTS
Given time, available funding, and the presence of partners willing to support our research effort by providing access to program data and program participants, we chose three projects for examination:
• The San Diego Housing Commission’s Achievement Academy
• Seattle/King County’s A Regional Coalition for Housing (ARCH)
• Humboldt Gardens in Northeast Portland
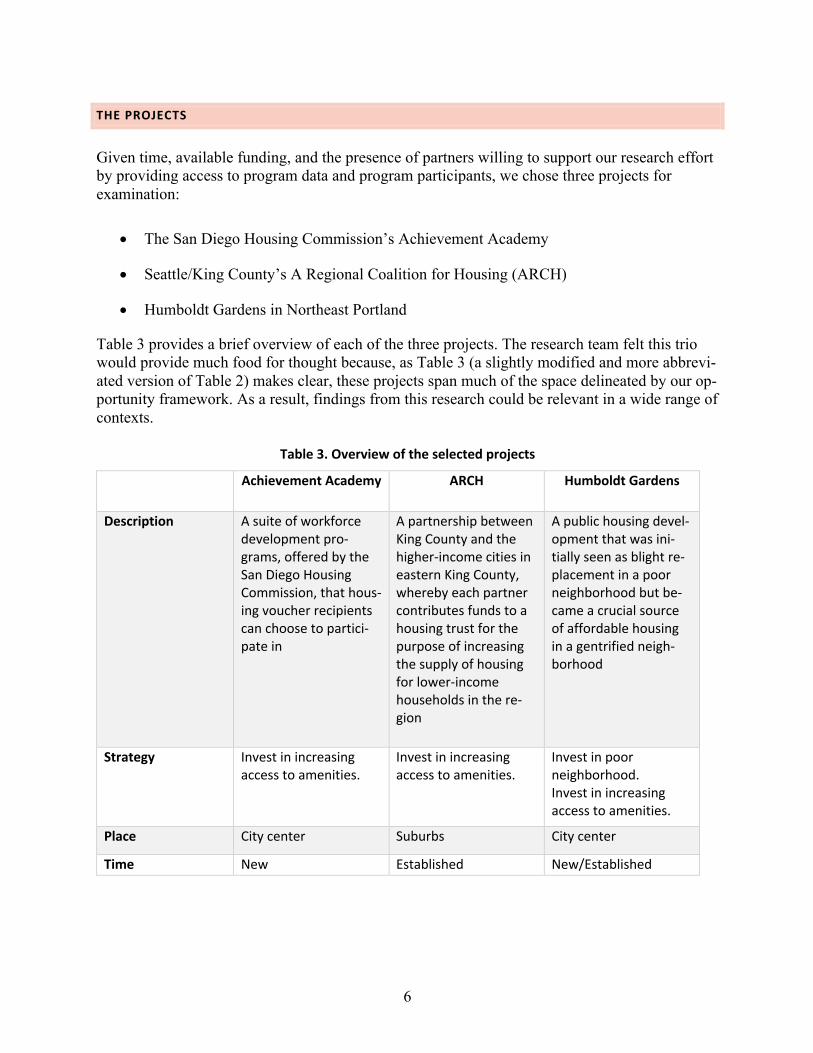
Table 3 provides a brief overview of each of the three projects. The research team felt this trio would provide much food for thought because, as Table 3 (a slightly modified and more abbrevi-ated version of Table 2) makes clear, these projects span much of the space delineated by our op-portunity framework. As a result, findings from this research could be relevant in a wide range of contexts.
Table 3. Overview of the selected projects
Achievement Academy ARCH Humboldt Gardens
Description A suite of workforce development pro-grams, offered by the San Diego Housing Commission, that hous-ing voucher recipients can choose to partici-pate in
A partnership between King County and the higher-income cities in eastern King County, whereby each partner contributes funds to a housing trust for the purpose of increasing the supply of housing for lower-income households in the re-gion
A public housing devel-opment that was ini-tially seen as blight re-placement in a poor neighborhood but be-came a crucial source of affordable housing in a gentrified neigh-borhood
Strategy Invest in increasing access to amenities.
Invest in increasing access to amenities.
Invest in poor neighborhood. Invest in increasing access to amenities.
Place City center Suburbs City center
Time New Established New/Established
7
Achievement Academy ARCH Humboldt Gardens
Key question How do participant circumstances shape experiences and success?
What causes suburban communities to continue to support the production and preservation of local affordable housing?
Do self-sufficiency pro-grams help low-income parents successfully ac-cess amenities in a gen-trifying community?
While the contexts for the Achievement Academy and ARCH are relatively straightforward, the context for the Humboldt Gardens effort evolved over time and thus warrants some discussion. Humboldt Gardens was developed to replace an older public housing project under the HOPE VI program. It was therefore initially intended to be an anchor for redevelopment as a replacement for a severely blighted property in a neighborhood lacking many high-opportunity amenities. However, during the 2000s, the neighborhood around the project rapidly changed and saw an in-flux of a large number of higher-income families.3 Rather than representing an investment in a poor community, Humboldt Gardens became a vehicle for preserving access to an amenity-rich neighborhood. We thus adapted our research focus to reflect this new reality.
MAJOR LESSONS: A QUICK LOOK
Lesson 1: Choice is a double-edged sword. A broad menu of self-sufficiency services helps lower-income families tailor their support to maximize positive impact, but there is a risk that the many choices can overwhelm them and cause them to not fully take advantage of some offerings. Lesson 2: Positive caseworker interactions and culture are vital. There are specific things program administrators can do to shape caseworker interactions and culture, such as separating the compliance and self-sufficiency service advisor roles, which can improve participants’ experiences and thus improve overall engagement. Lesson 3: Affordable housing is about respect for existing residents. Emphasizing the value of affordable housing for local residents can help prevent discussions from devolving into an “us-versus-them” narrative, and can help convince jurisdictions of the value of affordable housing anew.
3 Conversations with local officials and residents strongly suggest that Humboldt Gardens did not trigger this subse-quent gentrification, though its presence may have helped accelerate it.
8
Lesson 4: Quality design and project management are essential. Developments that are well-designed and well-managed help dissipate community fears and be-come important examples when advocating for subsequent projects. Lesson 5: Patience and pacing pay off. Even though need may be acute, starting small and showing success can be a good strategy, as the successes can make it easier for the efforts to be scaled and have larger impact. Lesson 6: The dual funding model increases local comfort with participation. Creating a structure where funding to support staff support is separated from funding to provide capital for projects can enhance local jurisdictional support, as jurisdictions are not asked to take a “leap of faith” and provide funds before they know what projects will be developed. Lesson 7: Market forces and a history of housing insecurity represent major challenges. Broader economic trends and housing market conditions often represent significant headwinds that make it much more difficult for lower-income families to consistently access opportunity and make progress toward self-sufficiency.
THE PROJECT TEAM
An additional goal for the project was to strengthen the network of academics in each metropoli-tan area well-versed in the issues of opportunity and positioned to offer technical, evaluative, and intellectual support for efforts to increase access to opportunity for lower-income families. To this end, during our initial outreach in each region, we asked contacts for their recommendations regarding leading local researchers studying these issues as well as institutions who would likely be interested in building such capacity. From the recommendations, we engaged with scholars and institutions and ultimately established academic partnerships with teams led by Professor Shawn Flanigan at San Diego State University, Professor Emily Lieb at Seattle University, and Professor Lisa Bates at Portland State University. These three scholars became the project leads for the research conducted in their metropolitan areas.
THE RESEARCH
Achievement Academy—San Diego Housing Commission4 The Achievement Academy is a suite of programs run by the San Diego Housing Commission designed to help holders of housing choice vouchers transition from dependence to self-suffi-ciency. The voluntary program is designed to assist a diverse collection of voucher holders. The commission has developed special supplemental programs targeted at specific lower-income groups. The Power of One program is a relatively new program designed for single parents or single heads of household. It offers group support in addition to the standard set of Achievement 4 This project was led by Shawn Flanigan, PhD, of the School of Public Affairs at San Diego State University. She was assisted by Britney Budiman, Marlyn Carrillo (MPA), Alexandra Metz (MPA), Nancy Nguyen, Ashley Orozco, Geoffrey Teal, and Stefanie Trompeter-Rolon.
9
Academy offerings. Participants meet regularly with their workforce development specialist and participate in workshops with a cohort of single parents/heads of households. The Monarch pro-gram targets recently homeless parents who have children in the Monarch School, a K-12 school for homeless youth. Through this collaboration, the San Diego Housing Commission selected 25 families with children at the Monarch School to bypass the Section 8 waitlist and receive hous-ing vouchers. The heads of these households participate in Achievement Academy programs. These families will continue to receive vouchers they can use for the duration of the time that their children attend the Monarch School. To obtain a sense of the program’s scope and participant engagement, the research team re-viewed program data the commission made available for 175 randomly selected participants. These data comprised 6,916 distinct instances when program participants received an Achieve-ment Academy service. While the agency data did not include information that could be used as clear indicators of success (examples would be data on income or hourly wages, employment in-formation, information on housing stability, or other indicators of well-being), the data provide a useful picture of the broad spectrum of services sought by participants and the frequency of agency-client interaction. The data show that the Achievement Academy provides assistance for a broad spectrum of needs (see Table 4). Participants most often sought assistance with job searches—37 percent of all pro-gram engagements were for this. Help finding workshops and education and training were the next most used services. Job search assistance is similarly in high demand by participants of spe-cialty programs, but evidence suggests that participants in the Power of One and Monarch pro-grams use services in significantly different combinations than those broadly involved in the Achievement Academy.
Table 4. Types of assistance offered by the Achievement Academy
Auto title loan Book scholarship Bus pass Car purchase loan Checking account Childcare referrals Childcare subsidies Credit cards Credit report error Delinquent bill Education, training search Food stamps and
comparable GED exam General benefits screening Head Start (incl. early)
Health and wellness referral Home loan Homeownership training Identity theft Individual development
account Informal loan Job search Medical benefits Orientation Other formal loan Outreach Payday loan Savings account Sherwin Williams
prerequisites
Small business training Subsidized housing SSI/Disability Supportive services and work
support Tax preparation services Temporary Assistance for
compensation Utility assistance WIC nutrition benefits Work readiness Work supports Workshop attendance
10
There are statistically significant differences in the rates at which the three sub-populations of the study used services (see Table 5). Monarch participants received services for credit report errors, education and training searches, general benefits screening, and transaction disputes at a signifi-cantly higher rate than general Achievement Academy participants, proportional to the service interactions contained in the data set. Power of One participants received services for credit re-port errors, general benefits screening, health and wellness referrals, and workshops at a signifi-cantly higher rate than general Achievement Academy participants, proportional to the service interactions contained in the data set.
Table 5. Differences in service participation among Achievement Academy (AA) populations
Difference between Monarch and gen-eral AA
Difference between Power of One and general AA
Participation rates
Z-score significance Participation rates
Z-score significance
Childcare re-ferrals
No significant difference
Power of One higher
-3.8662 p <0.01
Credit card-related
AA higher 2.9593 p <0.01 AA higher 3.1031 p <0.01
Credit report error
Monarch higher
-5.6955 p <0.01 Power of One higher
-3.8349 p <0.01
Education/ Training search
Monarch higher
-10.0322 p <0.01 No significant difference
General ben-efits screen-
ing
Monarch higher
-1.9907 p <0.05 Power of One higher
-3.9955 p <0.01
Health and wellness re-
ferral
No significant difference
Power of One higher
-4.0677 p <0.01
Home loan AA higher 5.5063 p <0.01 AA higher 10.7347 p <0.01
Job search No significant difference
AA higher 3.3457 p <0.01
Savings ac-count
AA higher 3.3617 p <0.01 AA higher 7.4412 p <0.01
Transaction dispute
Monarch higher
-5.8616 p <0.05 No significant difference
11
Difference between Monarch and gen-eral AA
Difference between Power of One and general AA
Participation rates
Z-score significance Participation rates
Z-score significance
Utility assis-tance
AA higher 3.8681 p <0.01 No significant difference
Work sup-port
AA higher 16.7869 p <0.01 AA higher 42.547 p <0.01
Workshop attendance
AA higher 2.862 p <0.01 Power of One higher
-4.6814 p <0.01
These differences likely reflect at least two things: a difference in the needs of these groups of participants and a difference in the exposure to services the two groups experienced in their spe-cialized programs. Our qualitative data, discussed later in the report, suggest that both differ-ences in needs and differences in exposure are likely present. It may be appropriate to have greater investment in programs that particular populations use more heavily, decrease exposure to programs that those populations use less frequently, or apply a targeted strategy that tracks use of individual services within certain populations and increases or decreases investment and expo-sure based on experience. But, on balance, it appears that diverse target populations recognize the value of a diverse set of program offerings. These quantitative data were supplemented with a qualitative longitudinal study of a number of Achievement Academy families. Thirty-one individuals (81.5 percent of information-session at-tendees) participated in time one interviews in January 2017, 80.6 percent of those (25 individu-als) participated in time two interviews in August-September 2017, and 88 percent of those (22 individuals) participated in time three interviews in April 2018.5 Table 6 details the de-mographics of the interviewees. Over this 16-month period, we were able to better understand individuals’ experiences of Achievement Academy programs and how their experience of and participation in the program were impacted by other aspects of their lives.
5 None of the individuals who refrained from participating in time two and time three interviews indicated a lack of interest in the research project, but rather were unreachable due to changes in contact information.
12
Table 6. Participant demographic information
Number of participants Race/Ethnicity African American 15
Asian/ Pacific Islander 2
Hispanic 11 White 3 Gender Female 22 Male 9 Age range 20–29 3 30–39 13 40–49 6 50–59 9 Language spo-ken at home
English 17 Spanish 8 Other 6
Interview participants were not a passive group. About three-quarters had working experience in the formal economy, and many reported being employed or engaged in education and training at the time of study. Importantly, the overwhelming majority of interviewees were actively engaged in activities they believed would move them closer to their goals and aspirations, and they saw the Achievement Academy as helping them do this. In terms of experiences, the record was largely positive. A little over one-third (12) entered a new job or experienced better working conditions such as a pay raise, more hours, or new bene-fits such as sick leave and vacation leave during the course of the study. More than one-third (12) participated in education or training programs outside the Achievement Academy over the course of the study, and four of these individuals completed an education or training program during the 16-month period of the study. Three individuals (just under 10 percent) experienced a job loss over the course of the study. We found that many of our interview participants were struggling with challenging life circum-stances that at times interfered with their ability to participate in Achievement Academy pro-grams, even when they saw these programs as potentially useful. Our qualitative data show that many of our participants lived in a context of recurrent, and, at times, acute economic and hous-ing insecurity. During the 16-month study, three individuals (10 percent) became homeless. Seven individuals either were evicted from their homes or experienced what we refer to as “in-formal” eviction, meaning they were forced from their home due to threat of eviction, upcoming
13
renovations to the property, or similar events that the owner initiated. More than a quarter of in-terviewees reported that they or a family member faced serious mental health issues that inter-fered with basic life functioning over the 16-month study period. More than a third of partici-pants reported a history of serious physical health issues that interfered with basic functioning, and more than a third reported that they or a family member had a history of involvement with the criminal justice system. Participants reported that Achievement Academy program participa-tion is one of the many aspects of life that fell lower on their priority list as they managed those crises. Key takeaways Our interview participants largely had a positive impression of Achievement Academy staff and services. The nature of the academy’s activities is an important factor. Academy staff are not in-volved in determining eligibility for Section 8 vouchers, but instead provide additional support-ive services and incentives. Because of the low potential for punitive action, interview partici-pants in our study felt comfortable developing a close relationship with staff members focused on overall economic stability rather than primarily on housing. This section elaborates on some key takeaways revealed in the study. Choice is a double-edged sword. Interview participants valued the wide array of services, assistance, and referrals the staff offer. As described earlier, the Achievement Academy provides assistance for a broad spectrum of needs (see Table 4). Participants most often came for assistance with job searches, and also used a wide array of other assistance. Our surveys show that most of the assistance that participants sought was for less common, unique needs, and the broad menu of available services positioned the Achievement Academy to be ready to assist many of them. Staff members also reported being flexible in terms of offering assistance at various locations and outside of typical office hours. Participants can receive services on a walk-in basis and are not required to have an appointment. Staff also do not insist on face-to-face meetings if they can provide assistance by email or phone. Participants reported that they found this flexibility in communication very valuable, since most used their vouchers to obtain housing on the private market all around San Diego. In a city that covers 372 square miles, using public transportation to get to the Achievement Academy is not always easy, which makes phone and email contact especially important. However, this flexibility does not come without cost. Only seven participants (less than 25 per-cent) reported participating in the Family Self-Sufficiency (FSS) program. Other participants seemed vaguely familiar with the program or reported not being aware of it at all. Our interview protocol asked questions specific to the FSS program, and when asked about the program, many interview participants showed interest. The Achievement Academy redesigned the FSS program to include additional incentives to achieve professional, educational, and financial goals and re-duced the timeline of the program from five to three years. During time 2 interviews, we gave interview participants a copy of the incentives and asked for their opinions on the incentives and reduced timeline. The majority of participants were very interested in the incentives and indi-cated they would reach out to their workforce development specialist about the FSS program. It
14
seemed they had only become aware of the program because of the interview. Many participants believed the incentives aligned well with goals they were already working to accomplish. The majority believed that the shorter timeline was preferable, even though it meant total earnings were capped at $10,000. This overwhelmingly positive response to information on the FSS pro-gram, combined with low levels of familiarity with the program, suggests that increased promo-tion of the program within the Achievement Academy would lead to higher participation. Positive caseworker interactions and culture are critical. The Achievement Academy’s staff members are expected to have very frequent interactions with participants, and participants are given customer satisfaction surveys to ensure that those interac-tions are predominantly positive. The Section 8 recipients in our study highly valued the inten-sive, personal, positive interactions they had with the staff. This positive impression is notewor-thy because public administration scholarship indicates it is common for low-income individuals to have a negative impression of public agencies and street-level employees. Instead, our inter-view participants expressed a very positive impression of Achievement Academy staff, and these positive relationships helped keep them engaged in programs. Achievement Academy staff interact with participants regularly, and in a variety of formats. Our quantitative data cover an average of 15 months of interactions for each of 175 participants. Dur-ing this time, staff interacted with each individual client an average of 40 times, for an average of nearly three service interactions per client per month. It should be noted that these are interac-tions during which participants received a concrete form of assistance. Check-in calls on partici-pants’ well-being or emails to inform participants of upcoming opportunities are not included in these figures. This volume of participant-staff member interaction is quite impressive. Overall, the participants we followed reported returning for services because of the warm atmos-phere, the open-door environment, and past successful experiences with staff. When staff suc-cessfully help participants navigate a life challenge, especially with positivity, participants are more likely to return for additional services. Interviews with staff members made it clear that the director of the Achievement Academy had instilled a clear culture of service in the organization and that the staff are involved in their work because they have a passion for service. Staff demonstrated an understanding of the leadership’s expectations as well as their own intrinsic motivation to serve. Staff members’ intrinsic reward for serving others plays an important role in the organization, as a positive work culture is rarely accomplished with a top-down approach. A culture of service and intrinsic staff motivation are crucial in an environment where program redesign seems to have increased drastically staff’s workload and frequency of client contact. While intrinsic motivation and a culture of service may not be enough to sustain morale among a staff that is chronically overworked, these attrib-utes can provide a buffer during a period of transition with a temporary peak in workload. Our interview participants’ experiences suggest that offering more online workshops and train-ings could be a successful strategy for overcoming some barriers to participation, including the childcare and transportation barriers mentioned earlier. Some participants said that because they work, they were unable to attend classes they thought would help them get a better job. Some
15
participants noted the appeal of being able to access training online when transportation is chal-lenging, or of being able to watch while multitasking (folding laundry, cooking, or riding the bus were given as examples). Participants indicated that while some trainings are available online, they would like to see the number and frequency of internet options expanded. Given the wide-spread availability and relative affordability of web-based seminar software, a growth in web-based offerings could offer improved impact for relatively little investment. Perhaps the Achievement Academy’s greatest asset is its highly committed employees, who have strong public service motivations. The individualized attention they offered, their frequent and recurrent interactions with clients, and their clear passion for their work were factors that Achievement Academy participants noted were important in their success and their continued participation in programming. The unit staff and leadership are to be commended for the pro-grams they have developed, and for their ability to maintain relatively high participation in vol-untary programs. While these strategies appear effective for attracting and retaining clientele, it is crucial to con-sider that frequent interaction and high workload can ultimately damage staff morale. The Achievement Academy, and any agency seeking to replicate its programs, should have sufficient staffing and appropriate intrinsic and extrinsic rewards in place to avoid staff burnout. Additionally, the Achievement Academy has successfully hired employees who are a strong cul-tural fit. Other agencies seeking to develop a similar culture would need to pay close attention to their hiring practices and have the freedom to hire on the basis of a strong fit with a public ser-vice culture. While also beneficial, location can be a challenge for scattered-site programs. The Achievement Academy seems to benefit from its catchy, memorable name and its physical separation from other units that are part of the housing authority. It is located on a different floor than the unit that processes Section 8 voucher applications. That unit is on the third floor and is the location with which clients are most familiar. Clients reach the academy through an entrance on a side of the building, away from the main entrance where clients enter for Section 8 eligibil-ity processing. Moreover, the Achievement Academy’s appearance is very different from that of the third floor. When clients enter, they are greeted at a large, open desk and asked to wait in a comfortable waiting area until they meet face-to-face with their workforce development special-ist. The specialists’ offices are glass-walled and filled with natural light and comfortable chairs. Many offices have toys and coloring supplies for children who accompany their parents to their appointments. Participants often remarked on the differences between the Achievement Acad-emy and the third floor and said the inviting environment is part of what draws them to the acad-emy. Our participants described some relatively common challenges to accessing supportive services, including transportation. While the Achievement Academy is conveniently located downtown on a central trolley line and near bus routes, participants said the distance to the academy as well as the high cost and lack of availability of parking are barriers.
16
Unlike other cities with public housing complexes that provide services on-site, the San Diego Housing Commission distributes a substantial number of Section 8 vouchers, which let low-in-come families seek rental units on the private market. While this program gives these families the chance to benefit from the amenities of higher-opportunity neighborhoods, it means that Achievement Academy families are scattered around the city. As San Diego’s urban core becomes more expensive and inaccessible even to upper-middle-class families, lower-income families are moving farther from the San Diego Housing Commission’s downtown location. The length of time it takes to reach the academy by public transportation ex-plains why many participants reported traveling there by car. While the Achievement Academy validates parking in their underground parking garage, participants reported that parking spots were limited and parking in the surrounding area was prohibitively expensive. Some participants reported arriving at the academy to participate in services only to leave due to a lack of parking. Participants also reported childcare as a barrier to participating in some services. Some noted that interesting programs were offered at times when they needed to pick up their children from school. Those with younger children seemed unaware they could bring their children with them to trainings and workshops, even though staff had indicated during interviews that children were welcome. Participants were aware they could bring their children to their one-on-one meetings in staff offices, but Achievement Academy staff may want to actively promote that children are welcome in workshops and trainings or provide limited childcare during these events. The broader economy remains a powerful counterweight. The overall economy of housing in the San Diego region presents a challenge to the Achieve-ment Academy and its participants. San Diego consistently is ranked among the least affordable housing markets in the United States. Fifty-seven percent of renters in the region are rent-bur-dened, meaning they spend at least 30 percent of their income on rent. That share is the 10th highest in the country. The San Diego Housing Commission estimates that since 2014, the region has produced only 4 percent of the number of moderate-income and 6 percent of the number of low-income housing units needed to meet demand, compared to 31 percent of the high-income units needed. In 2017, a renter needed to earn three times the minimum wage to pay the median rent price in San Diego, which meant many working-class families were paying up to 70 percent of their income on rent. Consequently, interview participants widely reported extreme difficulty in finding housing, even with their Section 8 vouchers in hand. They struggled to come up with the difference between the voucher amount and the higher cost of rent or to find housing they could afford before their voucher expired. They faced housing security challenges like becoming homeless, experiencing formal or informal eviction, experiencing rent increases, and losing their Section 8 voucher bene-fits over the course of the 16-month study. The struggle to pay for housing expenses meant par-ticipants often lived too far for easy access to Achievement Academy facilities, and were less able to participate in programming because the distance meant they would have to spend more time away from work or spend more on childcare and transportation. Even for those individuals who could participate, the Achievement Academy struggled because rising prices meant that the income target for realizing family stability and resilience was upwardly moving. While the acad-emy can provide substantial benefits at the margins, larger macroeconomic policy changes will
17
be needed to substantially influence the well-being of many housing-insecure San Diegans, a population that continues to grow. While programs like the Achievement Academy can improve participants’ lives, it is important that these programs be evaluated realistically in the context of the difficult economic environ-ments in which they operate. For the Achievement Academy, this is the extraordinarily challeng-ing housing market of southern California. San Diego Housing Commission leadership and other stakeholders need to evaluate the performance of the Achievement Academy using realistic met-rics that consider the population its programs are best suited to assist: relatively stable, work-ready, low-income adults whose housing stability has been secured through a Section 8 housing voucher. Even among this subset of program participants, we note substantial economic vulnera-bility. Many other, more vulnerable populations exist within the region. Improving the economic and housing security of an increasing number of housing-insecure San Diegans will require larger, macro-level policy changes that are beyond the purview of the Achievement Academy, and per-haps even beyond the purview of the San Diego Housing Commission. Some policy initiatives that could possibly affect the housing economy are politically controversial and would need to be implemented at a regional or statewide level. Examples might include:
• Requiring all landlords to accept Section 8 vouchers; • Regulating vacation rentals such that more residents have access to existing dwellings; • Modifying the permitting processes to allow more multifamily dwellings and more acces-
sory dwelling units (granny flats and tiny homes), and to allow builders to forgo current parking requirements; and
• Implementing “anti-flipping” policies that would require buyers to own a home or com-plex for a specified period before selling, thereby slowing the rent increases that often follow these “flips.”
Despite San Diego’s challenging housing environment and the policy work yet to be done, the Achievement Academy’s successes should be celebrated. ARCH and Establishing Access to Opportunity in Metropolitan Seattle Background and context A Regional Coalition for Housing, or ARCH, is a coalition of King County, Washington, and 15 suburban cities in the eastern portion of the county. The organization’s mission is to increase the supply of affordable housing within the boundaries of the member cities. It seeks to influence the supply of housing, change policies and practices that inhibit the production and preservation of affordable housing, facilitate the introduction of policies and practices that make it easier to pro-duce and preserve affordable housing, and help shape public opinion to be more favorable to-ward affordable housing. Importantly and interestingly, ARCH is a voluntary interlocal agency. ARCH grew out of Washington State’s Growth Management Act of 1990 (GMA), which, to pro-tect sensitive areas, established limits on where development could occur. The goal of the act was to preserve open space and protect natural resources by concentrating urban growth. It was
18
recognized, however, that concentrating growth could exacerbate burgeoning housing affordabil-ity challenges. Consequently, the GMA mandated that counties follow countywide planning practices to develop strategies for preventing or limiting adverse impacts on affordability, among other things. These affordable-housing and countywide-planning mandates catalyzed the formation of ARCH in 1992. The organization started comparatively small, as a partnership between the City of Bellevue and King County. By 1994, Kirkland and Redmond had also joined (Affordable Hous-ing Task Force 1994, 81). That year, according to ARCH’s Executive Director, Arthur Sullivan:
ARCH administer[ed] $600,000 to $1 million in pooled housing funds contributed annu-ally by the three cities. ARCH staff also provide[d] technical assistance to its local gov-ernments in housing policies, programs, and implementation of housing projects, and or-ganize[d] workshops on housing strategies. (Affordable Housing Task Force of the King County Growth Management Planning Council 1994, 81).
ARCH was not the county’s only response to the GMA’s affordable-housing requirements. King County also established a Growth Management Planning Council, which in turn convened an Af-fordable Housing Task Force. The task force issued a guidebook in 1994 that outlined a three-part “Action Plan for Affordable Housing”:
• Creating and preserving low-cost housing via accessory dwelling units, impact fee re-ductions and exemptions, inclusionary zoning, lease-purchase ownership programs, preservation of mobile home parks, special needs housing, and tax increment financing;
• Reducing development costs via adequate land supply, flexible subdivision standards, permit processing improvements, and small lot and townhouse development; and
• Education and coordination via local housing task forces and the coordination of local funding and technical assistance (Affordable Housing Task Force of the King County Growth Management Planning Council 1994).
At the time, ARCH’s main focus was on that last item on the list. The utility of this work was simple and clear: since housing and job markets are regional, not local, any real solution to the affordable-housing dilemma in King County—with or without the GMA—was going to have to be regional, too. It was going to require municipalities to work together efficiently and thought-fully, to pool their resources and share their burdens. Sullivan explained:
Increased local involvement can add increased complexity. It is common for housing pro-jects to use multiple funding sources. Each brings its own requirements, some of which may conflict. Funding sources often have different priorities for funding and different schedules for funding awards. This complexity can add cost to a project without adding values (Sullivan 2017).
He continued:
19
Local governments in King County are increasing their efforts to coordinate housing pro-grams in order to maximize cost-effectiveness and reduce complexity. Funding programs, for example, can be coordinated by establishing common priorities for projects to be funded, making eligibility and contracting procedures consistent where feasible, coordi-nating timing of funding applications and awards, and combining monitoring procedures. In addition to funding, local governments have adopted a variety of ordinances designed to accommodate affordable housing types and provide incentives for affordable housing. Zoning code definitions for special needs housing, development regulations for mobile home parks, guidelines for accessory housing, and density bonuses for affordable housing are being implemented by jurisdictions of all sizes. There is a growing demand from cities for technical assistance, and from developers for consistent, coordinated procedures. The refined countywide affordable housing policies developed by the Affordable Housing Task Force call for expanded technical assistance to cities to help address housing concerns (Sullivan 2017).
In this way, ARCH officials reasoned, every city in the region could benefit from every other city’s work. If Kirkland’s low-income housing capacity increased, for instance, Bellevue’s ser-vice employees might be able to live nearby, which meant less traffic on the roads for everybody. If a Redmond developer managed to navigate the thicket of tax credits and zoning exemptions to build an attractive, affordable multifamily project, then other jurisdictions could learn from that experience. Fundamentally, ARCH believed its job was to augment the work of local govern-ments and make sure no Eastside municipality would never have to start from square one again (Sullivan 2017). Of course, these things are just policies, not laws. As many critics have noted, the GMA does not say where affordable housing should go or who will build it (Quinn 2017). But the law, and the countywide planning practices it mandates, has given planners, policymakers, and citizens in King County more than 20 years of experience thinking regionally about what might seem, in other places, to be local problems.6 Where ARCH has been successful, this experience is a big part of the reason why. The ARCH approach and experience ARCH points to five strategies for achieving its goal of preserving and producing new affordable housing. Each of these strategies is implemented via a specific programmatic focus (see Table 7). In this section, we discuss each of these foci and, to the extent possible, how ARCH has per-formed in each. Note that this is not intended to be an evaluation of ARCH, in the traditional
6 King County’s Countywide Planning Policies ask all jurisdictions within the county to share the burdens, and ben-efits, of population and job growth, and to engage in thoughtful planning—together—about what that sharing will look like. They include goals for housing production generally, as well as for affordable housing in particular. Ac-cording to ARCH, by 2031, “each Eastside city’s goal is to create housing equal to 24 percent of local growth that is affordable to low-income households and 17 percent of local growth affordable to moderate-income households” (ARCH 2011, 18).
20
sense. Rather, our goal is to highlight aspects of the ARCH program that are distinctive and bet-ter understand how these features were able to be created and persist here when they have failed to do so in other contexts. It is this aspect of the ARCH experience that can be constructive for others seeking to make progress in preserving and producing affordable housing in more affluent suburban communities.
Table 7. ARCH’s strategies and programmatic efforts
Strategic area Programmatic focus
Coordinating public resources in a way that will attract greater private and not-for-profit invest-ment in affordable housing
Pooling technical resources between jurisdic-tions to assist in the development and imple-mentation of housing policies and programs
Housing trust fund
Shared resources
Providing expert assistance to local organiza-tions interested in becoming active in affordable housing provision
Zoning and land use
Providing ongoing community involvement, in-formation, and leadership directed towards housing needs
Providing information to the community on lo-cal housing issues
Community engagement
Housing trust fund and Shared resources Perhaps the most visible and tangible component of ARCH’s toolkit is its housing trust fund. By ARCH accounting, through 2016, member cities had given, loaned, or donated in-kind more than $47 million to the trust fund (ARCH 2016). These funds have been deployed to build or preserve affordable housing units in Eastside communities.7 Importantly, the trust fund has been an impe-tus for leverage. According to the King County Housing Development Consortium, every $1,000 of funding garners $9,000 more from external public and private resources (Housing Develop-ment Consortium n.d.). Housing trust fund monies have been associated with the creation of nearly 3,500 housing units affordable for low- and moderate-income families (table 8). Around 2,000 of these units target low-income people (earning up to 50 percent of the area median income) and more than 1,000 units target moderate-income people (50–80 percent of median). Though annual allocations across housing types and needs are not preordained year to year, ARCH and its member cities have established target distributions. The goal is to, over the long run, spend 56 percent of its
7 The work of ARCH’s Housing Trust Fund has been highlighted in a number of reports by the U.S. Department of Housing and Urban Development, the Urban Institute, the American Planning Association, and the University of Washington, among others.
21
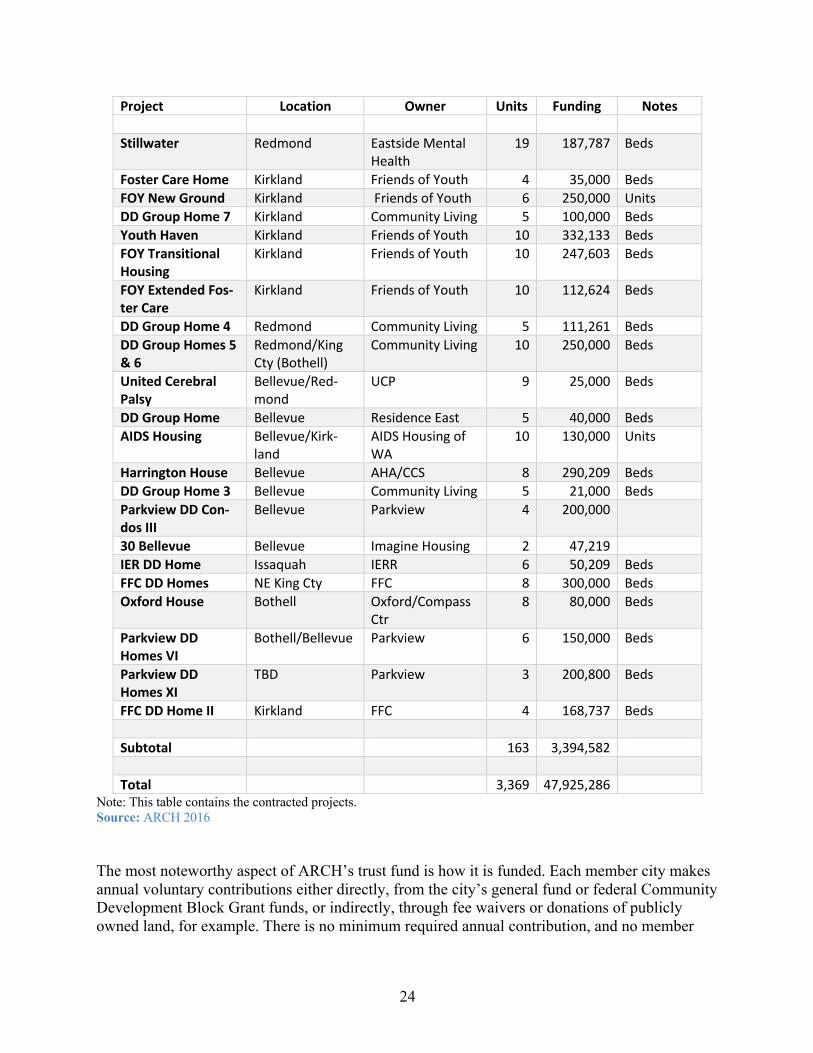
funding on housing for families, 13 percent on homeless and transitional housing, 19 percent on housing for elderly people, and 12 percent on supportive housing for special-needs populations (Mack, Retzlaff, and Schwab 2003, 115). Actual allocations have come close to these targets, though slightly more money has gone towards projects serving the homeless (see Table 8).
Table 8. Projects funded by ARCH, 1993–2016
Project Location Owner Units Funding Notes
1. Family Housing (54% of allocation, 56% target) Andrews Heights Apts
Bellevue Imagine Housing 24 400,000
Garden Grove Apts Bellevue DASH 18 180,000 Overlake Town-homes
4. Special Needs Housing (7.1% of allocation, 12.0% target) My Friends Place King Cty EDVP 6 65,000 Beds
24
Project Location Owner Units Funding Notes Stillwater Redmond Eastside Mental
Health 19 187,787 Beds
Foster Care Home Kirkland Friends of Youth 4 35,000 Beds FOY New Ground Kirkland Friends of Youth 6 250,000 Units DD Group Home 7 Kirkland Community Living 5 100,000 Beds Youth Haven Kirkland Friends of Youth 10 332,133 Beds FOY Transitional Housing
Kirkland Friends of Youth 10 247,603 Beds
FOY Extended Fos-ter Care
Kirkland Friends of Youth 10 112,624 Beds
DD Group Home 4 Redmond Community Living 5 111,261 Beds DD Group Homes 5 & 6
Redmond/King Cty (Bothell)
Community Living 10 250,000 Beds
United Cerebral Palsy
Bellevue/Red-mond
UCP 9 25,000 Beds
DD Group Home Bellevue Residence East 5 40,000 Beds AIDS Housing Bellevue/Kirk-
land AIDS Housing of WA
10 130,000 Units
Harrington House Bellevue AHA/CCS 8 290,209 Beds DD Group Home 3 Bellevue Community Living 5 21,000 Beds Parkview DD Con-dos III
Bellevue Parkview 4 200,000
30 Bellevue Bellevue Imagine Housing 2 47,219 IER DD Home Issaquah IERR 6 50,209 Beds FFC DD Homes NE King Cty FFC 8 300,000 Beds Oxford House Bothell Oxford/Compass
Ctr 8 80,000 Beds
Parkview DD Homes VI
Bothell/Bellevue Parkview 6 150,000 Beds
Parkview DD Homes XI
TBD Parkview 3 200,800 Beds
FFC DD Home II Kirkland FFC 4 168,737 Beds Subtotal 163 3,394,582 Total 3,369 47,925,286
Note: This table contains the contracted projects. Source: ARCH 2016 The most noteworthy aspect of ARCH’s trust fund is how it is funded. Each member city makes annual voluntary contributions either directly, from the city’s general fund or federal Community Development Block Grant funds, or indirectly, through fee waivers or donations of publicly owned land, for example. There is no minimum required annual contribution, and no member
25
city has to contribute to the general fund at all. That noted, ARCH and its members have devel-oped three “parity” formulas (based on current population, projected housing growth, and pro-jected job growth) that cities can use, as one official put it, to “establish a means for members to attain an equitable distribution of resources being contributed to affordable housing” (Mack, Retzlaff, and Schwab 2003, 116).8 The Housing Trust Fund’s $47 million of total funding translates to an average of about $120,000 per city per year—but this belies variation in giving across member cities. For in-stance, the city of Redmond, according to city planners, “has contributed $300,000 per biennium to the ARCH Housing Trust Fund each biennium since 2003–04 (except 2007–08)” (City of Redmond 2016). In 2011, Kirkland gave about $294,000, which increased to $442,000 in 2012, $424,000 in 2013, $406,000 in 2014, and $478,000 in 2015 (Kirkland City Manager’s Office n.d.).9 And according to its 2017 Affordable Housing Strategy Document, between 1999 and 2015, Bellevue—by far the largest city on the Eastside—made an “annual average contribution to affordable housing through the ARCH Housing Trust Fund [of] $963,936. Between 2011 and 2015 annual average contribution was $1,165,414” (City of Bellevue 2017). In general, as a 2012 Association of Bay Area Governments report put it, ARCH “trades more process for greater jurisdiction and community buy-in.” These parity formulas, developed in col-laboration with member governments, are an excellent example of this (Association of Bay Area Governments 2012, 24). No matter what kind of housing municipalities choose to build with ARCH’s help, there’s one constant: the organization always pushes to be sure it’s what one former King County official calls “housing of excellence” (Sims 2017). As far as ARCH is concerned, building high-quality housing—affordable housing that’s just as sturdy, well-built and attractive as the market-rate housing around it—is an enormous part of its success, because good housing is good for the peo-ple who live in it, and it’s also good for the people who live nearby. From a public-relations per-spective, the best way to win a fight over affordable housing is not to have it in the first place, and ARCH believes that if people understand that “affordable housing” doesn’t have to mean “unsafe housing,” “cheap housing,” “ugly housing,” or even “different housing,” they will rally to its defense and welcome it into their communities. Zoning and land use In addition to direct assistance, which has been particularly important for building low-income units, Eastside cities have used indirect interventions in the housing marketplace, like land-use incentives for developers and other regulatory strategies, as an important tool for creating afford-able housing in eastern King County. Table 9 shows that these incentives have helped produce more than 1,000 units above and beyond those developed via direct assistance. Incentives have been applied almost exclusively to produce units affordable to moderate-income people, who in-clude working people like firefighters, teachers, and health care workers who would otherwise have to endure long commutes from more affordable places (ARCH 2011, 24). 8 For more detail on these formulas, see the Association of Bay Area Governments report on workforce-housing strategies (Association of Bay Area Governments 2012). 9 An increase in Community Development Block Grant funding accounts for the large increase in Kirkland’s contri-bution from 2011 to 2012.
26
Table 9. Affordable housing created, 1993–2008
City Low Income (Less than 50% AMI) Moderate Income (50-80% AMI) Total Low and Moderate Income
Total 1,849 3 51 1,903 1,215 1,058 2,201 4,474 6,377 Notes: Includes permits for accessory dwelling units, density bonuses, etc. Does not include all property permitted after 2007 Source: ARCH 2011, 24 In East King County, ARCH has helped push for the adoption of a number of different zoning incentives that cities can use to encourage developers to set aside new housing units for low- and moderate-income people (see Table 10).
27
Table 10. Inclusionary zoning programs in East King County cities Jurisdiction Geographic
Focus Set Aside Minimum
Required Partici-pation
Incentives Of-fered
Income Targeting In-Lieu Fee Rent Owner
Kirkland Commercial, high density residential, medium density, and office zones
10% of units (in-cluding base)
Yes Height bonus, bonus units, density bo-nus, fee ex-emptions
60–70% AMI
70–100% AMI
Based on cost of construction vs. revenue gener-ated
Bellevue New multi-family devel-opments
None No 1 bonus mar-ket rate unit per afforda-ble unit
Up to 80% AMI
Up to 80% AMI
Bel-Red, Bellevue
All Bel-Red land use dis-tricts
None No Density bo-nus
Up to 80% AMI
Up to 100% AMI
$18/sq ft
Central Is-saquah Den-sity Bonus Program
Central Is-saquah
20% of density bonus sq ft
No Density bo-nus
50% AMI 60% AMI $15/sq ft of den-sity bonus
Central Is-saquah Urban Core
Central Is-saquah ur-ban core
10% of units (in-cluding base)
Yes Exemption from various impact fees
80% AMI for first 300 units, 70% AMI after
90% AMI for first 300 units, 80% AMI after
For fractional units only
Redmond: Overlake Dis-trict
All new dwelling units
10% of units (in-cluding base)
Optional for first
100 units, re-
quired beyond
this
Density bo-nus of up to one story
80% AMI (50% AMI or less counts as 2 affordable units)
80% AMI (50% AMI or less counts as 2 affordable units)
Administrative or-der needed to cal-culate formula
Redmond: Downtown
All new dwelling units
10% of units (in-cluding base)
Yes Density credit equal to square foot-age of afford-able units
80% AMI (50% AMI or less counts as 2 affordable units)
80% AMI (50% AMI or less counts as 2 affordable units)
Administrative or-der needed to cal-culate formula
Redmond: Willows/Rose Hill, Educa-tion Hill, Grass Lawn, North Red-mond
All new SF attached and de-tached units
10% of units (in-cluding base)
Yes 1 bonus mar-ket rate unit per afforda-ble unit, im-pact fee waiv-ers (depend-ing on afford-ability)
80% AMI (50% AMI or less counts as 2 affordable units)
80% AMI (50% AMI or less counts as 2 affordable units)
Administrative or-der needed to cal-culate formula
28
Jurisdiction Geographic Focus
Set Aside Minimum
Required Partici-pation
Incentives Of-fered
Income Targeting In-Lieu Fee Rent Owner
Redmond: Af-fordable Sen-ior Housing Bonus
Any zoning district that allows re-tirement residents or MF housing
50% of housing or retire-ment resi-dence units
No Density bo-nus if 50% of units or more are afforda-ble for sen-iors
50% AMI 50% AMI
Notes: In Central Issaquah’s urban core, developers can use the density bonus program in addition to the mandatory urban core program. In Redmond’s Overlake district, requirements are optional for the first 100 housing units built in the district. Each proposed development site may qualify for a waiver of no more than 15 units of affordable hou-sing. Redmond’s senior housing bonus program is a special incentive program that can be used in addition to other programs. Source: Housing Development Consortium n.d. These strategies include fee waivers, density bonuses, and flexible development standards for af-fordable units; linking affordability to zoning updates (so, for instance, Redmond, Newcastle, and Kenmore now require affordability in areas that have changed the way they regulate things like building height); permitting accessory dwelling units in single-family-zoned residential neighborhoods; and offering publicly owned surplus land to developers who agree to include af-fordable units in their market-rate projects (ARCH 2011, 32). Finally, in its policy advocacy work, ARCH makes good use of the lessons it learned when it be-gan nearly 30 years ago. For instance, “cities share staffing through ARCH to provide support on a variety of local planning initiatives,” director Arthur Sullivan wrote in his successful applica-tion for the Innovation in American Government Award, given in 2004 by the Fannie Mae Foun-dation and the Ash Institute for Democratic Governance and Innovation at Harvard University. “Through shared staff,” Sullivan continued, “one city’s experience in working on a planning is-sue can be applied to similar circumstances in other cities” (ARCH 2004). As ever, ARCH works to guarantee that no Eastside city will ever have to begin its affordable-housing work from scratch. Community engagement At ARCH, the watchword is “community compatibility.” This means that everything ARCH does has a big public relations element, from the quality of the housing it helps build, to the way it calculates member cities’ “parity” contributions to the Housing Trust Fund, to the community meetings at which plans for new projects are shaped, to its “Housing 101” workshops designed to rally support for affordable housing generally. The coalition’s goal is to change the culture of the Eastside, so that nobody feels like affordable housing is somebody else’s housing. ARCH is most successful when it tells a compelling story about why its work matters, reminding affluent community members that everyone benefits when opportunity is accessible to all. Perhaps ironically, the key to this kind of storytelling is good listening. “There’s no such thing as a NIMBY,” Sullivan says. In his view, opponents are people who haven’t been heard, haven’t had their concerns addressed in good faith, and haven’t felt their perspectives accounted for in a
29
respectful way (Sullivan June 2017). ARCH plays a long game, in which one compromise now could mean 10 more funded projects down the line. Fundamentally, ARCH understands that many people in East King County live there precisely because they want to live in the suburbs, not the city. They like single-family houses with yards, ample parking, and exclusive schools. ARCH officials do not dismiss neighbors’ concerns or dis-count their values. Instead, they make the argument that all these things need not be incompatible with affordability. They talk about sharing access to opportunity, and do not let discussions de-volve into talk about “these people” taking away “your schools.” They talk about the struggles of cost-burdened folks who are already living on the Eastside, about creating a balance between housing and jobs, about “our” teachers, “our” workforce, “our” neighbors. In sum, ARCH doesn’t talk about “other people”; it keeps the focus on “us.” In this way, the organization has helped create an enduring sense of community in East King County—which, in turn, has made better neighbors, and better partners, out of Eastsiders and their cities. Key lessons Lesson 1. Affordable housing is about respect for existing residents. The impetus for the creation of ARCH was the concern that the new growth management re-quirements were going to make it difficult for local residents to afford to live in the region, and ARCH never wavered from its initial mission of easing the affordability challenges faced by lo-cal residents. This helped prevent discussions from devolving into an “us versus them” narrative and has helped the organization avoid having to convince jurisdictions of the value of affordable housing anew. Lesson 2. Quality design and project management are essential. Local leaders repeatedly highlighted the design of ARCH-supported projects, particularly how well their designs complemented the neighborhood and surrounding streetscape. Moreover, they characterized ARCH-supported projects as scandal-free and well-run. These realities helped dis-sipate community fears once the housing was put in service. They also became important exam-ples to be referenced during advocacy for subsequent projects. For instance, Washington’s Gov-ernor feted ARCH’s Greenbrier Heights in 2006 for creating a model affordable living commu-nity (ARCH 2006). Similarly, the National Association of Housing and Redevelopment Officials recognized ARCH’s Village at Overlake Station in 2003 for its innovative program (ARCH n.d.). Lesson 3. Patience and pacing pay off. ARCH initially was a partnership between only King County and the City of Bellevue. The expe-riences in Bellevue and other early partners, including Kirkland and Redmond, became selling points for other jurisdictions, who could see the process and success. ARCH has grown to now include 15 eastern King County cities. Lesson 4. The dual funding model increases local comfort with participation. ARCH members provide funding through two channels. One channel provides money to support ARCH staff. The second channel provides capital funding for new development or the preserva-tion of existing units. Funding for this capital channel is not transferred to ARCH until the pro-jects are agreed upon, so local jurisdictions are not asked to provide funds before they know
30
what projects will be developed. The ARCH members decide together which projects present the greatest opportunity for the eastside. Family Self-Sufficiency in a Gentrifying Neighborhood: Home Forward’s Humboldt Gar-dens We initially viewed Home Forward’s Humboldt Gardens work to be a fit for the project—it was at first an effort to transform an existing project in an opportunity-poor urban area into an area that offers more opportunity. However, during the redevelopment, the surrounding neighborhood underwent a striking change that moved it from an opportunity-poor neighborhood to one that was increasingly opportunity rich. Instead of becoming a potential anchor to facilitate subsequent investments to improve the neighborhood, Humboldt Gardens became a vehicle for preserving access to the neighborhood for people of lesser means. This alternate role for Humboldt Gardens informed our research approach and led to more of a focus on resident efforts to remain in the neighborhood than we initially considered. Background The focus of this research is the experience of work-oriented families in Humboldt Gardens re-ceiving Home Forward assistance. Because Home Forward offers a broad array of services out-side of its Family Self-Sufficiency (FSS) program to work-oriented households, if one is to un-derstand the effects of its FSS program, it is important to understand this broader array of ser-vices. This section provides a brief overview of the principal kinds of services managed by Home Forward Community Services that may be relevant to the lived experience of work-fo-cused households that either receive housing choice vouchers or live in a Home Forward com-munity. Home Forward’s infrastructure of familial support As a HUD-designated Moving to Work (MtW) housing authority, Home Forward has greater flexibility than non-MtW housing authorities in how it can structure its programs and allocate the resources it receives from the federal government to serve its clients (Home Forward 2017).10 The agency has used this authority to develop two primary kinds of services applicable to work-oriented households:
• An array of resident services provided to residents of Home Forward developments • A case-managed, individualized, intensive Family Self-Sufficiency (FSS) program
By virtue of living in a Home Forward community, a work-oriented household has full access to the resident services offered by that community. The services, which vary from community to community, can include a food bank, youth activities, community holiday celebrations, or one-on-one meetings with a resident services coordinator to identify outside services that would be helpful. Each resident can choose whether to participate in any given program or not. In addition to these discretionary services, residence service coordinators provide active case management. For example, residence service coordinators may contact residents to schedule problem-solving 10 HUD designated Home Forward an MtW agency in 1998.
31
sessions if the residents are falling behind on their rent payments or having issues with another resident household—behaviors that could affect their continued residency and housing stability. Home Forward also partners with other agencies to deliver programs crafted to meet the needs of other populations it serves, such as those recovering from addictions and older adults who need additional help as they age in place in Home Forward properties. Of particular relevance to this study is the Bridges to Housing (B2H) program. B2H gives formerly homeless individuals and families who face mental illness, addiction, disability, or other challenges access to a supportive housing environment that includes case management provided by a Home Forward partner and housing provided by Home Forward. This program provides intensive case management and ac-cess to additional resources to help future work-oriented households who remain in recovery graduate and move into the less-intensive Greater Opportunities to Advance, Learn, and Suc-ceed, or GOALS, program. Thus, a household experiencing homelessness and addictions may enter Home Forward programs through B2H and then be transferred to a new case manager in the GOALS program, all while accessing resident services. GOALS, which is Home Forward’s FSS program, is designed to help work-oriented households who either have housing choice vouchers or live in Home Forward’s HUD-assisted housing in-crease their earnings and make progress toward greater economic independence. There are three key components: goal-setting, participation in services, and the creation of an interest-bearing escrow account. GOALS represents Home Forward’s use of its MtW status to create a custom-ized version of the national FSS model that is more responsive to local opportunities. On February 15, 2018, Home Forward celebrated the 25th anniversary of its participation in the Family Self-Sufficiency Program. Home Forward staff reported that 2,454 individuals had par-ticipated in GOALS since 2000. Of that number, 388 had graduated and 527 were currently en-rolled, resulting in a graduation rate of 20 percent. The average earned income for current gradu-ates was $37,600, which represented a 300 percent increase since they enrolled in the program. The average managed savings per current graduate was $7,900. Home Forward works with 54 community partners to provide services to program participants. When the GOALS program was first introduced, it was mandatory for residents in HOPE VI de-velopments to participate; nonparticipants were required to move from those sites to other Home Forward housing. In August 2015, partially in response to growing concerns about displacing families from high-opportunity neighborhoods, Home Forward eliminated the mandatory partici-pation requirement for residents in its HOPE VI developments, including those in North and Northeast Portland. While those failing to graduate on time lost access to savings accrued during program participa-tion, they did not have to move. The enrollment at former site-based programs where participa-tion had been mandatory dropped significantly after the policy change. Home Forward thus be-gan to provide a uniform GOALS program that had the same rules for all participants regardless of where they lived. The program is managed by the Community Services Department, which also manages other resident services.
32
Neighborhood context The corridor of gleaming high-rises along Vancouver and Williams Avenues is a marked change from the streetscape that prevailed during much of the area’s history. The longer history of Northeast Portland (also known as Albina) is one of racial segregation, disinvestment, urban re-newal, and displacement. From 1910 to 1940, many black Portlanders were pushed into the Al-bina District through the restrictive real estate market. During the 1940s, more than 23,000 black people moved to Portland to work in the shipyards for the war effort. After WWII, black workers who remained in the city were pushed into the Albina District, and white residents began moving to the suburban areas (Gibson 2007). Urban renewal projects and highway construction, begin-ning in the 1960s, displaced many of those who lived in the district. By the 1980s, prostitution, drug dealing, and abandoned houses were commonplace, and this reality gradually started to cap-ture the attention of city officials. In the 1990s, after decades of resident complaints, the city finally began to take steps to address Albina’s problems. City officials began to enforce building codes and increased block grant funding to help nonprofits build new affordable housing. The city established the Portland Hous-ing Center to increase homeownership and challenged banks to atone for and reverse decades of redlining. In 2000, the City of Portland created the Interstate Corridor Urban Renewal Area (Gib-son 2004). It was in this context that the HOPE VI redevelopment that would become Humboldt Gardens was conceived. Iris Court was a public housing development in the Albina neighborhood with a bad reputation, known for open-air drug markets and occasional gunfire. Home Forward (then known as the Housing Authority of Portland) envisioned converting Iris Court into safe, afforda-ble, stable, and high-quality housing that would help residents connect to opportunity and move out of poverty. They would have easy access to employment centers and educational institutions because Northeast Portland multiple bus lines that traverse the city, as well as additional transit lines heading to major employment centers. In addition, the Cascade Campus of Portland Com-munity College is within walking distance (and was also about to undergo a renovation and ex-pansion). The area also had a public library branch and a high school and featured parks and bike lanes. Many social service providers were familiar with the area, which would allow residents to maintain access to these institutional supports. In sum, Home Forward saw redeveloping the Iris Court site as a perfect model of the “moving-to-opportunity” concept that had gained popularity at the time. Humboldt Gardens was the result. The increase of public investment in the Albina District made the area more appealing to white residents, who began moving into the neighborhood with increased frequency. This influx in turn triggered attention from significant private capital, and the neighborhood experienced new resi-dential and commercial development along with substantial increases in housing costs. And the increased prices triggered the displacement of lower-income residents, especially lower-income black residents. In 1990, the African American population in Northeast Portland was 23,724, or 31 percent of the total neighborhood population. By 2010, the African American population had declined to 12,274, or 15 percent of the total (Portland Housing Bureau 2014). This dynamic sparked an important change in the perception of the value of Humboldt Gardens, from a conduit
33
for introducing opportunity into a lower-income neighborhood to a holdout trying to preserve ac-cess to opportunity for lower-income families but finding that maintaining this access was be-coming increasingly difficult. Research methodology We used a case study approach to address the research questions because both context and lived experience are central to our analysis. The primary research method was direct data collection with residents through 90-minute to two-hour interviews and focus groups. We recruited GOALS participants (current or former) living in North/Northeast Portland in general and Hum-boldt Gardens, a promising HOPE VI project in the heart of the gentrification, in particular. Our interviews focused on personal goals and aspirations and how program delivery works for low-income, work-oriented parents in subsidized housing. We also interviewed nonparticipant house-holds to consider how they understood self-sufficiency and accessed neighborhood-based oppor-tunity regardless of program participation. We held one focus groups with older, nonworking residents and a second with residents of Humboldt Gardens with children to gain their perspec-tives on their community and neighborhood change. Finally, to get a sense of how Humboldt Gardens functioned as a community, we conducted observations and less formal conversations at community events, including an onsite health fair, the National Neighborhood Night Out block party, and free kids’ lunch and fresh food distribution events. The research includes existing program documentation and evaluation data review, supple-mented with interviews with Home Forward and program partner staff to understand the overall dynamics of resident life and program participation at Humboldt Gardens. Our questions for staff were about their perceptions of program participation and clients’ satisfaction with programs and living in the neighborhood, in general. A limitation inherent to a study such as this is self-selection. Because residents were not required to participate in interviews, we were successful in recruiting only those who were willing and in-terested in telling us their story. Typically, this skews the sample toward those who have a con-cern that they wish to express (they want to be heard) and those who are proud of their achieve-ments (they want to tell their story). However, there is an even deeper level of self-selection in-volved in this analysis: because GOALS is a voluntary program, only those who want and are able to use its benefits apply. This population may not be representative of all work-oriented households with children who receive housing assistance. Thus, while our interviews do not cap-ture the diversity of experiences of all work-oriented households receiving housing assistance and living in a higher-opportunity, gentrifying neighborhood, they are still real and especially relevant to those motivated to participate in an FSS program.
34
Table 11. Profile of Interview Participants (n = 10) Sex
Male 2 Female 8
Race African American 3 Multiple 1 White 3 Unknown 2
GOALS participation Participant 7 Not a Participant 3
Relationship to N/NE Portland Grew up in N/NE Portland 5 Did not grow up in N/NE Portland 5
Takeaways Our engagement with the residents and administrators highlighted a number of takeaways. This section highlights three of the most significant. Choice is a double-edged sword. The GOALS program along with the general Home Forward resident services give families re-ceiving housing assistance an enormous menu of choices for services and programs. With so many offerings, the program can effectively serve participants in a wide range of circumstances. Case management begins with residents setting their own goals and objectives, making it possi-ble to tailor programs to residents’ needs, whether these individuals are just becoming stable or advancing in their education and careers close to the point of exiting housing assistance. Addi-tionally, the GOALS program supports longer-term and aspirational thinking that may not be available in some other programs, notably the case management for families in the Temporary Assistance for Needy Families (that is, welfare) program. Support for going to school—even graduate school—and for attempting to advance into careers rather than “jobs” is a positive as-pect of the GOALS program. This range of features poses challenges as well. Though GOALS participants rated the program highly for its access to many kinds of resources and services, many reported being initially over-whelmed by the number of choices. The program orientation attempts to convey its full range of activities in one meeting, and that can be confusing for participants, who instead preferred to have additional one-on-one interactions with coordinators who could walk them through their options.
35
One example is the confusion around the Individual Development Account savings program. Several residents, including both GOALS participants and nonparticipants, reported they were not aware of this program. Those who were aware reported confusion about how it works. Among participants, the different methods of savings—which include an escrow account for rent increases paid as incomes go up—were not entirely clear to most. Several participants described their lack of information about the possible uses of the savings accounts and expressed positive surprise on discovering they could access savings while still in the program to handle emergency expenses. This positive response suggests that program administrators might look to ways to promote this option more prominently and at regular junctures. This would increase awareness and could po-tentially increase program participation by eligible families. On balance, given there are many resident services options along with the GOALS program menu of options, there may be too much information for families to process and focus on at one time. Moreover, residents were also trying to navigate the changes to site-based housing through the Rental Assistance Demonstration program; three Humboldt Gardens residents mentioned they were confused about what the new voucher-based housing was going to mean for them and were focused on trying to assess that change. The complexity of the overall support infrastruc-ture is clearly an issue. Market forces and a history of housing insecurity represent major challenges. The broad transformation of the Humboldt Gardens neighborhood has created a situation where residents are unlikely to envision a future in which they are able to remain in the neighborhood if they succeed in the program and achieve their goals. The shrinking stock of rental housing avail-able for those earning 60–80 percent of area median income and the extremely limited public sector focus on this segment of the market means there is little to no affordable rental housing in “high-opportunity” neighborhoods for families who are graduating from GOALS and moving away from housing subsidies. In expensive markets like Portland, the middle rung of market-rate rental housing is not easily attainable, or it involves a move to a significantly less desirable loca-tion or even another city or state. Such moves are costly. As they exit assisted housing, program “successes” may be moving away from their jobs, children’s schools, social and support net-works, and important nearby amenities. Another source of stress for program participants is that many have had repeated bouts of hous-ing insecurity and fear that graduation could expose them to more risk rather than less. In the context of GOALS, “self-sufficiency” means a resident no longer needs housing subsidy. Most of the families have already experienced significant housing instability and worry about possible future dislocation if they again experience such instability. An unexpected event—an accident, job loss, new health condition, death or divorce—can cause an otherwise rising family to spiral downward toward housing insecurity. There are no buffers to help former housing assistance re-cipients weather these challenges financially and regain their footing. Thus, when families move off housing assistance, they also lose their safety net. This loss can be effectively permanent given that, in many places, waiting lists for housing assistance (vouchers or public housing) are closed.
36
The question of when and how families will leave assisted housing became more fraught when residents discussed neighborhood housing price trends. None saw themselves as able to afford housing near their current locations. Sadly, they were correct. When they talked about where they might live in the future, they sometimes suggested more rural areas in metro Portland—some with positive anticipation—or the possibility of having to move to “the Numbers,” or East Portland, usually spoken of with apprehension. For families who have experienced multiple dis-placements throughout Portland’s urban renewal era, another move—this time, out of Northeast Portland entirely—can be described as “root shock.” In the face of this reality, Home Forward has changed participation rules that require families who are not achieving milestones in self-sufficiency programs to relocate, out of a concern that it would be counterproductive if they were farther from opportunities and without additional hous-ing supports. The details of case management matter. A recurring theme that emerged throughout the study was that how case management was struc-tured and executed had material effects on participant experiences, with implications for program success. GOALS program participants have experienced multiple case management approaches and sometimes have had more than one coordinator. As a result, they expressed ideas about how case management could be coordinated and offered most effectively. Everyone noted that the relationship between the case manager and participant and the case man-ager’s fit with the participant’s needs are critical for keeping the participant engaged and on track. The opinions people mentioned about case management could be used by GOALS hiring managers when considering personnel choices. For example, participants agreed that coaches and mentors—as opposed to “scolds,” or those who focus on missteps without offering produc-tive paths forward—are likelier to bring about success. That noted, different roles are required to conduct the program. While coaching and mentoring are definitely needed, the program also needs staff to help participants connect with a network of “DIY” services and to ensure accountability and compliance. Home Forward intentionally coor-dinates on-site management of site operations, maintenance of the facility, voucher management, resident services, and the GOALS program. Agency staff noted that development site staff were closely engaged with one another so they could coordinate responses to issues for residents. Someone who was having trouble paying rent might get referred to resident services staff to ad-dress issues. A maintenance person might notice problems between neighbors and then bring the issue to a manager. The intention of the on-site coordination as well as the close working rela-tionships among staff and onsite coordination was to fully support participants’ success as ten-ants and as people. However, most residents of Home Forward sites expressed a strong preference for detaching property management functions—the work of landlords to collect rent and enforce rules—from their personal self-sufficiency journey. Low-income renters frequently experience challenges in their relationships with both landlords and property maintenance workers, and with their social caseworkers. They tended to view conflicts in either arena as a threat to their housing stability
37
and a peaceful living environment. For instance, they may be fearful of sharing a personal set-back with a service provider in case that provider shares it with the person who collects the rent. When the relationships are entangled, participants may withdraw from deeper engagement with Family Self-Sufficiency programming. For some residents, Home Forward programs may be only part of the picture of their work with case managers and social services, and this provides an opportunity. Coordinating goal setting and tracking in multiple arenas could enhance self-sufficiency progress if GOALS coordinators were to engage with other agencies. Several interviewees mentioned Department of Human Ser-vices (DHS) case workers as having a model of engagement that provided supportive and for-ward-moving progress. If GOALS coordinators connected with DHS case managers—and every family receiving Temporary Assistance for Needy Families has a DHS case manager—they could help reduce the total amount of time case managers spend checking in. Moreover, GOALS coordinators could provide greater aspirational supports to DHS programming, including the re-sources that GOALS can bring from outside agencies. For example, one participant described GOALS as having a greater focus on furthering education, rather than encouraging participants to take the first job available, as she said the Temporary Assistance for Needy Families rules pushed her to do. Interviewees rated GOALS coordinators highly for providing access to many programs and ser-vices, but noted they often communicate over email or with less depth than other case workers. Several interviewees wondered if the GOALS coordinator case load was too high to allow for consistent one-on-one, in-person contact. Some offered that structuring case manager relation-ships such that the primary case manager would be a coach who also managed the logistics asso-ciated with satisfying other program and compliance requirements might reduce the need to check in with case managers so often. Participants could thus avoid being in the middle of multi-ple programmatic formats. If the GOALS program were to move away from having the coordinator serve as a comprehen-sive case specialist responsible for both compliance with site-based housing assistance require-ments and self-sufficiency support services, it could increase resident engagement with the GOALS program by reducing the entanglement of resident services personnel with the property management and landlord functions of the housing authority. Several participants said they had better experiences with a “warm handoff” to partner agencies rather than just getting a referral, and they wanted to be able to discuss how to best engage with an external service provider with their coordinator in advance.
Major Lessons The three research projects revealed seven major lessons that efforts to increase access to oppor-tunity for lower-income families should consider. Lesson 1: Choice is a double-edged sword. (San Diego) The Achievement Academy actively embraced the notion of providing a wide array of services, assistance, and referrals, and the research clearly indicated that participants valued
38
having so many options. However, this flexibility did not come without cost. Only seven partici-pants (fewer than 25 percent) reported participating in the FSS program despite evidence indicat-ing broad-based participant interest. A key observation in this regard is that all offerings were not equally used. Participants most often came for help with job searches, and beyond this, chose as-sistance targeted to their specific needs (childcare assistance for single parents, for example). (Portland) The GOALS program offers participants an enormous menu of choices for services and programs. Case managers work with residents to help them set their own goals. These resi-dents thus have a program tailored to meet their specific needs. Residents expressed much appre-ciation for the individualized approach, but also reported being overwhelmed initially by the many choices, which sometimes caused them to overlook or not fully take advantage of some of-ferings. Lesson 2: Positive caseworker interactions and culture are vital. (San Diego) The Achievement Academy design required staff to have frequent, positive interac-tions with participants. The analysis revealed that this strategy has been successful—these posi-tive interactions were found to keep participants engaged in programs. Interviews with staff members made clear that this success was mostly driven by the Achievement Academy director, who instilled a clear culture of service. This leadership helped build a team of highly committed employees, who have strong public service motivations. Another key feature participants high-lighted was that Academy staff are not involved in determining eligibility for Section 8 vouchers. This removal of the potential for punitive interactions increased participant willingness to fully engage. (Portland) A recurring theme at Humboldt Gardens was that the structure and execution of case management had material effects on participant experiences, with implications for program suc-cess. Program participants strongly preferred that the mentor and compliance roles required for conducting the program be assigned to different case managers because the potential conflicts associated with property management could cause participants to hold back from deeper engage-ment. Moreover, coordinating the setting and tracking of goals in multiple arenas could enhance self-sufficiency progress if GOALS coordinators could engage with case managers from other agencies and programs. Lesson 3: Affordable housing is about respect for existing residents. (King County) The impetus for the creation of ARCH was the concern that the new growth man-agement requirements were going to make it difficult for local residents to afford to live in the region, and ARCH never wavered from its initial mission of easing affordability challenges for local residents. This helped prevent discussions from devolving into an “us-versus-them” narra-tive, and has helped ARCH avoid having to convince jurisdictions of the value of affordable housing anew. Lesson 4: Quality design and project management are essential. (King County) Local leaders repeatedly highlighted the design of ARCH-supported projects, par-ticularly how well their designs complemented the surrounding streetscape. Moreover, they char-acterized ARCH-supported projects as scandal-free and well-run. These realities helped dissipate
39
community fears once the housing was put in service. They also became important examples to be referenced during advocacy for subsequent projects. Lesson 5: Patience and pacing pay off. (King County) ARCH initially was a partnership between only King County and the City of Bellevue. The experiences in Bellevue and other early partners, including Kirkland and Red-mond, became selling points for other jurisdictions, who could see the process and success. ARCH has grown to now include 15 eastern King County cities. Lesson 6: A dual funding model increases local comfort with participation. (King County) ARCH members provide funding through two channels. One channel provides money to support ARCH staff. The second channel provides capital funding for new develop-ment or the preservation of existing units. Funding for this capital channel is not transferred to ARCH until the projects are agreed upon, so local jurisdictions are not asked to provide funds before they know what projects will be developed. The ARCH members decide together which projects present the greatest opportunity for the east side. Lesson 7: Market forces and a history of housing insecurity represent major challenges. (Portland) The broad transformation of the local neighborhood has made it difficult for residents to envision a future where they can remain in the neighborhood, even if they achieve their goals, because the area has little to no affordable housing. Moreover, success in achieving self-suffi-ciency—that is, when they complete the program and thus lose the program’s support—can ex-pose participants to more risk rather than less, owing to the greater housing instability that lower-income families face.
40
References Affordable Housing Task Force of the King County Growth Management Planning Council. March 1994.
Affordable Housing in King County: Strategies for Achieving Growth Management Housing Policies. King County Archive.
ARCH. 2016. East King County Trust Fund Summary. Accessed April 5, 2019. http://www.archhous-
ing.org/developers/docs/ARCHTrustFundList%20Master%20Thru%202016%20Fall%208-29-17.pdf. ARCH. May 2011. Housing 101: East King County. Accessed April 5, 2019. http://www.archhous-
ing.org/resources/pdfs/Housing_101_2011.05.13.pdf. ARCH. June 2006. “Governor awards Woodinville’s Greenbrier Heights for smart community accom-
plishment.” Press release. ARCH. July 2004. Innovation in American Government Award application (unpublished). ARCH. n.d. Housing Trust Fund. Accessed April 5, 2019. http://www.archhousing.org/developers/hous-
ing-trust-fund.html. ARCH n.d. Awards. Accessed April 11, 2019. http://www.archhousing.org/about-
arch/awards.html#recognition. Association of Bay Area Governments. Fall 2012. Regional Policy Background Papers. “Housing the
Workforce in the Bay Area,” 24. Accessed April 5, 2019. https://abag.ca.gov/abag/events/agen-das/r100312a-Item%206a:%20Report.pdf.
Chapa, Jorge and De La Rosa, Belinda. 2004. “Latino population growth, socioeconomic and demo-
graphic characteristics, and implications for educational attainment.” Education and Urban Society, 36(2): 130–49.
City of Bellevue, Washington. May 2017. Affordable Housing Strategies, Appendices, 3. Accessed April
City of Redmond, Washington. n.d. Housing Trust Fund. Accessed April 5, 2019. http://www.ci.red-
mond.wa.us/cms/One.aspx?portalId=169&pageId=124300. Gibson, Karen J. 2007. “Bleeding Albina: A history of disinvestment, 1940-2000.” Transforming Anthro-
pology, 15(1): 3-25. Gibson, Karen J. 2004. “Urban Redevelopment in Portland: Making the City Livable for Everyone?” In
The Portland Edge: Challenges and Successes in Growing Communities, edited by Connie P. Ozawa, 61–83. Portland: Island Press.
Goetz, Edward G. 2000. “The politics of poverty deconcentration and housing demolition.” Journal of
Urban Affairs, 22(2): 157–73.
41
Housing Development Consortium. n.d. East King County Cities: Incentive Zoning Programs. Accessed April 5, 2019. https://www.housingconsortium.org/wp-content/uploads/2017/06/Incentive-Zoning-East-KC-Cities_-Updated.pdf.
Housing Development Consortium. n.d. The Eastside Housing Trust Fund. Accessed April 5, 2019.
https://www.housingconsortium.org/eastside-housing-trust-fund3/. Home Forward. 2017. Year 19 Moving to Work annual plan. Accessed April 11, 2019.
Kirkland City Manager’s Office. n.d. Kirkland Performance Measures: Housing. Accessed April 2015,
http://www.kirklandwa.gov/Assets/CMO/CMO+PDFs/Performance+Measures+Housing.pdf. Mack, Stuart; Retzlaff, Rebecca; and Schwab, James. 2003. Regional Approaches to Affordable Housing
(American Planning Association, 2003). National Low Income Housing Coalition. 2014. “Advocates’ Guide: Inclusionary Housing Policies.” Ac-
cessed April 5, 2019. http://nlihc.org/sites/default/files/2014AG-185.pdf. Portland Housing Bureau. June 2014. 2010 Decennial Census. Quinn, Adrienne (director of City of Seattle Office of Housing). June 2017. Conversation. Rabin, Yale. 1999. “Expulsive Zoning: The Inequitable Legacy of Euclid.” In Zoning and the American
Dream: Promises Still to Keep, edited by Charles M. Haar and Jerold S. Kayden, 101–21. Chicago: APA Planners Press.
Silver, Christopher. 1997. “The Racial Originals of Zoning in American Cities“ In Urban Planning and
the African American Community: In the Shadows, edited by June Manning Thomas and Marsha Ritzdorf, 23–42. Thousand Oaks, California: Sage Publications.
Sims, Ron (former King County executive). June 2017. Conversation. Sullivan, Arthur. June 2017. Personal conversation. Wilson, Sacoby; Hutson, Malo; and Mujahid, Mahasin. 2008. “How Planning and Zoning Contribute to