The author(s) shown below used Federal funds provided by the U.S. Department of Justice and prepared the following final report: Document Title: Access to Transportation and Outcomes for Women on Probation and Parole Author(s): Miriam Northcutt Bohmert Document No.: 248641 Date Received: February 2015 Award Number: 2013-IJ-CX-0041 This report has not been published by the U.S. Department of Justice. To provide better customer service, NCJRS has made this Federally- funded grant report available electronically. Opinions or points of view expressed are those of the author(s) and do not necessarily reflect the official position or policies of the U.S. Department of Justice.
Transcript
The author(s) shown below used Federal funds provided by the U.S. Department of Justice and prepared the following final report: Document Title: Access to Transportation and Outcomes for
Women on Probation and Parole Author(s): Miriam Northcutt Bohmert Document No.: 248641 Date Received: February 2015 Award Number: 2013-IJ-CX-0041 This report has not been published by the U.S. Department of Justice. To provide better customer service, NCJRS has made this Federally-funded grant report available electronically.
Opinions or points of view expressed are those of the author(s) and do not necessarily reflect
the official position or policies of the U.S. Department of Justice.
ACCESS TO TRANSPORTATION AND OUTCOMES FOR WOMEN ON PROBATION AND PAROLE
By
Miriam Northcutt Bohmert
A DISSERTATION
Submitted to Michigan State University
in partial fulfillment of the requirements for the degree of
Criminal Justice - Doctor of Philosophy
2014
This document is a research report submitted to the U.S. Department of Justice. This report has not been published by the Department. Opinions or points of view expressed are those of the author(s)
and do not necessarily reflect the official position or policies of the U.S. Department of Justice.
ABSTRACT
ACCESS TO TRANSPORTATION AND OUTCOMES FOR WOMEN ON PROBATION AND PAROLE
By
Miriam Northcutt Bohmert
The current study focuses attention on a previously understudied topic – transportation
deprivation in women offenders. This is a timely and important endeavor given the scale of mass
incarceration, number of women on probation and parole, and the numerous barriers women with
a criminal record face. The study utilizes a mixed-methods sequential explanatory design of
transportation access and its causes and effects on recidivism for 402 women on probation and
parole.
The study has two phases. The quantitative, first phase, of this project combines multiple
indicators of transportation access (e.g., time, cost, stress related to travel) into one composite
access score; tests hypotheses linking resources to transportation access; and tests for direct and
moderating effects of transportation access on probation/parole violations and recidivism.
Quantitative analyses are able to identify associations between transportation resources,
transportation access, criminogenic needs, and recidivism; however, the analyses raised
questions about why or why not associations were present. To address these questions, a second
phase, a qualitative component, undertook analyses to increase understanding of (1) women's
experiences and feelings (e.g., any stress, ease) about getting around while under supervision, (2)
their strategies for increasing transportation resources and access, (3)the role of transportation
access in attending, or missing, required/needed programming and supervision appointments,
and (4) whether and how supervision violations or new offenses resulted from lack of
This document is a research report submitted to the U.S. Department of Justice. This report has not been published by the Department. Opinions or points of view expressed are those of the author(s)
and do not necessarily reflect the official position or policies of the U.S. Department of Justice.
transportation access. The follow-up sample included 75 women.
The findings of the quantitative analysis found, first, the scope of transportation
deprivation was found to be quite extensive; women reported low levels of individual and
community level resources. Second, an instrument (a composite score) was found to adequately
capture women’s level of transportation access. Third, several resources were found to predict
transportation access: owning or leasing a vehicle, having a valid driver’s license, having
difficulty walking, having poor vision, having friends who could help with transportation needs,
and living in an area with a low community accessibility score. Fourth, transportation access was
found to lower the odds of experiencing recidivism events and the time until these events
occurred. Fifth, the findings indicate that transportation access is especially important for women
with certain criminogenic needs – those with antisocial friends, histories of child maltreatment,
greater family support and greater self-efficacy.
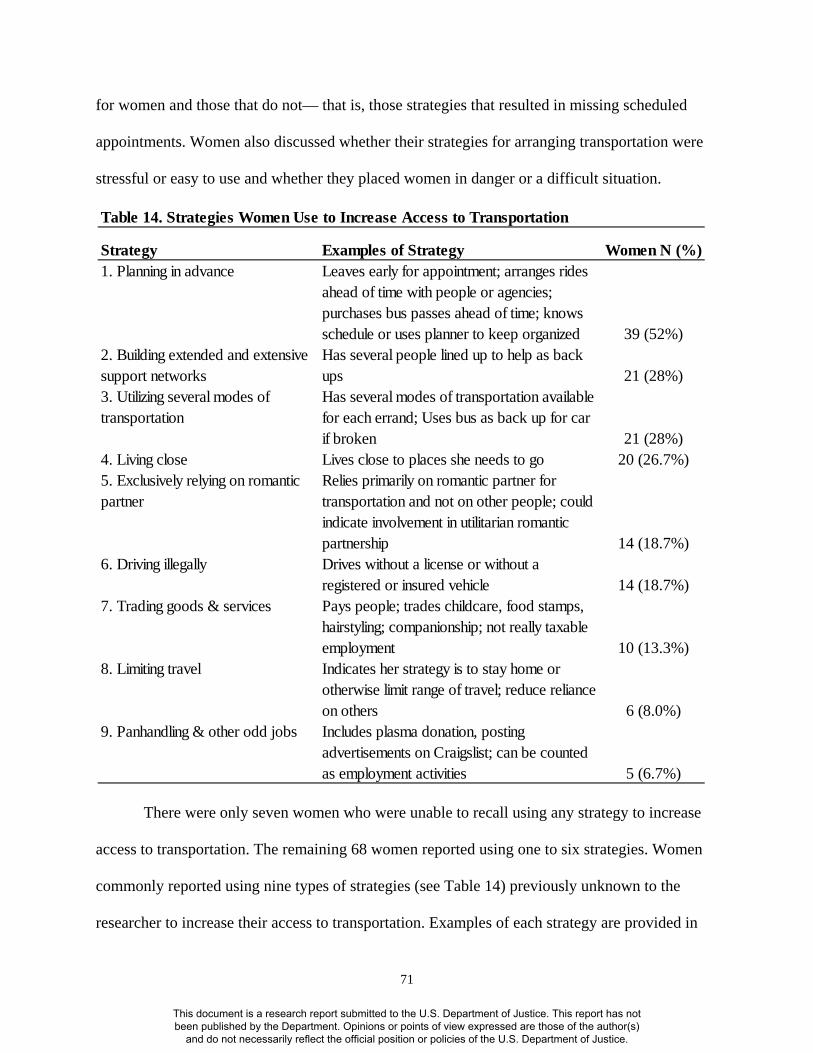
The findings of the qualitative analysis found that, first, women experience one to ten
types of transportation problems such as difficulty arranging rides, using inadequate bus services
and relying on unreliable people for transportation help. Second, women were found to utilize
several resources not previously known such as using agency-provided bus tokens or benefitting
from having an understanding and non-punitive supervision agent. Third, nine previously
unrecognized strategies were identified such as planning in advance for appointments, building
extensive support networks and making use of several modes of transportation. Fourth, the
relationship between transportation access and recidivism was found to be moderately strong.
Overall, the findings indicate that training parole and probation agents to recognize and
respond to women’s transportation needs will be beneficial. Similarly, transit authorities can
benefit from understanding the limitations of their services for women offenders.
This document is a research report submitted to the U.S. Department of Justice. This report has not been published by the Department. Opinions or points of view expressed are those of the author(s)
and do not necessarily reflect the official position or policies of the U.S. Department of Justice.
ACKNOWLEDGEMENTS
I would like to thank Dr. Merry Morash for your support and guidance over the past four
years. As a result of your expertise and encouragement, I have achieved goals I did not think
possible. You have provided an incredible model of mentorship I hope to emulate. I would also
like to thank Drs. Steve Chermak, Jennifer Cobbina, Steve Gold and Ed McGarrell for serving on
my dissertation committee. Thank you for taking the time to provide me with insightful feedback
and knowledgeable guidance. Additionally, I would like to thank my former mentors – Drs.
Donald Luidens and Alfred DeMaris. You both continue to encourage and advise in my
academic pursuits. You are my earliest supporters.
I also would like to thank the agencies that supported this research. This project was
supported by dissertation grants from the National Institute of Justice, Office of Justice
Programs, U.S. Department of Justice (2013-IJ-CX-0041),and the National Science Foundation
(SES-1323461). Additional funding was also provided by the National Science Foundation
(SES-1126162), the Association of Doctoral Programs in Criminology & Criminal Justice, and
Michigan State University. The opinions, findings, and conclusions or recommendations
expressed in this presentation are those of the author and do not necessarily reflect those of the
funding agencies.
I would also like to thank some of my friends who were around for the graduate school
years, such as Tia Stevens Andersen, Rebecca Stone, Megan Vertucci, and Deanna Trella. Tia,
you paved the way. Megan and Deanna, thank you for coffee breaks and laughter. You made the
thank you for reminding me of the world outside of the Nisbet Building. Jenny Cornacchione,
Marva Goodson and Chelsea Wilkins – thank you for your skillful work on this project. Data
iv
This document is a research report submitted to the U.S. Department of Justice. This report has not been published by the Department. Opinions or points of view expressed are those of the author(s)
and do not necessarily reflect the official position or policies of the U.S. Department of Justice.
doesn’t collect itself. Without you, this endeavor would not have been possible.
I would like to express my sincerest gratitude to Janine Sternik for caring for, and helping
me raise, my two most valuable creations Clare and Alex. Thank you for directing their steps,
keeping them safe, and providing me sanity and encouragement. You made it possible for me to
be both an academic and a mother.
Finally, I would like to thank my parents, Al and Val, and my parents-in-law, Joe and
Julie, who have been constant sources of love and support. Most of all, I would like to thank my
funny and handsome husband, Ben, who has been my greatest supporter. You make me laugh.
You encourage me when I am worn. You are my rock. Thank you for supporting this crazy
endeavor and for all the sacrifices you have made to bring it to fruition. Beginning and ending
each day with you is the greatest gift and most precious thing I have. All my eggs, too, are in one
basket.
v
This document is a research report submitted to the U.S. Department of Justice. This report has not been published by the Department. Opinions or points of view expressed are those of the author(s)
and do not necessarily reflect the official position or policies of the U.S. Department of Justice.
TABLE OF CONTENTS
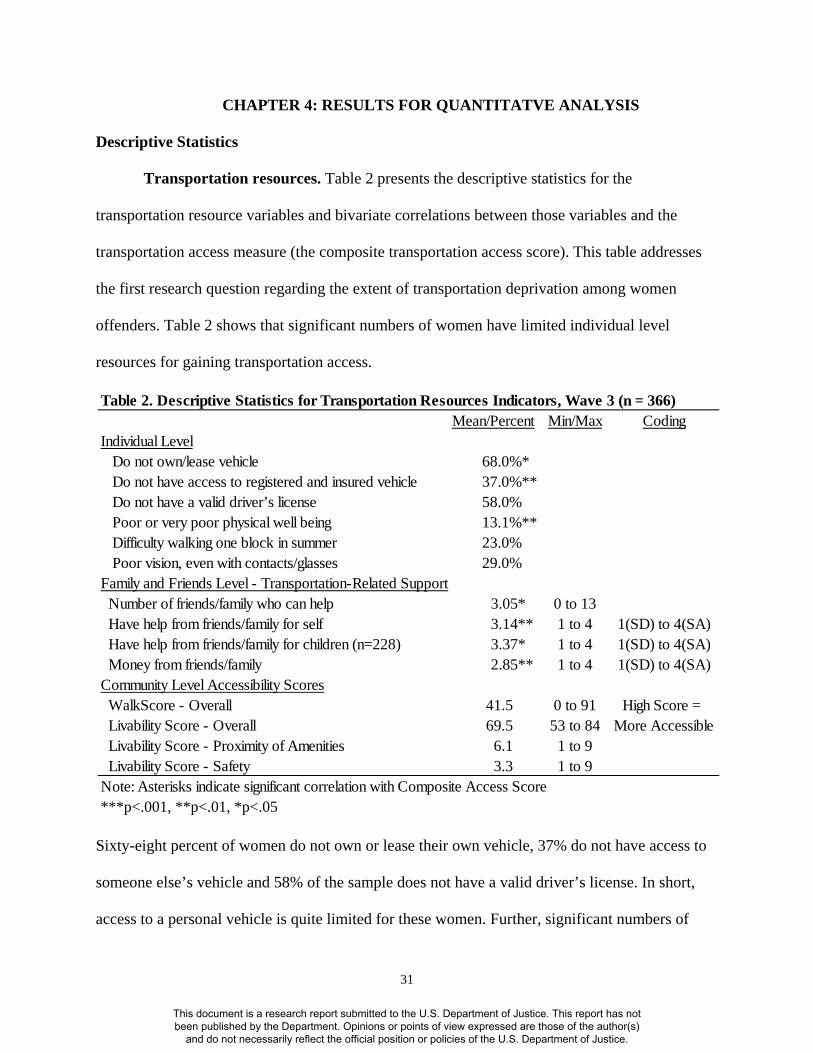
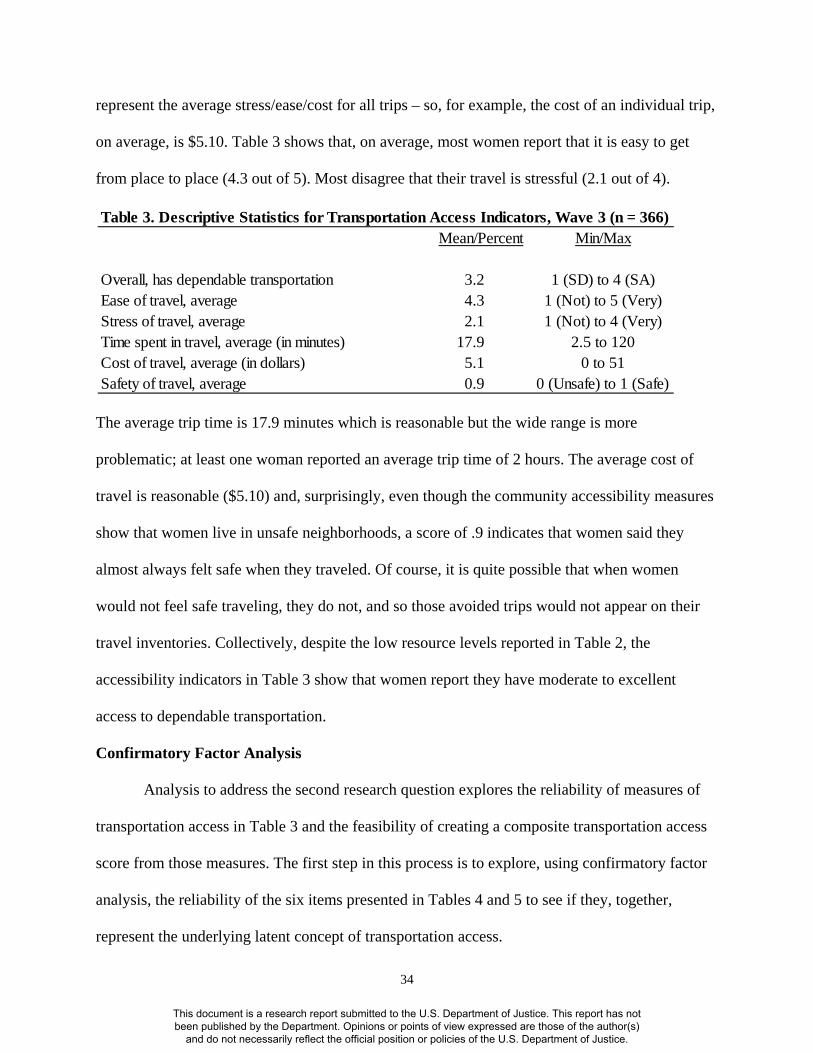
LIST OF TABLES ............................................................................................................. vi LIST OF FIGURES .......................................................................................................... vii CHAPTER 1: INTRODUCTION ........................................................................................1 Statement of the Problem .........................................................................................1 Significance of the Study .........................................................................................3 CHAPTER 2: REVIEW OF THE LITERATURE ..............................................................5 Women Offenders’ Pathways to Crime ...................................................................5 Risk Assessment Tools for Women Offenders ........................................................6 Agency & Structure .................................................................................................8 Purposes, Goals & Objectives ..................................................................................9 CHAPTER 3: RESEARCH METHODOLOGY ...............................................................13 Research Design .....................................................................................................13 Phase I: Available Data and Sample Design for Quantitative Analysis ................13 Quantitative measures ...............................................................................15 Resources hypothesized to predict transportation access .............18 Transportation deprivation ............................................................19 Criminogenic needs .......................................................................19 Recidivism ......................................................................................20 Quantitative data analysis strategy.............................................................22 Missing data ...................................................................................24 Phase II: Data Collection and Sample Design for Qualitative Analysis ................24 Qualitative measures ..................................................................................27 Qualitative data analysis strategy...............................................................28 CHAPTER 4: RESULTS FOR QUANTITATIVE ANALYSIS ......................................31 Descriptive Statistics ..............................................................................................31 Transportation resources ............................................................................31 Transportation access .................................................................................33 Confirmatory Factor Analysis ...............................................................................34
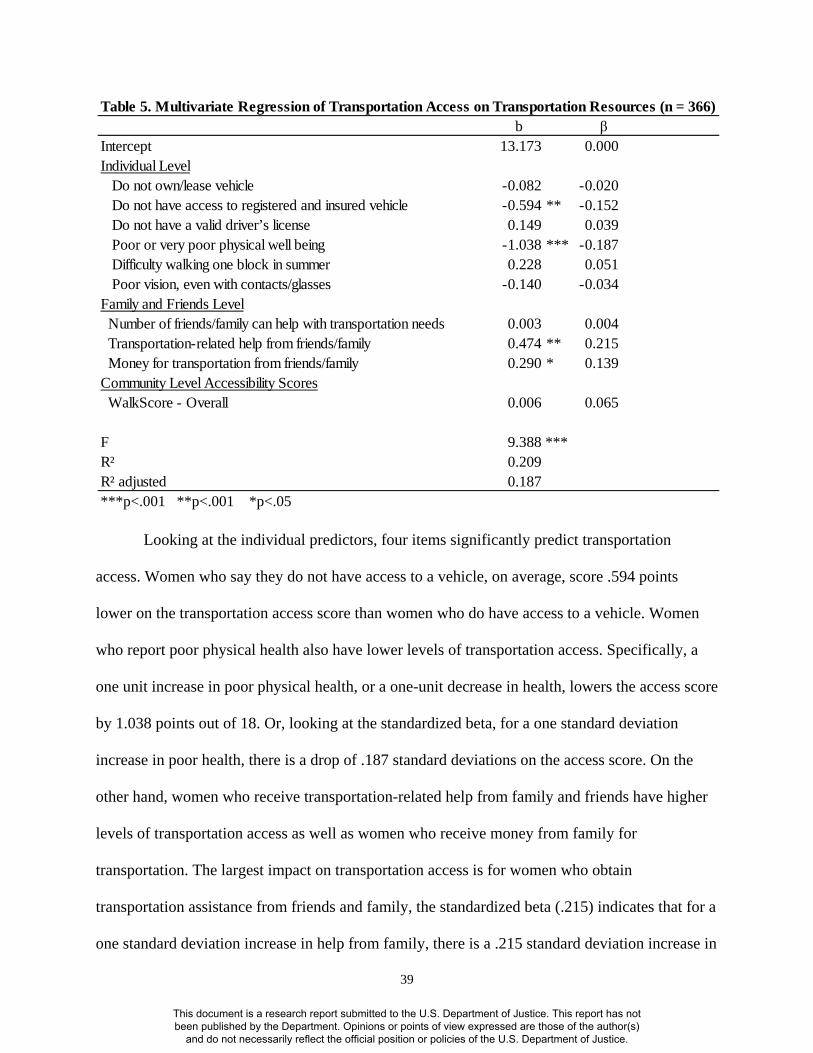
Creation of Composite Transportation Access Score ............................................35 Multivariate Analysis of Transportation Access on Transportation Resources .....38
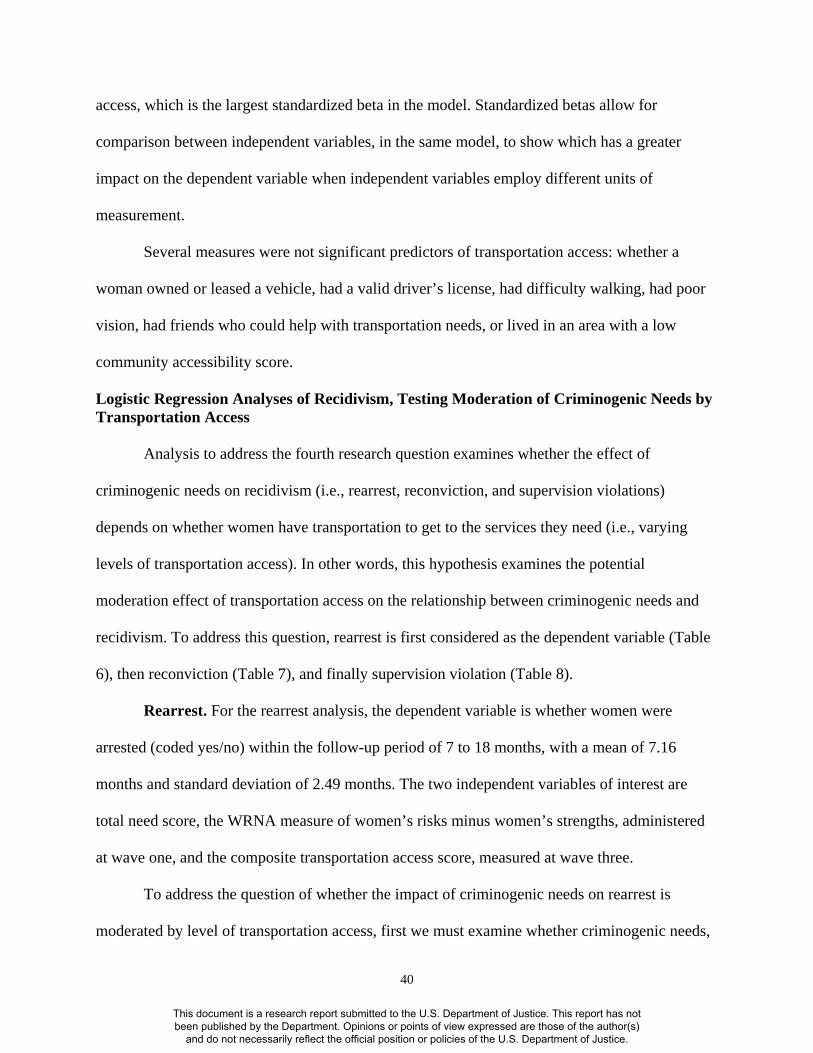
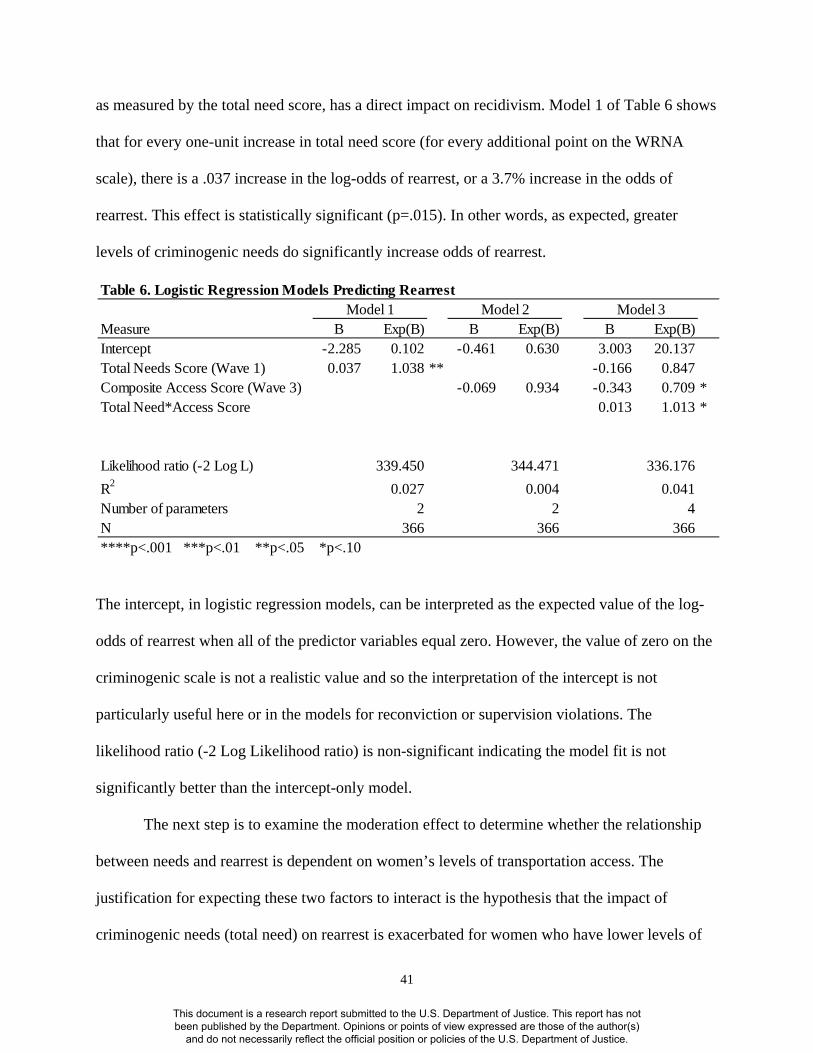
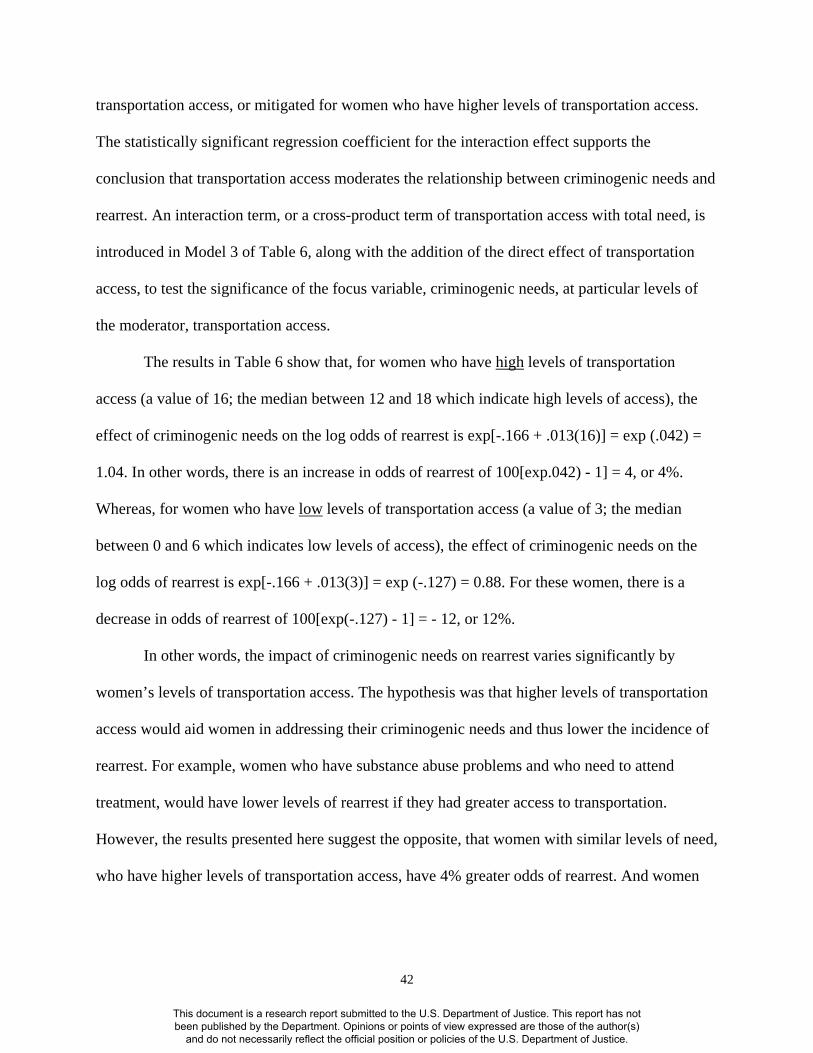
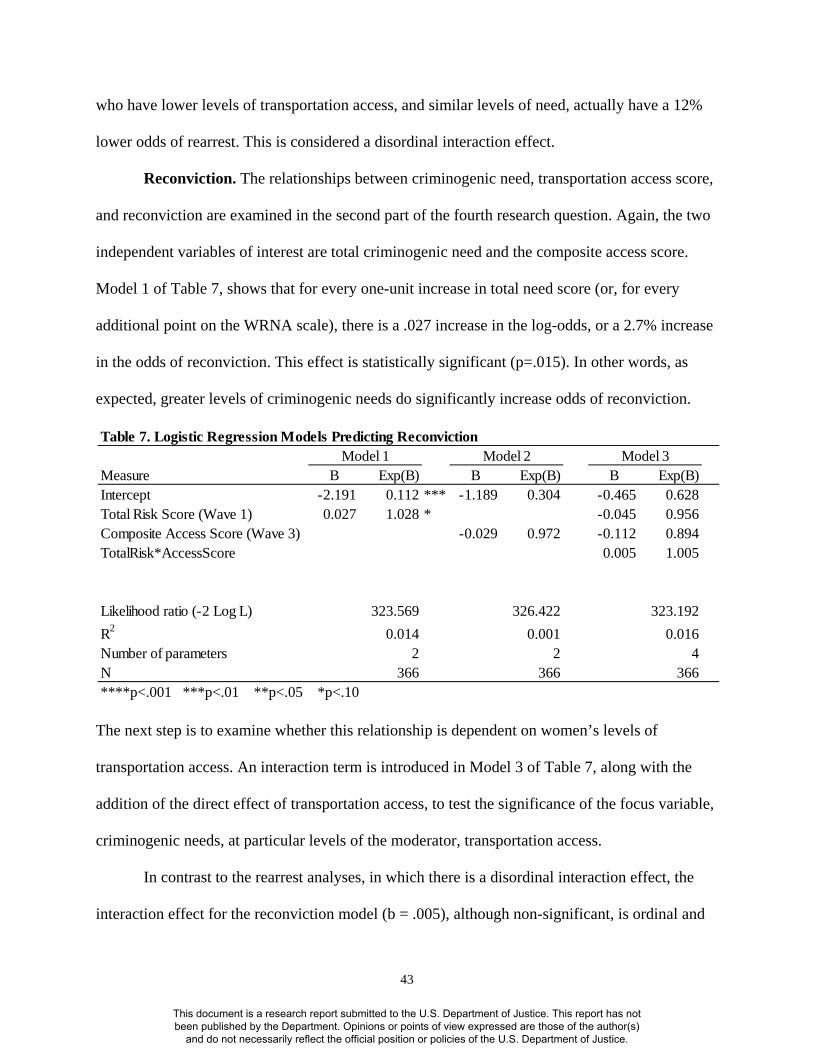
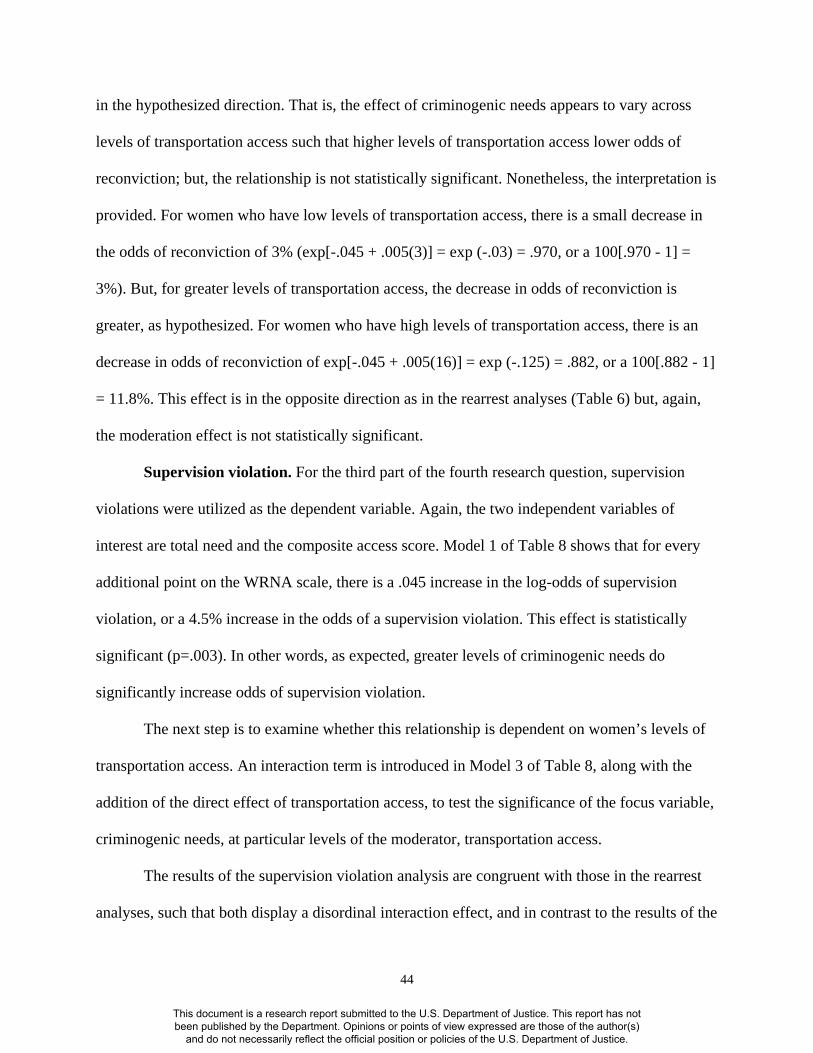
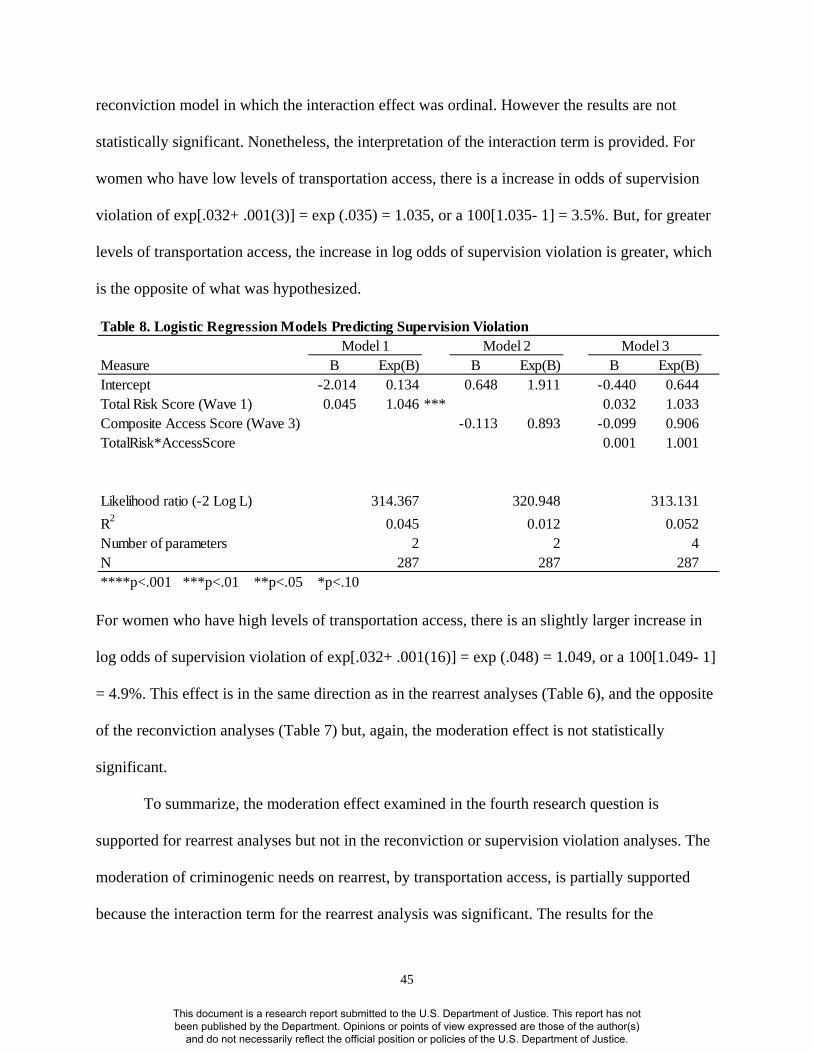
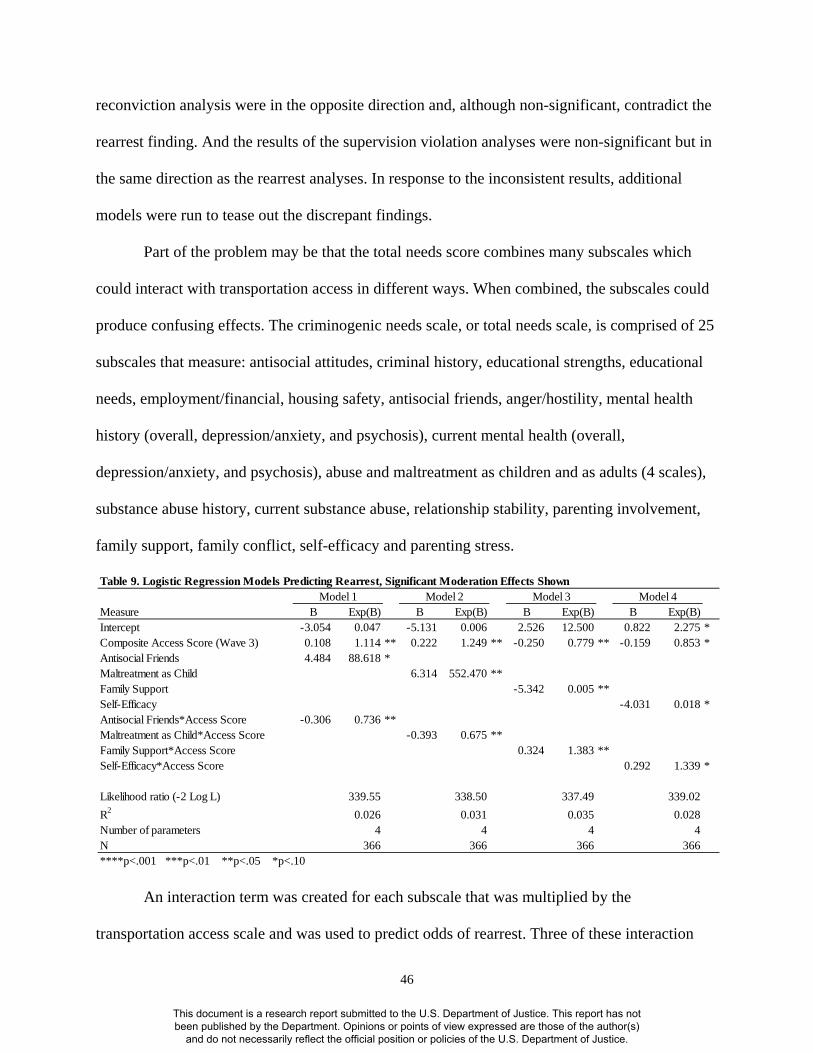
Logistic Regression Analyses of Recidivism, Testing Moderation of Criminogenic Needs by Transportation Access .....................................................40 Rearrest ......................................................................................................40 Reconviction ..............................................................................................43 Supervision violation .................................................................................44 Impact of Transportation Access on Recidivism Outcomes ..................................48 Rearrest ......................................................................................................49 Reconviction ..............................................................................................49
vi
This document is a research report submitted to the U.S. Department of Justice. This report has not been published by the Department. Opinions or points of view expressed are those of the author(s)
and do not necessarily reflect the official position or policies of the U.S. Department of Justice.
Supervision violation .................................................................................49 Survival analysis with Cox Regression......................................................49
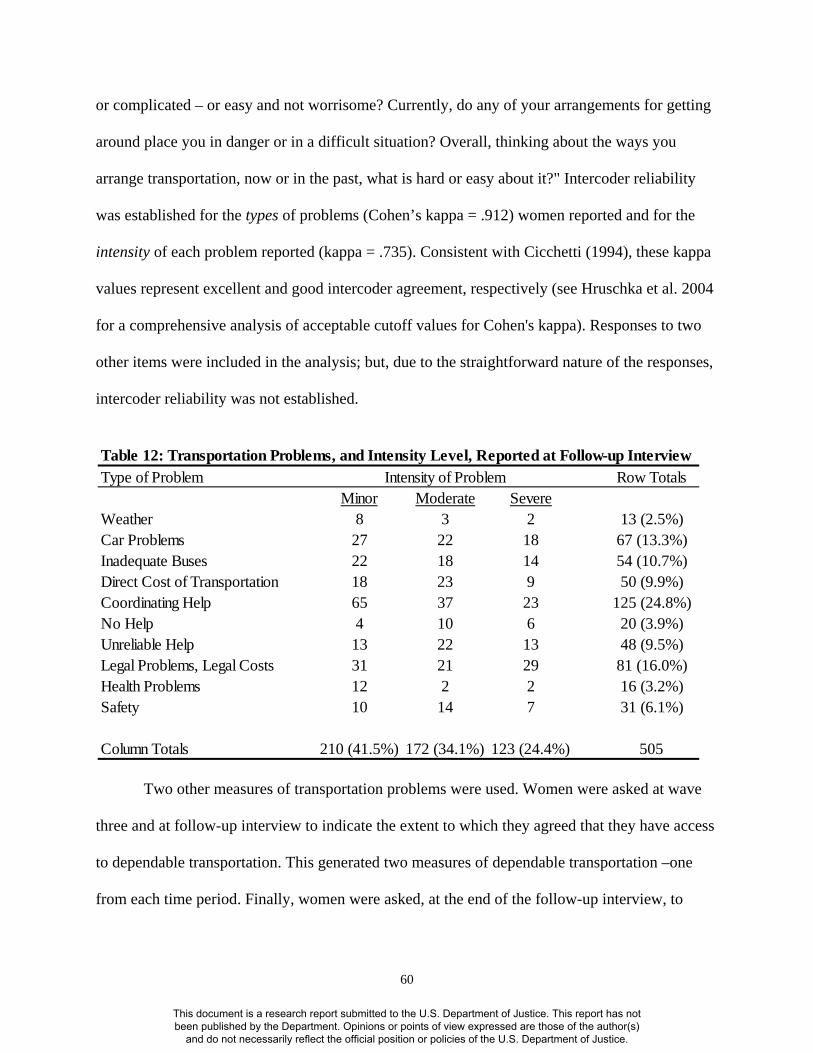
CHAPTER 5: RESULTS FOR QUALITATIVE ANALYSIS ........................................56 Descriptive Statistics ..............................................................................................56 Types, Intensity, and Comparative Importance of Transportation Problems ........58 Analysis of types of transportation problems ............................................61 Analysis of intensity of transportation problems .......................................65 Analysis of comparative importance of transportation problems with other problems ...........................................................................................67 Resources Used to Increase Transportation Access ...............................................68 Strategies Used to Increase Transportation Access ...............................................70 Relationship Between Transportation Access and Recidivism .............................76 CHAPTER 6: DISCUSSION AND CONCLUSION ....................................................... 81 Summary and Discussion .......................................................................................82 Quantitative results ....................................................................................82 Qualitative results ......................................................................................85 Limitations and Recommendations ........................................................................87 Conclusion and Policy Implications ......................................................................90 APPENDICES ...................................................................................................................93 Appendix A
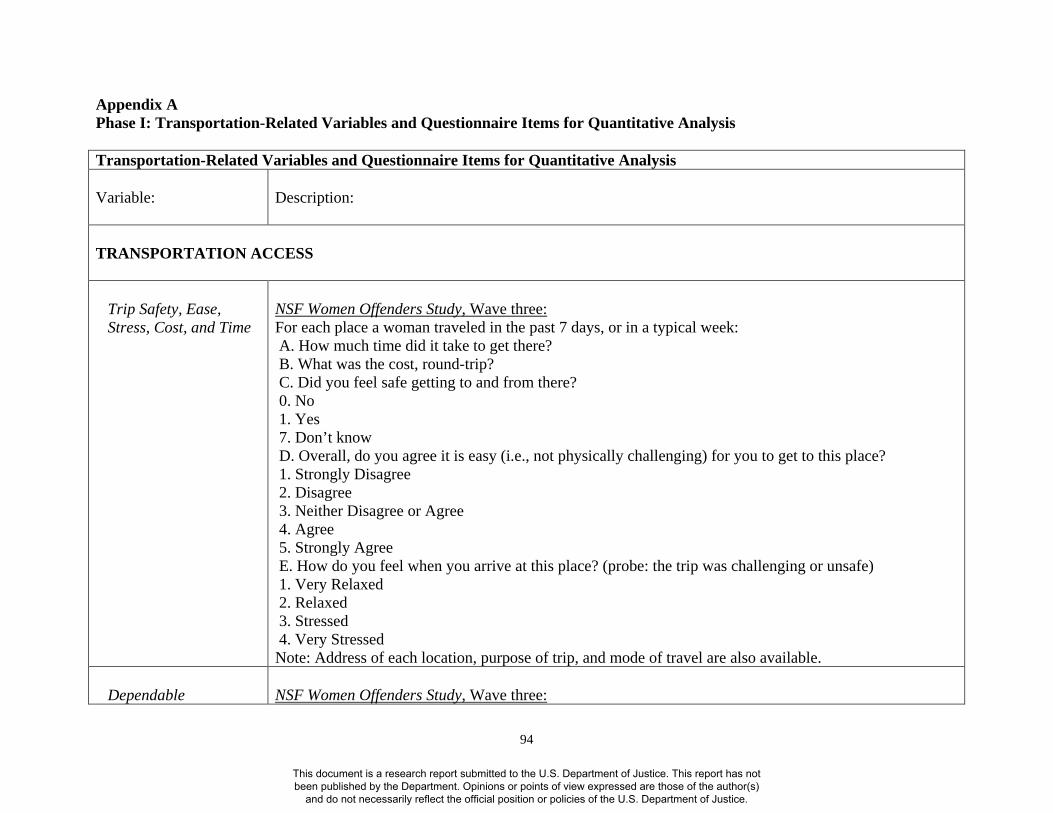
Phase I: Transportation-Related Variables and Questionnaire Items for Quantitative Analysis ............................................................................................ 94 Appendix B Phase II: Follow-Up Transportation Interview Questions for Qualitative Analysis............................................................................................................... 100
This document is a research report submitted to the U.S. Department of Justice. This report has not been published by the Department. Opinions or points of view expressed are those of the author(s)
and do not necessarily reflect the official position or policies of the U.S. Department of Justice.
LIST OF TABLES
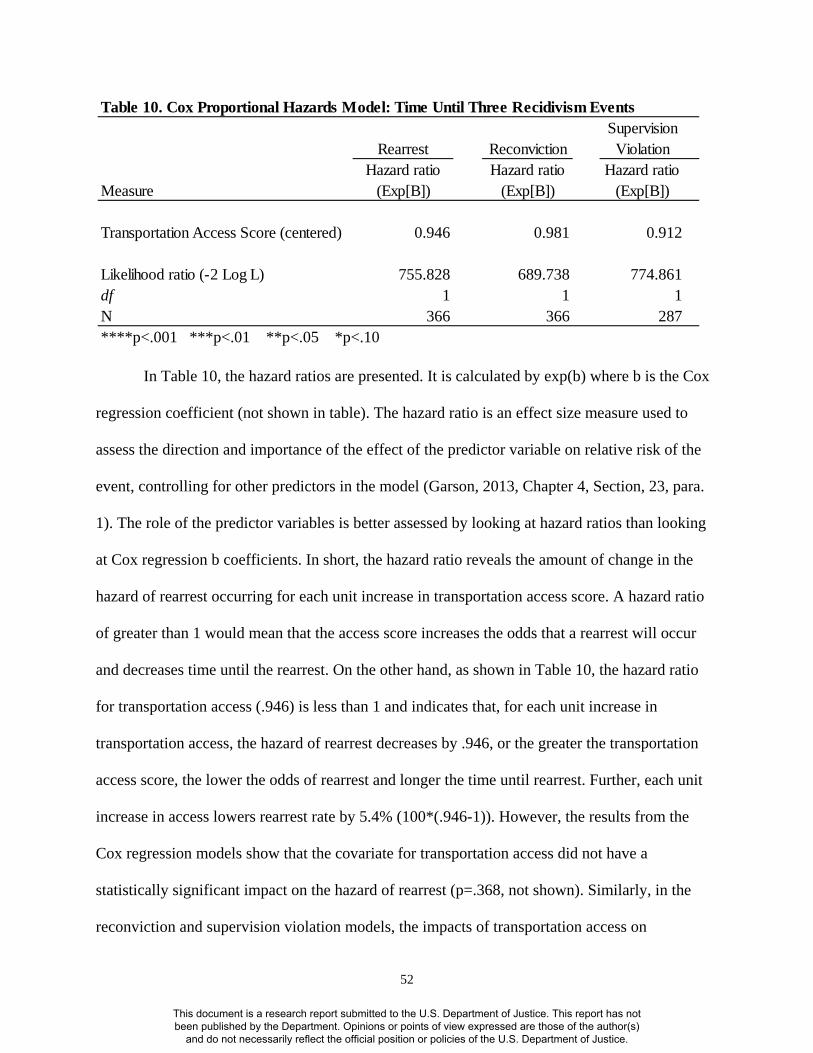
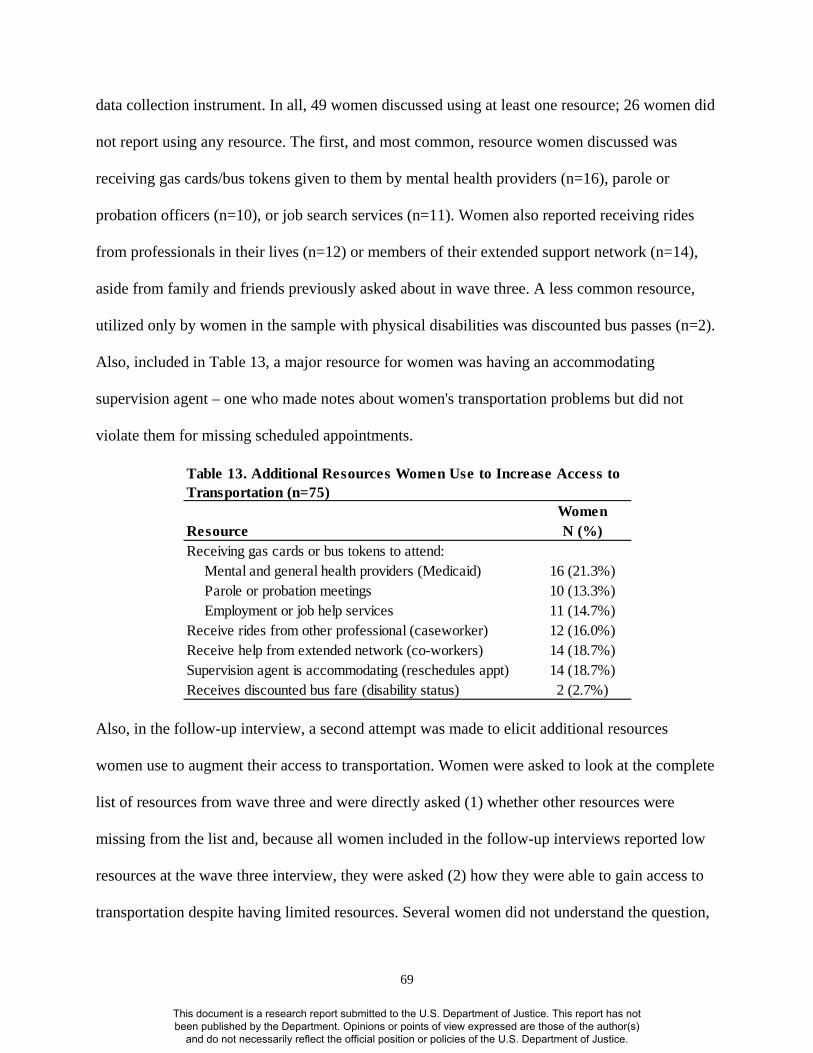
Table 1 Risk Factors & Criminal History for Women on Probation & Parole ............14 Table 2 Descriptive Statistics for Transportation Resources Indicators, Wave 3 (n=366) ..............................................................................................31 Table 3 Descriptive Statistics for Transportation Access Indicators, Wave 3 (n=366) ...........................................................................................................34 Table 4 Composite Access Score Measures ................................................................36 Table 5 Multivariate Regression Transportation Access on Transportation Resources (n=366) ..........................................................................................39 Table 6 Logistic Regression Models Predicting Rearrest ............................................41 Table 7 Logistic Regression Models Predicting Reconviction ....................................43 Table 8 Logistic Regression Models Predicting Supervision Violation ......................45 Table 9 Logistic Regression Models Predicting Rearrest, Significant Moderation Effects Shown .................................................................................................46 Table 10 Cox Proportional Hazards Model: Time Until Three Recidivism Events ......52 Table 11 Transportation Indicators, Comparison of Full Wave Three Sample to Three Subgroups .........................................................................................56 Table 12 Transportation Problems, and Intensity Level, Reported by Women at Follow-up Interview ...................................................................................60 Table 13 Additional Resources Women Use to Increase Access to Transportation (n=75) .............................................................................................................69 Table 14 Strategies Women Use to Increase Access to Transportation ........................71 Table 15 Strategies Women Use to Increase Access that Conflict with the Law ..........75 Table 16 Correlations Between Transportation Access & Recidivism Outcomes ........78
viii
This document is a research report submitted to the U.S. Department of Justice. This report has not been published by the Department. Opinions or points of view expressed are those of the author(s)
and do not necessarily reflect the official position or policies of the U.S. Department of Justice.
LIST OF FIGURES
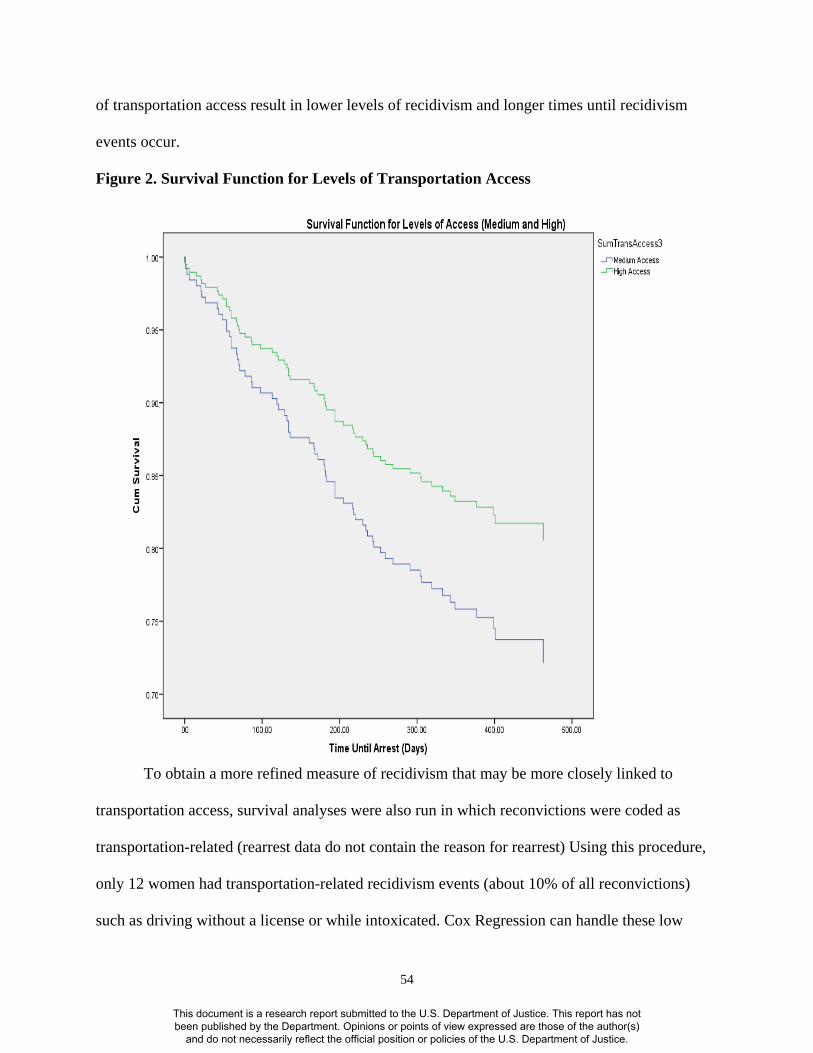
Figure 1 Conceptual Framework for Relationship between Transportation Resources, Access and Recidivism Outcomes, and Sample Measures ..........17 Figure 2 Survival Function for Levels of Transportation Access ................................54
ix
This document is a research report submitted to the U.S. Department of Justice. This report has not been published by the Department. Opinions or points of view expressed are those of the author(s)
and do not necessarily reflect the official position or policies of the U.S. Department of Justice.
CHAPTER 1: INTRODUCTION
Statement of the Problem
As a result of the “war on drugs” and the resulting policing and sentencing policies, the
decades prior to 2009 saw a substantial increase in the number of women in prison and under
community supervision (for a comprehensive review, see Belknap, 2007). In recent years, the
number of women entering the criminal justice system has declined slightly. However, the
number of women on probation or parole nationally, and their recidivism rates, remain quite
high. For example, in a sample of 15 states, approximately 60% of paroled women were
rearrested and 30% returned to prison within three years (Deschenes, Owen, & Crow, 2007).
These findings signal the need for additional research on women who are supervised in the
community (i.e., on probation and parole); better understanding of the barriers they face can lead
to programming that more effectively reduces their rates of recidivism.
Efforts aimed at reducing women’s recidivism must target several known criminogenic
needs: poverty and unemployment, unsafe housing, current depression and anxiety symptoms,
psychosis symptoms, anger/hostility, adult victimization, parental stress, and relationship
Bonta, 2010). Schram, Koons-Witt, Williams, and McShane, (2006) have found that accurate
needs/risks assessment for women on parole are important in placing women into appropriate
programming and preventing women from recidivating. The authors found that unmet needs do
negatively impact offenders’ reintegration into the community. Obtaining these necessary
services may be prevented by a risk factor that is not currently considered in needs/risk
1
This document is a research report submitted to the U.S. Department of Justice. This report has not been published by the Department. Opinions or points of view expressed are those of the author(s)
and do not necessarily reflect the official position or policies of the U.S. Department of Justice.
assessments – lack of access to adequate transportation. Almost no research has focused on
transportation deprivation (i.e., lack of access) in offender populations. Transportation
deprivation may interact with other risk factors, for instance, by making it difficult for women to
attend programming to address anger/hostility or to increase educational assets. Transportation
deprivation also may influence illegal behavior directly (e.g., driving without a license) or
indirectly through noncompliance with supervision requirements (e.g., failure to report to a
scheduled supervision meeting).
Just a few prior studies have identified transportation as a challenge that women parolees
face after release (Baer et al., 2006; Edin & Lein, 1997; Hattery & Smith, 2010; Richie, 2001;
to address women offenders’ needs in ten large metropolitan areas. The authors performed a
content analysis of the programs’ websites to discover the number and types of services were
being offered to women. They found that services were lacking in five key areas: childcare and
parenting services; healthcare and substance abuse counseling; education, employment and job
training; social support, and; housing and transportation. The authors explain that, although
public transportation may be available to women in metro areas, it is not suitable for many. The
authors point out that it may require in excess of four hours of travel per day (Richie, 2001, p.
380), it may not be safe depending on the neighborhoods women must travel through, and the
unreliability of the service decreases women’s ability to meet their needs on a regular basis.
When women’s needs are unmet, which may occur when they lack transportation, they are more
likely to recidivate (Schram et al., 2006).
Apart from the correctional literature, research shows that for a greater proportion of
women than men, transportation deprivation has important consequences for several precursors
2
This document is a research report submitted to the U.S. Department of Justice. This report has not been published by the Department. Opinions or points of view expressed are those of the author(s)
and do not necessarily reflect the official position or policies of the U.S. Department of Justice.
of recidivism. These precursors include unemployment, stress, and lack of medical care
De Bruyn, & Janssens, 2007). Recent research utilizing data from the Department of Housing
and Urban Development found that low-income individuals with cars lived in higher opportunity
neighborhoods characterized by lower poverty rates, higher social status, stronger housing
markets and lower health risks than those without cars (Pendall et al., 2014, p. 2); in large part
because of the inefficiency of public modes of transportation. Access to a car is key to obtaining
and maintaining employment (Blumenberg, 2004; Sandoval, Cervero, & Landis, 2011). For low-
income single mothers, car ownership is an even stronger predictor of gaining and maintaining
employment than education or work experience (Lichtenwalter, Koeske, & Sales, 2006), in part
because access to a reliable car translates to fewer days of missed work (Lambert, 1998). Further,
transportation problems can lead to increased levels of stress (Cox, Griffiths, & Rial-Gonzalez,
2000; Gottholmseder, Nowotny, Pruckner, & Theurl, 2009; Jacobson et al., 1996) which may
contribute to mental health problems, reduced labor productivity, lower employee performance,
and absenteeism. On the other hand, high transportation access can minimize social isolation,
increase access to health and social programs, and improve access to medical services
(Cvitkovich & Wister, 2001). Although overlooked in correctional research, transportation is
likely to be an important influence in the lives of women on probation and parole.
Significance of the Study
The study addresses four gaps in existing research. First, it focuses on women offenders,
a group that has not received adequate research attention. Second, it uses available survey data to
discover actual levels of transportation deprivation, which is currently unknown. Third, it
investigates the strategies women with transportation deprivation use to increase their level of
3
This document is a research report submitted to the U.S. Department of Justice. This report has not been published by the Department. Opinions or points of view expressed are those of the author(s)
and do not necessarily reflect the official position or policies of the U.S. Department of Justice.
transportation access. Fourth, and finally, it assesses how transportation deprivation is related to
recidivism.
4
This document is a research report submitted to the U.S. Department of Justice. This report has not been published by the Department. Opinions or points of view expressed are those of the author(s)
and do not necessarily reflect the official position or policies of the U.S. Department of Justice.
CHAPTER 2: REVIEW OF THE LITERATURE
Women Offenders’ Pathways to Crime
Research indicates that women offenders are different than men in the pathways they take
For example, women differ in the types of crimes they commit, the reasons they commit crimes,
and in their treatment by the criminal justice system after they have committed crimes.
Researchers using the feminist pathways model unmask these gender differences by asking girls
and women to discuss their lives and the milestone events that shaped the trajectory of their
lives; it usually involves retrospective, quasi-longitudinal research strategies. This type of
research is consistent with, and largely grew out of, life course and cycle of violence theories
(Widom, 2000). Research utilizing this approach consistently suggests the need to understand the
role of victimization, such as childhood and adulthood traumas, as precursors to women’s
offending (Belknap, 2007, p. 79; Chesney-Lind & Pasko, 2004; Richie, 2001; Salisbury, Van
Voorhis, & Spiropoulis, 2009; Widom, 2000). Widom (2000) reports that abused and neglected
girls are nearly twice as likely to be arrested as juveniles, twice as likely to be arrested as adults,
and 2.4 times as likely to be arrested for a violent crime (Widom, 2000, pp. 29–33) than males.
Other studies have found that girls with histories of abuse and family problems are more likely to
drink and use drugs, run away from home, and drop out of school (Chesney-Lind & Pasko, 2004,
pp. 107–111) than males. Collectively, research on women’s unique pathways to crime has found
the following needs lead to criminal behavior: low self-esteem and self-efficacy, parental stress,
victimization and abuse, relationship dysfunction, mental health problems (especially
depression), poverty and homelessness, and substance abuse (Van Voorhis, 2012). Women
offenders’ pathways to crime may indicate transportation is particularly important to their
5
This document is a research report submitted to the U.S. Department of Justice. This report has not been published by the Department. Opinions or points of view expressed are those of the author(s)
and do not necessarily reflect the official position or policies of the U.S. Department of Justice.
recovery, for example, by bridging their needs for substance abuse treatment and receipt of those
services. Further, whether women’s use of transportation may present a unique pathway into
crime via increased rates of transportation-related offenses, compared to male offenders.
Risk Assessment Tools for Women Offenders
The dominant tool for risk and needs assessment among female offenders, the Level of
Service Inventory – Revised (LSI-R), was developed by Don Andrews and James Bonta based
on research on male offenders (Andrews et al., 1990; Andrews & Bonta, 2010). Risk assessments
are used to predict the likelihood an offender will recidivate (i.e., be arrested or convicted of
additional crimes) and usually rely extensively on criminal history profiles. Needs instruments,
on the other hand, assess individuals’ educational level, employment skills, and physical and
mental health and are used to refer offenders to correctional and supervision services. In
developing their instrument, Andrews and Bonta found that, in order to reduce recidivism,
treatment programs must be appropriately matched to offenders in terms of level of
programming (intensive programming for high-risk offenders) and type of need (most serious
criminogenic needs must be addressed).
Andrews and Bonta discovered that, for men, there were four main ‘risk factors’ that
should be addressed in correctional programming: antisocial attitudes, peers, personality, and
criminal history. Subsequent studies, however, have found that these are not the dominant risk
factors for women (Van Voorhis, 2012; Wright, Salisbury, & Van Voorhis, 2007).
Because the guiding principle of the Risk-Need-Responsivity model of corrections and the
related use of the LSI-R, is that services should be matched to offender’s needs, the LSI-R is not
well suited for use with women.
6
This document is a research report submitted to the U.S. Department of Justice. This report has not been published by the Department. Opinions or points of view expressed are those of the author(s)
and do not necessarily reflect the official position or policies of the U.S. Department of Justice.
Yet, currently, most states administer the LSI-R to women offenders even though they
have not taken the proper steps (e.g., validation) to ensure it can be effectively used on a sample
of women (Wright et al., 2007). Research examining this practice has found that the LSI-R
overclassifies women (Wright et al., 2007); specifically, it suggests placement for women into
higher levels of custody than their behavior warrants. This violates the risk principle outlined by
the creators of the LSI-R. Recall this principle states that, in order to reduce future criminal
behavior, offenders must receive appropriate levels of treatment (i.e., intensive treatment if
administered to low-risk women could actually do harm). Further, this research has found that
the LSI-R ignores needs specific to women such as relationships, mental health problems,
parenting and childcare issues, abuse and victimization, self-esteem and self-efficacy (Presser &
Van Voorhis, 2002).
Pat Van Voorhis and colleagues recognized that the standard method of evaluating
women’s risk levels and corresponding needs required improvement (Hardyman & Van Voorhis,
2004; Presser & Van Voorhis, 2002; Salisbury et al., 2009; Van Voorhis, Salisbury, Wright, &
Baumann, 2008; Van Voorhis, 2012; Wright et al., 2007). In response, Wright, Van Voorhis,
Bauman and Salisbury (2007) spent several years addressing the limitations of the LSI-R and
creating a new, women-specific, gender-responsive, needs assessment: the Women’s Risks and
Needs Assessment (WRNA). They first validated the LSI-R among women offenders, then
developed an add-on instrument to the LSI-R that included scales relevant to parenting, abuse,
relationship issues, self-esteem and self-efficacy. Finally, as part of the NIC Gender-Responsive
Assessment Project, they carried out a national study designed to develop risks/needs
assessments specifically for women offenders. The result of these efforts is a gender appropriate
instrument designed to target women’s special needs. The authors have found that the predictors
7
This document is a research report submitted to the U.S. Department of Justice. This report has not been published by the Department. Opinions or points of view expressed are those of the author(s)
and do not necessarily reflect the official position or policies of the U.S. Department of Justice.
of women’s recidivism include these criminogenic needs: poverty and unemployment, unsafe
housing, current depression and anxiety symptoms, psychosis symptoms, anger/hostility, adult
victimization, parental stress, and relationship dysfunction. However, one need not yet examined
in these assessment tools is transportation access.
Agency & Structure
Similar to the necessity for a risk/needs assessment tool tailored to women’s specific
needs, research techniques aimed at understanding women offenders must also be appropriately
designed to consider women’s agency. Quantitative methods that employ closed-ended responses
can often mask women’s agency. Agency is nicely summarized as, ‘The capacity to act in a self-
directed and purposeful way” (Morash, 2010, p. 4). Women offenders are often portrayed as
passive victims who have had things happen to them: they were abused as children; they lacked
economic resources to obtain job skills and, as a result, turned to drug use or criminal behavior.
This characterization masks women’s agency and conceals that women not only have things
happen to them but also have capacity to make decisions that shape their lives. Although it is true
that women’s agency and choices are constrained by structures and forces beyond their control,
such as patriarchal gender roles and capitalism, research shows that women still exercise a
considerable amount of agency. For example, research on substance-abusing women on
probation and parole found that, despite “biological, personal and social experiences associated
with addiction and dependence” women still exercised agency by choosing to stay away from
people who break the law or do drugs (Morash, 2010, pp. 31, 111). In the context of
transportation, women exercise agency when they innovate strategies to increase their level of
access, despite the structural constraints of poor public transportation services they experience.
8
This document is a research report submitted to the U.S. Department of Justice. This report has not been published by the Department. Opinions or points of view expressed are those of the author(s)
and do not necessarily reflect the official position or policies of the U.S. Department of Justice.
Qualitative methods have the ability to reveal women’s agency. For instance, Susan
Batchelor (2005) conducted in-depth oral-history interviews with 21 young women convicted of
violent offenses. The women spoke of constraints on their agency such as being mistreated by
friends or family (Batchelor, 2005, p. 366). However, what emerges from the interviews are the
examples of agentic women who are empowered, in charge of their lives, in control of their fate,
and deserving of respect. One woman says, “You can’t rely on other people. You’ve only got
[yourself] (2005, p. 369).” Another young woman explains the importance of being seen as
powerful and in charge, stating that “If you let people walk all over you, people will and people
do…If you hit them back, then they usually stop (2005, p. 369).” Batchelor recommends that
positive change in women’s lives may be optimized when correctional practitioners maximize
women’s agency by increasing their involvement in programming so they feel that they are
valued and respected partners in their own treatment.
Qualitative methodologies are appropriately suited to exploring women’s strategies for
coping with transportation deprivation and the agency they exercise. For example, the research
may reveal that women use effective strategies for making transportation arrangements, despite
not having access to automobiles or money to pay for public transit.
Purposes, Goals & Objectives
The broad purpose of this study – to explore transportation deprivation in a sample of
women offenders – grew out of work being performed as a research assistant on a three-wave
NSF-funded study of 402 women on probation and parole (referred to as the NSF Women
Offenders Study hereafter). Arranging face-to-face interviews for women in this study provided
early indications that transportation access was a problem for these women. The initial research
plan involved scheduling interviews to coincide with women’s parole/probation reporting days;
9
This document is a research report submitted to the U.S. Department of Justice. This report has not been published by the Department. Opinions or points of view expressed are those of the author(s)
and do not necessarily reflect the official position or policies of the U.S. Department of Justice.
the assumption being that these would be the best days for women because they would already
have made transportation arrangements to get to parole or probation offices and presumably had
openings in their schedules. However, it became apparent that even getting to agents’ offices was
challenging for women. Several women reported that their rides would not wait the two hours
needed to complete the interview. One agent in a rural area required that her financially-stressed
clients, who lacked transportation, receive vouchers for the on-call bus service to avoid
additional hardship in getting to the interview. These experiences led to scheduling interviews
near women’s homes or offering transportation funds to decrease no-shows and increase the
participation rate.
Other interactions with supervision agents (parole or probation officers) revealed that
many may be unaware of the transportation problems facing women and, as a result, could be
penalizing women for transportation deficits. For example, preliminary data analysis conducted
on a partial data set before the dissertation research began, suggested that agents’ lack of
awareness may be problematic for women. One woman in the study was required to attend AA
meetings but, at the time, did not have car insurance and her probation agent simply advised her
to, “Go to find a way.” Without help or understanding from the supervision agent, they women
knew that she must attend AA and that the penalty for failure would likely be a supervision
violation. Another woman in the study explained that, “it’s discouraging when [agents] tell you,
‘You have to get there regardless, or you’re gonna to end up back in prison.’”
A corrections practitioner who develops programs and policies for corrections agencies
explained that, in response to callous responses of agents, she recently “conducted a client
sensitivity training that required staff to travel using public transit to make appointments…and
complete the day’s schedule of a client. Staff persons reported errors in scheduling of the
10
This document is a research report submitted to the U.S. Department of Justice. This report has not been published by the Department. Opinions or points of view expressed are those of the author(s)
and do not necessarily reflect the official position or policies of the U.S. Department of Justice.
buses…missing transfers and enduring long wait times” (Personal Correspondence with Lusanne
Green, International Community Corrections Association). This comment indicates that
probation and parole agents may be unaware of the issues women face with regards to
transportation and suggests a transportation access assessment tool may assist them to address
women’s needs. The lack of awareness and understanding about transportation deprivation may
also result in the imposition of violations or other sanctions when women’s transportation
arrangements are unreliable. Adequate training for agents and assessment of women’s
transportation needs, however, may improve women’s transportation situations. As a result of
this new knowledge, the key transportation-related predictors for the dissertation were developed
and collected as part of the wave three interview.
The specific design and goals of the research project were developed. The research
project was a mixed-methods study of transportation deprivation and its effects on recidivism
using existing quantitative data for a sample of 402 women on probation and parole. The goals
for the quantitative analysis of available wave three data were to (1) describe the extent and
distribution of transportation access of women offenders, (2) examine the reliability of selected
measures of transportation access and the feasibility of creating a composite access score, (3)
show how well resources (e.g., family support, individual mobility) predict transportation access,
(4) show whether transportation access moderates the association of criminogenic needs with
recidivism, and (5) show the degree to which transportation access adds to the prediction of
recidivism outcomes. The outcomes of interest were supervision violations, new arrests and
convictions (i.e., rearrest and reconviction data), and transportation-related illegal activity (e.g.,
driving without a valid license).
The quantitative data allowed for identification of statistical associations involving
11
This document is a research report submitted to the U.S. Department of Justice. This report has not been published by the Department. Opinions or points of view expressed are those of the author(s)
and do not necessarily reflect the official position or policies of the U.S. Department of Justice.
transportation resources and access, but were limited in their ability to explain the presence, or
absence, of associations. For example, the available quantitative data did not explain why a
woman without her own car and no alternative transportation (i.e., she had low resources) reports
no difficulty getting to necessary appointments (i.e., she reported that she had high access).
Therefore, the research project also integrated qualitative follow-up interview data from a
subsample of the women (n=75). The goal for the qualitative component of the research was to
capture women’s insights, experiences, and strategies regarding transportation resources and
access and to show whether transportation deprivation contributed to failure to attend needed or
required programs (e.g., substance abuse treatment). Specifically, the qualitative analysis
increased understanding of (1) the types and intensity of transportation problems women
experienced while under supervision, (2) their use of additional resources, not captured by
quantitative measures, that increased their transportation access, (3) strategies women used to
increase transportation access and whether these strategies brought women into conflict with the
law (e.g., driving without a license or riding with a friend who has a felony conviction) and (4)
the contribution of transportation problems to any violations or new offenses.
Findings of this research are expected to inform the development of a useful measure of
transportation access that combines knowledge gained from both quantitative and qualitative
methodologies.
12
This document is a research report submitted to the U.S. Department of Justice. This report has not been published by the Department. Opinions or points of view expressed are those of the author(s)
and do not necessarily reflect the official position or policies of the U.S. Department of Justice.
CHAPTER 3: RESEARCH METHODOLOGY
Research Design
The project used a mixed-methods sequential explanatory design (Creswell, 2008;
Ivankova, Creswell, & Stick, 2006). Consistent with this design, in Phase I, the quantitative data
from the NSF Women Offenders Study, an available dataset, was analyzed first. This analysis
addressed several research questions, raised several others, and provided the basis for selecting
potential participants for the Phase II qualitative data collection. The responses provided by
women interviewed in Phase II were analyzed to allow for interpretation of, explanation of, and
additions to the quantitative results.
Phase I: Available Data and Sample Design for Quantitative Analysis
The sample for the quantitative data analysis included 402 drug-involved women on
probation or parole who were convicted of a felony offense. The rationale was to study drug-
involved women because they account for the most common subgroup of women offenders
(Harer & Langan, 2001; Morash, 2010; Peters, Strozier, Murrin, & Kearns, 1997), and, as such
represent the typical female offender. The sample was recruited beginning in fall 2011 by first
selecting 16 counties located within a ninety-minute drive from the research office. These
counties encompass 68.5 percent of the 2011 state population, all major population centers (e.g.,
Detroit, Grand Rapids), and a mix of rural and suburban areas.
In these 16 counties, 73 parole and probation agents were recruited. Michigan is
innovative in that it is already taking strides to address the unique needs of women offenders by
offering women-only supervision caseloads for agents. Of the 73 recruited, 71 were female and
two were male. Parole agents were oversampled in relation to probation agents, to increase
parolees to 25 percent of the total sample. Then, approximately eight clients were recruited from
13
This document is a research report submitted to the U.S. Department of Justice. This report has not been published by the Department. Opinions or points of view expressed are those of the author(s)
and do not necessarily reflect the official position or policies of the U.S. Department of Justice.
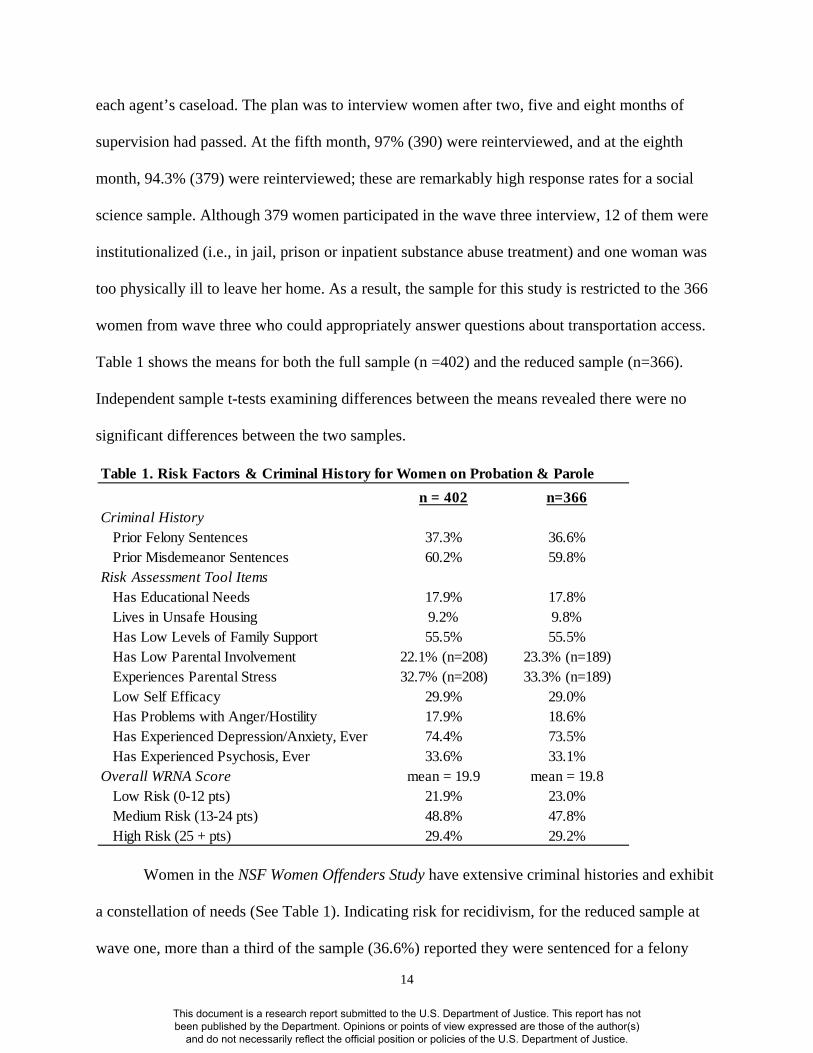
each agent’s caseload. The plan was to interview women after two, five and eight months of
supervision had passed. At the fifth month, 97% (390) were reinterviewed, and at the eighth
month, 94.3% (379) were reinterviewed; these are remarkably high response rates for a social
science sample. Although 379 women participated in the wave three interview, 12 of them were
institutionalized (i.e., in jail, prison or inpatient substance abuse treatment) and one woman was
too physically ill to leave her home. As a result, the sample for this study is restricted to the 366
women from wave three who could appropriately answer questions about transportation access.
Table 1 shows the means for both the full sample (n =402) and the reduced sample (n=366).
Independent sample t-tests examining differences between the means revealed there were no
significant differences between the two samples.
Women in the NSF Women Offenders Study have extensive criminal histories and exhibit
a constellation of needs (See Table 1). Indicating risk for recidivism, for the reduced sample at
wave one, more than a third of the sample (36.6%) reported they were sentenced for a felony
Table 1. Risk Factors & Criminal History for Women on Probation & Parolen = 402 n=366
Criminal History Prior Felony Sentences 37.3% 36.6% Prior Misdemeanor Sentences 60.2% 59.8%Risk Assessment Tool Items Has Educational Needs 17.9% 17.8% Lives in Unsafe Housing 9.2% 9.8% Has Low Levels of Family Support 55.5% 55.5% Has Low Parental Involvement 22.1% (n=208) 23.3% (n=189) Experiences Parental Stress 32.7% (n=208) 33.3% (n=189) Low Self Efficacy 29.9% 29.0% Has Problems with Anger/Hostility 17.9% 18.6% Has Experienced Depression/Anxiety, Ever 74.4% 73.5% Has Experienced Psychosis, Ever 33.6% 33.1%Overall WRNA Score mean = 19.9 mean = 19.8 Low Risk (0-12 pts) 21.9% 23.0% Medium Risk (13-24 pts) 48.8% 47.8% High Risk (25 + pts) 29.4% 29.2%
14
This document is a research report submitted to the U.S. Department of Justice. This report has not been published by the Department. Opinions or points of view expressed are those of the author(s)
and do not necessarily reflect the official position or policies of the U.S. Department of Justice.
conviction besides the one for which they were currently on probation or parole and 59.8% of the
sample had been sentenced for misdemeanor crimes. The gender-specific needs assessment tool,
Women’s Risk/Needs Assessment: Probation/Parole Interview (Van Voorhis et al., 2008),
administered in wave one indicates that sizeable proportions of women should receive assistance
in the areas of education (17.8%), housing safety (9.8%), family support (55.5%), parenting
and clinical psychosis (33.1%). Prior research shows that these needs predict recidivism
(Hardyman & Van Voorhis, 2004; Salisbury et al., 2009; Van Voorhis et al., 2008). The risk
instrument also indicates women’s overall level of need. A substantial portion of women are high
risk (23.0%) and the mean score (19.8) indicates that a considerable number of women are very
close to the cut-off value for being high risk (25).
Addressing and treating criminogenic needs often requires that women travel to receive
treatment or services. Yet, the majority of the women earn less than $10,000 per year (80.9%).
An income of $10,000 per year breaks down to $192 per week. Experts predict expenditures in
excess of 15-20% of one’s income present financial hardship (Litman, 2011). This translates to
$28.80 - $38 per week which may cover gas or bus fare but is unlikely to pay for car insurance,
vehicle registration, a driver’s license, and car repairs. Thus, there was a reasonable expectation
that women offenders lacked resources needed to get to and from treatment or services.
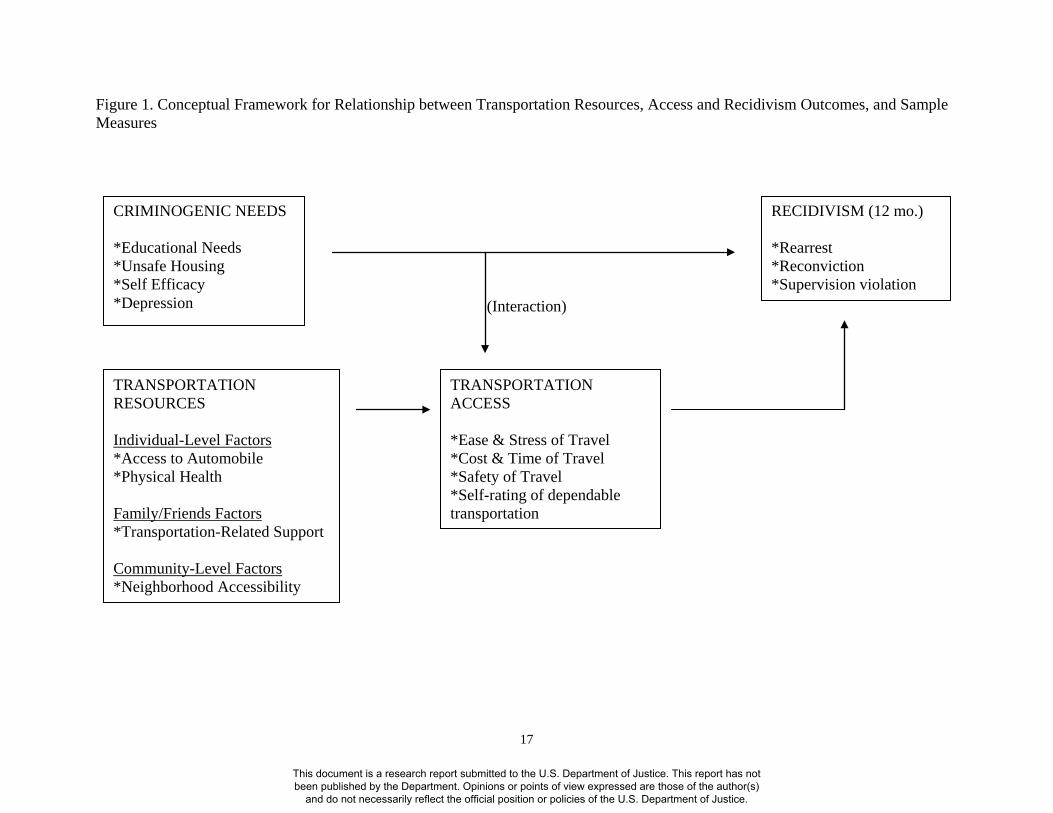
Quantitative measures. Figure 1 depicts the Phase I quantitative data used for the
dissertation research. Those data contained quantitative measures of (1) individual,
family/friends, and community levels of resources for getting from place to place, (2)
transportation access, (3) supervision agents’ reports and official records of compliance with
supervision requirements and of rearrests and reconvictions, and (4) criminogenic needs known
15
This document is a research report submitted to the U.S. Department of Justice. This report has not been published by the Department. Opinions or points of view expressed are those of the author(s)
and do not necessarily reflect the official position or policies of the U.S. Department of Justice.
to predict women’s recidivism. Measures of transportation resources and access were added to
the third wave of the study specifically for the dissertation and the criminogenic needs and
recidivism measures were already available in the NSF Women Offenders Study. The
hypothesized relationships between these measures, and examples of each measure, are
illustrated in Figure 1. It is hypothesized that transportation resources influence women’s access
to transportation. Transportation access is believed to impact recidivism events. And, the
relationship between criminogenic needs and recidivism is hypothesized to be moderated by
access to transportation such that the impact of criminogenic needs on recidivism may be
attenuated, or amplified, by variation in access to transportation.
16
This document is a research report submitted to the U.S. Department of Justice. This report has not been published by the Department. Opinions or points of view expressed are those of the author(s)
and do not necessarily reflect the official position or policies of the U.S. Department of Justice.
Figure 1. Conceptual Framework for Relationship between Transportation Resources, Access and Recidivism Outcomes, and Sample Measures (Interaction)
TRANSPORTATION ACCESS *Ease & Stress of Travel *Cost & Time of Travel *Safety of Travel *Self-rating of dependable transportation
TRANSPORTATION RESOURCES Individual-Level Factors *Access to Automobile *Physical Health Family/Friends Factors *Transportation-Related Support Community-Level Factors *Neighborhood Accessibility
17
This document is a research report submitted to the U.S. Department of Justice. This report has not been published by the Department. Opinions or points of view expressed are those of the author(s)
and do not necessarily reflect the official position or policies of the U.S. Department of Justice.
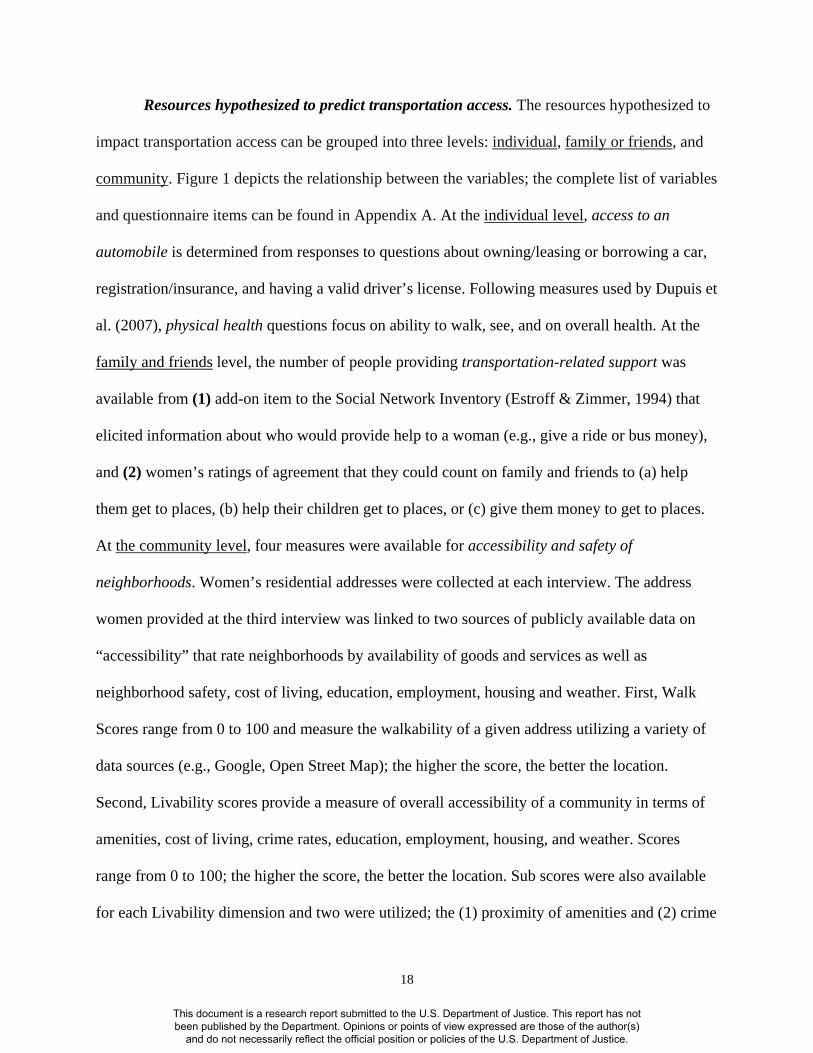
Resources hypothesized to predict transportation access. The resources hypothesized to
impact transportation access can be grouped into three levels: individual, family or friends, and
community. Figure 1 depicts the relationship between the variables; the complete list of variables
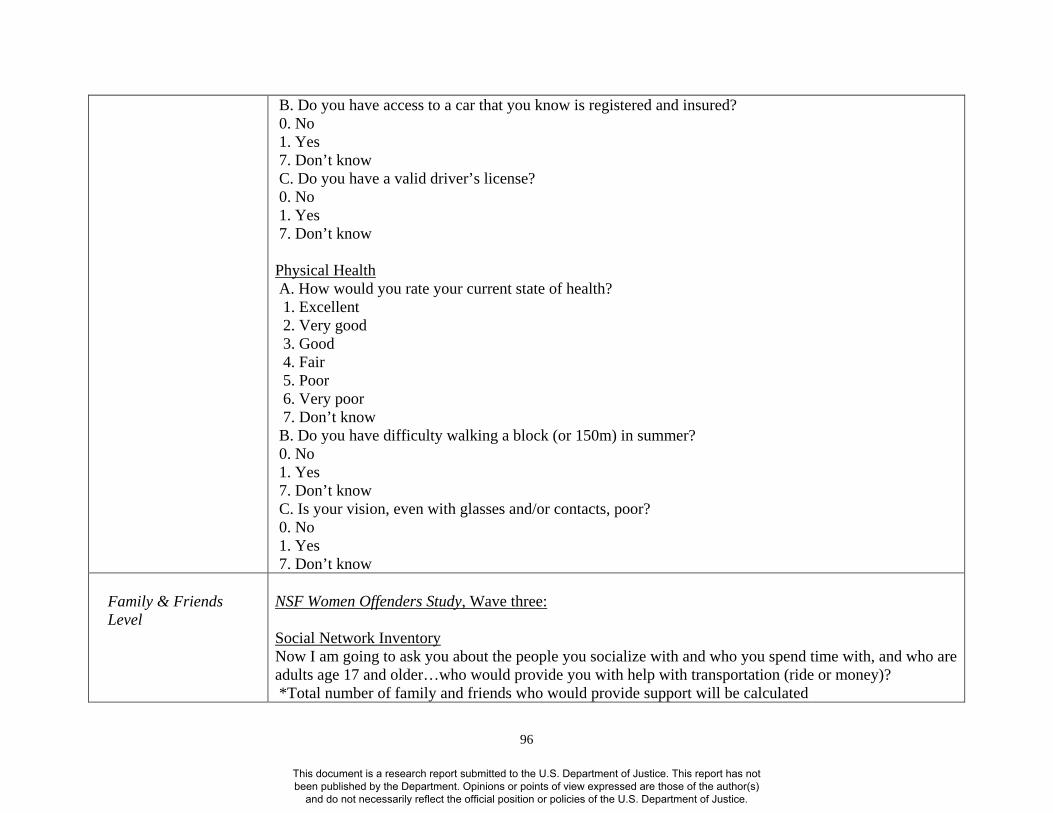
and questionnaire items can be found in Appendix A. At the individual level, access to an
automobile is determined from responses to questions about owning/leasing or borrowing a car,
registration/insurance, and having a valid driver’s license. Following measures used by Dupuis et
al. (2007), physical health questions focus on ability to walk, see, and on overall health. At the
family and friends level, the number of people providing transportation-related support was
available from (1) add-on item to the Social Network Inventory (Estroff & Zimmer, 1994) that
elicited information about who would provide help to a woman (e.g., give a ride or bus money),
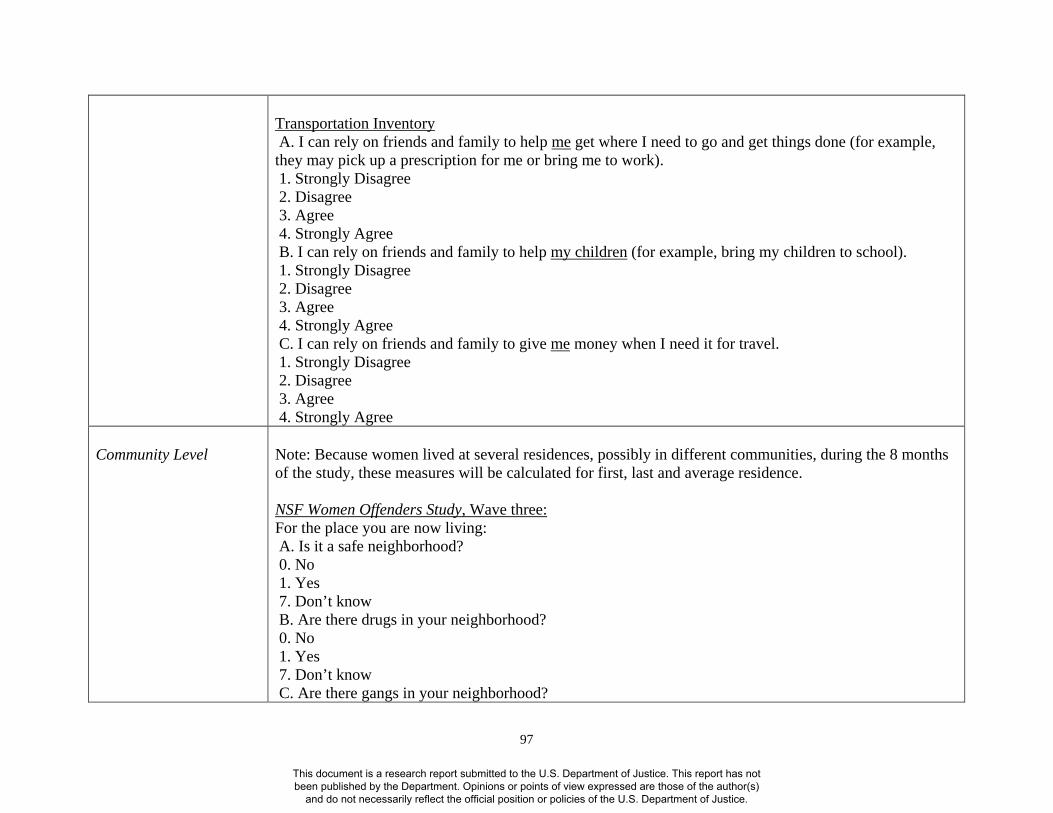
and (2) women’s ratings of agreement that they could count on family and friends to (a) help
them get to places, (b) help their children get to places, or (c) give them money to get to places.
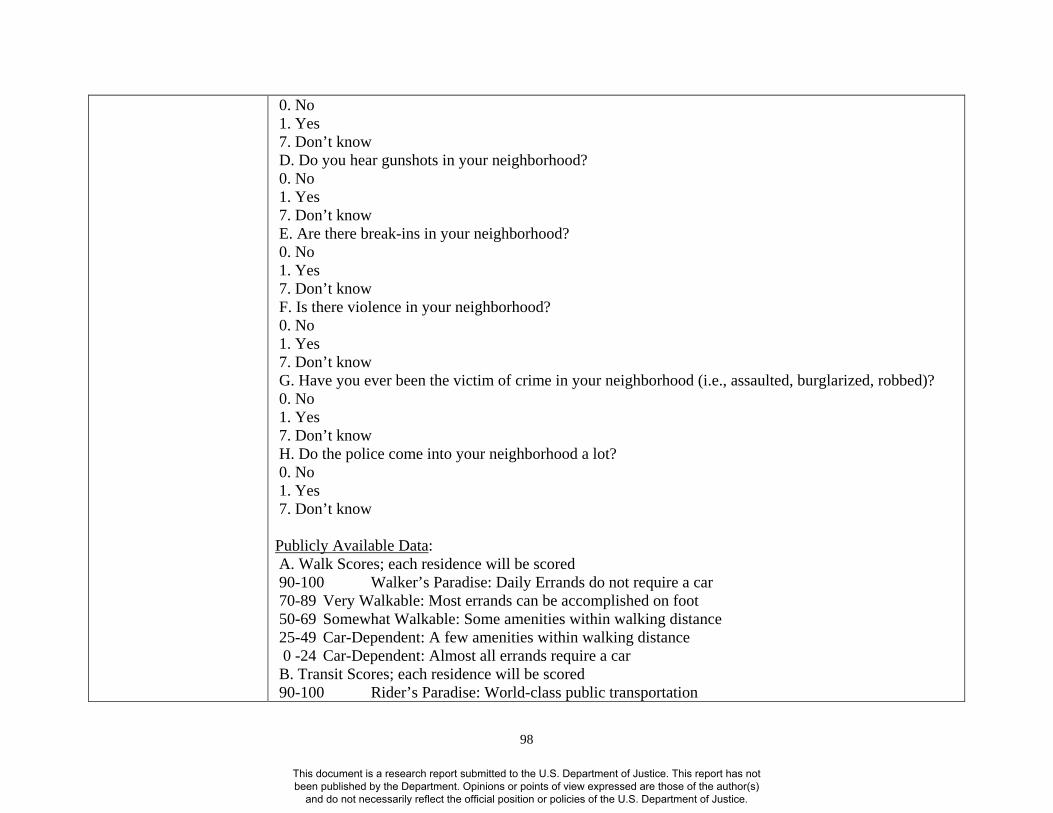
At the community level, four measures were available for accessibility and safety of
neighborhoods. Women’s residential addresses were collected at each interview. The address
women provided at the third interview was linked to two sources of publicly available data on
“accessibility” that rate neighborhoods by availability of goods and services as well as
neighborhood safety, cost of living, education, employment, housing and weather. First, Walk
Scores range from 0 to 100 and measure the walkability of a given address utilizing a variety of
data sources (e.g., Google, Open Street Map); the higher the score, the better the location.
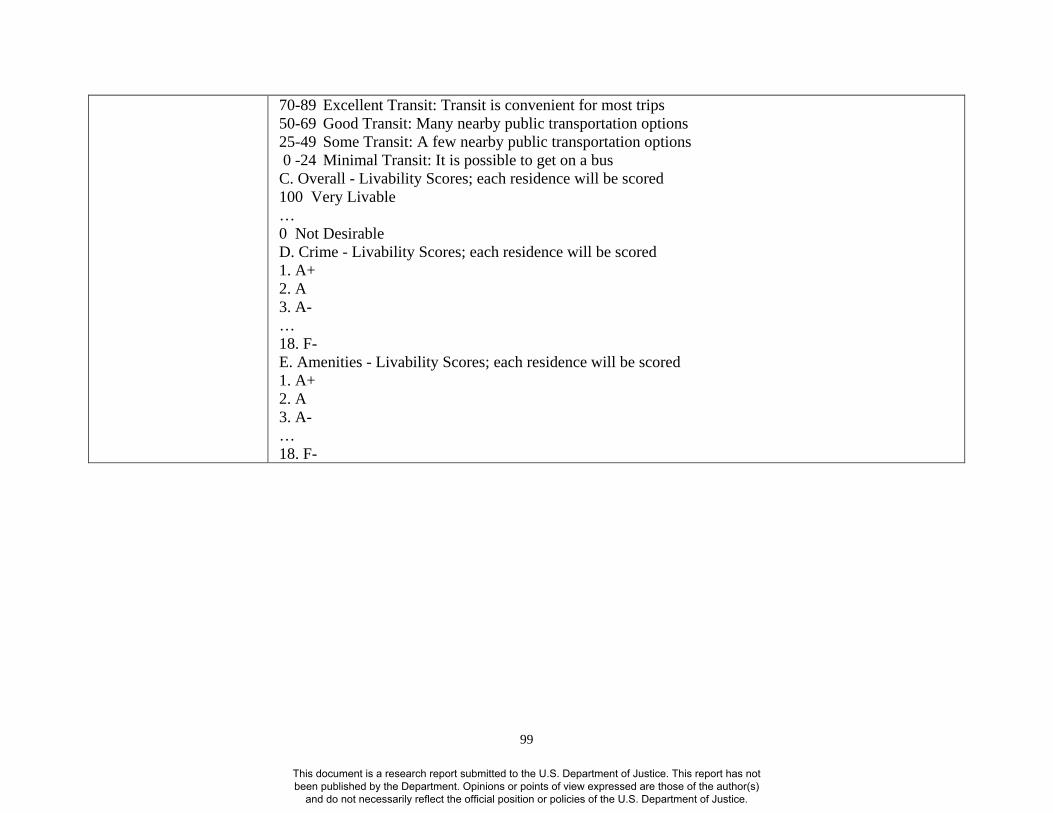
Second, Livability scores provide a measure of overall accessibility of a community in terms of
amenities, cost of living, crime rates, education, employment, housing, and weather. Scores
range from 0 to 100; the higher the score, the better the location. Sub scores were also available
for each Livability dimension and two were utilized; the (1) proximity of amenities and (2) crime
18
This document is a research report submitted to the U.S. Department of Justice. This report has not been published by the Department. Opinions or points of view expressed are those of the author(s)
and do not necessarily reflect the official position or policies of the U.S. Department of Justice.
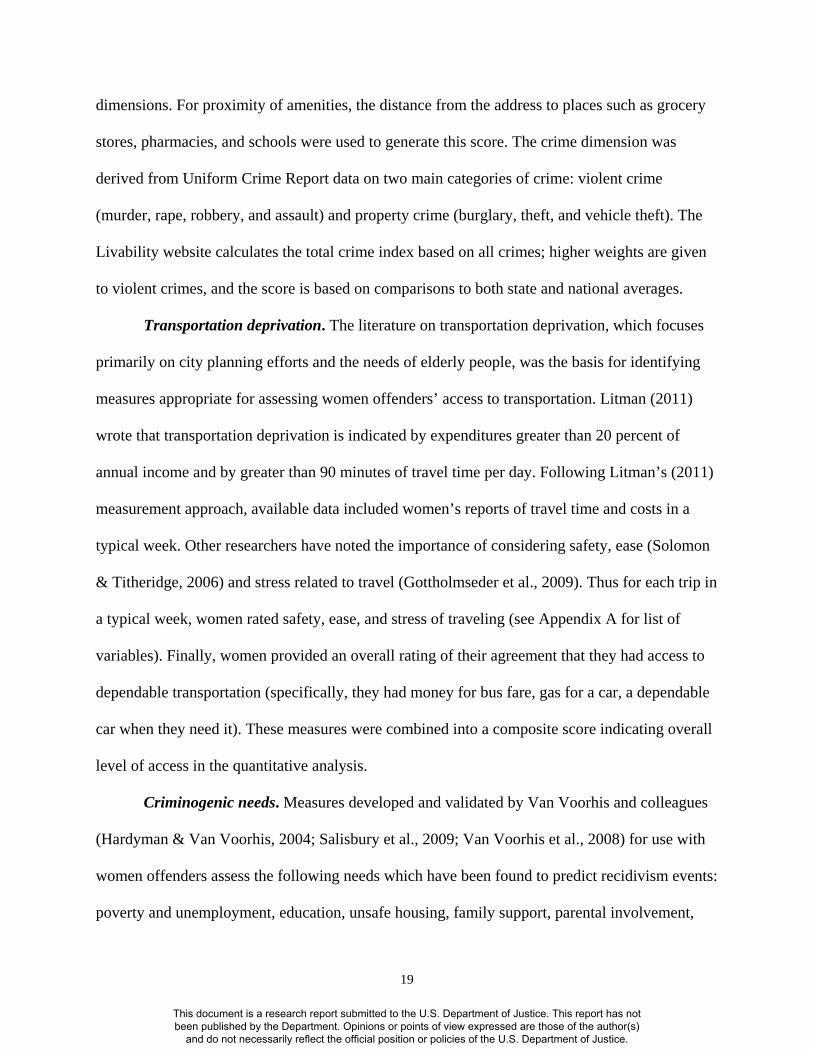
dimensions. For proximity of amenities, the distance from the address to places such as grocery
stores, pharmacies, and schools were used to generate this score. The crime dimension was
derived from Uniform Crime Report data on two main categories of crime: violent crime
(murder, rape, robbery, and assault) and property crime (burglary, theft, and vehicle theft). The
Livability website calculates the total crime index based on all crimes; higher weights are given
to violent crimes, and the score is based on comparisons to both state and national averages.
Transportation deprivation. The literature on transportation deprivation, which focuses
primarily on city planning efforts and the needs of elderly people, was the basis for identifying
measures appropriate for assessing women offenders’ access to transportation. Litman (2011)
wrote that transportation deprivation is indicated by expenditures greater than 20 percent of
annual income and by greater than 90 minutes of travel time per day. Following Litman’s (2011)
measurement approach, available data included women’s reports of travel time and costs in a
typical week. Other researchers have noted the importance of considering safety, ease (Solomon
& Titheridge, 2006) and stress related to travel (Gottholmseder et al., 2009). Thus for each trip in
a typical week, women rated safety, ease, and stress of traveling (see Appendix A for list of
variables). Finally, women provided an overall rating of their agreement that they had access to
dependable transportation (specifically, they had money for bus fare, gas for a car, a dependable
car when they need it). These measures were combined into a composite score indicating overall
level of access in the quantitative analysis.
Criminogenic needs. Measures developed and validated by Van Voorhis and colleagues
(Hardyman & Van Voorhis, 2004; Salisbury et al., 2009; Van Voorhis et al., 2008) for use with
women offenders assess the following needs which have been found to predict recidivism events:
poverty and unemployment, education, unsafe housing, family support, parental involvement,
19
This document is a research report submitted to the U.S. Department of Justice. This report has not been published by the Department. Opinions or points of view expressed are those of the author(s)
and do not necessarily reflect the official position or policies of the U.S. Department of Justice.
parental stress, adult victimization, relationship dysfunction, self efficacy, anger/hostility, and
depression/anxiety and psychosis symptoms. Reliabilities for scales (e.g., self-efficacy, child
abuse) are ≥0.75.
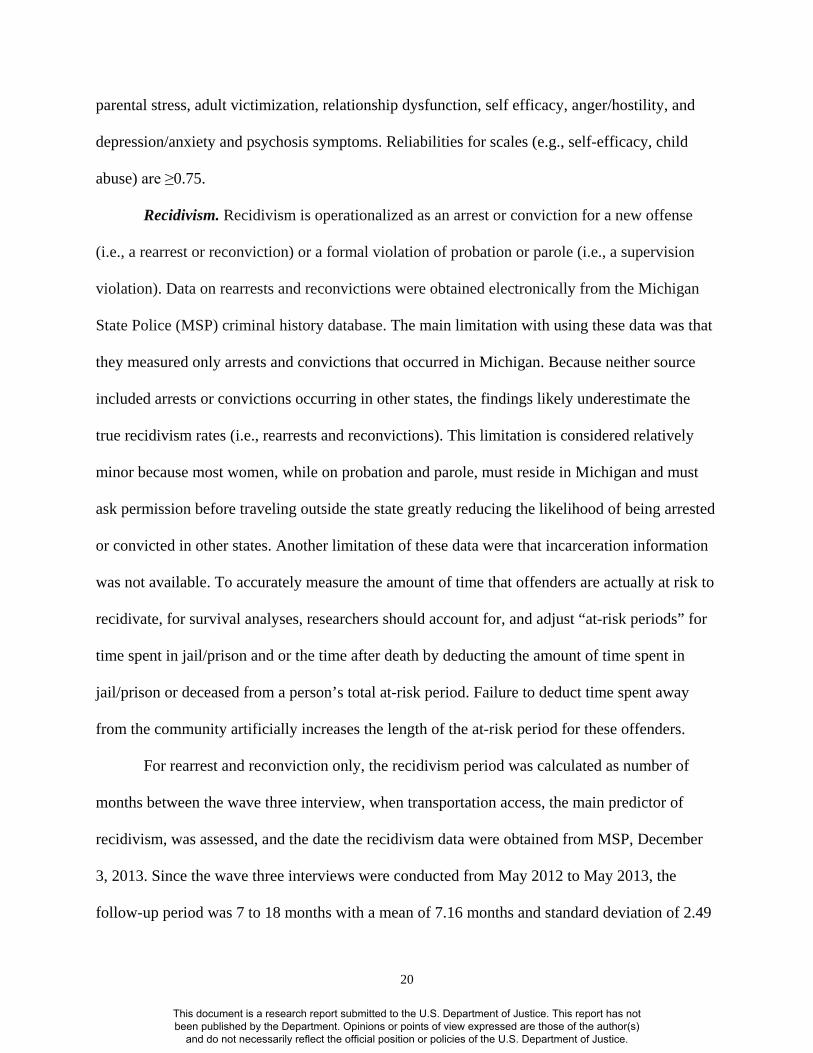
Recidivism. Recidivism is operationalized as an arrest or conviction for a new offense
(i.e., a rearrest or reconviction) or a formal violation of probation or parole (i.e., a supervision
violation). Data on rearrests and reconvictions were obtained electronically from the Michigan
State Police (MSP) criminal history database. The main limitation with using these data was that
they measured only arrests and convictions that occurred in Michigan. Because neither source
included arrests or convictions occurring in other states, the findings likely underestimate the
true recidivism rates (i.e., rearrests and reconvictions). This limitation is considered relatively
minor because most women, while on probation and parole, must reside in Michigan and must
ask permission before traveling outside the state greatly reducing the likelihood of being arrested
or convicted in other states. Another limitation of these data were that incarceration information
was not available. To accurately measure the amount of time that offenders are actually at risk to
recidivate, for survival analyses, researchers should account for, and adjust “at-risk periods” for
time spent in jail/prison and or the time after death by deducting the amount of time spent in
jail/prison or deceased from a person’s total at-risk period. Failure to deduct time spent away
from the community artificially increases the length of the at-risk period for these offenders.
For rearrest and reconviction only, the recidivism period was calculated as number of
months between the wave three interview, when transportation access, the main predictor of
recidivism, was assessed, and the date the recidivism data were obtained from MSP, December
3, 2013. Since the wave three interviews were conducted from May 2012 to May 2013, the
follow-up period was 7 to 18 months with a mean of 7.16 months and standard deviation of 2.49
20
This document is a research report submitted to the U.S. Department of Justice. This report has not been published by the Department. Opinions or points of view expressed are those of the author(s)
and do not necessarily reflect the official position or policies of the U.S. Department of Justice.
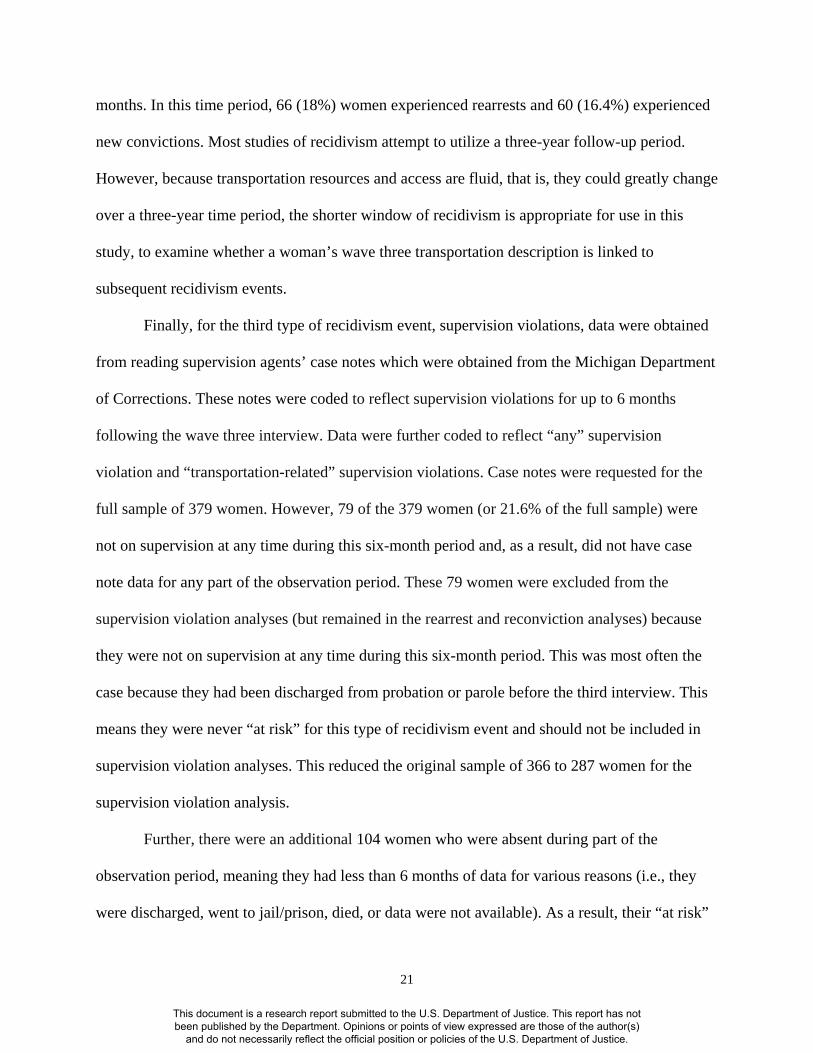
months. In this time period, 66 (18%) women experienced rearrests and 60 (16.4%) experienced
new convictions. Most studies of recidivism attempt to utilize a three-year follow-up period.
However, because transportation resources and access are fluid, that is, they could greatly change
over a three-year time period, the shorter window of recidivism is appropriate for use in this
study, to examine whether a woman’s wave three transportation description is linked to
subsequent recidivism events.
Finally, for the third type of recidivism event, supervision violations, data were obtained
from reading supervision agents’ case notes which were obtained from the Michigan Department
of Corrections. These notes were coded to reflect supervision violations for up to 6 months
following the wave three interview. Data were further coded to reflect “any” supervision
violation and “transportation-related” supervision violations. Case notes were requested for the
full sample of 379 women. However, 79 of the 379 women (or 21.6% of the full sample) were
not on supervision at any time during this six-month period and, as a result, did not have case
note data for any part of the observation period. These 79 women were excluded from the
supervision violation analyses (but remained in the rearrest and reconviction analyses) because
they were not on supervision at any time during this six-month period. This was most often the
case because they had been discharged from probation or parole before the third interview. This
means they were never “at risk” for this type of recidivism event and should not be included in
supervision violation analyses. This reduced the original sample of 366 to 287 women for the
supervision violation analysis.
Further, there were an additional 104 women who were absent during part of the
observation period, meaning they had less than 6 months of data for various reasons (i.e., they
were discharged, went to jail/prison, died, or data were not available). As a result, their “at risk”
21
This document is a research report submitted to the U.S. Department of Justice. This report has not been published by the Department. Opinions or points of view expressed are those of the author(s)
and do not necessarily reflect the official position or policies of the U.S. Department of Justice.
period was adjusted appropriately. For these women, their “time at risk” was calculated as the
time from their wave three interview until the end of the risk period occurs when they are
discharged (n=60), abscond (n=6), die (n=2), go to jail or prison (n=1), or to the point at which
notes are not available (n=36). The remaining women (n=183) had the complete six months of
case notes available. Using this method, the average follow-up period, or “at risk period” for
women in the supervision analyses (n = 287) is 125.92 days or approximately 4 months. During
that time period, 72 (19.7%) women experienced at least one supervision violation and 10 of
those were for transportation-related supervision violations (e.g., driving without a license or
failure to report due to car troubles). Alternatively, 216 (59%) women did not experience a
supervision violation. The range of supervision violations was one to five; just one women
experienced five supervision violations.
It is worth noting that for women who are right-censored from the supervision violation
analyses due to incomplete case notes, their notes can be considered missing at random. There is
no logical reason that women who were recruited into the sample later (and therefore did not
have case notes available because not enough time had passed) would be any different than
women who were recruited earlier. All women were interviewed within 12 months of each other
so it is unlikely that anything happened during that short window of time; for example, no new
legislation was passed in that year that would impact the hazard of recidivism. There is no
requirement in survival analysis that everyone be followed for the same period of time, so the
varying follow-up periods, or at-risk periods, do not violate any assumptions of survival analysis
(DeMaris, 2004).
Quantitative data analysis strategy. For quantitative analysis, first, the extent and
distribution of women offenders’ transportation deprivation was established using descriptive
22
This document is a research report submitted to the U.S. Department of Justice. This report has not been published by the Department. Opinions or points of view expressed are those of the author(s)
and do not necessarily reflect the official position or policies of the U.S. Department of Justice.
statistics and bivariate correlations. Second, data analysis was used to explore the reliability of
extant measures of transportation access and the feasibility of creating a composite transportation
access score. Conceptualizations of transportation deprivation in the literature (Gottholmseder et
al., 2009; Litman, 2011; Solomon & Titheridge, 2006) suggested that multiple indicators could
be used to create a composite score. Confirmatory factor analysis was used to verify whether the
multiple indicators collectively represent the underlying concept of transportation deprivation
suggested by the literature. Based on the findings, a composite score was created to indicate level
of transportation access.
A multivariate linear regression was used to address the third research question, how well
do resources (e.g., proximity to community goods and services, family support, individual
mobility) predict access? The composite transportation access score was the dependent variable
and was regressed on the independent variables representing resources hypothesized to influence
access. Fourth, criminogenic needs were hypothesized to have an indirect impact on recidivism,
dependent on whether women had transportation to get to the services needed to address their
needs. Logistic regression was used to determine whether the relationship between criminogenic
needs and recidivism (rearrest, reconviction, supervision violation) was moderated by women’s
level of transportation access.
In the logistic regression models, an interaction term, or a cross-product term of the
continuous variables transportation access scale with the total need scale, was utilized, along
with the main effect variables for each scales. This was to test the significance of the focus
variable, criminogenic needs, at particular levels of the moderator variable, transportation access.
The interaction term is not grand mean centered, as is common practice, because an
interpretation of each scale, at its zero level, is preferred given the skewed nature of the sample
23
This document is a research report submitted to the U.S. Department of Justice. This report has not been published by the Department. Opinions or points of view expressed are those of the author(s)
and do not necessarily reflect the official position or policies of the U.S. Department of Justice.
toward high levels of transportation. That is, the sample is skewed such that it is comprised of
women with high levels of both need and transportation access, so using a mean-comparison
interpretation, when the mean is skewed, in place of a zero-level interpretation was not desirable.
Fifth, the degree to which transportation access adds to the prediction of recidivism
outcomes (rearrest, reconviction, and supervision violations) was examined. Logistic regression
was used to predict whether the transportation access score can predict the occurrence of
recidivism events. Because many women offenders eventually recidivate, it becomes important
to incorporate the amount of time until a woman recidivates into the analysis. To this end,
survival analysis models (Cox proportional hazards model) were employed to predict the time
until recidivism events occurred.
Missing data. For any given variable, less than 3% of the sample had missing data, most
often due to the respondent having skipping a question during the interview. Missing data were
set to the mean value for the variable and are not expected to significantly alter outcomes.
Phase II: Data Collection and Sample Design for Qualitative Analysis
A purposive subsample of 75 women were recruited from the NSF Women Offender
Study participants who completed the wave three interview (n=379). Three subgroups, of 25
women each, were assembled based on women’s responses to Phase I quantitative indicators of
transportation resources, access and recidivism using the six months of recidivism data available
at that time. A preliminary analysis of the quantitative data suggested that the correlation
between resources and access was not as robust as expected and six-month recidivism figures did
not appear to be highly correlated with either resources or access. Research questions were
developed, and groups of women who could speak to the unexpected findings, were sampled.
To place women into the three groups, based on available quantitative data, women were
24
This document is a research report submitted to the U.S. Department of Justice. This report has not been published by the Department. Opinions or points of view expressed are those of the author(s)
and do not necessarily reflect the official position or policies of the U.S. Department of Justice.
first rated as low or medium/high in each of three areas: resources, access, and recidivism,.
Women characterized by certain combinations of resources, access and recidivism were believed
to be better able to address the emergent research questions are listed below as well as the
subgroup name and the main research question for that subgroup. All but 14% of the wave three
Main RQ: How did women gain access in the absence of resources? Did strategies
used contribute to a positive outcomes? How?
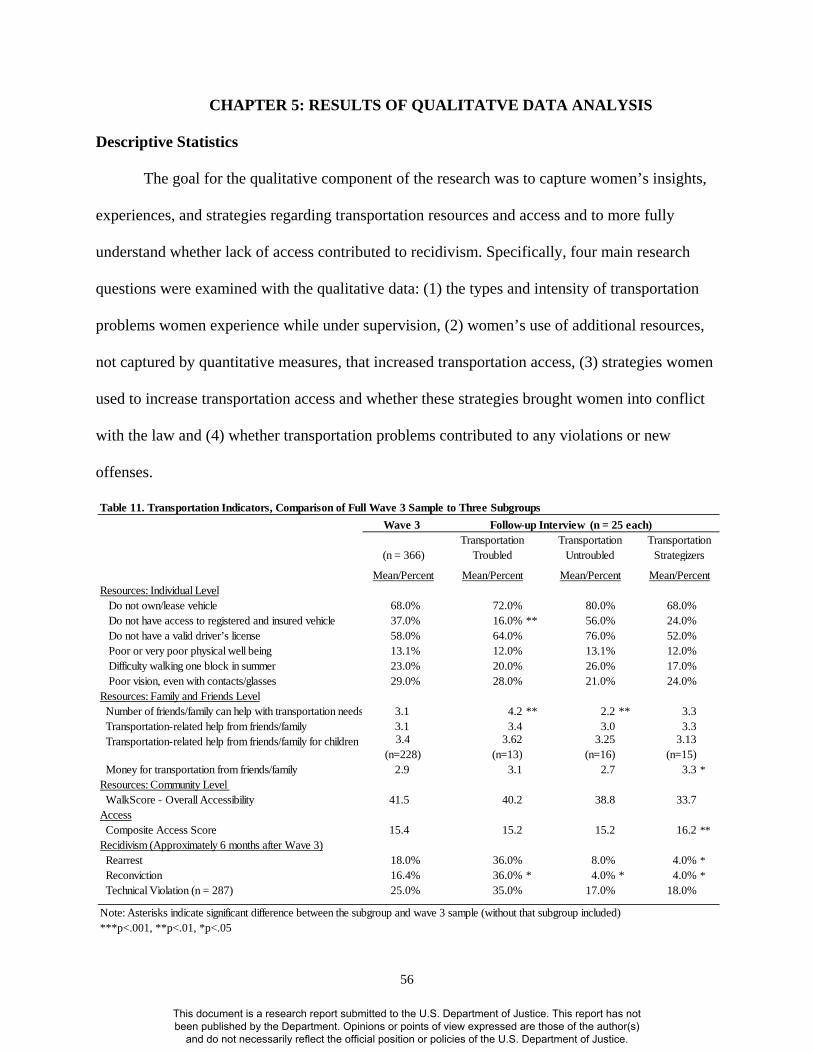
The first group of women, Transportation Troubled, were chosen because they
represented the expected finding, that women who had low resources would also have low access
which would lead to recidivism problems. The main research question for these women was
whether, and how, limited transportation resources and/or access led to recidivism events.
Interestingly, this group had the smallest number of women, only 70 of the 379 women who
completed the wave three interview, whereas the second and third groups each had 140 women,
which underscores that preliminary data analysis which informed the dissertation research design
did not support the main hypothesis.
25
This document is a research report submitted to the U.S. Department of Justice. This report has not been published by the Department. Opinions or points of view expressed are those of the author(s)
and do not necessarily reflect the official position or policies of the U.S. Department of Justice.
The second and third groups of women, and the questions they were asked, were chosen
because these women did not demonstrate a link between transportation problems and
recidivism, the expectation of the main hypothesis. The second group of women, Transportation
UnTroubled, were those for whom transportation did not appear to be related to recidivism at all;
that is, despite low levels of both access and resources, recidivism rates remained low. This
group behaved in a way that was opposite the main hypothesis. The main question here was, why
didn’t transportation problems lead to recidivism events? The third group of women,
Transportation Strategizers, were chosen because, for them, transportation resources did not
appear to be linked to transportation access. They had achieved medium to high levels of access
despite low levels of resources. For these women, the questions were related to how they were
able to gain greater access and whether the strategies they used resulted in positive outcomes.
The decision to recruit only 25 women from each group was based on an effort to balance
the practical issue of keeping the sample to a size feasible for in-depth, in-person interviewing
but large enough to provide useful information. To recruit only 25 women from each of these
three groups, women’s primary contact numbers were called, but not the numbers for their
collaterals (i.e., friends or family members for whom they provided contact information in
previous waves). For the second and third groups, those with low recidivism, this strategy was
sufficient to garner 25 women in each group. In these groups, about 70% of eligible women were
called and the first to return the calls were scheduled for interviews. However, for the first group
of women, this strategy was enhanced by also sending letters to women’s home addresses.
Again, no collaterals were contacted but enough women responded that 25 women were
scheduled for interviews. None of the women, in any of the three groups, who were contacted
declined an interview. The main challenge in scheduling was overcoming outdated contact
26
This document is a research report submitted to the U.S. Department of Justice. This report has not been published by the Department. Opinions or points of view expressed are those of the author(s)
and do not necessarily reflect the official position or policies of the U.S. Department of Justice.
information.
This recruitment protocol yielded 75 women from 14 of the 16 counties originally
sampled and therefore provided a statewide sample. Each woman identified for recruitment,
when called, was given an explanation of the Phase II study, the consent process was again
explained, and if there was consent, a face-to-face interview was scheduled at either women’s
homes, if the interviewer knew the woman well, or at a public location close to the women’s
home (e.g., a coffee shop, restaurant or public library), contingent on the woman’s preference.
A monetary incentive, of similar size as the ones utilized and found to be very important
in recruiting women for the NSF Women Offenders Study ($50), was offered as well as small
amounts of cash to offset bus fare or to give gas money to people who provided rides. At the
time of the interviews, most women were on probation or parole for 12 to 24 months. Interviews
were audio-recorded and transcribed.
Qualitative measures. A semi-structured interview format (see Appendix B), which
allowed for considerable probing, was used to provide women wide latitude in describing their
perceptions of transportation access. To place transportation in context with women’s other
needs, women were asked over the past five years: whether they could recall three significant
events that had occurred; during which months they were institutionalized (times during which
transportation was not relevant); during which months they received help from family, friends or
social services for transportation, and also for things other than transportation such as food,
money, or housing. The use of the life history calendar (Roberts & Horney, 2010) helped women
recall events with more accurate timing and allowed the researcher to see whether transportation
problems coincided with recidivism or other problems (e.g., lack of food).
To develop and refine the interview template, five pilot interviews were conducted with
27
This document is a research report submitted to the U.S. Department of Justice. This report has not been published by the Department. Opinions or points of view expressed are those of the author(s)
and do not necessarily reflect the official position or policies of the U.S. Department of Justice.
women who were not placed into one the three subgroups of interest. This process ensured that
the question wording was clear and that the ordering of questions was appropriate. The initial
and final instruments were approved by the MSU IRB.
Women from all three groups were asked the same series of open-ended questions to
engage them in sharing their insights, examples, and reports on the nature of transportation
challenges, any strategies or resources used for overcoming them, and the result, especially as it
related to recidivism. However, certain areas of the interview required probing depending on
women’s group membership, for example, if there was a recidivism event, women were asked to
explain it and probes were used to see if transportation was also related. To alert the interviewer
to when probes should be used, interview questions incorporated data provided by women in
earlier waves. For example, if in the wave three quantitative data collection a woman reported
she had little family support, lived in a rural area where buses did not travel, but did not indicate
problems getting to needed services, the interviewer would explicitly mention the gap between
these resources and her apparent level of access and ask her to describe her strategies and
resources for getting where she needs to go. To increase validity, self-reported recidivism data
was triangulated with official data (e.g., rearrest and reconviction data obtained from the
Michigan State Police and case notes from supervision agents).
Qualitative data analysis strategy. Interviews were transcribed and formatted into
specialized templates that could be read into the qualitative data analysis software, NVivo. The
software was primarily used to organize, code, establish inter-coder reliability for, and analyze
all Phase II data. Once the data were in NVivo, the data were segmented into sections that
corresponded with the four research questions. These research questions include: (1) the types
and intensity of transportation problems that women described since supervision began; (2)
28
This document is a research report submitted to the U.S. Department of Justice. This report has not been published by the Department. Opinions or points of view expressed are those of the author(s)
and do not necessarily reflect the official position or policies of the U.S. Department of Justice.
resources for transportation, including those not tapped by quantitative measures; (3) strategies
used by women to increase transportation access and ways that strategies brought women into
conflict with the law (e.g., trading drugs for a ride, riding with a friend who has a felony
conviction), and (4) the different ways that transportation problems contributed to recidivism.
To segment the data, all the responses in the interview related to a given research
question, for example, questions related to types of transportation problems women experienced,
were grouped together such that each woman’s responses to the series of questions were listed
together in a “node.” Next, all 75 women's responses to these groups of questions were read to
determine which types of transportation problems women were experiencing. A list of these
problems, or themes, was compiled and an initial codebook was created that directed the coder
what types of problems should be coded under that theme. For example, reports that women’s
family and friends were always late to pick them up should be coded under the problem, or
theme of, “Unreliable Help.”
With the help of an additional coder, an iterative process of establishing intercoder
reliability began (Hruschka et al., 2004; Weston et al., 2001) to ensure that codes were developed
and applied in a reasonable manner. A random sample of transportation problems was selected
for both the student and additional coder to independently code. The pair compared the codes
they had applied, discussed the adequacy of the initial codebook, and refined it where needed.
Once agreement was reached, the pair independently coded a larger number of, for example,
transportation problems (approximately 30) and used SPSS software to calculate a Cohen's
Kappa statistic (Hruschka et al., 2004). Once an acceptable kappa level was obtained, the author
continued coding the remainder of the data. Intercoder reliability was established, in this manner
for several sections of the dissertation.
29
This document is a research report submitted to the U.S. Department of Justice. This report has not been published by the Department. Opinions or points of view expressed are those of the author(s)
and do not necessarily reflect the official position or policies of the U.S. Department of Justice.
After data are coded, NVivo is able to provide a count of the number of women (i.e.,
cases) and the number of passages that reflect, for example, each type of transportation resource
women report using. From these data, the student can describe and provide examples of the
distribution of the transportation resources, or themes. For example, one part of the analysis
could determine whether women provided examples of transportation resources that were not
reflected by their quantitative scores. If this is the case, the findings would inform future
development of better concept measurements of resources. Qualitative data has an advantage
over a chi-square table in SPSS, for example, because it is able to contextualize information by
clicking on each box in a query and immediately linking to the full text detailing the new
resource discussed.
30
This document is a research report submitted to the U.S. Department of Justice. This report has not been published by the Department. Opinions or points of view expressed are those of the author(s)
and do not necessarily reflect the official position or policies of the U.S. Department of Justice.
CHAPTER 4: RESULTS FOR QUANTITATVE ANALYSIS
Descriptive Statistics
Transportation resources. Table 2 presents the descriptive statistics for the
transportation resource variables and bivariate correlations between those variables and the
transportation access measure (the composite transportation access score). This table addresses
the first research question regarding the extent of transportation deprivation among women
offenders. Table 2 shows that significant numbers of women have limited individual level
resources for gaining transportation access.
Sixty-eight percent of women do not own or lease their own vehicle, 37% do not have access to
someone else’s vehicle and 58% of the sample does not have a valid driver’s license. In short,
access to a personal vehicle is quite limited for these women. Further, significant numbers of
Individual Level Do not own/lease vehicle 68.0%* Do not have access to registered and insured vehicle 37.0%** Do not have a valid driver’s license 58.0% Poor or very poor physical well being 13.1%** Difficulty walking one block in summer 23.0% Poor vision, even with contacts/glasses 29.0%Family and Friends Level - Transportation-Related Support Number of friends/family who can help 3.05* 0 to 13 Have help from friends/family for self 3.14** 1 to 4 1(SD) to 4(SA) Have help from friends/family for children (n=228) 3.37* 1 to 4 1(SD) to 4(SA) Money from friends/family 2.85** 1 to 4 1(SD) to 4(SA)Community Level Accessibility Scores WalkScore - Overall 41.5 0 to 91 High Score = Livability Score - Overall 69.5 53 to 84 More Accessible Livability Score - Proximity of Amenities 6.1 1 to 9 Livability Score - Safety 3.3 1 to 9
This document is a research report submitted to the U.S. Department of Justice. This report has not been published by the Department. Opinions or points of view expressed are those of the author(s)
and do not necessarily reflect the official position or policies of the U.S. Department of Justice.
women report physical health limitations, such as difficulties walking or seeing, or being in poor
health (23%, 29%, and 13%, respectively), that could present problems with utilizing alternate
forms of transportation such as walking or biking. At the bivariate level, three resources are
significantly related to access: owning/leasing a vehicle (+), having access to a vehicle (+), and
poor physical health (-).
At the friends and family level, women on average report they can rely on 3.05 friends or
family members to help them with transportation-related needs. The other three indicators are
Likert scale items ranging from strongly disagree (0) to strongly agree (4) indicating that, in
general, women can rely on their family and friends for transportation-related support for
themselves or their children. Women, on average strongly agree that friends or family will help
them (3.14) or their children (3.37) with transportation needs. Although, women showed less
agreement (2.85) that family and friends would provide them money for transportation, women
across all three measures agree that they can rely on others for help (scores of greater than 2
indicate agreement). Further, all four measures of family and friend level resources are
statistically significant at the bivariate level, meaning they all impact transportation access at the
zero-order level.
At the community level, women are living in areas in which grocery stores may not be
close, they may not have sidewalks, or buses may not come frequently or at all. The average
WalkScore for women in the sample was 41.5 points which is very low. The actual values ranged
from 0 to 91 in the sample but there are 100 points possible on this scale. Similarly, Livability
scores indicated that overall accessibility was 69.5 out of a possible 100 points with actual scores
ranging from 53 to 84. The overall Livability score (69.5) and Livability score for proximity of
amenities (6.1) indicate that women are living in areas that are less desirable. In other words,
32
This document is a research report submitted to the U.S. Department of Justice. This report has not been published by the Department. Opinions or points of view expressed are those of the author(s)
and do not necessarily reflect the official position or policies of the U.S. Department of Justice.
they are living in places in which grocery stores, restaurants, bars, shopping, coffee shops,
schools, parks, libraries, book stores, entertainment, public transportation and fitness facilities
are far away from their homes.
Also important to note is the low rating for neighborhood safety (3.3 out of 9). This
indicator of crime examines both violent and property crime, applying a higher weight to violent
crimes. This subscore is based on comparisons to both state and national averages. In other
words, women in this sample, compared to women living elsewhere in the state and in country,
live in areas of high crime which further suggest that it may not be safe for women to walk or
take buses to and from their homes. None of these four measures was significantly related to
transportation access at the bivariate level. Taken together, these results suggest that women in
this sample have significant transportation deficits in the areas of individual and community
resources but receive substantial levels of support from family and friends.
Transportation access. Table 3 shows the descriptive statistics for the individual
transportation access measures that comprise the composite transportation access score. The first
item in the table, overall access to dependable transportation, was developed for this study. A
score of one would indicate that women do not have dependable transportation whereas four
indicates strong agreement that women do have dependable transportation. The average score of
3.2 means that most women agree that they have dependable transportation, on average, despite
the low level of resources reported in Table 2.
The next five items in Table 3 were derived from transportation and gerontology research
as well as research focused on low-income individuals. To obtain these items, in the third
interview, women were asked about all the places they traveled in the past seven days. The
number of trips ranged from one to seven trips, per week, per woman. The averages in this table
33
This document is a research report submitted to the U.S. Department of Justice. This report has not been published by the Department. Opinions or points of view expressed are those of the author(s)
and do not necessarily reflect the official position or policies of the U.S. Department of Justice.
represent the average stress/ease/cost for all trips – so, for example, the cost of an individual trip,
on average, is $5.10. Table 3 shows that, on average, most women report that it is easy to get
from place to place (4.3 out of 5). Most disagree that their travel is stressful (2.1 out of 4).
The average trip time is 17.9 minutes which is reasonable but the wide range is more
problematic; at least one woman reported an average trip time of 2 hours. The average cost of
travel is reasonable ($5.10) and, surprisingly, even though the community accessibility measures
show that women live in unsafe neighborhoods, a score of .9 indicates that women said they
almost always felt safe when they traveled. Of course, it is quite possible that when women
would not feel safe traveling, they do not, and so those avoided trips would not appear on their
travel inventories. Collectively, despite the low resource levels reported in Table 2, the
accessibility indicators in Table 3 show that women report they have moderate to excellent
access to dependable transportation.
Confirmatory Factor Analysis
Analysis to address the second research question explores the reliability of measures of
transportation access in Table 3 and the feasibility of creating a composite transportation access
score from those measures. The first step in this process is to explore, using confirmatory factor
analysis, the reliability of the six items presented in Tables 4 and 5 to see if they, together,
represent the underlying latent concept of transportation access.
Overall, has dependable transportation 3.2 1 (SD) to 4 (SA)Ease of travel, average 4.3 1 (Not) to 5 (Very)Stress of travel, average 2.1 1 (Not) to 4 (Very)Time spent in travel, average (in minutes) 17.9 2.5 to 120Cost of travel, average (in dollars) 5.1 0 to 51Safety of travel, average 0.9 0 (Unsafe) to 1 (Safe)
34
This document is a research report submitted to the U.S. Department of Justice. This report has not been published by the Department. Opinions or points of view expressed are those of the author(s)
and do not necessarily reflect the official position or policies of the U.S. Department of Justice.
Confirmatory factor analysis is a theory-testing model as opposed to a theory-generating
model (Stapleton, 1997). It is utilized when a researcher begins with a hypothesis, for example,
based on measures used in prior research, that represent the researcher’s understanding of a
given construct, in this case, transportation access. The objective of the confirmatory factor
analysis is to test whether the data collected fit the researcher’s hypothesized model, in this case,
the five variables identified based on a review of the extant literature and the one new item
created for this study.
The data were evaluated using the AMOS extension in SPSS. Model fit was evaluated
and sufficient fit was determined using cutoff values outlined by Hu & Bentler (1998). The Chi-
Square test of exact fit (10.649, df=9, p=0.301) tests whether a residual fit index is statistically
different from zero. A non-significant Chi-Square value is desirable. The Comparative Fit Index
was also examined (CFI = .991) and found to be at a suitable level; values higher than 0.9 are
indicative of sufficient fit. Also, the Root Mean Square Error of Approximation (RMSEA) point
estimate (in which values lower than 0.1 are indicative of sufficient) also showed good fit at
0.023. Upon achieving sufficient fit, these six latent factors were then combined together in a
scale (described in next section).
Creation of Composite Transportation Access Score
To combine the six items into a composite score, first, the most common method of
standardizing the items was investigated. This involved generating z-scores for each item and
then averaging them together because the scales for each variable are different. For example, as
shown in Table 4, the first and third items have values ranging from one to four whereas the
second item ranges from one to five. The ranges for the fourth through sixth items have even
greater variation.
35
This document is a research report submitted to the U.S. Department of Justice. This report has not been published by the Department. Opinions or points of view expressed are those of the author(s)
and do not necessarily reflect the official position or policies of the U.S. Department of Justice.
The creation of the composite score using standardized variables (z-scores) presented two
problems, one related to interpretability and one related to the skewed nature of the items. First,
the interpretation of having a standardized score did not make sense with this sample because the
sample means for each item do not provide useful comparison points.
As shown by the lack of transportation resources women reported in Table 2, the whole sample
is transportation deprived, so the average level of deprivation for the sample is not a useful
metric for which to compare other women in the sample. That is, to say that a given independent
variable results in a change in transportation access of about one standard deviation higher than
mean transportation deprivation does not make sense if the mean level is skewed toward
deprivation already. By contrast, for example, if one were comparing test scores for a group of
local high school students a national sample of high school students, a z-score interpretation
would be advantageous. It would indicate whether local students score higher or lower, in terms
of standard deviations, than the national average. But, because average levels of transportation
access in this study’s sample do not have the same interpretability, an alternate strategy was
explored.
The second reason z-scores were not optimal is because many of the composite scale
items were not normally distributed. Table 4 shows the skew, kurtosis and Shapiro-Wilk values
for each indicator. The Shapiro-Wilk values of zero indicate that all six variables are not from a
Overall, has dependable transportation 3.2 1 to 4 -1.004 0.293 0.000Ease of travel, average 4.3 1 to 5 -1.4 2.6 0.000Stress of travel, average 2.1 1 to 4 0.389 0.944 0.000Time spent in travel, average (in minutes) 17.9 2.5 to 120 3.2 14.9 0.000Cost of travel, average (in dollars) 5.1 0 to 51 2.5 14.0 0.000Safety of travel, average 0.9 0 to 1 -5.5 30.1 0.000
36
This document is a research report submitted to the U.S. Department of Justice. This report has not been published by the Department. Opinions or points of view expressed are those of the author(s)
and do not necessarily reflect the official position or policies of the U.S. Department of Justice.
normally distributed population. Skewness captures the degree of symmetry, or the extent to
which values on a variable are symmetrically arranged around the mean (Walker, 2013). A
skewness value of zero indicates the variable has a symmetric distribution and there is no skew
in the data. A distribution is considered skewed if the skewness is outside the range of -1 to 1. In
this case, efforts should be made to bring the distribution closer to normal. Kurtosis is a measure
of peakedness or flatness of a distribution; a kurtosis value of 0 means the distribution is close to
normal shaped whereas extreme positive values mean the sample is distributed around the tails
instead of around the mean (flat) and extreme negative values indicate the distribution is more
peaked than normal (Walker, 2013). Similar to skewness, kurtosis values between -1 and 1,
ideally as close to 0 as possible, indicate a more normal distribution. In Table 4, the four non-
normal, or problematic, variables are highlighted in grey. Efforts should be taken to move these
variables closer to a normal distribution.
A technique for creating a composite access score, for non-normally distributed items, is
to examine the distribution for each item and place women in categories based on where they
stand on the items. For each item, women were given a score out of three (1 = low access, 2 =
average access, 3 = high access). For example, for the average safety item (originally coded 1=
safe, 0 = unsafe), the average safety values of .75 to 1 were assigned a value of 3, indicating high
access; values of .25 to .75 were assigned a value of 2; and values of 0 to .25 were assigned a 1
indicating low access. In this manner, all items were coded into three point scales and then all six
items were summed together. The resulting scale could theoretically range from 6 to 18 but has
actual values ranging from 9 to 18. It has a mean of 15.4 and a standard deviation of 1.87.
One strength of creating a composite score based on the distributions of the individual
items is that, similar to z-score coding, it solves the problem of each variable having a different
37
This document is a research report submitted to the U.S. Department of Justice. This report has not been published by the Department. Opinions or points of view expressed are those of the author(s)
and do not necessarily reflect the official position or policies of the U.S. Department of Justice.
range of values (a different scale). That is, once summed together, each item has the same weight
in the composite score. However, one limitation is that this method assumes each individual item
matters the same amount to the underlying construct of transportation access (which the loadings
on the CFA would not completely support). The two methods were triangulated to ensure that the
composite score based on distributions was not dramatically different from the composite score
derived from z-scores; both scores were regressed on the same set of independent variables and
they performed similarly. Therefore, the more interpretable summed composite access score that
adjusts for non-normally distributed data is retained for use in the analyses.
Multivariate Analysis of Transportation Access on Transportation Resources
The goal of addressing the third research question is to address how well transportation
resources predict transportation access. The summed composite transportation access score is the
dependent variable and is regressed on the variables representing transportation resources. To
avoid multicollinearity problems in the multiple regression model, or high correlations between
the independent variables, Variance Inflation Factors (VIFs) were examined for all variables in
Table 5. All values were much greater than the cutoff value of .10; in fact, the VIFs ranged from
one to two indicating multicollinearity was not a problem. Further, I selected only one of the four
community accessibility scores, the Walkscore, which had a higher correlation with the
composite access score (Pearson correlation coefficient = .038) than the other three accessibility
Looking at Table 5, the F-statistic, which is the ratio of unexplained variance to explained
variance, shows the model has good fit (9.388, p = .000). The R-squared adjusted statistic shows
the variables in the model explain about 19% of the variation in transportation access. This is an
acceptable score for social science research but falls below a more desirable score (e.g., 0.5).
38
This document is a research report submitted to the U.S. Department of Justice. This report has not been published by the Department. Opinions or points of view expressed are those of the author(s)
and do not necessarily reflect the official position or policies of the U.S. Department of Justice.
Looking at the individual predictors, four items significantly predict transportation
access. Women who say they do not have access to a vehicle, on average, score .594 points
lower on the transportation access score than women who do have access to a vehicle. Women
who report poor physical health also have lower levels of transportation access. Specifically, a
one unit increase in poor physical health, or a one-unit decrease in health, lowers the access score
by 1.038 points out of 18. Or, looking at the standardized beta, for a one standard deviation
increase in poor health, there is a drop of .187 standard deviations on the access score. On the
other hand, women who receive transportation-related help from family and friends have higher
levels of transportation access as well as women who receive money from family for
transportation. The largest impact on transportation access is for women who obtain
transportation assistance from friends and family, the standardized beta (.215) indicates that for a
one standard deviation increase in help from family, there is a .215 standard deviation increase in
Table 5. Multivariate Regression of Transportation Access on Transportation Resources (n = 366)b β
Intercept 13.173 0.000Individual Level Do not own/lease vehicle -0.082 -0.020 Do not have access to registered and insured vehicle -0.594 ** -0.152 Do not have a valid driver’s license 0.149 0.039 Poor or very poor physical well being -1.038 *** -0.187 Difficulty walking one block in summer 0.228 0.051 Poor vision, even with contacts/glasses -0.140 -0.034Family and Friends Level Number of friends/family can help with transportation needs 0.003 0.004 Transportation-related help from friends/family 0.474 ** 0.215 Money for transportation from friends/family 0.290 * 0.139Community Level Accessibility Scores WalkScore - Overall 0.006 0.065
F 9.388 ***R² 0.209R² adjusted 0.187***p<.001 **p<.001 *p<.05
39
This document is a research report submitted to the U.S. Department of Justice. This report has not been published by the Department. Opinions or points of view expressed are those of the author(s)
and do not necessarily reflect the official position or policies of the U.S. Department of Justice.
access, which is the largest standardized beta in the model. Standardized betas allow for
comparison between independent variables, in the same model, to show which has a greater
impact on the dependent variable when independent variables employ different units of
measurement.
Several measures were not significant predictors of transportation access: whether a
woman owned or leased a vehicle, had a valid driver’s license, had difficulty walking, had poor
vision, had friends who could help with transportation needs, or lived in an area with a low
community accessibility score.
Logistic Regression Analyses of Recidivism, Testing Moderation of Criminogenic Needs by Transportation Access
Analysis to address the fourth research question examines whether the effect of
criminogenic needs on recidivism (i.e., rearrest, reconviction, and supervision violations)
depends on whether women have transportation to get to the services they need (i.e., varying
levels of transportation access). In other words, this hypothesis examines the potential
moderation effect of transportation access on the relationship between criminogenic needs and
recidivism. To address this question, rearrest is first considered as the dependent variable (Table
6), then reconviction (Table 7), and finally supervision violation (Table 8).
Rearrest. For the rearrest analysis, the dependent variable is whether women were
arrested (coded yes/no) within the follow-up period of 7 to 18 months, with a mean of 7.16
months and standard deviation of 2.49 months. The two independent variables of interest are
total need score, the WRNA measure of women’s risks minus women’s strengths, administered
at wave one, and the composite transportation access score, measured at wave three.
To address the question of whether the impact of criminogenic needs on rearrest is
moderated by level of transportation access, first we must examine whether criminogenic needs,
40
This document is a research report submitted to the U.S. Department of Justice. This report has not been published by the Department. Opinions or points of view expressed are those of the author(s)
and do not necessarily reflect the official position or policies of the U.S. Department of Justice.
as measured by the total need score, has a direct impact on recidivism. Model 1 of Table 6 shows
that for every one-unit increase in total need score (for every additional point on the WRNA
scale), there is a .037 increase in the log-odds of rearrest, or a 3.7% increase in the odds of
rearrest. This effect is statistically significant (p=.015). In other words, as expected, greater
levels of criminogenic needs do significantly increase odds of rearrest.
The intercept, in logistic regression models, can be interpreted as the expected value of the log-
odds of rearrest when all of the predictor variables equal zero. However, the value of zero on the
criminogenic scale is not a realistic value and so the interpretation of the intercept is not
particularly useful here or in the models for reconviction or supervision violations. The
likelihood ratio (-2 Log Likelihood ratio) is non-significant indicating the model fit is not
significantly better than the intercept-only model.
The next step is to examine the moderation effect to determine whether the relationship
between needs and rearrest is dependent on women’s levels of transportation access. The
justification for expecting these two factors to interact is the hypothesis that the impact of
criminogenic needs (total need) on rearrest is exacerbated for women who have lower levels of
This document is a research report submitted to the U.S. Department of Justice. This report has not been published by the Department. Opinions or points of view expressed are those of the author(s)
and do not necessarily reflect the official position or policies of the U.S. Department of Justice.
transportation access, or mitigated for women who have higher levels of transportation access.
The statistically significant regression coefficient for the interaction effect supports the
conclusion that transportation access moderates the relationship between criminogenic needs and
rearrest. An interaction term, or a cross-product term of transportation access with total need, is
introduced in Model 3 of Table 6, along with the addition of the direct effect of transportation
access, to test the significance of the focus variable, criminogenic needs, at particular levels of
the moderator, transportation access.
The results in Table 6 show that, for women who have high levels of transportation
access (a value of 16; the median between 12 and 18 which indicate high levels of access), the
effect of criminogenic needs on the log odds of rearrest is exp[-.166 + .013(16)] = exp (.042) =
1.04. In other words, there is an increase in odds of rearrest of 100[exp.042) - 1] = 4, or 4%.
Whereas, for women who have low levels of transportation access (a value of 3; the median
between 0 and 6 which indicates low levels of access), the effect of criminogenic needs on the
log odds of rearrest is exp[-.166 + .013(3)] = exp (-.127) = 0.88. For these women, there is a
decrease in odds of rearrest of 100[exp(-.127) - 1] = - 12, or 12%.
In other words, the impact of criminogenic needs on rearrest varies significantly by
women’s levels of transportation access. The hypothesis was that higher levels of transportation
access would aid women in addressing their criminogenic needs and thus lower the incidence of
rearrest. For example, women who have substance abuse problems and who need to attend
treatment, would have lower levels of rearrest if they had greater access to transportation.
However, the results presented here suggest the opposite, that women with similar levels of need,
who have higher levels of transportation access, have 4% greater odds of rearrest. And women
42
This document is a research report submitted to the U.S. Department of Justice. This report has not been published by the Department. Opinions or points of view expressed are those of the author(s)
and do not necessarily reflect the official position or policies of the U.S. Department of Justice.
who have lower levels of transportation access, and similar levels of need, actually have a 12%
lower odds of rearrest. This is considered a disordinal interaction effect.
Reconviction. The relationships between criminogenic need, transportation access score,
and reconviction are examined in the second part of the fourth research question. Again, the two
independent variables of interest are total criminogenic need and the composite access score.
Model 1 of Table 7, shows that for every one-unit increase in total need score (or, for every
additional point on the WRNA scale), there is a .027 increase in the log-odds, or a 2.7% increase
in the odds of reconviction. This effect is statistically significant (p=.015). In other words, as
expected, greater levels of criminogenic needs do significantly increase odds of reconviction.
The next step is to examine whether this relationship is dependent on women’s levels of
transportation access. An interaction term is introduced in Model 3 of Table 7, along with the
addition of the direct effect of transportation access, to test the significance of the focus variable,
criminogenic needs, at particular levels of the moderator, transportation access.
In contrast to the rearrest analyses, in which there is a disordinal interaction effect, the
interaction effect for the reconviction model (b = .005), although non-significant, is ordinal and
This document is a research report submitted to the U.S. Department of Justice. This report has not been published by the Department. Opinions or points of view expressed are those of the author(s)
and do not necessarily reflect the official position or policies of the U.S. Department of Justice.
in the hypothesized direction. That is, the effect of criminogenic needs appears to vary across
levels of transportation access such that higher levels of transportation access lower odds of
reconviction; but, the relationship is not statistically significant. Nonetheless, the interpretation is
provided. For women who have low levels of transportation access, there is a small decrease in
the odds of reconviction of 3% (exp[-.045 + .005(3)] = exp (-.03) = .970, or a 100[.970 - 1] =
3%). But, for greater levels of transportation access, the decrease in odds of reconviction is
greater, as hypothesized. For women who have high levels of transportation access, there is an
decrease in odds of reconviction of exp[-.045 + .005(16)] = exp (-.125) = .882, or a 100[.882 - 1]
= 11.8%. This effect is in the opposite direction as in the rearrest analyses (Table 6) but, again,
the moderation effect is not statistically significant.
Supervision violation. For the third part of the fourth research question, supervision
violations were utilized as the dependent variable. Again, the two independent variables of
interest are total need and the composite access score. Model 1 of Table 8 shows that for every
additional point on the WRNA scale, there is a .045 increase in the log-odds of supervision
violation, or a 4.5% increase in the odds of a supervision violation. This effect is statistically
significant (p=.003). In other words, as expected, greater levels of criminogenic needs do
significantly increase odds of supervision violation.
The next step is to examine whether this relationship is dependent on women’s levels of
transportation access. An interaction term is introduced in Model 3 of Table 8, along with the
addition of the direct effect of transportation access, to test the significance of the focus variable,
criminogenic needs, at particular levels of the moderator, transportation access.
The results of the supervision violation analysis are congruent with those in the rearrest
analyses, such that both display a disordinal interaction effect, and in contrast to the results of the
44
This document is a research report submitted to the U.S. Department of Justice. This report has not been published by the Department. Opinions or points of view expressed are those of the author(s)
and do not necessarily reflect the official position or policies of the U.S. Department of Justice.
reconviction model in which the interaction effect was ordinal. However the results are not
statistically significant. Nonetheless, the interpretation of the interaction term is provided. For
women who have low levels of transportation access, there is a increase in odds of supervision
violation of exp[.032+ .001(3)] = exp (.035) = 1.035, or a 100[1.035- 1] = 3.5%. But, for greater
levels of transportation access, the increase in log odds of supervision violation is greater, which
is the opposite of what was hypothesized.
For women who have high levels of transportation access, there is an slightly larger increase in
log odds of supervision violation of exp[.032+ .001(16)] = exp (.048) = 1.049, or a 100[1.049- 1]
= 4.9%. This effect is in the same direction as in the rearrest analyses (Table 6), and the opposite
of the reconviction analyses (Table 7) but, again, the moderation effect is not statistically
significant.
To summarize, the moderation effect examined in the fourth research question is
supported for rearrest analyses but not in the reconviction or supervision violation analyses. The
moderation of criminogenic needs on rearrest, by transportation access, is partially supported
because the interaction term for the rearrest analysis was significant. The results for the
This document is a research report submitted to the U.S. Department of Justice. This report has not been published by the Department. Opinions or points of view expressed are those of the author(s)
and do not necessarily reflect the official position or policies of the U.S. Department of Justice.
reconviction analysis were in the opposite direction and, although non-significant, contradict the
rearrest finding. And the results of the supervision violation analyses were non-significant but in
the same direction as the rearrest analyses. In response to the inconsistent results, additional
models were run to tease out the discrepant findings.
Part of the problem may be that the total needs score combines many subscales which
could interact with transportation access in different ways. When combined, the subscales could
produce confusing effects. The criminogenic needs scale, or total needs scale, is comprised of 25
subscales that measure: antisocial attitudes, criminal history, educational strengths, educational
needs, employment/financial, housing safety, antisocial friends, anger/hostility, mental health
history (overall, depression/anxiety, and psychosis), current mental health (overall,
depression/anxiety, and psychosis), abuse and maltreatment as children and as adults (4 scales),
substance abuse history, current substance abuse, relationship stability, parenting involvement,
family support, family conflict, self-efficacy and parenting stress.
An interaction term was created for each subscale that was multiplied by the
transportation access scale and was used to predict odds of rearrest. Three of these interaction
This document is a research report submitted to the U.S. Department of Justice. This report has not been published by the Department. Opinions or points of view expressed are those of the author(s)
and do not necessarily reflect the official position or policies of the U.S. Department of Justice.
terms were significant and one other approached significance: antisocial friends (p = .039),
maltreatment as a child (p=.040), family support (p=.027), and self-efficacy (p=.053). Table 9
shows that the direct effects for each subscale are in the expected direction – the impact of
‘antisocial friends’ and ‘maltreatment as a child’ increase the odds of rearrest whereas family
support and self-efficacy both reduce the odds of rearrest.
Women who score highly on the antisocial friends scale (i.e., they have friends who have
been in trouble with the law, done prison time, been on community supervision; or they have
committed offenses with a friend, spent time with people who abuse drugs/alcohol), compared to
women who score lower on the scale, experience a 9,213% increase in their odds of rearrest,
[exp(4.484 -.306) = exp(4.534) = 93.13, or 100(93.13-1) = 9,213%]. At specific levels of
transportation access the disordinal or ordinal nature of the interaction effect can be explored.
Women at low levels of transportation access experience a 3,437% increase in odds of rearrest
whereas women at high levels of transportation access experience a 34% decrease in odds of
rearrest. This is a disordinal interaction effect, the effect changes in direction (i.e., increase
versus decrease) over levels of the moderator variable, but results are in the expected direction.
That is, lower levels of transportation access lead to higher levels of rearrest and higher levels of
transportation access lower odds of rearrest.
Similarly, women who experienced high levels of maltreatment as a child have 37,178%
increase in their odds of rearrest [exp (6.314 -.393) = exp(5.921) = 372.78, or a 100(372.78-1) =
37,178%], compared to women with lower levels of maltreatment as a child. Women at lower
levels of transportation access experience a 16,886% increase in the odds of rearrest [(exp (6.314
-.393(3)) = exp(5.135) = 169.86, or a 100(169-1) = 16,886%] whereas women with higher levels
47
This document is a research report submitted to the U.S. Department of Justice. This report has not been published by the Department. Opinions or points of view expressed are those of the author(s)
and do not necessarily reflect the official position or policies of the U.S. Department of Justice.
of transportation have a much smaller, 2.6%, increase in their odds of rearrest [(exp (6.314 -
.393(16)) = exp(.026) = 1.026, or a 100(1.026-1) = 2.6%].
Women who have high levels of family support and high levels of transportation access
experience a 98.74% decrease in odds of rearrest, compared to women with lower levels of
family support. Women who have high levels of family support and low levels of transportation
access experience only a 15% decrease in odds of rearrest, compared to women with lower levels
of family support.
Women who have high levels of self-efficacy and high levels of transportation access
experience a 99.96% decrease in odds of rearrest, compared to women with low levels of self
efficacy. Women who have high levels of self-efficacy and low levels of transportation access
experience a 89% increase in odds of rearrest, compared to women with low levels of self
efficacy. This interaction effect is disordinal but in the expected direction.
The models in Table 9 better explain the nature of the disordinal interaction effect for the
relationship between overall criminogenic needs and rearrest which is moderated by
transportation access. It is clear that the overall moderation effect, when teased out, does not
show that, for women with similar levels of criminogenic need, those with higher levels of
transportation access have greater odds of rearrest and those with lower levels of transportation
access have lower odds of rearrest. In fact, the subscales that comprise the larger criminogenic
needs scale, when examined individually, reveal that greater levels of transportation access
actually lower odds of rearrest.
Impact of Transportation Access on Recidivism Outcomes
To address the fifth research question, regarding whether transportation access adds to
the understanding of recidivism (rearrest, reconviction and supervision violation) both logistic
48
This document is a research report submitted to the U.S. Department of Justice. This report has not been published by the Department. Opinions or points of view expressed are those of the author(s)
and do not necessarily reflect the official position or policies of the U.S. Department of Justice.
regression and survival analysis are employed.
Rearrest. Model 2 of Table 6 shows that, for every one-unit increase in composite access
score, or for every additional point in access score, a .069 decrease in the log-odds of rearrest is
expected. This is in line with the expectation that better transportation access should lower odds
of recidivism events. In terms of the odds ratio, each unit increase in the composite access score
lowers the odds of rearrest by 100[exp(-.069) - 1] = - 6.67, or 6.67%. But this effect is not
statistically significant (p=.325).
Reconviction. Looking at Model 2 of Table 7, every one-unit increase in composite
access score, or every additional point in access score, translates to a .029 decrease in the log-
odds of reconviction. This is in line with the expectation that better transportation access should
lower odds of recidivism events. In terms of the odds ratio, each unit increase in the composite
access score lowers the odds of rearrest by 100[exp(-.029) - 1] = - 2.8, or 2.8%. But this effect is
not statistically significant (p=.697).
Supervision violation. The results of the analyses (Table 8) were in the same direction
and magnitude as the analyses for rearrest and reconviction. For every one-unit increase in
composite access score, or every additional point in access score, translates to a .113 decrease in
the log-odds of supervision violation. This is in line with the expectation that better
transportation access should lower odds of recidivism events. In terms of the odds ratio, each
unit increase in the composite access score lowers the odds of rearrest by 100[exp(-.113) - 1] = -
10.7, or 10.7%. But this effect is not statistically significant (p=.121).
Survival analysis with Cox Regression. To further address research question 5, Cox
regression could be used because the recidivism data contained the specific date when offenders
were rearrested or reconvicted for a new offense, or if they experienced a supervision violation.
49
This document is a research report submitted to the U.S. Department of Justice. This report has not been published by the Department. Opinions or points of view expressed are those of the author(s)
and do not necessarily reflect the official position or policies of the U.S. Department of Justice.
The coding for the rearrest and reconviction analyses is first discussed, followed by the coding
strategy for supervision violations which differed slightly from the rearrest and reconviction
analyses.
As a type of survival analysis, Cox regression is preferable to Logistic Regression in that
it utilizes time-dependent data, which are important in determining not only whether offenders
recidivate, but also when they recidivate while allowing individuals to have different ‘times at
risk.’ It allows for comparison of women with, for example, 7-month follow-up periods to those
with 18-month follow-up periods. To do so, Cox regression utilizes both “time” and “status”
variables in estimating the impact of the independent variables on recidivism outcomes. The
“time” variable measures the amount of time (days) from the date of the wave three interview
until the date of first rearrest or reconviction, or December 3, 2013 for those who did not
recidivate. Smaller time units provide more time intervals which reduces ties (e.g., two women
with same amount of time until rearrest; which lowers variance to be explained) and increases
the statistical power of Cox Proportional Hazard models (Garson, 2013). Therefore, the unit of
time was coded as days.
For supervision violations the “at risk period” is calculated differently and the sample
size is different. The sample of 366 was reduced for the supervision violation analysis to 287
women. The process for achieving this number is explained in greater depth in the methods
section. To summarize, 79 women, or 21.6% of the 366 women, were removed from the analysis
because they were not on supervision at any time during this six-month period, most often
because they were discharged from probation or parole before the third interview. This means
they were never “at risk” for this type of recidivism event and should not be included in a model
predicting an event for which they could not experience (supervision violation). For the 104
50
This document is a research report submitted to the U.S. Department of Justice. This report has not been published by the Department. Opinions or points of view expressed are those of the author(s)
and do not necessarily reflect the official position or policies of the U.S. Department of Justice.
women who were absent from part of the observation period, meaning they had less than 6
months of data for various reasons (i.e., they were discharged, went to jail/prison, died, or data
were not available), they were included in the analysis and their “at risk” period was adjusted
appropriately. Using this method, the average follow-up period, or “at risk period” for women in
the sample (n = 287) was 125.92 days or approximately four months. During this time period, 72
of the 287 (25%) women experienced at least one supervision violation and ten of these were for
transportation-related supervision violations (e.g., driving without a license or failure to report
due to car troubles); 216 (74.9%) women did not experience a supervision violation.
For all three types of recidivism, the “status” variable was a dichotomous variable that
measured whether one of the three recidivism events had occurred (i.e., rearrest, reconviction, or
supervision violation). Lack of variance in the status variable (i.e., the low number of women
who experienced recidivism events) is not a problem for Cox Regression since what is analyzed
is the time until an event occurred, not the variance of the event variable itself (Garson, 2013,
Chapter 4, Section 2, para.2). Because variance on the time variable is more important than
simple event occurrence, Cox Regression is the appropriate model for accounting for varying
lengths of follow-up times and overdispersion of data.
The independent variable, or main focus variable, access to transportation, is grand mean
centered (i.e., the woman’s score minus the mean) to aid in creating more accurate baseline
hazard rates, which are the time-only rates when all covariates are zero, that are estimated at the
mean instead of at zero. This strategy also allows for interpretation at mean values instead of
zero, which is helpful when zero is not a realistic value. As discussed earlier, this is not a
primary goal for these analyses, for which mean transportation access is not a useful comparison
point.
51
This document is a research report submitted to the U.S. Department of Justice. This report has not been published by the Department. Opinions or points of view expressed are those of the author(s)
and do not necessarily reflect the official position or policies of the U.S. Department of Justice.
In Table 10, the hazard ratios are presented. It is calculated by exp(b) where b is the Cox
regression coefficient (not shown in table). The hazard ratio is an effect size measure used to
assess the direction and importance of the effect of the predictor variable on relative risk of the
event, controlling for other predictors in the model (Garson, 2013, Chapter 4, Section, 23, para.
1). The role of the predictor variables is better assessed by looking at hazard ratios than looking
at Cox regression b coefficients. In short, the hazard ratio reveals the amount of change in the
hazard of rearrest occurring for each unit increase in transportation access score. A hazard ratio
of greater than 1 would mean that the access score increases the odds that a rearrest will occur
and decreases time until the rearrest. On the other hand, as shown in Table 10, the hazard ratio
for transportation access (.946) is less than 1 and indicates that, for each unit increase in
transportation access, the hazard of rearrest decreases by .946, or the greater the transportation
access score, the lower the odds of rearrest and longer the time until rearrest. Further, each unit
increase in access lowers rearrest rate by 5.4% (100*(.946-1)). However, the results from the
Cox regression models show that the covariate for transportation access did not have a
statistically significant impact on the hazard of rearrest (p=.368, not shown). Similarly, in the
reconviction and supervision violation models, the impacts of transportation access on
Table 10. Cox Proportional Hazards Model: Time Until Three Recidivism Events
This document is a research report submitted to the U.S. Department of Justice. This report has not been published by the Department. Opinions or points of view expressed are those of the author(s)
and do not necessarily reflect the official position or policies of the U.S. Department of Justice.
reconviction and supervision violations were non-significant (p = .772 and p = .144,
respectively).
The likelihood ratio (755.828), if significant, would indicate the model as a whole is
significant. Because only one covariate is in the model for rearrest, this statistic indicates that the
model with transportation access, compared to the null model (the time-only model when all
covariates are 0), does not contribute significantly to the explanation of rearrest because the p-
value is not significant (p=.368). Similarly, transportation access does not contribute to the
explanation of reconviction (p=.772) or supervision violations (p=.144).
Despite the non-significant covariates, it is worth examining the survival functions at
different levels of transportation access. Women in the sample only reported medium to high
levels of transportation access; that is, there were no women in the sample who reported low
transportation access. Figure 2 shows that the survival curve is steeper for women with lower
levels of transportation access (i.e., at medium levels, the bottom line) than for women with
higher levels of transportation access. At the end of the observation period, about 73% of women
with medium levels of transportation access had not been rearrested. Yet, at the same time point,
about 83% of women with higher levels of access had not been rearrested. Although the
covariate for transportation access was non-significant, this finding suggests that higher levels of
transportation access do slow time until rearrest. The results were the same for the reconviction
and supervision violation analyses (not shown); women with lower levels of transportation
access (medium levels), compared with women who had higher levels of transportation access
(high levels), had more incidents of recidivism and experienced shorter times until the recidivism
event. These results, although non-significant, are in the expected direction. That is, higher levels
53
This document is a research report submitted to the U.S. Department of Justice. This report has not been published by the Department. Opinions or points of view expressed are those of the author(s)
and do not necessarily reflect the official position or policies of the U.S. Department of Justice.
of transportation access result in lower levels of recidivism and longer times until recidivism
events occur.
Figure 2. Survival Function for Levels of Transportation Access
To obtain a more refined measure of recidivism that may be more closely linked to
transportation access, survival analyses were also run in which reconvictions were coded as
transportation-related (rearrest data do not contain the reason for rearrest) Using this procedure,
only 12 women had transportation-related recidivism events (about 10% of all reconvictions)
such as driving without a license or while intoxicated. Cox Regression can handle these low
54
This document is a research report submitted to the U.S. Department of Justice. This report has not been published by the Department. Opinions or points of view expressed are those of the author(s)
and do not necessarily reflect the official position or policies of the U.S. Department of Justice.
event numbers and was used. The results showed that transportation access was not a significant
predictor of transportation-related reconviction (results not shown).
The findings of the quantitative analysis answered four main research questions. First, the
scope of transportation deprivation was found to be quite extensive for women who were found
to lack many resources needed to get from place to place. Women reported low levels of
individual and community level resources. Second, an instrument (a composite score) was found
to capture women’s level of transportation access. Third, preliminary data analysis suggested that
despite the low levels of resources women had at their disposal, they still reported high levels of
access to transportation in terms of stress, ease, cost, and time associated with travel. However,
the results of multivariate analysis revealed that several resources do significantly predict
transportation access. Yet, explanations for the low correlations between resources and access is
explored in greater depth in the following chapter. Fourth and fifth, transportation access, and its
relationship to criminogenic needs, was found to lower the odds of experiencing recidivism
events and the time until these events occurred. Further, the findings indicate that transportation
access is especially important for women with certain criminogenic needs – those with antisocial
friends, histories of child maltreatment, greater family support and greater self-efficacy.
These analyses raised questions about how women view both resources and access. The
next chapter explores women’s use of additional resources not captured in the quantitative
analysis and also attempts to improve the conceptualization of access. The quantitative data and
findings are instrumental in providing the sampling frame for women who can best address
questions raised in this section of the dissertation analysis.
55
This document is a research report submitted to the U.S. Department of Justice. This report has not been published by the Department. Opinions or points of view expressed are those of the author(s)
and do not necessarily reflect the official position or policies of the U.S. Department of Justice.
CHAPTER 5: RESULTS OF QUALITATVE DATA ANALYSIS
Descriptive Statistics
The goal for the qualitative component of the research was to capture women’s insights,
experiences, and strategies regarding transportation resources and access and to more fully
understand whether lack of access contributed to recidivism. Specifically, four main research
questions were examined with the qualitative data: (1) the types and intensity of transportation
problems women experience while under supervision, (2) women’s use of additional resources,
not captured by quantitative measures, that increased transportation access, (3) strategies women
used to increase transportation access and whether these strategies brought women into conflict
with the law and (4) whether transportation problems contributed to any violations or new
offenses.
Table 11. Transportation Indicators, Comparison of Full Wave 3 Sample to Three SubgroupsWave 3
(n = 366)
Mean/PercentResources: Individual Level Do not own/lease vehicle 68.0% 72.0% 80.0% 68.0% Do not have access to registered and insured vehicle 37.0% 16.0% ** 56.0% 24.0% Do not have a valid driver’s license 58.0% 64.0% 76.0% 52.0% Poor or very poor physical well being 13.1% 12.0% 13.1% 12.0% Difficulty walking one block in summer 23.0% 20.0% 26.0% 17.0% Poor vision, even with contacts/glasses 29.0% 28.0% 21.0% 24.0%Resources: Family and Friends Level Number of friends/family can help with transportation needs 3.1 4.2 ** 2.2 ** 3.3 Transportation-related help from friends/family 3.1 3.4 3.0 3.3 Transportation-related help from friends/family for children 3.4
Note: Asterisks indicate significant difference between the subgroup and wave 3 sample (without that subgroup included)***p<.001, **p<.01, *p<.05
Follow-up Interview (n = 25 each)Transportation
Untroubled
Mean/Percent
Transportation Troubled
Mean/Percent
Transportation Strategizers
Mean/Percent
56
This document is a research report submitted to the U.S. Department of Justice. This report has not been published by the Department. Opinions or points of view expressed are those of the author(s)
and do not necessarily reflect the official position or policies of the U.S. Department of Justice.
To ensure that sufficient numbers of women were included in the follow-up interview
sample to address these four research questions, three purposively sampled groups of women
(total n = 75) from the quantitative portion of the study (n=366) were interviewed. Descriptive
statistics are presented to illustrate how these subgroups differ from the larger sample from
which they were recruited.
The first group of women, Transportation Troubled, was characterized by Low
Resources, Low Access, Medium-High Recidivism; 70 women in the group of 366 met these
criteria. Women with these characteristics were chosen because they represent the expected
finding, that women who have low resources will also have low access which will lead to
recidivism problems. Table 11 shows that, overall, the 25 women who were interviewed from
this group did have lower transportation resources at the individual and community levels (but
had higher resources at the family/friends level), had lower access, and did have much higher
rates of recidivism. The main research question for these women is whether and how limited
transportation resources and/or access lead to recidivism events.
In the second and third groups, findings counter to the main hypothesis are examined.
The second group of women, Transportation Untroubled, are those for whom transportation does
not appear to be related to recidivism at all; that is, despite low levels of both access and
resources, recidivism remains low. Table 11 shows that, overall, women in this group had greater
transportation resources at the individual level but fewer resources at the family/friends and
community levels than the full sample of 366 women. Their level of access was slightly lower
and their recidivism was much lower than the full sample. This group behaves opposite what
would be predicted by the main hypothesis. The main question here is, why don’t transportation
problems lead to recidivism events?
57
This document is a research report submitted to the U.S. Department of Justice. This report has not been published by the Department. Opinions or points of view expressed are those of the author(s)
and do not necessarily reflect the official position or policies of the U.S. Department of Justice.
The third group of women, Transportation Strategizers, were chosen because, for them,
transportation resources do not appear to be linked to transportation access. They have achieved
medium to high levels of access while still retaining low levels of recidivism, despite low levels
of resources. Women had lower levels of individual and community transportation resources,
slightly higher family/friends resources, but significantly higher rates of access and significantly
lower rates of recidivism. For these women, the questions are related to how they were able to
gain greater access and whether the strategies they used resulted in positive outcomes.
Table 11 shows, then, that more or less, the sampling goals were met for each group and,
therefore, there are sufficient numbers of women in the sample (n=75) to address each research
question. Beyond achieving sampling goals, the group differences are not intended to provide a
framework for the qualitative analyses. Each woman in the study, regardless of sampling group,
was asked the same series of open-ended questions. As such, women’s narratives (i.e., the
complete transcripts from the interviews) are most often analyzed together for each research
question; that is, group differences are only examined when relevant to a research question.
One final note is that, because these are purposively sampled groups, even though
regression analyses are performed as part of the analyses, it is important to interpret those results
remembering that these groups are not representative of a larger population. Appropriate
interpretations are provided. These results should not be generalized to all women offenders
without running appropriate sample selection models (which would not be appropriate because
of the extremely small sample sizes of 25 women in each group). The ability to generalize to a
larger group of women offenders should be addressed with future research.
Types, Intensity, and Comparative Importance of Transportation Problems
The first research goal of the qualitative data analysis was to investigate the types and
58
This document is a research report submitted to the U.S. Department of Justice. This report has not been published by the Department. Opinions or points of view expressed are those of the author(s)
and do not necessarily reflect the official position or policies of the U.S. Department of Justice.
intensity of transportation problems impacting women. This question was partitioned into three
subquestions addressed in the follow-up interview. Because so few women reported having
problems with dependable transportation in the third wave of data collection (17.5% of 379
women), but also reported low levels of transportation resources (See Table 2), the primary
question and subquestions were designed to explore the nature of transportation problems in
three important ways. First, to understand why most women reported high levels of access to
transportation at wave three, women were asked to talk about any transportation problems they
had experienced in the past five years. Second, to investigate whether women reported high
levels of access to transportation because they were minimizing the amount of transportation-
related hardship they were experiencing, the intensity of each transportation problem women
reported was rated from minor to severe by coders. Because the intensity was not assessed by
women, but instead by coders, the rating approach should avoid women's attempts to minimize
their problems. Third, to look at whether women were reporting high levels of transportation
access, or low levels of deprivation, because they were situating the level of difficulty their
transportation problems present in relation to other problems they encounter, women were asked
to report their top three concerns, which takes into account women's perspectives on their
problems. Answering these three subquestions illuminates why women seem to be experiencing
hardship (e.g., they are reporting low levels of resources) but do not report experiencing hardship
(i.e., they are reporting high levels of transportation access).
Data used to answer these three subquestions come from responses to several questions
women were asked in the in-depth follow-up interview: "Looking back, over the past five years,
when you did have transportation problems, what were they? Currently, would you say that the
way you get to and from supervision appointments, grocery stores, appointments, etc. is stressful
59
This document is a research report submitted to the U.S. Department of Justice. This report has not been published by the Department. Opinions or points of view expressed are those of the author(s)
and do not necessarily reflect the official position or policies of the U.S. Department of Justice.
or complicated – or easy and not worrisome? Currently, do any of your arrangements for getting
around place you in danger or in a difficult situation? Overall, thinking about the ways you
arrange transportation, now or in the past, what is hard or easy about it?" Intercoder reliability
was established for the types of problems (Cohen’s kappa = .912) women reported and for the
intensity of each problem reported (kappa = .735). Consistent with Cicchetti (1994), these kappa
values represent excellent and good intercoder agreement, respectively (see Hruschka et al. 2004
for a comprehensive analysis of acceptable cutoff values for Cohen's kappa). Responses to two
other items were included in the analysis; but, due to the straightforward nature of the responses,
intercoder reliability was not established.
Two other measures of transportation problems were used. Women were asked at wave
three and at follow-up interview to indicate the extent to which they agreed that they have access
to dependable transportation. This generated two measures of dependable transportation –one
from each time period. Finally, women were asked, at the end of the follow-up interview, to
Table 12: Transportation Problems, and Intensity Level, Reported at Follow-up InterviewIntensity of Problem
60
This document is a research report submitted to the U.S. Department of Justice. This report has not been published by the Department. Opinions or points of view expressed are those of the author(s)
and do not necessarily reflect the official position or policies of the U.S. Department of Justice.
report their top three concerns at that moment. To minimize priming effects, women were
reminded that transportation need not be a top concern.
Table 12 was generated using NVivo software; the unit of analysis is transportation
problems, not women. The 75 women in the sample collectively reported experiencing 505
transportation problems. The most commonly reported type of problem was coordinating help
(24.8% of problems), followed by legal problems/legal costs (16% of problems), and car
problems (13% of problems). The most pressing or intense problems were also in the areas of
legal problems, coordinating help, and car problems. Types of problems and intensity of
problems are discussed separately and in greater detail in the next two sections.
Analysis of types of transportation problems. To address the first subquestion, whether
women are experiencing transportation problems, women's responses to the in-depth interview
questions were coded to identify the types of transportation problems women reported
experiencing. Although women overwhelmingly reported having high levels of access to
dependable transportation at wave three (140 agree and 162 strongly agree), at the follow-up
interview, 71 of 75 women reported experiencing at least one of ten different types of
transportation problems.
For example, one older woman [628] reported she had high access to transportation (she
uses a special bus service for older and disabled individuals) at wave three, but her follow-up
interview makes clear that she has at least four problems: inadequate bus service, weather,
safety, and coordinating help. Specifically, answering a question about whether she ever had any
problems with transportation, she says:
There was a couple bus drivers who were kinda sleazy, but – I eventually got them to stop. [They were] trying to cop a feel…and talking about just like something like, about how good it was to be between my legs and just crap like that…You'd be surprised how many little old lady hunters there are. This one guy,
61
This document is a research report submitted to the U.S. Department of Justice. This report has not been published by the Department. Opinions or points of view expressed are those of the author(s)
and do not necessarily reflect the official position or policies of the U.S. Department of Justice.
I’m not kidding. I know this man is a predator. I thought he was nice at first. I saw – and he helped me carry my groceries in, and he picked up my key to my apartment – my extra key that I have. He’s – nobody lives here but me. It was setting over there where I – probably sounds stupid, but I wear them around my neck. I don’t wanna lose them. I locked myself out there one time, and since then, I’ve put them around my neck. But I have a spare key, and I saw him do it, and he left, and I called him, and – you know? “I didn’t do that.” Yeah, well, I wouldn’t – they changed the locks so I know he doesn’t have it, but there’s – this guy is – this ain’t no nice man. He’s apparently done something else because he did get fired, but I don't know. That was not a nice guy.
When the interviewer asked for further clarification about problems with transportation,
the women further explained that she did not consider her experience a transportation
problem, emphasized again that she is grateful for her access to this special bus, but then
continued to explain problems with the service:
Yeah, well, it’s – no, no problem. That’s – I really am grateful. I wouldn’t go as far as to say stressful, but it’s not entirely easy and uncomplicated. You have a set time that they’re coming, but within that, they have 45 minutes to get there. And you have to sit, and watch, and wait, watch – and if you’re not there, they will leave you…So, I have to go outside, and if it’s raining, or it’s whatever, there I am sitting out there.
Although this woman says she has no real transportation problems, in the process of her
travels, she was actually verbally assaulted, had her house key stolen and felt fearful the
bus driver would return, has had to wait outside in bad weather, and spends a great deal
of time waiting for the bus. This women’s account illustrates that just because women
initially report high levels of transportation access, it remains necessary to dig deeper to
discover what they consider high access and whether they still may be experiencing
transportation problems.
Many women reported experiencing more than one problem; the range was zero to six
types of problems. Four women (5.3%) reported experiencing zero types of problems, 16
(21.3%) reported experiencing one type of problem, 28 (37.3%) reported two types, 17 (22.7%)
62
This document is a research report submitted to the U.S. Department of Justice. This report has not been published by the Department. Opinions or points of view expressed are those of the author(s)
and do not necessarily reflect the official position or policies of the U.S. Department of Justice.
reported three types, nine (12%) reported four types and one woman (1.3%) reported six
different types of problems. Women who reported a greater number of types of problems were
significantly more likely to have reported lower levels of transportation access at wave three
(Pearson Correlation Coefficient -.242; p-value = .037). However, recall that women reported
their level of access to dependable transportation at both wave three and the follow-up interview
and the latter measure was not correlated with number of problems.
The results of the analysis of the 75 follow-up interviews showed that, in order from most
to least commonly reported, the ten types of problems women reported were: difficulty arranging
rides (56% of women), experiencing legal problems and related costs (33.3%), having car
problems (32%), bus service is inadequate (22.7%), has help but from unreliable people (22.7%),
direct costs of transportation are prohibitive (20%), safety concerns (12%), not having people to
provide transportation help (8%), and experiencing weather issues (4%) or having health
problems that impede travel (8%).
To evaluate whether women who experienced specific types of transportation problems
were more likely to report lower levels of transportation access (at either wave three or at follow-
up interview), bivariate correlations were calculated for the ten types of transportation problems
women reported (see Table 12 for list). The expectation is that women who report lower levels of
transportation access may also report certain types of problems. This would indicate that certain
types of problems, or combinations of problems, may result in greater transportation deprivation
than other types. Significant and negative correlations are therefore expected.
Several significant findings emerge. Women who reported they had access to dependable
transportation at wave three reported fewer problems with direct costs of transportation (Pearson
Correlation Coefficient = -.236; p = .041) and fewer problems with unreliable help (Pearson
63
This document is a research report submitted to the U.S. Department of Justice. This report has not been published by the Department. Opinions or points of view expressed are those of the author(s)
and do not necessarily reflect the official position or policies of the U.S. Department of Justice.
Correlation Coefficient = -.285; p = .013), at the follow-up interview. Women who reported they
had access to dependable transportation, at the follow-up interview, reported fewer problems
with direct costs of transportation (Pearson Correlation Coefficient = -.304; p = .008) and fewer
safety concerns (Pearson Correlation Coefficient = -.257; p = .026); however, they reported
greater problems with legal costs or issues (Pearson Correlation Coefficient = .255; p = .027).
Across both time periods then, problems with direct costs of transportation were more
highly correlated with reports of access to dependable transportation. For women, having money
to pay for bus fare, or to give to rides for gas money, was significantly correlated with whether
they reported having access to dependable transportation. At only one of the two interviews,
women's ratings of dependable transportation hinge on whether they have reliable help (wave 3)
or feel safe while traveling (follow-up interview). The one perplexing finding is that, at the
follow-up interview, women who reported they had dependable access also reported greater
levels of legal problems such as not having a valid license. This finding warranted closer
analysis.
There were 30 instances in which women reported legal problems; in only two instances
did women equate legal problems with lack of dependable transportation. For the 28 instances in
which women reported both having dependable access and experiencing legal problems with
transportation, there were 23 women involved. The responses for these 23 women were read and
grouped by type of legal problem into three areas: women does not have a license but does not
drive (n=2 women); woman does not have a license but does drive (n=17); and woman has other
legal problem such as vehicle not having plates or being street-legal (n=4). Looking at the
narrative accounts, then, it appears that the main legal problem women face is that they do not
have a valid driver's license. However?, women do not view this as a transportation problem.
64
This document is a research report submitted to the U.S. Department of Justice. This report has not been published by the Department. Opinions or points of view expressed are those of the author(s)
and do not necessarily reflect the official position or policies of the U.S. Department of Justice.
These seemingly inconsistent findings explain why women would report they have high levels of
access but also high levels of legal problems. One woman with legal problems but who says she
has high access to transportation explains her situation is stressful because, "I have a car and
have no license." Similarly, another woman admits it is not ideal but a lack of license does not
mean lack of transportation, in response to the question, "Was transportation ever a problem for
you?"
"No… Just because I always had a car. No license, but a car… I don't like doing it, but I have three kids, and I have to work. Transit can't do it out here…I have no way to work."
Finally, a third woman explains that, even though her license was not valid, she still needed to
drive and:
"…that was scary because I was still on parole. And I’m thinking, ‘Oh my Gosh, if I get stopped. Here goes another year on parole. Here goes a violation.’ So that was very worrisome. I was always looking in the rear view mirror. A cop would go by. I sort of had a stroke."
Therefore, the significant bivariate correlation, in the opposite direction as expected, is present
because women do not equate legal barriers with lack of access to transportation. This suggests
that the current wording of the dependable access question [To what extent, do you agree that,
“Most days I have access to dependable transportation?” Dependable transportation means you
have money for bus fare, gas for your car, your car will start and run without a problem, and you
have access to it when you need it if you share it.] should be revised, in future studies, to include
phrasing targeting legal ability to drive.
Analysis of intensity of transportation problems. The second subquestion investigates
whether women minimize the severity of hardship, or intensity of problems, they experience
related to transportation access. To assess this dimension, the coders rated the intensity of each
transportation problem women reported. The level of intensity for each transportation problem
65
This document is a research report submitted to the U.S. Department of Justice. This report has not been published by the Department. Opinions or points of view expressed are those of the author(s)
and do not necessarily reflect the official position or policies of the U.S. Department of Justice.
was evaluated and categorized as minor (i.e., woman gets where she needs to be but experiences
minor annoyance or inconvenience, usually shorter term); moderate (i.e., woman gets where she
needs to be but may be quite late, getting there requires high levels of effort and inconvenience),
or severe (i.e., woman does not get where she needs to go or must violate the law to get there,
often longer term; transportation is a barrier). Because this was not assessed by women, it should
not be confounded by their tendency to minimize their problems. In the follow-up interview,
49% of women reported at least one minor transportation problem; 39% of women reported at
least one moderate transportation problem; and 29% of women reported at least one severe
transportation problem. This indicates that, despite few women reporting overall lack of
dependable transportation, significant numbers of women recount transportation problems with
high intensity levels.
To tease out whether the intensity of problems women reported was related to women’s
self-reported ratings of access to dependable transportation (at either wave three or at the follow-
up interview), bivariate correlations were calculated to show the connection of ratings of
dependable transportation with an ordinal variable reflecting the three levels of problem coder-
rated intensity (minor, moderate or severe). The expectation is that women who report that they
have access to dependable transportation will report less severe transportation problems than
women without dependable transportation.
The results of this analysis support the hypothesis. Intensity of problems was correlated
with women’s ratings of access at both wave three and the follow-up interview, in the expected
directions (results not shown). That is, women with lower levels of access are describing more
intense transportation problems than women who describe higher levels of access.
66
This document is a research report submitted to the U.S. Department of Justice. This report has not been published by the Department. Opinions or points of view expressed are those of the author(s)
and do not necessarily reflect the official position or policies of the U.S. Department of Justice.
Consider, for example, the problems two women for whom, as access decreases, intensity of
problems increases. First, one woman [653] explains the financial problems she encounters
arranging transportation:
It’s iffy, it just varies on, you know, if we can come up with the money just to take the bus because my kids are right at that point where you have to pay for them now so it’s like my income’s only $100.00 a month and I gotta put that to [the electric company] so it’s just – and I’ve been sick so I can’t donate [plasma] no more so it’s like it’s iffy on –
Another woman [673] with lower access than the first woman reports a higher intensity issue;
she explains that her transportation problems resulted in her being mugged and suffering a
concussion, "Yes. Case in point, I was mugged…It was when I was trying to get on the bus.”
The findings suggest that the types of problems low-access women report are more intense than
those described by higher-access women.
Analysis of comparative importance of transportation problems with other
problems. The third subquestion is designed to reveal whether women may be reporting high
levels of transportation access, or low levels of deprivation, because they are perceiving that the
level of transportation difficulty they face is relatively less severe compared to the severity of
other problems they encounter. To assess this question, which takes into account women's
perceptions of their problems, women were asked to report their top three concerns. Out of 75
women, 32 (42.6%) reported transportation as one of their top three concerns; in fact, it was the
most common area of concern given. This result should be interpreted with some degree of
caution due to priming effects, because women had just been asked about transportation concerns
earlier in the interview.
From the most commonly reported concerns to the least commonly reported, women's
other areas of concern were: finances in general (40%), others' health and wellbeing (32%),
67
This document is a research report submitted to the U.S. Department of Justice. This report has not been published by the Department. Opinions or points of view expressed are those of the author(s)
and do not necessarily reflect the official position or policies of the U.S. Department of Justice.
personal health and safety including addiction (29.3%), housing (25.3%), employment (25.3%),
going back to jail or not meeting terms of probation/parole (24%), education (18.7%), repairing
or maintaining personal relationships (16%), and personal improvement (13.3%).
One could expect that women who report transportation as a top concern would also
describe lower levels of access to dependable transportation. Bivariate correlations revealed that
whether women ranked transportation as a top three concern was not significantly correlated
with their own self-reported access to transportation. The expectation that women who reported
less access to dependable transportation at either wave three or the follow-up interview (two
separate variables) would report that transportation as a top concern was not supported.
Resources Used To Increase Transportation Access
The second research goal of the qualitative data analysis was to investigate women's use
of additional resources, not captured in the quantitative measures, to increase their access to
dependable transportation. This goal addresses whether the low correlation between women's
transportation resources and access is due, in part, to omitted variable bias. That is, measures of
transportation resources that were omitted from the list administered in the wave three interview
may contribute to the low correlation between measured resources and measures of access. To
explore this issue, questions in the time 4 in-depth interview were designed to elicit responses
about all the resources women use for getting from place to place. Due to the straightforward
nature of these questions, intercoder reliability was not established.
In the follow-up interview, women were asked which of the original list of transportation
resources, from wave three, they made use of; they also were asked to comment on whether they
rely on "other people" or "other programs" for help with transportation. This direct line of
questioning generated a list of resources not previously included in the wave three closed-ended
68
This document is a research report submitted to the U.S. Department of Justice. This report has not been published by the Department. Opinions or points of view expressed are those of the author(s)
and do not necessarily reflect the official position or policies of the U.S. Department of Justice.
data collection instrument. In all, 49 women discussed using at least one resource; 26 women did
not report using any resource. The first, and most common, resource women discussed was
receiving gas cards/bus tokens given to them by mental health providers (n=16), parole or
probation officers (n=10), or job search services (n=11). Women also reported receiving rides
from professionals in their lives (n=12) or members of their extended support network (n=14),
aside from family and friends previously asked about in wave three. A less common resource,
utilized only by women in the sample with physical disabilities was discounted bus passes (n=2).
Also, included in Table 13, a major resource for women was having an accommodating
supervision agent – one who made notes about women's transportation problems but did not
violate them for missing scheduled appointments.
Also, in the follow-up interview, a second attempt was made to elicit additional resources
women use to augment their access to transportation. Women were asked to look at the complete
list of resources from wave three and were directly asked (1) whether other resources were
missing from the list and, because all women included in the follow-up interviews reported low
resources at the wave three interview, they were asked (2) how they were able to gain access to
transportation despite having limited resources. Several women did not understand the question,
Women N (%)
Receiving gas cards or bus tokens to attend:Mental and general health providers (Medicaid) 16 (21.3%)Parole or probation meetings 10 (13.3%)Employment or job help services 11 (14.7%)
Receive rides from other professional (caseworker) 12 (16.0%)Receive help from extended network (co-workers) 14 (18.7%)Supervision agent is accommodating (reschedules appt) 14 (18.7%)Receives discounted bus fare (disability status) 2 (2.7%)
Table 13. Additional Resources Women Use to Increase Access to Transportation (n=75)
Resource
69
This document is a research report submitted to the U.S. Department of Justice. This report has not been published by the Department. Opinions or points of view expressed are those of the author(s)
and do not necessarily reflect the official position or policies of the U.S. Department of Justice.
but for those that did, useful information was generated; 21 new resources were suggested by 15
women in this section of the interview and were incorporated into Table 13.
Taken together, these findings highlight that there are resources available to women,
albeit they are patchwork in nature, for getting to and from some needed services such as
employment help, medical care and supervision appointments. However, more comprehensive
resources that help women with several needs simultaneously are lacking. Women were quick to
identify holes in services such as limited availability of friends or family, or unreliable sources
for bus tokens or limited bus routes and travel times. However, that women are making use of
these resources suggests they do have utility, even if limited.
Strategies Used to Increase Transportation Access
The goal for this component of the qualitative research was to capture women’s insights,
experiences regarding strategies they use to increase transportation access and whether these
strategies bring women into conflict with the law (e.g., driving without a license or riding with a
friend who has a felony conviction). Because so few women reported having problems with
dependable transportation in the third wave of data collection (17.5% of 379 women) yet also
reported low levels of transportation resources (See Table 2), the primary goal of this research
questions is to explore possible strategies women use to increase resources and access that were
not measured in the wave three interview.
To engage women in a conversation about their use of strategies, women were asked,
"Thinking about the ways you arrange transportation, now or in the past, what is hard or easy
about it?" Next, women were asked whether they have missed a required supervision
appointment, or another important appointment, and what strategies they use to avoid missing
important appointments. This line of inquiry was helpful in highlighting both strategies that work
70
This document is a research report submitted to the U.S. Department of Justice. This report has not been published by the Department. Opinions or points of view expressed are those of the author(s)
and do not necessarily reflect the official position or policies of the U.S. Department of Justice.
for women and those that do not— that is, those strategies that resulted in missing scheduled
appointments. Women also discussed whether their strategies for arranging transportation were
stressful or easy to use and whether they placed women in danger or a difficult situation.
There were only seven women who were unable to recall using any strategy to increase
access to transportation. The remaining 68 women reported using one to six strategies. Women
commonly reported using nine types of strategies (see Table 14) previously unknown to the
researcher to increase their access to transportation. Examples of each strategy are provided in
Strategy Examples of Strategy Women N (%)1. Planning in advance Leaves early for appointment; arranges rides
ahead of time with people or agencies; purchases bus passes ahead of time; knows schedule or uses planner to keep organized 39 (52%)
2. Building extended and extensive support networks
Has several people lined up to help as back ups 21 (28%)
3. Utilizing several modes of transportation
Has several modes of transportation available for each errand; Uses bus as back up for car if broken 21 (28%)
4. Living close Lives close to places she needs to go 20 (26.7%)5. Exclusively relying on romantic partner
Relies primarily on romantic partner for transportation and not on other people; could indicate involvement in utilitarian romantic partnership 14 (18.7%)
6. Driving illegally Drives without a license or without a registered or insured vehicle 14 (18.7%)
7. Trading goods & services Pays people; trades childcare, food stamps, hairstyling; companionship; not really taxable employment 10 (13.3%)
8. Limiting travel Indicates her strategy is to stay home or otherwise limit range of travel; reduce reliance on others 6 (8.0%)
9. Panhandling & other odd jobs Includes plasma donation, posting advertisements on Craigslist; can be counted as employment activities 5 (6.7%)
Table 14. Strategies Women Use to Increase Access to Transportation
71
This document is a research report submitted to the U.S. Department of Justice. This report has not been published by the Department. Opinions or points of view expressed are those of the author(s)
and do not necessarily reflect the official position or policies of the U.S. Department of Justice.
the table. Intercoder reliability was established for the coding of strategies (Cohen’s kappa =
.706); this kappa value represents good intercoder agreement (Hruschka et al., 2004).
The most common strategy women utilized was planning in advance for appointments
(52%). Other common strategies were building extensive support networks and making use of
several modes of transportation, for example, planning for a ride but having a bus pass available,
for appointments. More than a quarter of the sample used these two methods (28%). Other
strategies women used included living close to where they needed to travel (26.7%), relying
exclusively on romantic partners (18.7%), driving illegally (18.7%), trading goods and services
(13.3%), limiting travel (8%), and panhandling or working other odd jobs to pay for
transportation (6.7%).
Many women used a combination of strategies, often simultaneously. For example, using
narratives as the unit of analysis, a common combination of strategies was to live close to
necessary destinations (24 narratives) as well as planning ahead (15 of 24 narratives) and using
multiple modes of transportation (15 of 24 narratives). It was common for women to say that to
ensure they did not miss a required supervision appointment, they, “Just called ahead of time and
let, you know, whoever was going to know what time I had to be there. And if not, if that failed,
ride the bus.” This example illustrates women’s use of planning in advance as well as using
multiple modes of transportation (i.e., arranging a ride ahead of time and also making sure she
could use the bus).
Similarly, women who arranged for several people to be available to take them places (32
narratives) also used multiple modes of transportation (14 of 32 narratives) and planned ahead
(24 of 32 narratives). Because women are utilizing several strategies simultaneously, qualitative
interview methods are able to capture these various methods and how they complement one
72
This document is a research report submitted to the U.S. Department of Justice. This report has not been published by the Department. Opinions or points of view expressed are those of the author(s)
and do not necessarily reflect the official position or policies of the U.S. Department of Justice.
another. By contrast, if women were asked, in a checklist format, for example, whether they use
any of these nine strategies, the interplay between the various strategies would likely be lost.
Further, women may not recognize that they are using several strategies at once.
Although not quantifiable here, the interviewer used several alternative words for
“strategies” to help women see that what they were doing (e.g., calling several people days ahead
of an appointment to arrange transit) is considered strategizing. Most women did not appear to
understand their behavior as being a purposive and agentic act. Some strategies highlight
women’s use of agency better than others. For example, planning ahead of time involves leaving
early or arranging for multiple people to be available to take the woman to her appointment.
Similarly, when plans fall through, calling agencies to notify them of missing appointments and
asking about rescheduling all show that women are exercising agency. That is, they are acting
within a confined social structural position (lacking transportation) but are not passive victims of
their situation. Instead, they take steps to influence the outcome of their situation by utilizing the
nine strategies listed in Table 14.
Some strategies suggest that women are operating within the constraints of a male-
dominated social structure by capitalizing on the feminized role of being a caretaker and
romantic partner. For example, 14 women (almost 19%) indicated that they relied on a male
romantic partner as their exclusive means of transportation. Men in these relationships, in return,
relied on the women to clean their houses, help them remember appointments, or performed
other duties associated with a romantic, caretaking, partner. For example, one woman (1006)
explained that she relies on her boyfriend not just for transportation but also for money and
housing:
I would not have anything right now if it wasn't for [my boyfriend]…I live there free you know. I don't pay for any utilities. The only thing I do is pay for food and
73
This document is a research report submitted to the U.S. Department of Justice. This report has not been published by the Department. Opinions or points of view expressed are those of the author(s)
and do not necessarily reflect the official position or policies of the U.S. Department of Justice.
gas and then I keep the house clean and take care of the dogs and stuff…And he has given me a lot of money for gas because of probation and stuff…because for awhile there I wasn't working. They had me doing so many things that I couldn't work. And so he was supplying everything for me. (1006)
Although the nature of women’s relationships was not a focus of the interview, and was
somewhat of a surprise to discover, some of these women (609) indicated that their relationships
were more utilitarian than romantic.
I never had to ask because [my ex-husband] was always there…But I really did stop loving him. It wasn’t there no more. My eyes were opened. Because when I met him I was in my addiction. So yeah, we did trade, as you said, favors for favors. And then after I got clean and I seen, this is not what my life is. This is not who I am. That’s when I stopped. Told him I couldn’t tell him I loved him anymore. But he still was always there. He was my security.
Future investigations should focus more directly on achieving a better understanding of the roles
of agency and constraints on women’s strategies.
The use of some strategies was related to women’s perceptions of their access to
dependable transportation. Women who engage in some type of trading or employment to gain
transportation access are more likely to have said, in the follow-up interview, that they did not
have access to dependable transportation (50% of women who trade goods or services, and 80%
of women who perform odd jobs) than women who used strategies that did not involve trading or
working at odd jobs (e.g., planning ahead). This finding could indicate that women who must
trade or work at odd jobs to gain transportation access are more keenly aware of the challenges
they face when arranging transportation than women who use other strategies. On the other hand,
it could indicate that women who must barter or seek odd jobs to gain access to transportation
may have smaller social networks. These are both hypotheses that should be investigated in
future research.
74
This document is a research report submitted to the U.S. Department of Justice. This report has not been published by the Department. Opinions or points of view expressed are those of the author(s)
and do not necessarily reflect the official position or policies of the U.S. Department of Justice.
Not all strategies used by women are prosocial or even legal. The fourth research goal, to
determine whether women’s strategies to increase transportation access bring them into conflict
with the law, was addressed to see whether certain strategies increase women’s likelihood of
failing supervision or even returning to jail/prison. Women's strategies were coded into
categories indicating whether the strategies were in conflict with the law. Although most
strategies were found to be prosocial, two strategies were identified as being in conflict with law:
driving without a license and trading illegal goods or services (see Table 15). These strategies
add to our understanding of women's continuation of illegal behavior.
Women who traded goods and services traded childcare (n=1), provided free hairstyling (n=1),
traded food stamps (n=1), provided companionship (n=1), money (n=4) or didn’t want to say
(n=2). Women who worked odd jobs or panhandled did not do anything that violates a law or
would get them in trouble with supervision requirements; women in this category sold plasma (n
= 2), cleaned houses (n = 1), panhandled (n=1) or exchanged childcare for transportation
assistance (n = 1). The finding that women were not utilizing strategies that conflicted with the
law was in contrast to the expected hypothesis that, women suffering from lack of transportation
would resort to illegal methods of obtaining transportation. The finding may explain why
transportation issues were not strongly predictive of recidivism in the quantitative data analysis.
Table 15. Strategies Women Use to Increase Access that Conflict with the Law
Conflicts with Law
75
This document is a research report submitted to the U.S. Department of Justice. This report has not been published by the Department. Opinions or points of view expressed are those of the author(s)
and do not necessarily reflect the official position or policies of the U.S. Department of Justice.
There are women for whom the use of the nine strategies did not work as well as for other
women. For example, planning ahead of time for a ride did not ensure women were able to get
where they needed to go. Sometimes a ride would not show up:
Yes, there’s been a lot of times I’ve missed going places because it was a change of plan or they couldn’t come and take me. Just because those are the only people I have to ask to take me someplace don’t mean that they always take me because they don’t…Because you don’t never know when somebody’s gonna change their mind about coming and taking you. You can ask a week or two ahead of time, you know, and those people they done got old now and they forget stuff. They’ll say, oh, I forgot that I had to go to a funeral, oh I forgot that I had to go to such and such. [633]
Further, there are women for whom the use of these strategies was not enough to overcome
social structural deficits. For example, the scheduling of random drug screens, being random,
made it difficult for this woman to plan ahead to arrange a ride, borrow a vehicle, or use the bus
(due to the location of the screening center).
Well, I had to do drunk screens three times a week and it was random so I never knew until the morning of. That morning, I would have to make sure I’d get up and tell my dad hey, I have to drop today. And then it’s a different time every day you have to be here.[500]
For this woman and others in a similar situation, the requirements of supervision made many of
the possible transportation strategies challenging to employ. In this case, this information could
be shared with agents and agencies to help them better assist, or at least make them aware, of the
transportation problems they create for their clients.
Relationship Between Transportation Access and Recidivism
The goal for this component of the qualitative research was to investigate whether
transportation problems contribute to recidivism. It was expected that women who were
transportation deprived would employ strategies that brought them into conflict with the law or
76
This document is a research report submitted to the U.S. Department of Justice. This report has not been published by the Department. Opinions or points of view expressed are those of the author(s)
and do not necessarily reflect the official position or policies of the U.S. Department of Justice.
would miss important supervision meetings or other required appointments that could result in
being arrested, convicted or receiving supervision violations.
Recall in the quantitative section, transportation access and recidivism were not
statistically correlated. The fifth research question, in that section, was answered with an
investigation of the impact of transportation access on rearrest and reconviction. Recall hat
although the results from the quantitative analysis were non-significant, the effects were in the
expected direction. That is, greater transportation access lowered the odds (or hazard, in the
survival analysis models) of rearrest, reconviction, and supervision violation and slowed the time
until these recidivism events occurred.
First, to investigate the relationship between transportation access and recidivism, using
qualitative data, the list of transportation problems (see Table 12) was considered indicative of
“lack of access” and correlated with both self-reported and official recidivism measures such as
rearrest, reconviction and supervision violation. To ensure that both sources of recidivism data
covered the same time period and could, therefore, be compared, the time period used for the
official data was calculated to equal the time from women’s first interview with the study
through December 2013 which is approximately the time of their last interview. This is because
women were asked to recount new arrests (rearrests), new convictions (reconvictions) and
supervision violations occurring since their first interview until their fourth interview (the
follow-up interview). The two sources of data had similar rates of recidivism for the 75 women
who completed follow-up interviews. In the official data, 15 women were rearrested, 13 were
reconvicted, and 31 had supervision violations between their first interview and December, 2013.
In the self-report data, 12 women reported having been rearrested or reconvicted and 17 reported
having received a supervision violation.
77
This document is a research report submitted to the U.S. Department of Justice. This report has not been published by the Department. Opinions or points of view expressed are those of the author(s)
and do not necessarily reflect the official position or policies of the U.S. Department of Justice.
Table 16 shows the correlations of recidivism indicated by both the self-reports and
official records with the ten types of transportation problems. Transportation problems, from the
follow-up interview, are used as a proxy for the “lower access,” women reported experiencing.
Correlations are expected to be positive indicating that greater problems result in greater
incidence of recidivism. Only significant correlations are shown in the table. At the bivariate
level, women who reported having car problems were significantly less likely to self-report that
they had been rearrested or reconvicted since their first interview. This finding is
counterintuitive. However, because official data of rearrests is positively, although not
significantly correlated with car problems (r=.036, p =.972; not shown), this finding should be
interpreted with caution. A related finding is that women who reported that they had unreliable
transportation help were more likely to report having had a supervision violation. Again, though,
this finding is not supported in the official data. Taken together, the lack of significant
correlations indicates that transportation problems women experience are not resulting in official
recidivism events such as rearrest, reconviction or supervision violations.
Table 16: Correlations Between Transportation Access & Recidivism Outcomes
Self-Reported Recidivism (Yes/No) Official Data Recidivism (Number)
78
This document is a research report submitted to the U.S. Department of Justice. This report has not been published by the Department. Opinions or points of view expressed are those of the author(s)
and do not necessarily reflect the official position or policies of the U.S. Department of Justice.
Second, women’s responses to three questions directly assessing whether they felt their
transportation situations led to recidivism events were analyzed. The seventeen women who self-
reported experiencing supervision violations and the twelve women who self-reported being
rearrested or reconvicted since their first interview were asked directly, “Did lack of
transportation have anything to do with any of these violations?’ Their responses were grouped
as “yes” or “no.” Two of the twelve women who were rearrested or reconvicted and two of the
women who had supervision violations reported that transportation was related to their offense.
The rearrests were for stealing a vehicle and for driving without a license. For one woman, the
supervision violations occurred when, during a snowstorm, she was unable to report to
supervision. The other woman was arrested for a traffic violation for driving with a suspended
license. Because 12% to 16% of women (2 of 17; 2 of 12) who experienced recidivism events
described transportation as a contributing factor; this finding does provide strong women
evidence of a relationship between transportation problems and recidivism, though the sample
size is very small.
Third, all women in the follow-up interview were asked to explain how they ensure their
transportation problems do not result in recidivism. They repeat strategies noted in the previous
section (see Table 14) such as planning ahead or leaving early for appointments. Additional
strategies women identified for avoiding transportation-related offenses were ensuring that they
were riding with non-felons, taking alternate routes to avoid police detection, making others
aware of their transportation problems, and reducing the amount of trips taken. For example, one
woman recounts:
I did not go in a vehicle with somebody that was at risk. Like I won’t ride in a vehicle with somebody that does blow and nodding out thing, holding, you know what I mean, if I know if that person won’t stash it and blame it on me.
79
This document is a research report submitted to the U.S. Department of Justice. This report has not been published by the Department. Opinions or points of view expressed are those of the author(s)
and do not necessarily reflect the official position or policies of the U.S. Department of Justice.
A second woman explains that, to avoid police detection, she takes alternate routes when she
must drive without a license, “I do take a lot of different roads, and I take the long way around,
instead of taking the short way. That's about it and just hope to God…” And the third woman
finds that making her problems known to others helps ensure she gets where she needs to go. She
explained, “Oh you know, you just tell people like, “if I don’t get there, I go to prison.” So
they’re going to be like, “Oh!” Finally, the fourth woman reduces the number of appointments
she must attend or the places she goes: “I don’t go anywhere. Yeah. I don’t. I don’t go anywhere
I’m not supposed to go. I don’t go to stores that sell booze. In fact, that’s one of the reasons I
don’t walk down to my store anymore.”
80
This document is a research report submitted to the U.S. Department of Justice. This report has not been published by the Department. Opinions or points of view expressed are those of the author(s)
and do not necessarily reflect the official position or policies of the U.S. Department of Justice.
CHAPTER 6: DISCUSSION AND CONCLUSION
Transportation deprivation has emerged as a problem among low-income women because
of its impact on unemployment, stress and lack of medical care. Prior to this study, access to
transportation had not been examined among correctional populations. Yet, there is reason to
suspect transportation problems are exacerbated for women offenders, compared to men, because
women offenders’ pathways to crime are often characterized by victimization, such as childhood
and adulthood traumas, which serve as precursors to women’s offending. Transportation may be
particularly important to their recovery, for example, by bridging their needs for substance abuse
treatment and receipt of those services. Further, women’s use of transportation may present a
unique pathway into crime via increased rates of transportation-related offenses, compared to
male offenders. Therefore, transportation deprivation should be studied to discover the extent of
transportation problems and whether these problems impact recidivism.
In response to this gap, this study used a mixed-methods sequential explanatory design—
both quantitative and qualitative research methodologies— to examine transportation
deprivation in a statewide sample of 402 women. The goals for the quantitative analysis were to
describe the extent and distribution of transportation deprivation, create a composite
transportation access score, examine how well transportation resources predict transportation
access, show whether transportation access moderates the association of criminogenic needs with
recidivism, and show the degree to which transportation access adds to the prediction of
recidivism outcomes. The goals for the qualitative component of the research were to increase
understanding of the transportation problems women experienced while under supervision, their
use of resources, and strategies to increase their transportation access, and whether these
81
This document is a research report submitted to the U.S. Department of Justice. This report has not been published by the Department. Opinions or points of view expressed are those of the author(s)
and do not necessarily reflect the official position or policies of the U.S. Department of Justice.
strategies brought women into conflict with the law as well as the contribution of transportation
problems to any violations or new offenses.
In answering the research questions, the study addresses four gaps in existing research.
First, it focuses on women offenders, a group that has not received adequate research attention.
Second, it uses available data to discover actual levels of transportation deprivation, which is
currently unknown. Third, it investigates the strategies women with transportation deprivation
use to increase their level of transportation access. Fourth, and finally, it assesses whether
transportation deprivation is related to recidivism.
The concluding chapter begins with a summary of research findings and then offers
discussion of study limitations and recommendations for future research followed by a brief
conclusion and presentation of policy implications.
Summary and Discussion
Quantitative results. The results for the first research question regarding the extent of
transportation deprivation among women offenders indicated that women, overall, have
relatively high levels of resources in terms of family and friend support but have very low levels
of individual and community level resources. Despite low levels of individual and community
resources, women report moderate to high levels of transportation access. At the bivariate level,
resources significantly correlated with transportation access are: owning/leasing a vehicle, access
to a registered and insured vehicle, physical well-being, support from family and friends, and
women’s agreement that they have help with rides for themselves and their children and can get
money for transportation.
The second research question led to exploration of the reliability of various measures of
transportation access and the feasibility of combining them into one composite transportation
82
This document is a research report submitted to the U.S. Department of Justice. This report has not been published by the Department. Opinions or points of view expressed are those of the author(s)
and do not necessarily reflect the official position or policies of the U.S. Department of Justice.
access score. The results showed that five transportation access items from the transportation
literature as well as the one developed for this study are reliable measures of the underlying
latent construct of transportation access. Thus, they were combined into a composite measure of
transportation access.
The third research question, how well transportation resources predict transportation
access, was examined using multivariate linear regression. The results revealed that several
resources do significantly predict transportation access: whether a woman owned or leased a
vehicle, had a valid driver’s license, had difficulty walking, had poor vision, had friends who
could help with transportation needs, and lived in an area with a low community accessibility
score. Of these, the greatest impact, or the largest effect, was for transportation help from family
and friends.
The fourth research question was whether the effect of criminogenic needs on recidivism
(i.e., rearrest, reconviction and supervision violation) was moderated by transportation access. In
other words, were the effects of criminogenic needs on recidivism made worse by the lack of
transportation needed to address criminogenic needs, for example, attending substance abuse
treatment? The initial results revealed that criminogenic needs did significantly vary over levels
of transportation access, for rearrest, but not in the expected direction. Specifically, women with
similar levels of criminogenic needs, who had higher levels of transportation access, had greater
odds of rearrest compared to women with lower levels of transportation access. This was counter
to expectations that greater access to transportation would help women avoid recidivism events.
However, suggesting additional analyses were warranted, this finding was not supported by the
results of tests of the reconviction and supervision violation models; this . Additional analyses
were undertaken; the overall measure of criminogenic needs was segmented into its 25 subscales
83
This document is a research report submitted to the U.S. Department of Justice. This report has not been published by the Department. Opinions or points of view expressed are those of the author(s)
and do not necessarily reflect the official position or policies of the U.S. Department of Justice.
and the interaction effects for each of these subscales with transportation access were examined.
The results revealed that the relationship between four criminogenic needs (i.e., antisocial
friends, maltreatment as a child, family support, and self-efficacy) did significantly vary over
levels of transportation access in their impact on rearrest. For women who had antisocial friends
and who had experienced maltreatment as a child, lack of transportation exacerbated their odds
of rearrest. Conversely, these same women had significantly reduced odds of rearrest when they
had greater access to transportation. For these women, access to transportation made a significant
difference in whether their criminogenic needs resulted in rearrest. Similarly, for women who
had family support and greater self-efficacy, compared to those who did not, greater
transportation access aided them in avoiding rearrest whereas transportation deprivation led to
greater odds of rearrest.
The fifth research question was used to investigate the impact of transportation access on
rearrest, reconviction, and supervision violation. The results from test of both the logistic
regression and survival analysis models indicated that, although the results were non-significant,
the effects were in the expected direction. That is, greater transportation access lowered the odds
(or hazard, in the survival analysis models) of rearrest, reconviction, and supervision violation
and slowed the time until these recidivism events occurred.
Taken together, the findings pertinent to the fourth and fifth research questions suggest
that transportation access does lower the occurrence of recidivism, and the time until recidivism.
Further, the findings indicate that transportation access is especially important for women with
certain criminogenic needs – those with antisocial friends, histories of child maltreatment,
greater family support and greater self-efficacy.
84
This document is a research report submitted to the U.S. Department of Justice. This report has not been published by the Department. Opinions or points of view expressed are those of the author(s)
and do not necessarily reflect the official position or policies of the U.S. Department of Justice.
Qualitative results. The first qualitative research question led to examination of three
dimensions of transportation problems: types of problems, intensity of problems, and
comparative importance of transportation problems to other problems women currently
experience. The results showed that women reported experiencing one to ten types of problems:
difficulty arranging rides, experiencing legal problems and related costs, having car problems,
using inadequate bus services, relying on unreliable people for transportation help, being
burdened with the direct costs of transportation, feeling unsafe, lacking a social network of
people to provide transportation help, and coping with weather issues or health problems that
impeded travel. Both number of types of problems and specific types of problems were related to
whether women self-reported transportation deprivation at wave three or the follow-up interview.
Further, it was expected that intensity of problems women reported would be related to
women’s self-reported ratings of access to dependable transportation. The results of this analysis
support the hypothesis. Finally, although 32 women (42.6%) reported transportation as one of
their top three concerns; and was, in fact, the most common area of concern given, it was not
related to women’s self- reported levels of access to dependable transportation at either wave
three or the follow-up interview. Therefore, this particular set of questions did not enhance the
understanding of how women situate transportation problems among their larger list of concerns.
The results for the second qualitative research question are that women utilize several
resources not previously captured in the quantitative interview. Women reported using agency-
provided, or discounted, bus tokens and gas cards; receiving help from an extended network of
friends, co-workers, and professionals; and benefitting from having an understanding and non-
punitive supervision agent.
85
This document is a research report submitted to the U.S. Department of Justice. This report has not been published by the Department. Opinions or points of view expressed are those of the author(s)
and do not necessarily reflect the official position or policies of the U.S. Department of Justice.
The goal for the third qualitative research component was to capture the strategies
women use to increase transportation access and discover whether these strategies bring women
into conflict with the law. Nine previously unrecognized strategies were identified: planning in
advance for appointments, building extensive support networks, making use of several modes of
transportation, living close to where women needed to travel, relying exclusively on romantic
partners, driving illegally, trading goods and services, limiting travel, and panhandling or
working other odd jobs.
The findings also showed that many women used a combination of strategies, often
simultaneously. Not all strategies used by women are prosocial or even legal; however, far fewer
women than hypothesized resorted to illegal methods of obtaining transportation. There were
women for whom use of the use of the nine strategies did not work as well as they did for other
women. There were women for whom the requirements of supervision made many transportation
strategies challenging to employ. In this particular case, this information could be shared with
agents and agencies to help them better assist, or at least make them aware, of the transportation
problems they create for their clients.
Further, there were women for whom the use of these strategies was not enough to
overcome social structural deficits. It was hoped that these findings would also reveal women’s
use of agency despite their constrained positions in the social structure. Discussions with women
did show that despite having limited transportation resources or access, women exercise agency
by using what resources they have (phones, friends) to plan ahead of time and arrange for
multiple people to be available to help with rides. That is, women indicated that, although
confined in a social structural position (lacking transportation), they are not passive victims of
their situation. Instead, they take steps to influence the outcome of their situation. Further,
86
This document is a research report submitted to the U.S. Department of Justice. This report has not been published by the Department. Opinions or points of view expressed are those of the author(s)
and do not necessarily reflect the official position or policies of the U.S. Department of Justice.
interviews revealed that women operating within the constraints of a male-dominated social
structure sometimes obtained transportation by capitalizing on the feminized role of being
caretaking/romantic partner. In general, findings from this research question can be shared with
parole and probation officers, who, in turn can share these strategies with their clients to help
them find ways to cope with limited transportation resources and/or access.
The goal of addressing the fourth qualitative research question was to investigate the
relationship between transportation access and recidivism. Although the analyses of the
quantitative data suggested that transportation access lowered the odds of rearrest, reconviction
and supervision violation, the findings of the qualitative data were somewhat mixed. The
findings showed that transportation problems women experienced were not resulting in official
recidivism events such as rearrest, reconviction or supervision violations. However, when asked
to describe recidivism events, 12% to 16% of women described transportation as a contributing
factor lending some support for a relationship between transportation problems and recidivism.
Two potential explanations emerge for the mixed findings. First, the role of agents in
minimizing the consequences of missed supervision appointments emerged earlier in the data but
is again relevant here. Many women reported that if they notified agents that they are unable to
get to an important appointment, they were most often able to reschedule without incurring
penalties such as supervision violations. Second, women explain that police do not seem to
ticket, or do not seem to catch, women driving without licenses or properly registered vehicles.
Therefore, the impact of women’s transportation problems are not resulting in recidivism events.
Although this finding is not what is expected, it is helpful to women offenders that their
transportation problems are not translating into jail time.
Limitations and Recommendations
87
This document is a research report submitted to the U.S. Department of Justice. This report has not been published by the Department. Opinions or points of view expressed are those of the author(s)
and do not necessarily reflect the official position or policies of the U.S. Department of Justice.
There are several limitations to this study. First, it is not generalizable to a national
population because of its focus on substance-involved female offenders in one state. Laws
regarding driving and garnering of licenses, for example, as a penalty for committing a drug-
related crime, vary from state to state. Michigan is not a very punitive state in terms of its driving
laws. It can be expected that women residing in other states will experience a more dire climate
for driving. Studies in these other states will benefit from the measures developed in Michigan;
the basis for comparative research has been laid by this study. Additionally, the scope of the
study did not examine the experiences of males. It is known from feminist pathways research
that understanding the experience of one gender helps illuminate the experience of the other. So,
it is hoped that the findings presented here will stimulate research to provide some understanding
of men’s transportation needs. Future studies should be conducted with women offenders
broadly (not just substance-involved females), male offenders, and in states with different
sanctions for licensing and with different resources available to women (bus vouchers) and
weather (important consideration for bus riders and walkers).
Second, the non-significant relationship between transportation and recidivism can be
explained in three ways. The length of recidivism utilized in these analyses is much shorter than
the more typical three-year follow-up period for recidivism analyses and does reduce the
variability in the recidivism variables that can be explained resulting in a lower likelihood of
detecting significant recidivism findings. However, because transportation access is fluid and
changes rather quickly, using a longer follow-up period for recidivism may not increase the
explained variance. Also, it is worth noting that in the process of coding case notes for the
supervision violation analysis, it became apparent that although women were missing required
supervision meetings, court appointments and drug/alcohol tests, agents most often responded by
88
This document is a research report submitted to the U.S. Department of Justice. This report has not been published by the Department. Opinions or points of view expressed are those of the author(s)
and do not necessarily reflect the official position or policies of the U.S. Department of Justice.
rescheduling appointments or giving warnings. It was unusual that these types of occurrences
would result in a supervision violation. This suggests that transportation problems may not result
in supervision violations but may matter more for other outcomes such as ability to attend
substance abuse treatment, get to work on time, or keep other important appointments. This
could account for why transportation problems did not significantly predict supervision
violations.
The non-significant recidivism findings further underscore the importance of the
qualitative data which, based on preliminary analyses of these data, indicated that women were
in fact breaking the law by driving without a license, that is, they should have rearrests and
reconvictions, but they are not getting caught by the police. Therefore, their illegal behavior is
not resulting in recidivism events and is therefore not reflected in these analyses. The qualitative
data reveal the strategies women use to avoid being detected when breaking the law, and
therefore avoiding recidivism events. Finally, future studies would benefit from a longer follow-
up period for recidivism outcomes.
Third, there were some limitations with the way questions were asked in the qualitative
interview. The questions designed to capture the resources women use to increase transportation
access were confusing to many women despite revisions of the questions and re-training of the
interviewer. Many women reported being confused by the abstract concepts of resources, access,
and strategies and, as a result, limited information was collected. This research found that the
best way to measure transportation resources was not to engage women in conversations but
rather to ask whether they make use of a list of resources. The limitation is that the list maybe
incomplete. However, this research has increased the number of items that should be included in
the list and therefore should produce more valid information. The new information women
89
This document is a research report submitted to the U.S. Department of Justice. This report has not been published by the Department. Opinions or points of view expressed are those of the author(s)
and do not necessarily reflect the official position or policies of the U.S. Department of Justice.
provided regarding resources that may have been omitted from the wave three interview will be
tremendously beneficial to future investigations of women's resources. Future analyses should
include the new measures of resources (e.g., bus tokens from Medicaid, ride assistance from
caseworkers), in combination with the original list of resources, and utilize bivariate correlations
to investigate whether the combined list of resources is better correlated with levels of access to
dependable transportation.
Conclusion and Policy Implications
Although research on low-income individuals and transportation is plentiful; the same
cannot be said for women offenders. Few studies have examined transportation in correctional
populations and none have examined transportation deprivation among women offenders. The
present study is improves existing research in several important ways. First, the longitudinal
nature of the study, examining transportation access over time and situating it within the broader
concerns in women’s lives, lays the initial groundwork for establishing the extent to which
transportation impacts the lives of women offenders. Second, the sample sizes, and high
retention of women in those samples, from the wave one interview through the fourth, follow-up
interview, provide confidence in the external validity of the study – that the women who were
retained represent the larger population from which they were sampled. This ensures that the
study is of great rigor. Third, the diversity of the sample included women living in both rural and
urban areas and can address varying access to public transportation. Fourth, the use of both
quantitative and qualitative methodologies strengthened the study by allowing large numbers of
women (n=366) to be sampled to establish the broad scope of the transportation problem and
made possible the flushing out of complex topics such as agency with in-depth interviews
(n=75). Finally, the use of both self-report recidivism data with official recidivism data provides
90
This document is a research report submitted to the U.S. Department of Justice. This report has not been published by the Department. Opinions or points of view expressed are those of the author(s)
and do not necessarily reflect the official position or policies of the U.S. Department of Justice.
greater confidence that recidivism events were captured and allows for greater power in
statistical analyses.
The results overall suggest that women do encounter a great variety of transportation
problems but do receive substantial amounts of help from family and friends. In the absence of
resources such as dependable and reliable public transportation, women exercise agency by
employing many successful strategies such as planning in advance or utilizing several modes of
transportation. As hypothesized, women who have greater resources do have greater access. And,
women with greater access to transportation do better in terms of recidivism outcomes, although
results were not significant.
Overall, these findings suggest three major directions for policy. First, supervision agents
and agencies should be trained and aware of the significant problems their clients face that
complicate, and in some cases, inhibit them from attending supervision appointments, drug or
alcohol treatment and obtaining other necessary services. Most of the women in this study
seemed to have understanding agents who did not penalize them for transportation problems.
However, there were women who did go to jail when a ride fell through. The information
provided here, especially with regards to strategies women use to overcome transportation
deprivation, could be incorporated into this training and shared with other women to help others
surmount their transportation obstacles.
Second, transit authorities should be notified about how their current services, and
especially reductions in their services, impact women offenders and other low-income
populations. The findings of this study can help these agencies become aware of safety concerns
to their services as well.
91
This document is a research report submitted to the U.S. Department of Justice. This report has not been published by the Department. Opinions or points of view expressed are those of the author(s)
and do not necessarily reflect the official position or policies of the U.S. Department of Justice.
Third, programs aimed at increasing women’s access to affordable vehicles or
dependable public transportation should be considered an important component and included in
social services such as housing, employment and food aid. This study, and others involving low-
income samples, highlight the particular importance of access to an automobile.
Fourth, risk and needs instruments that currently assess women’s needs may also
consider including items related to transportation. Transportation is a stable enough construct
that an instrument administered semi-annually should provide valuable information to
supervision agents and other professionals (e.g., healthcare providers) relative to women’s needs
and abilities to attend necessary appointments.
92
This document is a research report submitted to the U.S. Department of Justice. This report has not been published by the Department. Opinions or points of view expressed are those of the author(s)
and do not necessarily reflect the official position or policies of the U.S. Department of Justice.
APPENDICES
93
This document is a research report submitted to the U.S. Department of Justice. This report has not been published by the Department. Opinions or points of view expressed are those of the author(s)
and do not necessarily reflect the official position or policies of the U.S. Department of Justice.
Appendix A Phase I: Transportation-Related Variables and Questionnaire Items for Quantitative Analysis Transportation-Related Variables and Questionnaire Items for Quantitative Analysis Variable:
Description:
TRANSPORTATION ACCESS
Trip Safety, Ease, Stress, Cost, and Time
NSF Women Offenders Study, Wave three: For each place a woman traveled in the past 7 days, or in a typical week: A. How much time did it take to get there? B. What was the cost, round-trip? C. Did you feel safe getting to and from there? 0. No 1. Yes 7. Don’t know D. Overall, do you agree it is easy (i.e., not physically challenging) for you to get to this place? 1. Strongly Disagree 2. Disagree 3. Neither Disagree or Agree 4. Agree 5. Strongly Agree E. How do you feel when you arrive at this place? (probe: the trip was challenging or unsafe) 1. Very Relaxed 2. Relaxed 3. Stressed 4. Very Stressed Note: Address of each location, purpose of trip, and mode of travel are also available.
Dependable
NSF Women Offenders Study, Wave three:
94
This document is a research report submitted to the U.S. Department of Justice. This report has not been published by the Department. Opinions or points of view expressed are those of the author(s)
and do not necessarily reflect the official position or policies of the U.S. Department of Justice.
Transportation A. To what extent, do you agree that, “Most days I have access to dependable transportation?” Dependable transportation means you have money for bus fare, gas for your car, your car will start and run without a problem, and you have access to it when you need it if you share it. 1. Strongly Disagree 2. Disagree 3. Agree 4. Strongly Agree B. Did you discuss transportation issues with your agent? 0. No 1. Yes 7. Don’t know C. Were transportation issues a problem for you? 0. No 1. Yes 7. Don’t know D. To what extent did you discuss transportation issues with your agent? 1. Hardly at all 2. -- 3. -- 4. -- 5. As fully as necessary 7. Don’t know
TRANSPORTATION RESOURCES Individual Level
NSF Women Offenders Study, Wave three: Access to an automobile A. Do you own or lease an automobile? 0. No 1. Yes 7. Don’t know
95
This document is a research report submitted to the U.S. Department of Justice. This report has not been published by the Department. Opinions or points of view expressed are those of the author(s)
and do not necessarily reflect the official position or policies of the U.S. Department of Justice.
B. Do you have access to a car that you know is registered and insured? 0. No 1. Yes 7. Don’t know C. Do you have a valid driver’s license? 0. No 1. Yes 7. Don’t know Physical Health A. How would you rate your current state of health? 1. Excellent 2. Very good 3. Good 4. Fair 5. Poor 6. Very poor 7. Don’t know B. Do you have difficulty walking a block (or 150m) in summer? 0. No 1. Yes 7. Don’t know C. Is your vision, even with glasses and/or contacts, poor? 0. No 1. Yes 7. Don’t know
Family & Friends Level
NSF Women Offenders Study, Wave three: Social Network Inventory Now I am going to ask you about the people you socialize with and who you spend time with, and who are adults age 17 and older…who would provide you with help with transportation (ride or money)? *Total number of family and friends who would provide support will be calculated
96
This document is a research report submitted to the U.S. Department of Justice. This report has not been published by the Department. Opinions or points of view expressed are those of the author(s)
and do not necessarily reflect the official position or policies of the U.S. Department of Justice.
Transportation Inventory A. I can rely on friends and family to help me get where I need to go and get things done (for example, they may pick up a prescription for me or bring me to work). 1. Strongly Disagree 2. Disagree 3. Agree 4. Strongly Agree B. I can rely on friends and family to help my children (for example, bring my children to school). 1. Strongly Disagree 2. Disagree 3. Agree 4. Strongly Agree C. I can rely on friends and family to give me money when I need it for travel. 1. Strongly Disagree 2. Disagree 3. Agree 4. Strongly Agree
Community Level
Note: Because women lived at several residences, possibly in different communities, during the 8 months of the study, these measures will be calculated for first, last and average residence. NSF Women Offenders Study, Wave three: For the place you are now living: A. Is it a safe neighborhood? 0. No 1. Yes 7. Don’t know B. Are there drugs in your neighborhood? 0. No 1. Yes 7. Don’t know C. Are there gangs in your neighborhood?
97
This document is a research report submitted to the U.S. Department of Justice. This report has not been published by the Department. Opinions or points of view expressed are those of the author(s)
and do not necessarily reflect the official position or policies of the U.S. Department of Justice.
0. No 1. Yes 7. Don’t know D. Do you hear gunshots in your neighborhood? 0. No 1. Yes 7. Don’t know E. Are there break-ins in your neighborhood? 0. No 1. Yes 7. Don’t know F. Is there violence in your neighborhood? 0. No 1. Yes 7. Don’t know G. Have you ever been the victim of crime in your neighborhood (i.e., assaulted, burglarized, robbed)? 0. No 1. Yes 7. Don’t know H. Do the police come into your neighborhood a lot? 0. No 1. Yes 7. Don’t know Publicly Available Data: A. Walk Scores; each residence will be scored 90-100 Walker’s Paradise: Daily Errands do not require a car 70-89 Very Walkable: Most errands can be accomplished on foot 50-69 Somewhat Walkable: Some amenities within walking distance 25-49 Car-Dependent: A few amenities within walking distance 0 -24 Car-Dependent: Almost all errands require a car B. Transit Scores; each residence will be scored 90-100 Rider’s Paradise: World-class public transportation
98
This document is a research report submitted to the U.S. Department of Justice. This report has not been published by the Department. Opinions or points of view expressed are those of the author(s)
and do not necessarily reflect the official position or policies of the U.S. Department of Justice.
70-89 Excellent Transit: Transit is convenient for most trips 50-69 Good Transit: Many nearby public transportation options 25-49 Some Transit: A few nearby public transportation options 0 -24 Minimal Transit: It is possible to get on a bus C. Overall - Livability Scores; each residence will be scored 100 Very Livable … 0 Not Desirable D. Crime - Livability Scores; each residence will be scored 1. A+ 2. A 3. A- … 18. F- E. Amenities - Livability Scores; each residence will be scored 1. A+ 2. A 3. A- … 18. F-
99
This document is a research report submitted to the U.S. Department of Justice. This report has not been published by the Department. Opinions or points of view expressed are those of the author(s)
and do not necessarily reflect the official position or policies of the U.S. Department of Justice.
Appendix B Phase II: Follow-Up Transportation Interview Questions for Qualitative Analysis
Section 2: Transportation Resources & Modes 5. During which periods of time would you say you had help from other people to help you with transportation, for example, a caseworker or co-worker?
Please explain. 6. During which periods of time would you say you had help from other programs to help you with transportation, for example, bus passes or facility-provided transportation to treatment, job help, etc.?
Please explain. Section 4: Social Support 10. Have you ever missed a required supervision appointment because you did not have transportation to or from there? a. If so, explain what happened and what the result/consequences were? b. If not, how do you ensure this doesn’t happen? 11. Have you ever missed another important appointment (e.g., treatment, medical appointment, etc.) because you did not have transportation to or from there? a. If so, explain what happened and what the result/consequences were? b. If not, how do you ensure you don’t miss an appointment?
Section 5: Current Level of Access to Transportation {Interviewer: Look at Transportation Inventory] At the last interview, you told us that you did/did not have access to dependable transportation. Remember we defined dependable transportation as: you have money for bus fare, gas for your car or to pay for a ride; your car will start and run without a problem; and you have access to it when you need it if you share it. 1. As of today, would you say strongly agree, agree, disagree, or strongly disagree that you currently have access to dependable transportation? 6. Currently, do any of your current arrangements for getting around place you in danger or in a difficult situation? [Probe, if needed: For example, driving without a valid license or riding with someone you aren’t supposed to be around.]
100
This document is a research report submitted to the U.S. Department of Justice. This report has not been published by the Department. Opinions or points of view expressed are those of the author(s)
and do not necessarily reflect the official position or policies of the U.S. Department of Justice.
If so, please explain.
7. Thinking about the ways you arrange transportation, NOW OR IN THE PAST, what is hard or easy about it? [Probes: How do you feel about your arrangements? Do they work well or poorly? If you could change your arrangements, how would you change them?] Section 7: Recidivism Thinking back to when you had your first interview with us, on [Interviewer: Look at calendar for month and year]: 1. Have you had any arrests or convictions that were for new crimes (crimes that occurred after your first interview)?
If so, briefly explain them. 2. Have you had any supervision violations?
2a. If so, did lack of transportation have anything to do with any of these violations? Please explain. 2b. If not, how you ensure that your transportation problems do not lead to violations/arrests?
Section 8: Link Between Access & Resources The next questions are about the difference between transportation resources and access. Usually women who say they have high levels of resources also say they have high levels of access. This diagram [Interviewer: Show diagram on blue laminated paper] shows different types of resources that might be related to access. 1. What do you think of the diagram?
a. Is anything listed that seems odd or like it doesn’t belong?
2. Are there other resources or arrangements you use to get transportation that aren’t listed?
a. If so, what are the results/consequences of using these other resources or arrangements?
3. Were you able to get access to transportation even though you had few resources?
a. If so, what other resources or arrangements did you use to get where you needed to go? b. What was the result/consequence of using these other resources or strategies?
101
This document is a research report submitted to the U.S. Department of Justice. This report has not been published by the Department. Opinions or points of view expressed are those of the author(s)
and do not necessarily reflect the official position or policies of the U.S. Department of Justice.
4. Do you think your lack of resources and/or access led to any recidivism problems (for example, violations)?
a. If not, how did you ensure that your lack of resources and/or access didn’t lead to arrests, violations, etc.?
5. Is there anything else we should know about transportation that I haven’t asked?
Wrapping Up: 1. What would you say are your top 3 concerns right now?
Transportation was a top concern: 1a. Please show me when on the calendar when it was. [Interviewer: highlight time period in yellow. Note that highlighters are erasable.]
Transportation was NOT a top concern: 1b. Was there ever a time when transportation was a top concern for you? 1c. Please explain why or why not.
102
This document is a research report submitted to the U.S. Department of Justice. This report has not been published by the Department. Opinions or points of view expressed are those of the author(s)
and do not necessarily reflect the official position or policies of the U.S. Department of Justice.
REFERENCES
103
This document is a research report submitted to the U.S. Department of Justice. This report has not been published by the Department. Opinions or points of view expressed are those of the author(s)
and do not necessarily reflect the official position or policies of the U.S. Department of Justice.
REFERENCES
Akers, R. L., & Sellers, C. S. (2009). Criminological theories: introduction, evaluation, and application (Fourth.). New York, NY: Oxford University Press.
Andrews, D. A., & Bonta, J. (2010). The psychology of criminal conduct. Elsevier.
Andrews, D. A., Bonta, J., & Hoge, R. D. (1990). Classification for effective rehabilitation: Rediscovering psychology. Criminal Justice and Behavior, 17(1), 19–52. doi:10.1177/0093854890017001004
Atkinson, R., & Rostad, K. A. (2003). Can inmates become an integral part of the US workforce? Urban Institute Press.
Baer, D., Bhati, A., Brooks, L., Castro, J., La Vigne, N., Mallik-Kane, K., … Winterfield, L. (2006). Understanding the challenges of prisoner reentry: Research findings from the Urban Institute’s Prisoner Reentry Portfolio. Washington, D.C: Urban Institute Justice Policy Center.
Batchelor, S. (2005). “Prove me the bam!”: Victimization and agency in the lives of young women who commit violent offences. Probation Journal, 52(4), 358–375. doi:10.1177/0264550505058034
Belknap, J. (1996). Access to programs and health care for incarcerated women. Federal Probation, 60, 34.
Belknap, J. (2007). The invisible woman: Gender, crime and justice. (Third Edition.). Belmont, CA: Thomson Wadsworth.
Bloom, B., Owen, B., & Covington, S. (2003). Gender-responsive strategies: research, practice, and guiding principles for women offenders. Washington D.C.: National Institute of Corrections.
Blumenberg, E. (2004). Beyond the spatial mismatch: welfare recipients and transportation policy. Journal of Planning Literature, 19(2), 182–205. doi:10.1177/0885412204269103
Chesney-Lind, M., & Pasko, L. (2004). The female offender: Girls, women, and crime (2nd ed.). Thousand Oaks, CA: Sage Publications.
Covington, S., & Bloom, B. E. (2003). Gendered justice: Addressing female offenders. In Gendered Justice: Women in the Criminal Justice System (pp. 1–20). Durham, North Carolina: Center for Gender and Justice.
Cox, T., Griffiths, A., & Rial-Gonzalez, E. (2000). Research on work-related stress. Luxembourg: Office for Official Publications of European Communities.
104
This document is a research report submitted to the U.S. Department of Justice. This report has not been published by the Department. Opinions or points of view expressed are those of the author(s)
and do not necessarily reflect the official position or policies of the U.S. Department of Justice.
Creswell, J. W. (2008). Research design: Qualitative, quantitative, and mixed methods approaches. Sage Publications, Incorporated.
Cvitkovich, Y., & Wister, A. (2001). The importance of transportation and prioritization of environmental needs to sustain well-being among older adults. Environment and Behavior, 33(6), 809–829. doi:10.1177/00139160121973250
DeMaris, A. (2004). Regression with social data: Modeling continuous and limited response variables. Hoboken, New Jersey: John Wiley & Sons, Inc.
Deschenes, E. P., Owen, B., & Crow, J. (2007). Recidivism among female prisoners: secondary analysis of the 1994 bjs recidivism data set. U.S. Department of Justice. Retrieved from https://www.ncjrs.gov/pdffiles1/nij/grants/216950.pdf
Dupuis, J., Weiss, D. R., & Wolfson, C. (2007). Gender and transportation access among community-dwelling seniors. Canadian Journal on Aging/La Revue Canadienne Du Vieillissement, 26(02), 149–158. doi:10.3138/cja.26.2.149
Edin, K., & Lein, L. (1997). Making ends meet: how single mothers survive welfare and low-wage work. Russell Sage Foundation.
Estroff, S., & Zimmer, C. (1994). Social networks, social support, and violence among persons with severe, persistent mental illness. In J. Monahan & H. Steadman (Eds.), Violence and mental disorder: Developments in risk assessment (pp. 259–295). Chicago: University of Chicago Press.
Gottholmseder, G., Nowotny, K., Pruckner, G. J., & Theurl, E. (2009). Stress perception and commuting. Health Economics, 18(5), 559–576. doi:10.1002/hec.1389
Hardyman, P. L., & Van Voorhis, P. (2004). Developing gender-specific classification systems for women offenders. Washington D.C.: U.S. Department of Justice, National Institute of Corrections.
Harer, M. D., & Langan, N. P. (2001). Gender differences in predictors of prison violence: Assessing the predictive validity of a risk classification system. Crime & Delinquency, 47(4), 513 –536. doi:10.1177/0011128701047004002
Hattery, A., & Smith, E. (2010). Prisoner re-entry and social capital. Lanham, Md: Lexington Books.
Hruschka, D. J., Schwartz, D., St John, D. C., Picone-Decaro, E., Jenkins, R. A., & Carey, J. W. (2004). Reliability in coding open-ended data: Lessons learned from HIV behavioral research. Field Methods, 16(3), 307–331.
Hu, L., & Bentler, P. M. (1998). Fit indices in covariance structure modeling: Sensitivity to underparameterized model misspecification. Psychological Methods, 3(4), 424.
105
This document is a research report submitted to the U.S. Department of Justice. This report has not been published by the Department. Opinions or points of view expressed are those of the author(s)
and do not necessarily reflect the official position or policies of the U.S. Department of Justice.
Ivankova, N. V., Creswell, J., & Stick, S. (2006). Using Mixed-Methods Sequential Explanatory Design: From Theory to Practice. Field Methods, 18(1), 3–20. doi:10.1177/1525822X05282260
Jacobson, B. H., Aldana, S. G., Goetzel, R. Z., Vardell, K. D., Adams, T. B., & Pietras, R. J. (1996). The relationship between perceived stress and self-reported illness-related absenteeism. American Journal of Health Promotion, 11(1), 54–61. doi:10.4278/0890-1171-11.1.54
Lambert, T. (1998). The poor and transportation: A comment on Marlene Kim’s “The working poor: Lousy jobs or lousy workers?” Journal of Economic Issues, 32(4), 1140–1142.
Lichtenwalter, S., Koeske, G., & Sales, E. (2006). Examining transportation and employment outcomes: Evidence for moving beyond the bus pass. Journal of Poverty, 10(1), 93–115.
Litman, T. (2011). Measuring transportation: Traffic, mobility and accessibility. Victoria Transport Policy Institute. Retrieved from http://vtpi.org/measure.pdf
McNiel, D. E., & Binder, R. L. (2007). Effectiveness of a mental health court in reducing criminal recidivism and violence. American Journal of Psychiatry, 164(9), 1395–1403. doi:10.1176/appi.ajp.2007.06101664
Morash, M. (2010). Women on probation and parole. Boston: Northeastern University Press.
O’Brien, P. (2006). Maximizing success for drug-affected women after release from prison: Examining access to and use of social services during reentry. Women and Criminal Justice, 17(95-113).
Owen, B., & Bloom, B. (1995). Profiling women prisoners: Findings from national surveys and a California sample. The Prison Journal, 75, 165–185.
Pendall, R., Hayes, C., George, A., McDade, Z., Dawkins, C., Jeon, J. S., … Smart, M. (2014). Driving to opportunity: Understanding the links among transportation access, residential outcomes, and economic opportunity for housing voucher recipients. The Urban Institute, National Center for Smart Growth at University of MD, and Institute of Transportation Studies at UCLA.
Peters, R. H., Strozier, A. L., Murrin, M. R., & Kearns, W. D. (1997). Treatment of substance-abusing jail inmates: Examination of gender differences. Journal of Substance Abuse Treatment, 14, 339–349.
Presser, L., & Van Voorhis, P. (2002). Values and evaluation: Assessing processes and outcomes of restorative justice programs. Crime & Delinquency, 48(1), 162–188.
Richie, B. (2001). Challenges incarcerated women face as they return to their communities: Findings from life history interviews. Crime & Delinquency, 47(3), 368–389.
106
This document is a research report submitted to the U.S. Department of Justice. This report has not been published by the Department. Opinions or points of view expressed are those of the author(s)
and do not necessarily reflect the official position or policies of the U.S. Department of Justice.
Roberts, J., & Horney, J. (2010). The life event calendar method in criminological research. In Handbook of quantitative criminology (pp. 289–312). Springer. Retrieved from http://link.springer.com/chapter/10.1007/978-0-387-77650-7_15
Salisbury, E. J., Van Voorhis, P., & Spiropoulis, G. (2009). The predictive validity of a gender responsive risk/needs assessment. Crime & Delinquency, 55, 550–585.
Sandoval, J. S. O., Cervero, R., & Landis, J. (2011). The transition from welfare-to-work: How cars and human capital facilitate employment for welfare recipients. Applied Geography, 31(1), 352–362. doi:10.1016/j.apgeog.2010.07.008
Schram, P., Koons-Witt, B., Williams, F., & McShane, M. (2006). Supervision strategies and approaches for female parolees: Examining the link between unmet needs and parole outcome. Crime & Delinquency, 52(3), 450–471.
Scroggins, J. R., & Malley, S. (2010). Reentry and the (Unmet) Needs of Women. Journal of Offender Rehabilitation, 49(2), 146–163. doi:10.1080/10509670903546864
Solomon, J., & Titheridge, H. (2006). Accessibility indicators and the policy goal of the reduction of transport-related social exclusion. (CTS working paper 2006/3). University College London, London: Centre for Transport Studies.
Stapleton, C. D. (1997). Basic Concepts and Procedures of Confirmatory Factor Analysis. Retrieved from http://eric.ed.gov/?id=ED407416
Steffensmeier, D., & Allan, E. (1996). Gender and crime: Toward a gendered theory of female offending. Annual Review of Sociology, 22, 459–487.
Van Dam, C., De Bruyn, E. E. J., & Janssens, J. (2007). Personality, delinquency, and criminal recidivism. Adolescence, 42(168), 763.
Van Voorhis, P. (2012). On behalf of women offenders. Criminology & Public Policy, 11(2), 111–145. doi:10.1111/j.1745-9133.2012.00793.x
Van Voorhis, P., Salisbury, E., Wright, E., & Baumann, A. (2008). Achieving accurate pictures of risk and identifying gender responsive needs: Two new assessments for women offenders. Washington D.C.: US Department of Justice, National Institute of Corrections. Retrieved from community.nicic.org/files/folders/7534/download.aspx
Walker, J. T. (2013). Understanding statistics for the social sciences, criminal justice, and criminology. Burlington, Mass: Jones & Bartlett Learning.
Weston, C., Gandell, T., Beauchamp, J., McAlpine, L., Wiseman, C., & Beauchamp, C. (2001). Analyzing interview data: The development and evolution of a coding system. Qualitative Sociology, 24(3), 381–400.
Widom, C. S. (2000). Childhood victimization and the derailment of girls and women to the criminal justice system. Research on Women and Girls in the Justice System, 27–36.
107
This document is a research report submitted to the U.S. Department of Justice. This report has not been published by the Department. Opinions or points of view expressed are those of the author(s)
and do not necessarily reflect the official position or policies of the U.S. Department of Justice.
Wright, E. M., Salisbury, E. J., & Van Voorhis, P. (2007). Predicting the prison misconducts on women offenders: The importance of gender-responsive needs. Journal of Contemporary Criminal Justice, 23(4), 310–340.
108
This document is a research report submitted to the U.S. Department of Justice. This report has not been published by the Department. Opinions or points of view expressed are those of the author(s)
and do not necessarily reflect the official position or policies of the U.S. Department of Justice.