Access Without Equity: Longitudinal Analyses of Institutional Stratification by Race and Ethnicity, 1972–2004 Julie Renee Posselt University of Michigan-Ann Arbor Ozan Jaquette University of Arizona Rob Bielby Michael N. Bastedo University of Michigan-Ann Arbor The competitive dynamics that sustain stratification among postsecondary institutions have reinforced racial inequality in selective college enrollment between 1972 and 2004. Using a data set constructed from four nationally representative surveys (National Longitudinal Survey 1972, High School & Beyond 1980, National Educational Longitudinal Survey 1988, and Educational Longitudinal Survey 2002), the authors model how escalating admissions standards—including academic preparation and the growing importance of SAT scores and extracurricular leadership—effectively JULIE RENEE POSSELT is a Ph.D. candidate in the Center for the Study of Higher and Postsecondary Education at the University of Michigan, 610 East University Avenue, 2117 SEB, Ann Arbor, MI, 48109; e-mail: [email protected]. Posselt’s research examines the relevance of organizational and sociocultural theory for strat- ification, diversity, and decision making in higher education. OZAN JAQUETTE is an assistant professor of higher education in the Department of Educational Policy and Practice at the University of Arizona. His research interests are organizational theory, postsecondary education finance, and quantitative methods. ROB BIELBY is a doctoral student at the Center for the Study of Higher and Postsecondary Education, University of Michigan. He studies higher education public policy, with a particular focus on the application of quantitative methodologies to assess and evaluate policy impact. MICHAEL N. BASTEDO is an associate professor in the Center for the Study of Higher and Postsecondary Education at the University of Michigan. He studies organizational decision making in public higher education, both in the United States and cross- nationally, with a particular focus on stratification and governance. American Educational Research Journal Month XXXX, Vol. XX, No. X, pp. 1–38 DOI: 10.3102/0002831212439456 Ó 2012 AERA. http://aerj.aera.net
Transcript
Access Without Equity:Longitudinal Analyses of InstitutionalStratification by Race and Ethnicity,
1972–2004
Julie Renee PosseltUniversity of Michigan-Ann Arbor
Ozan JaquetteUniversity of Arizona
Rob BielbyMichael N. Bastedo
University of Michigan-Ann Arbor
The competitive dynamics that sustain stratification among postsecondaryinstitutions have reinforced racial inequality in selective college enrollmentbetween 1972 and 2004. Using a data set constructed from four nationallyrepresentative surveys (National Longitudinal Survey 1972, High School &Beyond 1980, National Educational Longitudinal Survey 1988, andEducational Longitudinal Survey 2002), the authors model how escalatingadmissions standards—including academic preparation and the growingimportance of SAT scores and extracurricular leadership—effectively
JULIE RENEE POSSELT is a Ph.D. candidate in the Center for the Study of Higher andPostsecondary Education at the University of Michigan, 610 East UniversityAvenue, 2117 SEB, Ann Arbor, MI, 48109; e-mail: [email protected]. Posselt’sresearch examines the relevance of organizational and sociocultural theory for strat-ification, diversity, and decision making in higher education.
OZAN JAQUETTE is an assistant professor of higher education in the Department ofEducational Policy and Practice at the University of Arizona. His research interestsare organizational theory, postsecondary education finance, and quantitativemethods.
ROB BIELBY is a doctoral student at the Center for the Study of Higher andPostsecondary Education, University of Michigan. He studies higher education publicpolicy, with a particular focus on the application of quantitative methodologies toassess and evaluate policy impact.
MICHAEL N. BASTEDO is an associate professor in the Center for the Study of Higher andPostsecondary Education at the University of Michigan. He studies organizationaldecision making in public higher education, both in the United States and cross-nationally, with a particular focus on stratification and governance.
American Educational Research Journal
Month XXXX, Vol. XX, No. X, pp. 1–38
DOI: 10.3102/0002831212439456
� 2012 AERA. http://aerj.aera.net
maintain racial inequality in selective college enrollment over time. Blackand Latino students have made strides in their pre-collegiate academic prep-aration. Nevertheless, although access to postsecondary education hasexpanded since 1972 for all ethnic groups, Black and Latino students’odds of selective college enrollment have declined relative to White andAsian American students.
Building on a generation of research into expanding higher educationaccess, scholars are attending to the structure of access to specific types
of colleges and universities (Astin & Oseguera, 2004; Grodsky, 2007; Hearn,1991; Karen, 2002; Kingston, 1990; Trow, 1988). Such research recognizesthat the U.S. system of postsecondary education is highly stratified by mis-sion, selectivity, and returns to earned degrees—a phenomenon we referto as institutional stratification (Bastedo & Gumport, 2003). Inequality in-heres in stratified systems, but academic leaders and policymakers tacitlyaccept it as the price to be paid for benefits of efficiency and legitimacy.However, the competitive dynamics that sustain institutional stratificationmay also reinforce other forms of social inequality. In this article, we exam-ine the intersections of institutional and racial1 stratification trends since 1972using a data set constructed from four nationally representative NationalCenter for Education Statistics (NCES) databases.
To assess institutional stratification, we employ a six-category measureof initial postsecondary enrollment ranging from non-enrollment, to enroll-ment in vocational and community colleges, to enrollment in 4-year institu-tions with four levels of selectivity. Our analysis reveals that accounting forselectivity captures significant detail about the progress we have madetoward equitable postsecondary outcomes. We find that escalating creden-tials and competition for admission to selective institutions help explainthe continued underrepresentation of Latino and Black students in selectiveinstitutions. Given America’s history of unequal college access on the basisof ascriptive traits such as race and ethnicity, one would expect that anincreased emphasis on academic criteria would promote more equitableenrollment outcomes in selective institutions. And, on average, underrepre-sented minorities have made great strides since 1972 in their academic prep-aration for selective admissions. But since all groups have realized similarrates of increase in academic achievement, college entrance exam scoresare unequally distributed and increasingly valued, and minimum require-ments for admission continue to rise, the seemingly more equitable standardhas not produced more equitable outcomes. Consideration of additional fac-tors, such as extracurricular leadership, does not sufficiently offset the gapscreated by increasing competition and reliance on test scores. Access to the
Posselt et al.
2
system as a whole has expanded while patterns of racial stratification withinit persist.
Selective institutions do not fit all high school graduates’ learning needs,and we do not wish to elevate their intrinsic value over other institutionaltypes. However, the paradox of expanding access and continuing stratificationis a pertinent concern given continued enrollment imbalances by race/ethnic-ity and accumulating evidence about the gains that accompany education inselective institutions. Baccalaureate completion rates increase with institu-tional selectivity, both nationally (Astin, 1985; Bowen, Chingos, &McPherson, 2009; Carnevale & Rose, 2003; Long & Kurlaender, 2009) andamong students of color specifically (Bowen & Bok, 1998; Melguizo, 2010).Graduation from selective institutions is also associated with a range of posi-tive labor market outcomes (Brewer, Eide, & Ehrenberg, 1999; Hoxby & Long,1998; Monks, 2000). Furthermore, diversifying selective American collegesand universities has the potential over time to help counter racialized patternsof class inequality and, as Justice Sandra Day O’Connor wrote in her opinionfor Grutter v. Bollinger (2003), ‘‘cultivate a set of leaders with legitimacy in theeyes of the citizenry,’’ whose increasing diversity is a demographic fact. Inlight of the increasing benefits of selective college enrollment and concernsabout ethnic diversity in such institutions, it is important to understandchanges over time in students’ postsecondary destinations.
Research objective and contributions. The objective of our research is toexamine institutional stratification by race/ethnicity between 1972 and 2004,a time of significant change in both American race relations and access topostsecondary education. This research makes both empirical and conceptualcontributions to the literature. Empirically, we help resolve conflicting findingsfrom previous scholars about Black and Latino enrollment in selective institu-tions. Some find that students of color are more likely to attend more presti-gious institutions than Whites ceteris paribus (Bowen & Bok, 1998; Grodsky,2007), but others conclude underrepresented minorities have stronger odds ofenrolling in community colleges and less selective colleges (Hearn, 1991;Karen, 2002; Karen & Dougherty, 2005). To determine whether the contradic-tory findings may be an artifact of cross-sectional data use, we analyze enroll-ment trends by linking four time-varying data sets.
One trend that we identify—escalating admissions requirements toselective institutions—bridges our empirical and conceptual contributionsto the literature. Increases in the necessary and sufficient credentials for ad-missions to selective institutions may help explain persistent racial/ethnicstratification over time. We find that admissions requirements affecting racialenrollment trends include not only academic preparation, as Grodsky (2007)documents, but also extracurricular involvement and, increasingly, extracur-ricular leadership. Students from all racial/ethnic groups have higher gradesand more college preparatory coursework in 2004 than 1972, but Black andLatino students’ odds of enrolling in selective institutions are declining over
Access Without Equity
3
time relative to White and Asian American students. Admissions officers usea range of criteria to select students, but escalating credentials, generally,paired with increasing attention to SAT/ACT scores, specifically, keepsBlack and Latino students at a competitive disadvantage. Holding prepara-tion, test scores, and extracurriculars equal, enrollment disadvantages disap-pear for Black students and become advantages over White students forLatino students.
Through these findings, we suggest selective admissions serves as a mi-crofoundation for effectively maintained inequality (EMI) across race in post-secondary enrollment. Studying socioeconomic status (SES) inequality inhigh school tracking and college enrollment, Lucas (2001) coined EMI todescribe the result of a process in which advantaged groups protect their rel-ative position in educational transitions that have become universal (e.g.,year-to-year progress through high school) by seeking qualitative advan-tages in those transitions (e.g., college preparatory curriculum tracks). Weinvestigate whether this process may also explain selection into institutionsin our racially stratified postsecondary system. Baccalaureate aspirationshave become universal (Goyette, 2008), and college enrollment rates haverisen for all racial/ethnic groups (Grodsky, 2007). On average, however,White and Asian American students maintain a qualitative advantage in thecollege transition due to their greater access to selective 4-year institutions.Through our focus on escalating admissions credentials, we argue the micro-foundations of access to selective institutions since 1972 involve not onlyfamily goal setting and seeking, as Lucas and other EMI scholars wouldassert, but also the dynamics of institutional gatekeeping.
Literature Review and Theoretical Framework
Academic Preparation and the Market for Selective Colleges/Universities
Postsecondary enrollment is the outcome of an iterative process consist-ing of individual pursuit (i.e., aspiration, application, and choice) and insti-tutional access (i.e., admission). Thresher (1966) noted this 45 years ago inhis multilevel analysis for the College Entrance Examination Board: ‘‘In themarket for higher education, just as in the job market or the marriage market,the process of search, appraisal, and selection go on continuously, on bothsides, and emphases shift according to reciprocal needs and scarcities’’ (p.3). Since the 1950s, markets for higher education have become progressivelymore stratified on the basis of selectivity. In a process of ‘‘fanning out,’’ sys-tem expansion has occurred in the 2-year sector, while applications to selec-tive institutions have increased much faster than enrollment (Hoxby, 2009).
Attraction to a college’s resources rather than distance from one’s homeincreasingly motivates the college choice of well-qualified students (Hoxby,2009). These resource considerations involve the anticipated economic returns,
Posselt et al.
4
institutional prestige, and degree completion and graduate school placementrates associated with such institutions (Bound, Hershbein, & Long, 2009;Bowman & Bastedo, 2009; Frank & Cook, 1995; Hoxby & Long, 1998). Asthe perceived returns to education in a selective institution have risen, more in-dividuals have sought enrollment. The percentage of students applying to 4-year institutions increased from 38% to 53% between 1982 and 2004, includinga record high of 12.8% applying to selective public institutions in 2004 (Boundet al., 2009). With minimal growth in the selective sector, demand far outpacessupply, and the system-level results include rising competition and a wideningselectivity gap between the most and least selective 4-year colleges from 20 per-centiles in the 1950s to 76 percentiles in 2007 (Hoxby, 2009).
However, our focus is on the contributions of admissions offices to stiff-ening competition. There are clear financial and reputational benefits ofenrolling more academically accomplished students (McPherson &Schapiro, 1998). For example, institutional rankings processes create strongincentives for admissions offices to privilege applicants’ high school aca-demic achievement in admissions decisions (Alon & Tienda, 2007; Bastedo& Jaquette, 2011). Over time, institutional financial aid offerings have alsobecome more responsive to student academic characteristics and lessresponsive to financial need (Doyle, 2010).
As in other competitions where the number of aspirants exceeds the num-ber of opportunities, admissions officers assess students not in an absolutesense but relative to other applicants (Frank & Cook, 1995). In a context ofrising competition, this comparative evaluation drives up the academic cre-dentials that students seek and institutions reward. Thus, high-achieving stu-dents tend toward institutions that ranking systems construct as prestigious,while prestigious institutions use comparative evaluation to admit progres-sively higher achieving applicants. Students and institutions are caught upin an escalating cycle of reactivity and self-fulfilling prophesies through theirevaluations of admissions and rankings processes (Espeland & Sauder, 2007).We hypothesize this process and its implications for equity as follows:
Hypothesis 1a: The academic preparation (i.e., advanced course-taking, grades,and percentage of students taking standardized tests) of high school graduatesfrom each racial/ethnic group has increased over time.Hypothesis 1b: However, average increases in Black and Latino academic prepa-ration have not eliminated disparities in preparation because White and Asian stu-dents’ preparation has increased at a similar or higher rate.Hypothesis 1c: Over time, the proportions of White and Asian high school gradu-ates enrolling in highly selective institutions will remain higher than the propor-tion of Latino and Black students.Hypothesis 2a: The positive effect of academic preparation on enrollment in selec-tive colleges and universities has grown over time, nationally and for each racial/ethnic group separately.
Access Without Equity
5
Affirmative Action in Principle and Practice
Although institutions have a stronger incentive than ever to enroll stu-dents with the highest academic credentials, key admissions criteria (e.g.,scores on college entrance exams) are not equally distributed across raceand SES (Alon & Tienda, 2007; Grodsky & Jackson, 2009; Rothstein, 2004).Reacting to political mobilizations for civil rights in the 1960s and 1970s(Skrentny, 1996), up to half of moderately and highly selective institutionsreport having practiced affirmative action (Grodsky & Kalogrides, 2008).The policy received continued support into the 1980s as norms about thevalue of diversity diffused throughout the American consciousness, oftensupplanting norms about institutional mandates to remedy past injustices(Goldberg, 1998; Karabel, 2005). However, that support may be waning.
Supreme Court judgments in Regents of the University of California v.Bakke (1978), Grutter v. Bollinger (2003), and Gratz v. Bollinger (2003) ruledthat the diversity rationale provides sufficient legal grounds for public uni-versities to consider race in a narrowly tailored holistic evaluation, but lowercourt decisions and ballot initiatives have banned consideration of race inpublic institutions in five states (i.e., California in 1996, Texas in 1996,Washington in 1998, Florida in 2000, and Michigan in 2006). Changes inthe policy environment may also affect institutional decision making outsideof these states. According to College Board survey data, nearly half of the1,300 4-year institutions surveyed report consideration of ‘‘minority status’’at some point between 1986 and 2003, but its relative importance declinedsignificantly in the mid-1990s (Grodsky & Kalogrides, 2008).
In principle, affirmative action was intended to remediate the social in-justices that led Black, Latino, and Native American students to be underrep-resented in selective institutions (Chen & Stulberg, 2007; Karabel, 2005). Inpractice, affirmative action involves sensitivity to an applicant’s race vis-a-vis his academic profile and the institution’s objectives, plus considerationof nonacademic traits (e.g., extracurricular leadership) that may signal thestudent’s potential to succeed academically and contribute to the institution(Gurin, Dey, Hurtado, & Gurin, 2002; Karen, 1990; Klitgaard, 1985; Takagi,1992). According to Karabel (2005) and Grodsky (2007), admissions officesin moderately and highly selective colleges and universities changed theirdefinitions and criteria of merit—sometimes softening criteria such as theSAT and other times adding criteria—to construct cohorts that reflect stake-holders’ perceptions of a just society. Given White and Asian American stu-dents’ higher average academic preparation and achievement, and the factthat affirmative action conditioned the environment for admissions decisionsduring the years we study, we expect that controlling for indicators of aca-demic achievement will reduce White students’ enrollment advantage inselective institutions:
Posselt et al.
6
Hypothesis 2b: Holding academic preparation constant, disparities betweenWhites and other groups’ odds of enrolling in selective institutions will declineover time.
Intersections of Race With Extracurricular Involvement
and Socioeconomic Status
We know that selective institutions are looking for more than academic cre-dentials in their students and that race/ethnicity is hardly the only student cat-egory that is factored into admissions evaluations. For example, elite collegesalso value high school extracurricular (including athletic) involvement and lead-ership as a signal of positive character and personality traits (Stampnitzky, 2006;Stevens, 2007). They also prize legacy status, which encourages loyalty andfinancial generosity across generations (Espenshade, Chung, & Walling,2004). Such considerations further institutional objectives around leadershipdevelopment, campus culture, and financial solvency (Klitgaard, 1985; Soares,2007), but they also serve another function: that of simplifying selection.
As early as 1985, economist Robert Klitgaard discussed HarvardUniversity’s admissions challenge of selecting from ‘‘the right tail of the distri-bution of talent’’ (Klitgaard, 1985, p. 9). Since then, academic escalation hasmade it increasingly difficult to distinguish academically qualified applicantsto top-tier institutions from one another, such that we are approaching ceilingeffects for key measures of academic quality such as grades and test scores(Hoxby, 2009). Here, the admissions practice of comparative evaluation givesan edge to those who surpass necessary academic thresholds and who suffi-ciently distinguish themselves from conventional high achievers (Bennett,Lutz, & Jayaram, in press; Klitgaard, 1985). We hypothesize that the risingbar of admissions has both academic and extracurricular components:
Hypothesis 3: Extracurricular involvement and leadership will be increasinglyimportant predictors of enrollment in selective institutions, nationally and foreach racial/ethnic group separately.
Families with higher socioeconomic status are more likely to attain theacademic preparation and extracurricular experiences that elite collegesvalue, and no evidence to date suggests that these trends differ across ethnicgroups. If anything, research indicates that students of color, on average,hold higher aspirations and ambitions than White students (Carter, 1999;Kao & Tienda, 1998; Pascarella, Wolniak, Pierson, & Flowers, 2004). Overthe past 30 years, American higher education and selective institutions inparticular have become more stratified by socioeconomic status (Astin &Oseguera, 2004; Hoxby, 2009). In particular, high SES families increasinglystrive to maximize status and opportunity by pursuing the most prestigiouscollege education they can (Bourdieu & Passeron, 1977; Kingston & Lewis,
Access Without Equity
7
1990), both in initial enrollment (Bastedo & Jaquette, 2011) and transfer toelite colleges (Dowd, Cheslock, & Melguizo, 2008; Dowd & Melguizo,2008). The college admissions process now represents the culmination ofa long effort by many high SES parents to engage children in opportunitiesthat others will read as distinctive human, social, and cultural capital (Lareau,2003; Levey, 2010; Stevens, 2007). We expect that extracurricular activitiesare a primary source of such opportunities and therefore hypothesize thefollowing:
Hypothesis 4a: An increasing proportion of students of color in highly selectiveinstitutions will be from families with high socioeconomic status.Hypothesis 4b: Students of color with strong academic profiles, extracurricularleadership, and high SES will have the highest probability of enrollment in highlyselective institutions.
Method
Data and Sample
Our data consist of a nationally representative sample of high schoolcompleters from the 1972, 1982, 1992, and 2004 high school senior classes,utilizing data from National Longitudinal Survey 1972 (NLS), High School &Beyond 1980 (sophomore cohort) (HSB), National Educational LongitudinalSurvey 1988 (NELS), and Educational Longitudinal Survey 2002 (ELS). Weonly included students who completed high school within 1.5 years of theirhigh school graduating class, because the most recent wave of the ELS sur-vey interviewed students 1.5 years after the high school graduating class of(June) 2004. We constructed the sample to be consistent across cohorts. Tobe consistent with NLS, which begins with a nationally representative sampleof 12th graders in 1972, we excluded students who are not in 12th gradewhen the rest of their cohort begins 12th grade. Because only ELS 2002 uti-lizes hot-deck imputation for key covariates, we set ELS-imputed variablevalues equal to missing.
Weights. To make inferences about change over time in the nationalpopulation of high school completers, we select a weight variable that isconsistent across all surveys. Table S1 in the online supplementary materials(all appendices and tables/figures noted with an S may be accessed in theonline version of the journal) shows the availability of weights by surveyfor the restricted data used in our study. We selected a weight variable,which we have named ‘‘LONGWGT,’’ which is non-zero for students whowere survey respondents in 12th grade and who were survey respondents2 years later, when students identify initial postsecondary attendance.Consistent with Bound et al. (2009), we also created a single data set, with
Posselt et al.
8
results weighted so results are nationally representative of the high schoolgraduate population.
Dependent variable. We created three different measures of first institu-tion attended (1) using only Postsecondary Education Transcript (PETS) data(available only for NLS72, HS&B, and NELS), (2) using only survey responsedata, and (3) using a combination of PETS and survey data. This researchused the measure created using only survey data because missing postsec-ondary transcripts led to weighted postsecondary attendance rates thatwere lower for NLS (52%) and HSB (57.3%) using PETS data than for surveydata (57.0% and 65.6%, respectively). Moreover, we wished to use a consis-tent data type across cohorts, and PETS is not available for ELS 2002.
Next, we merged data from Barron’s (1971, 1981, 1991, 2003) Profiles ofAmerican Colleges to create a seven-category outcome variable: (1) does notattend postsecondary education, (2) attends a 2-year or a less than 2-yearinstitution, and attends a 4-year institution categorized by Barron’s as (3)noncompetitive, (4) competitive, (5) very competitive, (6) highly competi-tive, or (7) most competitive. In order to compare categories over time,we assign each institution the selectivity category Barron’s assigned it inthe year that the most recent cohort would be applying to college (i.e.,2003). Barron’s categorizations derive from a combination of high schoolgrade point average (GPA), average SAT, high school class rank, and per-centage of applicants who are admitted. Across the Barron’s categories,the mean high school GPA of a student in a Category 7 school is 3.6, com-pared to 3.43 in Category 6, 3.33 in Category 5, and 3.11 in Category 4.The proportion of private institutions increases with selectivity, from9.52% of the 2-year institutions, to 35.92% of open 4-year colleges, to44.92% of highly competitive, and 77.00% of the most competitive institu-tions. Due to very low numbers of students of color enrolled in the mostcompetitive institution category, we combined Categories 6 and 7, resultingin a six-category postsecondary enrollment outcome measure ranging fromno postsecondary education to most competitive. (See Appendix B andTable S2 in the online supplementary materials for distribution of GPA,SAT, and colleges across the six categories.)
Covariates. Demographic and admissions credential covariates wereincluded in the models. Demographic variables included race/ethnicity, gen-der, socioeconomic status quartile, and urbanicity. The National Center forEducation Statistics has collected data on race and ethnicity in their surveysin accordance with the five standard federal categories: White, non-Hispanic;Black, non-Hispanic; Hispanic; Asian or Pacific Islander; and AmericanIndian or Alaskan Native.2 In addition, ELS provided respondents an optionof Multiracial/Other, which we include in analyses for the 2004 cohort. Weestablished cut points for the SES quartile variable by sorting the weightedsample of high school graduates by continuous SES in ascending orderand dividing the sample into four groups of equal size. We then created
Access Without Equity
9
dichotomous variables for each SES quartile in anticipation of nonlinearitybetween SES and postsecondary outcomes.3
Precollegiate academic preparation variables include SAT/ACT score,high school GPA, highest math course passed, and highest science coursepassed. We constructed the SAT/ACT score variable by (1) determining com-posite SAT and ACT scores, (2) recentering ACT test scores for HSB and SATscores for HSB and NELS to reflect modifications to the ACT in 1989 and theSAT in 1995, (3) converting ACT scores to SAT scores with standardized con-cordance tables, and (4) selecting the higher composite score if studentstook both the SAT and the ACT. Of the students who indicated taking theSAT and/or ACT, test scores were missing for 3.3% in NLS, 38.7% in HSB,23.9% in NELS, and 10% in ELS. We imputed missing SAT/ACT test scoresfor students who indicate taking the SAT/ACT, using the average of themath and reading components from the standardized senior year test takenby all NCES survey respondents. See Appendix D in the online supplementalmaterial for sensitivity tests of the imputed SAT score data.4
The variables we created for high school GPA, highest math coursepassed, and highest science course passed utilize raw course-level highschool transcript data not available for NLS72. Given the centrality of aca-demic preparation to our research questions, we therefore excluded the1972 cohort from multivariate analyses. Math and science course-takingwere defined using measures developed by Burkam, Lee, and Owings(2003) and used by Dalton, Ingels, Downing, and Bozick (2007) (seeTable S3). Highest math course passed is defined as follows: 1 = No mathor ‘‘low’’ math; 2 = Algebra 1 or plane geometry; 3 = Algebra 2; 4 =Algebra 3, trigonometry, or analytic geometry; 5 = Pre-calculus; and 6 =Calculus. Highest science course passed is defined as follows: 1 = No scienceor ‘‘low’’ science; 2 = Basic biology or secondary physical science; 3 =General biology; 4 = Chemistry 1 or Physics 1; 5 = Chemistry 1 andPhysics 1; 6 = Chemistry 2, Physics 2, or advanced biology.
To examine whether rising admissions standards include both extracur-ricular and academic dimensions, we also included in our model self-re-ported measures of one’s participation in key extracurricular activities(student government, honors society, athletics, vocational club, academicclub). For NELS and ELS, a self-reported, dichotomous report of whetherthe student had been a leader in any extracurricular activities was also avail-able and included in the model.
Finally, we included controls for characteristics found in previousresearch to influence selective college enrollment. These variables includedegree expectations (less than bachelor’s, bachelor’s, master’s, and doc-toral/professional degrees), high school urbanicity (urban, suburban, andrural), high school control (public, Catholic, other private), and high schoolregion. Where it was available (i.e., in NELS and ELS), we created covariatesfor immigrant status (first generation, second generation, nonimmigrant).
Posselt et al.
10
Analysis
For hypotheses requiring multivariate analysis, the structure of ourdependent variable prompted our choice of methodology. One could inter-pret non-enrollment and the Barron’s categories as ordinally ranked, imply-ing an ordinal logistic regression. However, we found that the parallelregression assumption (Long & Freese, 2005) on which ordinal logisticregression rests was violated for our dependent variable. That is, the slopebetween a covariate and the dependent variable was not the same for all cat-egories of the dependent variable. Instead, we employed a multinomiallogistic regression model (MNLM), which creates M logistic regression equa-tions for the M outcome variable categories minus one for the base outcomeJ, nonselective 4-year institution. Therefore, for each covariate there are M –1 coefficients. Equation 1 shows the general equation used in our multino-mial logistic regression model:
pij5ex0ibj
Sml51ex0ibj
; ð1Þ
where pij is the probability of individual i experiencing postsecondary out-come j out of a total number of m possible outcomes; xi is a vector ofrace/ethnicity, demographic, degree expectation, and academic preparationvariables; and bj is the vector of coefficients for these covariates on the prob-ability of experiencing postsecondary outcome j.
In Multinomial Logistic Regression (MNL), coefficients (b) are expressedin terms of log odds. A unit change in the independent variable is associatedwith a b unit change in the log of the odds of the outcome occurring. To sim-plify interpretation, we report most findings in terms of odds ratios, whichraise e to the power of b. The odds ratio represents the factor change inthe odds of an outcome associated with a one-unit change in the indepen-dent variable (i.e., one unit on the scale of continuous variables and 0/1for dichotomous variables). We also calculated predicted probabilities ofadmission to selective institutions for select student profiles.
Each of the four surveys in our data set utilizes a stratified random sam-ple, first sampling U.S. high schools and then students within them. Wetherefore specified the variance-covariance matrix to be estimated withrobust standard errors. Students within high schools are more likely to besimilar than students in different high schools; therefore, less variation existswithin a sample that selects students within specific high schools than a sam-ple that selects students entirely at random. We use clustered, robust stan-dard errors—clustering on the high school—to acknowledge thecorrelation within high schools. Therefore, our standard errors are higherthan they would be if students were selected entirely at random.
Access Without Equity
11
Table S4 outlines the weighted and unweighted sample sizes for eachcohort. White students comprise a majority of the weighted sample ineach cohort (Figure S1), but previous research shows that the factors predict-ing White students’ postsecondary outcomes may not be the same ones ex-plaining outcomes among Asian American, Black, and Latino students (e.g.,St. John, Paulsen, & Carter, 2005). Therefore, in addition to the generalmodel, we estimated the model separately for each race category to deter-mine whether there are differences across race and cohort in the factorsthat predict postsecondary enrollment. For these analyses, we also tookadvantage of the availability of data in NELS and ELS on students’ immigrantstatus and extracurricular leadership and included these factors in the model.To determine the value added by these additional variables, we calculatedscalar measures of logistic model fit for nested models (e.g., Akaike’sInformation Criterion [AIC] and Bayesian Information Criterion [BIC]) as rec-ommended by Raftery (1996) and Long and Freese (2005).
Limitations
The principal limitations of our study derive from the demands of con-structing a longitudinal data set. While use of a consistent categorizationscheme across time is a paramount concern in constructing a longitudinaldata set, the coarse NCES and U.S. census race/ethnicity scheme obscuresconsiderable intragroup diversity in academic preparation and postsecond-ary outcomes. Aggregating all Asian American students is problematic, forexample, given that the mean preparation, SES, and postsecondary out-comes of students with Southeast Asian origins often more closely resemblethat of Black and Latino students than the East Asian ancestry students whocomprise the majority in the Asian American category (Chang & Kiang, 2002;Hune, 2002; Kiang, 2004). Through analyses of trends in each racial/ethniccategory we try to examine diversity within groups and cohorts, such asby SES and immigrant status; however, we do not advise that our findingsbe interpreted to structure programs or policies that affect ‘‘Asian’’ students’college opportunities, writ large.
One advantage of the Barron’s criteria is that they are well definedacross levels of selectivity and have changed little since 1972 (seeAppendix C in the online supplemental material). This stability is importantsince it allows us to apply Barron’s 2003 rankings to all years and thus makecross-cohort comparisons, an approach used in previous longitudinalresearch on selective college access (e.g., Astin & Oseguera, 2004).However, fixing the 2004 rankings means that a small proportion of institu-tions were counted as more selective in 1972, 1982, or 1992 than they mayhave been.
Analytically, growth in the African American, Asian American, andLatino/a populations during the time period we study means that group
Posselt et al.
12
averages take into account more variation in 2004 than in 1972. Similarly,high school graduation rates determine our analytic samples for each cohort,and our models do not account for increases since 1972 in the national highschool graduation rate. Defining enrollment within 1.5 years of high schoolgraduation may downwardly bias estimates of Black and Latino students’postsecondary enrollment, since those groups are more likely to delay initialcollege enrollment.
Finally, our data have not allowed us to control for whether changes intuition and financial aid—two factors that may incline students toward par-ticular institutional types—may have affected stratification by race and socio-economic status during this period. Available resources have not kept pacewith the rising costs of higher education since 1972. Specifically, the mid-1970s shift from grants to loans (Hearn & Holdsworth, 2005; Posselt, 2009;St. John & Asker, 2003) and the rise and fall of need-blind admissions ina context of rising tuition (Heller, 2008) could each negatively affect theodds of enrollment for students of color given their lower than averageSES. We intend in future research to examine this possibility more closely.
Results
Hypothesis 1: Institutional Stratification and Rising Academic Preparation
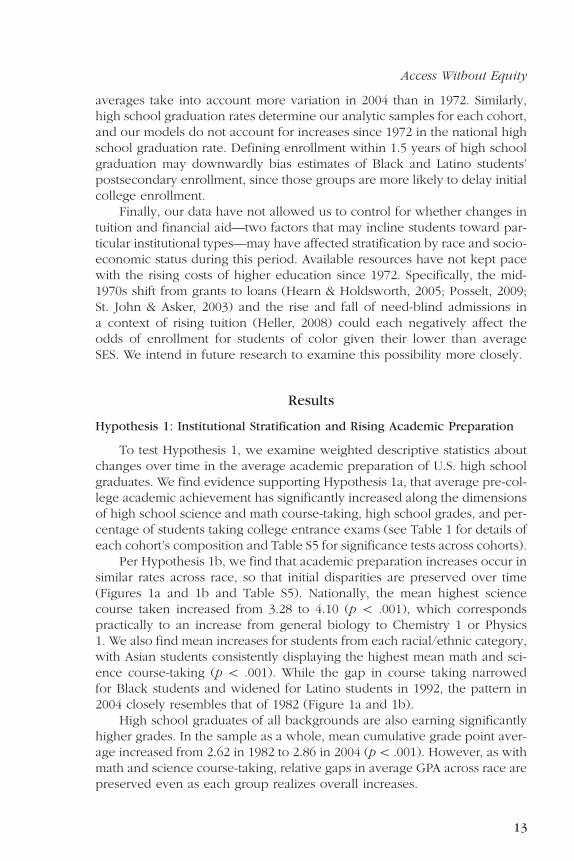
To test Hypothesis 1, we examine weighted descriptive statistics aboutchanges over time in the average academic preparation of U.S. high schoolgraduates. We find evidence supporting Hypothesis 1a, that average pre-col-lege academic achievement has significantly increased along the dimensionsof high school science and math course-taking, high school grades, and per-centage of students taking college entrance exams (see Table 1 for details ofeach cohort’s composition and Table S5 for significance tests across cohorts).
Per Hypothesis 1b, we find that academic preparation increases occur insimilar rates across race, so that initial disparities are preserved over time(Figures 1a and 1b and Table S5). Nationally, the mean highest sciencecourse taken increased from 3.28 to 4.10 (p \ .001), which correspondspractically to an increase from general biology to Chemistry 1 or Physics1. We also find mean increases for students from each racial/ethnic category,with Asian students consistently displaying the highest mean math and sci-ence course-taking (p \ .001). While the gap in course taking narrowedfor Black students and widened for Latino students in 1992, the pattern in2004 closely resembles that of 1982 (Figure 1a and 1b).
High school graduates of all backgrounds are also earning significantlyhigher grades. In the sample as a whole, mean cumulative grade point aver-age increased from 2.62 in 1982 to 2.86 in 2004 (p \ .001). However, as withmath and science course-taking, relative gaps in average GPA across race arepreserved even as each group realizes overall increases.
Access Without Equity
13
The percentage of students taking entrance exams and mean scores onthese exams both point to increased preparation for postsecondary
Table 1
Traits of 1972, 1982, 1992, and 2004 U.S. High School Graduates (Weighted)
1972
(N = 11,820)
1982
(N = 9,550)
1992
(N = 10,070)
2004
(N = 11,730)
Race/ethnicity
White 84.9% 79.3% 72.9% 62.7%
Black 8.3% 11.9% 11.8% 12.9%
Latino 3.5% 6.3% 9.7% 14.8%
Asian American 1.1% 1.3% 4.4% 4.4%
Controls
Female 51.0% 51.4% 49.7% 51.3%
Expect less than bachelor’s degree 58.6% 52.5% 28.4% 21.7%
Mean high school GPA (SD) NA 2.62 (.66) 2.66 (.68) 2.86 (.67)
Mean SAT (SD) 1,050.7
(180.8)
971.3
(195.4)
1,003.2
(193.1)
1,003.9
(202.5)
Mean highest science taken (SD) NA 3.28 (1.52) 3.84 (1.52) 4.10 (1.25)
Mean highest math taken (SD) NA 2.66 (1.43) 3.32 (1.51) 3.74 (1.47)
High school athletics 44.7% 52.4% 43.0% 44.8%
High school honor society 15.6% 17.5% 19.7% 23.2%
High school extracurricular leader NA NA 18.6% 37.3%
Postsecondary outcome
Not enrolled 44.0% 35.7% 28.3% 21.8%
2 year 23.4% 30.0% 27.9% 30.9%
Noncompetitive 4 year 8.9% 8.7% 10.5% 12.8%
Competitive 12.2% 13.4% 16.6% 18.3%
Very competitive 7.2% 7.3% 9.3% 9.8%
Most competitive 4.3% 5.0% 7.4% 6.4%
Posselt et al.
14
education. The two statistics are related, for with an increase in the size ofthe test-taking pool, we expect lower average scores. Indeed, the meanSAT score has declined by about 50 points, which is likely due to a risingpopulation of test-takers. Between 1982 and 2004, the proportion of studentstaking either the SAT or ACT increased, both overall and within racial/ethnicgroups (Figure S5). Nevertheless, we still observe increases in the mean SATscores of Black, Latino, and Asian American students (Table S7). AsianAmericans have the highest mean SAT score in each cohort, despite a higherproportion of them taking the exams than White, Latino, and Black studentsin each cohort.
Focusing on those who enroll in the most selective institutions, weobserve widening differences in mean SAT scores by race, from 141 pointsbetween White and Black students’ mean scores in 1972 to 202 pointsbetween Asian American and Black students’ mean scores in 2004 (Figure 2).
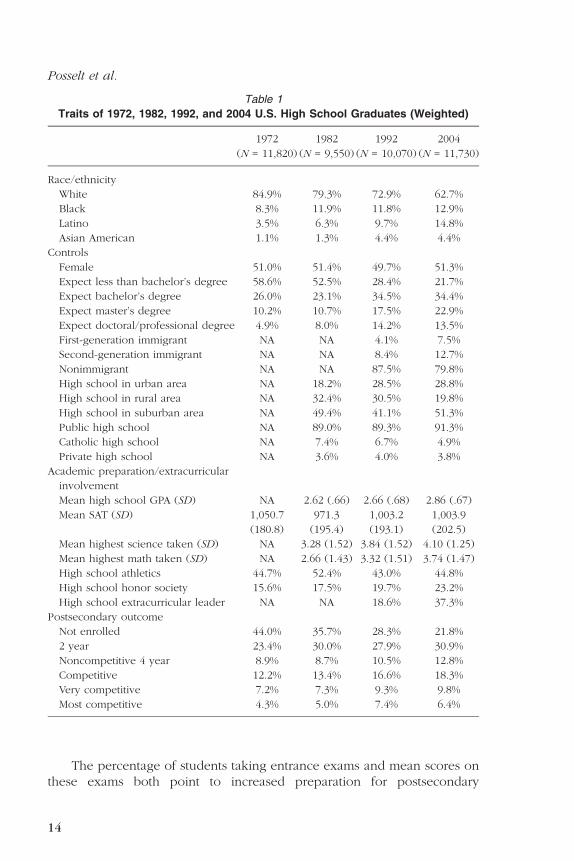
As is expected given rising postsecondary preparation, the percentage ofeach racial/ethnic cohort enrolling in any postsecondary education within 18months of graduation increases between 1972 and 2004 (Figure 3). Withsteeper gains in overall enrollment coming from the most underrepresentedracial groups, the enrollment gap reduces by more than half, from 44 per-centiles to 20 percentiles. Notably, the percentage of Black students not
Figure 1a. Mean highest high school math course passed.
Note. Highest math course passes is defined as follows, per Burkam, Lee, and
Owings (2003): 1 = no math or ‘‘low’’ math; 2 = Algebra 1 or plane geometry; 3
Figure 1b. Mean highest high school science course passed.
Note. Highest science course passed is defined as follows, per Burkam, Lee, and
Owings (2003): 1 = no science or ‘‘low’’ science; 2 = basic biology or secondary
physical science; 3 = general biology; 4 = Chemistry 1 or Physics 1; 5 =
Chemistry 1 and Physics 1; 6 = Chemistry 2, Physics 2, or advanced biology.
Figure 2. Mean SAT score in most selective institutions by race/ethnicity.
Posselt et al.
16
enrolling in postsecondary education is cut in half, from 52.6% to 26.3%.Against this backdrop of expanded access and improved academic prepara-tion, however, lower initial enrollment rates in selective institutions persistamong Black and Latino students compared to White and Asian students.
Per Hypothesis 1c, we find that similar rates of increase in academic prep-aration result in little change in institutional stratification (see Figure 4). Blackand Latino students do realize significant gains in access to selective collegesand universities, if we define them as any 4-year institution employing a com-petitive admissions process. By 2004, 22.7% of Black high school graduatesenroll in a selective college or university (up from 14.8% in 1972) comparedwith 16.2% of Latinos, 40.3% of Whites, and 50.9% of Asian Americans.However, all racial/ethnic categories make such gains during this time period,such that the overall selective college enrollment gap—one marker of institu-tional stratification by race—is slightly wider in 2004 than it was in 1972.
Looking at the most selective institutions (Figure 4), stratification by raceappears even more pronounced than in selective colleges, generally.Enrollment rates between 1972 and 2004 modestly increase from 1.6% to1.9% among Black students and from 1.4% to 3.4% among Latino students.Consistent with Asian American and White students’ higher mean grades,entrance exam scores, and advanced course-taking, a greater percentageof those students enroll in the most selective category of colleges and
Figure 3. Percentage of high school graduates enrolling in any type of postsec-
ondary education (PSE) within 18 months of graduation.
Access Without Equity
17
universities over time (from 11.6% in 1972 to 16.4% in 2004 for AsianAmericans and 4.7% to 7.3% of Whites). Put another way, for every 100Asian American high school graduates, 16 enrolled in one of the most selec-tive colleges in 2004, compared to only 2 of every 100 Black high schoolgraduates.
It is possible that gains in elite college enrollment may be driven byexpansion of the elite categories or greater academic preparation; to moreclosely examine the academic preparation hypothesis, we employ multino-mial logistic regression (Hypothesis 2).
Hypothesis 2: Academic Preparation and Odds of Enrolling in Selective
Institutions
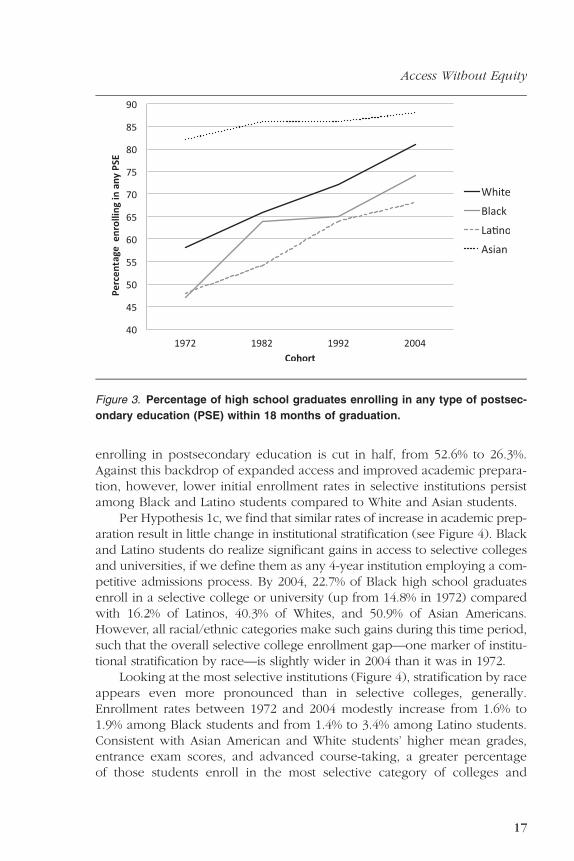
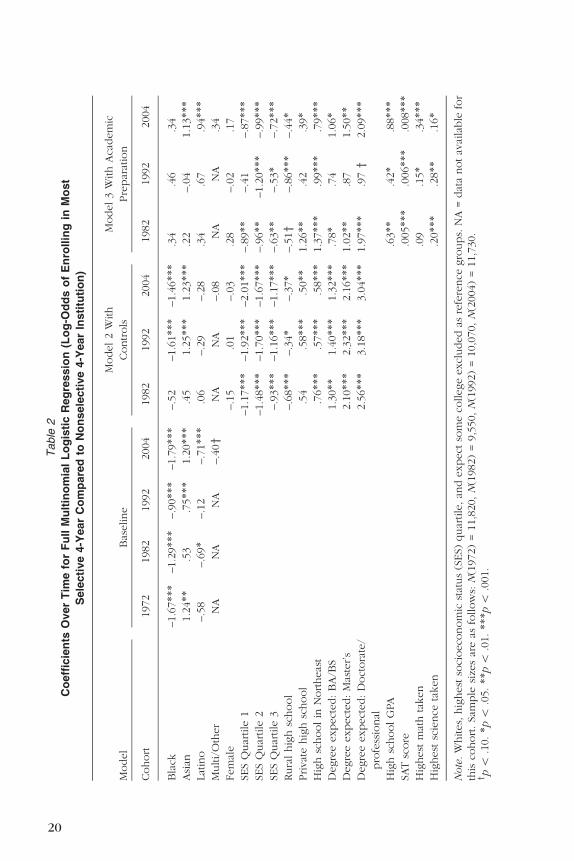
Tables 2 and 3 display the findings of our MNL models. High schoolGPA, SAT scores, and highest math and science courses taken are all associ-ated with significantly higher odds of enrollment in one of the most selectiveinstitutions relative to an open 4-year institution. Of these, GPA, SAT, andhighest high school math course support our hypothesis that the positiveeffect of academic preparation on enrollment in selective colleges has grownover time (Table 2). The increasing importance of SAT scores is perhaps thestrongest longitudinal trend. In 1982 a standard deviation increase in SAT is
Figure 4. Postsecondary enrollment of high school graduates 18 months after
graduation, as percentage of racial/ethnic group.
Posselt et al.
18
associated with a 2.7 times higher odds of enrolling in one of the most selec-tive institutions (p\ .001), but by 2004 it is associated with a 5.4 times higherodds (p \ .001). The positive relationship of grades and enrollment alsostrengthens. By 2004, each standard deviation increase in GPA is associatedwith 40% higher odds of enrolling in a very competitive (p \ .001) and 69%higher odds of enrolling in a most competitive (p \ .001) institution relativeto an open 4-year institution. Coefficients for highest math course taken alsotrend upward, indicating that advanced math courses increasingly predictenrollment.
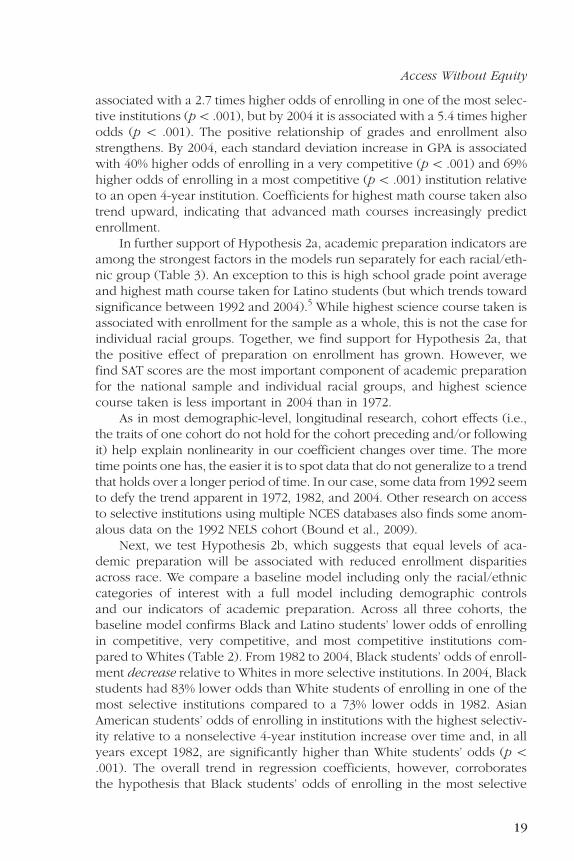
In further support of Hypothesis 2a, academic preparation indicators areamong the strongest factors in the models run separately for each racial/eth-nic group (Table 3). An exception to this is high school grade point averageand highest math course taken for Latino students (but which trends towardsignificance between 1992 and 2004).5 While highest science course taken isassociated with enrollment for the sample as a whole, this is not the case forindividual racial groups. Together, we find support for Hypothesis 2a, thatthe positive effect of preparation on enrollment has grown. However, wefind SAT scores are the most important component of academic preparationfor the national sample and individual racial groups, and highest sciencecourse taken is less important in 2004 than in 1972.
As in most demographic-level, longitudinal research, cohort effects (i.e.,the traits of one cohort do not hold for the cohort preceding and/or followingit) help explain nonlinearity in our coefficient changes over time. The moretime points one has, the easier it is to spot data that do not generalize to a trendthat holds over a longer period of time. In our case, some data from 1992 seemto defy the trend apparent in 1972, 1982, and 2004. Other research on accessto selective institutions using multiple NCES databases also finds some anom-alous data on the 1992 NELS cohort (Bound et al., 2009).
Next, we test Hypothesis 2b, which suggests that equal levels of aca-demic preparation will be associated with reduced enrollment disparitiesacross race. We compare a baseline model including only the racial/ethniccategories of interest with a full model including demographic controlsand our indicators of academic preparation. Across all three cohorts, thebaseline model confirms Black and Latino students’ lower odds of enrollingin competitive, very competitive, and most competitive institutions com-pared to Whites (Table 2). From 1982 to 2004, Black students’ odds of enroll-ment decrease relative to Whites in more selective institutions. In 2004, Blackstudents had 83% lower odds than White students of enrolling in one of themost selective institutions compared to a 73% lower odds in 1982. AsianAmerican students’ odds of enrolling in institutions with the highest selectiv-ity relative to a nonselective 4-year institution increase over time and, in allyears except 1982, are significantly higher than White students’ odds (p \.001). The overall trend in regression coefficients, however, corroboratesthe hypothesis that Black students’ odds of enrolling in the most selective
Access Without Equity
19
Table
2
Co
eff
icie
nts
Over
Tim
efo
rF
ull
Mu
ltin
om
ial
Lo
gis
tic
Reg
ressio
n(L
og
-Od
ds
of
En
roll
ing
inM
ost
Sele
cti
ve
4-Y
ear
Co
mp
are
dto
No
nsele
cti
ve
4-Y
ear
Insti
tuti
on
)
Model
Bas
eline
Model2
With
Controls
Model3
With
Aca
dem
ic
Pre
par
atio
n
Cohort
1972
1982
1992
2004
1982
1992
2004
1982
1992
2004
Bla
ck–1.6
7***
–1.2
9***
–.9
0***
–1.7
9***
–.5
2–1.6
1***
–1.4
6***
.34
.46
.34
Asi
an1.2
4**
.53
.75***
1.2
0***
.45
1.2
5***
1.2
3***
.22
–.0
41.1
3***
Latino
–.5
8–.6
9*
–.1
2–.7
1***
.06
–.2
9–.2
8.3
4.6
7.9
4***
Multi/
Oth
er
NA
NA
NA
–.4
0y
NA
NA
–.0
8N
AN
A.3
4
Fem
ale
–.1
5.0
1–.0
3.2
8–.0
2.1
7
SES
Quar
tile
1–1.1
7***
–1.9
2***
–2.0
1***
–.8
9**
–.4
1–.8
7***
SES
Quar
tile
2–1.4
8***
–1.7
0***
–1.6
7***
–.9
6**
–1.2
0***
–.9
9***
SES
Quar
tile
3–.9
3***
–1.1
6***
–1.1
7***
–.6
3**
–.5
3*
–.7
2***
Rura
lhig
hsc
hool
–.6
8***
–.3
4*
–.3
7*
–.5
1y
–.8
6***
–.4
4*
Privat
ehig
hsc
hool
.54
.58***
.50**
1.2
6**
.42
.39*
Hig
hsc
hoolin
Northeas
t.7
6***
.57***
.58***
1.3
7***
.99***
.79***
Degre
eexpect
ed:BA/B
S1.3
0**
1.4
0***
1.3
2***
.78*
.74
1.0
6*
Degre
eexpect
ed:M
aste
r’s
2.1
0***
2.3
2***
2.1
6***
1.0
2**
.87
1.5
0**
Degre
eexpect
ed:D
oct
ora
te/
pro
fess
ional
2.5
6***
3.1
8***
3.0
4***
1.9
7***
.97
y2.0
9***
Hig
hsc
hoolG
PA.6
3**
.42*
.88***
SAT
score
.005***
.006***
.008***
Hig
hest
mat
hta
ken
.09
.15*
.34***
Hig
hest
scie
nce
taken
.20***
.28**
.16*
Note
.W
hites,
hig
hest
soci
oeco
nom
icst
atus
(SES)
quar
tile
,an
dexpect
som
eco
llege
excl
uded
asre
fere
nce
gro
ups.
NA
=dat
anotav
aila
ble
for
this
cohort.Sa
mple
size
sar
eas
follow
s:N
(1972)
=11,8
20,
N(1
982)
=9,5
50,
N(1
992)
=10,0
70,
N(2
004)
=11,7
30.
yp
\.1
0.*p
\.0
5.**p
\.0
1.***p
\.0
01.
20
Table
3
Co
eff
icie
nts
Over
Tim
efo
rM
od
els
Esti
mate
dW
ith
inE
ach
Racia
l/E
thn
icC
ate
go
ry
Model
White
Bla
ckLa
tino
Asi
an
Cohort
1992
(N=
3,7
50)
2004
(N=
4,6
40)
1992
(N=
330)
2004
(N=
720)
1992
(N=
370)
2004
(N=
640)
1992
(N=
430)
2004
(N=
700)
Extrac
urr
icula
rle
ader
0.3
4y
0.5
2***
–1.6
9*
1.2
7*
–0.8
30.5
2–0.7
8y
0.7
8y
Imm
igra
nt(f
irst
genera
tion)
–0.4
2–0.6
6–43.2
6–0.1
50.6
51.0
3y
2.0
4**
–1.3
6
Imm
igra
nt(s
eco
nd
genera
tion)
0.8
3*
0.1
61.0
8–1.6
71.7
1*
0.7
52.0
9**
–0.3
2
Fem
ale
–0.1
00.2
9*
1.0
9y
–1.6
2**
–1.0
4–0.0
60.2
50.7
9y
Rura
lhig
hsc
hool
–0.6
6**
–0.4
9**
–1.3
5y
–1.5
8–3.2
0**
–1.4
9*
–0.1
73.0
4***
Privat
ehig
hsc
hool
0.4
70.3
02.3
6y
1.6
7*
23.3
5***
–0.4
4–0.9
41.3
5y
Hig
hsc
hoolin
NE
1.2
8***
0.7
9***
–0.8
8*
2.5
4***
–0.0
20.0
4–0.4
90.6
7
Degre
eexpect
ed:So
me
college
–0.2
0–32.6
6–44.2
7***
–34.5
6***
–9.4
8***
–27.7
3***
–35.0
1–26.8
3***
Degre
eexpect
ed:BA/B
S–0.2
80.0
3–1.9
6–1.5
320.0
3**
2.5
1y
3.7
8*
3.7
4**
Degre
eexpect
ed:M
aste
r’s
0.1
50.4
22
–1.6
3–2.7
9*
21.8
3***
2.3
5y
3.9
9*
3.7
0**
Degre
eexpect
ed
Doct
ora
te/p
rofe
ssio
nal
0.3
10.9
20.2
9–1.7
522.6
3***
3.0
84.0
9*
4.4
3***
Hig
hsc
hoolG
PA0.7
0***
0.7
2***
0.5
01.9
9***
–0.1
60.6
3–0.1
61.4
7**
SAT
score
0.0
1***
0.0
1***
0.0
1*
0.0
1**
0.0
1***
0.0
1***
0.0
1**
0.0
1***
Hig
hest
mat
hta
ken
0.1
10.2
8**
0.5
5**
0.7
2y
–0.3
40.3
60.5
3*
0.5
6*
Hig
hest
scie
nce
taken
0.2
5*
0.1
0–0.3
40.0
30.9
4*
–0.0
20.4
6y
0.3
2
SES
Quar
tile
1–1.9
2***
–1.4
6**
–0.0
6–0.7
3–0.2
30.0
90.2
40.2
6
SES
Quar
tile
2–1.4
5***
–1.4
1***
–0.7
0–0.2
3–1.6
0–0.1
1–0.5
70.5
6
SES
Quar
tile
3–0.8
7***
–0.8
8***
–0.9
80.5
2–0.9
8–0.1
20.9
60.5
7
Note
.Lo
g-o
dds
of
enro
llin
gin
most
sele
ctiv
e4-y
ear
com
par
ed
tononse
lect
ive
4-y
ear
inst
itution.N
onim
mig
rant,
hig
hest
soci
oeco
nom
icst
atus
(SES)
quar
tile
,an
dexpect
hig
hsc
hooldip
lom
aexcl
uded
asre
fere
nce
gro
ups.
NA
=dat
anotav
aila
ble
for
this
cohort.
yp
\.1
0.*p
\.0
5.**p
\.0
1.***p
\.0
01.
21
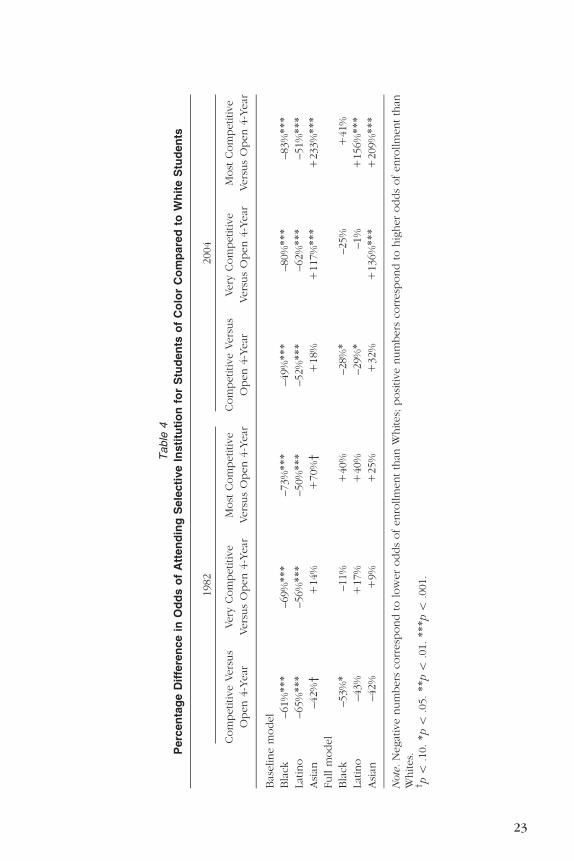
institutions is declining relative to other types of institutions and relative toWhites’ and Asians’ opportunities (Table 4). Running a similar model inwhich Asian American students were excluded as the reference group con-firmed this finding.
Controlling for demographic factors, degree expectations, and academicpreparation changes the relationships considerably. Differences in enroll-ment odds between Black and White students are no longer statistically sig-nificant in any of the cohorts, suggesting enrollment disparities may beattributed in part to associated disparities in academic preparation.Holding academic preparation constant not only equalizes Latinos’ odds ofenrollment by 2004 but produces a 156% higher enrollment odds thanWhite students, ceteris paribus (p \ .0001). In summary, our results clearlysupport Hypothesis 2b, that racial disparities in selective college enrollmentdecline over time if academic preparation and other variables in our modelare held constant. Differences in academic preparation—which are an out-come of racialized and unequal K–12 schools—help explain why Blackand Latino high school graduates are less likely than their White counterpartsto enroll in America’s most selective colleges and universities.
Hypothesis 3: Extracurricular Leadership and
Enrollment in Selective Institutions
Descriptive and multivariate evidence converge to support our hypothesisthat extracurricular involvement and leadership is increasingly important forenrollment in highly selective schools. In each racial/ethnic category, the per-centage of students enrolled in the most competitive institutions reportinghigh school extracurricular leadership more than doubles from 1992 to 2004(Figure 5). In the two cohorts in which we have leadership data, Black stu-dents in the most selective institutions report extracurricular leadership atthe highest rates (35% up to 74%), followed by Whites (30% up to 69%).
According to the MNL of the whole sample (Table 3), leadership does notpredict enrollment in a highly selective institution for the 1992 cohort, but it isstrongly, positively associated with enrollment in the most selective institu-tions in 2004 (p\ .001). Controlling for everything else in the model, extracur-ricular leaders in high school in the 2004 cohort have 75% higher odds ofenrolling in the most selective institutions relative to noncompetitive 4-yearschools (p \ .001). Leaders are also more likely to enroll in competitiveand very competitive institutions relative to noncompetitive 4-year colleges.
In the models disaggregated by race/ethnicity, extracurricular leadershippredicts enrollment in the most selective institutions among White, Black,and Asian American students but not Latinos. Latino students enrolled in themost selective institutions also have the lowest self-reported rates of highschool extracurricular leadership. It deserves noting that we report coefficientsfor the models by race/ethnicity for two purposes: (1) within-model
Posselt et al.
22
Table
4
Perc
en
tag
eD
iffe
ren
ce
inO
dd
so
fA
tten
din
gS
ele
cti
ve
Insti
tuti
on
for
Stu
den
tso
fC
olo
rC
om
pare
dto
Wh
ite
Stu
den
ts
1982
2004
Com
petitive
Vers
us
Open
4-Y
ear
Very
Com
petitive
Vers
us
Open
4-Y
ear
Most
Com
petitive
Vers
us
Open
4-Y
ear
Com
petitive
Vers
us
Open
4-Y
ear
Very
Com
petitive
Vers
us
Open
4-Y
ear
Most
Com
petitive
Vers
us
Open
4-Y
ear
Bas
eline
model
Bla
ck–61%***
–69%***
–73%***
–49%***
–80%***
–83%***
Latino
–65%***
–56%***
–50%***
–52%***
–62%***
–51%***
Asi
an–42%
y1
14%
170%
y1
18%
1117%***
1233%***
Full
model
Bla
ck–53%*
–11%
140%
–28%*
–25%
141%
Latino
–43%
117%
140%
–29%*
–1%
1156%***
Asi
an–42%
19%
125%
132%
1136%***
1209%***
Note
.N
egat
ive
num
bers
corr
esp
ond
tolo
wer
odds
ofenro
llm
entth
anW
hites;
posi
tive
num
bers
corr
esp
ond
tohig
her
odds
ofenro
llm
entth
anW
hites.
yp
\.1
0.*p
\.0
5.**p
\.0
1.***p
\.0
01.
23
comparison of factors’ relative importance and (2) between-model compari-son of coefficient significance and sign direction. These models’ analytic sam-ple sizes range from a low of 330 African Americans in 1992 to a high of 4,640Whites in 2004, and Long and Freese (2005) admonish against direct compar-isons of coefficients for models with different sample sizes. The results of like-lihood ratio tests, Long and Freese argue, will be skewed due to differencesbetween the samples (p. 67). Although we are only able to compare two co-horts, these data support Hypothesis 3, that extracurricular leadership is anincreasingly important predictor of enrollment in selective institutions.
Hypothesis 4: Race, Socioeconomic Status, and Institutional Stratification
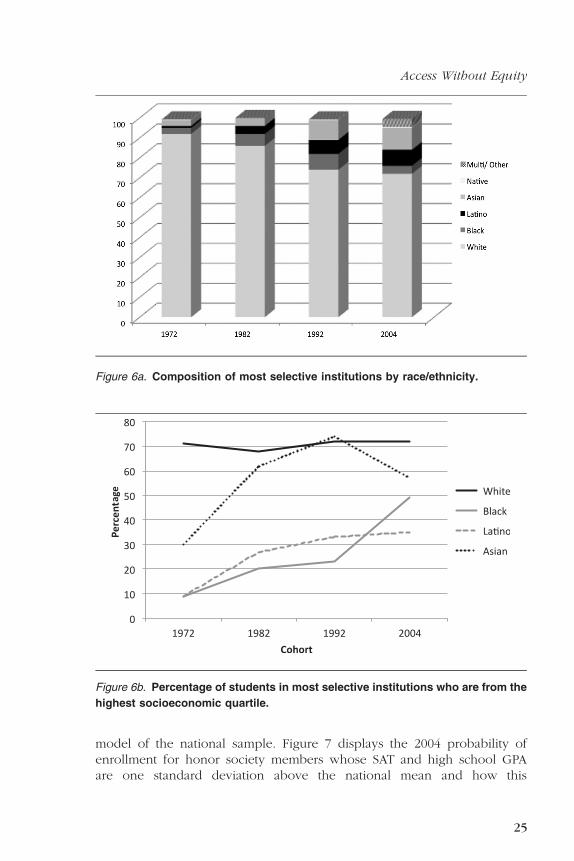
Descriptive statistics provide clear backing for Hypothesis 4a, that anincreasing proportion of students of color in highly selective institutions willbe from families with high socioeconomic status. White students still comprisethe majority in selective colleges nationally, but enrollment has become moreracially diverse over time (see Figure 6a). However, with this diversity we alsoobserve declining SES diversity among students of color, as increasing propor-tions are from the highest SES quartile (Figure 6b). The proportion of Whitestudents in the most competitive institutions who are from the highest SESquartile has hovered around 70% since 1972. By contrast, only 9% of Blackand 9% of Latino students in the most selective colleges were from the highestSES quartile in 1972, but by 2004 this had risen to 49% and 35%.
Finally, to examine Hypothesis 4b, that students of color with strong aca-demic achievements and high SES have the highest probability of enrollingin highly selective institutions, we calculate predicted probabilities from our
Figure 5. Percentage in the most selective institutions reporting extracurricular
leadership in high school.
Posselt et al.
24
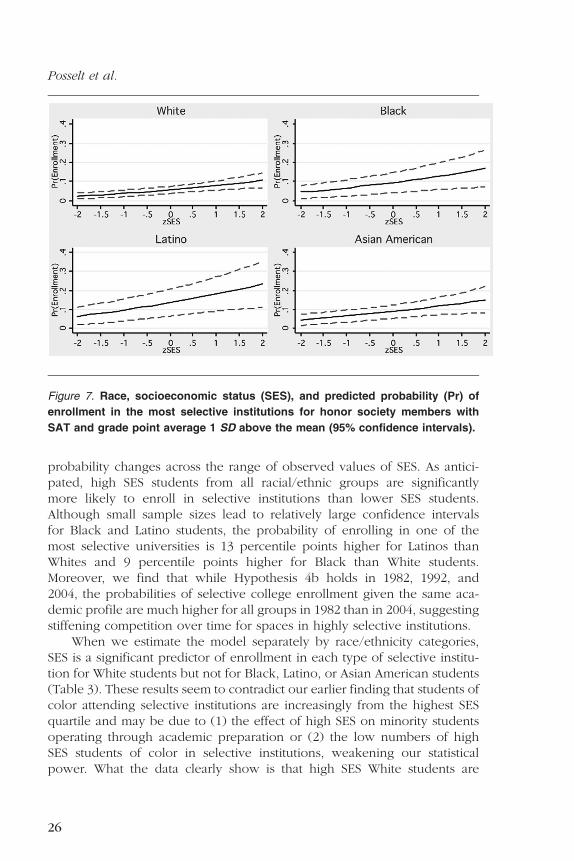
model of the national sample. Figure 7 displays the 2004 probability ofenrollment for honor society members whose SAT and high school GPAare one standard deviation above the national mean and how this
Figure 6a. Composition of most selective institutions by race/ethnicity.
Figure 6b. Percentage of students in most selective institutions who are from the
highest socioeconomic quartile.
Access Without Equity
25
probability changes across the range of observed values of SES. As antici-pated, high SES students from all racial/ethnic groups are significantlymore likely to enroll in selective institutions than lower SES students.Although small sample sizes lead to relatively large confidence intervalsfor Black and Latino students, the probability of enrolling in one of themost selective universities is 13 percentile points higher for Latinos thanWhites and 9 percentile points higher for Black than White students.Moreover, we find that while Hypothesis 4b holds in 1982, 1992, and2004, the probabilities of selective college enrollment given the same aca-demic profile are much higher for all groups in 1982 than in 2004, suggestingstiffening competition over time for spaces in highly selective institutions.
When we estimate the model separately by race/ethnicity categories,SES is a significant predictor of enrollment in each type of selective institu-tion for White students but not for Black, Latino, or Asian American students(Table 3). These results seem to contradict our earlier finding that students ofcolor attending selective institutions are increasingly from the highest SESquartile and may be due to (1) the effect of high SES on minority studentsoperating through academic preparation or (2) the low numbers of highSES students of color in selective institutions, weakening our statisticalpower. What the data clearly show is that high SES White students are
Figure 7. Race, socioeconomic status (SES), and predicted probability (Pr) of
enrollment in the most selective institutions for honor society members with
SAT and grade point average 1 SD above the mean (95% confidence intervals).
Posselt et al.
26
more likely to enroll in each type of selective institution relative to a nonse-lective 4-year institution in both 1992 and 2004. In comparison to enrolling ina nonselective 4-year school, White students in 2004 from the lowest SESquartile had 77% lower odds of enrolling in most selective institution (p \.01), a 52% lower odds of enrolling in a very selective institution (p \.01), and a 40% lower odds of enrolling in a selective institution (p \ .001).
In summary, we find conditional support for Hypothesis 4b, that stu-dents of color with high SES and strong SAT scores have the highest proba-bility of enrolling in selective institutions. High SES students of color do havesignificantly higher probabilities of enrolling in selective institutions thanhigh SES White students, but only where academics are equal. However,we know that most academic preparation is not equal, that Black andLatino students do not often have SAT scores one SD above the nationalmean, and that at mean and lower levels of SES the enrollment advantagebecomes nonsignificant. While capturing detail at one end of the SES, insti-tutional, and academic spectra, the probabilities we calculate do not pertainto the majority of high school graduates.
Discussion and Implications
Rising academic standards for admission, especially SAT scores, havenegative consequences for equitable enrollment in selective colleges. Witheach cohort of high school graduates, high school grade point average,SAT scores, and high school math curriculum are associated with greaterodds of enrolling in institutions that are even minimally selective.Academic preparation among Black and Latino students has improved acrossthe board, but similar rates of improvement among White and Asian studentson some indicators paired with institutions’ increasing reliance on SAT scoreshelp to preserve institutional stratification by race. While the share of Latinohigh school graduates enrolling in these institutions has more than doubledsince 1972, it remains half the national average. Similarly, Black high schoolgraduates’ enrollment in highly selective institutions remains less than one-third of the national average. When we do not hold constant students’ aca-demic profiles—as is the case in schools and society—Black students’ oddsof enrollment have decreased relative to White students’ since 1982.
The importance of academic preparation holds when we estimate themodel separately by each racial/ethnic group. We pose two possible explan-ations for the surprising findings that high school grade point average andhighest math course passed are not significantly associated with Latino stu-dents’ enrollment in the most selective universities. First, these findings maysimply be a function of the small number of Latino students in this samplewho enroll in this institutional type. We know that modeling ‘‘rare events’’ car-ries with it a greater risk of Type II errors (i.e., that the regression misses whatmay in reality be a significant association). A related possibility has to do with
Access Without Equity
27
Latino students’ clustering in particular institutional types and U.S. regions.Nationally generalizable data constructed from the NCES survey efforts maynot actually reflect trends for Latino students, who are not distributed equallyover the country, but rather concentrated in the Southwest and California.They are also concentrated in particular institutional types, with approxi-mately 50% enrolling in Hispanic Serving Institutions that, together, representjust 5% of colleges and universities (Mercer & Stedman, 2008, p. 30).
Holistic Evaluation and Institutional Preferences
We find evidence that academic preparation is a necessary but insuffi-cient basis for selective college admission and that additional factors are con-sidered. Both affirmative action and admissions in selective institutions restupon the practice of holistic evaluation, in which decision makers judge ap-plicants not only on the basis of academic accomplishment but also personaltraits perceived to predict college success and leadership in society. In look-ing for applicants with ‘‘character’’ and ‘‘leadership,’’ some selective univer-sities already practiced holistic admission when affirmative action wasintroduced (Soares, 2007; Stampnitzky, 2006; Wechsler, 1977). Previousexperience with leadership in extracurricular activities, the argument goes,is a prime signal of potential for future leadership (Bennett, 2012;Klitgaard, 1985; Soares, 2007).
Universities like UC-Berkeley, however, also made holistic evaluationa cornerstone of their rationale for affirmative action policies (Takagi,1992). In combination with high achievers’ efforts to distinguish themselvesin the pool of applicants, a significant consequence of affirmative action mayhave been to institutionalize the value that selective institutions place onnonacademic indicators that are more equally distributed across race(Sternberg, 2010; Takagi, 1992). Affirmative action may not change admis-sions opportunities for the majority of underrepresented students, but ithas clear effects in the most selective universities—as it has intended to do(Bowen & Bok, 1998; Grodsky & Kalogrides, 2008).
As selective institutions approach ceiling effects in the ability of test scores,grades, and curriculum to distinguish applicants on the basis of academic prep-aration alone (noted by Hoxby, 2009), escalation in the requirements foradmission to selective institutions has come to include both academic and non-academic traits. And, as Bennett (2012) writes, ‘‘When elite universities beganto use participation in structured activities as part of their assessment of stu-dents’ merit for admission, it became a mechanism for stratification’’ (p. 48).Our data confirm the growing importance of extracurricular activities whilechallenging Bennett’s conclusion that schools should therefore be more con-cerned with equalizing activity participation than with equalizing academicopportunities. Controlling for extracurricular leadership and demographicsalone does not eliminate the gap in the probability of enrollment between
Posselt et al.
28
Blacks, Latinos, and Whites. Put another way, valuing nonacademic indica-tors—whether it is race, extracurricular leadership, or other psychosocialtraits—does not minimize the central and increasing role that prior academicachievement has come to play in selective admissions.
Moreover, we find that selective universities are increasingly stratified bysocioeconomic status, both within and across racial groups. Our predictedprobabilities confirm Bowen, Kurzweil, and Tobin’s (2005) finding thathigh SES students of color with strong academic profiles have the best chan-ces of enrolling in selective institutions. However, in separate MNL regres-sions by racial group, we find SES is only a statistically significant factor inWhite students attending a highly selective college or university. This findingmay trace to the very small numbers of high SES students of color in selectiveuniversities. As this number increases and approaches the 70% rate thatWhites have had since 1972, and given the upward trend in our coefficients,SES may soon become a significant predictor of enrollment across racial cat-egories. In the meantime, that students of color at selective colleges are sig-nificantly higher in SES than they used to be may help explain the observedincreases in their average academic preparation and enrollment.
Implications
Together, the trends we have identified allow the postsecondary systemto remain stratified while fulfilling competing demands for overall growth,a modicum of racial diversity, and in the selective sector, high rankings.Yet over the long term, and given pressure to roll back race-sensitive admis-sions, it will require a multidimensional agenda to resolve the tensionbetween access and equity (St. John, Hu, & Fisher, 2010). Here, the two dis-courses of diversity in American higher education that Chang (2002) identi-fies are instructive. The discourse of preservation protects existing practicesand arrangements of power, emphasizing short-term solutions to the prob-lem of underrepresentation. The diversity discourse of transformation, onthe other hand, considers long-term, structural dimensions of access andhow diversity may transform institutions. There are implications of ourresearch associated with both discourses. To confront questions about struc-tural diversity in America and elite American universities over the long termwill require us to fundamentally rethink our values and how they are re-flected in admissions criteria and practices. However, we do a disserviceto current Black and Latino students by not striving to accelerate their qual-ifications relative to White and Asian students on criteria that affectenrollment.6
Beginning with the latter, our findings corroborate the importance ofreducing racial/ethnic gaps in academic preparation (Alon & Tienda, 2007;Espenshade, Hale, & Chung, 2005). Unequal rates of enrollment have ledpolicymakers to set high school curriculum and course-taking standards as
Access Without Equity
29
levers for improving postsecondary access (Allensworth, Nomi,Montgomery, & Lee, 2009; Chazan, 1996), and we do find that holdingcourse-taking equal significantly reduces enrollment gaps for underrepre-sented students of color. However, raising curriculum standards withoutstrengthening support systems may exacerbate socioeconomic inequalityby favoring students whose parents can provide academic support.Moreover, while raising standards for all sounds like a laudable goal, itmay have the unintended consequence of fomenting the academic escala-tion trend on which, we argue, institutional stratification by race is based.The problem is not that Black and Latino students have not improved theirperformance on the measures selective colleges require. Rather, because allgroups have improved at similar rates on measures unequally distributed byrace, underrepresented students’ competitive disadvantage is preserved.
College access programs and targeted standardized test preparation aretwo possible, short-term solutions. First, programs such as Upward Boundencourage underrepresented students’ college access by providing collegeknowledge, test preparation, and advanced curriculum that selective institu-tions desire but that are not available in all families and secondary schools(Gandara, 2001; Perna, 2005; St. John et al., 2010; Swail & Perna, 2002).Multisite evidence is needed, however, about these programs’ outcomes,the mechanisms by which outcomes are achieved, and the programmaticcomponents that most contribute to outcomes. Second, one study findsthat targeted preparation on the SAT and ACT for Black and Latino studentsreduces test score gaps (Buchmann, Condron, & Roscigno, 2010), suggestingtest preparation may also indirectly reduce selective college enrollmentgaps. Test preparation might include training to counter the tendenciestoward stereotype threat that standardized tests can induce in Black andLatino students (Steele, 1997; Taylor & Antony, 2000). A very high scoredoes not ensure admission, but a very low one precludes it, and we findthat SAT scores are the single strongest predictor of enrollment.
However, we do not presume that the SAT should be the strongest factorin enrollment. Often efforts to close gaps on criteria that historically hurtBlack and Latino students’ attainment are really short-term solutions to a lon-ger term social justice challenge: whether and how America’s values and pat-terns of power will be transformed with its increasing racial and ethnicdiversity. For decades, education scholars have identified high-stakes testingas a barrier to social justice (Banks, 1995). In college admissions, notions ofequal opportunity are compromised by the SAT and ACT’s entrenched rolein determining access to the educational sector that produces the greatestlong-term economic benefits. This incompatibility is also problematicbecause underrepresented groups are also growing most quickly in the over-all population (National Academy of Sciences, 2011). We need additionalways of identifying talent.
Posselt et al.
30
The incentive for highly selective institutions to preserve conventionalacademic achievement as their primary admissions consideration is power-ful, without a doubt, for contemporary institutional stratification relies onranking systems constructed from academic selectivity statistics (Bowman& Bastedo, 2011; Espeland & Sauder, 2007). However, highly selective insti-tutions are also best positioned to reshape the cultural landscape of what isvalued in American higher education. Institutions can reward talents andskills that our increasingly multicultural democracy demands, for example(Guinier, 2003; Sternberg, 2010). As we find, extracurricular involvementand leadership improve the odds of admission for Black and Latino students,suggesting that more balanced definitions of merit may encourage diversity.Another step in the direction of talent identification and social justice is thepractice of contextualizing an applicant’s attributes based on their highschool characteristics and opportunities to learn.
Finally, researchers and institutions should continue to consider themerits of diversity itself (Gurin, Dey, Hurtado, & Gurin, 2002; Milem,2003). We reiterate that given the considerable heterogeneity within theWhite and Asian American categories (and the imperfection of the catego-ries), our findings should not be interpreted to structure policy or programsthat may affect these groups’ opportunities, writ large. In general, intersect-ing race with gender, SES, immigrant status, and urbanicity better capturesthe complex structure of postsecondary access more accurately thanaccounting only for race/ethnicity (Bastedo & Jaquette, 2011; Kao &Tienda, 1998; Perna & Titus, 2004; Schmidt, 2007).
Conclusion
Although disparities in postsecondary enrollment writ large continue tonarrow, we must attend to the possibility that stratification—both in postsec-ondary access and in the labor market outcomes that derive from this access—isbeing shifted to other sources within the system. Advanced degree attainmentand institutional prestige, which go hand-in-hand with institutional stratifica-tion, are two additional foundations of racial inequality requiring our attention.In this article, we have analyzed the expansion of postsecondary access andpersistence of inequitable enrollment in the most selective colleges anduniversities.
Specifically, we have examined how escalation since 1972 in the neces-sary and sufficient conditions for admission to selective colleges and univer-sities may be hindering more equitable enrollment outcomes. For instance,having a minimum SAT score and taken calculus seems to have becomea necessary but not sufficient condition for enrollment in very selective insti-tutions. Admissions committees at selective institutions clearly care a greatdeal about students’ academic profiles and are increasingly unwilling toadmit applicants’ whose numbers are 1 to 2 standard deviations below
Access Without Equity
31
that of their average student. Taking this approach with measures unequallydistributed by race—such as the SAT—encourages unequal enrollment.
Yet the trends we identify suggest that attending to academic preparationmay not be enough. Even controlling for test scores and academic preparation,extracurriculars contribute positively and significantly to Black and Latino stu-dents’ odds of enrollment in selective institutions. As we approach ceiling ef-fects in the ability of standardized tests, coursework, and grades tomeaningfully distinguish among the growing number of students pursuingselective institutions, we should track the growing use of so-called noncognitivecriteria such as leadership and how opportunities to cultivate such criteria aredistributed across social origins. Extracurricular leadership in addition to excel-lent academic qualifications may have constituted sufficient grounds for admis-sion through the early 1990s, but it appears to be a necessary condition in the21st century. If the escalation in recent history can be taken as our guide, whatensures a student’s admission today may be insufficient in the near future.
We focused on demographic-level trends in preparation, but we alsoneed research that clarifies the micro-level processes admissions officersuse to make meaning of applicant information. What is holistic evaluationlike in practice? How do admissions officers handle differences in SAT scores(Zwick, 2002) and extracurricular achievements (Kaufman & Gabler, 2004),for example? Such research could also capture additional detail about partic-ularistic criteria that admissions officers employ to distinguish among stu-dents who are qualified along the universal criterion of academicperformance (Klitgaard, 1985; Stevens, 2007). Regression analysis is suitablefor picking up the criteria that are necessary for getting in to competitive in-stitutions, but not the idiosyncrasies and experiences (e.g., taking first prizein state debate contest, starting a nonprofit organization) that are sufficientfor setting apart particular candidates from conventional academic achievers.
Fundamentally, however, it is not only how merit is defined (i.e., which cri-teria are considered), but also the nature of the admissions competition itselfthat make equitable outcomes so difficult to achieve. The logic of Lucas’(2001) theory of effectively maintained inequality helps illustrate the challenge.As the transition to postsecondary education has become nearly universal,advantaged individuals are increasingly seeking access to selective institutionsto distinguish themselves in a professional labor market saturated with bache-lor’s degree holders (Frank & Cook, 1995). Their pursuit of such institutions,combined with elite colleges’ multiple imperatives to protect low rates of admis-sions and high academic qualifications, compel the use of comparative evalua-tion in choosing who most deserves admission. When evaluation iscomparative, admissions becomes a competition and ‘‘winner take all’’ market(Frank & Cook, 1995) in which applicants try to present themselves with evergreater levels of academic and personal distinctions (Bourdieu & Nice, 1984;Bourdieu & Passeron, 1977). Unfettered escalation makes it more difficult toreduce disparities, and system stratification continues and/or intensifies.
Posselt et al.
32
Admissions officers may try to mitigate these tendencies through considerationsof the high school environment, but tendencies toward inequality are deeplyinstitutionalized. As affirmative action policy options are limited, realizing racialequity will therefore require ongoing efforts to reduce pre-college disparitiesamong students seeking opportunity, as well as creative efforts among thosewith the power to provide it.
Notes
This article is based upon work made possible by funding from the Association forInstitutional Research, the National Center for Education Statistics, the NationalScience Foundation, and the National Postsecondary Education Cooperativeunder Association for Institutional Research Grant RG10-129.
1The National Center for Education Statistics (NCES) databases we use (NationalLongitudinal Survey 1972 [NLS], High School & Beyond 1980 [HSB], NationalEducational Longitudinal Survey 1988 [NLS], and Educational Longitudinal Survey 2002[ELS]) apply the same race/ethnicity classification scheme as the U.S. census. Due toextremely small sample sizes of Native Americans/American Indians in our institutionsof interest, we focus our analyses on individuals who identify as White, Black/AfricanAmerican, Asian American, and Hispanic/Latino/a in the wave of data collection followinghigh school graduation. Since two census categories are explicitly racial (i.e., White andBlack) and two are ethnic (i.e., Asian American and Latino), we use the language ofrace/ethnicity to describe the groups. Race and ethnicity are distinct constructs, but givenAmerica’s racialized society and education system, we use racial to describe trends acrossracial/ethnic groups.
2Recognizing many individuals select Hispanic as the closest category in data collec-tion efforts but disapprove of that label and instead identify with the broader Latino/a com-munity (Alcoff, 2005), we opt for using Latino in our discussion of results.
3Building on other research of socioeconomic status (SES) across cohorts, we testedalternate measures of SES, including (1) continuous SES for all students in all cohorts and(2) parental education and logged family income. Cross-tabulations of the quartile meas-ures with parental education levels and logged family income reflect expected trends.Sensitivity tests of the full model with each SES measure yielded Aikake InformationCriterion measures equal to the .0001 place and McFadden’s R2 equal to the .001 place.See Appendix A in the online supplemental material for results of the sensitivity analyses.
4Sensitivity tests compare results of our MNL with true SAT scores to the MNL withimputed SAT scores. The coefficients were not statistically different, but the model withimputed SAT scores had better model fit due to larger sample size. Therefore, our finalmodels employ imputed SAT scores.
5Small samples of Latino students enrolling in highly selective institutions result inlow statistical power and thus possible Type II errors in estimating the factors predictingtheir enrollment.
6Although our longitudinal data set did not allow for such analyses over time, Pernaand Titus (2004) convincingly demonstrate the important role played by state-level poli-cies regarding financial aid, tuition, K–12 education, and general appropriations in bothinstitutional and SES stratification.
References
Alcoff, L. M. (2005). Latino vs. Hispanic: The politics of ethnic names. Philosophy andSocial Criticism, 31(4), 395–407.
Access Without Equity
33
Allensworth, E., Nomi, T., Montgomery, N., & Lee, V. E. (2009). College preparatorycurriculum for all: Consequences of ninth grade course taking on academic out-comes in Chicago. Educational Evaluation and Policy Analysis, 31(4), 367–391.
Alon, S., & Tienda, M. (2007). Diversity, opportunity, and the shifting meritocracy inhigher education. American Sociological Review, 72(4), 487–511.
Astin, A. (1985). Minorities in American higher education: Recent trends, currentprospects, and recommendations. San Francisco, CA: Jossey-Bass.
Astin, A., & Oseguera, L. (2004). The declining ‘‘equity’’ in American higher educa-tion. Review of Higher Education, 27(3), 321–341.
Banks, J. (1995). Handbook of research on multicultural education. New York, NY:McMillan.
Barron’s. (1971). Barron’s profiles of American colleges 1972. New York, NY:Barron’s Educational Series Inc., College Division.
Barron’s. (1981). Barron’s profiles of American colleges 1982. New York, NY:Barron’s Educational Series Inc., College Division.
Barron’s. (1991). Barron’s profiles of American colleges 1992. New York, NY:Barron’s Educational Series Inc., College Division.
Barron’s. (2003). Barron’s profiles of American colleges 2004. New York, NY:Barron’s Educational Series Inc., College Division.
Bastedo, M. N., & Gumport, P. J. (2003). Access to what? Mission differentiation andacademic stratification in US public higher education. Higher Education, 46(3),341–359.
Bastedo, M., & Jaquette, O. (2011). Running in place: Low-income students and thedynamics of higher education stratification. Educational Evaluation and PolicyAnalysis, 33(3), 318–339.
Bennett, P., Lutz, A., & Jayaram, L. (in press). Beyond the schoolyard: The contribu-tions of parenting logics, financial resources, and social institutions to the socialclass gap in structured activity participation. Sociology of Education.
Bound, J., Hershbein, B., & Long, B. T. (2009). Playing the admissions game: Studentreactions to increasing college competition. Journal of Economic Perspectives,23(4), 119–146.
Bourdieu, P., & Nice, R. (1984). Distinction: A social critique of the judgment of taste.Cambridge, MA: Harvard University Press.
Bourdieu, P., & Passeron, J. C. (1977). Reproduction in education, society and cul-ture. Thousand Oaks, CA: Sage.
Bowen, W. G., & Bok, D. C. (1998). The shape of the river: Long-term consequences ofconsidering race in college and university admissions. Princeton, NJ: PrincetonUniversity Press.
Bowen, W. G., Chingos, M. M., & McPherson, M. S. (2009). Crossing the finish line:Completing college at America’s public universities. Princeton, NJ: PrincetonUniversity Press.
Bowen, W. G., Kurzweil, M. A., & Tobin, E. (2005). Equity and excellence inAmerican higher education. Charlottesville, VA: University of Virginia Press.
Bowman, N. A., & Bastedo, M. N. (2009). Getting on the front page: Organizationalreputation, status signals, and the impact of US News and World Report on stu-dent decisions. Research in Higher Education, 50(5), 415–436.
Bowman, N. A., & Bastedo, M. N. (2011). Anchoring effects in world university rank-ings: Exploring biases in reputation scores. Higher Education, 61(4), 431–444.
Brewer, D. J., Eide, E. R., & Ehrenberg, R. G. (1999). Does it pay to attend an eliteprivate college? Cross-cohort evidence on the effects of college type on earnings.The Journal of Human Resources, 34(1), 104–123.
Posselt et al.
34
Buchmann, C., Condron, D. J., & Roscigno, V. J. (2010). Shadow education, Americanstyle: Test preparation, the SAT and college enrollment. Social Forces, 89(2),435–461.
Burkam, D. T., Lee, V. E., & Owings, J. (2003). Mathematics, foreign language, and sci-ence course taking and the NELS: 88 transcript data (NCES 2003–01). Washington,DC: US Department of Education. National Center for Education Statistics.
Carnevale, A. P., & Rose, S. J. (2003). Socioeconomic status, race/ethnicity, and selec-tive college admissions. New York, NY: The Century Foundation.
Carter, D. F. (1999). The impact of institutional choice and environments on AfricanAmerican and White students’ degree expectations. Research in HigherEducation, 40(1), 17–41.
Chang, M. J. (2002). Preservation or transformation: Where’s the real educational dis-course on diversity? Review of Higher Education, 25(2), 125–140.
Chang, M. J., & Kiang, P. N. (2002). New challenges of representing Asian Americanstudents in US higher education. In W. A. Smith, P. G. Altbach, & K. Lomotey(Eds.), The racial crisis in American higher education: Continuing challengesfor the twenty-first century (pp. 137–158). Albany, NY: SUNY Press.
Chazan, D. (1996). Algebra for all students? The algebra policy debate. Journal ofMathematical Behavior, 15(4), 455–477.
Chen, A. S., & Stulberg, L. M. (2007, August). Beyond disruption: The forgotten originsof affirmative action in college and university admissions, 1961-1969. Paper pre-sented at the American Sociological Association annual meeting, New York, NY.
Dalton, B., Ingels, S. J., Downing, J., & Bozick, R. (2007). Advanced mathematics andscience course taking in the spring high school senior classes of 1982, 1992, and2004 (Statistical analysis report, NCES 2007-312). Washington, DC: NationalCenter for Education Statistics.
Dowd, A., Cheslock, J., & Melguizo, T. (2008). Transfer access from community col-leges and the distribution of elite higher education. Journal of Higher Education,79(4), 442–472.
Dowd, A., & Melguizo, T. (2008). Socioeconomic stratification of community collegetransfer access in the 1980s and 1990s: Evidence from HSB and NELS. Review ofHigher Education, 31(4), 377–400.
Doyle, W. R. (2010). Changes in institutional aid, 1992-2003: The evolving role ofmerit aid. Research in Higher Education, 51, 789–810.
Espeland, W. N., & Sauder, M. (2007). Rankings and reactivity: How public measuresrecreate social worlds. American Journal of Sociology, 113(1), 1–40.
Espenshade, T. J., Chung, C. Y., & Walling, J. L. (2004). Admission preferences forminority students, athletes, and legacies at elite universities. Social ScienceQuarterly, 85(5), 1422–1446.
Espenshade, T. J., Hale, L. E., & Chung, C. Y. (2005). The frog pond revisited: Highschool academic context, class rank, and elite college admission. Sociology ofEducation, 78(4), 269–293.
Frank, R. H., & Cook, P. J. (1995). The winner-take-all society: How more and moreAmericans compete for ever fewer and bigger prizes, encouraging economicwaste, income inequality, and an impoverished cultural life. New York, NY:Free Press.
Gandara, P. (2001). Paving the way to postsecondary education: K-12 interventionprograms for underrepresented youth (Report of the National PostsecondaryEducation Cooperative Working Group on Access to PostsecondaryEducation). Washington, DC: U.S. Department of Education.
Goldberg, D. T. (1998). The new segregation. Race and Society, 1(1), 15–32.
Access Without Equity
35
Goyette, K. A. (2008). College for some to college for all: Social background, occu-pational expectations, and educational expectations over time. Social ScienceResearch, 37(2), 461–484.
Gratz v. Bollinger. 539 U.S. 244 (2003).Grodsky, E. (2007). Compensatory scholarship in higher education. American
Journal of Sociology, 112(6), 1662–1712.Grodsky, E., & Jackson, E. (2009). Social stratification in higher education. The
Teachers College Record, 111(10), 2347–2384.Grodsky, E., & Kalogrides, D. (2008). The declining significance of race in college ad-
missions decisions. American Journal of Education, 115(1), 1–33.Grutter v. Bollinger, 539 I.S. 306 (2003).Guinier, L. (2003). Admissions rituals as political acts: Guardians at the gates of our
ideals. Harvard Law Review 117(113).Gurin, P., Dey, E. L., Hurtado, S., & Gurin, G. (2002). Diversity and higher education:
Theory and impact on educational outcomes. Harvard Educational Review,72(3), 330–367.
Hearn, J. C. (1991). Academic and nonacademic influences on the college destina-tions of 1980 high school graduates. Sociology of Education, 64, 158–171.
Hearn, J. C., & Holdsworth, J. M. (2005). Federal student aid: The shift from grants toloans. In E. P. St. John & M. D. Parsons (Eds.), Public funding of higher educa-tion: Changing contexts and new rationales (pp. 40–74). Baltimore, MD: JohnsHopkins University Press.
Heller, D. (2008). Financial aid and admission: Tuition discounting, merit aid, andneed-aware admission (National Association for College Admission CounselingWhite Paper). Arlington, VA: NACAC.
Hoxby, C. M. (2009). The changing selectivity of American colleges. Journal ofEconomic Perspectives, 23(4), 95–118.
Hoxby, C. M., & Long, B. T. (1998). Explaining the rising income and wage inequal-ity among the college-educated (No. 6873). Cambridge, MA: National Bureau ofEconomic Research.
Hune, S. (2002). Demographics and diversity of Asian American college students.New Directions in Student Services, 97, 11–20.
Kao, G., & Tienda, M. (1998). Educational aspirations of minority youth. AmericanJournal of Education, 106, 349–384.
Karabel, J. (2005). The chosen: The hidden history of admission and exclusion atHarvard, Yale, and Princeton. Boston, MA: Houghton Mifflin Company.
Karen, D. (1990). Toward a political-organizational model of gatekeeping: The caseof elite colleges. Sociology of Education, 63, 227–240.
Karen, D. (2002). Changes in access to higher education in the United States: 1980–1992. Sociology of Education, 75(3), 191–210.
Karen, D., & Dougherty, K. (2005). Necessary but not sufficient: Higher education asa strategy of social mobility. In K. Dougherty (Ed.), The contradictory college:The origins, impacts, and futures of the community college (pp. 33–57).Albany, NY: SUNY Press.
Kaufman, J. & Gabler, J. (2004). Cultural capital and the extracurricular activities ofgirls and boys in the college attainment process. Poetics, 32, 145–168.
Kiang, P. N. (2004). Checking Southeast Asian American realities in Pan-AsianAmerican agendas. AAPI Nexus: Asian Americans & Pacific Islanders Policy,Practice and Community, 2(1), 48–76.
Kingston, P. W., & Lewis, L. S. (1990). Undergraduates at elite institutions: The best,the brightest, and the richest. In P. W. Kingston & L. S. Lewis (Eds.), The high-
Posselt et al.
36
status track: Studies of elite schools and stratification (pp. 105–145). Albany, NY:State University of New York Press.
Klitgaard, R. (1985). Choosing elites: Selecting the’’ best and brightest’’ at top univer-sities and elsewhere. New York, NY: Basic Books.
Lareau, A. (2003). Unequal childhoods: Class, race, and family life. Berkeley, CA:University of California Press.
Levey, H. (2010). Outside class: A historical analysis of American children’s compet-itive activities. In K. Sternheimer (Ed.), Childhood in American society: A reader(pp. 342–354). New York, NY: Allyn and Bacon.
Long, J. S., & Freese, J. (2005). Regression models for categorical dependent variablesusing Stata (2nd ed.). College Station, TX: Stata Press.
Long, B. T., & Kurlaender, M. (2009). Do community colleges provide a viable path-way to a baccalaureate degree? Educational Evaluation and Policy Analysis,31(1), 30–53.
Lucas, S. R. (2001). Effectively maintained inequality: Education transitions, trackmobility, and social background effects. American Journal of Sociology,106(6), 1642–1690.
McPherson, M. S., & Schapiro, M. O. (1998). The student aid game: Meeting need andrewarding talent in American higher education. Princeton, NJ: PrincetonUniversity Press.
Melguizo, T. (2010). Are students of color more likely to graduate from college if theyattend more selective institutions? Evidence from a cohort of recipients and non-recipients of the Gates Millennium Scholarship Program. EducationalEvaluation and Policy Analysis, 32(2), 230–248.
Mercer, C. J., & Stedman, J. B. (2008). Minority-serving institutions: Selected institu-tional and student characteristics. In M. Gasman, B. Baez, & C. S. V. Turner(Eds.), Understanding minority-serving institutions (pp. 28–42). Albany, NY:SUNY Press.
Milem, J. F. (2003). The educational benefits of diversity: Evidence from multiple sec-tors. In M. Chang, D. Witt, J. Jones, & K. Hakuta (Eds.), Compelling interest:Examining the evidence on racial dynamics in higher education. Palo Alto,CA: Stanford University Press, 126–169.
Monks, J. (2000). The returns to individual and college characteristics: Evidence fromthe National Longitudinal Survey of Youth. Economics of Education Review,19(3), 279–289.
National Academy of Sciences. (2011). Expanding underrepresented minority partic-ipation: America’s science and technology talent at the crossroads. Washington,DC: National Academies Press.
Pascarella, E. T., Wolniak, G. C., Pierson, C. T., & Flowers, L. A., (2004). The role ofrace in the development of plans for a graduate degree. The Review of HigherEducation, 27(3), 299–320.
Perna, L. W. (2005). The key to college access: Rigorous academic preparation. In W.G. Tierney, Z. B. Corwin, & J. E. Colyar (Eds.), Preparing for college: Nine ele-ments of effective outreach (pp. 113–134). Albany, NY: SUNY Press.
Perna, L. W., & Titus, M. A. (2004). Understanding differences in the choice of collegeattended: The role of state public policies. The Review of Higher Education,27(4), 501–525.
Posselt, J. R. (2009). The rise and fall of need-based grants: A critical review of pres-idential discourses on higher education, 1964–1984. Higher Education:Handbook of Theory and Research, 24, 183–226.
Raftery, A. (1996). Approximate Bayes factors and accounting for model uncertainty.Biometrika, 83, 251–266.
Access Without Equity
37
Regents of the University of California v. Bakke, 438 U.S. 268 (1978).Rothstein, J. M. (2004). College performance predictions and the SAT. Journal of
Econometrics, 121(1), 297–317.Schmidt, P. (2007). Color and money: How rich White kids are winning the war over
college affirmative action. New York, NY: Palgrave MacMillan.Skrentny, J. D. (1996). The ironies of affirmative action: Politics, culture, and justice
in America. Chicago, IL: University of Chicago Press.Soares, J. A. (2007). The power of privilege: Yale and America’s elite colleges. Stanford,
CA: Stanford University Press.Stampnitzky, L. (2006). How does ‘‘culture’’ become ‘‘capital’’? Cultural and institu-
tional struggles over ‘‘character and personality’’ at Harvard. SociologicalPerspectives, 49(4), 461–481.
Steele, C. (1997). A threat in the air: How stereotypes shape intellectual identity andperformance. American Psychologist, 52(6), 513–529.
Sternberg, R. J. (2010). College admissions for the 21st century. Cambridge, MA:Harvard University Press.
Stevens, M. (2007). Creating a class: College admissions and the education of elites.Cambridge, MA: Harvard University Press.
St. John, E. P., & Asker, E. H. (2003). Refinancing the college dream: Access, equalopportunity, and justice for taxpayers. Baltimore, MD: Johns HopkinsUniversity Press.
St. John, E. P., Hu, S., & Fisher, A. S. (2010). Breaking through the access barrier:Academic capital formation informing public policy. New York, NY: Routledge.
St. John, E. P., Paulsen, M. B., & Carter, D. F. (2005). Diversity, college costs, and post-secondary opportunity: An examination of the financial nexus between collegechoice and persistence for African Americans and Whites. Journal of HigherEducation, 76(5), 545–569.
Swail, W. S., & Perna, L. W. (2002). Pre-college outreach programs. In W. G. Tierney& L. S. Hagedorn (Eds.), Increasing access to college: Extending possibilities forall students (pp. 15–34). Albany, NY: State University of New York Press.
Takagi, D. Y. (1992). The retreat from race: Asian-American admissions and racialpolitics. Camden, NJ: Rutgers University Press.
Taylor, E., & Antony, J. (2000). Stereotype threat and wise schooling: Towards thesuccessful socialization of African American doctoral students in education.Journal of Negro Education 69(3), 184–198.
Thresher, B. A. (1966). College admissions and the public interest. New York, NY:College Entrance Exam Board.
Trow, M. (1988). American higher education. Educational Researcher, 17(3), 13.Wechsler, H. S. (1977). The qualified student. New York, NY: Wiley.Zwick, R. (2002). Fair game?: The use of standardized admissions tests in higher edu-
cation. New York, NY: Routledge.
Manuscript received June 6, 2011Final revision received October 14 2011