Page 1
Edited by
Angela Hull, Cecília Silva and Luca Bertolini
Accessibility
Instruments
for Planning
Practice
ESF provides the COST Office through an EC contract
COST is supported by the EU RTD Framework programme
Page 2
Edited by:
Angela Hull
School of the Built Environment
Heriot-Watt University
Edinburgh EH14 4AS
Cecília Silva
Research Centre for Territory, Transports and Environment (CITTA)
Faculty of Engineering of Oporto University
Rua Dr Roberto Frias s/n
4200-465 Porto
Luca Bertolini
University of Amsterdam
Department of Geography Planning and International Development Studies,
Nieuwe Prinsengracht 130
1051PH Amsterdam
© COST Office, 2012
No permission to reproduce or utilise the contents of this book by any means is necessary, other
than in the case of images, diagrammes or other material from other copyright holders.
In such cases, permission of the copyright holders is required. This book may be cited as:
COST Action TU1002 –Accessibility Instruments for Planning Practice.
Please note: exceptions must be justified in writing by the Action Chair/MC.
Neither the COST Office nor any person acting on its behalf is responsible for the use which might
be made of the information contained in this publication. The COST Office is not responsible for the
external websites referred to in this publication.
ISBN13: 978-989-20-3187-3 (hbk)
ISBN13: 978-989-20-3210-8 (ebk)
Page 3
COST- the acronym for European Cooperation in Science and Technology- is the oldest
and widest European intergovernmental network for cooperation in research.
Established by the Ministerial Conference in November 1971, COST is presently used by
the scientific communities of 36 European countries to cooperate in common research
projects supported by national funds.
The funds provided by COST - less than 1% of the total value of the projects - support
the COST cooperation networks (COST Actions) through which, with EUR 30 million per
year, more than 30 000 European scientists are involved in research having a total
value which exceeds EUR 2 billion per year. This is the financial worth of the European
added value which COST achieves.
A "bottom up approach" (the initiative of launching a COST Action comes from the
European scientists themselves), "à la carte participation" (only countries interested in
the Action participate), "equality of access" (participation is open also to the scientific
communities of countries not belonging to the European Union) and "flexible structure"
(easy implementation and light management of the research initiatives) are the main
characteristics of COST.
As precursor of advanced multidisciplinary research COST has a very important role for
the realisation of the European Research Area (ERA) anticipating and complementing
the activities of the Framework Programmes, constituting a "bridge" towards the
scientific communities of emerging countries, increasing the mobility of researchers
across Europe and fostering the establishment of "Networks of Excellence" in many key
scientific domains such as: Biomedicine and Molecular Biosciences; Food and
Agriculture; Forests, their Products and Services; Materials, Physical and Nanosciences;
Chemistry and Molecular Sciences and Technologies; Earth System Science and
Environmental Management; Information and Communication Technologies; Transport
and Urban Development; Individuals, Societies, Cultures and Health. It covers basic and
more applied research and also addresses issues of pre-normative nature or of societal
importance.
Web: http://www.cost.eu
Page 5
v
CONTENTS
Preface xiii
List of Acronyms xxi
Chapter 1. Accessibility Measures and Instruments 1
Chapter 2. Accessibility in Planning Practice 21
Chapter 3. Accessibility Instruments 45
Chapter 4. Accessibility Instruments Survey 205
Chapter 5. Conclusions 239
Glossary 253
References 259
Appendix A 267
Appendix B 283
Appendix C 329
Appendix D 335
Appendix E 341
Appendix F 353
Affiliation of Editors/Authors 359
Page 6
vi Accessibility Instruments for Planning Practice
Page 7
vii
LIST OF FIGURES
Figure 2.1: The classic description of tasks involved in planning and decision-making (based
on among others BANFIELD (1959; 1973) and FRIEDMANN (1987)) 25
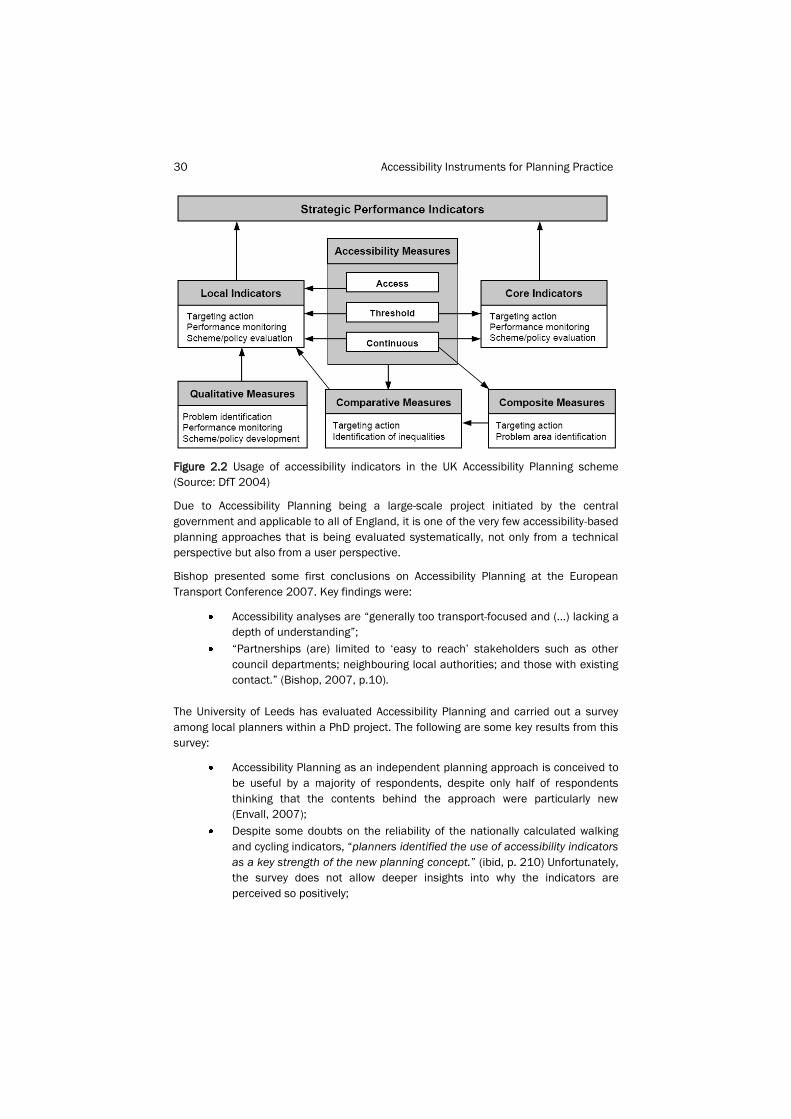
Figure 2.2 Usage of accessibility indicators in the UK Accessibility Planning scheme (Source:
DfT 2004) 30
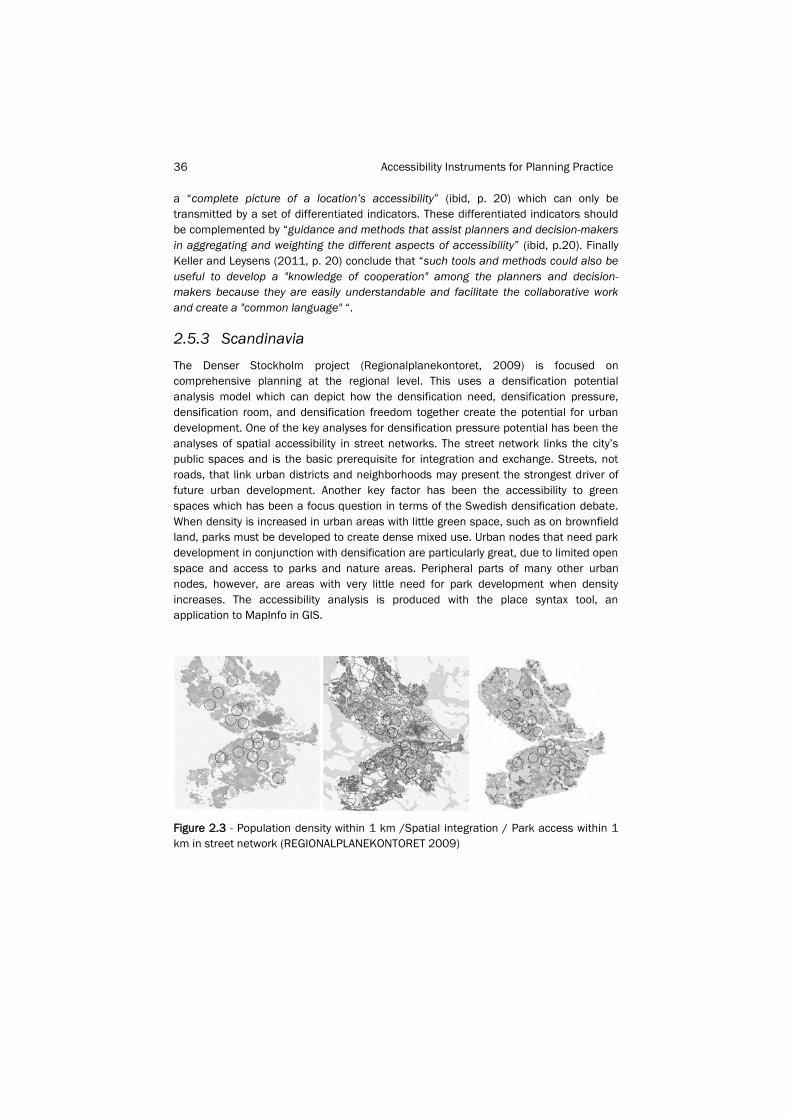
Figure 2.3 - Population density within 1 km /Spatial integration / Park access within 1 km in
street network (REGIONALPLANEKONTORET 2009) 36
Figure 2.4 - Workplace accessibility in Denmark (Nielsen et al., 2005) 37
Figure 3.1 SNAMUTS visual output clearly shows accessibility changes with the
implementation on a new rail corridor and a bus network reconfigured to act as a feeder
service. 55
Figure 3.2 Spatial accessibility analysis of Nicosia, Cyprus 69
Figure 3.3 Angular Segment Analysis by Metric distance of the city of Jeddah, SA (by Space
syntax Ltd.). 70
Figure 3.4 Commuter flow or ‘desireline traces’ drawn from commuting in Denmark. The map
is based on origin-destination data for commuting and summarizes the number of commutes
passing through any given area. Source: Byen, Vejen og Landskabet (Hovgesen and Nielsen
2005; Miljøministeriet, 2006) 74
Figure 3.5 Activity fields for leisure activities. The activity fields are drawn to indicate the
areas that contain the 75% and 95% of the activity destinations that are closest to home, out
of the total number of activity destinations of the municipal population. Source: Danish
Centre for Strategic Urban Research (Nielsen, 2011) 75
Figure 3.6 The simplified model flowchart 82
Figure 3.7 Different accessibility functions of the simulation module 82
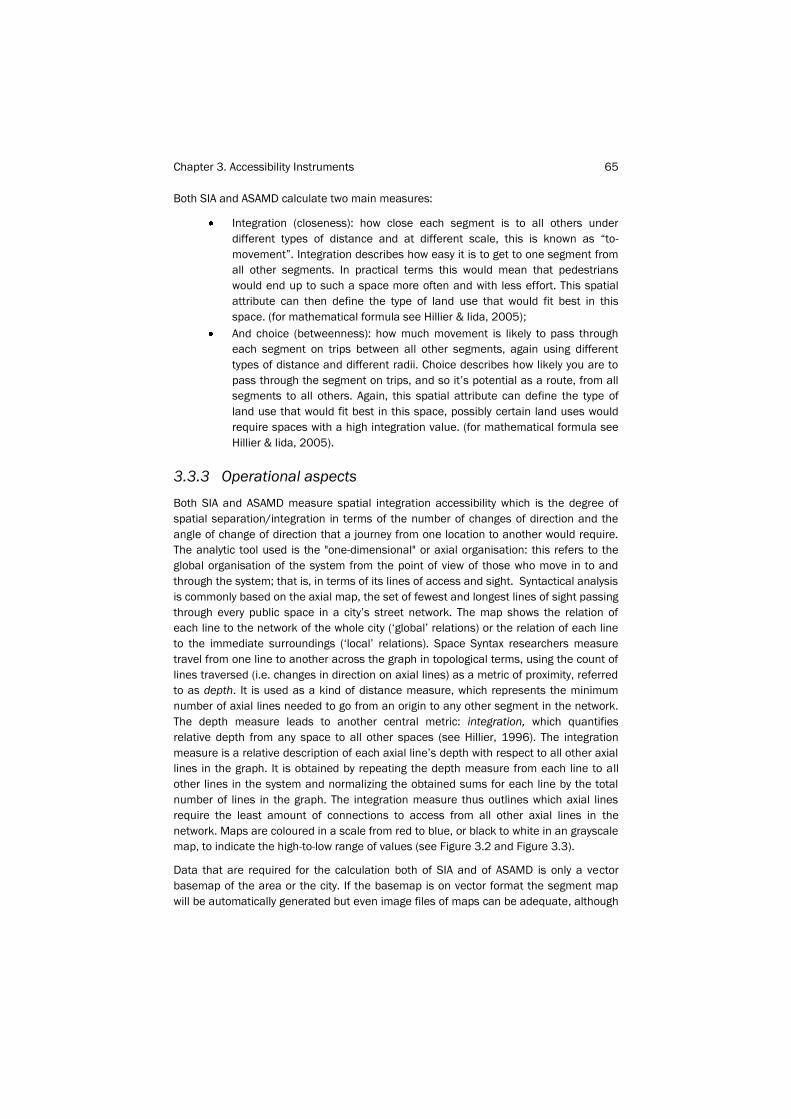
Figure 3.8 An exemplar of the simulation development path in Helsinki city region. Starting
from a hypothetical random distribution of retail unit types, the charts (right) show the
quantity by type 83
Figure 3.9 Structure of the air and rail return trips for computing the contactability indicator
(author: A. L'Hostis) 88
Figure 3.10 Contactability by monomodal and intermodal transport chains between
European cities in 2009 (author: A. L'Hostis) 89
Figure 3.11 Contactability level by city and by monomodal and intermodal transport chains in
2009 (author: A. L'Hostis) 89
Figure 3.12 Public transport accessibility in the EMM (gravity accessibility indicator) 95
Figure 3.13 Land-use and public transport accessibility index: population density vs. Public
transport accessibility 95
Figure 3.14 Example of the Stuttgart Region: Quality Levels from A to F for the accessibility
by motorised individual transport. 101
Page 8
viii Accessibility Instruments for Planning Practice
Figure 3.15 Metric Reach Map of Atlanta. The 10 interval colour range red-blue represents
the spectrum from higher to lower values. (Source: Haynie et al., 2009) 108
Figure 3.16 Directional Reach Map of Atlanta. The 10 interval colour range red-blue
represents the spectrum from higher to lower values. (Source: Haynie et al., 2009) 108
Figure 3.17 Directional Reach Map of KAUST . The 10 interval colour range red-blue
represents the spectrum from higher to lower values. (Source: KAUST Masterplan guidelines) 109
Figure 3.18 Northern metropolitan area of Turin: Pedestrian road network (white lines) and
the new subway line in project (grey lines) with new access points (black and white dots) 115
Figure 3.19 Accessibility on the Northern Turin area visualized through a Green-Yellow-Red
Gradient Map. 115
Figure 3.20 The calculation of generalized travel cost zone accessibility indicators in the
present scenario 123
Figure 3.21 The accessibility measure as input data in LUTI model structure 123
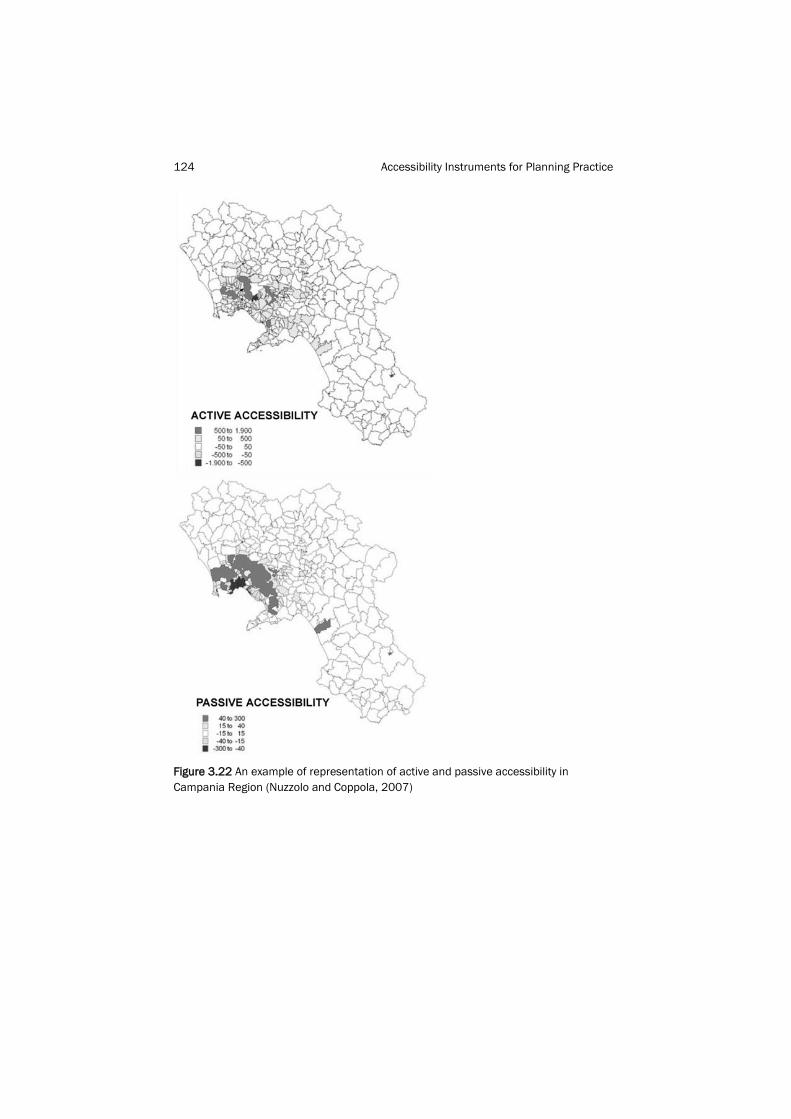
Figure 3.22 An example of representation of active and passive accessibility in Campania
Region (Nuzzolo and Coppola, 2007) 124
Figure 3.23 Access to basic services Bike (10 min.) 130
Figure 3.24 Access to bars, restaurants, non-daily shopping and cultural facilities, Transit (20
min.) 130
Figure 3.25 Access to inhabitants Car (30 min. inter-peak) 130
Figure 3.26 Access for inhabitants Car (30 min. inter-peak) - Scenario Hub and Spoke 131
Figure 3.27 Access for inhabitants Car (30 min. inter-peak) - Scenario Metropolitan
Connectivity 131
Figure 3.28 Geographical density of public transport network infrastructure accessed by
stops/ kilometre 143
Figure 3.29 Demographic density of public transport infrastructure based on stops per
10,000 inhabitants 143
Figure 3.30 Average density of public transport stops in the network 143
Figure 3.31 Balance between soundness and plainness of the accessibility measure (Source:
Silva, 2008) 150
Figure 3.32 Clusters of accessibility in the Greater Oporto 151
Figure 3.33 Potentials and limitations of SAL (Source: Silva, 2008) 151
Figure 3.34 Application to Condeixa-a-Nova, Portugal 157
Figure 3.35 Alternative scenarios for road investment in the municipality of Coimbra 157
Figure 3.36 Land use maps for alternative scenarios for road investment in the municipality
of Coimbra 158
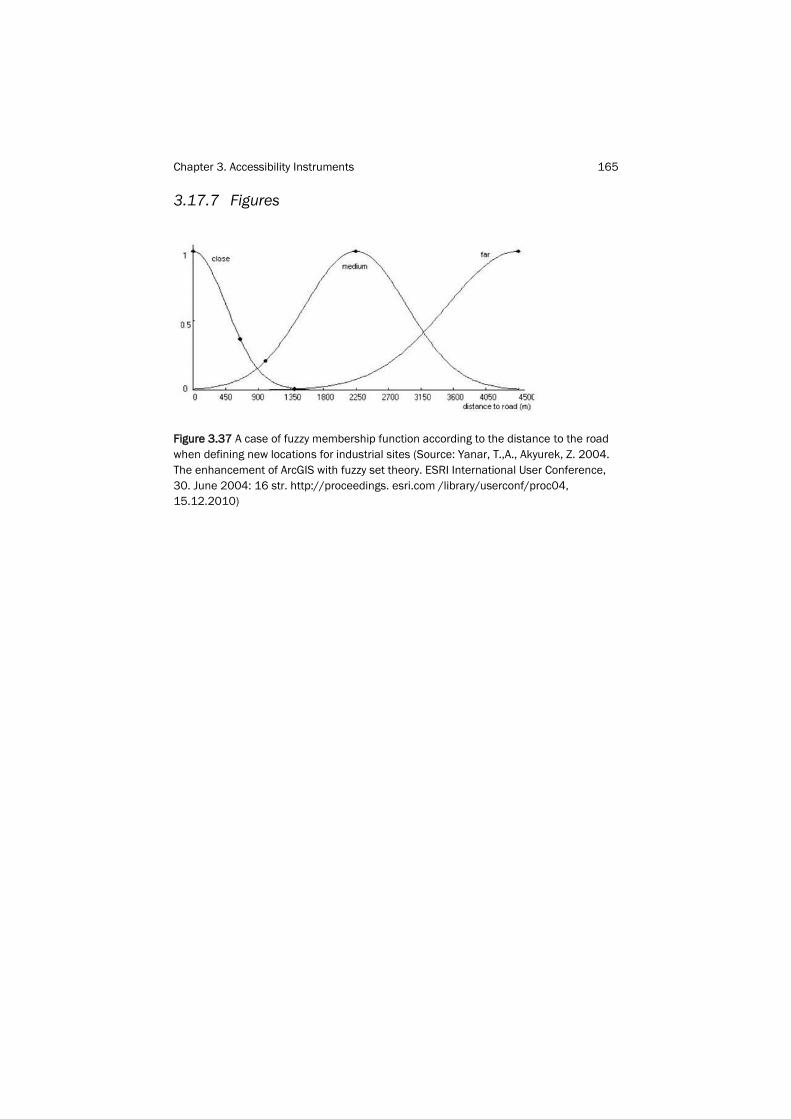
Figure 3.37 A case of fuzzy membership function according to the distance to the road when
defining new locations for industrial sites (Source: Yanar, T.,A., Akyurek, Z. 2004. The
enhancement of ArcGIS with fuzzy set theory. ESRI International User Conference, 30. June
2004: 16 str. http://proceedings. esri.com /library/userconf/proc04, 15.12.2010) 165
Page 9
ix
Figure 3.38 Isochrone maps Gregorio Marañon Hospital (left side) and Getafe Hospital (right
side) 172
Figure 3.39 Closest food store within axial lines. Maps are comparable in terms of colour.
(Darker is shorter distance) 178
Figure 3.40 Time table analysis: number of trains between better accessible towns because
of new improved transport infrastructure 182
Figure 3.41 Left- Modelling of public transport routes. Right- Mapping of potential
accessibility indicator result 188
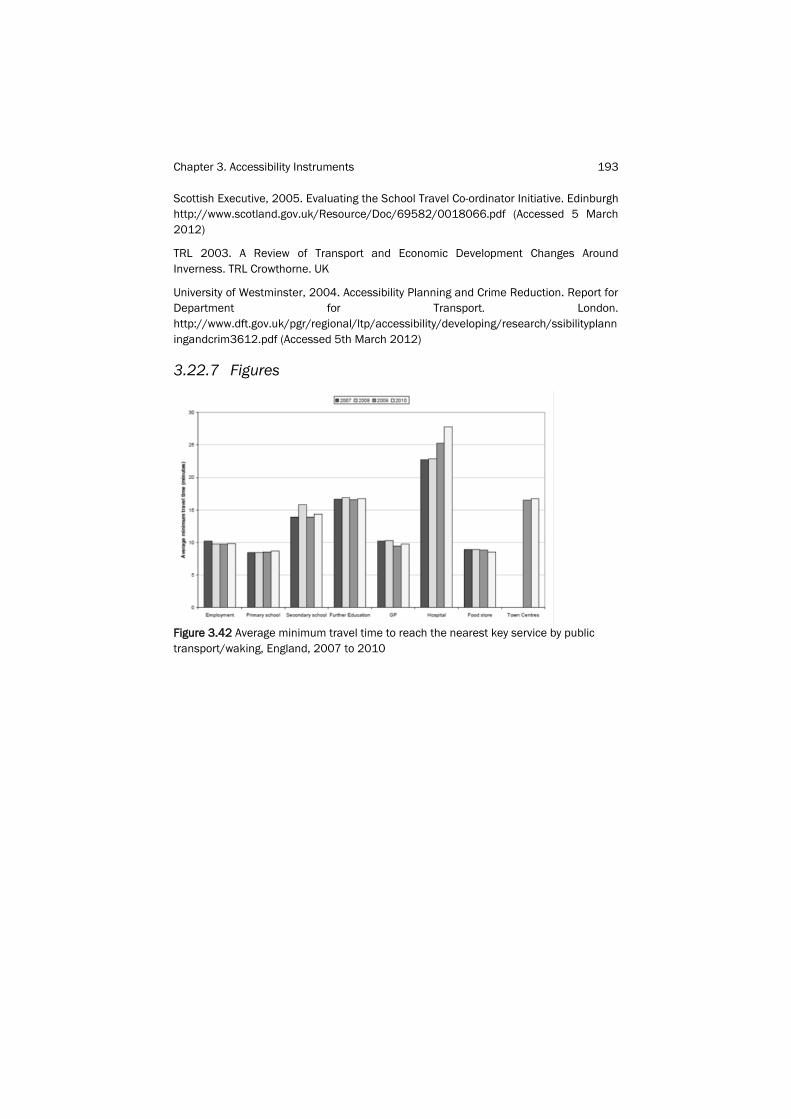
Figure 3.42 Average minimum travel time to reach the nearest key service by public
transport/waking, England, 2007 to 2010 193
Figure 3.43 Uses of ACCALC 194
Figure 4.1 Policy requirements to undertake an accessibility analysis 222
Figure 4.2 Private investor concerns addressed by the instruments 225
Figure 4.3 Individual goals addressed by the instruments 226
Figure 4.4 Accessibility components addressed by the instruments 227
Figure 4.5 Accessibility measures used in the instruments 227
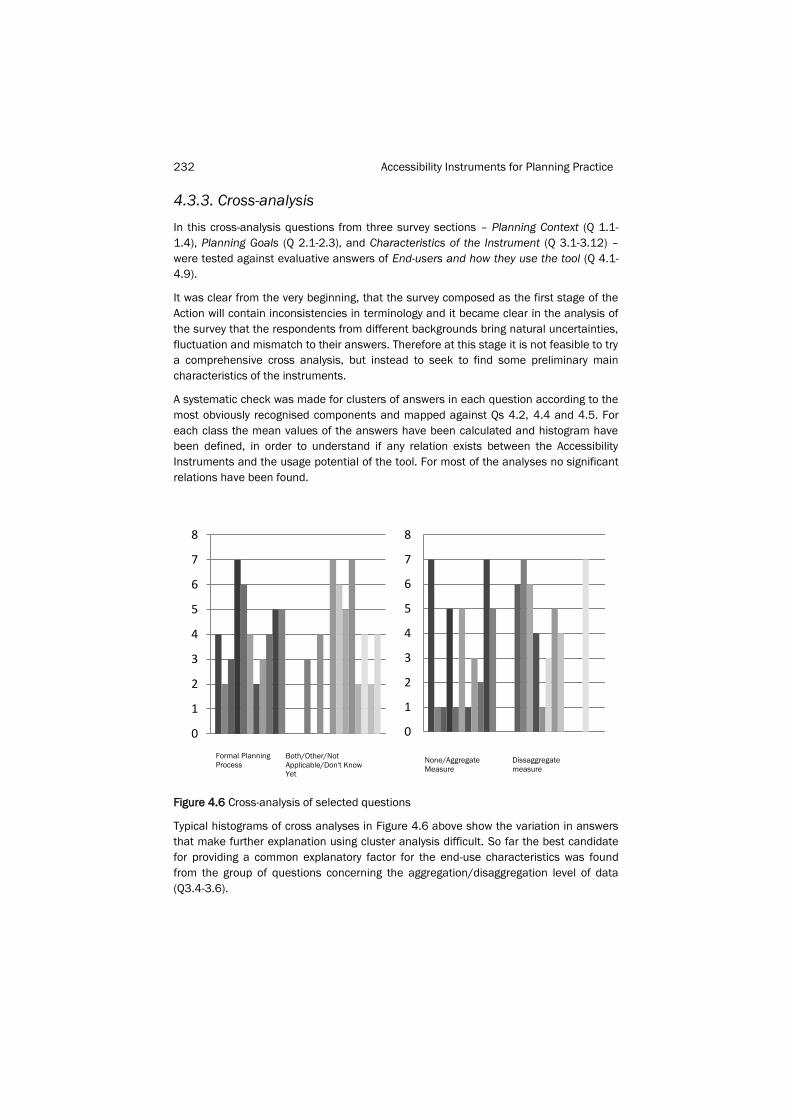
Figure 4.6 Cross-analysis of selected questions 232
Figure 4.7 Images showing two extreme principles of accessibility instruments: zonal
aggregation vs. detailed morphology 235
Page 10
x Accessibility Instruments for Planning Practice
Page 11
xi
LIST OF TABLES
Table 2.1 The objective and expert knowledge in question may be prioritised or not and
applied or not in each of the tasks involved in planning and decision-making processes, in
different ways and for different reasons 26
Table 3.1 Target values for accessibility to central locations from residential areas 100
Table 3.2 Target values for accessibility to central locations from neighbouring central
locations 100
Table 3.3 Categories for bicycle infrastructure and target values for travel speed for daily
traffic 101
Table 3.4 Travel times with a 50% trip likelihood 129
Table 3.5 Tools aggregation according to their type of output visualization 201
Table 4.1 Categories of how the Accessibility Instruments inform planning goals 210
Table 4.2 Coverage of each Accessibility Instrument according to the geographical scale 212
Table 4.3 Coverage of the Accessibility Instruments according to the planning goals 213
Table 4.4 Coverage of the Accessibility Instruments according to the planning goals –
transport modes 214
Table 4.5 Coverage of the Accessibility Instruments according to the decision support task 216
Table 4.6 Coverage of the Accessibility Instruments according to the instrument’s role in
urban planning 217
Table 4.7 Coverage of the Accessibility Instruments according to the transport modes used
in the instrument 219
Table 4.8 Coverage of the Accessibility Instruments according to the trip purpose 221
Table 4.9 Instruments that address multiple public stakeholder goals 224
Table 4.10 Accessibility measures used in the instruments 228
Table 4.11 Developer’s perception on a number of issues influencing usability of
Accessibility Instruments 229
Table 4.12 Barriers to the use of Accessibility Instruments 231
Table 4.13 Institutional and other issues that might block the effective use of accessibility
instruments 231
Table 4.14 Grouping by spatial aggregation and the difference between three instrument
groups 234
Page 12
xii Accessibility Instruments for Planning Practice
Page 13
PREFACE
Angela Hull and Cecilia Silva
Page 14
xiv Accessibility Instruments for Planning Practice
Page 15
Preface xv
Accessibility is a fundamental attribute of a well-functioning city or urban region. In
particular, the concept of accessibility provides a framework for understanding the
reciprocal relationships between land use and mobility. Accessibility, however,
encapsulates more than a measure of vehicle speed; it is a measure of opportunity or
ease of access for people, with different attributes, to the activities they wish to engage
in. The concept, thus, incorporates a focus on the proximity of origins to destinations,
the concentration or spatiality of activities, the quality of mobility systems available to
overcome spatial separation, and the perceptions, interests and preferences of people
who live and work there. Such a framework has important potential advantages when
transferred to the realm of urban planning. However, despite the large number of
accessibility instruments available in the literature, they are not widely used to support
urban planning practices.
This report represents a review of accessibility instruments and of the use of
accessibility concerns in planning practice. It starts with an overview of the concepts
and theory concerning the measurement of accessibility followed by a review
accessibility concerns and measurements in current planning practice. The report also
provides a compendium of examples of accessibility planning instruments developed in
several European Countries: the planning problem addressed by these instruments and
how the instruments influence practitioners and decision-makers. It, thus, offers a
detailed understanding and comparison of accessibility instruments across Europe and
further afield in order to launch a wide debate on their purpose and operational detail
and to foreground ways of improving their potential for use in practice.
This report presents the outcomes of the first stage of the COST Action TU1002
“Accessibility Instruments for Planning Practice in Europe” financed by the COST Office
(supported by the EU Framework Programme). The aim of the Action is to gain insight
into the usability of accessibility instruments in planning practice acting as a catalyst for
the effective implementation of accessibility instruments in European planning practice.
The Action will promote knowledge on how accessibility instruments can be effectively
applied to support urban planners in their daily practice. It brings together researchers,
with different approaches to accessibility, and a set of practitioners from selected
reference cities. The relevance of accessibility instruments for specific (land use and
mobility related) urban planning challenges will be studied through reflection workshops
involving local practitioners. Central aim of these workshops is to shed light on the
potential of accessibility instruments to support planning practice.
This Action, therefore, has added value for both accessibility instrument developers and
users. For developers, this Action will provide information on the planning context and
tasks, and the skills and preferences of urban planning practitioners so that these
characteristics can be reflected more effectively in existing and new instruments being
developed. For potential users, the Action will, through piloting accessibility instruments
with practitioners in interactive workshops, demonstrate how accessibility instruments
can provide information on the appropriate and equitable level of service provision and
provide information on the impact of proposed urban planning decisions on the
accessibility of people across their jurisdiction. We expect that the additional knowledge
on the potential of accessibility instruments for urban planning practice will have
Page 16
xvi Accessibility Instruments for Planning Practice
beneficial impacts on urban quality and decision making on urban land use patterns in
each of the countries involved in the Action. It is our intention to disseminate the
scientific knowledge produced in the course of this Action more widely across Europe
and the world.
This report presents the scientific outcomes of the research carried out during 2011-
2012 by Work Group 2 (WG2) “Accessibility Instruments”. Considerable empirical
research has been developed to examine several issues, including:
Documentary review of the state of art of the development of accessibility 1.
instruments (Chapter 1).
Inventory and review of the use of accessibility instruments in planning 2.
practice (Chapter 2).
Description and critical review of the accessibility instruments proposed by 3.
national Work Unite (WU) of the COST Action for the research propose of the
Action (Chapter 3).
Web-based survey (Appendix A) of the components and planning function of 4.
the same accessibility instruments (Chapter 4) providing objective and
comparable information on these instruments enabling the development of
summary sheets for each accessibility instrument being researched
(Appendix B). An online discussion forum to create a Glossary or common
language on accessibility terms (Glossary).
Many scholars agree that accessibility is an old idea in planning research that needs
fresh thinking to make the jump to planning practice. This report has benefited from the
fresh thinking from the disciplines of transport and land use planning, bringing together
researchers from different backgrounds and local and national contexts across several
countries, developing both complex and simple accessibility planning instruments.
The report is divided into the following chapters:
List of Acronyms used
CHAPTER 1: Accessibility Measures and Instruments
Based on the literature review this will consist of:
Review of concepts and theory concerning the measurement of accessibility 1.
i.e. the conceptual discussion.
Presentation of the diversity of measures defined in the theory. 2.
CHAPTER 2: Accessibility in Planning Practice
Focus on two types of accessibility instrument:
Single –case practice examples: single planning cases where a case specific 1.
methodology of accessibility analysis has been applied;
Standardized accessibility analysis methodologies or planning guidelines. 2.
Page 17
Preface xvii
Instruments reviewed on the basis of the:
context of the accessibility analysis application (e.g. public transport
planning, neighbourhood planning, social exclusion, etc);
impact of accessibility analysis on planning process and outcomes;
experiences of tool usability by practitioners.
CHAPTER 3: Accessibility Instruments (in this COST Action)
Presents short reports of all accessibility instruments proposed for this Action and an
analysis of these accessibility instruments based on the:
Background or motivation for development. 1.
Conceptual framework and theoretical underpinnings. 2.
Operational aspects. 3.
Relevance for planning practice. 4.
Strengths and Weaknesses. 5.
CHAPTER 4: Discussion on Accessibility Instruments
Overview of Accessibility Instrument Survey. 1.
Analysis of Results /Overall patterns emerging. 2.
CHAPTER 5 Conclusions
State of play on the design of Accessibility-based instruments. 1.
Implementation of Accessibility-based instruments in practice – overview. 2.
Recent progress in Accessibility-based instruments. 3.
Reflection on the usefulness/ usability of Accessibility-based instruments in 4.
urban planning.
Next steps in COST TU1002. 5.
GLOSSARY
Presenting the main concepts requiring definition for this report.
Appendices
This report is the first of a series of reports to be produced by this COST Action. It will be
followed by a second report on workshop evaluations of accessibility instruments
presented in this report. Following the work plan of this Action, the accessibility
instruments collected for this report will next be evaluated in local workshops across
several Europe. The second report will present the workshop methodology and the
results of the different workshops. The final report will present the cross analysis of
workshop evaluations and the main findings of this research, providing
recommendations for the development more useful accessibility instruments.
This publication is supported by COST.
Page 18
xviii Accessibility Instruments for Planning Practice
Notes on contributors
The first report of COST Action TU1002 Accessibility instruments for Planning Practice in
Europe, has been produced by Work Group 2 (WG2) of this COST Action, under the
management of Angela Hull and general management of Cecília Silva (Chair) and Luca
Bertolini (Vice Chair). The work of this WG and of the whole Action is supervised by the
Management Committee (MC) closely coordinated by the Core Group (CG) and by the
Rapporteur of the Action, Willi Hüstler. WG2 has also benefited from the support of
other groups and individuals form the COST Action during specific tasks. At the time of
conclusion of this report WG2 had 32 members from 15 of the 22 participating
countries (see detailed list below). Although only some of these have contributed to the
writing up of this report all have actively contributed to the discussions which led to this
publication.
The work conducted for this report started formally during the first MC meeting in
Oporto, organised by Cecília Silva and her local research team. The WG2 meetings held
during this MC meeting and subsequent meetings (in Edinburgh, organised by Derek
Halden and Angela Hull and in Turin organised by Matteo Tabasso) where of vital
importance to the development of this report.
The first meeting in Amsterdam launched the discussion on the Action Glossary.
Following a general discussion among all members on the need for commonly agreed
concepts, Enrica Papa produced a 1st version of this Glossary, which was published on
our website for continuing discussion between meetings
(http://www.accessibilityplanning.eu/). The Glossary received several contributions and
suggestions from several members on the website forum and during the WG2 meeting
in Turin. A concluding web-based discussion period was organised after the Turin
meeting, coordinated by Magda Mavridou.
The first MC meeting also launched the development of the Accessibility Instrument
Survey, with general suggestions from the entire MC and later worked on by WG2 in a
separate session. As manager of WG2, Angela Hull had the main role in the
development of this survey from day one, preparing the first proposals to be discussed
in the referred meeting and leading the development from there on. The contributions
collected during the MC and WG meeting were later compiled and consolidated into the
first version of the survey by Angela Hull, Enrica Papa and Anssi Joutsiniemi. This was
later revised following contributions from other members (Cecilia Silva, Derek Halden,
Marco te Brömmelstroet, Luca Bertolini) The internet survey was prepared by Enrica
Papa with the help of Marco the Brömmelstroet (member of WG3). Results collected
from the survey were converted by Ana Amante (member of WG3) into a data sheet
ready for statistical analysis. Finally, analysis of the results was developed by the
authors of Chapter 4. The res ults of this survey were also used to develop summary
sheets for each Accessibility Instrument (Appendix B) by Tiago Patatas and Cecília Silva.
In parallel to the development and implementation of the Accessibility Instruments
Survey, each Work Unit was responsible for producing a short report presenting the
Accessibility Instrument they were bringing into this Action. These short reports
Page 19
Preface xix
presented in Chapter 3, followed a common structure developed with the contribution of
Cecília Silva, Angela Hull, the editorial team of Chapter 3 and the Core Group. The
structure of these reports was then discussed by WG2 during the Edinburgh meeting.
Results of this discussion where then used to consolidate the final structure by the
editorial team of Chapter 3. This editorial team has followed the production of the short
reports closely, providing support to authors and working as reviewers of these reports
which were developed in two stages, with an intermediate peer review stage.
The review presented in Chapter 1 and Chapter 2 was developed by two junior
researchers. These reviews benefitted from the contributions of several members of the
action, who provided literature and even their own publications on the reviewed
subjects. In case of 0, some of these contributions went as far as becoming co-authors
of the chapter.
The production of this report was coordinated by Angela Hull and Cecília Silva. English
proofreading was done by Angela Hull. Final editing of the report and the design of the
cover were developed by Tiago Patatas.
Work Group Manager: Angela Hull (UK)
Members (32):
Albert Steiner (CH)
Anders Larsson (SE)
Ann Legeby (SE)
Anssi Joutsiniemi (FI)
Aud Tennøy (NO)
Aurelie Mercier (FR)
Bruno Santos (PT)
Cecília Silva (PT)
David Vale (PT)
Derek Halden (UK)
Elisabetta Vitale Brovarone (IT)
Emilio Ortega (ES)
Enrica Papa (IT)
Gebhard Wulfhorst (DE)
Jacques Teller (BE)
Jean-Pierre Nicolas (FR)
Johannes Keller (DE)
Jürgen Gerlach (DE)
Luca Bertolini (NL)
Magda Mavridou (GR)
Maruska Subic Kovac (SL)
Nadia Charalambous (CY)
OrnaTzur (IS)
Petter Naess (DK)
Rosa Arce (ES)
Saleem Karou (UK)
Sanna Iltanen (FI)
Tanu Uteng (NO)
Thomas Nielsen (DK)
Thomas Straatemeier (NL)
Tobias Nordström (SE)
Vasileia Trova (GR)
Page 20
xx Accessibility Instruments for Planning Practice
Page 22
xxii Accessibility Instruments for Planning Practice
Page 23
List of Acronyms xxiii
ABICA: Activity based indicators of connections and access needs
ACCALC: Database suite for calculation of UK accessibility statistics
AIS: Accessibility Instrument Survey
ASAMeD: Space Syntax: Spatial Integration Accessibility and Angular Segment Analysis
by Metric Distance
ATI: From Accessibility to the Land Development Potential
CAPITAL: CalculAtor for Public Transport Accessibility in London
CBD: Central Business District
CG: Core Group
DfT: Department for Transport
DLR: Docklands Light Rail
EMM: Erreichbarkeitsatlas der Europäischen Metropolregion München
GDATI: Geographic/Demographic Accessibility of Transport Infrastructure
GIS: Geographic Information System
GraBAM: Gravity-Based Accessibility measures for Integrated Transport-land Use
Planning
HIMMELI: Heuristic three-level Instrument combining urban Morphology, Mobility,
service Environments and Locational Information
IMaFa: Isochrone maps to facilities. Shopping centres in the Metrosur influence area
InViTo: Interactive Visualization Tool
JAD: Joint-accessibility Design
MaReSi SC: Method for arriving at maximum recommendable size of shopping centres
MC: Management Committee
MoSC: Measures of Street Connectivity: Spatialist_Lines
OS: Ordnance Survey
PST: Place Syntax Tool
PTALS: Public Transport Accessibility Levels
PTAM: Public Transport Accessibility Mapper
RIN: The German Guidelines for Integrated Network Design– binding accessibility
standards
SAL: Structural Accessibility Layer
SNAMUTS: Spatial network analysis for multimodal urban transport systems"
SNAPTA: Spatial Network Analysis of Public Transport Accessibility
Page 24
xxiv Accessibility Instruments for Planning Practice
SONATA: Social Needs And Transport Accessibility
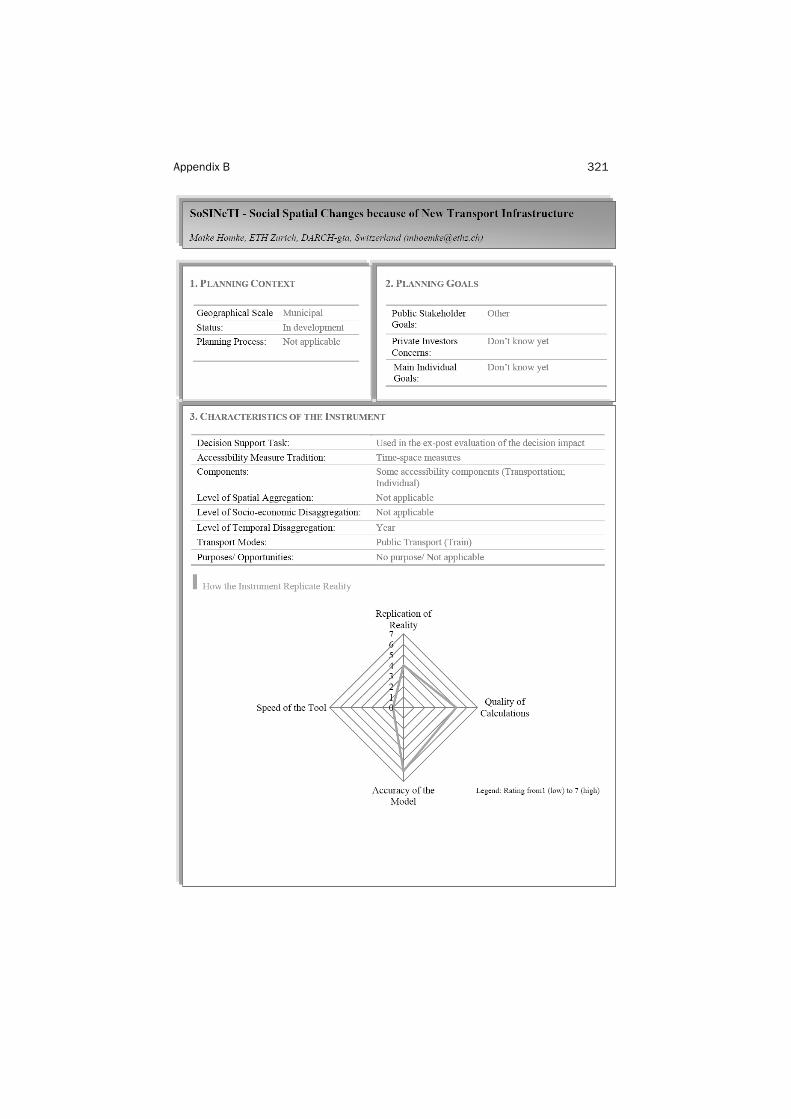
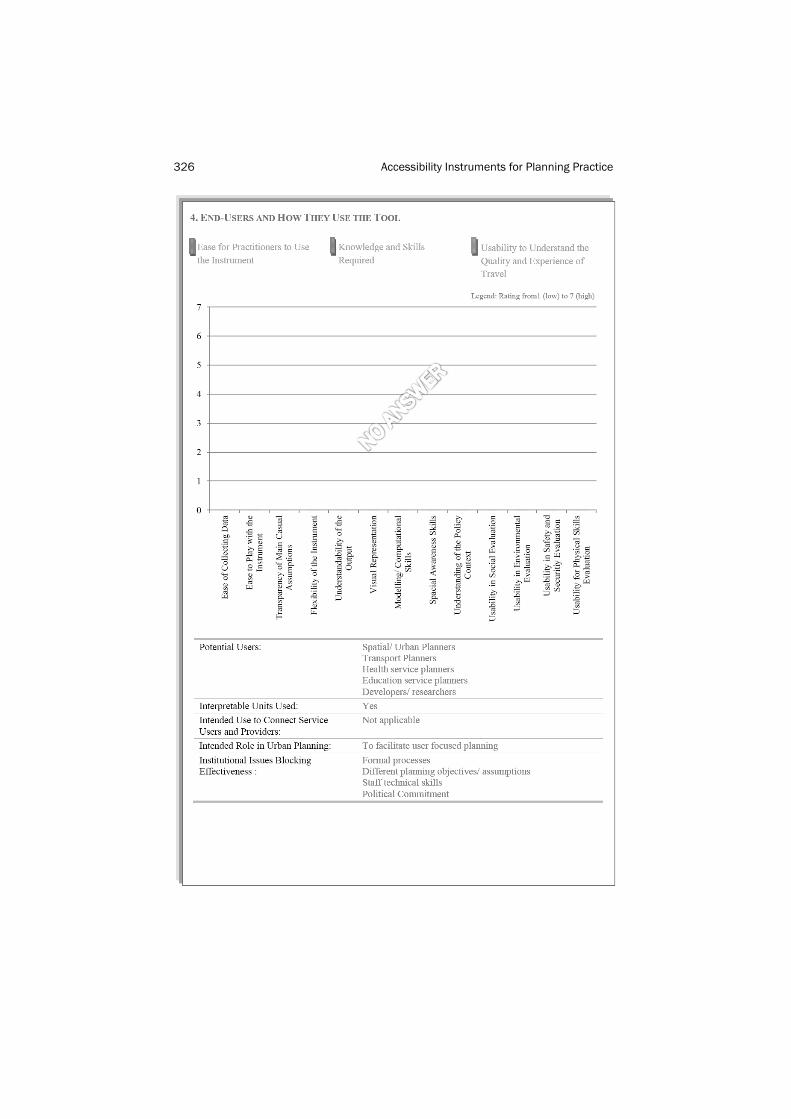
SoSINeTi: Social spatial influences of new transport infrastructure
STAG: Scottish Transport Appraisal Guidance
TMfS: Transport Model for Scotland
TRACE: Retail Cluster Accessibility
TRANSAM: Transport Accessibility Modelling
UrbCA: Cellular automata modeling for accessibility appraisal in spatial plans
WALC: Weighted Access for Local Catchments
WG: Working Group
WU: Work Unit
Page 25
Chapter 1. ACCESSIBILITY MEASURES AND
INSTRUMENTS
Saleem Karou, Angela Hull
Page 26
2 Accessibility Instruments for Planning Practice
Page 27
Chapter 1. Accessibility Measures and Instruments 3
There has been a growth of interest in the concept of accessibility in recent decades,
with many accessibility studies published in the academic press discussing how to
measure accessibility, the implementation of the concept of accessibility in urban
planning and transport and the contribution such decision support tools might have.
This interest in accessibility, more recently, has broadened such that there is a
multitude of approaches used in the consideration of the development of accessibility
instruments (or tools) and the contribution they could make to urban planning practice
to inform land use and transport decision-making. This report focuses on these new
approaches to accessibility modelling and aims to help practitioners choose the most
appropriate accessibility instrument based on the urban management problem.
This chapter, however, seeks to provide a benchmark to these later instruments by
categorising the ‘first wave’ of accessibility instruments developed using the
descriptions of these instruments in the academic press. This documentary review is
limited to the accessibility-based planning instruments in the English language
academic press and seeks to explain early conceptualisations of accessibility and how
the concept is measured and incorporated in the instrument.
The chapter has the following structure: Section 2.1 presents the categorisation and
components of accessibility-based planning instruments that have been widely reported
in the literature. Section 2.2 describes the aspects and dimensions of accessibility
instruments while Section 2.3 focuses on accessibility modelling in a GIS environment.
Section 2.4 takes a more thematic approach to the categorisation of accessibility
instruments developed for urban planning practice using some of the most common
accessibility instruments developed in Europe. This section explains the themes or
approaches to accessibility, the concept(s) incorporated in the instrument and what is
measured as well as further relevant technical issues of accessibility modelling
including input and output data. Finally, Section 2.5 presents what can be seen as some
of the omissions in the ‘first wave’ of accessibility instruments suggesting that that tool
developers should address these omissions if accessibility instruments are to have
wider application in urban management.
1.1. Categorisation and Components of Accessibility
Instruments
The concept of accessibility is about movement and, in particular, about the ease of
getting around from place to place. One can categorise the different derivations of
accessibility into two broad families (Hull, 2011), The first, is focussed on mobility or the
ability to travel and is derived from classical location theory which hypothesises that
there is a direct correlation between changes in the transport system (e.g. transport
costs) and journey length (Banister, 2002; Ney, 2001; Geurs and van Wee, 2006). This
conception has held the attention of geographers and transport engineers interested in
the geography of flows and the movement patterns between origins and destinations
noting the average speeds and predicting the direct costs of travel.
From this conceptualisation has grown another derivation of accessibility which focuses
more on the ‘ease of reaching’ a number of daily activities at different destinations. This
Page 28
4 Accessibility Instruments for Planning Practice
conceptualisation is, therefore, interested in the ability of social groups to reach
destinations where they can carry out a given activity as well as the transport network
(Bhat et al, 2000; SEU, 2003). This conceptualisation of how efficiently the spatial
distribution of services and facilities is connected/ integrated with the transport
infrastructure creates a new challenge for tool developers and urban managers.
The academic literature deals more thoroughly with the first conceptualisation of
accessibility than the second. Whilst this Action is more concerned with the second
conceptualisation, it is important to understand the antecedents of the current wave of
accessibility instruments. This section, therefore, examines earlier published work to
identify and compare the use of accessibility components and how these are
incorporated in the measurement of accessibility (see Martin and Dalvi, 1976; Geurs
and Ritsema van Eck (2001); Jones et al, 2005). According to Martin and Dalvi (1976),
there are three equally important components in modelling accessibility. These are
people’s preferences and choice groups, existing opportunities, and the degree or
intensity of the transport service provided to tackle distances. Handy and Niemeier
(1997) identified four key components of accessibility measures: the level and type of
spatial separation, representation of origins and destinations, size of travel deterrence
and size of attractiveness. In the study by Reneland (1998), accessibility indictors can
be split into four groups by defining four aspects of accessibility: origins and
destinations, time of day, available transport modes and the characteristics of
passengers including gender, age, physical condition, and type of job. Geurs and
Ritsema van Eck (2001) defined four types of components important in the
measurement of accessibility including land use, transport, individual and temporal
components. Further, Geurs and Ritsema van Eck show that these components may be
affected by accessibility through feedback mechanisms.
Based on the authors above, in general three key elements have been commonly
considered in the scientific academic literature to characterise accessibility measures:
(1) a determined geographical “origin” location or category of people or freight that is
being considered for accessibility, (2) a set of relevant destinations that might be
weighted by the size or quality of associated opportunities, and (3) a measure of
physical separation between (1) and (2) that is usually expressed in terms of time,
distance or generalised cost.
Some accessibility instruments focus on origins or people, some on opportunities, and
some on the connection. Accessibility instruments and models have been categorised in
different ways (see Spiekermann and Neubauer, 2002; Transport Scotland, 2003; DHC,
2007). Scottish Transport Appraisal Guidance (STAG) used the objective of developing
the indicators of local accessibility, by cycling and walking and the coverage of public
transport network, as a basis for the categorisation of instruments (Transport Scotland,
2003). In this respect, three major categories have been presented as follows:
Category 1- Accessibility instruments analysing walk times to public
transport services or to local facilities. In these instruments, public transport
systems are classified according to types of desired destination, frequency,
mode, and time of day while local facilities are classified by an associated
Page 29
Chapter 1. Accessibility Measures and Instruments 5
function. For example, Glasgow City Council Bus Network Coverage Model,
and PTALS Models (e.g. Hammersmith and Fulham), etc.;
Category 2 - Accessibility instruments analysing travel times using public
transport systems and motorised vehicles through the motorway network. In
these instruments, public transport networks are described in terms of
journey planning techniques and destinations are expressed as
opportunities, activities or places (e.g. CBD). For example, SONATA (Steer
Davis Gleave), ACCMAP (MVA), APTT (Halcrow), ABRA (Colin Buchanan and
Partners);
Category 3 – Instruments or models that are not specifically developed to
measure accessibility that, however, involve the process of accessibility
modelling. These incorporate: land use models that describe the spatial
interaction in terms of accessibility (e.g. DELTA, MEPLAN, LILT, TRANUS,
etc.); demand models that measure accessibility change for input to an
economic appraisal; and activity based models that estimate behaviour
according to accessibility to opportunities. For example, four stage models
used in conjunction with accessibility analysis processors - e.g. ACCALC
(Derek Halden Consultancy), CSTM3, TMfS, SITM used in conjunction with
the SPT accessibility model;
In the same context, Derek Halden Consultancy (2007) split the accessibility
instruments available internationally into three categories based on their functionality.
First, catchment instruments that are used by service providers such as public transport
operators and retailers. These instruments help providers to plan suitably for
residents/customers to enable access to their facilities based on the analysis of the
local population and output information on potential customers within the catchment
area. The second category of accessibility instruments is that obtained from public
transport or road journey planners. These instruments usually focus only on calculation
of the time required to reach desired destinations. The third category includes land use
and transport models which are more complex compared with the catchment or journey
planning instruments. These can incorporate information on different features such as
the type of opportunity and traveller behaviour that can be connected with separate
accessibility models to produce a better quality accessibility calculation.
This chapter takes the categorisation types used by the Scottish Transport Appraisal
Guidance (see above) to illustrate the different approaches taken by tool developers in
the first wave of accessibility instrument development. This categorisation connects well
with the application of accessibility instruments in urban planning practice which is the
main concern of this Action.
1.2. Dimensions of Accessibility
Accessibility instruments can be sensitive to a range of various dimensions or aspects
which characterise the functionality and capability of the instrument. This section
introduces several dimensions of accessibility modelling derived from the documentary
review of the academic literature covering the last two decades. These aspects include:
Page 30
6 Accessibility Instruments for Planning Practice
Spatial separation (deterrence) factor: The spatial separation factor 1.
represents one or more attributes of the links between areas that separate
places and people from the opportunities. These can be distance (crow-fly or
network distance), travel time, travel cost, reliability, information,
convenience, safety or other attribute that acts as a deterrent or constraint
to access.
Type of accessibility indicator and the measurement of spatial separation: In 2.
many studies accessibility indicators have been split into different types
based on different criteria. Geurs and Ritsema van Eck’s categorisation is
one of the most commonly referenced and has therefore been selected for
this study. Geurs and Ritsema van Eck (2001) differentiated between
infrastructure-based, activity-based and utility-based accessibility measures.
Further, the activity-based measures were broken down into distance,
contour potential accessibility, inverse balancing factors and space-time
measures.
Origins: Accessibility can be measured from the point of view of different 3.
population groups (e.g. age, gender or social groups) or types of economic
actors (e.g. firms or industries) in the area, or people using the area (e.g.
tourists or travellers). The origins may be locations (location-based
measures) or people such as economic actors (person-based measures).
Destinations, type of associated opportunities and measurement of their 4.
attractiveness: Accessibility to the location of an area can be measured with
regard to activities, opportunities and assets; for example, population,
business activities, universities, health services, shopping facilities or tourist
attractions. The attractiveness of these opportunities can be measured in
different dimensions such as population; number of employees, students,
patients or facilities; the total gross floor area of facilities; volume of sales;
percentage of gross domestic product; etc.
Input data and parameters: These incorporate all the data required to carry 5.
out accessibility planning and modelling which, according to Titheridge
(2004), can be classified into three groups including data on transport
infrastructure and operations, data on people and data on facilities and
amenities.
Output of accessibility modelling: Modelling outputs vary according to the 6.
functionality and objective of the accessibility instrument.
Dimension of accessibility values: Most of the indicators that have been 7.
used in accessibility instruments present the accessibility of locations as
non-dimensional values which are not comparable with each other. This
complicates the output interpretation and assessment of infrastructure
improvements. Ranking is a useful method that has been widely used by
accessibility modellers for comparison of different accessibility measures
(Baradaran and Ramjerdi, 2001).
Spatial detail and geographical scale: Accessibility analysis may be applied 8.
at a continental, transnational, interregional, regional, municipality or
neighbourhood scale. The selection of detail and level of the analysis is
based on the scale of the issues considered and the detail that needs to be
Page 31
Chapter 1. Accessibility Measures and Instruments 7
understood. Every spatial scale requires data of different spatial resolution
with regard to area size and network representation; transfer time; and intra-
area access and intra-node terminal.
Type of transport: Accessibility analysis might consider only personal travel 9.
or freight transport, or both.
Travel modes and mode choice: Accessibility might be measured for only one 10.
transport mode such as walking, bicycle, car, bus, rail, ferry, air, or bespoke
services (i.e. patient transport or school transport). An accessibility model
also might be run for a multi-modal transport system in which the choice
between the modes is being considered based on particular criteria or where
travel modes are specified by the model user.
Route choice: Accessibility might be measured taking into account the ability 11.
to make a choice between routes, for example minimum cost, minimum
time, shortest distance, least amount of walking, route via a location or
locations, route avoiding a location, include or exclude modes, etc (DHC,
2007).
Interchange options: Interchange options might be considered in 12.
accessibility analysis, for example minimum number of interchanges,
minimum time for interchange, availability of guaranteed connections,
through or avoiding a particular interchange.
Interchange points by facilities available: Accessibility analysis might 13.
consider the availability of facilities and services at interchange points; for
example information, shelter, porters/ staff, CCTV, luggage trolleys, etc (DHC,
2007).
Scheduling: An accessibility instrument might be able to calculate 14.
accessibility taking into account target arrival or departure time or both,
arrival or departure during a specified period, depart after, and arrive before
(DHC, 2007).
Travel costs and fares: Accessibility analysis might consider travel cards and 15.
concessions, season tickets option, fares restricted by quota and time of day
restrictions (DHC, 2007).
Walking time and waiting time (for public transport): Calculating accessibility 16.
by public transport should consider the total travel time of the journey
including the walk access time to the public transport service, waiting time,
in-vehicle time and interchange time. However, some accessibility
instruments do not have the capability to consider all these details and
calculate only in-vehicle travel time rather than the total time. Also, time of
travel by public transport can be measured in different ways. Accessibility
instruments might estimate it using service frequencies, actual service
schedules for a specified time of day and day of the week, or based on
speed limits and journey distance.
Real time updates and reliability: This reflects the instrument’s capability to 17.
take into account the change in journey time due to roadwork, congestion,
delays, etc.
Page 32
8 Accessibility Instruments for Planning Practice
Type of vehicle: Accessibility analysis might consider the physical 18.
characteristics of vehicles such as luggage carrying capability, low floor bus,
etc.
Day of the week, seasonal variations: An accessibility instrument might be 19.
able to calculate the difference between accessibility during week days and
the weekend. Also, seasonal variations might be considered in an
accessibility calculation.
Time of day: An accessibility instrument might be able to consider the 20.
calculation of accessibility in different times of the day, for example peak
time or off-peak time.
Environmental impact: Accessibility instruments might provide some 21.
environmental information, for example, on the amount of emissions
resulting from a journey.
Health impact: Some health information might be also provided by the 22.
accessibility instrument such as an amount of calories burnt off to carry out
the journey.
Safety and security information: Accessibility instruments might consider 23.
safety and security issues during the journey including real and perceived
safety, speed limits, presence of road crossing facilities and travel during
darkness (e.g. lack of street lighting) (Halden, 2010).
Physical features: Accessibility can be measured whilst taking into account 24.
the physical features during the journey that, according to Halden (2010),
are categorised into three groups including steep hills and topographic
constraints, kerbs and physical obstructions, and surfacing and
maintenance.
Non-spatial barriers: In addition to spatial constraints, the accessibility 25.
instrument might consider the non-spatial barriers between areas such as
economical, political, cultural, legal or linguistic barriers. Non-spatial linkages
between areas (e.g. complementary industrial composition) might be
considered as well (Spiekermann and Neubauer, 2002).
Quality and environment of journey: Accessibility analysis may consider the 26.
quality and environment of travel that can be expressed in five features:
opportunities for rest points and for shelter from weather, aesthetics and
attractiveness of journey routes, comfort of vehicles and waiting places,
support services during journey (e.g. catering), and help and assistance from
public transport staff (Halden, 2010).
Information and booking: This may be considered in accessibility analysis by 27.
taking account of the availability of information needed to plan the journey,
time spent for planning and booking the journey, and the availability of
information during the journey itself.
Equity: Accessibility instruments may be developed to calculate accessibility 28.
for particular areas or groups in order to find out inequities in accessibility
between poor and rich, urban and rural, central and peripheral, or nodal and
interstitial areas.
Dynamics: Accessibility instruments may be developed to calculate 29.
accessibility for different points in time in order to identify changes in
Page 33
Chapter 1. Accessibility Measures and Instruments 9
accessibility due to investmentin transport infrastructure or the impacts of
other transport policies (Spiekermann and Neubauer, 2002).
Land use analysis: Accessibility instruments may be developed to identify 30.
how changes in land use patterns and location choice affect accessibility.
Modelling programme: Most of the accessibility instruments have been 31.
developed to be run under a Geographic Information System (GIS)
environment while some instruments rely more heavily on bespoke
programming with a direct or indirect link with a GIS database.
1.3. Accessibility Modelling in a GIS Environment
With the rapid increase in computer power and availability of a wide range of electronic
data sets, the dependence on GIS techniques for accessibility analysis has significantly
risen in the last decade. GIS is well-known for its capability to analyse, model and
visualise geographical data such as transport and socio-economic data. It facilitates the
utilisation of quantitative geographical approaches within a digital environment. A GIS
map can incorporate many and various layers of information that are accompanied with
a linked database and which can demonstrate them in innovative ways (Grid, 3-D,
thematic maps, etc.) to ease data interpretation (Wu and Hine, 2003).
In the past, GIS users used to analyse accessibility by using “buffer” and “overlay” tools.
The main drawback of these conventional tools was their inability to consider the
transport network. Accessibility was being measured based on crow-fly or Euclidean
distances rather than using actual distances on the network. Furthermore, all the
locations within the computed buffer zones were equally weighted which means the
nearest location to the desired destination or service is as equivalent as the furthest
one to the same destination (de Jong and van Eck, 1996; Geertman et al., 2004).
In 1991, Geertman and Bosveld used potential measures based upon a real world
transport network for the first time in GIS-based accessibility analysis (de Jong and van
Eck, 1996). The analysis overcame the drawbacks of “buffer” and “overlay” functions,
dividing the study area into many hexagonal tiles that are equal in size. The new GIS-
based accessibility analysis usually uses accessibility measures that are especially
designed in a way that can be integrated in a separate modelling programme with a
direct or indirect link with the GIS database. An integrated GIS tool, ACCESS, was
developed by Liu and Zhu, 2004, within the ArcView 3.2 offering flexible and interactive
GIS environment that supports accessibility analysis for many planning and decision
making applications on a whole urban area or region. Accessibility Analyst is another
new ArcView extension which was also created by Liu and Zhu working with the other
ArcView extensions such as Network Analyst, Spatial Analyst, Patch Analyst and 3D
Analyst in order to run advanced potential models in addition to the usual potential and
contour models.
Recently, a software package named Flowmap designed to analyse and display
interaction or flow data between two different geographical locations was developed at
the Faculty of Geosciences of the Utrecht University in the Netherlands (Utrecht
University, 2011). Since most thematic mapping and GIS packages have little
Page 34
10 Accessibility Instruments for Planning Practice
functionality for handling this type of information, Flowmap fills this gap in GIS packages
by dealing with:
Storage, visualisation and analysis of spatial flow patterns (e.g. trade flows
and commuter journeys);
Computing travel times, distances, or transport costs using a transport
network map;
Modelling the market areas of current or programmed services.
It presents some unique and practical graphical measures including catchment profile,
location profile and proximity profile. All these abilities make Flowmap a very efficient
technique that can be integrated in planning support systems especially in terms of
facility and service location planning (Geertman et al., 2003). However, since it is
developed as an extension for a particular spatial analysis that is difficult to run in GIS
packages, data management, network analysis and mapping functions in Flowmap are
further behind those provided in GIS packages (Liu and Zhu, 2004).
Another main tool that can be linked to GIS to improve its analysis capability of
developing transport models is ACCMAP. It is a trip access and travel time mapping
package which provides an accessibility calculation from and to any point using travel
costs through highway and public transport networks (Citilabs, a). ACCMAP is able to
show the impact of network changes on the transport system by overlaying accessibility
mapping on any background map. Also, the tool facilitates the generation of Public
Transport Accessibility Level (PTAL) indices for different time periods using public
transport services (Wu and Hine, 2003). Lately, a considerable development has been
executed in the ACCMAP package by MVA and Citilabs on behalf of the UK Department
for Transport (DfT) to build a new tool named Accession. This tool is able to measure
accessibility using many more origin and destination combinations and to produce
different types of indicators (Citilabs, a
1.4. Accessibility-based Planning Instruments
This section compares the different approaches to accessibility instrument development
using the three-fold categorisation of instruments employed by Transport for Scotland in
their Scottish Transport Appraisal Guidance (STAG). This categorisation is used to
illustrate the different approaches to the access indicators used (see Section 2.1
above). The STAG categorisation is used here because it is consistent with the
classifications articulated in the state of the art scientific literature (Handy and
Niemeyer (1997), Geurts and vanWee (2006), and Silva (2008)) and at the same time
relates easily with the context in which practitioners apply ideas on accessibility. As
noted earlier, this English language review is heavily dependent on accessibility
instruments developed in the United Kingdom.
1.4.1. Category 1: Accessibility by Public Transport
This first category includes accessibility instruments that examine the accessibility by
public transport incorporating analysis of the walk times to public transport services or
to local facilities.
Page 35
Chapter 1. Accessibility Measures and Instruments 11
Within this category are instruments that measure access to the public transport
network at a geographical point without measuring the separation or interaction
between places. One example of this approach is PTAL (Public Transport Accessibility
Levels) which has been developed by the London Borough of Hammersmith and
Fulham. PTAL deals only with the origin or destination of a journey using a set formula to
measure the intensity of public transport provision at different points (bus stop or train
station) within easy walking distance of each area or site (Jones et al., 2005). This
formula takes account of walk time to nearby public transport services, the number of
services available, service reliability and average waiting time in order to score each
location on a six-point scale (Halden et al. 2005). The main datasets required are the
public transport network including locations of public transport stops, delineation of
routes and schedule frequency in order produce the PTAL indices (Wu and Hine, 2003).
The ACCMAP software has been used to facilitate the production of these indices for
different time periods of public transport service. The output of the PTAL’s analysis,
expressed as a set of Accessibility Indices for a range of locations, is classified into six-
value ranges and spatially mapped, and then defined in terms of Accessibility Levels.
Another examples of this category, which incorporates more robust measures of the
perceived walk access times to bus stops and rail transport, is WALC (Weighted Access
for Local Catchments) developed by the Transport Studies Group (TSG) at the University
of Westminster. This is a walk access instrument based on a very detailed
representation of the local walking network, covering pedestrian only routes, alleyways
and short cuts. WALC calculates walk access times for different groups of people taking
account of several limitations that accompany the local environment. These limitations
include: the local terrain (e.g. steep hills); the lack of provision of a shelter and seating
at bus stops; low levels of street lighting; and difficulties in crossing busy roads because
of heavy traffic volumes, speeding traffic, barriers (e.g. guard railing) preventing
crossing at convenient points and lack of safe crossing points (Jones et al, 2005).
WALC aims to demonstrate how the consideration of the hindrances to walking (physical
obstacles and individual limitations) will change and shrink the shape of standard
catchment areas.
The instrument uses the catchment (contour) measure based on different walk speeds
and maximum acceptable walk times to different public transport nodes, and with
regard to the concerns of various population groups. Weighted values for lack of bus
stop facilities (e.g. shelter and/or seating), steep gradients (=>1:5), low levels of street
lighting, and absence of formal pedestrian crossing arrangements are used to produce
the catchment areas. Several different types of data are required for calculating each
catchment; these include (Jones et al, 2005):
A road network including a detailed pedestrian network;
The location of bus stops (and facilities available); crossing points; steep
hills; lamp posts as well as lighting levels;
The weighted perceptions of different groups in regard to each of the
limitations associated with walk access; and
Other relevant data, including data on traffic flow data and pavement
characteristics.
Page 36
12 Accessibility Instruments for Planning Practice
After applying the various weighting factors to the pedestrian network and to certain
railway stations / bus stops, the outputs of WALC analysis are presented using ArcGIS
as maps showing how the catchment sizes differ from each other according to the type
of population group. The analysis is able to generate three different types of catchment
area for each of the socially disadvantaged groups considered, to/from selected railway
stations and bus stops: unadjusted walk catchments (no penalties); daytime penalties
catchments; and night time penalties catchments (Jones et al, 2005).
1.4.2. Category 2: Accessibility by motorised vehicles through
the transport system
These are instruments that focus on the flow of motorised traffic through the motorway
network. Instruments cover one or more motorised modes and describe the transport
network in terms of journey planning techniques with destinations expressed as
opportunities, activities or places.
One application that focuses only on the bus network accessibility and buses run by the
same operator is PTAM (Public Transport Accessibility Mapper) developed by West
Yorkshire Passenger Transport Executive. PTAM can generate both origin and
destination-based indicators and has an integrated GIS-based accessibility mapping
instrument that. The instrument measures the accessibility of a location or set of
locations by calculating the total travel time by bus taking account of walking time
(based on straight line walking distance from and to bus stops), bus waiting time
(estimated from service frequencies) and bus journey time (calculated from bus
timetable database) (Halden et al. 2005). In order to carry out an accessibility
calculation, PTAM requires the following data (Jones et al., 2005):
Bus services databases including timetables, stops and routes;
Ordnance Survey mapping illustrating road networks, different physical
features and administrative boundaries;
Census statistics including many population characteristics;
Employment location characteristics, and;
Facilities databases including information on the provision of retail,
education, health, and leisure services.
The output of PTAM can be presented as isochrones on an Ordnance Survey
background or as tables including census statistics, employment statistics and lists of
facilities associated with their attributes (Jones et al., 2005).
Another application that focuses on the bus network is SONATA (SOcial Needs And
Transport Accessibility) which has been used by rural local authorities in the UK to
address travel needs and prioritise their expenditure on rural public transport (DfT,
2000). SONATA is a technique that was developed by Steer Davies Gleave in the late
1980s to estimate travel needs and identify gaps in the transport network across a
given area (Helm, 1999). It evaluates the extent to which the existing public transport
services are able to meet people’s travel needs based on trip profiles estimated from
maximum travel times and duration of purpose, and also test the effect of service
Page 37
Chapter 1. Accessibility Measures and Instruments 13
changes and define those services that are most significant in meeting these needs
(Cumbria County Council, 2002).
SONATA employs a combination of local surveys and social indicators to measure travel
needs. It assigns total travel needs to particular journey purposes according to
percentages obtained from travel survey data (Titheridge, 2004). The model analyses
the use of bus services for work, health, senior education, leisure and shopping
purposes. By applying car ownership, population and other socio-economic factors,
numbers of unmet journeys can be estimated (Somerset County Council, 1997-2000).
The key output of SONATA is a prediction about the proportion of travel needs produced
by each area which are met by the public transport networks. The output can be
expressed in terms of need met/unmet. A mapping system has been included to
present the results on a geographical base. Since SONATA measures fulfilment of
different types of travel need separately, it is possible to map needs met for each
journey purpose at different times of day. In addition, SONATA is able to generate a
report on the number of travel needs that are met by each separate public transport
service (Steer Davies Gleave, 2004).
Some instruments in this category can cover all the key features of journey time by
public transport covering walking time, waiting time, in-vehicle time (actual not
generalised/ weighted) and interchange time. An example of this type of instrument is
CAPITAL (CalculAtor for Public Transport Accessibility in London).CAPITAL measures
accessibility based on the minimum of total travel time between two zones using any
combination of public transport modes in Greater London (i.e. bus, underground,
Docklands Light Railway and national rail) in addition to walk access times (by assuming
an average walk speed of 5km/h) to the public transport network (London Transport,
1999). However, accessibility cannot be calculated at different times of the day since
data is only collected for the morning peak travel period. Furthermore, different
population groups can be only considered in measuring accessibility in CAPITAL by using
standard representative values for walk speeds, thresholds, etc. (Jones et al., 2005).
The CAPITAL instrument combines information from Transport for London’s Planning
and Development Geographical Information System (PDGIS) and its public transport
assignment model (RAILPLAN) (Jones et al., 2005). CAPITAL relies on the Ordnance
Survey Centre Alignment of Roads (OSCAR) database as a source of the road network in
Greater London, containing all the major and minor roads, which has some
supplementary information on walk links. RAILPLAN represents links, stops and services
together with route characteristics (i.e. frequency) and uses a multi-routing assignment
algorithm.
The analysis output is typically provided as shaded maps illustrating isochrones of
journey travel times from and to a specific location, or set of locations using GIS
mapping software. Further, the output file can be also presented as a spreadsheet
where other types of analysis can be carried out (London Transport, 1999).
There are instruments in this category that support multi-modal travel including public
transport, car, cycling and walking. Two examples of this approach are TRANSAM
(TRANSport Accessibility Modelling) and Accession.
Page 38
14 Accessibility Instruments for Planning Practice
TRANSAM is an approach developed by Brown & Root to measure and quantify road
network accessibility by competing travel modes and to analyse access changes in
terms of network improvements and new public transport services. It provides the ability
to make a comparison of accessibility measures for cycle, walk and public transport
networks, or for a combination of these travel modes for the complete journey from
origin through to destination (Robbins, 1999).
The TRANSAM model is based on a customised GIS which can create travel time
contours based on the lowest generalised cost route for a range of travel modes (rail,
bus, car, cycle and car) from all network nodes to the destination node. The calculation
takes into account the walk time at the start and end of the public transport journey, the
wait time at the bus stops and railway stations, and the on board travel time (Titheridge,
2004).
Data sets have to be set up in GIS for TRANSAM. These include the car network with the
associated speed-flow relationships and observed volumetric information for each link;
the public transport network (i.e. bus and rail) with the service time tables; cycle and
walk networks; network nodes reflecting bus stops and railway stations; points of
interest or "focal" points on the network such as transport interchanges, centres of
employment and key hospitals; and other relevant statistical data (Robbins, 1999). By
running TRANSAM, travel time contours will be created and then GIS can demonstrate
visually the extent of travel attainable for acceptable combinations of travel modes. In
this context, the output from TRANSAM is able to highlight the areas where levels of
network accessibility for different travel modes are relatively low and high.
Accession is a travel access and travel time mapping package that was developed by
MVA and Citilabs on behalf of the UK Department of Transport (Jones et al, 2005). It is
built from a fully functional GIS with many features to help Local Authorities and their
partners in: setting up strategic and action plans; the evolution and development of
proposed actions; the prioritisation of resources; and the monitoring of accessibility
strategies and action plans (DfT, 2004). Accession supports multi-modal travel and
flexible routed and demand responsive transport modes (DfT, 2004).
The instrument measures accessibility to and from any point based on travel time, cost,
distance or generalised cost through road and public transport networks (Titheridge,
2004). It is able to consider many origin and destination combinations in calculating
accessibility and to generate different types of indicators (Halden et al. 2005).
Accession offers a number of calculation methods: Threshold Hansen/ Gravity measure,
Hansen/ Gravity Measure, Relative Hansen/ Gravity measure, Simple Utility or logsum
measure or simple time-constrained accessibility (Citilabs, b). Access to local public
transport is represented as a combination of walk time to a boarding point and the
average wait time for a service. This can be calculated based on either the actual walk
time or a straight-line walk time, while in-vehicle travel time is usually calculated based
on scheduled arrival or departure times. The accessibility calculation can be carried out
for specific catchment values of origins/ destinations, for selected modes, for particular
routes/ services, and for particular days of the week and times of day (Titheridge,
2004). Moreover, other criteria can be considered in the analysis, for example road
Page 39
Chapter 1. Accessibility Measures and Instruments 15
speed, maximum speed, frequency, start and end times, and delays for wheelchairs
(Citilabs, b).
In order to measure accessibility, Accession requires a collection of data sets with
regard to: public transport data (rail and bus) including boarding points and full
timetables; the road network with the associated speed limits; walk and cycle links; and
demographic and other data that can be disaggregated from census geography and
other polygon systems onto origin points (Citilabs, b). The outputs of Accession can be
presented as tables and various contours reflecting accessibility. Also, the results can
be exported for mapping or analysis in other packages.
1.4.3. Category 3: Other models that incorporate accessibility
In this category are models and instruments that have not been developed specifically
to measure accessibility that, however, incorporate some dimensions of accessibility
modelling. Included in this category as examples are two land use and transport
interaction models and a technique from urban space design.
GenMod
GenMod is a static multimodal transport model that was developed by the
Transportation Planning Department of Amsterdam (DIVV) and the University of
Amsterdam (Brömmelstroet and Bertolini, 2008). It is basically a traditional four-step
model based on household surveys and mobility counts. As a by-product, GenMod can
be used for measuring accessibility as it calculates travel times between 933 zones
within the Amsterdam region using extensive public and car transport networks.
GenMod has been used to show the land use - transport system consequences of land
use/ transport alternatives, by calculating network consequences (e.g. level of service),
network opportunities (e.g. for more efficient use) and the dynamics of indicators that
show the change from a baseline scenario; for example potential accessibility (e.g. the
number of people or jobs accessible from each zone within acceptable travel time) and
sustainability (e.g. the number of people or jobs reachable within a crow flight distance)
(Brömmelstroet and Bertolini, 2008).
In order to run the model, land use data including the number of people or jobs held by
zone, and road and public transport networks are required. The outputs of GenMod runs
are presented as clear overviews of all the indicators used and spatial maps produced
by GIS that help to define which land use - transport system choices have a negative
effect on the chosen indicators and which a positive one. These can be used to build a
list of appropriate land use transport choices and strategies.
TMfS (Transport Model for Scotland)
TMfS is a strategic, multi-modal demand and assignment model which was developed
by MVA Consultancy, with its land-use capability developed by David Simmonds
Consultancy (Transport Scotland, b).
The key objective of TMfS is to enable the Scottish Government and Local Authorities
across Scotland to examine the impact of and/or interaction between major inter-urban
Page 40
16 Accessibility Instruments for Planning Practice
road and public transport schemes and major transport policy options in forecast years
(MVA, 2006) TMfS measures the implications of these schemes for accessibility and
travel demand and, consequently, helps Local Authorities in prioritising and scheduling
their transport interventions (Transport Scotland, a). Other objectives are to undertake
economic, traffic and land-use assessments of proposed transport schemes and
policies, and also to produce robust traffic forecasts on all Trunk Roads within the
model area (Transport Scotland, b; MVA, 2006).
An accessibility analysis package is included as an add-on to the basic TMfS model. The
analysis uses the output costs obtained from running the basic model along with
several parameters specified by the user, and produces a number of accessibility
measures. These measures can be for either destinations or origins and can be
weighted by demographic and socio-economic data related to each geographical zone
such as the number in employment or the number of households (Transport Scotland,
b). The model takes into account the main responses of passengers to schemes or
policies such as destination choice, mode choice, route choice, trip frequency and peak
spreading. A wide range of data is required to run TMfS which is built using a system of
zones and a transport network. The main data include (Transport Scotland, b):
Census and travel to work data including travel diaries, roadside and public
transport passenger interview data, and rail ticket data;
Planning data forecasts that are set up by Local Authorities and focus on
future development land allocations for each TMfS zone;
National/regional economic and geo-demographic assumptions;
Public transport service data including routes, boarding points, fares and
frequencies;
Road network details including number of lanes, link lengths, junction lay-
outs, typography, signal timings and speed limits, and;
Count data including traffic counts, public transport user counts, turning
counts at junctions and car park surveys.
This is a strategic regional model that generates a variety of outputs that can be used to
evaluate policy initiatives or public transport and road infrastructure schemes as well as
to predict changes in both transport and land use patterns over the model area. The key
outputs available from TMfS are: operational analysis; accessibility analysis (that can be
performed by linking the operational analysis of the transport model with graphical and
tabular analysis of land use changes); congestion mapping; accident analysis;
environmental analysis; economic and financial assessment; sub-area analysis; and
demographic and land-use predictions (Transport Scotland, b; MVA, 2006).
Space Syntax
Space Syntax is a technique developed by Bill Hillier, Julienne Hanson and colleagues at
the Bartlett, University College London that provides a spatial analysis of aspects and
structure of space and helps to describe social activities and human behaviour from a
spatial configuration perspective (Jiang et al, 2000). Space Syntax has been used to
estimate the connectivity and, consequently, accessibility of architectural or urban
spaces (i.e. buildings, open spaces, streets and cities) (Hillier, 1996). It is also able to
Page 41
Chapter 1. Accessibility Measures and Instruments 17
define movement patterns and the degree of difficulty in mobility. Moreover, the
instrument can be used for other applications including land-use distribution, criminal
activity, estate prices and other spatial related characteristics.
The main principle of Space Syntax is to model a spatial structure as a set of axial lines
and calculate spatial indices of a space in order to estimate the relation between
various parts of indoor or urban spaces (Jun et al, 2007). Axial lines are lines of
unhindered movement used in measuring accessibility, and they are defined as the
least number of longest straight lines. This is illustrated with a connectivity graph where
axial lines are represented as nodes and line intersections as links, which reverses the
terminology used in the traditional method (Abubakar and Aina, 2006).
Three key measures using different configuration parameters can be applied in the
calculation: “connectivity” which computes the degree that each space (node) is directly
linked to other spaces (nodes) in the connectivity graph, “control” which computes the
potential of any space to provide part of a route linking between any two spaces within a
defined distance (modelling movement through spaces), and “integration” which
computes relative depth from any space to all other spaces (modelling movement to
spaces), and (Abubakar and Aina, 2006; Vaughan and Geddes, 2009).
In addition, three different types of distance calculation can be considered in
accessibility analysis by using Space Syntax. These are metric (shortest paths),
topological (fewest turns’ paths) and geometric (least angle change paths). For example,
when topological distance is applied, the most accessible sites are not those closest to
all other sites in terms of metric distance, but rather those in terms of number of
changes of direction through the journey (Hillier, Turner et al. 2007). The topological
method, called depth-based accessibility, is commonly more significant since it
assesses the complexity of routes within the defined area (Rose and Stonor, 2009).
Depth of one node from another can be directly estimated by calculating the number of
turns (or steps) between two nodes, while the depth of a node (or a street) in a
particular step distance is measured by the number of nodes that are separated from
that node by the given number of steps (Jun et al, 2007). However, the Space Syntax-
based measure has a key weakness in calculating the actual journey length since it
does not considertraditional travel costs such as travel time or distance (Jun et al,
2007).
In order to measure accessibility in Space Syntax, the transport network (i.e. public
transport services, roads, cycle and/or walk routes) as well as the associated lengths of
the network links are required to be built. The spatial indices derived from Space
Syntax analysis reflect the extent to which a space (or node) is integrated and
connected with other spaces (or nodes) in the studied area (Jun et al, 2007). The
resulting maps can be presented in several scales of colours showing the different
range of accessibility values (Vaughan and Geddes, 2009).
Page 42
18 Accessibility Instruments for Planning Practice
1.5. Recommendations for Accessibility Instruments
Improvements
The review above has focused on accessibility instruments that are well described in the
literature identifying some of the gaps in the coverage of accessibility. The following list
summarizes a number of issues contributing to enhance the soundness of accessibility
instruments.
However, it is not necessary that each accessibility instrument should consider all the
recommendations listed below since the various objectives of accessibility analysis in
planning practice require different considerations.
Consider, in addition to public transport and car, other modes including
walking and cycling;
Consider all public transport networks (i.e. bus, rail, underground, ferry, air,
etc) in the modelled area rather than the bus network only;
Consider interchange options between public transport services of different
operators and modes (e.g. bus, rail and underground);
Consider interchange options based on the minimum time accepted for
interchange, best route (fastest route, cheapest route or shortest distance),
priority for interchange between public transport services of the same mode
or operator, and/or minimum number of interchanges required to complete
the journey;
Considered the influence of specific times of day for specific days of the
week (i.e. during weekday or the weekend) associated with access
requirements to particular types of facility;
Consider the declining attractiveness of potential destinations with
increasing travel time (or distance) from an origin location, by using a
distance decay measure (e.g. Hansen measure),
Consider different walk access speeds according to area and type of
population group;
Consider different walk access thresholds (time or distance) to boarding
point (bus stops and stations) according to area and type of population
group;
Consider real time updates due to traffic congestion, roadwork or delay;
Consider physical features including physical obstructions, steep hills and
topographic constraints, and maintenance and surfacing;
Consider the type of vehicle to gain a better assessment of accessibility for a
specific journey purpose or for some population groups. For example, a bus
with luggage carrying capability for people travelling to an airport, and a bus
with assigned space for a wheelchair/ pushchair for disabled people or
those travelling with young children in pushchairs;
Consider the quality and environment of the journey including opportunities
for shelter from weather and for rest points; comfort of waiting areas and
vehicles; attractiveness and aesthetics of walking routes; support services
Page 43
Chapter 1. Accessibility Measures and Instruments 19
when travelling (e.g. catering); and assistance and helpfulness of public
transport staff;
Consider the safety and security factor during the journey including real and
perceived safety whether outside or in the vehicle, speed limits, obstructions
during hours of darkness (e.g. lack of street lighting), and availability of road
crossing facilities;
Give an indication of the environmental impact of the route choice, for
example emissions resulting from the journey;
Be able to identify changes in demand and in land-use patterns that might
result from an improvement – or deterioration – in accessibility in an area.
1.6. Conclusion
The importance of using accessibility instruments in planning practice has recently been
rising in many countries. This chapter has reviewed the way in which accessibility
instruments have been categorised in the literature focusing on the conceptualisation of
accessibility and the dimensions modelled in the instruments.
To illustrate the approaches used by tool developers a three-fold categorisation was
used which matched well with the state of the art categorisations by leading tool
developers and related to how accessibility is being articulated by practitioners.
Examples of each category were demonstrated to illustrate the general issues and
themes. The chapter concluded with recommendations on how to improve accessibility
instruments to make them more usable for urban management practitioners.
Page 44
20 Accessibility Instruments for Planning Practice
Page 45
Chapter 2. ACCESSIBILITY IN PLANNING PRACTICE
Johannes Keller, Rosa Arce-Ruiz, Ana Condeço-Melhorado, Magda Mavridou, Tobias
Nordström, Emilio Ortega, Aud Tennøy, Vasileia Trova, Angela Hull
Page 46
22 Accessibility Instruments for Planning Practice
Page 47
Chapter 2. Accessibility in Planning Practice 23
2.1 Introduction
There have been plenty of applications of accessibility analysis techniques since
HANSEN introduced the issue of accessibility to the spatial planning sphere in 1959.
Several methodological approaches with a great number of variations have been
developed and tested in various case studies. Most of these case studies focus on
issues concerning the mathematical accuracy of different accessibility indicators to
address real world planning problems.
Consequently, the ability of modelers today to measure different aspects of accessibility
with sophisticated, highly specific indicators is very advanced. The constant increase of
computer-based calculation and data storage capacities allow highly disaggregated
analyses to be carried out on normal office computers. Chapter 1 of this report has
provided a detailed overview on the state-of-the-art of accessibility modeling, addressing
the common indicator types as well as a number of accessibility planning software tools.
A question less often addressed by planning research is the usefulness of the available
tools. In other words: are the available concepts of measuring accessibility and their
implementation in the form of planning tools helpful for planners and decision-makers
in making good plans and decisions? Do planning and communication processes
benefit from these tools? Can they understand and interpret different kinds of
accessibility indicators with regard to these planning contexts? Are the available
software tools helpful in the sense that they enable planners to make use of
accessibility analysis techniques in their everyday work?
This chapter of the report intends to deliver an overview of the knowledge that is
available on these questions concerning the usefulness and applicability of accessibility
planning methods and tools. To reach this goal, this chapter will sum up the relevant
scientific literature and present a variety of relevant case studies. It must be pointed out
though, that this chapter cannot provide a final and comprehensive overview of case
studies since knowledge about these studies – especially regarding usefulness issues –
is often scarcely documented, anecdotal and subjective. Therefore, this study rather
tries to extract a number of hypothetical conclusions that may be drawn from those
case studies that are known to the authors and have thus been taken into consideration
for this report. These hypotheses may be used later on in the process of this COST
action and beyond as a starting point for further research into the addressed issues.
2.2 Planning context
Planning practice is a quite diverse activity, and offers a variety of planning contexts
where accessibility instruments can be useful in different ways. The planning contexts
define what is required from the accessibility instrument in order to be useful. Here we
will present a broad framework of planning contexts, within which the usefulness and
usability of different accessibility instruments can be discussed. The chapter is heavily
based on the works conducted in a previous COST action (Fischer et al., 2010).
These planning processes are usually highly complex and often marked by controversy.
Complexity is enhanced by issues of multi-layer governance, with transport decisions
Page 48
24 Accessibility Instruments for Planning Practice
normally affecting different administrative levels (e.g. national, regional, local),
systematic tiers (i.e. policy, plan, program, project) as well as sectors (e.g. transport,
land use, energy).
2.2.1 Strategic – tactical – operational dimensions
Planning can normally be classified along strategic - tactical - operational dimensions. A
number of decision making systems are organized along these dimensions. Land use
and planning acts are often organized in this way (national guidelines, municipal land
use plans, zoning plans), and the same could be said about sector plans (National
transport plan, regional transport planning, local transport plans). Whether the planning
process is strategic, tactical or operational will matter to determine which kind of
accessibility instrument might be useful in a specific situation.
Decisions made at the strategic level are long-term decisions about what to do in order
to achieve something. This could be generic decisions about how to e.g. reduce GHG
emissions from transport, or more specific decisions about how to solve traffic and
environment problems, like congestion on major roads or health problems caused by
transport at the municipal level. Municipal overall plans would be classified as strategic
plans, since they often strive at being strategic as well as comprehensive. The national
transport plan would also be a strategic plan.
The tactical level is of a more medium term nature and considers how to achieve what
is decided on at the strategic level, including decisions on alternatives.
Operational planning, finally, is more short term and concerns the actual
implementation in ways that maximize the positive outcomes and minimize and mitigate
negative effects and impacts. Zoning plans may often be considered as operational
plans.
2.2.2 Various tasks in planning processes
The understanding of planning has changed over the past decades. Through the shifting
discussions, however, some tasks seem to define planning and to be unavoidable in a
practice defined as planning (Friedmann, 1987). Based on among others Friedmann
(ibid) and Banfield (1959; 1973), the tasks involved in planning and decision-making
may be listed as in Figure 2.1. These tasks are carried out in overall land use and
transport planning as well as in zoning plan processes (at least they are supposed to
be).
Planning and decision-making processes will normally not follow a direct course of
action from task number one to task number nine. Rather, they are iterative processes,
more to be understood as continuous discussions regarding where we are going, what
needs to be changed, where we want to go, how to get there and whether a proposed
project contributes to take us there or not.
Page 49
Chapter 2. Accessibility in Planning Practice 25
Figure 2.1: The classic description of tasks involved in planning and decision-making
(based on among others BANFIELD (1959; 1973) and FRIEDMANN (1987))
Accessibility instruments can be applied in different ways and play different roles in
several tasks of planning. For instance, when analysing the situation and defining the
problems, accessibility instruments can be applied in a descriptive way illuminating the
lack of accessibility to important services in certain areas. When assessing the effects
and consequences of different alternatives, accessibility instruments can be used as
analytical tools, helping to predict whether implementing a certain action would
contribute to achieving defined objectives, as well as disclosing unwanted
consequences. In feedback and post-auditing, accessibility instruments can be applied
when comparing a previous situation, planned situations and the existing situation after
implementing the action in question.
The different tasks in a planning process hence call for different kinds of accessibility
instruments.
A framework for defining planning context when discussing the usefulness of
accessibility instruments
Usefulness of accessibility instruments should be discussed in relation to the planning
context.
Table 2.1 illustrates a framework for defining the planning contexts.
1. Situation analysis and problem definition
2. Formulation of goals and objectives
3. Identification and design of alternatives
4. Identification, prediction and assessments of impacts and consequences
for each alternative (impact assessment)
5. Comparison of alternatives with respect to consequences in relation to
desired objectives and other values
6. Recommendations (planning proposals)
7. Decision about action, based on knowledge produced through the
preceding steps and other knowledge
8. Implementation of the decision through appropriate institutions
9. Feedback and post-auditing
Page 50
26 Accessibility Instruments for Planning Practice
Table 2.1 The objective and expert knowledge in question may be prioritised or not and
applied or not in each of the tasks involved in planning and decision-making processes,
in different ways and for different reasons
Questions/issues Tasks Strategic Tactical Operational
Problem definition
Formulation of objectives
Identification of alternatives
Impact assessments
Comparison of alternatives
Recommendation - plan
Decision made
Implementation
Feedback
2.3 The baseline – literature review
To develop a baseline of understanding and knowledge on usefulness aspects with
regard to accessibility analysis methods and tools Geurs and Van Eck’s work
“Accessibility Measures: review and applications” (2001) is the relevant text. In their
report, the authors introduce and test as well as evaluate different techniques of
measuring accessibility.
While the focus of Geurs/Van Eck’s work lies rather on methodological aspects of
different types of accessibility indicators, they also cover the aspect of usefulness on a
general level. Categories they use for this evaluation are:
Interpretability;
data need and;
usability.
Their main finding is that “the most simple activity-based measures are the most easy
to interpret, (…) the potential accessibility measure is somewhat less easily interpreted”
whereas “more theoretically and methodologically sound accessibility measures (…) are
even more difficult to interpret” (ibid, p.135). It is not surprising that this ranking turns
out to be vice versa for the issue of data need: apparently ease of interpretation is a
direct consequence of a small variety of information being subject to a very limited and
simple series of data processing steps. (For more detailed discussions of advantages
and disadvantages of different indicator types, see e.g. Handy and Niemeier, 1997;
Geurs and Van Eck, 2001; Bertolini et al., 2005.)
The term “usability” is used by Geurs and Van Eck in the sense of a measure’s ability
and validity in capturing and adequately representing certain aspects of the real world.
Page 51
Chapter 2. Accessibility in Planning Practice 27
They point out that some measures (e.g. utility-based measures) are most usable in the
context of economic appraisals due to their methodological proximity to economic
welfare theory, whereas others (e.g. activity-based measures) are most usable with
regard to social evaluations and the analysis of equity issues.
Finally, Geurs and Van Eck conclude that “there seems to be trade-off between the
‘common-sense’ interpretability and methodological soundness of the measure” (ibid, p.
138).
In a more recent work, Geurs and Van Wee (2004) discussed four criteria to evaluate
usability: (1) theoretical basis, (2) operationalisation, (3) interpretability and
communicability, and (4) usability in social and economic evaluations.
Thus, from the theoretical basis side, these authors argue that an accessibility measure
should firstly be sensitive to changes in the transport system, secondly, an accessibility
measure should be sensitive to changes in the land-use system and, thirdly, a measure
should be sensitive to temporal constraints of opportunities. Finally, a measure should
take individual needs, abilities and opportunities into account. These criteria are not
considered absolute; applying the full set of criteria would imply a level of complexity
and detail that can probably never be achieved in practice. Thus in practical
applications, different situations and study purposes demand different approaches.
However, it is important to realize the implications of ignoring one or more of these
criteria.
Operationalisation is the ease with which the measure can be used in practice, for
example, in ascertaining availability of data, models and techniques, and time and
budget. It is interesting that the authors highlight that this criterion will usually be in
conflict with one or more of the theoretical criteria described above.
In regard to Interpretability and communicability, researchers, planners and policy
makers should be able to understand and interpret the measure, otherwise it is not
likely to be used in evaluation studies of land use and/or transport developments or
policies, and will thus have no impact on the policy making process.
Geurs and Van Wee (2004) uphold that infrastructure-based accessibility measures are
easy to interpret and communicate but they lack the land-use component, and temporal
and individual elements. More complex location- and utility-based accessibility
measures can be considered effective measures of accessibility, which can also be
used as input for social and economic evaluations. That is they overcome the most
important shortcomings of infrastructure-based measures, but they exclude individuals’
spatial–temporal constraints typically included in person- based accessibility measures.
Furthermore, these person-based measures are, in Geurs and Van Wee opinion (2004)
potentially very useful for social evaluations, and may also be tied to the utility-based
approach, which gives the practitioners the possibility of using them in economic
evaluations. On the other hand, person-based measures have some disadvantages
related to data availability and complexity, hindering their application.
Moreover, if we look at activity-based transport models, they don´t link daily activity
patterns with long-term spatial behavior of household and firms, which does not
facilitate their use in land use and transportation investments decision making.
Page 52
28 Accessibility Instruments for Planning Practice
Despite the relevance of methodological soundness, Ross brings into the debate that
the purpose of an accessibility indicator is not only to adequately measure but also to
“communicate a trend of events, and to simplify our understanding of these.” (Ross,
2010, p. 3)
These aspects of simplification and communication refer to a more process-oriented
understanding of accessibility indicators. According to this indicators should not be
expected to contain an objective truth that we can extract with the adequate
mathematical method, but rather to be a means towards establishing a common
language for planners from different domains (e.g. land use and transport) as described
by te Brömmelstroet (2008) and Straatemeier and Bertolini (2008).
Consequently, Ross expects the following principles to be met by a useful accessibility
indicator: “it should be simple to use and understand; it should identify the means of
improving accessibility; and it must be based on credible data with a convincing and
rational method of calculation”. (Ross, 2000, p. 3)
This statement finally includes a further very interesting aspect of an indicator’s
usefulness: its ability to indicate starting points for accessibility-improvement measures.
In conclusion, it can be stated that the usefulness of accessibility indicators is
determined by the following aspects: an indicator should be
methodologically adequate;
understandable / interpretable;
solution-oriented and;
supportive of interdisciplinary communication.
These aspects bear the potential of being in conflict with each other to a certain extent.
Consequently, a useful indicator would be one that achieves an ideal trade-off between
these aspects with regard to a specific planning problem and within the technological
boundaries of data need and computing speeds.
This very issue of a trade-off between methodological and process-oriented criteria is
also confirmed by Straatemeier and Bertolini (2008) as a key finding from a series of
accessibility planning workshops with practitioners from the Netherlands: they conclude
that “that making accessibility useful means finding the right balance between relevant
perceptions of accessibility without sacrificing appropriate standards of rigor” (ibid, p.
10) and that useful indicators need to be developed in close cooperation with the
practitioners.
Less focused on accessibility but more generally looking into Planning Support Systems
in the field of Land-Use and Transport Planning is the research conducted by te
Brömmelstroet (2010). A survey among 450 Dutch planning practitioners brought up
some interesting findings: the Planning Support Systems typically used by the surveyed
practitioners
“do not sufficiently support the generation of new strategies” but;
adequately support the evaluation of strategies”;
Page 53
Chapter 2. Accessibility in Planning Practice 29
are “not providing enough insight in crucial Land-Use and Transport
relationships”;
are “used to justify existing positions”. (te Brömmelstroet, 2010, p. 32).
The survey identified the following issues as the most severe obstacles
towards a more successful use of Planning Support Systems. They are
perceived to be “not transparent”, “not user friendly”, “not interactive” and
to have a “low communication value” (te Brömmelstroet, 2010, p. 33).
2.4 Accessibility as part of planning guidelines and laws
2.4.1 Accessibility Planning in the UK
One of the most well-established examples for a systematic integration of accessibility
indicators and analysis into legal planning procedures is the UK’s Accessibility Planning
scheme. Since 2006, English counties are required by the UK Department of Transport
(DfT) to incorporate Accessibility Planning into their Local Transport Plans.
The origins of developing Accessibility Planning in the UK lie in the discussion on social
exclusion. Therefore “the primary purpose of accessibility planning is to promote social
inclusion by improving the ability of disadvantaged groups and areas to access the job
opportunities and essential public services that they need. It should be based on an
improved assessment of accessibility problems and the joined-up planning and delivery
of transport and other services.” (DfT 2004, p.19)
With “Accessibility Planning Guidance”, the DfT has documented the approach that local
actors are supposed to pursue, providing information and assistance on the process as
a whole, the use of accessibility indicators and the integration of different stakeholders
into the planning procedure.
The guidance recommends that Accessibility Planning should be organized as a
continuous process consisting of 5 stages:
Strategic Accessibility Assessments;
Local Accessibility Assessments;
Option Appraisal;
Accessibility Plan Preparation;
Performance Monitoring and Evaluation.
The DfT calculates a variety of core accessibility indicators that are available on a small
geographic scale for the whole country. It recommends the additional calculation of
local accessibility indicators to be used for assessment and monitoring purposes.
The following figure illustrates how accessibility indicators are supposed to be used in
the accessibility planning process.
Page 54
30 Accessibility Instruments for Planning Practice
Figure 2.2 Usage of accessibility indicators in the UK Accessibility Planning scheme
(Source: DfT 2004)
Due to Accessibility Planning being a large-scale project initiated by the central
government and applicable to all of England, it is one of the very few accessibility-based
planning approaches that is being evaluated systematically, not only from a technical
perspective but also from a user perspective.
Bishop presented some first conclusions on Accessibility Planning at the European
Transport Conference 2007. Key findings were:
Accessibility analyses are “generally too transport-focused and (...) lacking a
depth of understanding”;
“Partnerships (are) limited to ‘easy to reach’ stakeholders such as other
council departments; neighbouring local authorities; and those with existing
contact.” (Bishop, 2007, p.10).
The University of Leeds has evaluated Accessibility Planning and carried out a survey
among local planners within a PhD project. The following are some key results from this
survey:
Accessibility Planning as an independent planning approach is conceived to
be useful by a majority of respondents, despite only half of respondents
thinking that the contents behind the approach were particularly new
(Envall, 2007);
Despite some doubts on the reliability of the nationally calculated walking
and cycling indicators, “planners identified the use of accessibility indicators
as a key strength of the new planning concept.” (ibid, p. 210) Unfortunately,
the survey does not allow deeper insights into why the indicators are
perceived so positively;
Page 55
Chapter 2. Accessibility in Planning Practice 31
Data availability is not a serious obstacle towards detailed accessibility
assessments;
The hypothesis “that there is a significant problem in specifying useful
accessibility indicators and that this is a barrier to effective Accessibility
Planning“(ibid, p. 216) was confirmed.
These two reviews of the UK accessibility scheme apparently do not allow a definitive
assessment of its usefulness. Nonetheless, it is interesting to observe, that criticism is
targeted less toward issues like interpretability or data needs but rather to what Geurs
and Van Eck (2001) referred to as usability. In other words, there are serious doubts
concerning whether the used indicators adequately reflect the complexity of the
planning problems to be solved, that they ‘lack depth of understanding’ and that there
is a ‘significant problem’ in specifying useful accessibility indicators.
In the light of this finding, it is interesting to quote Halden (2011), who describes a
“widespread abuse” of accessibility measures. This abuse includes that
“National measures are adopted by local authorities (…) without questioning
whether the assumptions are relevant”;
“Planning decisions have been made (…) without sufficient thought about
what indicator might be relevant or useful”;
“indicators have been used tactically, to make the case for a development
look artificially strong or weak” (Halden 2011, p.15).
Halden refers these problems to the enormous amount (468 different types) of national
indicators and sees a need for “a clearer typology of measures which may help to
overcome past difficulties.” (ibid, p. 18) Yet, it should be noted that the types of
accessibility measures used to calculate the UK National Accessibility Indicators mainly
belong to the family of threshold measures (e.g. opportunity available within travel time
threshold, number of people or opportunities within certain catchment areas) supported
by some continuous measures and a so-called frequency score (representing the
varying transport service qualities throughout a day) (cp. Halden, 2011). These
measures are usually considered to have a low to moderate level of complexity and thus
a rather high level of interpretability. Nonetheless many planners do not work with these
indicators in an appropriate manner. There is an obvious barrier between theory and
practice of accessibility indicators. Using these indicators – in this case very simple and
“interpretable” ones – does not guarantee good planning.
Further input to this discussion might be given by a project on “Process and Impact
Evaluation of Accessibility Planning” that is being carried out by Loughborough
University and is still going on. Results are expected within 2012 but were not available
for this report.
2.4.2 Accessibility Standards in German Planning Law
An important backbone of Spatial Planning in Germany is the “System of Central Places”
which requires regional planning authorities to assign different levels of centrality to
certain cities. For the different centrality levels there are a variety of standards
Page 56
32 Accessibility Instruments for Planning Practice
regarding the services that should be available in the city (e.g. education, health
facilities). This System of Central Places is supposed to ensure a basic level of service
provision for the population and to concentrate spatial developments. The transport-
related legislation in Germany defines certain standards of accessibility that should be
met with regard to the accessibility of these central places and thus to the services
provided by them. These standards are defined in terms of travel time. A binding
network planning guideline provides some fundamental standards with regard to the
System of Central Places is the “Richtline für Integrierte Netzgestaltung” (RIN) which is
discussed in more detail in section 3 of this report.
For Local Public Transport Plans in Germany, the usage of accessibility standards
belongs to the state-of-the-art. The following types of indicators are mostly used (cp.
Schäfer-Sparenberg et al., 2006; Schwarze, 2005):
Indicators that define travel time standards with regard to the above-
mentioned central places (rural areas) or to central areas of cities (urban
areas);
Indicators describing the areal coverage of the public transport system
(percentage of population within a certain distance threshold of a public
transport stop).
Methodologically, these accessibility measures belong to the type of “contour
measures” which are generally assumed to have a high degree of interpretability. Data
and software requirements depend on the degree of precision of the calculations but
are also limited. Schwarze criticizes that these stated accessibility indicators, although
used to evaluate the existing public transport supply, are only rarely used to evaluate
planning scenarios, thus reducing the understandability and transparency of the
planning process and its conclusions. Hence, the problem in this case is not a lack of
usefulness of the indicators but rather an inconsistent usage of the indicators within the
planning process.
Whilst the general objectives and standards of public transport and service provision as
well as the appropriateness of the System of Central Places for present-day planning
issues are frequently debated in Germany, the literature review conducted here did not
result in specific findings on the usefulness of accessibility indicators in planning
processes.
2.4.3 Accessibility Standards in Sweden
In Sweden there is a growing interest for accessibility analysis in a wide range of urban
planning issues brought forward by the use of GIS in Swedish municipalities and an
extensive access to geographic data. Beside the use of transport models for analyzing
car transport systems municipalities and regions have analyzed access with public
transport and have started to use these analyses as a background for guidelines. For
example the municipality of Gothenburg has proposed guidelines for car parking
standards based on the access to public transport.
There are some Swedish cities that use accessibility guidelines for park planning, such
as the required distance to a park or playground from residential entrances. The
Page 57
Chapter 2. Accessibility in Planning Practice 33
guidelines define different distances for different kinds of parks and their staying
values. They are based on Swedish research where a strong correlation between
pedestrian distance and people habits of using the parks have been observed. One
example is the Stockholm park program. (cp. Sociotophandboken by the Municipality of
Stockholm).
2.5 Single-case practice examples of accessibility
tools and instruments
Innumerable case studies on accessibility measures and analyses have been performed
in the last years and decades using a wide variety of methodologies and addressing all
kinds of planning questions. Several tools that have been developed and are being used
more or less systematically are presented in Chapter 1 of this report.
This section intends to elaborate on how useful accessibility measures and instruments
are perceived by those working with them and how planning processes have benefited
from the usage of these tools. While section 2.4 described some experiences with
accessibility planning guidelines, this section (2.5) goes through a couple of case
studies where accessibility tools and measures have been used within real-world
planning processes. Generally, it can be said that there is hardly any evidence on this
topic, be it quantitative or qualitative, scientific or anecdotal.
The following examples have been found to be interesting contributions to the debate
on “Accessibility Instruments in Planning Practice” and give some insights on how these
instruments have been integrated into processes and/or on the experiences made by
the planners with these instruments.
2.5.1 100 station plan
An interesting case in Italy, in Naples, has been described in Papa (2011). The process
of integrated planning between transport and the urban system started in 1994 with the
formulation of the Strategies for Urban Planning. The process continued with the Urban
Transport Plan (PCT), approved in 1997, the Primary Road Network Plan, approved in
2001 and the Urban Master Plan, approved in July 2003 and adopted in June 2004.
Two fundamental methodological innovations were introduced in the transportation
planning process. The first was to bring mobility, transport and urban system under a
single planning process. The second was to draw up a systemic plan rather than a list of
separate, uncoordinated interventions (Camerlingo, 2000).
This plan, approved by the Town Council on July 2003, is an innovative planning
instrument. Defining “metro stations as an occasion for urban renewal”, it governs the
transformation processes planning both interventions on the public transportation
system and on the urban land-use system. The plan is directed to reduce the Neapolitan
metropolitan area with its increasing car dependency, expanding the influence area of
each station and increasing the accessibility from the public transportation system to
major urban activities.
Page 58
34 Accessibility Instruments for Planning Practice
The analyzed application is an extreme case of integration between transportation and
land-use planning. The approach used to define the planning methodology is a holistic
approach, according to which the mobility system and the land-use system are
integrated as far as the activity locations in the territory and the opportunity of
displacements offered is concerned.
The strategies and the effects of the plan are evaluated and measured with the support
of an integrated transport model and by a 100 Stations GIS, which integrates
transportation infrastructure data, socio-economic data, pedestrian paths times and
costs, location of major urban activities and specifications of the major projects of
urban transformations in the new stations’ influence areas.
The relevance of this work to planning consists in providing a methodology for the
definition of an land-use and transportation plan as well as a decision support tool for
governing the urban transformation processes.
The strategies to attain these goals consist of the development of an integrated and
balanced transport system, the integration among the transport supply interventions
and the travel demand measures, the available financial resources and the system’s
economic efficiency. These strategies have been translated into some operational
measures. For the public transport system in particular, the plan defines the network
integration of the existing lines, the extension of the influence area of the existing lines,
through the realization of new stations, the development of new rail axes, the definition
for the bus system as the feeder function to the rail transport network (Comune Di
Napoli, 1997). The Urban Transport Plan (PCT) faces for the first time in systematic way
the problem of the accessibility to the rail lines. The interventions of the Urban
Transport Plan are imposed by travel and accessibility demands and vice versa, new
urban locations are been influenced by the accessibility offered by the rail lines. In fact,
this strong connection was underlined, defining the Urban Transport Plan as an integral
part of the Urban Master Plan (PRG). The interrelations between the urban planning
choices and the Urban Transport Plan are first of all those to locate trip attractiveness
activities in accessible areas. The stations assume the role of central element around
which the urban renewal and regeneration of the urban system is reorganized
(Cascetta, 2001).
The 100 Stations Plan is inserted into this process of integrated transport land-use
planning and represents the last footstep of the planning process. Starting from the
programmatic indications of the Urban Transport Plan (PCT), it is oriented to increase
the accessibility to the rail transport system stations and to implement processes of
urban renewal in the new stations’ influence areas. The 100 Stations Plan proposes to
increase and to regenerate the territory served by the rail transport system, with
interventions oriented to improve the accessibility from and to the 100 stations, to
improve the architectural quality of the station buildings and the urban quality of the
areas where the stations are located. The stations are defined as "occasions of urban
renewal" and, constituting the point of contact between the urban system and the
transport system, they represent some strategic nodes for the integrated planning of the
transport and the urban activities system (Comune Di Napoli, 2001).
Page 59
Chapter 2. Accessibility in Planning Practice 35
The tools and the analytical models for the impact verification of the different scenarios
and for the management of the transformations are a mathematical simulation model
and the 100 Stations GIS.
The decision support tools have been used in the study phase of the present state, in
the interventions definition phase and in the scenarios simulation phase.
The Geographical Informative System (GIS) has the purpose to acquire, to integrate, to
elaborate and to represent the geo-referenced data concerning the integrated transport-
land use system. The Stations GIS includes maps, geo-referenced transport supply data
(viability, rail stations, cars and bus stops), activities system data (census parcels data,
location of activities), influence stations areas data (census parcels belonging to the
station’s influence areas), transport supply and demand interaction data (ingoing and
outgoing persons from the stations and the percentage of the access modes to the
stations from 7.00 to 9.30 a.m.).
The interrelations between the urban planning choices and the Urban Transport Plan
are first of all those to locate trip attractiveness activities in accessible areas. The
stations assume the role of central element around which reorganizes the urban
renewal and regeneration of the urban system (Cascetta, 2001).
The relevance of this work to planning education and practice consists in providing a
methodology for the definition of a land-use and transportation plan as well as a
decision support tool for governing the urban transformation processes. In fact, with the
aid of this decision support tool, three scenarios for the study case of Municipio station
were defined: a “transportation” scenario, an “archaeological” scenario and an
“integrated” scenario. This leads to the project of a metro station which is also an
outdoors archaeological museum, ensuring the development of the urban environment
quality.
2.5.2 Bahn.Ville 2
Bahn.Ville 2 was an application-oriented French-German research cooperation on
railway-oriented development in the years 2007-2010. Based on the empirical findings
of the preceding project Bahn.Ville, Bahn.Ville 2 aimed at verifying these findings
through their successful implementation within two case study projects: the railway
corridor between St. Etienne and Firminy in the French region Rhône-Alpes and the
German Taunusbahn corridor in the metropolitan region Frankfurt/Rhein-Main (cp.
L’hostis et al. (2009) for French project; Bahn-Ville2-Konsortium (2010) for German
project). Both of these case study projects used accessibility analyses to support the
local planning processes.
Methodologically, both teams used quite different approaches. While the French team
used a broad set of rather simple accessibility measures (infrastructure and contour
measures), the German team aimed at aggregating the available data within one land-
use - accessibility index, referring to the Australian Luptai (Land-use and Public
Transport Accessibility Index, cp. Pitot et al., 2005). Keller and Leysens (2011) have
conducted a comparative review of the two approaches, concluding that accessibility
planning frameworks need to deliver differentiated information that are able to provide
Page 60
36 Accessibility Instruments for Planning Practice
a “complete picture of a location’s accessibility” (ibid, p. 20) which can only be
transmitted by a set of differentiated indicators. These differentiated indicators should
be complemented by “guidance and methods that assist planners and decision-makers
in aggregating and weighting the different aspects of accessibility” (ibid, p.20). Finally
Keller and Leysens (2011, p. 20) conclude that “such tools and methods could also be
useful to develop a "knowledge of cooperation" among the planners and decision-
makers because they are easily understandable and facilitate the collaborative work
and create a "common language" “.
2.5.3 Scandinavia
The Denser Stockholm project (Regionalplanekontoret, 2009) is focused on
comprehensive planning at the regional level. This uses a densification potential
analysis model which can depict how the densification need, densification pressure,
densification room, and densification freedom together create the potential for urban
development. One of the key analyses for densification pressure potential has been the
analyses of spatial accessibility in street networks. The street network links the city’s
public spaces and is the basic prerequisite for integration and exchange. Streets, not
roads, that link urban districts and neighborhoods may present the strongest driver of
future urban development. Another key factor has been the accessibility to green
spaces which has been a focus question in terms of the Swedish densification debate.
When density is increased in urban areas with little green space, such as on brownfield
land, parks must be developed to create dense mixed use. Urban nodes that need park
development in conjunction with densification are particularly great, due to limited open
space and access to parks and nature areas. Peripheral parts of many other urban
nodes, however, are areas with very little need for park development when density
increases. The accessibility analysis is produced with the place syntax tool, an
application to MapInfo in GIS.
Figure 2.3 - Population density within 1 km /Spatial integration / Park access within 1
km in street network (REGIONALPLANEKONTORET 2009)
Page 61
Chapter 2. Accessibility in Planning Practice 37
Aalborg University have used accessibility to examine the relationships between town,
roads and landscape (Nielsen et al., 2005). The project aimed to analyze the changes
in urbanization and landscapes following the investments in motorways in Denmark
since the 1960´s - and to set up a vision for future developments and spatial relations
within motorway corridors. Accessibility analysis has been used to find out how many
workplaces that can be reached within 30 minutes by car.
Figure 2.4 - Workplace accessibility in Denmark (Nielsen et al., 2005)
Page 62
38 Accessibility Instruments for Planning Practice
2.5.4 Regional and national accessibility in Spain
There are several cases in Spain (Monzón et al., in press; López, 2009) where some
methodologies have been validated to assess the spatial equity or the territorial
cohesion impacts of transport infrastructure plans based on the calculation of
accessibility indicators.
The authors evaluate different transport infrastructures, such us: High Speed Rail (HSR)
extensions or the Spanish Strategic Transport and Infrastructure Plan using different
accessibility indicators. The case study applications show that the results are heavily
influenced by the selection of the accessibility indicator, each one providing a
complementary perspective on equity measurement.
In addition, they evaluate the effects at different planning levels: cities, regions, nations
and adjacent regions. They demonstrate that the accessibility improvement and
distribution caused by a new transport infrastructure depends on the study area
considered.
The procedure uses spatial impact analysis techniques and is based on the
computation of accessibility indicators, supported by a Geographical Information
System (GIS).
Their main findings are:
The selection of the most appropriate indicator depends on the approach of the study. If
the analysis is more focused on the economic implications of equity effects, one should
choose an indicator with an economic foundation, such as the potential indicator. If our
interest is more inclined towards an evaluation of the transport network quality, we
should choose a more infrastructure-oriented indicator, such as the network efficiency
indicator.
Accessibility benefits located outside the borders of the country under consideration
should not be left out of the planning process. They have shown to constitute important
additional benefits, which should justify a co-financing of the corresponding transport
infrastructure investments.
In the analysis of HSR networks, there are several variables driving these differences in
the cohesion results. First, they are explained mainly by the combination of population
density distribution and the location of HSR stations. Second, the relative starting
situation – in terms of accessibility – of the area and third, the quality of the access
provided by the transport network from cities without a HSR station to the HSR network.
The risk of spatial polarization posed by HSR can clearly be seen in the Spanish case
study. After the HSR extension, higher accessibility values are concentrated in the
surroundings of HSR stations. The presence of HSR stations causes the existence of
‘‘islands’’ with enhanced levels of accessibility, and shadow areas in isolated locations.
The size of these ‘‘islands’’ depends on the quality of the transport network from the
surrounding cities to the nearest HSR station.
Page 63
Chapter 2. Accessibility in Planning Practice 39
Other studies (Condeço-Melhorado et al., 2011; Gutiérrez et al., 2011) focus on the
issue of spatial spillovers of transport infrastructure investment, where spillovers are
defined as those accessibility gains felt in one region due to transport infrastructure
built in other region.
The main objective of the study is a methodological proposal to measure spillovers
based on accessibility indicators. The methodology was applied to evaluate the impacts
of roads foreseen in the Spanish transport master plan (2005-2020). However this
methodology can be applied to other transport modes. Impacts of the Spanish transport
master plan were evaluated as accessibility gains and monetary gains.
The main results show that new roads in Spain will generate important spillovers, that is,
accessibility gains will overpass the regional boundaries were they are allocated. On
average 59% of the investment made by the Spanish Government in one particular
region is exported to other regions due to spillovers. But spillovers are not
homogeneous; their spatial distribution is influenced by several factors, such as:
Distance to the new infrastructure: spillovers decrease with distance to the
new road;
Orientation of new roads: spillovers follow the direction of new roads, if a road
has a North-South direction, the regions in the North and South of the section
are better off than those located to the West and East;
Spillovers of central regions are higher than those of peripheral regions,
because the former bear more interregional traffic and benefit more bilateral
relationships;
Spillovers have a direct relationship with the amount invested in new roads:
The location of the new highways within the region is an important factor.
Since spillovers decrease with distance to the new roads, they are higher when
roads are located in the regional border.
This tool has been applied in a post evaluation study of the Spanish transport master
plan (2005-2020) funded by the Ministry of Public Works (Gutierrez et al., 2010).
However this measure has only been applied by academics. In our case we have applied
this tool to measure the spillover effects of implementing different toll schemes in the
interurban roads in Spain (Condeço-Melhorado et al., 2011) or to evaluate spillovers of
TEN-T projects using as case study a motorway linking Poland with Czech Republic,
Austria and Slovakia (Gutiérrez et al., 2011).
In every case, results show that investments in one region will generate accessibility
impacts outside their boundaries (spillovers). This can be an important issue, especially
in decentralized governments, since investment undertaken by individual regions or
states may generate spillovers that are higher than the benefits for the region itself.
When this occurs, spillovers can be used as a tool to negotiate some kind of national
aid or participation of the most benefited regions in funding transport investments.
Page 64
40 Accessibility Instruments for Planning Practice
2.5.5 Space Syntax
There are many urban projects in practice where the space syntax methodology has
been applied and even more research projects conducted around the world. Most of the
urban projects in practice can be found in the websites of the practice Space Syntax Ltd
(www.spacesyntax.com), of the practice Spacescape (www.spacescape.se) and a few
in the proceedings of the Space Syntax Symposia (www.spacesyntax.net). Just a few
representative ones are cited here.
Jeddah Strategic Planning (conducted by Space Syntax Ltd for the Municipality
of Jeddah, Saudi Arabia, source: www.spacesyntax.com):
Space syntax was commissioned by the municipality of Jeddah to create a spatial
development strategy for the city. The accessibility analysis aimed towards an evidence-
based development strategy of the city by strengthening the city centre and its
immediate surroundings by proposing new developments. The analysis helped first of all
to identify and to understand the existing patterns of density, land use and socio-
economic settlement and second to test different solution strategies and their impact.
The outcome was urban design guidelines for each development area. The Strategic
Planning Framework has been adopted by the Municipality of Jeddah in 2006 and is
part of the emerging Jeddah Plan.
According to Space Syntax Ltd, questions that are addressed in the accessibility
analysis for regional and urban projects like this one are:
How much beneficial movement can be generated to and through the site?
Which are the key linkages in a site?
What impact the new development is likely to have on its setting?
What are the appropriate kinds and densities of new land uses?
Beijing CBD (conducted by Space Syntax Ltd for Beijing CBD Administration
Authority Chaoyang District Government, source: www.spacesyntax.com):
The brief for the competition of this project put significant emphasis on the themes of
sustainability and people-centred design. The aim of the team of which Space Syntax
Ltd was a member was to create a low carbon masterplan for the extension of Beijing’s
CBD. The problems of the area included high levels of vehicle traffic, high demands on
public transport infrastructure, energy-intensive buildings, shortage of public open
space and of convivial, non-commercial activities. Space Syntax contributed both
visionary design thinking by setting the guiding principles and objective urban
evaluation of the proposed spatial layout. The suggested masterplan includes a
sustainable transport system in which pedestrian movement, cyclists and public
transport usage are encouraged by connecting key routes for different transport modes
at every scale.
According to Space Syntax Ltd, the main questions that are addressed in the
accessibility analysis for masterplan projects like this one are:
Page 65
Chapter 2. Accessibility in Planning Practice 41
How should a masterplan design respond to the physical and environmental
potentials of a site?
How should the spatial layout be designed?
How should land use and density be distributed within this layout?
How can the social, economic and environmental impacts of development
proposals be forecast?
Rotterdam South (Van Nes et al., 2012):
The project presented in this paper is about the southern part of Rotterdam (more
problematic, there is no demand for development, high unemployment, immigrant
population) where the municipality wanted to test out various proposals for new bridges
connecting it to the city’s northern (more successful) part. A combination of three
spatial analysis tools: Spacematrix (measuring density), Space Syntax (measuring
integration) and Function Mix (measuring mix of functions) were used. These were
correlated to one another and with socio-economic data through GIS. The analysis of the
existing situation showed a correlation between the degree of mix of functions, density
and integration meaning that the higher the angular integration, the higher the mix of
functions and the density of the built mass. Based on this finding and on the analysis of
the existing situation at the city level, the areas which are offering the highest priority for
improvements were identified. These were those with high spatial integration of the
street network and with low density in built mass. The spatial data of these areas were
also combined with social data. Based on all this data a priority map for different types
of interventions in each area was defined. Based on this map the location of the new
bridge was chosen and this was tested with the same type of analysis to observe the
effect it would have in the area.
According to the authors, the planners from the municipality acknowledge that these
tools contribute to a much more fine-grained strategic planning for the area than the
current Dutch planning practice does (Van Nes et al., 2012, p. 8003).
The main questions that the above presented analysis attempted to address were (ibid,
p.8003):
What are the spatial conditions for the most attractive locations for lively
and vital urban areas with a balanced mixture of functions? Which areas are
more suitable than others to develop into quiet residential neighbourhoods?
What are the spatial and functional effects of a new bridge (including public
transport) connecting Rotterdam South to the North in relation to the first
question? How can it affect the functional and spatial potentials for
Rotterdam South?
2.6 Conclusions
While there are plenty of projects that apply accessibility measures in one way or
another, the amount of research done on their practical value and their usefulness is
still rather limited and fragmented.
Page 66
42 Accessibility Instruments for Planning Practice
While accessibility instruments in general are usually considered to bear the potential of
providing a “common language” for planners from different fields, there is still a risk of
indicators being too complex, abstract and therefore hard to interpret and comprehend
for non-modelers. On the other hand, there is also serious doubt to whether the more
simple accessibility indicators can really draw an adequately complex picture of real-
world planning problems. In a recent study about the practitioners’ perspectives of the
use of accessibility measures (Curl et al., 2011), there was recognition that using
measures of accessibility only tells part of the story and the real barriers to individuals'
accessibility are much more complex and harder to understand and quantify.
Interpretability generally appears to be in conflict with usability and because more
complex indicators aggregate more information with more sophisticated mathematical
methods, thus making them more abstract and less intuitively understandable. A first
goal must therefore be to make these data aggregation methods more transparent as
has been suggested by Keller and Leysens (2011). Nonetheless, at some point a trade-
off will have to be found between interpretability and complexity of measures as
claimed by Geurs and Van Eck (2001): the measures must provide the process with
enough input and stimulation to lead to adequate solutions. This can only happen if the
measures contain enough methodological substance to cover the relevant dimensions
of a planning problem. But it also needs to be understandable and interpretable for all
stakeholders involved.
To reach an ideal balance Straatemeier et al., (2010, p.588) demand “that research in
planning should adopt a more experiential case-study design” which means that
planning practice and academia should cooperate in order “to strike a balance between
rigour and relevance, between knowledge that is on the one hand theoretically and
empirically sound and on the other hand also useful for and valued by the practitioners
who have to use this type of knowledge.” (ibid, p. 588)
These findings describe the research agenda on how to arrive at useful indicators in the
sense of achieving an ideal balance between methodological accuracy and
interpretability of accessibility tools and indicators that promise to provide a common
language for planners from different fields (e.g. urban, transport, environment). While
this is without doubt a very important step towards more sustainable planning practices,
several case studies (especially the analysis of the UK Accessibility Planning scheme)
have shown that accessibility instruments, like all other planning tools, can also be
exploited for individual interests through tactical usage of these indicators in order to
support existing positions. A planning tool that can successfully contribute to a more
sustainable planning practice will therefore have to address not only planners and
experts that may see the world from different professional viewpoints but generally
share the objective of working for public welfare; it will rather have to reach
stakeholders from the private domain (companies, affected residents), non-profit
organizations (environmental or social interest groups) and certain politicians that tend
to prioritize individual interests over cooperative solutions that serve public welfare. A
useful planning tool will have to be able to make plain to all stakeholders how individual
interests can be reconciled with public interests and why cooperative strategies are
more beneficial to all involved players than just defending one’s own positions.
Page 67
Chapter 2. Accessibility in Planning Practice 43
Engagement with local authority practitioners involved in Accessibility Planning in
England (Curl, 2011) has highlighted the importance of understanding the local level,
household and individual accessibilities in addition to the aggregate, national or
regional picture if we are to properly understand the relationship between accessibility
and associated outcomes, and therefore target interventions appropriately. Accessibility
instruments and measures that help in different levels of planning can be
complementary.
Page 68
44 Accessibility Instruments for Planning Practice
Page 69
Chapter 3. ACCESSIBILITY INSTRUMENTS
Luca Bertolini (coordinator), Derek Halden, Sanna Iltanen, Bruno Santos
Page 70
46 Accessibility Instruments for Planning Practice
Page 71
Chapter 3. Accessibility Instruments 47
In this chapter, the accessibility instruments participating in the Action are described. As
stated in the Memorandum of Understanding, these are the instruments that will be
applied and improved in the course of the Action, in order to improve their usability and,
with it, the effectiveness of instrumental support for accessibility planning in Europe.
The reports follow a similar format, in response to the guidance that was sent to the
participants in the action and which is reported in Appendix A. The authors were asked
to report on the background of the accessibility instrument (its scientific and/or
practical motivation), its conceptual framework and theoretical underpinnings ,
operational aspects , relevance for planning practice, and strengths and limitations
(with an eye at future improvements). In addition, they were asked to include some
representative visualizations of the instrument output. In the last section of the chapter
(section 3.23), the instruments y are compared with each other on each of these
dimensions in order to identify the most salient similarities and differences and
implications for the next steps of the Action. In the concluding part of this report
(Chapter 5), these conclusions are integrated with those from other chapters.
Page 72
48 Accessibility Instruments for Planning Practice
Page 73
Chapter 3. Accessibility Instruments 49
3.1 Spatial Network Analysis for Multimodal Urban
Transport Systems (SNAMUTS)
Author of report: Carey Curtis, Jan Scheurer, Roger Mellor
Organisation: Curtin University/ RMIT University/ Curtin University
Address: Curtin University of Technology, GPO Box U1987, Perth Western Australia.
6845
E-mail: [email protected] ; [email protected] ; [email protected]
3.1.1 Background
The Spatial Network Analysis for Multimodal Urban Transport Systems (SNAMUTS)
accessibility instrument was developed to fill a significant gap in planning for
accessibility by providing a planning support tool that can be used to inform strategic
land use and transport planning. Its first application was in providing a comparison of
metropolitan accessibility by public transport for three centres within Greater Perth,
Western Australia. Following this use it became clear that our instrument could be
applied in a wide range of settings. As a result our research over the past five years has
focussed on its use to support government decision making on re-structuring of
metropolitan urban form to support public transport (and vice versa) and developing a
twenty year investment strategy for public transport services and new infrastructure. To
answer these types of questions we realised that the instrument needed to be
developed in a way that could forge constructive collaborations between transport and
land use planning agendas. The tool needed to have a function of trans-disciplinary
communication in order that land use transport integration be fully understood and
achieved. A focus on accessibility can introduce land use considerations into
conventional transport models, and conversely, land use planning can be enhanced by
better understanding of the mobility implications of particular urban forms. It was also
important for us to develop an instrument whereby the dissemination of accessibility
measures through visual media offered a means to enhance understanding, making a
contribution towards a productive discourse on future directions for urban form and
mobility, engaging a wide range of stakeholders and thus helping to bring this important
challenge further into the public arena.
3.1.2 Conceptual framework and theoretical underpinnings
SNAMUTS is a GIS-based tool to assess the relationship between public transport
network configuration, performance and service standards on the one hand, and the
geographical distribution or clustering of land use activities across a metropolitan area
on the other hand.
SNAMUTS breaks down the land use-transport system into a set of activity nodes and
route segments derived from the hierarchy of activity centres identified in strategic
Page 74
50 Accessibility Instruments for Planning Practice
planning documents, and the location and service standard of public transport routes.
In particular, SNAMUTS makes the following definitions:
Minimum service standard: SNAMUTS defines a minimum standard for inclusion of a
public transport route into the analysed network, requiring a service frequency of 20
minutes (or better) during the weekday inter-peak period (about 10.00 to 15.00) and 30
minutes (or better) during the day on Saturdays and Sundays. This level has been
chosen as it reflects the minimum for public transport to be perceived as having a full-
time presence and attracting usage for a variety of both planned and spontaneous
journey purposes. More specifically this approach aims to set public transport
accessibility on a level playing field with accessibility by car, thus providing the real
possibility for the traveller to choose between modes. In so doing this sets a standard
for design of the future transport service (and land use patterns) where accessibility by
public transport is possible for as many travellers across the metropolitan area as
possible (where accessibility by public transport is the objective of governments).
Activity nodes: these refer to the list of higher-order activity centres across a
metropolitan area (principal, major and specialised) that appear in strategic planning
documents such as Melbourne 2030 and Melbourne @ 5 million or Perth’s Network City
and Directions 2031. There are also some major transfer points and some linear
corridors along high-frequency tram or bus lines captured where they play an important
role in the network. In some cases, a designated activity centre may contain more than
one SNAMUTS activity node.
Each activity node is assigned an exclusive catchment of residents and jobs located
within walking distance from the associated rail station(s) (800 m) or tram/bus
corridors (400 m). Wherever two or more of these catchments overlap geographically,
the residents and jobs are distributed in equal parts among the associated activity
nodes. In effect, every resident and job within walking distance from a minimum-
standard public transport service has been assigned to one, and only one, activity node
catchment.
Travel impediment: SNAMUTS measures spatial separation, or spatial resistance (a
proxy value for distance) by relying on the units that are closest to the public transport
user experience, namely travel time and service frequency. Each route segment is
labelled with an impediment value consisting of the average travel time divided by the
number of services per hour, separately for each direction, and multiplied by a factor of
8 to arrive at more readable numbers. The travel impediment (proxy distance) between
any two activity nodes on the network is thus made up of the sum of the impediment
values on each route segment passed along the path. Another indicator adds to this by
considering the transfer penalty on public transport (see below).
3.1.3 Operational aspects
SNAMUTS utilises six indicators (see Curtis & Scheurer, 2010) including:
Closeness centrality describes the ease of movement along the public transport
network, in terms of speed and service frequency.
Page 75
Chapter 3. Accessibility Instruments 51
Degree centrality describes the directness of journeys along the public transport
network. It is a topological network indicator, measuring the minimum number of
transfers between each pair of activity nodes.
Contour catchments measure the combined effect of public transport speed and land
use intensity. This index determines the number of residents and jobs within the
walkable catchment areas of activity nodes that can be reached within a public
transport travel time of up to 30 minutes from the reference node.
Speed comparison measures the competitiveness of public transport against the car.
The index determines the travel time ratio between public transport and road travel (in
typical congested conditions) for the path between each pair of nodes.
Betweenness centrality captures the geographical distribution of attractive travel paths
between each pair of nodes across the network. It shows concentrations of ‘movement
energy’ generated by the travel opportunities the network provides, or in other words, to
what extent an activity node is located ‘at the crossroads’ of public transport supply. It
essentially identifies those transport routes that will be traversed the most
(cumulatively) by journeys between different pairs of centres after all potential journey
combinations are considered.
Nodal connectivity measures the strength of each activity node for (multimodal)
integration of services. It captures the suitability of activity nodes for making transfers
or breaks of journey with minimal disruption to the flow of movement.
Composite indicator for overall public transport accessibility is compiled from the figures
for each of the above indicators. They are converted to a scale from approximately 0 to
10 to afford them roughly equal weighting. Higher values indicate greater accessibility.
The composite index is commonly visualised on a scale map of the metropolitan area,
highlighting the geographical catchment areas of each activity node in traffic light
colours according to their composite score.
Two further measures can be drawn from the SNAMUTS database and are utilised to
highlight network characteristics that facilitate comparisons between cities or along
time lines within the same city.
Service intensity describes the number of vehicles for each mode that are in
simultaneous revenue service during the reference period. It is given as a total as well
as relative to metropolitan population. Service intensity is a two-sided measure: it
illustrates both the generosity (or not) of a public transport operator or agency to
provide operational resources, and the efficiency of their dispatchment. Thus the ratio
between service intensity changes and shifts on the accessibility measures can help to
determine the efficacy (or not) of initiatives to expand (or cut) public transport services.
Network coverage is an aggregate, network-wide indicator of the previously described
contour catchment measure, extracted by overlaying all defined activity node
catchments and then counting the percentage of metropolitan residents and jobs
contained within them. Network coverage can illustrate the growth (or shrinkage) over
time of the proportion of the metropolitan area that is accessible by public transport
Page 76
52 Accessibility Instruments for Planning Practice
services of the SNAMUTS minimum standard, and can benchmark this proportion for
comparisons between cities.
The evolution of public transport accessibility over time is also captured in the global
and local efficiency change index. This index delivers a percentage figures for the
improvement (or deterioration) of public transport accessibility at each activity node
(local efficiency), as well as for the network as a whole (global efficiency), following
changes in service levels, network configuration and/or land uses. It does this by
comparing the minimum travel impediment (closeness centrality) for each pair of nodes,
weighted by the product of the number of activities (residents and jobs) at either node,
before and after the changes.
Most recently, a network stress index has been developed that takes in the
aforementioned segmental betweenness index and draws a ratio with the actual
quantitative ability of the public transport service to move passengers. This index is
designed to highlight where in the network the concentration of travel opportunities
generated by the land use-transport system appears to outstrip, match or remain below
the carrying capacity offered by the transport mode(s) and service levels on the route
segment in question (Scheurer & Woodcock, 2011).
3.1.4 Relevance for planning practice
SNAMUTS identifies and visualises a land use-public transport system’s strengths and
weaknesses in a coherent mapping exercise, considering geographical coverage; ability
and efficiency to connect places of activity; strategic significance of routes and network
nodes; and, speed competitiveness between public transport and car travel.
The SNAMUTS tool has so far been applied in several collaborative ventures with land
use and transport planning agencies as well as academic partners in Perth, Melbourne,
Hamburg and more recently Porto and Copenhagen (Scheurer, 2009; Scheurer, 2010).
In Perth, the completion of a 72-km radial suburban railway in late 2007 provided an
opportunity to test the SNAMUTS model on a real-life, before-and-after comparison of
network performance and service levels, as well as the broader role of public transport
in the mobility mix of the Western Australian capital. Our analysis demonstrated how
accessibility by public transport changed across the metropolitan region, with effects
beyond the simple view of improvements along the new railway itself. In addition, the
analysis highlighted the way in which improvements to network accessibility open up
considerable possibilities to improve land use opportunities at locations with improved
accessibility (Scheurer & Curtis, 2008).
By developing an interactive decision tool we assisted in the examination of scenarios
for activity centres framed around the accessibility of the transport network and the
accessibility of place. Testing these factors through a scenario approach enabled key
planning questions to be examined:
Which activity centres could best be intensified?
Which centres should perform a regional role and which ones a local role?
Where should public transport investment (infrastructure, service
improvement) go?
Page 77
Chapter 3. Accessibility Instruments 53
The data and ideas being fed into SNAMUTS were drawn from work in progress within
the agencies. This research project as well as the earlier accessibility ranking data
informed the next iteration of the metropolitan planning strategy and the outcome has
been the release of the ‘Directions 2031’ strategy (Curtis & Scheurer, 2009).
A project for the State Public Transport Authority (PTA) in 2010 employed SNAMUTS to
evaluate the PTA proposals) for the next 20 years investment in public transport for
greater metropolitan Perth. The PTA in developing their strategy wanted to test how well
the proposed network and service performed in relation to enhanced public transport
accessibility to key activity centres.
In 2009 SNAMUTS has been used to benchmark public transport accessibility between
cities – Melbourne and Hamburg (Scheurer, 2009). SNAMUTS was used to determine
how the public transport networks in both cities are configured, how responsive they are
to the geographical distribution and concentration of residents and jobs across the
urban structure, and how capable to provide accessibility and convenience of travel
across the metropolitan area.
SNAMUTS is a tool designed to assess the impact of network and land use changes in
the past and the future. This is the case regardless of whether such changes are the
outcome of deliberate planning efforts such as policy decisions to expand or cut public
transport service or to pursue transit-oriented development schemes, or of self-
regulated processes such as the deterioration of service quality due to traffic congestion
or market-led urban development along or away from public transport facilities.
SNAMUTS was again used as a comparative tool for longitudinal analysis along the
recent example of the introduction of an orbital bus service (Route 903) through
Melbourne’s middle suburbs in April 2009.
3.1.5 Strengths and limitations
The relative accessibility of activity centres and network nodes can be determined by
SNAMUTS and used to inform decisions about both public transport network
configuration and about land use intensification in the catchment areas of nodes and
corridors that gain in accessibility. This tool is well-suited to inform local area planning
to add detail to the strategic directions spelled out in a metropolitan planning strategy,
and to identify gaps in public transport service that need to be addressed to achieve the
congruence of movement and land use the document aspires to. It is also well-suited to
inform priorities for the future expansion of public transport infrastructure in the Perth
metropolitan region.
SNAMUTS planning decision support tool has been employed by using a discursive
approach, in a way not common to the development or use of traditional transport
models. Indeed where research has been conducted into the utilisation of knowledge
derived from analytic planning techniques it is apparent that there is little evidence of
its use or effectiveness by decision-makers (Sager & Ravlum, 2005). In recognising this
problem, our aim was to design SNAMUTS in such a way that it could be easily
understood and ‘owned’ by decision-makers as a means to utilisation in decisions.
SNAMUTS design, including the simple rationale in measuring the network from the
personal traveller perspective and the use of visual mapping outputs, is aimed at
Page 78
54 Accessibility Instruments for Planning Practice
promoting deliberative processes that can be appreciated by a wide range of users, not
just those with mathematical modelling expertise.
In terms of the usefulness of SNAMUTS, workshop participants have indicated that its
value goes beyond simply providing knowledge on public transport networks or future
urban form. While SNAMUTS demonstrated the possibilities for measuring public
transport accessibility, some of the highest ratings were for the use of the tool in
governance—especially the value of the tool in communicating decisions to the public
and in aiding collaboration across the professional groups. In commenting on the
particular SNAMUTS indicators, workshop participants indicated the two greatest
strengths were the visual composite maps (Figure 3.1) and the way in which speed of
travel by public transport and car travel can be compared. The interviewees added to
this indicating that by seeing accessibility plotted provided the department with
measurements, before this they had relied on anecdotal evidence. They also noted that
when the transport outcomes were mapped it became clear that there had not been,
but needed to be, a land use response where accessibility had not improved.
Participant’s also identified—‘its ability to explore supply-led scenarios’; the way in which
it generates an index of accessibility, noting that this was based on theoretical
connectivity rather than actual use; and the way it ‘is easier to recalibrate for differing
scenarios’. In relation to the traditional transport models, one noted that there was ‘no
comparison, different purposes’.
We continue to develop the instrument, in particular we are applying it to cities around
the world as part of a project looking to inform the Australian government as to an
appropriate benchmark for public transport accessibility in order to inform infrastructure
investment and priorities.
3.1.6 References
Curtis C, Scheurer J (2009) Network City Activity Centres. Developing an Analysis,
Conception and Communication Tool for Integrated Land Use and Transport Planning in
the Perth Metropolitan Area. Research Monograph, Department of Planning and
Infrastructure (DPI) and Curtin University of Technology, Perth (WA), available online at
www.abp.unimelb.edu.au/gamut/pdf/perth-snamuts-future-scenarios-19june09.pdf
Curtis C, Scheurer J (2010) Planning for Sustainable Accessibility: Developing Tools to
Aid Discussion and Decision Making. Progress in Planning, Vol 74, No 2
Sager T, Ravlum I A (2005) Interagency Transport Planning: Cooperation in a Loose
Policy Network. Chapter 16 in Albrechts L, Mandelbaum S J (2005, Eds) The Network
Society: A New Context for Planning? Routledge, Abingdon, UK
Scheurer J (2009) Public Transport and Land Use Integration in Melbourne and
Hamburg: Can Comparative Network Performance Provide a Sense of Future Direction?
4th State of Australian Cities Conference, Perth (WA), November 2009
Scheurer J (2010) Benchmarking Accessibility and Public Transport Network
Performance in Copenhagen and Perth. 33rd Australasian Transport Research Forum
(ATRF), Canberra (ACT), September 2010
Page 79
Chapter 3. Accessibility Instruments 55
Scheurer J, Curtis C (2008) Spatial Network Analysis of Multimodal Transport Systems:
Developing a Strategic Planning Tool to Assess the Congruence of Movement and Urban
Structure. Research Monograph, Curtin University Sustainability Policy Institute (CUSP)
and Australian Centre for Governance and Management of Urban Transport (GAMUT),
Perth (WA)/Melbourne (VIC), June 2008, available online at
www.abp.unimelb.edu.au/gamut/pdf/perth-snamuts-report.pdf
Scheurer J, Woodcock I (2011) Transforming Melbourne through Transit Oriented
Intensification: Implications for public transport network performance, accessibility and
development densities. 5th State of Australian Cities Conference, Melbourne (VIC),
November/December 2011
3.1.7 Figures
Figure 3.1 SNAMUTS visual output clearly shows accessibility changes with the
implementation on a new rail corridor and a bus network reconfigured to act as a feeder
service.
Page 80
56 Accessibility Instruments for Planning Practice
Page 81
Chapter 3. Accessibility Instruments 57
3.2 Retail Cluster Accessibility (TRACE)
Author of report: Ann Verhetsel, Jeroen Cant & Thomas Vanoutrive
Organisation: University of Antwerp
Address: Prinssstraat 13 – CST S.B. 412, 2000 Antwerpen, Belgium
E-mail: [email protected]
3.2.1 Background
The main motivation for developing this accessibility instrument was the need for a new
retail policy in Belgium (Flanders). In the past, Belgium used economic restrictions in its
retail policy. The European Directive on services in the internal market (Directive
2006/123/EC of the European Parliament and of the Council (European Union, 2006);
commonly referred to as the Bolkestein Directive) states that as of 2009 such
restrictions are no longer allowed. It is however still possible to use restrictions in retail
policy, mainly arguments of spatial planning are tolerated. Such a policy requires
intricate insights in the retail landscape. However, current decision taking is limited to a
case by case approach based on expert knowledge since the necessary coordination
and tools are not available. We therefore designed this tool to analyse the retail
landscape of Flanders and as a possible aid for developing a new restrictive retail policy
based on spatial planning.
The scientific research questions are how retail spreads along the landscape and why,
in other words what are the parameters which determine the location of retail
companies. Furthermore the potential influence of policy on retail sprawl is under
scrutiny. In the first place we want to test to what extent the parameters of the classic
spatial interaction models are still valuable. In this reasoning accessibility to both supply
and demand is crucial.
The main planning problem we want to address is the following: there are sound
socioeconomic reasons to limit retail sprawl, such as protecting open space (Flemish
Government, 2011), sustainability (see for example Newman et al (1995), Banister
(1999, 2007 & 2008), Burton (2000), Kennedy et al (2005), Kenworthy (2007) and
Glaeser & Kahn (2010) on the sustainability of compact cities), mobility issues
(Boussauw et al, 2011), the rise of the knowledge economy and the associated rise in
importance of the vibrancy of cities (van den Berg, 1999; van den Berg & Braun, 1999;
van den Berg et al, 2004; van Winden et al, 2007; Whisler et al, 2008; Yigitcanlar et al,
2008) and the social role of retail (Harvey, 1973) (particularly food retail, cf. food
deserts (see for example Clarke et al (2002), Guy et al (2005) and Zenk et al (2005))).
Governments all across Europe want to spatially restrict the sprawl of retail firms
(Davies, 1995; Guy, 1998; Péron, 2001). In this regard policy in many European
countries has failed (Davies, 1995; Guy, 1998; Péron, 2001). Contrarily, a spatial
restrictive policy might lead to a drop in productivity and consumer welfare (Evers,
2001; Griffith & Harmgart, 2008; Haskel & Sadun, 2009; Cheshire et al, 2011;
Page 82
58 Accessibility Instruments for Planning Practice
Matsumura & Matsushima, 2011). The tool can aid in developing a spatially restrictive
policy that takes both retail sector productivity and welfare into account.
3.2.2 Conceptual framework and theoretical underpinnings
The retail landscape is the outcome of the location decision of retail companies. This
decision process is mainly determined by the accessibility of the available locations
(already defined by Christaller (1933)). The government influences accessibility and
location decisions via a wide array of policies, ranging from transport and land-use
planning to fiscal and social measures. Accessibility can here be defined as the ease of
reaching a shop by potential consumers. In general customers prefer a varied supply of
shops. As a consequence it is an advantage in the retail sector to locate close to
competitors and other retailers (Arentze et al, 2005). Hence, our tool primarily focuses
on the delimitation of retail clusters. The location, size and composition of clusters are
correlated to the accessibility of the site. Gravity based accessibility measures and
infrastructure based accessibility measures seem to be appropriate estimators of the
retail landscape since they incorporate population (demand), infrastructure and
distance characteristics.
3.2.3 Operational aspects
Given the fact that we have geo-referenced data of shops at our disposal, we can
employ a multitude of accessibility measures, including gravity type potential
accessibility measures and infrastructure based accessibility measures. In practice we
are able to measure the distance of retail clusters to relevant infrastructure, such as the
nearest train station and major roads.
The data input from the tool comes from the Locatus database (Locatus, 2012).
Locatus data are available for Belgium, Luxemburg, the Netherlands and a selection of
major European cities. The databases include information on coordinates and
addresses of individual shops, detailed information on the type of retail, the type of road
a store borders, the net floor surface of shops (limited) and the type of shopping area.
The database for Flanders, Belgium was provided free of charge to the Department of
Transport and Regional Economics of the University of Antwerp as support for research
for the Flemish Government. Ideally one would use this or similar data as input for the
tool. An analysis can already be made using basic geographical information on the
location of stores. To fully explore the possibilities of the tool, one would ideally have
information on the type of retail and the size of shops or length of the store front.
The tool has been developed using Model Builder in the ArcGIS 10 suit, developed and
distributed by ESRI. The first part of the tool (to calculate clusters) requires no further
extensions. The second part (to calculate distances) requires the Spatial Analyst
extension. Currently the tool works with Euclidean distances. It is possible to upgrade
the tool to include real distances. The Network Analyst extension is then required. The
tool works best in ArcGIS 10, but has been tried and tested in ArcGIS 9.3 to satisfactory
results. To calculate clusters for a set of 34000 records a mid range laptop (PC specs:
dual core 1.3 GHz, 4Mb RAM) requires about 1 to 1.5 hours. ArcGIS is not publicly
available, and comes at a significant cost, but is widely used.
Page 83
Chapter 3. Accessibility Instruments 59
Both performing the calculations and interpreting the results of the calculation is
relatively easy. The tool is very intuitive and user friendly and can therefore be used by
anyone with a basic understanding of GIS software. This means that the tool can also be
used with limited support by non-professionals in small cities and companies enlarging
the chance of a better application of policy on an operational level. More experienced
users will find it easy to tweak the tool to fit their specific needs, to adjust the tool to
different data, to solve related problems or create interactions with other tools.
It is important to note that in our database no data is grouped into a higher level, i.e. no
data is grouped at the statistical ward or municipal level. If this is the case some further
statistical methods have to be included, as was discussed by Sadahiro (2003).
3.2.4 Relevance for planning practice
The tool has not yet been introduced in practice, but it has been developed and tested
within policy research for the Flemish Government to analyse the retail landscape of
Flanders and possibly as an aid and input for a new retail policy. Also lower tiers of
governance, such as provinces and municipalities, have shown interest in applying the
tool and a few are testing it. We have a great deal of confidence that the tool will
eventually be used in practice.
As was said Belgium needs to change its retail policy because of the Bolkestein
Directive which aims to liberalise the European services market. We have noticed from
an extensive literature review that from a planning point of view spatial restrictions are
a good tool and are to be preferred over economic restrictions (see also Davies (1995),
Guy (1998) and Péron (2001)). However some cases described in the available
literature, in casu the Dutch case, show that a retail policy based on strict spatial
planning can lead to losses in sector productivity and possibly a drop in consumer
welfare (Evers, 2001). Since Belgium has more urban sprawl than the Netherlands and
Germany, a policy based on strict spatial planning in the Dutch or German style may
lead to even more detrimental results. The tool is able to show which areas are
interesting for retailers to invest in, areas where they can fulfil their economic needs, by
linking clusters to socioeconomic location factors. Such locations can then be
associated to areas which the government itself wants to develop. Thus the needs of
society and the economic requirements of private companies can be matched.
3.2.5 Strengths and limitations
Academic research in retail planning policy has significantly slowed down the last
decade. Most of the available literature is thus rather dated. The actual tool will allow
further investigation of the location of retail and the influence of planning on the
location of retail in the 21st century. A weakness of the tool is that it now only allows for
a cartographic analysis. In future updates of the tool more spatial econometric outputs
will be calculated.
The most important practical benefit of the presented tool is the ease of use of the
instrument and the straightforward interpretability of the results. This means on the one
hand that the tool can also be used at the municipal level where the planning policy in
Belgium is actually operationalized. On the other hand the instrument is not a black box
Page 84
60 Accessibility Instruments for Planning Practice
and allows experienced users to tweak its functionality, which significantly increases the
usability of the tool and permits interactions with other instruments. An important
hindrance in bringing the tool into practice is the data requirements. As was already
explained, the tool uses expensive databases. These databases need to be updated
regularly which leads to high fixed costs. Many cities in Europe however have an
increasing interest in retail developments as they start recognizing the influence of retail
on liveability, both in an economic and social way. As such they are starting to provide
data on the matter.
3.2.6 References
Arentze, T. A., Oppewal, H. & Timmermans, H. J. P. 2005. A multipurpose shopping trip
model to assess retail agglomeration effects. Journal of Marketing Research, 42, 109-
115.
Banister, D. 1999. Planning more to travel less. Town Planning Review, 70, 313-338.
Banister, D. 2007. Is paradigm shift too difficult in UK transport? Journal of Urban
Technology, 14, 71-86.
Banister, D. 2008. The sustainability paradigm. Transport Policy, 15, 73-80.
Bousauw, K., van Acker, V. & Witlox, F. 2011. Excess travel in non-professional trips:
Why look for it miles away? Tijdschrift voor Economische en Sociale Geografie, 103, 20-
38.
Burton, E. 2000. The compact city: just or just compact? A preliminary analysis. Urban
Studies, 37, 1969-2001.
Cheshire, P., Hilber, C. A. L. & Kaplanis, I. 2011. Evaluating the effects of planning
policies on the retail sector: or do town center first policies deliver the goods? SERC DP
66.
Christaller, W. 1933. Die Zentralen Orte in Süddeutschland. Eine ökonomisch-
geographische Untersuchung über die Gesetzmäßigkeit der Verbreitung und
Entwicklung der Siedlungen mit städtischer Funktion. Jena: Fischer.
Clarke, G., Eyre, H. & Guy, C. 2002. Deriving indicators of access to food retail provision
in British cities: studies of Cardiff, Leeds and Bradford. Urban Studies, 39, 2041-2060.
Davies, R. L. (ed.) 1995. Retail planning policies in Western Europe, London: Routledge.
European Union. 2006. Directive 2006/123/EC of the European Parliament and of the
Council of 12 December 2006 on services in the internal market. Official Journal of the
European Union, 376, 36-68.
Evers, D. 2001. The rise (and fall) of national retail planning. Tijdschrift voor
Economische en Sociale Geografie, 93, 107-113.
Flemish Government. 2011. Ruimte voor morgen – Burgerparticipatie voor een
groenboek beleidsplan ruimte. Brussels: Flemish Government.
Page 85
Chapter 3. Accessibility Instruments 61
Glaeser, E. L. & Kahn, M. E. 2010. The greenness of cities: carbon dioxide emissions
and urban development. Journal of Urban Economics, 67, 404-418.
Griffith, R. & Harmgart, H. 2008. Supermarkets and planning regulation. CEPR DP
6713.
Guy, C. M. 1998. Controlling new retail spaces: The impress of planning policies in
Western Europe. Urban Studies, 35, 953-979.
Guy, C., Clarke, G. & Eyre, H. 2004. Food retail change and the growth of food deserts: a
case study of Cardiff. International Journal of Retail & Distribution Management, 32,
72-88.
Harvey, D. 1973. Social justice and the city, London: Edward Arnold.
Haskel, J. & Sadun, R. 2009. Regulation and UK retail productivity: evidence from
microdata. IZA DP 4028.
Kennedy, C., Miller, E., Shalaby, A., Maclean, H. & Coleman, J. 2005. The four pillars of
sustainable urban transport. Transport Reviews, 25, 393-414.
Kenworthy, J. 2007. Urban planning and transport paradigm shifts for cities of the post
petroleum age. Journal of Urban Technology, 14, 47-70.
Locatus. 2012. Locatus Database. Woerden: Locatus.
Matsumura, T. & Matsushima, N. 2011. Locating outside a linear city can benefit
consumers. Journal of Regional Science, Early View (Online version of record published
before inclusion in an issue), 1-13.
Newman, P., Kenworthy, J. & Vintilla, P. 1995. Can we overcome automobile
dependence? Physical planning in an age of urban cynicism. Cities, 12, 53-65.
Péron, R. 2001. The political management of change in urban retailing. International
Journal of Urban and Regional Research, 25, 847-878.
Sadahiro, Y., 2003. Cluster detection in uncertain point distributions: a comparison of
four methods. Computers, Environment and Urban Systems, 27, 33-52.
Van Den Berg, L. 1999. The urban life cycle and the role of a market oriented
revitalisation policy in Western Europe. In: Summers, A. A., Cheshire, P. & Senn, L. (eds.)
Urban changes in the United States and Western Europe. Washington: The Urban
Institute Press.
Van Den Berg, L. & Braun, E. 1999. Urban competitiveness, marketing and the need for
organising capacity. Urban Studies, 36, 987-999.
Van Den Berg, L., Van Klink, H. A. & Van Der Meer, J. 2004. A survey of metropolitan
government in Europe In: Phares, D. (ed.) Metropolitan governance without metropolitan
government? Aldershot: Ashgate.
Van Winden, W., Van Den Berg, L. & Pol, P., 2007. European cities in the knowledge
economy: towards a typology. Urban Studies, 44, 525-549.
Page 86
62 Accessibility Instruments for Planning Practice
Whisler, R.L., Waldorf, B.S., Mulligan, G.F. & Plane, D.A., 2008. Quality of life and the
migration of the college educated: a life-course approach. Growth and Change, 39, 58-
94.
Ygitcanlar, T., O’Connor, K. & Westerman, C. 2008. The making of knowledge cities:
Melbourne’s knowledge-based urban development experience. Cities, 25, 63-67.
Zenk, S. N., Schulz, A. J., Israel, B. A., James, S. A., Bao, S. & Wilson, M. L. 2005.
Neighbourhood racial composition, neighbourhood poverty and the spatial accessibility
of supermarkets in Detroit. American Journal of Public Health, 95, 660-667.
Page 87
Chapter 3. Accessibility Instruments 63
3.3 Space Syntax: Spatial Integration Accessibility and
Angular Segment Analysis by Metric Distance (ASAMeD)
Authors of report: Nadia Charalambous*, Magda Mavridou**
* Organisation: Department of Architecture, University of Cyprus,
Address: P.O. Box 20537, 1678 Nicosia, Cyprus
E-mail: [email protected]
** Address: Ionos Dragoumi 4, 54624, Thessaloniki, Greece
E-mail: [email protected]
3.3.1 Background
The instruments presented here are: Spatial Integration Accessibility (SIA) and Angular
Segment Analysis by Metric Distance (ASAMD) and they both belong to the wider
theoretical and methodological field of space syntax developed in the Space Lab of
University College London.
Space syntax is both a theory of urban planning and design and a software-based
technology. It is an evidence-based approach to planning and design, with a focus on
the role of spatial networks in shaping patterns of social and economic transaction.
Through a configurational analysis of a street network, the Space Syntax methodology
investigates relationships between spatial layout and a range of social, economic and
environmental phenomena. These phenomena include patterns of movement,
awareness and interaction; land use density, land use mix and land value; urban growth
and societal differentiation; safety and crime distribution. Research using the space
syntax approach has shown how: movement patterns and flows in cities are powerfully
shaped by the street network; this relation shapes the evolution of the centres and sub-
centres that affects the well-being of people in the city; patterns of security and
insecurity are affected by spatial design; spatial segregation and social disadvantage
are related in cities; buildings can create more interactive organisational cultures (Hillier
and Hanson, 1984).
Space syntax methodology analyzes the movement network to quantitatively measure
“spatial accessibility”. This approach utilises graph theory indices of accessibility, which
measure spatial separation. The key focus is to describe the spatial impedance factors
that separate locations, without considering the nature of the activities separated; to
measure accessibility from a particular location to either all other locations in the study
area or to all other locations that fall within a certain distance from the location under
study. All destinations are accounted as equals and land uses are not considered during
the initial analysis.
Page 88
64 Accessibility Instruments for Planning Practice
3.3.2 Conceptual framework and theoretical underpinnings
Both instruments are measuring what has been described above as spatial
accessibility. However, each instrument is measuring spatial accessibility in a different
way. SIA is using a spatial representation called axial line and on the topological
distance between axial lines based on the number of steps from one line to the other
while ASAMD includes in the axial analysis furthermore the angles of incidence between
lines, the segmentation by junction of the axial line and the effect that metric radii
would have on the choice of routes and the trips destinations.
SIA is concerned with the number of changes of direction that a journey from one place
of the movement network of a city, to another would require. The notion of proximity in
general and the perception of a location’s accessibility in a network of city streets in
particular are affected by the experience of physical travel through an urban
environment, which involves much more than a simple distance or time cost of reaching
a location. Unlike metric accessibility measures, which rely strictly on distance or travel
time, cognitive research on access also accounts for the ‘complexity’ involved in walking
to a place. Spatial integration is considered very important because it measures the
complexity of routes within an urban area and takes into account the important
subjective dimension to accessibility.
Space syntax analysis argues that which locations appear accessible or remote and
which paths are chosen to access a place, depend on people’s wayfinding skills and
mental conceptualizations of the environment. It is suggested that the most accessible
locations are not necessarily those closest to all other locations in terms of metric
distances, but rather those closest in terms of topological turns (Hillier et al., 2007).
From a behavioral point of view, this assumption postulates that the cognitive
complexity of the route, described as the number of directional changes on a route, is
the primary consideration in pedestrian path choice, even more so than metric distance.
Pedestrians are thus expected to prefer routes that involve less turns along the way,
rather than shortest routes.
For ASAMD the indicators that are used in addition to the axial lines connectivity and
topological distance are: the axial lines segmentation by junctions (segment map), the
angularity between axial lines and the metric distance measured on axial lines’
segments.
Consequently, this instrument is based on the axial lines segments between junctions; it
allows three types (measures) of distance:
Metric (shortest paths);
Topological (fewest turns paths);
Geometrical (least angle change paths).
The instrument then calculates accessibility at different scales (radii), local –
intermediary – global, using the different types of distance. The scales (radii) can be
assigned by the researcher depending on the research question, so that local can be for
example 200m, intermediary at 800m and global at 2000m.
Page 89
Chapter 3. Accessibility Instruments 65
Both SIA and ASAMD calculate two main measures:
Integration (closeness): how close each segment is to all others under
different types of distance and at different scale, this is known as “to-
movement”. Integration describes how easy it is to get to one segment from
all other segments. In practical terms this would mean that pedestrians
would end up to such a space more often and with less effort. This spatial
attribute can then define the type of land use that would fit best in this
space. (for mathematical formula see Hillier & Iida, 2005);
And choice (betweenness): how much movement is likely to pass through
each segment on trips between all other segments, again using different
types of distance and different radii. Choice describes how likely you are to
pass through the segment on trips, and so it’s potential as a route, from all
segments to all others. Again, this spatial attribute can define the type of
land use that would fit best in this space, possibly certain land uses would
require spaces with a high integration value. (for mathematical formula see
Hillier & Iida, 2005).
3.3.3 Operational aspects
Both SIA and ASAMD measure spatial integration accessibility which is the degree of
spatial separation/integration in terms of the number of changes of direction and the
angle of change of direction that a journey from one location to another would require.
The analytic tool used is the "one-dimensional" or axial organisation: this refers to the
global organisation of the system from the point of view of those who move in to and
through the system; that is, in terms of its lines of access and sight. Syntactical analysis
is commonly based on the axial map, the set of fewest and longest lines of sight passing
through every public space in a city’s street network. The map shows the relation of
each line to the network of the whole city (‘global’ relations) or the relation of each line
to the immediate surroundings (‘local’ relations). Space Syntax researchers measure
travel from one line to another across the graph in topological terms, using the count of
lines traversed (i.e. changes in direction on axial lines) as a metric of proximity, referred
to as depth. It is used as a kind of distance measure, which represents the minimum
number of axial lines needed to go from an origin to any other segment in the network.
The depth measure leads to another central metric: integration, which quantifies
relative depth from any space to all other spaces (see Hillier, 1996). The integration
measure is a relative description of each axial line’s depth with respect to all other axial
lines in the graph. It is obtained by repeating the depth measure from each line to all
other lines in the system and normalizing the obtained sums for each line by the total
number of lines in the graph. The integration measure thus outlines which axial lines
require the least amount of connections to access from all other axial lines in the
network. Maps are coloured in a scale from red to blue, or black to white in an grayscale
map, to indicate the high-to-low range of values (see Figure 3.2 and Figure 3.3).
Data that are required for the calculation both of SIA and of ASAMD is only a vector
basemap of the area or the city. If the basemap is on vector format the segment map
will be automatically generated but even image files of maps can be adequate, although
Page 90
66 Accessibility Instruments for Planning Practice
the segment maps would need to be drawn manually. Research by Turner (2007) which
replaced the segment lines with road-centre lines has shown that road-centre lines can
work equally well for transport analysis. Furthermore, road centre line data allows for
whole regions or even whole countries to be modelled without spending time on the
manual production of the axial/segment map. Obviously, the data requirements are at
minimum and easily, in most cases available, which count for easy use.
The analysis of the segment map can be produced by Depthmap (Turner, 2001; Hillier,
2009). Depthmap runs on Windows (2000 and XP are the older versions). The software
was available only for academic use until recently but now is publicly and freely
available and it is provided as open-source.
The calculation time depends on the size of the urban area analysed in combination
with the number of lines or segments per map. Usually for small urban areas of a
neighbourhood it wouldn’t take more than a few minutes. The analysis of a whole city
can take up to a few hours depending on the size. The analysis is calculated
automatically without any special knowledge or technical expertise by the user. As soon
as a correct segment map is imported in the programme it is matter of a sequence of
simple commands to produce the model. However, wide knowledge based on the theory
of space syntax and on basic principles deriving from it is required in order to interpret
the results. Inadequate knowledge of the main concepts behind the analysis can
confuse or lead to naïve and simplistic assumptions.
Depthmap also offers the capability of extension through two levels of interface. The
first level, a scripting interface based on the Python language, allows researchers to
calculate new derived measures as well as to add graph measures, such as circuit
lengths, for each of the graph types. It also allows the ability to select groups of nodes
according to value or according to simple algorithms. The second level, the Software
Developers’ Kit (SDK) allows programmers to write new forms of analysis.
3.3.4 Relevance for planning practice
The information that the instrument produces can be relevant for planning practitioners:
To inform them on the constraints and opportunities of urban areas with
regard to the street network and how it can attract or deter pedestrian
movement so that land use strategy is better aligned to the pedestrian
movement opportunities;
To offer insights on how the area can be optimised in its context regarding
its commercial viability, the potential for retail, the design of sustainable
development and the creation of vibrant and lively urban spaces;
And finally it offers the possibility to test different strategic guidelines and
design proposals.
The space syntax approach has been used in practice since 1984, particularly the
Angular Segment Analysis by Metric Distance since 2006, in a variety of urban problems
in several countries which include the UK, Saudi Arabia, China, USA, Chile and many
more, with partners from both the private and public sector. In Greece it has been
mostly used for research urban projects and therefore there hasn’t been any feedback
Page 91
Chapter 3. Accessibility Instruments 67
from applications in practice. At the moment SIA is in the process of being applied in
Cyprus through a research project which has been prepared jointly by Nicosia
Municipality (planning department) and academics, including the author, from the
University of Cyprus.
The instrument addresses a number of issues relevant to the formation of a land use
strategy and location: to help boost the economy, to revitalise central areas, to increase
social sustainability and to improve cycling and pedestrian access. The instrument
offers an evidence-based approach to decision making by informing on the accessibility
and walkability of an urban area and by helping to test strategic interventions and
design proposals. The value of the instrument in the planning outcome and in the
decision-making process is that it gives a scientific and objective tool by which the
proposals could be tested and evaluated regarding spatial accessibility and pedestrian
movement and how these attract land use.
3.3.5 Strengths and limitations
The instrument is a strong tool for analysis and evidence based design that has been
tested both in research and in real practice problems and been proved successful. One
of its weaknesses could be considered the fact that it is based on a wide theoretical
basis which makes it difficult for someone, in either the scientific or the practical field,
to instantly understand and accept. In what follows some of the main positive and
negative reactions of planning practitioners to the instrument are presented. These
derive mostly from the application of the instrument in countries other than Greece and
Cyprus as in these countries it has been only used for research.
Positive reactions include:
The instrument provides clear and undisputable metrics and therefore it is
objective;
It has been proved very useful in stakeholder negotiations since it can be
trusted more than just an architect’s or urban planner’s experience or
intuition;
It introduces science in the field of architectural and urban design in relation
to accessibility, where this did not exist in the past. Traditionally,
accessibility was mostly related to transport and land use planning;
It reduces the risk in strategic or design decisions as it offers an evidence-
based assessment regarding the spatial accessibility potential of each
proposal;
It provides very illustrative and easy to “read” visualisation.
Negative reactions are:
The instrument is not a “theory of everything” as it is many times expected.
People have too high expectations and anticipate that it should explain
everything. However, the instrument explains pedestrian movement quite
well and therefore also land use patterns and to a certain degree socio-
economic sustainability;
Page 92
68 Accessibility Instruments for Planning Practice
The instrument itself and especially the theory behind it are very
complicated and take time to understand. This makes it more difficult to use
in support of decisions in public engagement situations where time is
limited;
There is very often an overemphasis among urban designers on
‘architecture’ and ‘attractors’, so they don’t believe that there is a strong
connection between accessibility and the functionality of the city;
There is reluctance among practitioners for the use of models in general.
They believe that parties in possession of a model can argue whatever they
want because they justify it with the modelling, and they don’t seem to
always like that.
Criticism of this approach from a scientific point of view is usually based on the fact that
all paths/axes are weighted equally in the analysis. So, a street that has no buildings on
it is weighted equally with a street that has a number of tall buildings; an area covered
with residential land uses is weighted equally with an area full of commercial land uses.
Criticism also points out that interpretations of the spatial phenomena need to take into
account additional information that is not readily available through a configurational
analysis. The method does not account for the three-dimensional geometry of the built
environment for example, nor the land use characteristics of the network. The addition
of three-dimensional built-form indicators as well as land use characteristics would
allow graph measures to capture a more realistic description of the built environment
and address some of the criticisms. Research towards these criticisms is in progress
(for the three-dimensional built form see Mavridou, 2012; for land use characteristics
see Ortiz-Chao, 2008).
3.3.6 References
Hillier, B. and Hanson, J. (1984). The Social Logic of Space. Cambridge: Cambridge:
University Press.
Hillier, B. and Penn, A. (1996). Cities as Movement Economies. Urban Design
International 1: 49-60.
Hillier, B. (1996). Space is the Machine. Cambridge: Cambridge University Press.
Hillier, B. and Iida, S. (2005). Network and Psychological Effects in Urban Movement. In
A.G. Cohn & A.D. Mark (eds), COSIT 2005, LNCS 3693, pp. 475-490, Springer-Verlag,
Berlin Heidelberg.
Hillier, B., Turner, A. Yang, T., Park, H. (2007). Metric and topo‐geometric properties of
urban street networks: some convergences, divergences and new results, Proceedings
6th International Space Syntax Symposium, ITU, Instanbul, Turkey, 12-15 June 2007.
Hillier, B. (2009). Spatial Sustainability in Cities: Organic Patterns and Sustainable
Forms. In Koch, D., Marcus, L. and Steen, J. (eds), Proceedings 7th International Space
Syntax Symposium, Stockholm: KTH, pp. K01:1- K01:20.
Page 93
Chapter 3. Accessibility Instruments 69
Mavridou, M. (2012). Perception of three-dimensional urban scale in an immersive
virtual
Environment. Environment and Planning B: Planning and Design 39 pp.33 – 47.
Ortiz-Chao, C. (2008). Land use patterns and access in Mexico in Mexico City.
Proceedings 4th ACSP- AESOP Joint Congress, Chicago, Illinois, USA, 6-11 July 2008.
Stonor, T. and Rose, A. (2009). Planning Urban Accessibility. In Wolfgang C., Access for
all: approaches to the built environment, pp.79-93.
Turner, A. (2001). Depthmap: a program to perform visibility graph analysis. In
Proceedings 3rd International Space Syntax Symposium, Atlanta, pp. 31.1–31.9
Turner, A. (2007). From axial to road-centre lines: a new representation for space syntax
and a new model of route choice for transport network analysis. Environment and
Planning B: Planning and Design, Vol.34 (3): 539-555
3.3.7 Figures
Figure 3.2 Spatial accessibility analysis of Nicosia, Cyprus
Page 94
70 Accessibility Instruments for Planning Practice
Figure 3.3 Angular Segment Analysis by Metric distance of the city of Jeddah, SA (by
Space syntax Ltd.).
Page 95
Chapter 3. Accessibility Instruments 71
3.4 Activity based indicators of connections and
access needs (ABICA)
Author of report: Thomas Sick Nielsen; Petter Næss
Organisation: Technical University of Denmark; Aalborg University
Address: Bygningstorvet 116 B, DK-2800 Kgs. Lyngby
E-mail: [email protected]
3.4.1 Background
This instrument is not an instrument with the purposefulness and instrumentality that
this implicitly assumes, but may be applied purposefully in planning as well as in
scientific context. Data visualizations have a long history but visualizations and
illustrations of interaction patterns and access needs have generally been limited by
access to spatial behaviour data and computation capacities.
Visualizations based on interaction data was included as a prominent part of the first
metropolitan planning studies in the US (e.g. Chicago Area Transportation Study, CATS;
Detroit Metropolitan Area Transportation Study, DMATS; see Tobler, 1987) as well as in
studies surrounding the ‘Lund school of geography’ (e.g. Lenntorp, 1978; Westelius,
1973) such have, however, until the increase in geo-statistical computation capacities
and geo-referenced data in the last decade, been a rare event. The improved access to
e.g. detailed, spatially referenced datasets, as well as the spread of spatially explicit
survey ‘tools’ such as GPS provides new possibilities for the representation and
visualization of spatial interaction patterns. Such may be seen as a supplement to more
normative accessibility indicators and may have a huge potential when it comes to
communicating findings and engage stakeholders in discussions on criteria for access
conditions.
Representative treatments – i.e. visualisations with the purpose of representing and
communicating spatial interactions and thus connections and access needs – have
been applied in a number of Danish research projects, including ‘Byen, Vejen og
Landskabet’ (Town, Road and Landscape) and ‘Danish Centre for Strategic Urban
Research’. This section is based on these experiences.
3.4.2 Conceptual framework and theoretical underpinnings
Activity-based indicators and visualizations of connections and access needs do not
define accessibility, but assumes that the spatial connections/interactions can be
represented and that lessons of access needs and accessibility may be inferred from
such representations.
The lack of definition of accessibility is an important contribution from this indicator.
Thus, accessibility indicators will often rest on a normative basis or assumed causalities
which may not be relevant under all conditions or applicable to all. Representing ‘actual’
behaviours can supplement and provide a basis for interpretation accessibility and
Page 96
72 Accessibility Instruments for Planning Practice
access needs. The openness to interpretation – the fact that the revealed behaviours
represented has developed out of multiple underlying causalities – may be seen as a
weakness, but also as a strength as the representation can be accepted by
stakeholders in the field.
In the Danish examples visualizations of connections and access needs have especially
been employed to measure spatial integration at the regional and national scale.
Examples include research into developments along the motorway network as an input
to a debate on relations between infrastructure design and land use developments; and
elaboration of travel patterns in an emerging polycentric metropolitan area as an input
to a consensus based strategic planning process for the whole urban entity. The
increase and upscaling of spatial dependencies have been documented and illustrated
– a process which is extremely relevant for the consideration of accessibility locally as
well as regionally.
Even though data access is improving, data is still one of the main concerns for the
development of such indicators. As in many other countries there is a long tradition for
collecting commuting data in Denmark, and these have been employed to represent
interactions and access needs nationally. However, the prominence of commuting in
defining the spatial economy has been decreasing for long and studies relating to
consumption patterns more generally are highly desirable. Transportation data may in
some instances be used to represent interactions and access needs, and tourism
datasets may be used at a larger scale, but the main ‘future promise’ for such studies
would be to employ cell phone datasets or loggings based on build-in GPS devices to
represent interactions and access needs for large populations.
3.4.3 Operational aspects
Danish visualizations of connections and access needs have based on either the Danish
commuter survey (Statistics Denmark, Registerbaseret arbejdsstyrkestatistik, RAS) or
the Danish National Travel Survey. The register based account of commuting generally
allows the identification of the location of home and work based on other register
datasets, while the National Travel Survey have been collecting detailed data on trip
origin and destinations since 1997. In both instances origin-destination links may be
mapped as ‘desirelines’ – an approach developed for transportation planning in the US
under the heading of ‘coordinate method’ in the 1940s. The desireline connections as a
basic building block allow for the summary of flows or ‘desireline traces’ as a property of
a location; or to map the activity field or catchment of a given place/location.
Visualisations based on desirelines or desireline traces can indicate loads, demand for
capacity, as well as spatial patterns of dependency and centrality. Visualisation of
activity fields or catchments also indicates patterns of dependency, but takes the
starting point of a place or location. Both are of interest in municipal and regional
planning and provide basic reality based outlooks to the location of a customer basis,
where a population live their lives etc.
Origin-destination datasets from commuter or travel surveys are the minimum
requirement for the indicator and are generally not freely available. Exceptions are the
US and UK where efforts have been made to make census data available, but in many
Page 97
Chapter 3. Accessibility Instruments 73
countries it is necessary to pay to get access to data (e.g. Denmark, Germany, Sweden)
and/or there may be restrictions to access (e.g. Netherlands, France), and of course
some countries and regions does not have such data at all.
The processing requirements depend on the format of the data available and whether
interaction datasets match available spatial datasets (e.g. maps of boroughs, census
tracts, wards or similar). In practise survey data and spatial data are not ‘in tune’ due to
timing, updates etc. which then require ‘repair’ of base datasets before analysis.
Most current PCs are able to handle origin-destination datasets from commuter or travel
surveys, but software to process large databases, geo-statistics, and maps are required.
Commercial software’s, such as ArcGIS, are generally preferred by the practitioners of
the field, but open source software (such as R) are becoming increasingly available for
spatial analysis and may be able to perform the tasks as well.
Realistically the handling of data and analysis does require some technical expertise,
but not to a level where it cannot be included in a general GIS courses. Handling of
detailed micro level time-space datasets from e.g. cell phones or GPS will of course
increase requirements and require handling outside ‘standard software packages’.
Interpretation of results can take place at many levels. The main issue here is that the
representation should reflect the intended application, and the representation comes
with a declaration of its content.
3.4.4 Relevance for planning practice
The examples relied on in this chapter has been produced in strategic research projects
focussing on the spatial development and upscaling processes, as well as in
preparations for a common plan for a metropolitan corridor development.
It is our judgement that it is very beneficial when it comes to describing the ‘planning
context’ and especially the dependency or connectedness of the planning unit
(municipality) towards other areas.
3.4.5 Strengths and limitations
The main strength of this instrument is that it may be said to represent what people do.
On this basis it may gain acceptance and wide application and allow for multiple
interpretations.
Experiences with communication to planning practitioners show that the visually
appealing image is readily applied in all sorts of communications and presumably
creates an interest or awareness around the subject of spatial development conditions.
This includes voices that see the map either as representation of ‘doom’, or that dislike
the visual representation because of an implicit image of inescapability or givens. So
also the representation is discussed.
An important limitation is the lack of causality or explanations. There are many
underlying reasons for the spatial pattern of interactions. Ideally visualisations of
connections and access needs should be accompanied with a discussion of why and
Page 98
74 Accessibility Instruments for Planning Practice
how this is so – scientifically (general) as well as locally in a given planning context
(contextually).
An additional limitation is of course also the visualisations are seductive and great care
must be taken towards adequacy and explanation.
3.4.6 References
Hovgesen, H. H. , Nielsen, T. S. 2005. Spatial development effects of motorways
(original title: Effekter af motorveje), in: Egebjerg, U. & Simonsen, P. (red.), Byen, vejen
og landskabet – motorveje til fremtiden, Aalborg University, KVL Forest and landscape,
Danish road directorate, Copenhagen (in Danish)
Lenntorp, B. 1978. A Time-Geographic Simulation Model of Individual Activity
Programmes. In: Timing space and spacing time, Part 2, Carlstein, Parkes & Thrift (eds.):
pp 162-180. Arnolds. London
Miljøministriet 2006. Det nye Danmarkskort – planlægning under nye vilkår.
Landsplanredegørelse 2006. Ministry of the environment: Copenhagen (in Danish)
Nielsen T.S. 2011. Fritidslivet i bevægelse. Byplan 63 (2), 29-31 (in Danish)
Tobler, W. 1987, “An Experiment in Migration Mapping by Computer”, The American
Cartographer, 14(2): 155-163.
Westelius, O. 1973. The individual's way of choosing between alternative outlets. Report
D17, Svensk Byggtjanst: Stockholm.
3.4.7 Figures
Figure 3.4 Commuter flow or ‘desireline traces’ drawn from commuting in Denmark. The
map is based on origin-destination data for commuting and summarizes the number of
commutes passing through any given area. Source: Byen, Vejen og Landskabet
(Hovgesen and Nielsen 2005; Miljøministeriet, 2006)
Page 99
Chapter 3. Accessibility Instruments 75
Figure 3.5 Activity fields for leisure activities. The activity fields are drawn to indicate the
areas that contain the 75% and 95% of the activity destinations that are closest to
home, out of the total number of activity destinations of the municipal population.
Source: Danish Centre for Strategic Urban Research (Nielsen, 2011)
Page 100
76 Accessibility Instruments for Planning Practice
Page 101
Chapter 3. Accessibility Instruments 77
3.5 Heuristic three-level Instrument combining urban
Morphology, Mobility, service Environments and
Locational Information (HIMMELI)
Author of report: Sanna Iltanen
Organisation: Tampere University of Technology
Address: BOX 600, FIN-33101, Tampere
E-mail: [email protected]
3.5.1 Background
This report introduces a spatial simulation model of an urban retail system where the
accessibility concept plays a key role in several aspects of interaction. Essentially, the
idea is to model the cumulative effects of accessibility and the interaction of urban
actors within the physical framework created by the urban structures. The study is
focused on retailing which is (and has been) one the core activities of cities and which
also is highly competitive and dynamic. The actors in the retail sector continuously
search for new locations and modes for production and consumption in order to get
comparative advantage. The behaviour and interaction in urban systems have already
been interpreted as obeying the principles of complex systems (e.g. Jacobs, 1961;
Schelling, 1978; Allen 1981) even before ‘complexity theory’ (or ‘complex systems
theory’) has been established. The availability of computing capacity later enabled new
methodologies like agent based modelling for simulating the complex phenomena.
This continuously changing and complex nature of urban development, which is
emphasised in a retail sector but can also be seen in other fields, has raised new
paradigms and understanding about planning problems during the last two decades.
Widely used traditional planning methods are not fully able to answer the challenges of
this new operational environment. This paradigm change and processual approach has
created a new demand for planning tools that increase knowledge of the development
process and cumulative effects of individual interactions. New planning instruments
should be able to reveal causal relations and boundary conditions that can lead to
system phase transitions and additionally show whether they lead to more fluctuating or
stable development paths. Modelling tools can work as useful instruments in
discussions between private and public sectors in planning processes and particularly in
situations where tensions exist between different interest groups. The model presented
here is still in a test phase and requires still improvements in order to serve in real
planning contexts.
Page 102
78 Accessibility Instruments for Planning Practice
3.5.2 Conceptual framework and theoretical underpinnings
The focus of the modelling tool is to observe how different accessibility factors influence
on a spatial organization of retail units and how this process can be simulated by using
agent based modelling methodologies. The objective is to find out how the selected
boundary conditions effect on the location choice of retail units on the regional scale.
These boundary conditions in the model include accessibility measures, the properties
of infrastructure as well as the features of urban actors and objects like households and
retail units. The model emphasises the spatial aspects of the self-organising
phenomena. All this is related to the network city theory in a way that the overall model
structure follows Gabriel Dupuy’s theoretical three level framework of urban networks
(Dupuy, 1999).
The simulation model comprises all the three level elements of Dupuy’s model: (1)
infrastructural networks, (2) networks of production and consumption and (3) agent
level networks. However, all the elements are reduced for the purposes of the retail
model. Households - as the operators of level three - create the connections between
the operators on level two by forming their spatial territories. As the focus of the model
is on the dynamics between the three elements it also gains from the tradition of spatial
interaction modelling (e.g., Batty 1976; Wilson, 1985). Approaches from different
theoretical backgrounds are combined and the interest lies on the process in which the
competing retail units act as independent agents and locate themselves in urban
structure. The objective is to approach the concept of accessibility not only by reducing
problems into smaller parts but observing it as a part of a larger entity.
Since the model approaches the retail system as spatial and morphological
phenomena, accessibility is also mainly defined in terms of the structural properties of
the urban environment. However within the model different components of accessibility
(Geurs & Wee, 2004) are related to interactions, namely land use, transportation and
individual components. The accessibility is taken into account when defining the
agglomeration advantages of retail units and when households select their shopping
destinations based on utility measures. The accessibility measure which is based on
network properties is utilised in the process of locating new retail units generated
during the simulation process.
3.5.3 Operational aspects
The model consists of two major modules: (1) an initialisation module and (2) a
simulation module. The initialisation module includes all functions that read all the
input data for the model. The input data includes information concerning households,
retail services and transportation system. The actual processing of the data then
happens in the simulation module which runs the given number of simulation cycles.
A more accurate description of the model can be seen in a model flow chart
represented in Figure 3.6. The model utilizes accessibility measures in multiple ways
during the simulation cycle. At first it calculates the accessibility measure from every
retail unit to every other retail unit (Acc R-R) which indicates the degree of clustering of
each retail unit. In the second step, the model calculates the utility of each retail unit for
Page 103
Chapter 3. Accessibility Instruments 79
every household and their shopping orientation is based on this ranking of retail units
(ordinal utility). The utility function includes an accessibility factor which is based on the
travel cost from household location to the retail unit locations (Acc Hh-R). After every
household has selected their shopping destinations, the purchasing power of every
household is allocated to retail units and retail unit accounts are updated. Every retail
unit type has a certain revenue limit that they have to reach in order to survive to the
next simulation cycle. If a retail unit does not achieve the revenue limit, it goes bankrupt
and is removed. At the end of each simulation cycle new retail units are created to
replace the unit that went bankrupt. The location of the new retail units is based on the
accessibility of the network (Acc Network) within a given radius. The new generation of
retail units created at the end of each simulation cycle initialises the next cycle and the
series of these generations form the development path of the system.
The formulas for calculating the accessibility and the utility measures
Accessibility from a retail unit to every other retail unit is defined as:
(3.1)
where is travel cost from retail unit u to retail unit v.
The clustering indicator of the retail unit u is then defined as
(3.2)
where is coefficient which controls the magnitude of clustering for each retail type.
The effect of the size of each retail unit is defined as
(3.3)
where is coefficient depending on the unit type and is size of the retail unit.
Similarly the accessibility for a household in segment i to retail unit in segment j can be
formulated as follows
(3.4)
where is coefficient depending on unit type and is travel cost from segment i to
segment j. Finally these can be combined into utility function. The utility of a household
in segment i for retail unit u in segment j is defined as
(3.5)
New retail units generated at the end of every simulation cycle are located on the basis
of network level accessibility within a given radius R. The network accessibility measure
for each segment i is defined as
(3.6)
where the is the travel cost from segment i to segment j.
The case study of the test phase is executed in the Helsinki City region in Finland. The
model currently uses the census database of households. The original database
Page 104
80 Accessibility Instruments for Planning Practice
includes the number of households (three income brackets) in grid format but for the
model the information is linked to the road network database. The model also utilizes a
company register database which includes the classification of companies based on the
company size and branch. The retail typology is derived from the classification which is
based on the national version of Statistical classification of economic activities in the
European Community NASE Rev.2. Hitherto the model has been tested only with the
data sets from Finnish sources, but there are no restrictions to use other data sources
available.
At the more general level, the urban environment is represented in this study as a set of
discrete spaces including information from one discrete space to every other discrete
space. This representation can be defined also as a generalized travel cost matrix. As it
can be noticed from above that the travel cost matrix used in current simulations is
based on the representation of the topological road network structure where one road
segment corresponds to one discrete space. However, the model structure allows the
travel cost matrix to be based on any other relevant transportation means or spatial
entities e.g. public transportation or lots.
Technically, the model is running in 64-bit Windows environment with Microsoft .Net
Framework and MapInfo GIS-software. The actual code is written in MapBasic
(programming language for MapInfo) and in C#. The calculation time for the dataset of ~
20000 road segments is currently about 50 minutes and the memory usage is
approximately 6 GB. Thus the implementation of the model requires some basic
knowledge about MapInfo software and some general understanding of programming.
3.5.4 Relevance for planning practice
The model increases knowledge about the relationship of retail dynamics and the
structural properties of the urban physical environment e.g. transportation networks.
The simulations will produce the series of different development paths of spatial self-
organisation of retail units. These development paths can reveal the phase transitions
that are related to the boundary conditions defined in the model. The model enables the
observation of factors behind the location choice that take into account consumers'
shopping strategies as dependent on urban structure. Thus, it enables observation how
the distribution of retail units emerges from individual agents’ decisions which are
based on several accessibility measures.
The model will also help the assessment of planning scenarios e.g. how new road
alignments or new residential growth affect service locations. Generally, the tool can
avail planners to approach their task of controlling the development as a process
instead of an attempt to define the end result without knowing the process.
3.5.5 Strengths and limitations
From the scientific point of view the model offers new methodology to analyse
interaction within an urban system as a self-organising far-from-equilibrium phenomena
instead of using the equilibrium based land-use transportation models or spatial
interaction models. The agent based modelling methodologies and the availability of
more detailed data enable less aggregated representation of the system objects and
Page 105
Chapter 3. Accessibility Instruments 81
more powerful tools for representing behavioural mechanisms compared with the
tradition of spatial interaction models.
Currently, the model is still in a development phase and needs more testing and
validation in order to serve as a serious and credible tool in real planning contexts. One
of the next steps should be development of a calibration process through which a “best
fit” parameter combination that corresponds to a historical development in a given area
can be found. One of the strengths in real planning contexts is the knowledge that the
model can produce concerning the feedback loops and causal relations between
changes in infrastructural or other attributes and the reactions or the behaviour of
urban actors from individuals to institutions.
One of the key future improvements of the model would be the inclusion of public
transportation. The travel cost matrix which currently is based on a road network (i.e.
private transportation) could be extended to cover public transportation services. This
requires the data of public transportation and the methodology how this data can be
processed into travel costs.
3.5.6 References
Allen, P.M., Sanglier, M. (1981). Urban Evolution, Self-Organization, and Decision
Making. Environment and Planning A, Vol. 13 (2): 167-183.
Batty, M. (1976). Urban Modelling: Algorithms, Calibrations, Predictions. Cambridge
University Press.
Dupuy, G. (1991). L’urbanisme des réseaux – théories et méthodes. Armand Colin
Editeur, Paris.
Geurs & Wee. (2004). Accessibility evaluation of land-use and transport strategies:
review and research directions. Journal of transport geography, Vol. 12: 127-140.
Jacobs, J. (1969). The economies of cities. New York: Vintage.
Shelling, T.C. (1978). Micromotives and Macrobehaviour. Toronto, Canada: George J.
McLeod Ltd.
Wilson, A.G., Bennett, R.J. (1985). Mathematical Methods in human Geography and
Planning. John Wiley & Sons.
Page 106
82 Accessibility Instruments for Planning Practice
3.5.7 Figures
Figure 3.6 The simplified model flowchart
Figure 3.7 Different accessibility functions of the simulation module
Page 107
Chapter 3. Accessibility Instruments 83
Figure 3.8 An exemplar of the simulation development path in Helsinki city region.
Starting from a hypothetical random distribution of retail unit types, the charts (right)
show the quantity by type
Page 108
84 Accessibility Instruments for Planning Practice
Page 109
Chapter 3. Accessibility Instruments 85
3.6 Contactability
Author of report: Alain L'Hostis
Organisation: LVMT-IFSTTAR
Address: 20 rue Elisée Reclus, 59 666 Villeneuve d'Ascq, France
E-mail: [email protected]
3.6.1 Background
This contactability indicator was developed from a vision of networks from the
theoretical geography tradition and in reaction to the classic accessibility indicators,
which emphasize too much the quantification of a level at the expense of understanding
the network view of the access conditions.
The scientific question was to supplement accessibility indicators with a complementary
view that would allow for a better understanding of how transport networks contribute to
the local level of accessibility.
The planning issues to be addressed are associated with the objectives of spatial
cohesion such as they are enunciated in the ESDP (European Spatial Planning
Perspective): Which degree of cohesion in a city network? Which level of contactability
for cities and metropolitan regions? What are the missing links in the transport network
to favour a better spatial integration of a city network?
3.6.2 Conceptual framework and theoretical underpinnings
Metropolises have become the focus of contemporary economic development. They
constitute a type of settlement organising both the short distances of co-presence and
the long distances of telecommunication and transport through the mastering of fast
transport systems. Despite the rise of telecommunications, it is acknowledged by many
analysts in the field of innovation, that face-to-face contact remains a key element. The
analysis of professional mobility shows those contacts are dominantly performed
through single day trips.
Time-geography (Hägerstrand, 1970) provides the theoretical and conceptual
framework still suitable for analysing this type of metropolitan mobility. In that it
considers the space-time individual constraints as key parameters in the measurement
of the access conditions. The main indicator is contact potential (Erlandsson, 1979),
also called contactability (Haggett, 2001). It measures the possibility to realise a trip to
a distant location respecting the time-space prism.
Accessibility is defined in the contactability indicator as the potential, for somebody in a
location, for having face-to-face contact with somebody else in a single or a group of
distant locations.
The measure of accessibility is Boolean for each O-D pair considered: is it (YES) or is it
not (NO) possible to perform a contact under some time constraints? Departure not
Page 110
86 Accessibility Instruments for Planning Practice
earlier than 5am, return not later than 11pm and a minimum period of time of 6 hours
for a contact are leading criteria, while connection times are also considered (see
details in Figure 3.9).
3.6.3 Operational aspects
The type of accessibility that the indicator measures is “travel times using public
transport”.
Contactability is measured by associating two optimal transport chains corresponding to
a return trip. Fast transport systems -by rail and air - are operated with timetables. To
reach a certain level of realism, and to consider intermodality in a satisfactory way a
scheduled minimum path must be computed (L’Hostis and Baptiste, 2006). Therefore
timetable information must be collected and manipulated in a large database.
Data is available by purchasing the OAG 1 database for flights and by automatic queries
of the public website DieBahn.de for the train timetables.
The data has been stored on a mysql database. Timetables and nodes (the graph) must
be put in the database, and then the minimum paths are processed through the
database. The minimum paths have been computed with the Musliw software (not
publicly available, developed by P. Palmier from the Centre d'Etudes Techniques de
l'Equipement Nord-Picardie). The degree of technical expertise is high for performing the
calculation and processing the information, because of the mass of information it
involves.
Tasks and time consumption:
selection of the cities to be considered;
1 month for gathering railway information with an ad hoc java web capturing
tool developed at the IFSTTAR;
3 days for formatting transport supply information under the form of a
graph;
3 days week for modelling the full graph in a GIS environment with
pedestrian connections for intermodality;
2 x 4 hours for computing minimum paths with Musliw (roughly 1 million
minimum paths for 200 cities);
5 days for processing minimum paths in the database;
1 day for realising the cartography;
The degree of technical expertise for interpretation is low.
1 http://www.oag.com/
Page 111
Chapter 3. Accessibility Instruments 87
3.6.4 Relevance for planning practice
Contactability indicators are particularly suitable in the frame of the polycentrism option
for organising the territory with city networks.
It has been used in the frame of the European Spatial Planning Observation Network
(ESPON) for proposing European cities competitiveness indicators (Lennert et al., 2010)
as can be seen on Figure 3.10 and Figure 3.11. Furthermore, it has been used by BBR2
in the ESPON Atlas 3 to propose the constitution of Global Integration Zones outside of
the pentagon 4, as stated in the ESDP polycentrism option.
Coupled with the classic accessibility indicator developed by Spiekermann and Wegener
(Spiekermann and Wegener, 2007) it allows for a better understanding of the levels of
accessibility by identifying the top level contactability link.
It has also been used for clustering European cities in a research for the French DATAR
(project ACME 2011).
3.6.5 Strengths and limitations
Strengths
it allows for the identification of links, existing or missing, as opposed to the
simple identification of high or low accessibility locations;
it measures the possibility to realise real daily trips as opposed to the
measure of an abstract level of accessibility (as in classic accessibility
indicators), which helps the interpretation of the cartography.
Limitations
it operates a selection through the full timetable information, therefore
focuses on a limited type of mobility needs, and does not account for the full
transport supply between two cities. For this reason, it is a complementary
indicator to classic accessibility indicators (there is no way to overcome this
limitation which is inherent to this type of indicator);
the indicator measurement is highly dependent on the choice of cities; this
step, the choice of cities, must be thus made on a clear and sound basis
and is not an easy task at the European level (by experience the city list is
often provided by the commissioner of the work i.e. Urban Audit cities
chosen for the “Future Orientations for Cities” ESPON project).
2 The German federal Planning office “Bundesamt für Bauwesen und Raumordnung”.
3 ESPON and BBR, ESPON atlas, Mapping the structure of the European territory (BBR, 2006).
4 The pentagon formed by the cities of London, Hamburg, Munich, Milan and Paris, concentrating
population (40 %) and wealth (50 % of GDP) on a limited surface (20 %).
Page 112
88 Accessibility Instruments for Planning Practice
the most recent implementation combines air and rail transport; the next
step will be to integrate transport by road in a full multimodal and
intermodal approach
In the context of a planning discussion the experience is that this type of
indicator is not easily readable at first sight, but once explanation is given,
the stakeholders can clearly understand the type of mobility involved and
represented. The representation of the indicator has required extensive
work on graphical representation both schematic and cartographic;
3.6.6 References
Erlandsson, U. (1979). Contact potentials in the European system of cities. In: Folmer,
H., and Oosterhaven, J., (eds) Spatial Inequalities and Regional Development, Martinus
Nijhoff Publishing: The Hague, 93-116.
Hägerstrand, T. (1970). What about people in regional science? Papers of the Regional
Science Association, 24: 7-21.
Haggett, P. (2001). Geography, a global synthesis. Prentice Hall, Harlow.
L’Hostis, A., Baptiste, H. (2006). A Transport network for a city network in the Nord-Pas-
de-Calais region: linking the performance of the public transport service with the
perspectives of a monocentric or a polycentric urban system. European Journal of
Spatial Development, 20.
Lennert, M., Van Hamme, G., Patris, C., Smętkowski, M., Płoszaj, A., Gorzelak, G.,
Pumain, D., Comin, M.-N., Gregor, M., Rozenblat, C., Angelidis, M., Robert, J., Fons, J.,
Bozzani-Franc, S., L’Hostis, A., Ludlow, D. (2010). Future Orientations for Cities. Final
report. ESPON.
Spiekermann, K., Wegener, M. (2007). Update of selected Potential Accessibility
Indicators. ESPON.
3.6.7 Figures
Figure 3.9 Structure of the air and rail return trips for computing the contactability
indicator (author: A. L'Hostis)
Page 113
Chapter 3. Accessibility Instruments 89
Figure 3.10 Contactability by monomodal and intermodal transport chains between
European cities in 2009 (author: A. L'Hostis)
Figure 3.11 Contactability level by city and by monomodal and intermodal transport
chains in 2009 (author: A. L'Hostis)
Page 114
90 Accessibility Instruments for Planning Practice
Page 115
Chapter 3. Accessibility Instruments 91
3.7 Erreichbarkeitsatlas der Europäischen
Metropolregion München (EMM)
Author of report: Johannes Keller, Gebhard Wulfhorst
Organisation: Technische Universität München, Department for Urban Structure and
Transport Planning
Address: Arcisstr. 21, D-80333, München
E-mail: [email protected]
3.7.1 Background
Accessibility is at the heart of the research approach on sustainable mobility. The TUM
department of urban structure and transport planning is developing suitable
instruments and tools with manifold partners of the Munich metropolitan region and
beyond. Since 2007, the EMM accessibility atlas has been conceived and developed as
a strategic tool for analysis and planning, across all transport modes and on various
spatial scales. The main objectives are to investigate, understand and visualize the
potentials and risks of land-use and transport development on a local level in order to
improve regional governance and decision-making processes.
3.7.2 Conceptual framework and theoretical underpinnings
The ‘Erreichbarkeitsatlas der EMM’ is mainly a database of structural (population,
employed people, motorization etc.) and transport supply data (road networks with
relevant attributes, public transport stop and line model with timetables) that covers the
geographic area of the European Metropolitan Region of Munich (EMM,
www.metropolregion-muenchen.eu): an area with a diameter of approximately 170 km
and a population of 5.5 million. The structural datasets are incorporated in the
database on the spatial level of municipalities with a further differentiation on city
district level for the three largest cities in the area (München, Augsburg, Ingolstadt).
This database is the platform for regional accessibility analyses. It is also the starting
point for the development of sub-models that can analyze smaller parts of the EMM with
a higher degree of detail.
Per se, this accessibility modelling platform does not pose any limitations on the
methodological framework, as long as a selected methodology does not require data
other than the aforementioned structural and transport supply datasets (which however
can be extended flexibly with according data surveying efforts).
Practically, the ‘Erreichbarkeitsatlas der EMM’ has been developed with a focus on
implementing variations of isochrone and gravity accessibility measures, since these
are both relatively easy to implement as well as to interpret and therefore appear to be
most useful within strategic transport and land-use planning processes (Geurs and van
Eck 2001).
Page 116
92 Accessibility Instruments for Planning Practice
Beside these classical accessibility measures, other measures have been used e.g.
network analysis indicators based on the methodological framework of Multiple
Centrality Analysis (Crucitti et al. 2006, Curtis and Scheurer 2010).
The underlying assumption is, that accessibility is a complex, multi-dimensional concept
that cannot be captured by one or few indicators, but needs to be analyzed with a
variety of indicators, each of which is specifically designed to explain one specific
aspect of accessibility.
A future goal in the development of the ‘Erreichbarkeitsatlas der EMM’ is the
specification of location-specific accessibility profiles that bring together these separate
issues of accessibility, thus providing a multi-faceted overview of how a certain location
performs with regard to the different aspects of accessibility (Keller and Ji 2012).
3.7.3 Operational aspects
On the regional level, the ‘Erreichbarkeitsatlas der EMM’ has been used for analyzing
accessibility indicators for car and public transport. These indicators include travel time
analyses (isochrones) to different locations of regional interest (e.g. airport, long-
distance train stations, universities, major leisure facilities) and the development of an
accessibility index that calculates population and job potentials that can be reached
from every municipality in the study area. This index implements a gravity accessibility
indicator in which spatial resistance is defined by travel time.
In the local accessibility analyses, the degree of spatial resolution is strongly improved,
a larger variety of indicators is being implemented and cycling and walking are included
in the analyses. Accessibility differences within a municipality are analyzed, e.g. by
analyzing access and egress to public transport stations; and by determining network-
based catchment areas of points of interest (health-care, shopping, services etc.). Public
transport service quality is determined on the basis of an index that combines the
aspects of travel time, service frequency and numbers of transfers. Public transport
accessibility levels of locations are compared with land-use density levels to determine
areas with accessibility deficits. Further indicators are under development. The goal is
to categorize and later aggregate very specific indicators to a lower number of
generalized indicators (categories to be specified, e.g. ‘local public transport
accessibility’, ‘regional public transport accessibility’, ‘non-motorized neighbourhood
accessibility’). These aggregated indicators can be used for the development of a
location-specific accessibility profile. Such an accessibility profile could be used in
assessing land-use plans with regard to ‘sustainable accessibility’ by applying it to every
block of a planning scheme and assessing it against land-use-type-specific benchmarks.
As mentioned in Figure 3.13, all aforementioned accessibility analyses are based on
firstly structural datasets and secondly transport supply datasets. The main structural
datasets are population and employment. In Germany, these datasets are publicly
available from the statistical administration of the German states with a spatial
resolution of municipalities. To arrive at more detailed structural data, disaggregation
methods based on land-use density estimations are used. This is currently done by
using CORINE Land Cover data (http://www.eea.europa.eu/publications/COR0-
landcover), but is intended to be refined by additional datasets in the future.
Page 117
Chapter 3. Accessibility Instruments 93
The analysis of travel times for car, cycling and walking on a network basis is done by
using the OpenStreetMap network (www.openstreetmap.com). OpenStreetMap is a user
generated world-wide map (“Wikipedia-principle”) that can be used without cost for any
purpose.
Public transport timetable data is generally publicly available (internet, timetable
booklets) but its implementation in the database requires a lot of work unless a study
area is covered by an already existing transport model, as has been the case in all
applications of the ‘Erreichbarkeitsatlas der EMM’ so far.
To date there are no automatic routines for calculating the different accessibility
indicators, therefore the tool can only be used by experienced modellers who have been
made familiar with the database. Advanced GIS skills are indispensible. The time
required for calculating different indicators varies but is generally quite high (several
hours to several days).
Beyond this modelling database, a prototype of an online tool of the
‘Erreichbarkeitsatlas der EMM’ has been developed. This online tool covers a few basic
indicators on the regional level. The underlying data is static, but users can specify
which specific datasets are to be visualized, e.g. by specifiying a time budget for an
isochrone analysis. No technical skills are required for using the webtool, but its
applicability for actual planning purposes is very limited. After a short testing phase the
webtool is currently not publicly available due to technical problems. The future of the
webtool mainly depends on whether more funds for its development will be available in
the future. The functionality of location-specific accessibility profiles could then be
integrated in the webtool.
3.7.4 Relevance for planning practice
The instrument (local accessibility model) is currently being applied for the first time in a
real-world planning context: a climate protection concept for a county near Munich.
Within this project, the tool is mainly being used to determine potentials for transit-
oriented development, promotion of neighbourhood mobility and strategic land-use
planning. The project is still at an early stage and the local modelling environment is still
in the build-up phase. Therefore, no experiences on usability, effectiveness or outcomes
can be reported at this time. The project will be completed in mid-2012.
Beyond this planning application, the tool is used in different research projects. Most
noteworthy is a French-German cooperation project on “Stress-tests for sustainable
mobility – an accessibility approach”. Within this project accessibility indicators are
combined with other socio-economic and demographic data to establish an area-wide
vulnerability index, which examines a municipality’s vulnerability in the face of potential
energy cost increases due to peak-oil developments and/or stricter CO2 emission
regulations/trading schemes. This project is perceived with high interest by regional
planning professionals but since it is still under development it is not possible yet to
assess its impact on decision-making or usability.
Page 118
94 Accessibility Instruments for Planning Practice
3.7.5 Strengths and limitations
The most important strength of the ‘Erreichbarkeitsatlas der EMM’ is its flexibility in
incorporating a large variety of indicators. It has not been designed to calculate one very
specific kind of indicator but to provide a data platform suitable to handle all major
state-of-the-art accessibility modelling techniques.
Another major strength of the tool is, that all core datasets are available free of charge.
Therefore, the instrument can be set up in any German region and could probably be
transferred to many parts of Europe (with minor adjustments according to the
availability of structural data). It gives public bodies with limited financial and personal
resources a possibility to develop a quantitative evidence-base for the purpose of
integrated land-use and transport planning.
Its major limitation is that it is not a tool that can be used by anyone. It clearly needs
time and expertise to develop the model for a specific region and equally to calculate
specific indicators. The further development of the online prototype is an option but
cannot be advanced without a strong funding base.
3.7.6 References
Crucitti, P.; Latora, V.; Porta, S. (2006) Centrality in networks of urban streets, Chaos.
Vol. 16 (1), 1-9.
Curtis, C.; Scheurer, J. (2010) Planning for sustainable accessibility: Developing tools to
aid discussion and decision-making, Progress in Planning, 74, 53-106.
Geurs, K.; van Eck, J.R.R. (2001) Accessibility measures: review and applications.
Rijksinstitut voo Volksgezondheid en milieu (RIVM) report 408505 006. Utrecht
University: Utrecht.
Keller, J.; Ji, C.: Developing accessibility models to foster climate-efficient regional
development. Proceedings of 9th World Congress of Regional Science Association
International. Timisoara 2012.
Page 119
Chapter 3. Accessibility Instruments 95
3.7.7 Figures
Figure 3.12 Public transport accessibility in the EMM (gravity accessibility indicator)
Figure 3.13 Land-use and public transport accessibility index: population density vs.
Public transport accessibility
Page 120
96 Accessibility Instruments for Planning Practice
Page 121
Chapter 3. Accessibility Instruments 97
3.8 The German Guidelines for Integrated Network
Design– binding accessibility standards (RIN)
Author of report: Prof. Dr.-Ing. Juergen Gerlach
Organisation: University of Wuppertal, Department of Civil Engineering, Institute for
Road Traffic Planning and Engineering
Address: Pauluskirchstraße 7, D-42285 Wuppertal
E-mail: [email protected]
3.8.1 Background
The “Guidelines for Integrated Network Design” (RIN) formulate standards for all
transport modes and for all spatial levels reaching from the macro level of connecting
agglomerations to the micro level of securing a local supply of infrastructure for
pedestrian, bicycle, public and car transport. The RIN mainly focus on passenger
transport. This includes car, public transport (railways, underground rail, tram and bus),
bicycle and pedestrian transport modes as well as the design of linkage points for
intermodal transport (Park+Ride, Rail+Fly and Bike+Ride). The RIN orientate these
standards directly towards the system of central locations identified as suitable bases
for the spatial components of a basic accessibility. Additionally, the RIN are an attempt
to integrate scientific knowledge of transport planning into a highly binding planning
guideline.
The backgrounds are target values for journey times between central locations. They are
derived from spatial planning considerations and have been used in German transport
planning for many years. Figure 3.14 shows these target values. Journey time includes
getting to transport from home, waiting and travel time, and getting from transport to
final destination. The listed target values are not a quality criterion for transport
planning on their own. However, they form the basis for assessing the quality of
infrastructure supply with the help of speed-based target values for specific network
elements and for assessing the quality of complete transport routes between central
locations.
3.8.2 Conceptual framework and theoretical underpinnings
The RIN suggest targets for connecting central locations to each other and to residential
areas. The following are goals of the RIN:
Guarantee the supply function for people living within the catchment areas
of central locations;
Guarantee the exchange function between central locations;
Support the development of population structures that are concentrated on
the system of central locations;
Support the special importance of the interconnection between national and
international agglomerations.
Page 122
98 Accessibility Instruments for Planning Practice
The RIN are assigned the highest category in the publications of the German Research
Society on Roads and Transport (FGSV) and are thus strongly binding for German
authorities and transport planners. They were announced by the German Federal
Transport Ministry with the request that they be applied to trunk roads. The RIN are the
first part of a highly complex set of guidelines that sets standards for all steps of
infrastructure design; from network design to the alignment and assessment of specific
street sections.
3.8.3 Operational aspects
The starting point for the RIN is the system of central locations. The combination of this
system and the target values for journey times between central locations and residential
areas builds the basis for the functional structuring of the transport network. In
addition, it is the basis for the development of quality requirements for the transport
networks and linkage points in the RIN. Each network section is classified according to:
Its importance: level of connector function (LCF), and;
Its function (road category).
The LCF is derived from the level of central locations to be connected. Six levels of
connector function are defined to describe the significance of connection routes. These
levels are valid for all modes of transport as long as they are relevant for the respective
mode. The importance of a connection results from the importance of the locations to
be connected. The RIN distinguish between connections related to the service functions
for residential locations in catchment areas and connections that enable exchange
between central locations.
In the second step a road category is assigned to each network segment in addition to
the LCF. Roads may have combinations of functions imposed on them in terms of the
expectations set by the adjoining land-uses. A road category is assigned to each road
section in accordance with the following criteria:
Road type (motorways, country roads, urban roads);
Location (outside built-up areas, bordering built-up areas, within built-up
areas);
Type of adjoining land-use (non-built-up, built-up);
Main road or access road;
The RIN develop similar categorizations for Public Transport, bicycle and
pedestrian traffic.
Central locations are connected by a series of network elements that together form a
transport route. The quality of the transport route can only be improved by upgrading
the compositing elements of the route. Quality requirements for specific network
elements can be derived from target values for the transport routes. The RIN
operationalize these quality requirements by standard distance ranges and target
values for car, public transport and cycling travel speed on the network elements. These
requirements are formulated at a micro level of specific network elements.
Nevertheless, they help to guarantee the exchange function and the supply function of
Page 123
Chapter 3. Accessibility Instruments 99
central locations as they are derived from spatial planning considerations. In addition to
the criteria that are related to specific network sections, the RIN introduce criteria for
assessing the service quality of complete transport routes between central locations
and between central locations and residential areas. The goal of these criteria is to
obtain a picture of the overall quality of the network for different transport modes.
Relevant criteria for connection quality at this macro level are journey time, costs,
directness, temporal and spatial availability of transport services, reliability, safety and
comfort. The RIN set target values especially for journey time and directness and work
with the six levels of service quality from A to F like school grades.
3.8.4 Relevance for planning practice
Transport policy should not concentrate primarily on improving traffic, but rather on the
underlying purpose, that is, on the activities that can be carried out with the help of
transport and on the needs that can be satisfied by those activities. The definition of the
concepts of basic needs and basic mobility is a normative task and changes over time
and between regions. However, this definition is required to formulate concrete
standards that guarantee the satisfaction of certain needs, the basic necessity of which
is beyond dispute.
These standards should describe opportunities provided by the transport and the
spatial system as well as specific needs of certain groups of people. Accessibility
standards are a suitable means of describing these components of basic mobility. The
system of central locations is an appropriate basis for designing the spatial components
of the standards system. It must be broken down into spatially low levels of centrality to
guarantee the local supply of daily goods and services. Standards are necessary for the
system’s structure and the facilities of central locations.
These standards are set with the RIN. They are binding for the whole country and are
used in transport planning processes especially on the federal and regional level. While
the standards concerning connections by car are set very near to the current situation
the main focus of the RIN is enhancing the quality of public transport and of the “slow
modes” (pedestrian and bicycle) with the aims to enable all people to make use of the
standards and to reduce the environmental impacts of transportation.
3.8.5 Strengths and limitations
The RIN are a successful example of designing the transport components of such a
system of accessibility standards. The RIN deal with the design of transport networks for
public, private motorized, bicycle and pedestrian modes of transport. Firstly, the RIN
establish the functional structure and hierarchy of the transport network. Secondly, the
RIN develop quality requirements for the development of specific network elements.
These are derived from the general requirements, which result from spatial planning
considerations and functional structuring of the transport network. Standard distance
ranges and car speeds are used as criteria to describe these quality requirements.
Thirdly, the RIN develop indicators for assessing the service quality of complete
transport routes (connections between central locations and to residential areas).
Service quality levels are determined for point-to-point speed and the ratio of private to
Page 124
100 Accessibility Instruments for Planning Practice
public travel time. This approach allows the transport routes to be assessed as "good"
or "bad" from the user’s point of view. It has been applied in planning practice like in
Transport Plans for the region of Stuttgart (Figure 3.14), Rhine-Main-Area or Thüringen.
Hence, the RIN shows that it is possible to develop a comprehensive system of
standards that is not only clear and pragmatic, but that also includes all transport
modes and all spatial levels from a detailed micro level to the macro accessibility of
agglomerations. As such, the RIN are an important component of basic mobility and
thus form an important component of sustainable transport development. This
component must be supplemented with criteria for the spatial elements of basic
mobility and by criteria for the environmental and economic aspects of sustainable
transportation development.
So far this system is limited on passenger transport. An implementation of standards for
freight transport modes will be developed in the next years. It could be used easily so
that there are no limitations. One lack at the moment is that this guideline is recognized
by traffic planners but not very well known by geographical or spatial experts.
3.8.6 References
Forschungsgesellschaft für das Straßen- und Verkehrswesen FGSV (2008) Richtlinien
für die integrierte Netzgestaltung RIN. FGSV: Köln.
3.8.7 Tables and Figures
Table 3.1 Target values for accessibility to central locations from residential areas
Central Location Journey time [min]
Car Public Transport
Basic centres (BC) 20 20
Mid-level centres (MC) 30 45
Upper-level centres (UC) 60 90
Source: FGSV (2008)
Table 3.2 Target values for accessibility to central locations from neighbouring central
locations
Central location Journey time to nearest neighbour [min]
Car Public Transport
Basic centres (BC) 25 40
Mid-level centres (MC) 45 65
Upper-level centres (UC) 120 150
Agglomerations (A) 180 180
Source: FGSV (2008)
Page 125
Chapter 3. Accessibility Instruments 101
Table 3.3 Categories for bicycle infrastructure and target values for travel speed for
daily traffic
Category Sub-Category Standard
range [km]
Target
speed
[km/h]
AR
Outside
built-up
areas
AR II Interregional bicycle
connection 10-70 20-30
AR III Regional bicycle
connection 5-35 20-30
AR IV Local bicycle
connection Up to 15 20-30
IR
Inside
built-up
areas
IR II
Inner-municipal
express bicycle
connection
- 15-25
IR III
Inner-municipal
standard bicycle
connection
- 15-20
IR IV Inner-municipal
bicycle connections - 15-20
IR V Inner-municipal
bicycle connections - -
Source: FGSV (2008)
Figure 3.14 Example of the Stuttgart Region: Quality Levels from A to F for the
accessibility by motorised individual transport.
Page 126
102 Accessibility Instruments for Planning Practice
Page 127
Chapter 3. Accessibility Instruments 103
3.9 Measures of Street Connectivity: Spatialist_Lines
(MoSC)
Author of report: Vasileia Trova
Organisation: Dept. of Architecture, University of Thessaly
Address: Pedion Areos, Volos 38334, Greece
E-mail: [email protected]
3.9.1 Background
How individuals move and interact between places is related to the spatial form of
these places. Spatial form in cities can be conceived in terms of networks of streets and
related routes, open spaces, clusters of land parcels and buildings. This physical
infrastructure both accommodates and shapes circulation of different kinds
(pedestrian, vehicular, public transportation). Therefore the form of physical
infrastructure can either facilitate or impede this circulation and consequently human
presence in public space.
Spatialist_Lines has been developed within the broader context of syntactic studies.
Syntactic studies argue that the spatial structure of urban areas plays a significant role
in pedestrian movement and land use distribution. Originally in space syntax the focus
was on links that are defined as lines of sight or as lines of unobstructed movement
(axial lines). A unit distance was associated with a link between one axial line and
another, and thus the accessibility between streets was measured as a count of links
that need to be crossed to move from one axial line to another. The actual length of a
street is irrelevant as far as it can be represented by one line of sight. In this sense, the
connectivity of the network was defined topologically and distance had no meaning.
Spatiality_lines introduces metric values into this framework so that the proposed
measures combine topological and metric properties. It aims at contributing a way of
measuring how a street grid becomes metrically denser or sparser, more or less
intelligible and more or less easily accessible.
This approach might help to bridge the gap between understanding urban structure,
urban design, and urban regulation. One practical outcome is to support the appropriate
design of streets as part of urban developments. For example it can inform us on how
the street network can be designed so as to ensure that some places, intended as retail
hubs, business cores or local centres, will be more likely to attract higher densities of
movement, whereas others, intended for residential uses, will remain quieter (Hillier,
1993).
Page 128
104 Accessibility Instruments for Planning Practice
3.9.2 Conceptual framework and theoretical underpinnings
One can distinguish four different approaches regarding description and evaluation of
street connectivity (Ozbil et al., 2011).
The first one resorts to typological distinctions between rectilinear, curvilinear and cul-
de-sac layouts. These distinctions are supported by measures of the average properties
of street networks, such as the number of intersections or cul-de-sacs by unit area.
A second one directly discusses the connectivity of street networks as a factor that
affects accessibility and walking. The measures used include density of street
intersections per area, block size per area, cul-de-sacs per area, proportion of four-way
intersections, the ratio of intersections to cul-de-sacs, the links–nodes ratio, or the
average distance between intersections.
A third approach uses measures that can characterize a particular location within a
network such as the walking catchment area around a destination of particular
importance or the directness of available routes from various surrounding origins to
destinations of importance.
The fourth one takes a configurational approach and it is associated with space syntax
studies. It involves measuring the accessibility of all parts of a network under
consideration from each individual street element. The intent is to provide a generalized
description of spatial structure and connectivity hierarchy without making assumptions
about desirable or typical trips.
Following this last, syntactic approach, Spatialist_Lines defines accessibility in terms of
street connectivity as a specific form of relatedness that arises according to the
structure of street networks. Street networks are mechanisms that serve the purposes
of connectivity in the broad sense. Connectivity is comprehended as a generator of
urban potential. Urban potential can be thought of as the quantity of destinations that is
available within a given distance of movement from a point. From the point of view of
movement, potential access is the fundamental form of spatial relatedness.
3.9.3 Operational aspects
A research team from Georgia Institute of Technology has proposed three measures of
street connectivity that can discriminate between the connectivity potential of individual
road segments in adjacent or proximate positions. These are Metric reach, Directional
reach and Directional distance (Peponis et al., 2008). When averaged over an area,
they provide robust measures of overall connectivity. In other words, the three
aforementioned measures can be used to describe the aggregate connectivity
differences between urban areas, as well as the internal spatial structure of a single
urban area.
Stated simply, metric reach (Figure 3.15) measures the length of street which lies within
a parametrically specified network distance from a point.
Directional reach (Figure 3.16) measures the length of street which lies within a
specified number of direction changes from a point, with a specification of the minimum
Page 129
Chapter 3. Accessibility Instruments 105
angular threshold that defines a direction change. While metric reach “grows” around a
root point equally in all available directions, directional reach is “biased” according to
the linear alignment of streets.
Directional distance measures the average number of direction changes, subject to a
parametric angular threshold, that are needed in order to access the parts of a given
metric reach. In order to characterize a network, the measures are applied to the mid-
points of all road segments in a system. In principle, they can be applied to a more
limited set of chosen points (for example to the entries to schools or shops) or to a
larger set of points (for example to all street intersections in addition to all road
segment mid-points).
Spatialist_lines is a JAVA-based software which has been developed at the Georgia
Institute of Technology by Peponis, Bafna and Zhang, and is currently available “as is”
upon request addressed to [email protected] without technical support
other than provided in a simple manual originally intended for distribution to new
members of the Georgia Tech research team. The software operates as a plug in to
ArcView GIS.
The software takes as input street centre line information from standard GIS street
network data bases or CAD files in DXF format. It provides as output the measures of
metric reach, directional reach and directional distance. Results are also displayed in
colour street maps.
Time length of calculation ranges from seconds to few hours depending on the size of
the street network and the available computer power. A basic knowledge of GIS
software is required to perform the calculation. Visuals maps are easy to be
comprehended and there is no need for technical expertise to understand the
differentiations and hierarchies of the urban grid in question.
3.9.4 Relevance for planning practice
The approach can inform urban design decisions in creating new streets or realigning
existing ones. The notion that street layout can and should serve planning aims is an old
one. What have been missing are measures of street connectivity that can support
decisions about street layout design. The proposed measures are useful in this context.
They mediate between urban planning and urban design. Urban planning is oriented
towards principles of general applicability and tends to be concerned with the average
or aggregate properties of areas. Urban design is concerned with the internal structure
of areas and with the way in which street layout impacts the nature, orientation and
performance of building developments for which it provides the context. Walking is,
after all, a pre-eminently context-dependent activity, one that occurs according to the
fine grain of environment, as well as its larger scale structure. This is why we need
enriched models of street layout and urban form in order to better design for walkability.
The fact that direction changes are as important as metric distance in describing street
connectivity points to the role of cognitive factors. Traditional models of movement
patterns are based on the consideration of distance and time, but they do not take into
account the intelligibility of urban form. Integrating considerations of intelligibility can
lead to enhance models of urban form and function (Ozbil et al., 2011).
Page 130
106 Accessibility Instruments for Planning Practice
Spatialist_lines has been used to support design and planning decisions in practice. In
summer 2010, the software was used to assist Perkins and Will in the master-plan for
the King Abdullah University of Science and Technology Science Town (KAUST) 5. This is
to be developed in Saudi Arabia, on a 790 acre site, north of Jeddah.
The Georgia Tech research team worked with the urban designers to ensure that the
main road network, the linear pedestrian spine and the master-plan stipulations would
work together as an intelligible, flexible and effective framework for the growth of a
vibrant research, development and business community. Specific programmatic aims
served by road and path connectivity include the support of serendipitous interaction
and communication as well as the provision of an accessible and intelligible system of
support functions such as social meeting places, retail, cultural centres, restaurants
and other amenities.
The process of consultation included a design guideline which was discussed with
urban designers in the beginning of the design process; analyses of the proposed
network to confirm that it took the best possible advantage of connections to the pre-
existing context (Figure 3.17) and that its internal structure was suitable for the phased
development of the town ; proposals of specific urban elements (such as the “research
souk” ) which would enhance the emergent pedestrian circulation system and finally
calibration of the location of local hubs (such as open spaces, incubator complexes, or
specific buildings), that will punctuate movement over the network of streets and paths.
3.9.5 Strengths and limitations
From a scientific point of view the proposed connectivity measures enrich a
considerable body of literature that points to a relationship between the distribution of
pedestrian movement and the spatial structure of street networks. They underline the
importance of the street network as the long-term framework that impacts the evolution
of important aspects of urban function, including walkability, and patterns of land use
that benefit from walkability. Furthermore they are sensitive to the geometry and the
metric properties of the spatial structure of street networks.
From a practice point of view the proposed connectivity measures are critical for
understanding the relationship between urban network design and practical
consequences. Measures that emphasize the average properties of areas can be
useful in supporting general guidelines and policies, but cannot inform design decisions
about alternative street alignments or alternative ways of fronting and orienting
developments. The specific measures of connectivity affect the interface between urban
design and urban planning. Understanding how pedestrian movement is distributed
over an area is important to urban development and urban design, because it helps the
design team determine the potential character of individual streets.
5http://www.perkinswill.com,
https://www.worldarchitecturenews.com/index.php?fuseaction=wanappln.projectview&upload_id=
17428
Page 131
Chapter 3. Accessibility Instruments 107
Planning practitioners adopted the proposed consultation process and measures with
no negative reactions. More than that, it seems that their original decision to adopt the
specific consultation process was mainly based on the academic performance of the
method.
This argues against the underlining idea that the academic and the professional
environments are two separate areas with completely different requirements and goals.
On the contrary it seems that academic performance influences professional choices.
Accessibility in urban context is a complicated issue. All accessibility instruments are
limited in the sense that they focus on specific aspects of the problem and
consequently they cannot explain everything. Spatialist_Lines have not been tested
extensively in practice as it is a new instrument. Judging from its nature and
background we can anticipate that negative reactions probably will be similar with those
concerning space syntax instruments (i.e., practitioners having too high expectations of
the results, or being unable to translate results without a theoretical background). For
the time being developers are testing the instrument in academic research
3.9.6 References
Haynie S.D. and Peponis J. (2009). Atlanta: A Morphological History. Proceedings of the
7th International Space Syntax Symposium Ed D Kooh, L Marcus, J Steen,
Stockholm:KTH pp 087:1-087:13.
Hillier B. (1993). Specifically Architectural Knowledge, The Harvard Architecture Review,
Vol. 9: 8–27.
Ozbil A., Peponis J., Stone B. (2011). Understanding the link between street
connectivity, land use and pedestrian flows, Urban Design International, Vol. 16: 125–
141.
Peponis J., Bafna S., Zhang Z. (2008). The connectivity of streets: reach and directional
distance, Environment and Planning B: Planning and Design, Vol. 35: 881-901.
Page 132
108 Accessibility Instruments for Planning Practice
3.9.7 Figures
Figure 3.15 Metric Reach Map of Atlanta. The 10 interval colour range red-blue
represents the spectrum from higher to lower values. (Source: Haynie et al., 2009)
Figure 3.16 Directional Reach Map of Atlanta. The 10 interval colour range red-blue
represents the spectrum from higher to lower values. (Source: Haynie et al., 2009)
Page 133
Chapter 3. Accessibility Instruments 109
Figure 3.17 Directional Reach Map of KAUST . The 10 interval colour range red-blue
represents the spectrum from higher to lower values. (Source: KAUST Masterplan
guidelines)
Page 134
110 Accessibility Instruments for Planning Practice
Page 135
Chapter 3. Accessibility Instruments 111
3.10 Interactive Visualization Tool (InViTo)
Author of report: Stefano Pensa
Organisation: SiTI 6 – Politecnico di Torino
Address: Via Pier Carlo Boggio 61, 10138 Torino
E-mail: [email protected]
3.10.1 Background
The instrument developed by SiTI, called InViTo (acronym of Interactive Visualization
Tool), aims to provide a visual interactive support to large scale planning processes. The
tool is intended to provide an effective basis for sharing information and enabling
discussion among different actors such as planners, stakeholders and, in general, non-
expert people within focus groups, workshops, participative and collaborative
processes.
The decision to develop this instrument stems from the need to analyse the relations
between urban development and spatial elements, such as transport facilities or
landscape issues. Since accessibility is one of the factors which most influence location
choices, a specific study has been dedicated for its investigation.
The main strength of InViTo is represented by the possibility of managing interactive and
dynamic scenarios, in order to visualize in real time the effects of decision making on
urban form and to support the planning processes. Due to its flexibility, the tool can be
used for several applications and in different fields of research which need to visualize
geo-referenced data on maps. In this COST Action, InViTo is presented as a tool for
calculating and visualizing accessibility in real time during participated planning
processes.
3.10.2 Conceptual framework and theoretical underpinnings
InViTo has been designed to support urban planning processes. It aims to improve the
cognitive process through an interactive framework, which combines different data in a
complex structure of relations and connections. A specific spatial behaviour can be
assigned to each data. Each behaviour can be described through a mathematical
function, providing a spatial effect on settlements. For example, a new subway line
interacts with the suitability of residential zones as well as the localization of a railway
station modifies the perception of the area (Pensa et al., 2011).
All the mathematical functions can be activated and modified in real time during the
participatory process by the participating actors, who can operate on the following
elements:
6 SiTI – Higher Institute on Territorial Systems for Innovation - is a non-profit association, set up by
the Turin Polytechnic and the Compagnia di San Paolo in order to produce research and training
orientated towards innovation and socio-economic growth.
Page 136
112 Accessibility Instruments for Planning Practice
Mathematical functions. For instance, if experts do not agree on the catchment area of
a railway station, they can change the values assigned to the specific element.
Weights among the spatial elements. Users can define the singular weights which
correlate to different spatial elements.
Outlines of routes. For example, it is possible to change the path of a public transport
line in the project.
Due to its characteristics, the tool is particularly suitable for measuring accessibility,
here intended as the walking time to the nearest public transport access points (e.g.
bus stops or railway stations). Walk distances are calculated on the pedestrian network,
as shown in Figure 3.18, and then divided on the average walking speed.
3.10.3 Operational aspects
Nowadays technology provides different solutions to visualize data and relate them to
specific features of the object of study. For this reason, existing software have been
investigated in order to find the most useful and appropriate for the specific tasks. In
particular, this software should be a single tool able to manage and display data,
variables and outputs with the possibility to customize it. Furthermore, it should be able
to work in real-time relating choices and areas of interest and creating immediate
outputs. Finally, it should allow the construction of a method replicable and easily fitting
to different sorts of case studies.
The chosen software has been Rhinoceros combined with its free plug-in Grasshopper.
The former is a commercial 3D modelling tool developed by McNeel & Associates, while
the latter, Grasshopper, is a plug-in that allows users to create shapes using generative
algorithms that can contain different kind of input including numeric, textual,
audiovisual and so on.
Normally this software is used at the furniture or building scale in industrial design and
in the architectural field, but Rhino and Grasshopper are here used in an innovative way
to study and analyzing spatial issues in large area decision processes.
First of all the combined use of these two pieces of software creates a generative
instrument, that allow the drawing of shapes without modelling. Other benefits are
related to their parametric features, which allow each data to be associated with one or
more mathematical equations and create relationships among them for defining shapes
and their behaviours. It is dynamic, so that the choices of users modify outputs in real
time according to rules described with algorithms. Furthermore, it is easy to customize
using common scripting languages like C#, Python or VB.
The availability and costs of databases depend on the specific case study. Road
networks are freely available from open source web sites as “Open Street Maps”, but
InViTo can use different kind of sources.
Finally, taking advantage of the possibility to describe feature behaviours in a
parametric way, the tool can be also used for reproducing the dynamics of various
assessment methods, providing interactive visualizations for different purposes. For
example, the tool has been applied to reproduce the ANP assessment technique and
Page 137
Chapter 3. Accessibility Instruments 113
support collaborative processes (Lami et al., 2011). In this case, it has been used to
build dynamic maps showing costs and benefits of different scenarios concerning the
improvement of railway infrastructure in three different areas along the corridor 24:
Rotterdam - Genoa.
In the application of InViTo to accessibility, the main purpose is the evaluation of
planning options, which concern the localization of new public transport lines.
Therefore, accessibility is calculated as walk time from the nearest public transport
access points with reference to the pedestrian road network . The output of this
calculation is a map which defines point by point the level of accessibility to different
public transport modes (Figure 3.19) such as bus, subway and railway or all of them
(without considering, at this step of the research, different weights associated to
different modes depending on their level of service).
Results can be displayed in different ways, according to audience and level of expertise.
To simplify the understanding of the output, we chose to work on bi-dimensional maps
which lay on the studied area directly in Google Earth virtual globe. Each map shows
point by point the level of accessibility through a colour gradient based on a red-yellow-
green scale: red corresponds to worst value while green represents the best one.
3.10.4 Relevance for planning practice
The first application has been a pilot study on Northern area of Turin (IT). The test
intended to investigate the transformation effects of the new subway network on the
redevelopment of areas of interest.
In particular, the first application concerns the study of the relationship between
facilities and settlements, in order to define how public transport facilities influence the
localization of new settlements as a consequence of accessibility. This relation is useful
for the definition of the route of the new subway line, mapping the difference between
existing and future accessibility to public transport and defining the area which could be
advantaged or disadvantaged from the realization of a project option. The comparison
among different scenarios and the possibility to modify some element of the project as
well as their influence, provide data which can be used to build a discussion on a
shared basis of information.
A second application concerns new settlements on dismissed brownfields in the city of
Asti (IT) as a part of the European project “CircUse” (Circular Flow Land Use
Management), a Central Europe Programme co-financed by the ERDF. The tool has
been used for analyzing the suitability of different possible new functions for these
former industrial areas on the basis of reclamation costs, landscape issues,
accessibility, localization of green areas, transport and commercial facilities. As for the
Turin case study, the tool has shown to be useful in the evaluation of alternative
planning options.
3.10.5 Strengths and limitations
This tool’s main strength lies in its possibility of being adapted to different uses and
purposes, which can act on different scales. Each component of the model can be
Page 138
114 Accessibility Instruments for Planning Practice
evaluated and changed in real time on the basis of the considerations of experts, thus
providing scientific validation to the functioning of the model.
This tool facilitates the communication of information, providing a shared basis for
enabling discussions. Relations among data and their weights can be modified by users
and displayed in real time, allowing a full interaction between users and needed
information.
Another interesting aspect is represented by the possibility of visualizing the effects in
Google Earth. It, thus, allows non-expert users the possibility to visualize outputs in a
well-known environment, and with a user-friendly interface.
Further developments can be carried out.
First of all, the use of public transport changes city by city. In literature, different studies
can be found, but usually the peculiarity of each case makes complicated the
identification of the real behaviour of people. The next step will concern the definition of
the weights related to the different transport modes in order to obtain a general
accessibility to public transport. A further step will be the definition of accessibility as
perceived by people, which could be investigated and defined through specific studies
or surveys. This information will be useful to understand the quantity of people who will
potentially use the new transport line.
Secondly, the interface for changing the input values are not so user-friendly, so the
presence of a technician for the tool managing is required.
Future improvements concern the updating of the tool on the basis of feedback
received during workshops and focus groups, especially on the choice of the
visualization modality. The interface will be modified in order to be more user friendly.
3.10.6 References
Lami I. M., Masala E., Pensa S. (2011) Analytic Network Process (ANP) and visualization
of spatial data: the use of dynamic maps in territorial transformation processes. The
International Journal of the Analytic Hierarchy Process (IJAHP),Vol. 3 (2).
Pensa, S., E. Masala, C. Marietta (2011). The effects of decision-making on urban form:
A tool for supporting planning processes. Proceedings of the 7th international
conference on virtual cities and territories, Lisbon, October 11th to 13th, 2011,
Coimbra: Department of Civil Engineering of the University of Coimbra and e-GEO,
Research Centre in Geography and Regional Planning of the Faculty of Social Sciences
and Humanities of the Nova University of Lisbon, N.N. Pinto, J.A. Tenedorio, M. Santos,
R. Deus (Eds),
Page 139
Chapter 3. Accessibility Instruments 115
3.10.7 Figures
Figure 3.18 Northern metropolitan area of Turin: Pedestrian road network (white lines)
and the new subway line in project (grey lines) with new access points (black and white
dots)
Figure 3.19 Accessibility on the Northern Turin area visualized through a Green-Yellow-
Red Gradient Map.
(Note: From left to right the figure illustrates the accessibility to bus stops in the first
image, to subway stations in the second and to railway stations in the third. The fourth
one is the sum of the three, considering all the different transport modes with the same
weight.)
Page 140
116 Accessibility Instruments for Planning Practice
Page 141
Chapter 3. Accessibility Instruments 117
3.11 Gravity-Based Accessibility measures for
Integrated Transport-land Use Planning (GraBAM)
Author of report: Enrica Papa*, Pierluigi Coppola**
* Organisation: Dipartimento di Pianificazione e Scienza del Territorio DiPiST, Università
degli Studi di Napoli “Federico II”
Address: Piazzale Tecchio, 80, 80125 Napoli
E-mail: [email protected]
** Organisation: Dipartimento d’Ingegneria dell’Impresa, Università degli Studi di Roma
“Tor Vergata”
Address: Via del Politecnico 1, 00133 Roma
E-mail: [email protected]
3.11.1 Background
In transportation planning a paradigm shift is occurring: from mobility-oriented analysis
(which evaluates transport system performance based on quantity and quality of
physical travel) to accessibility-based analysis (which considers a broader range of
impacts and options) (Litman, 2010). The instrument described in this paper, is an
example of this shift which gives to accessibility measures a central role in transport
and urban planning.
Such accessibility instruments have been developed both for scientific and planning
motivations. In the academic field the important role of transport infrastructures for
spatial development is well recognized: areas with better access to the locations of
input materials and markets will be more productive, more competitive and hence more
attractive than remote and isolated areas (Linneker, 1997). However, the impact of
transport infrastructures on spatial development has been difficult to be verified
empirically; in fact, modeling analysis, such as those based on accessibility measures, is
necessary to investigate these impacts and to analyse the effects of transport
infrastructure and service improvements on the spatial distribution patterns. In other
words, the scientific question the accessibility instrument here presented, wants to
answer is “what are the impacts on the land use induced by changes in the
transportation system?”
The scientific question has direct implications for planning, related to the distributive
issues of transport interventions: the goal of the accessibility instrument is to assess
and to value the benefits of changes in either the land-use or the transportation
systems, as a performance indicator of integrated land-use and transport planning. In
other words, the question the instrument wants to address is “who reaps the
accessibility benefits from investments in the transport system and where are these
located?”
Page 142
118 Accessibility Instruments for Planning Practice
3.11.2 Conceptual framework and theoretical underpinnings
The accessibility typically measures “the ease and convenience of access to spatially
distributed opportunities with a choice of travel” (U.S. Department of Environment,
1996). Several definitions, and related measures, can be found in the literature. Here
we propose a “gravity-based” measure of accessibility, so called “gravity-based” since it
can be derived from “gravity-type” trip distribution model (see Hansen, 1959); this has
been used in various analyses (Geertman and Ritsema van Eck, 1995).
Starting from the general definition of “gravity-based” measures, two types of
accessibility have been considered, referred to as “active” and “passive” accessibility
(Cascetta, 2009). The active accessibility of a given zone i is a proxy of the ease of
reaching the activities/opportunities located in different zones j of the study area for a
given purpose (e.g. workplace, shopping) moving from i:
(3.7)
where Wj is the activity/opportunity to reach in zone j, and cij is the generalized cost of
reaching zone j from zone i.
On the other hand, the passive accessibility is a proxy of the opportunity of an activity
located in a given zone i to be reached from the potential “consumers” coming from all
the other zones j of the study area for a given purpose (e.g. the clients of a shop):
(3.8)
where Wj are the potential “consumers” of the activity/opportunity to be reached in the
zone i, and cji is the generalized cost of reaching zone i from zone j.
Such definitions do consider the accessibility of a given zone as a sum of the
generalized travel costs between zones itself and the other zones of the study area,
weighted by an attraction term representing either the opportunities to be reached in
the other zones (in the case of the active accessibility) or the potential “consumers” of
the opportunity located in the given zone (in the case of the passive accessibility). The
weights are typically powered by an exponent greater than one to take into account the
agglomeration effects (if any), whereas the impendence function, f(cij), typically includes
the travel time in a negative exponential form, based on the assumptions that: the
attraction of a destination increases with size and declines with distance or travel time
or cost (i.e. the gravity-based assumption).
In doing so, the accessibility measure can include both the effects of changes in the
transportation systems, captured by means of the function f(cij), and in the land use
patterns (captured by the weights Wj).In that, gravity-based accessibility indicators are
more powerful than travel time accessibility indicators 7 and daily accessibility
7 measures the accumulated generalised travel costs to the set of destinations: all destinations in
the set get equal weight irrespective of their size and all other destinations are weighted zero (the
activity function is rectangular).
Page 143
Chapter 3. Accessibility Instruments 119
indicators 8 ; moreover, they are founded on sound and consolidated behavioral
principles of the Random Utility Maximization (Ben-Akiva and Lerman, 1985).
3.11.3 Operational aspects
The accessibility indicators we have tested are:
the active accessibility of the residents towards the workplaces of a study
area;
the passive accessibility of the economic activities with respect to the
residents of a study area.
The active accessibility measures have been calculated as:
(3.9)
where: E(j) is the number of workplaces in the zone j; C(i,j) is the generalized travel cost
(i.e. weighed sum of the travel time and travel costs) between zone i and zone j; α1 and
α2 are parameters to be calibrated (see Coppola and Nuzzolo, 2011).
The passive accessibility measures have been calculated as:
(3.10)
where: Res(j) is the number of people residing in zone j (i.e. the potential clients of the
economic activities in i); C(j,i) is the generalized travel cost between zone j and zone i; γ1
and γ2 are parameters to be calibrated.
The above definition of the accessibility measures requires the subdivision of the study
area (and portions of the external area) into a number of discrete geographic units
called traffic analysis zones (TAZ’s) and the definition of the relevant infrastructures and
services (Figure 3.20). All trips that start or end within a zone are represented as if their
terminal points were in a single fictitious node called zone centroid.
To physically delimit the zones, the criterions generally adopted can be summarized in
respect of (Cascetta, 2009):
the physical geographic separators placed on territory as railways, rivers,
etc.;
the official administrative limits as census sections, municipal borders, etc.;
homogeneity: the land use, socioeconomic characteristics, and their
accessibility to transportation facilities and services.
In general the number of the zones inside the study area is closely connected to the
end-users’ level to be achieved. In our case study, the Regione Campania has been
subdivided into 383 “homogeneous” traffic zones with respect both to their land-use
characteristics (e.g. level of population and economic activities) and to their accessibility
8 Based on the notion of a fixed budget for travel, generally in terms of a maximum time interval in
which a destination has to be reached to be of interest.
Page 144
120 Accessibility Instruments for Planning Practice
to transportation networks. A traffic zone represents either one municipality, or a group
of municipalities (typically the small ones) or part of a municipality (this is the case of
the large cities).
Zoning is related to the subsequent phase of selection of the relevant supply elements
and the definition of the transport supply graphs. By means of these graphs the OD
travel costs and travel times needed for the computation of the generalized travel cost
can be estimated.
The datasets used in the accessibility instrument here presented include:
Origin-Destination (OD) tables for inter-zonal travel time and travel costs;
Demographic and socioeconomic data (e.g. the employment distribution) by
each zone;
Zone geographic boundary files.
Socioeconomic data (workplaces and resident per zone) are typically available and
acquirable from the National Institute of Statistics (e.g. the ISTAT in Italy). The
implementation of the transport supply model is more complex, in that it requires the
collection of the characteristics of transportation infrastructures and services in the
study area, and the implementation of such elements into a simulation software
package. In our case, the data have been processed using the “TransCAD
Transportation GIS Software”, that require a medium-high degree of technical expertise
to perform the calculations and for the interpretation of results.
The calibration of the parameters, which might represent the mayor difficulty of the
accessibility instrument, requires the estimation of a gravity-based trip distribution
model using a survey carried on in the specific case study, or, alternatively, adapted to
the case study from similar ones.
3.11.4 Relevance for planning practice
The above accessibility instruments can be used to measure the distribution of wider
economic benefits of alternative transportation projects. Furthermore, by working with
data in a GIS environment, the spatial distribution of current accessibility levels as well
as future changes in accessibility can be displayed (Figure 3.22). Accessibility levels and
changes can be associated with socioeconomic data available at the zone level to
estimate how current accessibility and benefits may vary by socioeconomic group.
Furthermore the accessibility indicators can be also calculated for a specific transport
mode (road, rail, multimodal transport), for a precise trip purpose, for a particular
economic activity category and/or for a specific social group of residents.
These accessibility measures can be used in a variety of operational planning and
public involvement activities of transportation agencies where it is necessary to
evaluate how the impacts of new infrastructures and transportation services are
distributed. Moreover, they could be integrated in a more complex Land-Use Transport
Interaction (LUTI) modeling structure (see for instance Figure 3.21), to simulate the
impacts of changing accessibility on the residential and economic activity spatial
distribution, as well as on dwelling prices (see for instance Coppola and Nuzzolo, 2011).
Page 145
Chapter 3. Accessibility Instruments 121
In this respect, they are useful in the Land-Use/Transport decision making process to
identify an interrelation between the accessibility and the changes in the population and
economic activities spatial distribution pattern, as well as on the dynamics of the real
estate market.
In this respect, they have been already used in several applications in transport
planning processes, in different feasibility studies for transport infrastructures
assessment, and in Transport Masterplans at different scales (urban, provincial and
regional). One of the latest applications regards the Regional Metro System Plan (RMS)
of the Campania Region (South-Italy), which is an integrated land-use, infrastructure and
operational plan, including Naples and the whole Campania Region (see Cascetta and
Coppola, 2004; Cascetta and Pagliara, 2008).
It’s important to stress that these measures in the Italian context are not the common
practice used in city and urban planning tools; they are mainly used in transport
planning decision process.
3.11.5 Strengths and limitations
From a scientific point of view, the described instrument has a strong theoretical base,
which is well accepted in transport planning field. Furthermore the modeling framework
takes into account the spatial interaction between the distribution of the demand and
the accessibility level of opportunities (competition effects). Moreover this accessibility
measure, in principle, can take consideration of the variations across individuals; in
other words the measure could be specified differently according to the characteristics
of individuals for whom the accessibility is being estimated.
From a practice point of view the complexity of the model framework might require high
hardware and software requirements and a certain degree of technical expertise to
perform the calculation. Accessibility calculation is immediate once the Level of
Services - LOS values have been defined, but LOS calculation for large networks can
take excessive time in execution. For example in the described application, where the
Campania Region road graph consisted of 1.900 nodes and 650 links, the LOS values
calculation time can vary from 15 to 60 minutes (in large part to write the OD tables on
the hard disk) according to whether a congested or not congested network assignment
model is used. In terms of memory usage the proposed instrument uses minimum
space during computation.
The proposed instrument can be easily integrated with GIS in order to create and
customize maps, build and maintain geographic data sets, and perform many different
types of spatial analysis. According to this further improvements of the instrument can
provide a more clear visualization module that could facilitate feedbacks in the
consultation process with local authorities and economic stakeholders. It is necessary,
in fact, to better disseminate and visually represent accessibility measures that could
significantly enhance understanding, and engage a wide range of stakeholders and thus
help to bring this important challenge further into the public arena. On the other hand,
the possibility of a multimodal transport analysis can provide insights into the equity of
alternative transportation investments.
Page 146
122 Accessibility Instruments for Planning Practice
3.11.6 References:
Ben-Akiva M. and Lerman S. (1985), Discrete Choice Analysis. MIT Press.
Cascetta E. and Coppola P. (2004), The Regional Metro System of Campania Region:
from planning to operations. Proceedings of the European Transport Conference 2004,
© Association for European Transport, Strasbourg, France.
Cascetta E. and Pagliara F. (2008), Integrated railways-based policies: The Regional
Metro System (RMS) project of Naples and Campania, Transport Policy, Vol.15 (2): 81-
93.
Cascetta E. (2009), Transportation System Analysis Models and Applications. Springer.
Nuzzolo A. and Coppola P. (2007), Regional accessibility and socioeconomic activities
location: from empirical evidences towards a modeling framework. In: Proceedings of
World Conference on Transportation Research, Berkeley CA.
Coppola P. and Nuzzolo A. (2011), Changing accessibility, dwelling price and the spatial
distribution of socio-economic activities, Research in Transportation Economics, Vol.
31: 63-71.
Engwicht D. (1993), Reclaiming Our Cities and Towns: Better Living with Less Traffic.
New Society Publishers, available at: www.newsociety.com.
Geertman, S.C.M., van Eck, R., Jan, R., (1995), GIS and models of accessibility potential:
an application in planning, International Journal of Geographical Information Systems,
Vol. 9 (1): 67–80.
Hanson W. G. (1959), How Accessibility Shapes Land Use, Journal of the American
Institute of Planners, Vol. 35 (2): 73-76.
Linneker B. (1997), Transport Infrastructure and Regional Economic Development in
Europe: A Review of Theoretical and Methodological Approaches. Report to SASI Project.
TRP 133. Sheffield: Department of Town and Regional Planning.
Litman T. (2010), Evaluating Accessibility for Transportation Planning Measuring
People’s Ability To Reach Desired Goods and Activities. Victoria Transport Policy
Institute, available at: http://www.vtpi.org/access.pdf
Nuzzolo A. and Coppola P. (2007), Regional accessibility and socioeconomic activities
location: from empirical evidences towards a modeling framework. In: Proceedings of
World Conference on Transportation Research WCTR 2007, Berkeley CA.
U.S. Department of Environment (1996), Policy and Procedure Guidelines, PPG 6.
Page 147
Chapter 3. Accessibility Instruments 123
3.11.7 Figures
Figure 3.20 The calculation of generalized travel cost zone accessibility indicators in the
present scenario
Figure 3.21 The accessibility measure as input data in LUTI model structure
Supply model:
facilities and
services that
connect study
area traffic
zones
Socioecono
mic variables
Res(i)
Spatial
discretization
(zoning):
discrete
subareas
(traffic analysis Accessibility
indicators
Output
data
Model
Input
data
Generalized
Costs
C(o,i)
Page 148
124 Accessibility Instruments for Planning Practice
Figure 3.22 An example of representation of active and passive accessibility in
Campania Region (Nuzzolo and Coppola, 2007)
Page 149
Chapter 3. Accessibility Instruments 125
3.12 Joint-accessibility Design (JAD)
Author of report: Thomas Straatemeier
Organisation: Goudappel Coffeng & Universiteit van Amsterdam
Address: De Ruijterkade 143, 1011 AC Amsterdam
E-mail: [email protected]
3.12.1 Background
In both the scientific and professional community the need to integrate transport- and
land use policies in order to achieve more sustainable mobility patterns is widely
recognized. However, in practice these integrated strategies are hard to come by. The
concept of accessibility provides a basis for making trade-offs between land-use and
transportation policies that has been sorely lacking, since it relates to features of the
transport system (e.g. speed, and travel costs) as well as the land-use system (e.g.
densities and mixes of opportunities). It is a well-known and studied concept within the
scientific literature, but its use in practice however is still limited. The motivation for
developing the accessibility instrument was to support integrated transport and land-
use strategy making in planning practice. The scientific questions where threefold:
How to measure accessibility to support integrated transport and land-use 1.
strategy making?
How to use accessibility measures in integrated transport- and land-use 2.
strategy making processes?
Does the use of accessibility measures in planning practice lead to more 3.
integrated transport- and land-use strategies?
It is important to highlight that the measure that is chosen depends on the planning
process for which it is used.
3.12.2 Conceptual framework and theoretical underpinnings
We defined accessibility in zone x as the opportunities in all other zones that can be
accessed within a certain travel time and cost. In other words this means that
accessibility indicates the potential space for action that people and firms located in a
particular place have to engage in spatially and temporally dispersed activities. Using
this definition accessibility cannot only be directly related to the qualities of the
transport system (e.g. travel speed or costs), but also to the qualities of the land-use
system (e.g. densities and mixes of opportunities). It thus provides planners with the
possibility to understand interdependencies between transport and land-use
development, and thus support the exploration of the scope for joint action.
There has been little attention within the scientific community for the application of
accessibility in planning practice. Handy and Niemeier (1997) are a welcome exception.
As Handy and Niemeier (1997, p.1182) signal: “The trend in transportation planning
literature has been towards more disaggregate and complex representations of
Page 150
126 Accessibility Instruments for Planning Practice
accessibility.” However, more complex accessibility measures, such as utility-based
measures, while more sophisticated from a theoretical point of view, also require more
analytical skills from the participants making it harder to use such measures in practice.
In order to be useful for practical planning purposes, an accessibility measure must
meet two basic requirements: on the one hand it must be consistent with the real
accessibility needs of the relevant social actors (people, firms); on the other hand it has
to be understandable to policy makers (Bertolini et al., 2005). In this respect two
hypotheses are advanced. The first is that it is not possible to use complex measures in
the phase of policy design. The second hypothesis is that relatively simple measures
can already provide insights that can help develop more integrated transport and land
use policies.
3.12.3 Operational aspects
The exact accessibility measure is different in each application, since the measure is
developed together with planning practitioners and to address a specific planning
problem. The accessibility measures are related to societal goals, such as social
cohesion, economic competitiveness and sustainability (see Table 3.5). Accessibility is a
way of relating transport policies to societal issues. A potential accessibility measure is
always the starting point. In the section for illustration the measures that have been
developed in the case of Almere are described.
The accessibility analysis was carried out using a potential accessibility measure with a
distance decay function. This means opportunities that are closer are given a stronger
weight than more distant opportunities. Table 3.4 shows the different impedance
functions depending on the spatial scale and the mode of transport. The travel times
shown in Table 3.4 indicate the turning point in our impedance functions, or the travel
time where there is a 50% trip likelihood. These travel times where estimated with the
use of the 2007 national travel survey (Mobiliteitsonderzoek Nederland/MON). Travel
times and accessibility scores were calculated using a combination of a multimodal
local and regional transport model. Travel times by car were calculated for the inter-
peak period. Travel times for public transport include waiting time and time needed to
travel to and from the station. The local model has 600 zones for Almere and has
detailed data on inhabitants, jobs and services. Depending on the planning goal access
to different type of opportunities was measured. To improve social cohesion we
measured access to basic services (shops, health care, education etc.), while for
economic competitiveness access to jobs on a regional level was measured (see Table
3.5, Figure 3.23 and Figure 3.24).
Each zone of the model has between 50-2.000 inhabitants. The local model was used
to calculate the accessibility measures on neighbourhood and city level. To calculate
the metropolitan accessibility scores the local model was combined with the regional
model. This model has much less detail outside Almere (1.000-20.000 inhabitants per
zone).
The spatial and travel time data is not freely available but owned by the municipality.
They make the data available to researchers or consultants if they think this is useful for
a particular project. When you have obtained the travel times the accessibility analyses
Page 151
Chapter 3. Accessibility Instruments 127
are relatively easy to carry out using GIS. Basic GIS skills are sufficient. Calculation time
for the transport model is one-day, once the travel times are loaded into the GIS set-up.
The actual production of the accessibility maps itself takes 15 minutes per map (in this
phase the impedance function can be adjusted, or the type of activity).
3.12.4 Relevance for planning practice
The joint-accessibility-design framework has been used in three cases in the
Netherlands, they were applied to real planning problems and developed with planning
practitioners. It is important to highlight that the set-up was more of an experiment
outside the real planning process. However, results of the analysis have been used in
the real planning process in all the cases.
The limited number of participants in each of the cases forces us to be humble about
generalizing our conclusions, but we discovered some interesting benefits of using
accessibility as a concept to design integrated transport and land-use strategies:
Accessibility strengthens the knowledge about the geographical distribution
of opportunities and how these are influenced by interventions in the
transport and land-use system;
It increases awareness about the development potential of locations and
how well different activity patterns can be served in a particular location.
It is important to have a multidimensional perspective in your accessibility
analysis since accessibility can differ quite a lot depending of the mode of
transport or type of opportunities you look at;
Accessibility makes it possible to develop transport strategies that improve
the accessibility of locations you want to develop and/or develop a land-use
strategy that takes into account the development potential of locations
given their accessibility;
Accessibility can lead to different transport and land-use strategies
compared to a planning process in which only mobility impact analyses are
done;
Accessibility makes it easier to relate transport policies to wider societal
goals;
Accessibility is just one of the factors that influence development at a
particular location, but it seems to be an important precondition. If the
accessibility needs are not met it is very difficult to get development going;
To come up with the most suitable transport and land-use strategy it is
important to combine accessibility analyses and mobility impact analyses.
3.12.5 Strengths and limitations
During the cases it became clear that using simple accessibility measures, such as the
cumulative opportunity measure, already requires quite some explanation especially for
land use planners. It was thus decided to stick to a cumulative opportunity measure and
increase complexity only by placing different cumulative opportunity maps on top of
each other, or use a distance decay function if practitioners where able to understand it.
Page 152
128 Accessibility Instruments for Planning Practice
Sometimes complexity that was lacking in the accessibility indicators was added during
the discussions. Despite the problem of interpretation there were several indications
that accessibility does have the potential to be an integrative concept. A transportation
planner stressed the fact that “These accessibility maps were very helpful to me in
discussing the opportunities and threats of different spatial policy options with land use
planners”. On the other hand a land use planner noticed that with the help of the maps
a transportation planner took a much more active role in signalling opportunities for
economic development, rather than just pointing, as more usual, at mobility
management issues.
Questions were also raised about the kind of data that had been used. The traditional
four step transport model is designed to calculate the level-of-service on the regional
road system, while for calculating actual travel times a much more detailed road
network would be a better input. Data on travel time by public transport or slow modes
is also of low quality in traditional models. Next to this, the spatial data on the
distribution of activities was not always available on the same level of aggregation as
the zones of the transport model. As a result, when the accessibility maps were
examined in detail participants sometimes noticed things, which conflicted with their
perception of the actual situation. This made it hard for them to accept the information
unconditionally.
During the process, participants became more and more familiar with advantages and
drawbacks of the use of the accessibility maps. Most clearly was this the case with the
land use planners who were closely involved in all the workshops part of the strategy
making processes. They seemed to undergo a learning process, which was different,
and much more thorough, than that of those who just attended some of the workshops.
This suggests that involving participants in the production, not just the use of the
information could be an important success factor. In all instances it appeared crucial to
collectively decide what type of information to use in the accessibility analysis and make
clear what the drawbacks were of the use of a particular model. In other words,
accessibility measures have to be developed with the participation of those who will use
and learn from them, similarly to what has been found for other indicators.
Improvements of the instrument depend to a large extent on the context in which it is
being used, since the type of indicator depend on the planning problem being discussed
and the practitioners at the table. However improving the geographical representation
of the accessibility indicators is something that makes the maps easier to understand
for planners. The sometimes weird shapes of the transport model zones, especially the
large zones in rural areas, dominate the picture and hamper the interpretability. The
speed of the transport model to calculate different scenario is also something we look
to improve. Ideally, we would like to show the effects of a different transport and land-
use scenario during the course of one workshop. Figure 3.25, Figure 3.26 and Figure
3.27 show the results of analyzing different transport scenarios on the accessibility of
Almere.
Page 153
Chapter 3. Accessibility Instruments 129
3.12.6 References
Bertolini, L., F. le Clercq, Kapoen, L. (2005), Sustainable Accessibility: A Conceptual
Framework to Integrate Transport and Land Use Plan-Making. Two Test-Applications in
the Netherlands and a Reflection on the Way Forward, Transport Policy, Vol. 12 (3):
207–220.
Handy, S., and Niemeier, D.A. (1997), Measuring Accessibility: An Exploration of Issues
and Alternatives, Environment and Planning A, Vol. 29 (7): 1175–1194.
3.12.7 Tables and Figures
Table 3.4 Travel times with a 50% trip likelihood
Spatial scale Bike Public Transport Car
Neighbourhood 10 min. 10 min. -
City 20 min. 20 min. 15 min.
Metropolitan - 45 min. 30 min.
Table 3.5 Accessibility needs and planning goals
Goal Spatial scale Accessibility needs Preferred modes of
transport
Social Cohesion Neighbourhood
City
Access to basic
services (child care,
health care, daily
shopping, social
services and
sporting facilities)
Bike and public
transport
Economic
competitiveness Metropolitan
Access to labor
force
Access to
international Airport
Car and public
transport
Variety in living
environments
City
Metropolitan
Access to
restaurants, bars,
cultural facilities
and non-daily
shopping
Access for people
Different
combinations of
car, Bike and public
transport
Sustainable growth City
Metropolitan Access for people
Ratio Car / Public
transport
Page 154
130 Accessibility Instruments for Planning Practice
Figure 3.23 Access to basic services Bike (10 min.)
(Note: Darker colours indicate higher accessibility)
Figure 3.24 Access to bars, restaurants, non-daily shopping and cultural facilities,
Transit (20 min.)
Figure 3.25 Access to inhabitants Car (30 min. inter-peak)
Page 155
Chapter 3. Accessibility Instruments 131
Figure 3.26 Access for inhabitants Car (30 min. inter-peak) - Scenario Hub and Spoke
Figure 3.27 Access for inhabitants Car (30 min. inter-peak) - Scenario Metropolitan
Connectivity
Page 156
132 Accessibility Instruments for Planning Practice
Page 157
Chapter 3. Accessibility Instruments 133
3.13 Method for arriving at maximum recommendable
size of shopping centres (MaReSi SC)
Author of report: Aud Tennøy
Organisation: Institute of Transport economics
Address: TØI, Gaustadalleen 21, NO 0349 Oslo
E-mail: [email protected]
3.13.1 Background
This instrument has been developed by the planning authorities in Oslo, in order to help
dimension shopping centres in the municipality in accordance with their overall plan for
development of shopping and services (Municipality of Oslo, 2003). A description of this
plan and the system it is embedded in is attached as appendix. The planning authorities
apply the method, together with the plan itself, to calculate the maximum size for new
shopping centres or extensions of shopping centres in specific locations, in order for the
centre to serve a population about equal to the number living in walking- and bicycling
distance from the centre. The instrument and the plan are interrelated. I don’t think a
tool like this can be applied if not rooted in an overall plan. Further, the plan and the
method are in accordance with state-of -the-art knowledge in coordinated land use and
transport planning, and there are strong local and more general empirical evidence for
the main assumptions.
The sector plan for retail development in Oslo aims at a retail development supporting
and strengthening the existing retail structure. This is characterised by many smaller
retail centres, located in densely populated areas which are well covered by public
transport services, and with only the main city centre as a regional or city-wide centre.
This structure ensures that most people in Oslo have walking distance to their nearest
centre, which among others contributes to good accessibility to shopping and services,
low car shares on shopping journeys and to short shopping trips. Fewer and bigger
centres would increase the average travel distances from the homes to the nearest
shopping opportunity, and hence reduce accessibility and increase car use on shopping
journeys. This strategy has been followed for a long time in Oslo, and have resulted in a
‘many and small’ centre structure.
When the planning authorities give advice to developers and to decision makers
regarding the size of new retail centres, they calculate the maximum dimension of the
shopping centre based on the number of people living in the actual walking and
bicycling distance from the centre in the future, defined as within one km and between
one and two km. I refer in the following description to the plan and the method in
general (Municipality of Oslo, 2003), to research by Tennøy et al., (2010) regarding
methods for analyses in planning for relocation and dimensioning of shopping centres,
and to Tennøy’s (2012/forthcoming) case studies of application of this method in a
particular zoning plan process.
Page 158
134 Accessibility Instruments for Planning Practice
3.13.2 Conceptual framework and theoretical underpinnings
In the overall plan and the description of this instrument (it is not defined as an
instrument, it just explains how the planning authorities assess the shopping centres
with respect to localisation and size), accessibility to shopping and services is
understood and measured in terms of walking distance to the nearest shopping and
service centre from the inhabitants’ dwellings.
There are no references to grand theoretical underpinnings for this way of
understanding accessibility, unless the general understanding that the longer the
walking distance, the fewer can and will walk. This is particularly so when discussing
older people and people that for any reason have trouble walking. This is empirically
substantiated in the background report to the overall plan. It is not explained why they
chose these exact definitions etc.
3.13.3 Operational aspects
Accessibility is measured as real walking distance from dwelling to shopping centre.
In the Økern case, the number of people living within one km and two km real walking
distance of the site today and in 2025 was defined with the help of geographical
information systems (GIS) and data of location of residences, as well as known plans
and probable developments in the area, and population extrapolations. Thorough
knowledge of the existing retail structure is mandatory (context). This was combined
with empirical data regarding average spending in these kinds of centres (with the rest
being spent in the city centre). The future turnover of the centre was calculated based
on this.
Turnover (NOK) within walking and bicycling distance = number of people within 1 km
and between 1 and 2 km from the centre (persons) x percentages of spending at this
centre 9 (%) x spending per persons in such centres (NOK/person)
Figures for average turnover per square metre for such centres was collected (register
data), and the size of the future centre – given that it served people in walking and
bicycling distance, and have somewhere near average turnover per square metre – was
calculated:
Centre size (m2) = Turnover (NOK) within walking and bicycling distance/Average
turnover in similar centres (NOK/m2)
This is a simplified description, but it includes the main concept.
9 The share of their spendings will vary, depending among others on location and content of nearby
shopping centers. In this case, people living within 1 km were supposed to spend all of their
shopping money (except what is used in the city centre) here, while people living 1 – 2 km from the
centre would spend 30 % of their shopping money here and people living more than 2 km from the
centre would not spend money here. This is obviously a simplification of reality, but it is well
explained in interview why it is reasonable to do it.
Page 159
Chapter 3. Accessibility Instruments 135
By not allowing the centre to be bigger than this, one ensures that the centre does not
need to draw customers from outside walking and bicycling distance, and also that it
probably will not be attractive for people living other places to travel the extra distance
in order to do their shopping at this centre rather than at the centre closest to where
they live. It does not ‘steal’ customers from other centres and affect those centres
negatively. Still, it will be big enough to serve the local market and the majority of the
population will have shopping and services nearby.
The data required is the number of people living within one and two kilometres real
walking distance from the site of the proposed centre, as well as existing and expected
retail structure. GIS, maps, accessible population data extrapolations, and known plans
are relevant data, as are average register data for spending on shopping in such centres
and for necessary or average turnover per square meters in shopping centres.
The planning authorities emphasise that this method is not very time-consuming. The
calculations are straightforward, and no advanced model needs to be developed and
maintained. It requires mainly data that are available in a plan-making process anyhow.
Most planners should be able to carry out this analysis. Planning knowledge is the main
competence necessary. Only a very limited technical expertise is required.
3.13.4 Relevance for planning practice
The output of this instrument/method is the size of a new retail centre proposed in a
certain location that is necessary in order to be big enough to serve those living in
walking and bicycling-distance from it. The concrete output is the number of m2
necessary and recommended. The planning authorities recommend to not build larger
centres, since that may ruin the structure of provision from many and smaller centres.
This would cause reduced accessibility to shopping and services, as well as increase car
dependency and traffic volumes.
The instrument has been applied by the planning authorities in Oslo for some years. I
have studied the use of the method as part of the analyses for the zoning plan process
for Økern centre (Municipality of Oslo 2010, 2010a).
In this case, the initiators proposed to build a 60.000 m2 shopping centre as part of a
160.000 m2 project in a transformations area about 4 km from the city centre of Oslo.
This would be the biggest centre in Oslo, and only three centres are more than half the
size of the proposed one. The planning authorities applied this instrument/method to
arrive at the appropriate size according to overall plans, and to explain to the initiators,
the district politicians, the public and the decision-makers how and why a shopping
centre this size would affect the existing infrastructure negatively and contribute to
increased car dependency and traffic volumes.
With the help of the described instrument, they calculated the optimal size of the
shopping centre to be about 25.000 m2 in 2030 (of the total 160.000 m2). The
instrument was hence useful in the decision-making by allowing the planning authorities
to take a stand and explain why the proposed project is not in accordance with overall
plans, and to recommend the decision-makers to reject it. By these simple calculations,
they defined in a logical and easy to understand way what the right size of the centre
Page 160
136 Accessibility Instruments for Planning Practice
would be, if the project was to contribute to the defined objectives in the overall plans.
This also allowed relevant regional authorities to file formal complaints. This means that
the case will be decided by the Ministry of Environment rather than the City Council.
If this instrument had not been used (in combination with the overall plan), it would be
harder for the planning authorities to demonstrate the discrepancies between the
overall plan and its objectives, and the proposed project and its consequences. This
would also make it harder for the regional authorities to file formal complaints.
3.13.5 Strengths and limitations
The planning authorities claim that this method is understandable, transparent and
requires less work than other methods. Hence, all involved parties can apply it,
understand it, and contribute in the discussions regarding retail development.
In interview, the senior planner responsible for shopping and service development plans
explained that the planning authorities are pleased to have established a way to
calculate the size of new shopping centres that is rough, clear and understandable, and
that is firmly rooted in the overall plan.
The basic, simple and logical principles of the overall plans and the methodological
simplicity of the instrument are important. The overall plan contributes to the further
development and strengthening of the centre structure, and that there is no
unnecessary competition between the centres. The present method is simple, the
underlying assumptions are easy to understand, and the computation/analysis is not
very labour intensive to carry out. This is considered important and necessary because
the planning authorities in Oslo deal with many such cases and cannot have a tool that
is too labour intensive to use.
The developer and consultants can also make such calculations, and it is important that
the principles are clear and simple. Complicated and detailed analyses do not
necessarily offer more and better information to decision- and policy-makers. In Oslo,
the planning authorities see no need to do this in more detailed ways.
It is emphasised that the overall plan is the main steering tool. Such analyses are
nevertheless useful in planning processes, particularly because those working in the
planning authorities have different competences and expertise in this field. The
analyses help to clarify the consequences at the overall level and at the project level.
Tennøy et al.’s. (2010) evaluation of ‘retail planning’ in the 13 largest cities in Norway,
found that the combination of Oslo’s binding sector plan for retail (required at county
level in Norway) and the described method for dimensioning the centres meant that
Oslo had ‘the best’ planning practice for retail developments. This was especially so for
the dimensions of ease of understanding and transparency.
In an analysis of national travel survey data, Engebretsen, Hanssen and Strand (2010)
found strong support for people normally choosing the closest opportunity for especially
daily retail and services, and that shopping centres become more car-based the bigger
they are.
Page 161
Chapter 3. Accessibility Instruments 137
So far, the plan and the instrument have worked well in Oslo. The plan and calculations
have been respected by developers and decision-makers, according to interviews with
the planning authorities (Tennøy et al., 2010). In the ongoing zoning plan process
discussed above, however, the City Council have adopted the plan in spite of the
planning authorities’ recommendations not to do so. Because of formal complaints from
two regional authorities, the final decision needs to be made by the Ministry of
Environment. It will be interesting to see how this case ends.
3.13.6 References
Engebretsen, Ø, Hanssen, J.U. and Strand, A. (2010). Handelslokalisering og transport.
Kunnskap om handlereiser (Effects of locations of shopping on transport. Knowledge
about retail journeys). TØI report 1080/2010. Available at: www.toi.no.
Municipality of Oslo (2003). Kommunedelplan for lokalisering av varehandel og andre
servicefunksjoner. Del I Plan (Municipal sector plan for localisation of retail and other
service functions. Part I Plan). Planning authorities. Available at: http://www.plan-og-
bygningsetaten.oslo.kommune.no/getfile.php/Plan%20og%20bygningsetaten/Internett
/Dokumenter/plan/planer/kommunedelplaner/kdp_14_varehandel_del_i.pdf.
Municipality of Oslo (2010). Økern senter. Planforslag til bystyret. Reguleringsplan med
med konsekvensutredning (Økern centre. planning proposal to the City Council. Zoning
plan with impact assessment). Planning authorities. Dated 19.02.2010. Available at:
http://web102881.pbe.oslo.kommune.no/saksinnsyn/showfile.asp?fileid=2539828 .
Municipality of Oslo (2010a). Økern senter, reguleringsplan med konsekvensutredning
(Økern centre, zoning plan with impact assessments. The case presented to the
Standing Committee on Urban Development). Dated 03.12.2010.
Tennøy, Aud (forthcoming 2012). How and why planners make plans which, if
implemented, cause growth in traffic volumes. Explanations related to the expert
knowledge, the planners and the plan-making processes. PhD thesis, Norwegian
University of Life Sciences, Institute for Spatial Planning and Landscape Architecture.
Tennøy, Aud, Tanja Loftsgarden, Jan Usterud Hanssen og Arvid Strand (2010). Erfaring
med handelsanalyser i Framtidens byer (Experiences with retail analyses in ‘the Cities
of the Future’). TØI rapport 1071/2010. Available at: www.toi.no.
Page 162
138 Accessibility Instruments for Planning Practice
Page 163
Chapter 3. Accessibility Instruments 139
3.14 Geographic/Demographic Accessibility of
Transport Infrastructure (GDATI)
Authors of report: Lidia Zakowska, Wieslaw Starowicz, Sabina Pulawska
Organisation: Cracow University of Technology, CUT
Address: Warszawska 24, 31-155 Krakow, Poland
E-mail: [email protected]
3.14.1 Background
The motivation for using previously known demographic and geographic indicators for
assessing the accessibility of existing public transport systems in cities as a whole was
to use them to examine and assess smaller regions, districts, neighborhoods or other
spatial entities e.g. post code areas or regular grids. In this way, simulation models
allow the calculation of indicators for smaller areas of the city and to compare
accessibility of public transport systems in their areas, identify areas of low accessibility
and areas attractive in terms of accessibility.
The development of the instrument was focused on several questions: Can city-scale
accessibility indicators be used to assess the accessibility of micro-scale (region,
district, housing complexes, post code areas or regular grids)? Could this be a tool for
identifying areas for development due to good public transport accessibility? Could this
be a tool for identifying areas with poor public transport accessibility? Could this be an
instrument for determining the quality of life for residents in the area of the city?
The planning problem is to understand the accessibility of specific areas within big cities
by public transport. The instrument is focused on public transport only, and depends on
the availability, and collection, of service data at the requisite scale.
3.14.2 Conceptual framework and theoretical underpinnings
The instrument determines the accessibility of public transport system in the area
(Kozlak, 2008) as:
1. Geographical density of public transport network (GKp), which is defined as length of
roads where the public transport operates, on the area of 1 km2 of city area.
2. Demographic density of public transport network (GKp), which is defined as length of
roads where the public transport operates per 10 000 inhabitants.
3. Average density of the public transport network (GKpd), which is defined as length of
roads where the public transport operates, referring to the size of the area as well as to
the population.
4. Geographic density of stops (GJp) which defines number of stops in the area of 100
km2.
Page 164
140 Accessibility Instruments for Planning Practice
5. Demographic density of the stops network (GJd), which is defined as a number of PT
stops per 10 000 inhabitants.
6. Average density of stops (GJpd) – to calculate this indicator both: size of the area as
well as population is used, and those values are related to number of stops.
The Instrument GDATI measures accessibility by comparing demographic (population)
and geographic (size of area) data with the length of the transport network and the
number of stops.
The concept of accessibility in the Polish context is defined in terms of service quality in
the collective public transport system (EN 13816: 2002 “Transportation – Logistics and
Services – Public passenger transport – Service quality definition, targeting and
measurement”). This normative definition includes 8 categories of service quality
criteria for public transport. The two first categories refer to accessibility, describing in
general the existing public transport characteristics. These are:
spatial-temporal accessibility – within the area where the service is
provided, referred to in terms of geography, time, frequency and means of
transport;
functional accessibility – in terms of access to the system, including
connection to other transport systems;
Values obtained from the simulation model can be compared with other values, eg.
values resulting from the standards.
In Poland, these measures are used to assess the accessibility of public transport
systems in cities. They are described in the literature (Bryniarska and Starowicz, 2010;
Bieda, 2002; Bieda, 2011) and widely used.
3.14.3 Operational aspects
The instrument GDATI measures geographic and demographic accessibility of public
transport linear and punctual infrastructure.
(3.11)
(3.12)
(3.13)
where K is the length of roads where the public transport operates [km], a is the area
[km2], b is the number of inhabitants.
(3.14)
(3.15)
(3.16)
Page 165
Chapter 3. Accessibility Instruments 141
where J is the number of stops, a is the area [km2], and b is the number of inhabitants.
Geographic and demographic data may be obtained easily if they relate to the
boundaries of the city area. For smaller areas (regions) data may be obtained by using
GIS maps. Information about the length of the public transport network may be obtained
by using the public Internet tools, transport service deliverers can provide such data or
auxiliary data for subsequent detailed calculations. Data on the number of stops may be
obtained easily from the organizer of transportation in the city. Stage of data collection
is the most time-consuming.
The model under development will use the available tools. Processing will be in the form
of interactive involvement of the user. Equipment used for processing will be readily
available.
After collecting relevant data, the calculations are not time-consuming.
To perform the calculation technical knowledge at the basic level is required.
To interpret the results technical knowledge at the advanced level is required.
3.14.4 Relevance for planning practice
Information about the level of accessibility of public transport system in the area and its
relationship to the quality of life of residents in the area is useful for planning
practitioners; although this instrument has not yet been used in the context of planning.
The instrument has previously only been used for the evaluation of existing public
transport systems in urban areas (how they ensure the accessibility of the system).
Detailed examination of areas with poor and good accessibility in order to understand
why has not been carried out. Understanding of these issues currently depends on
expert intuition.
In the areas, where weak geographical and demographical accessibility is detected,
policy measures should be enhanced in order to increase the level of accessibility (more
PT routes, more PT stops). In the areas, where good accessibility is identified, land uses
that rely on accessibility investment/development may be introduced (new housing
development, new business areas and firms locations).
3.14.5 Strengths and limitations
The instrument has several strengths, including relatively easily available data, simple
calculation, and using the same data, you can specify other properties, e.g. average
radius or time reaching the stop. The main weakness is the focus on the availability only
public transport services with no reference to other features of the public transport
system (e.g. frequency).
The instrument has not yet been used in the actual planning context.
We expect that using a simulation model as an interactive package (slide decision), the
instrument can support the development of planned areas where there is the demand
Page 166
142 Accessibility Instruments for Planning Practice
for transport infrastructure, and for understanding wider spatial development issues
(Bieda, 2002).
We are planning improvements to instrument from the scientific and practical point of
view. We think that it is possible to include the identification of service frequency into
the current instrument at the disaggregated scale of smaller city districts. We are
planning to include in the instrument the relationships between indicators of
accessibility and quality of life. The instrument will be made available to local
government to use the results of the accessibility level assessments and to link them
with the quality of life.
3.14.6 References
Bryniarska Z., and Starowicz W. (2010) Results of public transport systems in selected
cities, Kraków.
Bieda K. (2002) Urban Planning and Development Problems after Poland’s Transition to
Market Economy, In: The Transformation of the City Space on the Background of
Political-Economic Changes in Central Europe, 4th International Symposium for Central
Europe, Krakow 2002, (p.103-109)
Bieda K. (2011) Krakow – Transport and Sustainable Urban Growth, Zeszyty Naukowe
Politechniki Krakowskiej. Kraków.
Kozlak A. (2008) Ekonomika transportu. Teoria i praktyka gospodarcza, Wydawnictwo
Uniwersytetu Gdanskiego, Gdansk, (p. 38)
Pulawska S., Starowicz W., and Żakowska L. (2011) Accessibility instruments in urban
transport planning in Krakow and other cities in Poland. 24th ICTCT Workshop
Proceedings, Traffic safety management. Tackling the problems in urban areas and at
other hot spots. October 27th & 28th 2011
EN 13816: 2002 “Transportation – Logistics and Services – Public passenger transport
– Service quality definition, targeting and measurement”
Page 167
Chapter 3. Accessibility Instruments 143
3.14.7 Figures
Figure 3.28 Geographical density of public transport network infrastructure accessed by
stops/ kilometre
Figure 3.29 Demographic density of public transport infrastructure based on stops per
10,000 inhabitants
Figure 3.30 Average density of public transport stops in the network
0,00,51,01,52,02,53,03,54,0
0,0
0,5
1,0
1,5
2,0
2,5
3,0
Geo
gra
ph
ica
l d
en
siit
y o
f p
ub
lic
tra
nsp
ort
pu
nctu
al
infr
ast
ru
ctu
re [
sto
ps/
km
2]
Geo
gra
ph
ica
l d
ensi
ty o
f p
ub
lic
tra
nsp
ort
lin
ea
r in
fra
stru
ctu
re
[km
/km
2]
Bus serviceTram service
0,0
5,0
10,0
15,0
20,0
25,0
0,02,04,06,08,0
10,012,014,016,0
Dem
og
ra
ph
ic d
en
sity
of
pu
bli
c
tra
nsp
ort
pu
nctu
al
infr
ast
ru
ctu
re
[sto
ps/
10
00
0in
ha
bit
an
ts]
Dem
og
rap
hic
den
sity
of
pu
bli
c
tra
nsp
ort
lin
ea
r in
fra
stru
ctu
re
[km
/10
00
0in
ha
bit
an
ts]
Bus serviceTram service
0,01,02,03,04,05,06,07,08,09,010,0
0,0
1,0
2,0
3,0
4,0
5,0
6,0
7,0
Avera
ge d
en
sity
of
sto
ps
netw
ork
Avera
ge d
en
sity
of
pu
bli
c
tra
nsp
ort
netw
ork
Bus serviceTram service
Page 168
144 Accessibility Instruments for Planning Practice
Page 169
Chapter 3. Accessibility Instruments 145
3.15 Structural Accessibility Layer (SAL)
Author of report: Cecília Silva
Organisation: CITTA Research Centre for Territory, Transports and Environment; FEUP
Faculty of Engineering of Oporto University
Address: Rua Roberto Frias s/n, 4200-465 Porto, Portugal
E-mail: [email protected]
3.15.1 Background
Urban mobility problems, such as congestion, have been threatening the quality of life,
competitiveness and sustainable development of urban areas. The need for an
integrate approach to land use and transport in mobility management has been widely
recognised. Accessibility measures are believed to provide a useful framework to
support this integrated approach. We believe that measures of comparative accessibility
by transport mode can operationalise the accessibility concept for this purpose. The
comparative accessibility measure proposed here is the Structural Accessibility Layer
(SAL). This instrument reveals how the urban structure enables or disables travel
choice, i.e. how urban structure constraints mobility into a range of potential mobility
choices (more specifically mode choice). Thus, the focus here is to understand what
mode choices are made available by the urban structure in contrast to the mainstream
research focussed on understanding how urban structure influences travel behaviour.
Thus, distinction is made between the potential for travel provided by the urban
structure and the effective travel choices made within these conditions (wider
influenced by far more than the availability of choice).
SAL was developed as a design support tool for integrated land use and transport
planning providing foresight for how specific land use and transport policies constraint
travel choices of inhabitants and thus enable or limit particular choices. This foresight is
relevant in the planning of specific issues such as new development (zoning),
development density, land use mix and location of activities for master plans or other
land use plans in connection to transport planning regarding, network design and reach,
service level and price.
3.15.2 Conceptual framework and theoretical underpinnings
The Structural Accessibility Layer (SAL) is a geographical representation of comparative
accessibility levels by types of transport modes to different types of opportunities
generating travel (Silva, 2008). It is based on the concept of Accessibility defined as the
extent to which the land use and transport system enable individuals to reach different
types of opportunities (adapted from the accessibility concept presented by Geurs and
Eck, 2001; 36). More specifically, the SAL proposes the concept of Structural
Accessibility assessing how urban structure constraints travel choices (Silva and Pinho,
2010).
Page 170
146 Accessibility Instruments for Planning Practice
The SAL includes two main accessibility-based measures: the diversity of activity index
and the accessibility cluster (the comparative measure). The first measures the
accessibility level by each transport mode (non-motorized, public transport and the car),
counting the number of the most relevant travel generating activity types that one can
reach from a given origin (using contour measure based on the ‘dissimilarity index’ of
Cervero and Kockelman, 1997). The accessibility cluster uses the results of the
previous index to develop the comparative analysis of accessibilities by transport
modes, identifying the mode choices made available to inhabitants by local land use
and transport conditions.
The scheme in Figure 3.31 summarises the conceptual choices made in the
development of the SAL with regard to the balance between soundness and plainness
of the accessibility measure, central to the development of the conceptual framework of
the SAL. Soundness of the basic contour measure was enhanced by using
disaggregated spatial analysis (at the census track level, or grid based of at most 1km2)
of accessibility levels by different transport modes to several types of activities. These
choices (which to some extent are case-specific) provide the necessary detail for the
thorough modulation of small scale variations of local land use and transport conditions
for mobility. Aggregation of accessibility measures is used, on the other hand, to recover
simplicity and the communicative qualities of the measure.
The high level of disaggregation by scale is complemented by a general indicator of
accessibility for the entire study region. The range of disaggregation of activities is made
usable and understandable by the measure of diversity of activities. Finally accessibility
levels by transport mode are combined through a comparative measure.
3.15.3 Operational aspects
As referred to above the SAL compares the variety of travel generating activity types
reachable by different transport modes within a giving travel time and travel price limit.
Activity types considered should at least include, employment, schools, leisure,
shopping, healthcare and other activities, but ideally with higher levels of disaggregation
across these activity types. Accessibility limits are defined by cut-off criteria such as,
travel time, travel price and travel cost limits (chosen and calibrated by, for instance,
political choice or user survey).
The diversity of activity index provides an average of the number of activity types
accessible, weighted by the potential frequency of use 10. Results of this index range
from zero (no accessible activities) to one (all activities are accessible).
The general form of the diversity of activity index is the following:
10 The access to activity types with higher frequency of use provides higher values of diversity of
activities than the access to activity types with lower frequency of use.
Page 171
Chapter 3. Accessibility Instruments 147
y
y
y
yy
f
fAct
DivAct
)*(
(3.16)
Where, y is the activity type, Acty a value representing the existence or not of the activity
type y inside accessibility boundaries (Acty {0; 1}) and fy the potential frequency of use
of the activity type.
The results of the diversity of activity index are then used to develop the comparative
analysis of accessibilities by transport modes, identifying the mode choices made
available to inhabitants by local land use and transport conditions. The different
combinations of accessibility levels by transport modes are grouped into 7 accessibility
clusters according to the mode (or modes) choice which is considered to be favoured by
land use and transport conditions:
Cluster I - NM modes;
Cluster II - NM modes and PT;
Cluster III - all modes;
Cluster IV - NM modes and car;
Cluster V – PT;
Cluster VI - PT and car;
Cluster VII – car.
The use of a particular transport mode is considered to be favoured by the urban
structure when accessibility levels by that particular transport mode are perceived to be
high, i.e. when an acceptable range of activities can be reached making its use
competitive in comparison to the other modes. The choice of this threshold (one of the
many case-specific choices of the SAL) is based on the potential use frequency of
activities considered unnecessary according to the local perception of high accessibility
levels (which can be calibrated through, for instance, political decision or surveys).
The data requirements for the implementation of the SAL include:
Georeferenced data:
o Population, Employment and presence or absence of each of the
activity types considered, by census track;
o Transport infrastructure layout, service level (capacity, speed, slope,
frequency, etc.) and price.
Other data such as basic data on travel behaviour (travel frequency by trip
purpose, travel time by mode, O/D matrix, etc.).
This data is generally purchased (or even produced) by local land use and transport
authorities and thus available.
Page 172
148 Accessibility Instruments for Planning Practice
Computation of SAL can be processed with any GIS software able to develop network
analysis (measuring accessibility areas along transport infrastructure), with several free
and licence products available in the market. However, in the absence of specific
processing scripts, advanced technical expertise in GIS is required to operationalize SAL
concepts into GIS measures. In this condition, calculation times may reach out to weeks
(depending on the size of the study area). On the other hand, results of the SAL are easy
to understand and are very intuitive, considering both the perceptions used for
accessibility and the map representation process.
3.15.4 Relevance for planning practice
The main outcomes of the SAL are the diversity of activity index maps for each transport
mode and the cluster map (comparing accessibility levels by all transport modes). These
maps identify small-scale variations on accessibility conditions provided across different
census tracks of the study area. Diversity of activity maps provide important information
on availability and service level and quality of each transport mode across the territory.
This information provides information on spatial inequalities with regard to land use and
transport opportunities with potential role in the development of public service
standards for public transport, in the identification classification of the hierarchy of
urban centralities, or in the definition of priorities for mixed development strategies. The
cluster map provides the baseline information on potential mode choices, categorizing
relative competitiveness of different transport modes and thereby identifying areas
where inhabitants clearly have no competitive alternative to the car. For illustrative
purposes, see Figure 3.33 providing the relative competitiveness of the car, public
transport and walking for the Greater Oporto.
So far, the SAL has not been used in planning practice, having been applied within
research contexts to analyse accessibility conditions of Greater Oporto (Silva, 2008;
Silva and Pinho, 2010) and Copenhagen Metropolitan Area (Pinho, 2010). The first
application, to Greater Oporto, was designed to test and validate the SAL for planning
practice, both for improving the understanding of accessibility conditions and for
supporting the development of planning strategies. Research results obtained were
validated through expert interviews with very positive results. The second application
was within a research on the influence of urban structure on travel behaviour were the
role of urban structure as constraint and influence of travel behaviour was analysed
comparing monocentric and polycentric urban structures. The diversity of activity
indicator was shown to have significant influence on travel behaviour in multivariate
regression models considering urban structure and personal characteristics as
independent variables of travel distance and mode share. In addition, the results of this
research reinforced the concept of structural accessibility put forward with the SAL,
revealing the role of urban structure in constraining travel choices, enabling and, in
particular, disabling particular travel choices.
Page 173
Chapter 3. Accessibility Instruments 149
3.15.5 Strengths and limitations
The SAL was built with high concerns on usability taking into consideration the ‘rigour-
relevance dilemma’ (see for instance, Hoetjes, 2007; Brömmelstroet, 2007). Figure
3.33 summarized the main debate around potential and limitations, in theory and
practice, of the SAL regarding the main choices made in its development. So, the use of
special representation (via GIS) and of a regional scale of analysis are responsible for
providing an integrated approach and view on the urban structure at the same time
surpassing administrative boundaries and enabling the picturing of small scale
variations. However, the regional perspective of the tool disables micro scale analysis in
spite of the ability to identify small scale variations. Another important choice within the
rigour-relevance dilemma was the use of a simple accessibility measure (contour
measure) providing a tool which is easy to communicate and understand but does not
consider some of the complexity of accessibility such as distance decay or competition
effects. This choice is balanced with the high disaggregation level of analysis (regarding,
spatial scale, transport modes and activity types) which enhances the understanding of
the urban structure conditions, but, at the same time limits the simplicity of the tool.
Again, the complexity introduced by the high disaggregation level is reduced through the
introduction of an aggregate measure (the accessibility cluster comparing accessibility
across transport modes) which synthetises much of the disperse information and
provides a framework for thought facilitating the development of objectives and the
testing of different scenarios. Finally, the SAL is highly adaptable to local conditions
since it leaves a large number of issues to be defined and fine-tuned locally, when
calibrating the case specific SAL, however, this adaptability and the disaggregation level
of the tool are highly dependent on the availability of data which may limit its use.
So far, the SAL has not been used in planning practice but its potential has been
assessed resorting to semi-structured interviews to experts in related core fields (Silva,
2008). This assessment aimed to discuss the robustness as analysis tool, the
usefulness as design support tool; and, the applicability by local planners and
politicians; in summary the potential of the SAL for planning practice. The main
advantages of the SAL referred to by experts were the ease of use, understanding and
communicating of the tool and the coherence of the measures. Some authors recognize
the ability to support thought for policy development, especially with regard to
integration. The main advantage of the SAL was ascribed to its synthesising capacity as
a diagnosis tool and to the ability of testing different policy scenarios. Many of the
aspect referred to as advantages are also responsible for some disadvantages. For
instance the capacity of synthesising information of the diagnosis tool is responsible for
the loss of important detail. The regional scale of analysis limits micro-scale
approaches. Finally the SAL is data and time consuming and therefore expensive, being
out of reach of average local authorities.
Page 174
150 Accessibility Instruments for Planning Practice
3.15.6 References
Brömmelstroet, M. (2007). Desired characteristics of expert knowledge to support the
integration of land use and transport planning. In Proceeding of the Bijdrage aan het
Colloquium Vervoersplanologisch Speurwerk 2007, Antwerpen; copy available from M
Brömmelstroet, Amsterdam Institute for Metropolitan and International Development
Studies, Amsterdam
Cervero, R. and Kockelman, K. (1997). Travel demand and the 3Ds: Density, diversity,
and design. Transportation Research Part D: Transport and Environment, Vol. 2 (3):
199-219
Geurs K. and Eck, J. (2001). Accessibility measures: review and applications. Evaluation
of accessibility impacts of land-use-transport scenarios, and related social and
economic impacts National Institute of Public Health and the Environment.
Hoetjes, P. (2007). Planning as a Design Science – Design Science as a Methodology.
In Proceeding of the AESOP 2007, Naples; copy available from P Hoetjes, Amsterdam
Institute for Metropolitan and International Development Studies, Amsterdam
Pinho, P., Silva, C., Næss, P., Sousa, F., Reis, J., Giulietti, F., Torres, M. (2010). MOPUS -
Mobility Patterns and Urban Structure. Porto, Faculty of Engineering of the University of
Porto
Silva, C. (2008). Comparative Accessibility for Mobility Management. The Structural
Accessibility Layer. Faculty of Engineering of the University of Porto. Porto, University of
Porto. PhD thesis.
Silva, C., and Pinho, P. (2010). The Structural Accessibility Layer (SAL): revealing how
urban structure constraints travel choice. Environment and Planning A, 42: 2735-2752.
3.15.7 Figures
Accessibility measure
Disaggregation
Spatial By activity By transport mode
Regional
accessibility level
Diversity of activity
index
Accessibility
Cluster
Aggregation
Figure 3.31 Balance between soundness and plainness of the accessibility measure
(Source: Silva, 2008)
Page 175
Chapter 3. Accessibility Instruments 151
Figure 3.32 Clusters of accessibility in the Greater Oporto
Figure 3.33 Potentials and limitations of SAL (Source: Silva, 2008)
CONCEPTUAL
CHOICES
Simple
accessibility
measure
Regional scale
Geographical
representation
High
disaggregation
level
Aggregate
measure of
sustainability
High level of
local choice
Potential Limitations
Spatial representation
Global view
Spatial integration
No suport for micro
scale policy
Limited local view
Easy to undestand and
communicateSoundness limitations
Enables thorough
understanding of LUT
conditions
Limited by local dataLimits design support
ability (policy choice)
Synthesizes information
Framwork of thought
Good diagnosis tool
Facilitates definition of
objectives
Enables the test of
scenarios of actionHigh level of
adaptability
May limit usability of
measure
Limits advantages of
contour measure
Constraint
approach
High level of
objectivity
Bridge the
implementation gap of
integrated LUT policies
Limited to potential
mobility
Page 176
152 Accessibility Instruments for Planning Practice
Page 177
Chapter 3. Accessibility Instruments 153
3.16 Cellular automata modeling for accessibility
appraisal in spatial plans (UrbCA)
Authors of the report: Nuno N. Pinto, Bruno F. Santos
Organization: University of Coimbra
Address: R. Luis Reis Santos, Pólo II da Universidade, 3030-788 Coimbra
E-mail: [email protected]
3.16.1 Background
The interactions between land use and transportation are one of the most addressed
topics in planning and transportation, both from the academic and from the practice
standpoints. The use of computers to simulate these interactions is also a very
important research topic since the early 1950s when computers were introduced to
civilian research and large scale urban models were developed and applied to several
urban areas. With the development of the personal computer in the mid 1980s, which
led to the democratization of its use in planning research and practice, land use
simulation models gained an even greater attraction, as every researcher could
develop, at very low cost, solutions to support planning practitioners in their decision-
making processes.
Cellular automata (CA) models were introduced to urban studies at that time and are,
since then, among the most popular modeling concepts used to simulate land use
change, taking into account the influence of transportation and accessibility in a more
or less explicit way. This report will present a CA model that uses some innovative
concepts to simulate land use change taking into account accessibility by including this
driver as an endogenous phenomenon, allowing a simulation that effectively conjugates
land use change and transportation.
3.16.2 Conceptual framework and theoretical underpinnings
The use of dynamic models such as CA is often considered a powerful tool to simulate
and understand complex systems and complex behaviors of stochastic nature which
depend on different variables and have different temporal and spatial scales. With
regard to accessibility, the CA model reported aims to simulate in a single simulation
environment the effects of transport systems (from which accessibility is evaluated) as
one of the main drivers of land use change. The main goal is to capture the effects of
accessibility in land use by parameterizing some traditional transportation models (e.g.
the gravitational model) in conjugation with other parameters regarding other drivers,
such as land use interaction/neighboring effects, or land suitability. The
interdependences of all these drivers, which are important features of the complexity of
urban phenomena, are taken into account so that all the partial parameters can be
calibrated under the influence of all the observed phenomena.
Page 178
154 Accessibility Instruments for Planning Practice
3.16.3 Operational aspects
UrbCA is a dynamic model that simulates land use change over a space divided into
irregular cells designed from the traditional census blocks. Cells have at each moment a
given cell state (or land use) from a finite cell of cell states which change through time
taking into account the cell states of a given number of neighboring cells. This evolution
is provided by a set of transition rules that parameterize the behaviors of all the drivers
at stake. The calibration of the model is done using an optimization procedure that
provides an efficient search of the space of solutions for the optimal set of parameters
of the model. The very simple concept of CA allows the creation of a very powerful tool
to capture complexity and emergence from simple transition rules that can be easily
linked to common planning rules and restrictions. UrbCA incorporates some innovations
when compared with the ones reported in the literature. Irregular cells are drawn taking
into account both urban form and the information that is spatially referenced to them.
The neighborhood size is a calibration parameter and not an input value defined by the
user. The effect of the transport system (and accessibility) is explicitly considered.
The evaluation of the influence of accessibility in land use change is made by
considering that land use change occurs as a consequence of a set of transition rules
that accounts a transition potential for each cell (each location in space) in every
moment in time. This potential is a function of the land use drivers, such as
accessibility, land use suitability, or neighborhood effects. The model calculates
accessibility taking into account the road transport network for private car mode.
Although possible, the consideration of other transport modes is not yet implemented in
the model (it will probably be implemented by the time the WU will have their workshops
during 2013).
Detailed information about the modeling concepts, options, and formulation of UrbCA
can be found in Pinto and Antunes (2010).
The use of UrbCA in the appraisal of accessibility in planning focuses on the possibility
of simulating different planning solutions under different planning parameters taking
into account different accessibility conditions, which are a result of the investments on
the road network. Rather than focusing on measuring accessibility as a primary goal,
the model simulates the direct effects of accessibility in land use. The model provides
the calibration of some accessibility parameters, as the friction parameter of a gravity
transportation model, along with the calibration of other land use parameters. The
model is also able to simulate future land demand values by simulating future
demographic and employment distributions. Input data includes the transport network
configuration and attributes, as long as data on land use, demographics, employment,
and other relevant data to constrain land use change. All the datasets refer to a
common spatial structure based on irregular cells that take into account urban form. All
these datasets are made publicly available by traditional data providers such as
municipalities or statistics agencies.
UrbCA is implemented as a stand-alone software application developed in Visual Basic
to run in Windows-based machines. The running time for a standard problem vary from
a few hours to one and a half days, depending on the configuration of the dataset and
on the desirable threshold for calibration. Some GIS expertise is required to preprocess
Page 179
Chapter 3. Accessibility Instruments 155
data in order to create the datasets for the UrbCA. No specific expertise is needed to
interpret the results as the model provides a fully descriptive set of easy-to-use text files
that only contain readable information.
3.16.4 Relevance for planning practice
The use of modeling in common planning processes is many times a very demanding
task as both common planning offices and practitioners are not technically prepared for
it or do not have the necessary budget to acquire sophisticated consultancy support
that could provide this kind of approaches. There is also a latent tension between
modelers and practitioners, on the one hand, and between modelers and decision
makers, on the other hand. Traditional practitioners (planners, architects, and also
engineers) are many times suspicious of the capacities of models to effectively provide
any kind of valuable help, which many times undermines the possibility of using
sophisticated modeling approaches. Decision-makers, by the contrary, tend to be very
keen of having solutions provided by advanced tools that help them to support their
decisions by using state-of-the-art knowledge.
The main goal of UrbCA is to simulate different planning scenarios of land use evolution
taking the influence of the transport system (and therefore accessibility) explicitly into
account. This simulation is expected to help practitioners to evaluate these scenarios
under different parameters in order to test their feasibility and to inform both the
citizens in the participatory process and decision-makers in the planning process itself.
UrbCA aims to be a simple-to-use, simple-to-understand decision support tool that can
be used in any kind of planning process by any planning structure, regardless of
financial or even technical requirements. It is designed to be a simple tool that can be
used by planners with no specific background on modeling, by decision-makers who are
not necessarily skilled to understand the mechanics of the model, and also by citizens
who are also not skilled in participatory processes for evaluating different planning
scenarios.
This modeling approach to planning is therefore relevant for providing informed
solutions to different stakeholders at various stages of the planning process.
CA models have been used to support planning processes, being one of the most used
models the MOLAND model which is used by the Joint Research Center of the European
Commission to support long term regional planning under the influence of climate
change. UrbCA was not yet fully used in real-world planning processes, as it still is under
development. It was already used in a research context for providing a test-bed for
strategic scenario planning in a research project that included several planning officials
from different planning agencies. The Action will provide the proper test-bed for its
application to a real world planning process in conjugation with the Coimbra municipal
planning department. The model is expected to evaluate, within the work of the Action’s
Working Unit of Coimbra, the impacts of new transport investments and the consequent
new accessibility conditions in municipal plans.
Page 180
156 Accessibility Instruments for Planning Practice
3.16.5 Strengths and limitations
The use of CA models for assisting planning processes is useful as they allow the
simulation of prospective planning scenarios under a fairly good variation of the
parameters that are considered by the model. The calibration of the model allows
planners and decision-makers to understand the main drivers and the main trends that
took place in their territories, which is very useful for cross analysis with other kinds of
quantitative and qualitative indicators that are usually part of the planning toolsets. The
use of this model is expected to be very suitable to forecast feasible and plausible
future land use/transportation scenarios rather than to point out what will be future
urban design solutions. The model is very good at identifying areas of potential change
rather than indicating what are the exact plots which will be developed. These models
are also strongly linked to GIS which allows a good use of visualization techniques, a
powerful mean to explain different options to non-skilled interlocutors.
UrbCA was already used in a research project that simulated a practice environment in
which several practitioners and decision-makers were present. Simple outputs of the
model were very useful for launching the discussion over very simple planning options,
proving the value of the model.
There are, however, important limitations as the application of any kind of models has
always some degree of limitations. Models are meant to capture trends that are more or
less accepted as good descriptors of a given reality under a very well-known set of
conditions. The ability to simulate futures based on the calibration of models is always
dependent of the capacity of researchers and practitioners to understand the
complexity of systems making use of some abstraction. Many assumptions must be
made in order to be able to work with available data, to feasibly model a given
phenomenon, or even to be able to identify the proper scale of simulation. Models are
many times not able to cope with decisions that break up historical trends, which
reduce their use especially when practitioners are not properly informed about the use
that can be made of the model.
The underlying complexity of the model is many times referred as a potential problem.
The CA concept is, nevertheless, quite easy to understand and very intuitive in the way it
models reality. The natural sense of complexity associated with this model may be
reduced for elucidation purposes by (1) taking into account only variables which depend
on available datasets which are commonly used in planning (mainly from censuses),
and parameters which are simply to understand by the agents to understand by the
agents and (2) by strengthening the visualization capacities of the outcomes of the
model, explicitly linking the results to maps and associated data.
UrbCA is under development and the main goal is to create a low cost tool that is
expected to be used in common planning processes by a wide range of planning
agencies, from municipal departments to regional/national planning agencies.
Page 181
Chapter 3. Accessibility Instruments 157
3.16.6 References
Pinto, N. and Antunes, A. (2010). A cellular automata model based on irregular cells:
application to small urban areas. Environment and Planning B-Planning & Design,
37(6): 1095-1114.
3.16.7 Figures
Figure 3.34 Application to Condeixa-a-Nova, Portugal
Figure 3.35 Alternative scenarios for road investment in the municipality of Coimbra
Page 182
158 Accessibility Instruments for Planning Practice
Figure 3.36 Land use maps for alternative scenarios for road investment in the
municipality of Coimbra
Page 183
Chapter 3. Accessibility Instruments 159
3.17 From Accessibility to the Land Development
Potential (ATI)
Author of report: Maruška Šubic Kovač, Petra Pergar and. Metka Sitar.
Organisation: University of Ljubljana, Faculty of Civil and Geodetic Engineering,
Municipal Economics institute and University of Maribor, Faculty of Civil Engineering.
Address: University of Ljubljana, Faculty of Civil and Geodetic Engineering,
Municipal Economics institute, Jamova 2, 1000 Ljubljana, Slovenia and University of
Maribor, Faculty of Civil Engineering, Smetanova 17, 2000 Maribor.
E-mail: [email protected]
3.17.1 Background
In the Republic of Slovenia, the methods of land use planning have been so far focused
in particular on the physical balancing of land surfaces for a particular type of land use,
and do not take into account the economic aspect in preparing the basis for land use
decision-making in the process of spatial planning. A consequence is the irrational use
of land. Therefore, the procedures and basic documentation for the decision-making on
land use and on the restriction of land use in the spatial planning process need to be
improved (Šubic Kovač, 2004).
Urban development is directly interconnected with the construction of technical
infrastructure. Housing construction can take place on developed land only.
Construction of technical infrastructure, however, is linked with the relatively high
(direct) costs. The question is which method of urban development and/or land use
zoning is conditioning the lowest land development costs (costs of technical
infrastructure) over the long-term period? By the long-term policy of construction, and
thereby, of land development (technical infrastructure), housing construction may be
adjusted in such a way that the additional social costs of land development, at certain
social benefits and in a certain long-term period, are minimised. To this end, we will
need to define the appropriate factors and indicators, on the basis of which we will
define the impacts of technical infrastructure on land development potential and on the
additional social costs and social benefits of construction (Šubic Kovač, 2008).
The accessibility to technical infrastructure is only one factor that has to be
incorporated in the model of land development potential, which can be used in the
spatial planning process. Taking into account the known land developmental potential
under condition of sustainable development and by an appropriate model we may
transparently decide on the land use.
In the research only public utility infrastructure (technical infrastructure) defined by
Spatial Planning Act (2007) will be included:
public roads (including drains and public lightening);
water supply (drinking water supply and (sewage) waste water treatment);
Page 184
160 Accessibility Instruments for Planning Practice
energy services (supply) (electricity, district heating and natural gas supply).
3.17.2 Conceptual framework and theoretical underpinnings
The accessibility to technical infrastructure is defined in terms of the physical and cost
accessibility to the technical infrastructure.
The accessibility to technical infrastructure is measured as the accessibility of the
provided land use at the local level, taking into account the capacity of the existing
technical infrastructure and the distance from the existing technical infrastructure.
The results of the research by the Municipal Economic Institute of Ljubljana show, that
the capacity of the existing technical infrastructure and the distance from the existing
technical infrastructure are the most decisive factors defining accessibility to technical
infrastructures (Klemenčič, Rakar, Šubic Kovač). Also other authors argue that for the
definition of the accessibility in spatial planning it is important that in addition to the
spatial dimensions, we take into account the physical and socio - economic aspects of
accessibility (Lotfi, Koohsari, 2009; Bisht, Mishra, Fuloria, 2010). In addition also the
political goal of the European Communities is that the municipal services ought to
provide the needs and expectations of users of public services that are based on:
universal access for all citizens and high quality services at affordable prices while
ensuring the protection of the environment, care for vulnerable groups and access to
municipal services regardless of the allocation of the settlements in the region.
Under the current legislation of the Republic of Slovenia, the technical infrastructure
design generally follows the spatial plan implementation, when it is already too late for
the more effective and sustainable planning. The proposed instrument will define the
costs and benefits of providing technical infrastructure at the strategic level of planning.
Legal provisions and practice in Slovenia do not promote the observance of the actual
costs of technical infrastructure in the planning and implementation phase of land
development. Because of that it is necessary to improve the situation and to analyse
the accessibility as described above.
3.17.3 Operational aspects
Type of accessibility:
physical distance, and;
capacity of the existing and proposed technical infrastructure.
The accessibility instrument is determined by:
the distance in M/KM, and;
the capacity expressed by physical indicators of various technical
infrastructure elements, and;
finally in costs.
Page 185
Chapter 3. Accessibility Instruments 161
The distance between the public lines of technical infrastructure and a final consumer
(private connectors to a private residential building) indirectly depends on the housing
construction typology, settlement density, subdivision of land and, last but not least, on
land ownership. The capacity of technical infrastructure depends on the specific
technical characteristics, as the width and flow of public roads, quality of and pressure
in the drinking water network, free capacities in the sewage systems, voltage conditions,
hydraulic and heat conditions in the district heating systems, etc. There are
tremendously varied indicators, and certain parameters are relevant for the specific
natural conditions only within the studied area, whilst others are relevant for a particular
population density only. Thus, we would limit ourselves to defining the key physical
indicators for a variety of technical indicators, expressing the capacity with comparable
units of measurement.
Finally we will define the social costs and benefits of (non-) providing access to technical
infrastructure, taking into account the sustainable development.
The data required are:
the land use type;
settlement density;
housing construction typology;
land subdivision;
public/private land ownership;
technical infrastructure data;
the distance from the existing technical infrastructure;
the capacity of technical infrastructure;
and others.
The majority of the information is directly available for free in public records (for
example, in the cadastre of public technical infrastructure); some of data will be
obtained indirectly by calculation and some will be based on a survey of different
stakeholders in the process of spatial planning and land development. The data will be
acquired also in the workshops, some of them from the case study.
Quantitative analysis will be made with specialized computer programmes working by
using numerical data. Spatial analysis will be produced in an environment of geographic
information systems. They will mainly include working with vector objects while the fuzzy
logic methodology is based on the raster objects. Since we already have the appropriate
licence for ArcGIS® Spatial Analyst 10, which includes some methods of fuzzy logic, we
will test our accessibility instrument in that programme.
In comparison with other methods of so-called soft intelligence the establishment of the
input data requires intensive scientific research work (Aliev, Aliev, 2001), while the
application in place is simpler and already built into newer programmes to work in an
environment of geographic information systems (Boroushaki, Malczewski, 2010). This
makes it more useful for other stakeholders in spatial planning practice. For the
verification of results we will prepare a workshop for spatial planners. Within the
framework of the workshop, the participants will be familiarised with the project and the
Page 186
162 Accessibility Instruments for Planning Practice
model, presenting the results of the envisaged project by ICT technologies, and asking
the participants for their respective opinions on the value of the results.
We will define the basic input data (fuzzy membership functions), then the further
empirical calculations can be made by spatial planning practitioners. Since the basic
assumption of our model is ensuring the transparency, it will also be easier to interpret
the results. The interpretation will be understandable to other stakeholders in spatial
planning like municipal managers and public.
3.17.4 Relevance for planning practice
The accessibility instrument will define the location of different degrees of accessibility
ranked between 0 and 1. The results will be presented separately (for example
accessibility to water services) or they will be combined. The final result will be the
expertise basis to help the stakeholders in spatial planning to determine the
appropriate planning zones for residential land use.
Analysis within the research will be conducted at the level of individual parcels, whilst
the final accessibility instrument will cover the level of the entire municipality. The
expertise basis can be used for the strategic and implementing phase of the municipal
spatial plan.
The proposed accessibility instrument is under the construction and has not yet been
used.
In Slovenia, the methods of land use planning have been so far focused in particular on
the physical balancing of land surfaces for a particular type of use, and do not take into
account the economic aspect in preparing the basis for land use decision-making in the
process of spatial planning. The accessibility to technical infrastructure will be
applicable in Slovenia and elsewhere in Europe, where the factors incorporated into the
project impact on the social costs and social benefits of different land use in the same
way.
In Slovenia, land use modelling and simulation have not been carried out yet. A
consequence is that certain vacant plots of building land are not interesting for private
investors, whilst certain land uses are causing exceedingly negative external effects,
which had not been foreseen at the spatial planning phase. The land use modelling and
simulation including the accessibility to technical infrastructure are going to introduce a
dynamic model of decision-making on land use in land use planning, based on the land
development potential, determined by the (social) costs and (social) benefits.
3.17.5 Strengths and limitations
The developmental potential of land could be determined also by including the factors
and analysis of impacts on the social costs, and on social costs and social benefits
which ensue from a certain land use type. In the research specific focus will be on the
analysis of social costs and social benefits of the residential areas with the differing
level of land development (technical infrastructure). In recent studies in the field of cost
benefit analysis, the authors argue that the key problem is the underestimation of the
investment value and an overestimation of social benefits. Also the social rate of return
Page 187
Chapter 3. Accessibility Instruments 163
is not adequately defined (Korthals Altes, 2010). There is also a dilemma whether and
to what extent the results of the analysis of social costs and benefits of specific
infrastructure projects are suitable at certain stage of spatial planning (Faludi, 2000;
Korthals Altes, 2010). The authors conclude (Lichfield, 1964; Evans, 2004) that social
costs and benefits are relatively simple to identify, but difficult to financially quantify.
Another problem is the changing attitude of the stakeholders toward individual solutions
over time.
Within the recent studies of fuzzy logic it was found out, that these studies included the
environment protection and the process of "thinking" of all participants in spatial
planning (Galderisi, Ceudech, Pistucci, 2008; Phills et al., 2004; Yanar, Akyurek, 2004;
Fernandez Ruiz, 2009). According to the comparison of different methods of so-called
soft intelligence, the benefits of the methods of fuzzy logic are: the possibility of
interpreting the results, the transparency, the gradual process, and the tolerance to
imprecise input data. As the only drawback the amount of knowledge needed to create
the input data and the impossibility of learning the system is mentioned (Aliev, Aliev,
2001). We believe, however, that the inclusion of several parameters, according to
Fernandez and Ruiz (2009), can cause the loss of transparency and monitoring the
impact of each indicator. Other research shows the benefit of a small number of key
indicators of the accessibility (Bisht, Mishra, Fuloria, 2010).
In Slovenia, the technical infrastructure is designed according to the land use area
types in the spatial plan. Therefore social costs and benefits will be determined
approximately. The proposed instrument will encourage the analysis of land use
decision making and at the same time the transparency, and more effective and
sustainable spatial planning.
We are preparing several empirical analyses in order to define the usability of the
instrument within the spatial planning practice. The results of the empirical analysis will
help to upgrade the scientific and practical aspects of the proposed accessibility
instrument.
3.17.6 References
Aliev, R.A and Aliev, R.R. (2001). Soft computing and its applications. Singapore. World
Scientific Publishing Co: p. 1-10. Http://www.worldscibooks.com/compsci/4766.html
(29.11.2010).
Bisht, S.S., Mishra, V., Fuloria, S. (2010). Measuring Accessibility for inclusive
development: A census based index. Soc Indic Res., Vol. 98 (1): 167-181. DOI
10.007/s11205-009-9537-3.
Boroushaki, S. and Malczewski, J. (2010). Using the fuzzy majority approach for GIS-
based multicriteria group decision-making. Computer & Geosciences, Vol. 36 (3): 302-
312. DOI: 10.1016/j.cageo.2009.05.011.
Carlsson, C. and Fuller, R. (1996). Fuzzy multiple criteria decision making: Recent
developments. Fuzzy Sets and Systems, Vol. 78 (2): 139-153.
Http://www.sciencedirect.com (4.3.2011).
Page 188
164 Accessibility Instruments for Planning Practice
Evans, A.W. (2004). Economics & Land use planning. Malden, MA, Oxford, Victoria,
Blackwell publishing: 209 p.
Faludi, A. (2000). The performance of spatial planning. Planning Practice & Research,
15 (4): 299-318.
Fernandez, I. and Ruiz, M.C. 2009. Descriptive model and evaluation system to locate
sustainable industrial areas. Journal of Cleaner Production, 17 (1): 87-100.
DOI:10.1016/j.jclepro.2008.02.011.
Klemencic, T., Mlakar, C., Murko, V., Saje, M. (1972). Mestna renta v zvezi s problemom
financiranja opremljanja mestnega zemljišča s komunalnimi napravami in objekti
(Urban rent to address the problems of financing technical infrastructure). Municipal
Economics Institute. Ljubljana. 379 p.
Korthals, A.W.K. (2010). The financial estimates and results of servicing land in the
Netherlands. Environment and Planning B, Vol. 37 (5): 929-941.
ichfield, N. (1964). Cost-benefit analysis in plan evaluation. The Town Planning Review,
Vol. 35 (2): 159-169. http://www.jstor.org/stable/40102430 (10.3.2011).
Lotfi, S. and Koohsari, M.J. (2009). Analyzing Accessibility Dimension of Urban quality of
life: Where urban designers face duality between subjective and objective reading of
place. Soc Indic Res., Vol. 94 (3): 417-435. DOI 10.1007/s11205-009-9438-5.
Phillis, J.A., Kouikoglou, V. S., Adriantiatsaholiniaina, L. A., Zhu, H. (2004).
Environmental applications of Fuzzy Logic. Fuzzy Systems, Budapest, Hungary, 25-29
July 2004: p. 341-346. http://ieeexplore.ieee.org/stamp (19.11.2010).
Rakar, A. (1979). Nekateri vidiki rasti urbanih aglomeracij (Some Aspects of the Urban
Agglomeration Growth). Municipal Economics Institute. Ljubljana. 108 p.
Šubic, M. (1989). Stanovanjska gradnja in varstvo kmetijskih zemljišč (Housing
construction and protection of agricultural land). Municipal Economics Institute. 109 p.
Šubic Kovač, M. (2004). I have got money - I am looking for building land to purchase!.
Gajšek, M. (Ed.) Prostorska dokumentacija in EU skladi. Zbornik referatov, 19.
Sedlarjevo srečanje z mednarodnim seminarjem, 12. In 13. November 2004, Lipica,
Slovenija: p. 103-112.
Šubic Kovač, M. (2008). Najboljša raba zemljišča za prihodnost mest in urbanih
območij (The highest and best use of land for the future of cities and urban areas). V:
Sitar, M. (Ed). Urbane prihodnosti. Maribor, Fakulteta za gradbeništvo: p. 245-258.
Yanar, T.,A., Akyurek, Z. (2004). The enhancment of ArcGIS with fuzzy set theory. ESRI
International User Conference 30. Junij 2004: 16 p.
http://proceedings.esri.com/library/ /userconf/proc04 (15.12.2010).
Page 189
Chapter 3. Accessibility Instruments 165
3.17.7 Figures
Figure 3.37 A case of fuzzy membership function according to the distance to the road
when defining new locations for industrial sites (Source: Yanar, T.,A., Akyurek, Z. 2004.
The enhancement of ArcGIS with fuzzy set theory. ESRI International User Conference,
30. June 2004: 16 str. http://proceedings. esri.com /library/userconf/proc04,
15.12.2010)
Page 190
166 Accessibility Instruments for Planning Practice
Page 191
Chapter 3. Accessibility Instruments 167
3.18 Isochrone maps to facilities. Shopping centres in
the Metrosur influence area (IMaFa)
Authors of report: Rosa M. Arce-Ruiz, Enrique J. Calderón, Ana Margarida Condeço-
Melhorado, Emilio Ortega
Organisation: TRANSYT, UPM
Address: E.T.S.I. de Caminos, Canales y Puertos, UPM. Profesor Aranguren, s/n. Ciudad
Universitaria. 28040 Madrid
E-mail: [email protected]
3.18.1 Background
MetroSur is the name of a new metro line developed in recent years in Madrid.
MetroSur's area of influence is located in the southern outskirts of Madrid's
metropolitan region. This area is characterized by the presence of densely populated
cities such as Alcorcón, Getafe, Leganés, Móstoles and Fuenlabrada, and has one of the
highest concentrations of shopping centres in the region of Madrid. These centres make
up new centralities in these peripheral areas –attracting traffic flows– and are linked to
new urban developments. They are situated in spaces with good accessibility by private
transport but, in some cases, with poor accessibility by public transport.
The study area has seen a constant rise in congestion levels, and there is therefore an
increasing need for the provision of good quality public transport. The mobility changes
induced by the shopping centres in the area (with increasing number of customers,
coming from longer distances), and the difficulty of access for a significant portion of
the population (those without private cars), creates a need for public transit provision.
One of our main motivations for developing this accessibility instrument was to assess
the level of service of public transport when accessing shopping centres in the MetroSur
influence area. However isochrone maps can be applied to other type of facilities
(health care, education, etc.)
The main research question to be addressed is whether shopping centres in the study
area can be accessed easily by public transit.
3.18.2 Conceptual framework and theoretical underpinnings
Our instrument of isochrone maps defines accessibility as the opportunities for ease of
access and takes as a case study the access to shopping centres by public transit.
The accessibility instrument is measured as the process associated with getting to and
from the shopping centres by public transit.
The theoretical underpinning of this accessibility instrument is that the more accessible
the selected shopping centres, the greater the likelihood that they will be accessed by
public transit (Murray et al., 1998).
Page 192
168 Accessibility Instruments for Planning Practice
This measure is therefore relevant from several points of view:
To owners / operators of public transport services and urban planners, who 1.
can assess the level of service for the MetroSur influence area, regarding the
access to the main shopping centres;
From an environmental perspective (emissions of pollutants) (Keijer and 2.
Rietveld, 2000). Accessibility by public transport is a critical issue from the
point of view of both sustainable mobility (Black, 1996) and sustainable
accessibility (Weber, 2006).
Because it is a simple measure, isochrone maps are easy to communicate and easy to
interpret by decision makers and transport planners alike, as well as by the rest of the
stakeholders.
3.18.3 Operational aspects
The accessibility instrument presented here measures the travel times by public
transport to shopping centres.
Isochrone maps are drawn using the network coverage analyses included in a GIS.
Given the spatial nature of network coverage analyses, GIS have become useful tools
which provide capabilities for data collection, data management and handling, spatial
analysis, network analysis, and cartographical presentation of results (Zhu and Liu,
2004).
Coverage or service areas can be delineated by GIS through the creation of buffer areas
(bands) around shopping centres, based on Euclidean (straight-line) distance or travel
times along a network. The choice of the distance calculation method significantly
affects the final results. For a given distance threshold (for example, 0.25 km), service
areas are larger using Euclidean distances than network distances, since the first
method overestimates the size and the population of the service areas (Gutiérrez and
García-Palomares, 2008).
In our case, we decided to use buffer areas considering distance along a public
transport network, through the quickest network paths. The population covered in each
buffer area was then estimated following previous studies (Gutiérrez et al., 2000;
Murray, 2001; Murray et al., 1998).
The input required is a digital public transport network, providing information on travel
times, type of mode (train, metro, bus) and transfer times between transport modes,
which is combined with a street network to calculate pedestrian access times from the
stations/stops to the shopping centres also through the quickest network paths.
The location of the shopping centres and the metro and train stations and bus stops are
also required as input data.
The population data available at census track level (0.25 square kilometres on average)
are used to calculate the population covered within each buffer area.
We use the EMME3 traffic assignment model which gives us travel time matrices by
public transport. A commercial GIS –and specifically its network analysis capabilities– is
Page 193
Chapter 3. Accessibility Instruments 169
then used to calculate distances between public transport stops/stations and shopping
centres through the street network, simulating the real routes followed by the
population on their way to those shopping spaces. The EMME3 model was chosen
because this is currently being used by the Public Transport Authority of Region of
Madrid. However other software can be used if they include traffic assignment models
and network analysis tools.
We also use GIS to calculate the isochrone maps; with this method, the resulting
coverage area is not a circle (as it would be using Euclidean distances), but an irregular
polygon containing all the sections of streets and public routes located within a network
distance threshold.
Results can be obtained within three days when all the data and technical expertise is
available for the analysis. This is an estimated time accounting for one day for
processing the traffic model using EMM3, one day for bringing the results to the GIS and
calculating of the isochrone maps and one more day to elaborate maps and other
outputs such as graphics and tables.
This accessibility instrument can be understood by everyone, as access to shopping
centres is expressed as travel time, which is a familiar indicator. However some
technical knowledge of network analysis using GIS is required.
3.18.4 Relevance for planning practice
Isochrone maps make it possible to assess accessibility to shopping centres by public
transport. It can be understood as a measure of accumulated opportunities when
considering the amount of population or employment within a certain distance or time
threshold from one or several shopping centres. Taking into account the total
population within time thresholds, the measure of accumulated opportunities provides
an estimation of the potential demand for shopping centres.
The use of isochrone maps of shopping centres has several applications for urban and
transportation planning. It allows assessment of the public transport network by
identifying populated areas outside the coverage area. Greater attention should be
given to areas which are not covered or poorly covered by the public transport system,
than to implementing steps to extend the network or to increase the frequency of
service provision.
This method can also be used to draw some conclusions about the location of new
metro or train stations and bus stops, by comparing time thresholds after the location of
new bus stops or stations on the network. It thus helps to determine the most suitable
location to boost accessibility to shopping facilities.
It can also be used to propose facilities for soft modes, such as cycling.
This instrument was applied in 2005 in the Autonomous Region of Madrid, in
collaboration between the regional Public Transport Authority and the Regional Health
Department (Redondo, 2005).
The objective was to study the accessibility by public transport to specialized health
centres in the region. The population was calculated (both in absolute and relative
Page 194
170 Accessibility Instruments for Planning Practice
terms) within certain distance thresholds from the health facility. Three different
scenarios were analysed for the years 2000, 2004 and 2008; each scenario considered
changes in population and infrastructure in both transport and health centres. For each
year, isochrone maps were calculated individually for each particular health facility (see
for example Figure 3.38.
The instrument identified the less accessible health centres and the location of the
population with poor accessibility to these types of facilities. The results influenced
political decisions in two ways:
By reassigning the population with worst accessibility to other health centres, 1.
while maximizing their accessibility.
Identifying potential locations for new health centres in areas with long travel 2.
time to these facilities.
3.18.5 Strengths and limitations
The main strengths of the present accessibility instrument are its low data requirements,
and the ease of calculation, transmission and interpretation of results.
The instrument requires relatively few data, which as we have seen, are basically
related to the network, and to the locations of the defined economic centres.
Isochrone maps are easy to calculate through simple network analysis performed in a
GIS.
Because the output is expressed as travel time thresholds, the results can be easily
interpreted by policy makers and transport planners and simply transmitted to everyone.
However, due to the simplicity of the measure, the results of this instrument are not
sufficiently realistic, as they use an all-or-nothing function (inside or outside the
established distance) rather than a distance decay function.
This implies that everyone within the threshold area would have the same probability of
access to a shopping centre, without considering the population which lies beyond the
selected distance. Isochrone maps do not therefore accurately reflect the behaviour of
traffic flows, which tend to decrease progressively as the distance increases.
Another drawback of this instrument is the choice of the distance threshold itself, which
is somewhat arbitrary and may cause the results to vary significantly (Tillema, 2007).
Finally, since our case study focuses only on access by public transport the results refer
only to this mode. Results computed considering access by private car would be
certainly different.
Page 195
Chapter 3. Accessibility Instruments 171
3.18.6 References
Black, W R. (1996). Sustainable transportation: a US perspective. Journal of Transport
Geography, Vol. 4: 151-159.
Gutiérrez, J. Cristóbal, C. Gómez, G. (2000). Accesibilidad peatonal a la red de metro de
Madrid: efectos del plan de ampliación 1995 -1999. Anales de Geografía de la
Universidad Complutense, Vol. 20: 363-376.
Gutiérrez, J. and García-Palomares, A. (2008). Distance-measure impacts on the
calculation of transport services areas using GIS. Environment and Planning B: Planning
and Design, Vol. 33: 480-503.
Keijer, M.J.N. and Rietveld, R. (2000). How do people get to the railway station? The
Dutch experience. Transportation Planning and Technology, Vol. 23: 215-235.
Murray, AT. (2001). Strategic analysis of public transport coverage. Socio-economic
Planning Sciences, Vol. 35: 175-188.
Murray, AT., Davis, R., Stimson, RJ., Ferreira, L. (1998). Public transport access.
Transportation Research D, Vol. 35: 319-328.
Redondo, J.C. (2005). Estudio de accesibilidad y cobertura de la red de transporte
público y asistencia sanitaria de la Comunidad de Madrid. II Accesibilidad a los centros
de atención especializada". Geosanidad, 15.
Tillema, T. (2007). Road pricing: a transport geographical perspective. Ph.D. Thesis,
Utrecht: Faculty of Geosciences, Utrecht University.
Weber, J. (2006). Reflections on the future of accessibility. Journal of Transport
Geography, Vol. 14: 296-398.
Zhu, X. and Liu, S. (2004). Analysis of the impact of the MRT system on accessibility in
Singapore using an integrated GIS tool. Journal of Transport Geography, Vol. 12: 89-101.
Page 196
172 Accessibility Instruments for Planning Practice
3.18.7 Figures
Figure 3.38 Isochrone maps Gregorio Marañon Hospital (left side) and Getafe Hospital
(right side)
Page 197
Chapter 3. Accessibility Instruments 173
3.19 Place Syntax Tool (PST)
Author of report: Alexander Ståhle
Organisation: KTH School of Architecture
Address: Östermalmsgatan 26, 100 44 STOCKHOLM, SWEDEN
E-mail: [email protected]
3.19.1 Background
Accessibility research of human behaviour has always been limited by the kind of data
and analytical tools available. For example “there was no effective means for
representing or dealing with the spatial complexity of a realistic urban environment”,
neither did past studies “incorporate data about a person's cognitive environment into
the analytical framework” (Kwan, 2000). In the past decade many steps have been
taken to overcome these limitations, for example, `instead of using the straight-line
distance between two locations, the actual travel distance over the transportation
network can be used' (Kwan, 2000). Kwan et al. (2003) state that still much remains
and especially the understanding of our cognitive environment is pointed out to be a
crucial issue.
The most important background to the Place Syntax Tool (PST) and the theories of Place
syntax is the shortcomings and strengths of space syntax methodology. The strengths
consist of a strong empirical theory of cognitive space and cognitive distance, measured
in changes of directions, so called axial line steps. However, within space syntax
research accessibility is measured only within the network of axial lines with no
attractions. This led to the idea to add attractions such as density or transit points to the
spatial model to get better predictions of pedestrian flow but also new interesting
measures of accessibility. In many planning projects where space syntax was used the
issue of attractions came up when describing centrality and proximity. Place syntax has
been a natural answer to these questions. Very simply put, Place syntax is adding
attractions to Space syntax.
3.19.2 Conceptual framework and theoretical underpinnings
Accessibility is a widely used spatial analytic measure defined as “the relative ‘proximity’
of one place i to other places j. In generalised terms, the measure can be defined as:
(3.18)
where Wj is some index of the attraction of j and dij is a measure of impedance, typically
the distance or travel time of moving from i to j” (Jiang et al., 1999). From this definition
it is easy to see how space syntax does not deal with the full concept of accessibility, in
Page 198
174 Accessibility Instruments for Planning Practice
that one rarely deal with Wj or any indexes of place attraction.11
Another way of putting it
is that geographic accessibility deals with ‘places’, where ‘place’ simply means a
geographically specific space, a location, or a space with a specific content, while space
syntax deals with ‘spaces’, i.e. spaces or locations with no specified content and thereby
no measurable attraction. This straightforward distinction, between space and place,
can be said to be the basis of what Jiang et al. (1999) distinguish as ‘geographic’ and
‘geometric’ accessibility.12 Hence, if geographic accessibility is the proximity of places,
then geometric accessibility is the proximity of spaces, i.e. setting Wj = 1. This can be
defined as:
(3.19)
From this we can see exactly why space syntax from the point of view of spatial analysis
is a special case of geometric accessibility.
Defining how to measure dij, the ‘distance’, ‘transport cost’ or ‘energy effort’ to move
from i to j, is then obviously a critical part of a accessibility measure, and in a geometric
accessibility measure the critical part. The most common distance units used within
accessibility research are: topological steps in a network, metric travel distance, travel
time, travel cost and monetary charges. But it is exactly concerning such descriptions
and measurements of distance one have encountered problems within spatial analysis
when moving from the comprehensive level of geography to the detailed level of urban
settings: “what is dramatically absent are tools for developing accessibility measures at
fine spatial scales which involve the geometry of urban structure in terms of streets and
buildings in contrast to the measurement of accessibility at the geographic or thematic
level”, (Jiang et al., 1999).
It is here that we propose that the morphological descriptions developed within space
syntax can prove useful and can contribute to accessibility research. Hence, the ‘axial
map’ developed within space syntax research, an example of topological steps in a
network, is a better measure of distance for certain critical issues of accessibility than
for example metric travel distance.
3.19.3 Operational aspects
Together with a group of students at the Department of Numerical Analysis and
Computer Science at KTH, we have developed the Place Syntax Tool (PST), an
application for the desktop software MapInfo. The PST consists of two main
components, MapBasic (MB) and Dynamic Link Library (DLL). The MB component is
written in MapBasic and implements reading and writing in MapInfo's own databases.
The DLL component is written in C/C++ and is compilated as a DLL. It takes care of the
graphical user interface (GUI) and does the accessibility calculations. The two
11As discussed in the introduction, this is one of the points with space syntax, trying to develop
descriptions whereby the architectural variable can be controlled.
12What is called ‘geometric’ here seems to come close to what is also known as ‘pre-geographic’
(e.g. Miller 2000).
Page 199
Chapter 3. Accessibility Instruments 175
communicate through a communication interface integrated within the DLL. The GUI
has two main windows. In the first window all tables are selected: input place data
(plots or address points) and output place data (where the results will be distributed:
plots or address points), axial lines and `unlinks' (points where crossing axial lines do
not connect), links (e.g. address points which link plots to closest axial line).
The second window is for selecting the type of analysis and consists of five pages. In the
‘Calculation type setting' page you can choose to calculate from all places or just from a
single place. In the 'Criteria settings' page the column for desirable place data is
selected. Here you can choose multiple columns. Data can also be normalized and
given a relative weight. In the `Result settings' page you choose how results are
displayed, in a table or on a coloured map in MapInfo. Here there is also a critical
section where you decide how data on input place data are distributed to the address
points, divided with the amount of address points or the full value to all. Similar to that,
the output place data has to be determined, whether they are to collect the mean, max
or min of the result values at the address points (that is if you do not choose to display
them on the address points). In the `Table Column Keys' page you select the key
columns that connect, e.g. address points and plots. The time for running a small city
analysis would be typically a couple of seconds.
3.19.4 Relevance for planning practice
We believe that the marriage between spatial analysis and urban morphology that place
syntax represents can bring with it certain fruitful theoretical implications. By taking as
its point of departure a geometric element, the axial line, that is defined from the point
of view of an experiencing subject rather than a more abstract element, (such as street-
crossings or bus-stops), the place syntax approach actually turns a lot of things upside
down. As earlier argued, many descriptions of accessibility of today are conducted from
a pronounced system point of view, partly because it has fit existing descriptive
techniques, partly because it has fit existing needs, which primarily has been formulated
by large bureaucracies and corporations. Place syntax then introduces the possibility to
also conduct descriptions and analyses of accessibility from a life-world point of view in
just as systematic and quantitative a way. The effect in our opinion is nothing less than
a possible displacement of power.
In many concrete urban planning situations system world descriptions (administrative)
and life-world descriptions (user) contradict each other, but since system descriptions
usually have more powerful quantitative foundations and life-world descriptions rely
more on ‘weaker’ qualitative descriptions, the former turn out to be the stronger part. In
a study by Ståhle (2005) it was shown that the access to parks and green areas
perceived by the citizens contradicted the measures by the planning authorities, which
measured this as hectare of park and green area per person. When instead the
accessibility was measured, using among other parameters axial distance rather than
travel distance, perceived access and measured accessibility correlated. The argument
was made further critical by the fact that the city districts where the citizens’ access to
park and green areas was perceived to be low, were rather low status post-war suburbs,
that by the planning authorities were understood as ‘green’, while the city districts
where the citizens’ access to parks and green areas was perceived to be high, were
Page 200
176 Accessibility Instruments for Planning Practice
quite dense high status inner-city districts, that the planning authorities were
understood as ‘grey’. According to existing measurements there was no need for new or
better parks in the post-war suburbs then, while that could be the case in the inner city.
The new place syntax measurements could hence show that there existed “more park
space in a denser city” and at the same time give quantitative voice to the perceived
lack of park and green areas in the conceived ‘green’ areas. In extension this
fundamentally alters both power relations in urban space as well as urban planning and
design practice.
3.19.5 Strengths and limitations
With these fundamental findings as a background we believe that the ‘place syntax’
approach has great potential for the development of new tools for urban planning and
design, not only for predicting pedestrian flow or estimating urban accessibilities, not
least to redefine the concepts of densities and areas. The aim of the research is to help
urban studies and practice to find new and possibly more informative ways or
presenting place data in general. These new realms of geographic accessibility analyses
with axial lines are however so diverse that only empirical investigation will show their
usefulness. Even so we would like to sketch some rough categories of application.
Between different categories of spaces: This means extending integration
analysis to other categories of spaces than those represented by axial lines,
such as points (e.g. address points) and districts (e.g. plots). It offers the
possibility to for example analyse ‘configurative constitution’, i.e. the number
of entrances within a certain radius, or ‘plot configuration’, which would be
the number or the total size of ‘accessible’ plots within a certain radius;
From all places to an attraction: This means calculating the number or the
sum of the value of a specific attraction within a specific radius from all
places. This implies a ‘supply’ or LOS (Level of Service). It could for example
concern the number of shops, or the amount of green space. These could
furthermore be combined into a possible measure of urban attraction;
Between the same attractions: This means calculating the number or the
sum of the value of a specific attraction within a specific radius from the
attractions. This could be a measure of ‘clustering’ of attractions or possible
competition/cooperation between businesses,
Between different places/ attractions: This means calculating the number or
the sum of the value of a specific attraction within a specific radius from
another attraction. This can be for example used for linking households and
jobs, people’s accessibility to work etc;
Place population: This means calculating the number of people within a
specific radius from all places. This can, as shown in this article, be used for
pedestrian movement prediction. But it could also be a means to analyse for
example the size of local economical markets;
Attraction population: This means calculating the number of people within a
specific radius from an attraction. This obviously is an extension to the
category above and could be used to analyse for example the number of
Page 201
Chapter 3. Accessibility Instruments 177
potential customers to a particular shop location or the potential amount of
visitors to a park.
This said, it is obvious that as with all analyses of accessibility and configuration there
are complexes of qualitative factors that are difficult to take into account, as put forth
by Kwan et al. (2003) among others. Desyllas et al. (2003) have tested to integrate
street width, adjacent retail and accessibility to underground stations in a pedestrian
demand model. Other factors are of course car traffic barriers, safety, noise levels, air
quality, identity etc. These factors furthermore affect different users such as children,
elderly, disabled etc. to different degrees. Kwan et al. (2003) even emphasizes that also
the individual level (personal accessibility) has to be taken into account. Still we believe
that the rather straight-forward approach of place syntax analysis balances well
between rather simple in-data and precision in out-data at the level that is most useful
in urban planning and design.
3.19.6 References
Batty, M. (2003). A new theory of space syntax. Working Paper 75, Centre for Advanced
Spatial Analysis, UCL, London.
Jiang, B. and Claramunt, C., (2000). An integration of space syntax into GIS: New
perspectives for urban morphology. Transactions in GIS, Vol. 6: 295-307.
Kwan, M.-P. (2000). Analysis of human spatial behavior in a GIS environment: Recent
developments and future prospects. Journal of Geographical Systems, Vol. 2: 85-90.
Kwan, M.-P., Murray, A.T., O'Kelly, M.E., Tiefelsdorf, M. (2003). Recent advances in
accessibility research: Representation, methodology and applications. Journal of
Geographical Systems, Vol. 5: 129-138.
Marcus, L. (2000). Architectural knowledge and urban form: The functional performance
of architectural urbanity. Ph.D. thesis, KTH School of Architecture, Stockholm, Sweden.
Miller, H.J. (2000). Geographic representation in spatial analysis. Journal of
Geographical Systems, Vol. 2: 55-60.
Page 202
178 Accessibility Instruments for Planning Practice
3.19.7 Figures
Figure 3.39 Closest food store within axial lines. Maps are comparable in terms of
colour. (Darker is shorter distance)
Page 203
Chapter 3. Accessibility Instruments 179
3.20 Social spatial influences of new transport
infrastructure (SoSINeTi)
Author of report: Maik Hoemke
Organisation: ETH Zurich, DARCH-gta
Address: Wolfgang-Pauli-Strasse 15, HIL D74.1, CH-8093 Zurich
E-mail: [email protected]
3.20.1 Background
Increasing expansion of transport infrastructure is taking place in more and more
countries. This trend, strongly encouraged by the globalization process, is reflected in
ever-shorter journey times in both national and international travel. During such
developments, extensive urban-planning alterations in areas that are being provided
with new transport infrastructure tend to be viewed purely in terms of economic and
efficiency benefits – and particularly in terms of the time saved when travelling the
distance from starting-point to destination. However, there has been little research on
the socio-spatial effects of new transport infrastructure systems. There is no awareness
or sensibility for such changes, and as a result hardly any methods are available to
investigate phenomena of this type. The present study is therefore intended to add a
new level to research on the efficacy of new transport facilities – namely, the socio-
spatial effects of transport infrastructure. Also the study tries to find methods to
investigate and measure social changes because of new transport infrastructure.
3.20.2 Conceptual framework and theoretical underpinnings
Accessibility in this case means not only the time needed and distance to a newly
developed transport infrastructure. The instrument looks also on accessibility aspects
before and after the new transport infrastructure was established in the same
municipality. Also it has a stronger look on regions which are no longer connected,
because of the new transport infrastructure, traversing another way.
So accessibility is measured with the number of connections to the next larger city.
These numbers of connections are compared over the years, especially before and after
the improvement of the new transport infrastructure. In the same way travel times will
be collected and compared, in a way of time table analysis.
To this quantitative meaning and measurement of accessibility, there are additional
qualitative approaches by observations of human behaviour before and after the new
transport infrastructure was built. Theoretical background is within urban sociology,
“Raumsoziologie” nd mobility studies, using mobile methods.
This methods and definitions are used to find a new level beside economic and
ecological aspects of new build transport infrastructure, this means, to find social
influences. So the sociology approach was used to find out, what influences better
Page 204
180 Accessibility Instruments for Planning Practice
accessibility has on human behaviour and what social and behavioural changes can be
observed in better accessible municipalities.
3.20.3 Operational aspects
The instrument measures different types of accessibility. First travel times between
municipalities are measured. Also these travel times are compared over years to have
an overall view. But not only travel times are measured, also the number of connections
are counted and compared over the years. But accessibility means also changes in
social spatial terms. So the development of new apartments for rent is counted and
greeting and talking behaviour of people living in the better accessible municipalities
are observed. This is all to see differences in social behaviour in fact of the new
transport infrastructure. Questionnaires with shop owners are used to show better
accessibility. Better Accessibility means therefore: longer shop opening times,
renovations in the shops, more international and not only local shops, more articles and
what kind of articles (more local or national orientated?). So these Questionnaires help
to understand accessibility in a more social way. To start with all these social
observations, expert interviews are useful as a pretest for preparing all observations.
All the data is available, but needs investigation and research. Also the list is not
completed here. So in other cases maybe other data will be more interesting.
No soft- or hardware is needed. Maybe a statistic programme can be used, like SPSS.
But at the end it is more concerned with analysing qualitative data. And there for no
good computer programmes are available.
All observations are long term observations within 5 up to 10 years. The first
computation is possible after three years. The time needed for computation depends on
the available data and the research questions, but needs no longer than one or two
weeks. But it has to be repeated every year, maybe more often.
No special requirements in technical aspects are needed. Maybe some interest in social
sciences and empirical methods
3.20.4 Relevance for planning practice
Because it is a long-term research and observation, this instrument on social influences
of new transport infrastructures can be used for future planning. Accessibility to
infrastructure is not only seen on economic and ecological basis, but also on social
facts. Specific on this instrument is that it provides information about former projects.
With this information it is possible to make future projects for good accessible transport
infrastructure more socially acceptable.
The instrument is not been used yet and it is not published at the moment. It will be
published in 2012. But practitioners are involved in the project and know about it. So it
helps architects and urban designers to create a socially acceptable surrounding for a
new transport infrastructure and it is also about, how to design accessible buildings and
places for transport facilities.
Page 205
Chapter 3. Accessibility Instruments 181
One mayor problem of the instrument is the long-term operation time of the instrument,
before valid data is available. This fits not within a planning context. And also five years
after a new transport infrastructure was built, no special interest on social effects is
drawn by planners, who are already preparing the next project.
Despite this, the instrument is really easy to apply in other countries. Only new ideas
about social research have to been learned, like doing an observation or preparing a
questionnaire. The needed and useful data varies from case to case.
3.20.5 Strengths and limitations
In scientific way it is hard to find any methods to measure social accessibility. So the
used methods are a kind of testing methods. Because social effects are overall hard to
measure and also hard to interpret, all findings sometimes are very subjective.
Nevertheless the instrument is easy to use and produce much qualitative data.
The instrument is most useful after implementing a new transport infrastructure,
because it is hard to analysis social behaviour before something happened in reality.
But it is useful for ideas in urban planning for constructing new accessible buildings and
places. So the instrument is more useful for future accessibility tasks than for the case
used for the research. This means other projects can learn from the faults, but also
from the good things of the observed project.
The advantage by using the instrument is, to create maybe better social contexts for
new transport infrastructure. But most important is even to think about social influences
of new transport infrastructure and accessibility. One major disadvantage is that the
instrument cannot be used every time in the same way and it needs long term
observations. But this disadvantage can also been seen as advantage, because every
case study is best prepared and the methods used are exactly those ones that are
needed.
Future improvements are planned. So the instrument should be improved by going on
with the case study longer than 5 years after the new transport infrastructure was
opened. This is helpful to observe long term social changes in better accessible
municipalities. It will also help to improve the methods to observe social spatial changes
because of new transport infrastructure and better accessibility.
Page 206
182 Accessibility Instruments for Planning Practice
3.20.6 Figures
Figure 3.40 Time table analysis: number of trains between better accessible towns
because of new improved transport infrastructure
0
20
40
60
80
100
120
2006 2007 2008 2009 2010 2011
Brig - Visp
Page 207
Chapter 3. Accessibility Instruments 183
3.21 Spatial Network Analysis of Public Transport
Accessibility (SNAPTA)
Author of report: Angela Hull and Saleem Karou
Organisation: Heriot Watt University
Address: School of the Built Environment, Riccarton, Edinburgh, UK
E-mail: [email protected]
3.21.1 Background
SNAPTA has been designed to evaluate the spatial accessibility and the social equity of
an urban public transport system. Currently, it has been applied to the Edinburgh
transport network to analyse i) the spatial accessibility and equality in the distribution of
urban services, and (ii) the impact that planned transport projects in the Local Transport
Strategy will have on spatial accessibility by public transport. It, therefore, is used for
both ex post and ex ante evaluation of public transport services.
Good accessibility is seen by the Scottish Government as a driver to economic growth
and competitiveness through “providing access to markets and enhancing the
attractiveness of cities as focal business locations and tourism” (Scottish Executive,
2004: 18). In the National Transport Plan accessibility is linked to improving journey
times and connections and to the quality and affordability of public transport choices
(Scottish Executive, 2006:2). Accessibility is translated into the Edinburgh Local
Transport Strategy as “whether or not people can get to services and activities at a
reasonable cost, in reasonable time and with reasonable ease”. (CEC, 2007:82).
Previous empirical studies of accessibility in the study area have examined the sub-
regional context, or wider travel to work context, using an aggregated dataset to make
broad-brush statements about accessibility. Halden (2002) examined the accessibility
outcomes of different strategies for growth and David Simmonds Consultancy used a
computer model to predict the impact of two major new strategic headquarters
developments to the west of Edinburgh beyond the city bypass close to the airport
(Bramley et al., 2011). More recently, Jan Scheurer has been examining sub-regional
accessibility using the SNAMUTS model.
3.21.2 Conceptual framework and theoretical underpinnings
SNAPTA is GIS based accessibility instrument which defines accessibility as “whether or
not people can get to services and activities at a reasonable cost, in reasonable time
and with reasonable ease”. Three measures or indicators of accessibility are used:
Time access to city centre by public transport from each zone during the actual morning
peak hour travel to the Central Business District (CBD).
Page 208
184 Accessibility Instruments for Planning Practice
A contour measure which calculates the total number of economic activities or
destinations within a maximum travel time by public transport for different trip
purposes.
A potential accessibility measure. A gravity-based measure using the morning peak hour
travel time between data zones, weighted by the quantity of activity opportunities per
zone. Using Hansen’s equation [ )(.J
ijji tfaA ], the potential accessibility for
the residents of each origin zone Aj is estimated. Where j is the attractiveness
(quantity or size of activity points) of destination zone J, tij is travel time, cost or distance
from zone to zone , and ( ij) is an impedance function. The impedance function
adopts a low value for the sensitivity parameter [ ] with a value of 0.1 since people
using public transport are not very sensitive to a small variation of time (Boucq, 2007;
Spiekermann and Wegnener, 2007).
The instrument, therefore, focuses on the land use and transport component of urban
interactions and the availability of opportunities during the morning peak hour which
can be accessed by public transport. The above-mentioned indicators have been widely
used in the literature and they rely on different methodologies to measure accessibility.
The fundamental difference between them is that the time access to city centre and
contour indicators focus on the separation between locations while the potential
indicator focuses on the interaction between locations (Gutiérrez et al., 1996). The
selection of accessibility indicators used in SNAPTA depends on the objectives of the
instrument user (See Chapter 4 for further discussion).
The theoretical underpinnings of the potential accessibility measure are that the
interactions between an origin and destination will decline with increasing distance and
time but that interactions are positively associated with the amount of activity at each
location (Hansen, 1959). The instrument focuses on groups of people, and assumes
that they have a set of social and economic activity needs to be met at different
destinations, and that travel demand will be determined by the attractiveness of these
locations and the quality of the transport infrastructure linking these places.
3.21.3 Operational aspects
SNAPTA uses the UK Census Data Zones, which have a population of 500-1000
residents, so that contextual data on the population and socio-economic criteria can be
used. Land-use and socio-demographic data (at Data Zone level) including the total
number of jobs, total gross floor area of retail services and recreation facilities, and
number of patients in health care centres and hospitals, can be obtained under licence
from government organisations. The data on the number of students in secondary
schools and universities, and number of leisure and recreation facilities can be obtained
from these organisations’ websites.
The digital multimodal transport network of bus services, tramways and railways can be
modelled in GIS (ARC/INFO). The network covers the whole of the studied area and
consists of links and nodes. The nodes are chosen on the network to correspond to
boarding points which provide a regular coverage across the study area. The analysis
involves the closest node on each public transport route (within the zone) to the zone’s
Page 209
Chapter 3. Accessibility Instruments 185
centroid. The centroids of larger, lower density zones of the periphery of the urban area
are re-calculated on the basis of population origins.
For each transport link in the GIS data base, tabular attributes of its type, length and the
time needed to pass that link have been built. SNAPTA takes into account walk access
time, waiting time, in-vehicle time and interchange time. In-vehicle travel time through
each link belonging to the currently running transport services can be calculated based
on the timetables associated with the bus and tram stops or railway stations during the
morning peak times.
Accessibility is calculated for the time access to city centre based on the shortest
journey time (or the fastest possible route) by public transport from the nearest node
(boarding point) in the network to the centroid of each zone to the nearest node to the
centroid of the CBD. The shortest possible journey time might be achieved by using one
or more services whether those services are provided by the same type of transport
mode or not. The calculation of the potential accessibility indicator is more complicated.
It also involves the shortest possible journey times on the network using public
transport from the nearest node to the centroid of each zone as an origin to those
nodes nearest to the centroids of the other zones as destinations. Once the travel time
is computed for each relationship, the accessibility value of each origin zone will be
obtained by relating the travel times with the land use attractiveness values
(opportunities size) in the destination zones by applying Hansen’s equation. A contour
indicator has also been measured for each zone by calculating the size of desired
opportunity (land use attractiveness) that can be reached by using public transport from
that node in the network nearest to the zone centroid within the determined maximum
time. A maximum travel time of 15 minutes applies to trips for shopping purposes, while
a length of 30 minutes is used for other services, since having a choice of retail services
such as a supermarket is not as significant as the choice within recreational and
educational services. In a GIS environment, the outputs of SNAPTA can be mapped and
demonstrated in 3D using Interpolation and 3D Analyst techniques to show the spatial
distribution of accessibility across the modelled area.
Data collection and input into GIS database is a quite time-consuming process while, by
comparison, running the SNAPTA instrument in GIS does not take a long time. However,
data input and performing the calculation require a good knowledge of GIS software
including ArcCatalog and ArcMap especially the functions of ArcGIS Network Analyst (i.e.
Cost Matrix, Closest Facility, Service Areas and the Best Route) that are used to run the
accessibility calculation. With regard to the degree of expertise required to interpret a
SNAPTA output, it depends on the choice of accessibility measure. The results of the
potential indicator are not easy to interpret by non-modellers as they are expressed in
units while those of the contour indicator and time access to the CBD represent the
number of reached opportunities and the needed travel time respectively, which are
easy to interpret.
3.21.4 Relevance for planning practice
This instrument has only just been designed so it has not yet been used by public or
private sector decision makers. Both the City of Edinburgh transport department and
Page 210
186 Accessibility Instruments for Planning Practice
the Lothian Region Health Board were involved in early stages of the design of the
instrument. The intention is to work with these institutions to refine the instrument to
their specific needs. The instrument will be useful to service providers in several ways;
SNAPTA compares the zonal accessibility by public transport and can estimate the
accessibility impacts brought about by proposed transport infrastructure changes. In the
case of Edinburgh, it can evaluate the zonal impact of route choices for new
infrastructure such as the tram.
At a strategic level, it provides an overview of the attractiveness of zones accessed by
public transport to identify the “hotspots” of activity during the morning peak hour. This
locates areas of potential congestion which may require specific management
approaches.
At a strategic level, it can identify at a disaggregated level those zones that are relatively
poorly served by public transport. This can be correlated with income and car ownership
data to identify where the public transport system needs strengthening.
At a service operational level, when disaggregated by activity, the instrument shows the
length of public transport commute for residents using the isochrones feature.
At a service operational level, the instrument can show the likely zonal impact of service
closure and relocation (e.g., Hospital).
Accessibility is one of the UK government’s ex ante evaluation criteria for transport
project proposals in that the impact on accessibility is one of the key criteria for (i) the
assessment of major development proposals in the UK and (ii) the assessment of major
transport infrastructure projects by the Department of Transport and Transport for
Scotland. Current appraisal methodologies are limited to assessing the impacts of
development or transport infrastructure on the surrounding neighbourhood roads.
SNAPTA, therefore, introduces a focus on the spatial equity by public transport.
3.21.5 Strengths and limitations
One of SNAPTA’s drawbacks is that zonal centroids are used, and so SNAPTA assumes
that all individuals are gathered at the centroid and enjoy the same level of accessibility,
although they have different travel demands and may perceive the set of alternatives
quite differently. In addition, since Data Zones are groups of 2001 Census output areas
have populations of between 500 and 1,000 residents, however, the areas of some
zones are very large compared with the rest due to their low population density.
Therefore, generating the same accessibility value for the whole area of a large zone is
questionable. Another drawback is that the opportunities which are located just outside
the modelled area even by only few seconds are neglected. Assuming a walk time
between origin or destination and boarding point of 10 or 15 minutes (based on the
zone size) rather than calculating the actual walk time through the pedestrian network
can be considered as a weakness. Also, the input of the required transport data into a
GIS environment is a quite time consuming process.
On the other hand, the key strength of SNAPTA is the ability to apply a package of
accessibility indicators using small geographical divisions, and with different ranges of
Page 211
Chapter 3. Accessibility Instruments 187
land-use and socio-demographic data. Therefore, the instrument takes into account
both transport and land-use systems for accessibility analysis. Since three different
types of accessibility indicators are applied in SNAPTA, the results can be used for
different applications in transport and land-use planning. Another benefit of including
different accessibility indicators is the ability to tackle a limitation of one of the applied
indicators by using another indicator in the package. For example, no distance decay is
considered in the contour indicator (i.e. all the opportunities located within the selected
maximum travel time area are equally counted and not weighted by the distance) while
the potential accessibility indicator applies a gradual decay in the distance. The
potential indicator considers all the relationships between all origins and destinations
while the considered area is limited by using the contour indicator. Also, the results of
potential indicator are not easy to interpret by non-modellers as they are expressed in
units while the contour indicator output represents the number of reached opportunities
which is easy to interpret.
3.21.6 References
Bramley, G., Simmonds, D., and Dobson, A. (2011). Using land use/transport interaction
(LUTI) models to assess the sustainability of strategic planning and infrastructure
proposals: the potential scope and illustrative applications. In Hull, A.D., Alexander, E.R.,
Khakee, A., and Woltjer, J., (2011) Evaluation for Participation and Sustainability in
Planning, Routledge: London.
Boucq, E. (2007). The Effects of Accessibility Gains on Residential Property Values in
Urban Areas: The Example of the T2 Tramway in the Hauts-de-Seine Department,
France. Paper presented at the European Transport Conference 17-19 October 2007,
Leeuwenhorst, Netherlands.
City of Edinburgh Council (2007). Local Transport Strategy 2007-2012, the City of
Edinburgh Council, Edinburgh.
Halden, D. (2002). Using accessibility measures to integrate land use and transport
policy in Edinburgh and the Lothians. Transport Policy, Vol. 9: 313-324.
Gutiérrez, J., González, R. and Gómez, G. (1996) 'The European high-speed train
network: predicted effects on accessibility patterns', Journal of Transport Geography,
vol.4, no.4, pp.227-238
Hansen, W.G. (1959). How accessibility shapes land use. Journal of American Institute
of Planners, Vol. 25: 73-76.
Scottish Executive (2006). Scotland’s Transport Strategy, Scottish Executive, Edinburgh.
Spiekermann, K. and Wegener, M. (2007). Update of Selected Potential Accessibility
Indicators. Final Report, Urban and Regional Research (S&W) and RRG Spatial Planning
and Geoinformation.
Page 212
188 Accessibility Instruments for Planning Practice
3.21.7 Figures
Figure 3.41 Left- Modelling of public transport routes. Right- Mapping of potential
accessibility indicator result
Page 213
Chapter 3. Accessibility Instruments 189
3.22 Database suite for calculation of UK accessibility
statistics (ACCALC)
Author of report: Derek Halden
Organisation: DHC
Address: 2 Dean Path, Edinburgh, EH4 3BA
E-mail: [email protected]
3.22.1 Background
In 1992 when planning an integrated land use and transport strategy for east central
Scotland it was identified that modelling tools for accessibility were very limited.
Consultants MVA had done some land use transport policy interaction modelling work
under JATES (Joint Authorities Transport and Environmental Studies) but it was clear
that further work was needed to identify how accessibility analysis could be made more
practical to land use and transport planners.
The conceptual foundations of ACCALC were developed to solve this problem. DHC
founder Derek Halden (whilst working for the UK Transport Research Laboratory)
undertook a review of accessibility modelling techniques to identify how better
information could be made available to land use and transport planners to help them
plan changes. Out of this review came various papers which showed that accessibility
change was perhaps the most important parameter to focus on when planning land use
and transport e.g. “managing uncertainty in transport policy development” (Halden,
1996) and “transport and economic development around Inverness” (TRL, 2003).
By 1996 the opposition Labour party had picked up on the accessibility theme as the
paradigm shift they wanted to make in transport policy and when they were elected in
1997 the accessibility goal was included in transport and land use policy. DHC was
appointed to design the first the Scottish approach to implementing this approach in
1998 and subsequently DHC was also appointed to lead the development of
accessibility planning policy in England in 2002 (DHC et al, 2004).
In 1999 version 1 of the ACCALC model was issued on CD to all local authorities in
Scotland with Planning Advice note 57 – Planning and Transport. In 2005 this model
was substantially upgraded when DHC was appointed to calculate the core accessibility
indicators for England and Wales. Since 2005 ACCALC has been used annually to
update the CAI which are neighbourhood level indicators (approximately 1000 houses)
and cover mainland UK.
3.22.2 Conceptual framework and theoretical underpinnings
The basic concepts in ACCALC are that it is a relational database helping planners to
manage large and complex data sets and to output meaningful accessibility indicators
(DfT 2011). Version 1 allowed users to upload spatially referenced data on land uses,
spatially referenced data on locations from which trips are generated and tables
Page 214
190 Accessibility Instruments for Planning Practice
showing the deterrents affecting travel between each origin and destination location.
Functions are provided to automate the calculation of a variety of common accessibility
indicators formulations.
By far the most widespread application of the model is using travel time data between
origins and destination. These are calculated from the digital road and public transport
network using a hierarchy of related sparse matrices to represent the journey times
between any two points. The matrices are populated using observed travel
speeds/costs on each road/footpath link and scheduled journey times/costs from
public transport timetables. On some links other barriers are added. For example
certain public transport services are not available to people due to physical barriers to
using services such as no lifts at rail stations for people who cannot use stairs. Some
links have time penalties added due to known difficulties using them such as reliability
or quality factors.
By aggregating the travel times or costs between nodes for each mobility groups within
the database, the journey times/costs between any two points can be output. The
model algorithms search for better journey times or costs until convergence is achieved
relevant for the user group being considered and the range of barriers (time, cost,
quality, information, etc being considered).
A key part of the model is to guide users when formulating useful indicators: “which
population group are you considering, what type of land use are they trying to reach,
what barriers to access are being considered?”
Default parameters are included to represent the deterrent effect of travel allowing trip
opportunities to be combined in Hansen, Logsum, and other opportunity and value
measures. These are based on observed behaviour but can be overwritten by a user
who wishes to use their own parameters based on local survey data (e.g. the deterrent
effect of safety factors is greater in Middlesborough than Inverness so understanding
locally relevant factors like not being willing to travel on a bus after 6pm if over 60 is
important) (UoW, 2004).
3.22.3 Operational aspects
ACCALC version 1 in 1999 was based on Microsoft Access 97 but became obsolete
when this software was not commonly available on people’s computers after about
2002. Active users maintained a separate copy of Access 1997 (including at the UK
universities which used it for training students).
A revised version has never been publicly issued and instead government uses a MS
SQL server version of ACCALC to calculate and publish 468 different accessibility
indicators annually in Excel spreadsheets. This means that local authorities generally do
not need to do their own analysis. If they are looking at a land use plan or transport
change they can read off and compare indicators or commission additional analysis.
Building the matrices takes many hours of computation even on high specification
servers. However once built, ACCALC uses these matrices as look up tables for any
policy question to be analysed so that questions can be answered in real time e.g. when
working on a project or policy. A high level of technical expertise is needed to run the
Page 215
Chapter 3. Accessibility Instruments 191
analysis but it is hoped to provide a web based user front end so that anyone can use
the tools free of charge. To create a user interface suitable for non-technical people will
require significant investment so each year DfT defer it till the next year.
In general users concentrate on travel time analysis since the data is more readily
available. However analysis of travel costs is also common. Users have not commonly
used the model for other factors.
Travel times and costs vary throughout the day and the journey times and costs used in
any analysis need to be weighted to match the probability of users wanting to make a
trip at each time of day. For example there might be regular bus services on a route
between 9am and 5pm but these would be of little use for people wanting to make a
journey to a night club. Analysis typically measures 23 journey times across a 24 hour
period and two cost periods – peak and off peak.
Data has become much more freely available over the last two years with the opendata
government initiative. However data on commercial facilities like shops and theatres
can still be quite expensive to purchase.
3.22.4 Relevance for planning practice
National planning policy guidance suggests that as a minimum in a planning application
comparisons should be made between the car available and non car available trip
times. If the ratio of non car available to car available time exceeds 2.5 then the
location would only be suitable for certain types of development and if it exceeds 10
then the location is considered to be car dependent. Although planning guidance
requires these checks it is still common practice in the UK not to present the
accessibility information with planning applications. Common practice is to make vague
statements about accessibility issues not being a problem.
Part of the reason for this is that government puts out far too much guidance and much
of it is rarely read. DfT considered a major training and information programme about
accessibility planning in 2004 but did not go ahead, instead undertaking some small
scale information sessions “within-reach”.
In transport planning the Scottish Government require four different types of
accessibility measure to be reported for all transport appraisals: stated, expressed,
social and comparative (STAG 2003). The social measures can use the core national
indicators and deterrence parameters are published in Scottish Transport Appraisal
Guidance to let people use look up tables to calculate simple indicators. DfT are
considering similar approaches for UK appraisal but the NATA refresh is taking many
years.
3.22.5 Strengths and limitations
The main limitation of the model is that it does not yet incorporate user data as
standard but plans are being put in place to address this using data from
http://www.fixmytransport.com/, http://www.fixmystreet.com/ and the Loop
(www.theloopuk.co.uk). This means that there is little calibration of indicators to show
Page 216
192 Accessibility Instruments for Planning Practice
that this is actually how people view the opportunities that have to reach services and
facilities.
At a practical level accessibility indicators need to become as integrated and easy to
use as other key information affecting decision making like cost. The Auditor General in
Scotland recently concluded in a recent review of local government that if there was
only one type of indicator local authorities could monitor it should be accessibility, since
accessibility was the most useful way to demonstrate the opportunities available to
citizens for health, education, work, leisure, etc.
The barriers to making these changes happen are not technical but relate to changing
culture and attitudes of professionals who work in narrow areas and are not focused
enough at the needs of the people they serve. Uses of the indicators has therefore been
common by campaign groups showing how and why people’s needs are not being met
and it may take many years to support service providers to become more
citizen/consumer focused.
See http://www.dft.gov.uk/statistics/releases/accessibility-2010 for further details.
3.22.6 References
Department for Transport, 2011. Accessibility Statistics Guidance. Last Revised
September 2011. http://assets.dft.gov.uk/statistics/series/accessibility/accessibility-
statistics-guidance.pdf (Accessed 5 March 2012).
Department of the Environment, 1995. Policy and Procedure Guidance: A Guide to
Better Practice – Reducing the Need to Travel Through Land Use and Transport
Planning, PPG 13, HMSO, London, UK.
Derek Halden Consultancy, University of Westminster, 2004. Developing and Piloting
Accessibility Planning. Final report for DfT. London.
http://www.dhc1.co.uk/projects/accessibility_developing.pdf (Accessed 5 March 2012)
Forum for the Future, 2010. The Sustainable Cities Index 2010. London:
http://www.forumforthefuture.org/sites/default/files/images/Forum/Projects/Sustaina
ble_Cities_Index/Sustainable_Cities_Index_2010_FINAL_15-10-10.pdf (Accessed 5
March 2012)
Halden, D. 2003. Accessibility Analysis Concepts and their Application to Transport
Policy, Programme and Project Evaluation. In Transport Projects, Programmes and
Policies: Evaluation Needs and Capabilities. Ashgate. Edited by Mackie and Pearman.
Halden 1996. Managing Uncertainty in Transport Policy Development. Proceedings of
the Institution of Civil Engineers.
Scottish Executive 2000. Accessibility and a Criterion in Policy and Project Development.
Final Report.
Scottish Executive 2002. National Planning Guidance Note 17.
Scottish Executive 2002. Planning Advice Note 57.
Page 217
Chapter 3. Accessibility Instruments 193
Scottish Executive, 2005. Evaluating the School Travel Co-ordinator Initiative. Edinburgh
http://www.scotland.gov.uk/Resource/Doc/69582/0018066.pdf (Accessed 5 March
2012)
TRL 2003. A Review of Transport and Economic Development Changes Around
Inverness. TRL Crowthorne. UK
University of Westminster, 2004. Accessibility Planning and Crime Reduction. Report for
Department for Transport. London.
http://www.dft.gov.uk/pgr/regional/ltp/accessibility/developing/research/ssibilityplann
ingandcrim3612.pdf (Accessed 5th March 2012)
3.22.7 Figures
Figure 3.42 Average minimum travel time to reach the nearest key service by public
transport/waking, England, 2007 to 2010
Page 218
194 Accessibility Instruments for Planning Practice
Figure 3.43 Uses of ACCALC
Page 219
Chapter 3. Accessibility Instruments 195
3.23 Cross-analysis of the accessibility instruments
presented in Chapter 3
Luca Bertolini, Derek Halden, Sanna Iltanen, Stefano Pensa and Bruno Filipe Santos
In this concluding section, we look at how the different accessibility instruments
presented in this chapter compare on the different aspects: background, conceptual
framework and theoretical underpinnings, operational aspects, relevance for planning
practice, strengths and limitations, and visualization. We identify, per item, significant
similarities and differences and reflect on potential implications for the following steps
of the Action.
3.23.1 Background
The main motivation to develop an accessibility instrument can be roughly divided in
three categories: policy and planning support, scientific enquiry, or a combination of the
two. The borders between these categories are not always clear cut. However, based on
the motivation expressed by the authors and for the sake of orientation, 10 of the 22
instruments reviewed in Chapter 3 can be placed in the first category, 4 in the second,
and 8 in the third.
Within the instruments primarily motivated by a policy support aim, two groups can be
identified. A first group is primarily directed at supporting policy development and
delivery in a multi-disciplinary (both transport and land use) and multi-stakeholder
(including different levels of expertise) context. Examples are SNAMUTS (0), EMM (3.7),
InViTo (3.10), and JAD (3.12). A second group rather aims to develop tools for the
assessment of land use and/or transport development proposals and/or service
provision. Examples are TRACE (3.2), RIN (3.8), MaReSi SC (3.13), IMaFa (3.18),
SNAPTA (3.21), and ACCALC (3.22).
On the other extreme of the spectrum are instruments that are primarily motivated by
scientific enquiry, even though the potential relevance for planning is also envisaged, as
it might be expected from participants in this COST action. In this category fall HIMMELI
(3.5), GDATI (3.14), UrbCA (3.16), and SoSINeTi (3.20).
A middle category is rather above all motivated by the wish to innovatively apply in
planning practice insights already fairly consolidated in the scientific domain. The Space
Synthax inspired instruments described in sections 3.3, 3.9, and 3.19 fall in this
category. Other examples are ABICA (3.4), Contactability (3.6), GraBAM (3.11), SAL
(3.15), and ATI (3.17).
This variety of motivations is both a challenge and an asset for the COST Action. It is a
challenge because it demands establishing a common language and sense of direction
between researchers coming from different backgrounds and having different primary
motivations. It is an asset because it gives the Action a rich variety of expertise
spanning the scientific and policy domains. Such variety seems essential for our aim of
establishing a bridge between scientific enquiry and policy practice.
Page 220
196 Accessibility Instruments for Planning Practice
3.23.2 Conceptual framework and theoretical underpinnings
The ease or difficulty in reaching different activities dominates among the instruments
as a conceptual definition of accessibility. The kind of activities or services that are
included in measurements varies more or is not reported in a very detailed way. Some
of the instruments focus on certain services like retail and shopping (e.g. TRACE,
MaReSi SC), some approach public transportation or technical infrastructure as service
(to be accessed) (e.g. InViTo, ATI) while others approach transportation and
infrastructure as a system which enables the access to activities or services. Several
different activities are taken into account for example in instruments like ‘SAL’ and
‘GraBAM’.
One clear group of instruments concentrate only on the physical and configurational
aspects of space and define accessibility in terms of the topological network properties
of urban space using transportation network or other networks based on visual
perception. ASAMeD and ‘MoSC’ are examples of instruments that are based strongly
on space syntax approach. Some of the instruments settle between these two like ‘PST’
has a more individual approach to the accessibility concept.
The theoretical underpinnings vary from geography to architecture. Most of the activity
related instruments utilise gravity based accessibility measures and are thus related to
the modelling tradition of urban geography. Instruments that emphasise the spatial and
structural properties of urban environments mostly refer to the ‘space syntax school’
which has its origins in architecture and urban morphology. Instruments that are part of
larger model structures, like ‘HIMMELI’ and ‘UrbCA’ are related to different traditions of
modelling theories like systems theory, complexity theory and the theory of cellular
automata. Some instruments like ‘ABICA’ refer to time geography or information
visualisation. A significant part of the instruments are not reported having any
theoretical underpinnings, but they are merely developed for normative planning
purposes.
The motivation for choosing and developing the instruments is generally an aim to
support strategic planning decisions – especially the focus is on the integration of
transport and land use planning. Some of the reports emphasise more economic issues
and assessment of investments while others emphasise more social aspects e.g. social
equity. Differences can be seen also between normative tools that are developed to set
certain (unambiguous) standard solutions for planning (e.g. maximum travel times to
services or minimum customer potential within given distance) and more analytical
tools that don’t include straightforward instructions for planning but rather increase
understanding of the interdependencies between urban elements.
3.23.3 Operational aspects
The authors were asked to give an answer to the following questions:
Which types of accessibility does the instrument measure?
How does your instrument calculate accessibility?
Which data is required? Is the data publicly and freely available? If not at
which conditions can it be obtained?
Page 221
Chapter 3. Accessibility Instruments 197
How is the data processed? What are the hardware and software
requirements? Is the software publicly and freely available? If not, at which
conditions can it be used?
How much time does the calculation require?
Which degree of technical expertise is required to perform the calculation?
Which degree of technical expertise is required to interpret the results?
A comparative overview of the responses to these questions is reported in Appendix 3.
Significant similarities and differences are:
Most instruments deal with aggregated measures of accessibility, by either
considering a network distance (despite the mode) or the different modes
together;
The techniques for computing accessibility, when mentioned, vary from
spatial syntax (3) and gravity models (5), to activity based (2), social based
approaches (2) and clustering (1);
Part of the instruments (6 of 22) deal with the impact of land-use changes,
some instruments deal with accessibility to stores, while few deal with the
accessibility to facilities;
In general, data needed is transportation info (maps, OD matrices,
times/costs) and population data. Most of the authors mention that the info
they need is available on the web (10 of 22) or is provided by planning/local
authorities (7 of 22). Only 5 authors mention that data must be purchased;
No clear idea of computation time is always provided – the time for applying
the instruments depend on the type of tool used and the size of the case
study, but most of the authors mention the duration of hours or days;
14 of the instruments are based on GIS software, 2 use data management
software, and only 6 authors mention that they use (or developed) open
source tools;
The level of expertise need to use the instruments also vary between
instruments – 6 authors mention that no specific expertise is needed to use
the instrument and 10 mention the same for interpretation of the results; 3
authors mention that a high level of expertise is needed for preparing data,
7 to use the instrument, and 4 to read the results.
Potential implications for the following steps of the Action are:
The summary shows that different accessibility techniques are being used
and different transport modes are focused upon by the authors. The
compatibility of these different perspectives can be a major challenge for
the Action but it also proves the wide coverage of this Action;
In the same way, some authors focus on urban-level accessibility, while
others focus on neighboorhood-level accessibility (e.g., walking or cycling
distance) and others on interregional-level accessibility (e.g., long distance
trips by rail or air). The merger of both scales, by using more than one
instrument in the future can be a potential goal for accessibility research - .
Page 222
198 Accessibility Instruments for Planning Practice
Most authors present instruments that deal with accessibility in a static
fashion, i.e. they try to get the picture for a given scenario (in the past,
present or future), but 3 authors mention that their instruments focus on
measuring the impacts on time of land use changes and impacts of
infrastructure investments. The Action may explore these different
approaches, trying to understand how they can differently be used by
planners and, if they provide different answers, for which uses which
approaches can be better.
3.23.4 Relevance for planning practice
Each of the reports attempted to address the following questions:
What information does your instrument produce that can be useful for
planning practitioners?
Has the instrument been used before in a real planning context?
If yes:
Where and when?
Which planning problem, or problems, did the instrument address?
How did the instrument help in decision-making?
What difference did it make in the planning outcome and/or in the decision-
making process?
If no:
Why not?
Has the possibility of using the instrument to address a planning problem
and support a decision-making process been otherwise explored? If yes,
provide a brief description of the planning problem and how the instrument
can provide support to decision makers.
A comparative overview of the responses to these questions is reported in Appendix 4.
Significant similarities and differences among the reviewed instruments with respect to
planning practice are:
Some are tools to aid calculation;
Some are expert systems to help define and answer problems;
Some are repeatable analytical methods using existing and widely available
tools like GIS systems.
Potential implications for the following steps of the Action are:
Where there are clear policies defined for accessibility, then tools have an
application since they can be optimized to implement the policy and make
calculation easier.
Page 223
Chapter 3. Accessibility Instruments 199
Where accessibility analysis contributes to another policy goal like transport
or land use planning then repeatable analytical methods can be most
useful.
Accessibility can be a difficult concept so both of the above can use expert
systems to guide people through the process of data collection, analysis,
policy formulation and planning.
3.23.5 Strengths and limitations
The variety of motivations for developing the accessibility instruments and the even
greater variety in their content focus mean that it is difficult if not impossible to
synthesize their strengths and limitations. The discussion here would therefore have to
be at a high level of abstraction and be limited to the most salient issues. For more
concreteness and detail we refer to the individual chapters.
A key strength cited by most if not all is the ability of the instrument to link (1) some
information on transportation networks, land uses and the urban fabric, to (2) their
impact on location and mobility behaviour and therefore (3) implications for the
achievement of policy goals ranging from economic development, to social equity and
environmental preservation. From the point of view of instrument developers,
accessibility is, in its various forms, a (if not the) key indicator of the performance of the
built environment. Most authors would subscribe the view of the Auditor General in
Scotland reported in section 3.22 that, if there was only one type of indicator local
authorities could monitor it should be accessibility, since accessibility is the most useful
way to demonstrate the opportunities available to citizens for health, education, work,
leisure, etc.
A second key strength cited by many is the straightforwardness, ease of interpretation
and communicative power of the indicators, often in map form. These last claims,
however, are not always supported by actual applications in planning practice, or by
applications going beyond a pilot study, as documented in the previous section.
Accordingly, several authors also cite the need to embark in practice applications and to
learn through them how usable the instruments actually are, and how to improve
usability. This provides, of course, a clear focus for the next steps of this Action.
Requirements in terms of data availability, calculation time and technical expertise are
also often cited as limitations and areas of improvement. Other areas of improvement
mentioned concern, perhaps somewhat contradictorily with the previous ones, the need
to extend the range of inputs (e.g. more transportation modes, more qualitative urban
morphology features) and outputs (e.g. more impacts), or to increase the realism of the
underlying behavioural assumptions (e.g. by including distance decay and competitions
effects, or transport-land use feedback mechanisms). Some of the authors, however,
point out the fact that models are by definition limited in their realism, and that the aim
should rather be to ensure that the accessibility instrument is transparent in its
assumptions and logic, and easy to use. They further contend that complexity should
rather be added by also using other instruments, or through the discussion with other
experts and stakeholders. The rigor-relevance dilemma cited in section 3.15 sums up
Page 224
200 Accessibility Instruments for Planning Practice
this conundrum and seems to point to a key area of discussion and exploration for the
following phases of the Action.
3.23.6 Visualization of outputs
The accessibility instruments described here show a variety of visualization forms.
Sometimes the output of accessibility tools can be numerical and listed in tables, matrix
or datasheets, without offering any kind of visual outcome (e.g. tools in sections 3.2,
3.13, 3.14, 3.17, and 3.20). But this kind of outcome can be needed for some users to
make sense of accessibility which can otherwise be treated as a ‘slippery’ concept and
not trusted by decision makers. Nevertheless, the most of accessibility tools generates
a visual product, generally represented by bi-dimensional maps.
In order to analyse these different approaches to visualization, an overview will be
shown, including only the instruments which generate a visual output. Furthermore,
since many case studies have very similar output, their analysis will be conducted
aggregating the tools on the basis of the technique of visualization. Main categories are:
2D areal aggregation: data are grouped in macro-zones and classified on the
basis of a colour scale;
2D axis-based maps: data are defined by the road network (e.g. Space
Syntax based instruments) or by lines connecting points. The colour of
shapes define the intensity of values;
2D point-based maps: data are represented by points on 2D maps. Size and
colour of shapes define the intensity of values;
3D images: maps with a third, z-axis;
no visual output: tools with no visual output described.
The accessibility instruments have been ordered as shown in the Table 3.5.
Only 5 of 23 tools do not report a visual output, highlighting the importance of visual
communication for the most of the studies. Nevertheless, communication is mostly
intended to provide knowledge rather than simply present data. In fact, except in one
case (ABICA, section 3.4), all the accessibility instruments which have a visual output
make use of bi-dimensional maps, preferring traditional methods of communication
which are commonly used in spatial studies. This can be due to several factors. Firstly,
2D maps are generally perceived as more easy to understand for a wider range of
people with different levels of expertise. Secondly, accessibility studies involve the use
of spatial indicators which perfectly fit geo-referenced representations. Thirdly, input
data are bi-dimensional. Finally, the different approaches to the study of accessibility do
not cover the z-dimension, projecting all the connections to the ground level.
Half of the tools represent data by the use of area aggregation, generally based on the
administrative boundaries of studied areas. This technique provides results highly
dependent on the scale of aggregation, which is generally a balance between the
dimension of the area and the amount of data to consider.
Page 225
Chapter 3. Accessibility Instruments 201
Table 3.5 Tools aggregation according to their type of output visualization
2D areal aggregation
SNAMUTS (3.1) JAD (3.12) PST (3.19)
HIMMELI (3.5) SAL (3.15) SNAPTA (3.21)
EMM (3.8) UrbCA (3.16) ACCALC (3.22)
GraBAM (3.11) IMaFa (3.18)
2D axis-based maps
ASAMeD (3.3) MoSC (3.9) RIN (3.8)
Page 226
202 Accessibility Instruments for Planning Practice
2D point-based maps 3D images
Contactability (3.6) InViTo (3.10) ABICA (3.4)
No visual output
TRACE (3.2)
MaReSi SC (3.13)
GDATI (3.14)
ATI (3.17)
SoSINeTi (3.20)
Space syntax based tools (ASAMeD and MoSC) use the road network to visualize the
value associated to their indicators. This allows them to define the behaviour of each
axis in relation to the whole area, creating a well performing visualization for describing
the relations among the parts. Nevertheless, they seem more suitable in testing
alternative project options rather than generate useful information for project design.
Also the RIN shows its output by the use of coloured axes, however the overlapping
reduced the clarity of the information provided.
Point-based maps are used by just two tools and in a similar way but at different scales.
The Contactibility uses elements of info-graphic to implement the readability of a very
large scale map, generating a picture which highlights well the size and location of value
clusters. On the other side InViTo proposes a point output at urban scale where points
vary in colour and size according to indicator values.
The overview on tool shows that the techniques of visualization are not affected by the
scale of representation, but rather by the type of data aggregation. In determining the
required visualization approach it seems necessary to first understand the intended
audience and what the planner hoped they will do when they see the visualization.
Among the accessibility tools presented in this report, the purposes of visualizations
mostly focus on data explanation to high and medium experts, with map-based
knowledge. All the visual outputs, both concerning policy support and scientific enquiry,
provide representations which distil complex concepts into relatively simple maps and
graphs helping planners to understand spatial dimensions of key accessibility statistics.
Some visualizations use more artful techniques, which can be helpful in facilitating
engagement, but still remain knowledge-focused.
Page 227
Chapter 3. Accessibility Instruments 203
Most of the tools need calculation times within the range of hours to days. Only one tool
(InViTo), allows data exploration, generally considered as the highest form of data
knowledge, by the use of interactive dynamic maps which work in real-time.
The majority of tools show their outcomes with colours that refer to three common
techniques: the first is the traditional green-yellow-red scale, the second resorts to the
different gradients of the same colour while the third uses the opposition between red
and blue to highlight the contrasts. These traditional approaches to the use of colour
shows once again the purpose of these tools to provide results that can be understood
by the most of people and, in particular, to inform spatial planners on the capabilities of
an area to access another one or to be accessed.
Page 228
204 Accessibility Instruments for Planning Practice
Page 229
Chapter 4. ACCESSIBILITY INSTRUMENTS SURVEY
Angela Hull, Enrica Papa, Cecilia Silva, Anssi Joutsiniemi
Page 230
206 Accessibility Instruments for Planning Practice
Page 231
Chapter 4. Accessibility Instruments Survey 207
4.1 Introduction
This chapter presents the main results of the Accessibility Instrument Survey (AIS),
collecting basic information on each of the accessibility instruments reviewed in this
report (for more detail on these Instruments see Chapter 3). The aim of the survey was
to enable quick, objective and comparable overviews of each of the reviewed
accessibility instruments. The information collected will enable the categorization of
accessibility instruments present in this research, aiming to be a reference for future
categorization of accessibility instruments for planning practice. These categories will
support the analysis of the coverage of accessibility instruments in this research, i.e.,
identify how representative this research is across different accessibility instrument
types. In addition, these will be used to analyse the characteristics and concerns which
most frequently underlie the development of accessibility instruments. Finally, the
survey also collects developer’s perceptions on the usefulness of their accessibility
instruments in planning practice, enabling the first insight into the main research
question of this COST Action, although limited to the developer’s point of view.
In summary, the results of the survey will be used for four purposes:
Development of an accessibility instrument sheet for each accessibility
instrument summarizing its main characteristics (Appendix A);
Identify the coverage of accessibility instrument types present in this research
(Section 4.3.1) discussing the representativeness of this Action;
Provide a glimpse on the characteristics and concerns which most frequently
underlie the development of accessibility instruments (Section 4.3.2);
Provide a first insight into the perceived usefulness of accessibility
instruments in planning practice from the point of view of the developer
(Section 4.3.2 and Section 4.3.3).
The next section provides an overview of the Survey describing the information
collected. This section also describes the development process of this survey including
data collection, dates and means. The results of the survey are analysed in the third
section starting with a discussion on the coverage of accessibility instruments reviewed
by this research (Section 4.3.1), identifying accessibility measure types which are
represented and which are absent. This discussion is accompanied by the presentation
of the main categories of accessibility instruments from the perspective of the end user.
These categories try to summarize the main concerns planning practitioners are
expected to have when searching for an accessibility instrument and is built upon some
of the information collected by the survey. Following, the third section also presents a
general analysis of the results (Section 4.3.2), focussing on the dominant
characteristics of the accessibility instruments reviewed and on the developer’s
perception of the usefulness their instrument will have for end users. The section ends
with a brief cross analysis of results (Section 4.3.3) trying to identify relationships
between accessibility instrument characteristics and perceptions of usefulness by
developers. The fourth and last section presents the main conclusions of this study.
Page 232
208 Accessibility Instruments for Planning Practice
4.2 The Accessibility Instrument Survey
The Accessibility Instrument Survey was conducted on the Action’s website
(http://www.accessibilityplanning.eu) with developers of accessibility instruments
participating in this research being invited by e-mail with a direct link to the survey
(which was not accessible otherwise or searchable on the web).
The development of the survey started in the beginning of 2011 with a general
discussion meeting involving all research groups of this COST Action. The main issues of
the survey were discussed in a general assembly, which was later subdivided into
smaller groups to work on the particular questions in each group. This process enabled
the development of an inclusive survey considering different perspectives and the
backgrounds of accessibility instrument developers. The draft version of the survey was
then further developed by a smaller team. The survey was available to be filled in by all
participating accessibility instrument developers from mid-August to mid-September
2011.
A preliminary analysis of the results of the survey and of the comments left by the
accessibility instrument developers revealed some minor corrections required for the
survey. These corrections were developed following a general discussion meeting in
Edinburgh in the fall of the same year with corrected questions sent out for a second
round by the end of the year, concluding the data collection phase of the survey.
The final version of the survey (see Appendix B) holds 4 main groups of questions
preceded by a preliminary group of questions providing general information on the
developer of the accessibility instrument (such as, name, e-mail and institution) as well
as the name of the accessibility instrument. The remaining questions are divided into
four groups:
Planning Context. 1.
Planning Goals. 2.
Characteristics of the Instrument. 3.
End-users and how they use the tool. 4.
The first group of questions aimed to identify a number of baseline issues for the
development of the accessibility instrument, namely, if there are political requirements
for accessibility planning in the country/region of origin/activity of the developer, as well
as, information on the geographical scale, the status of development of the instrument
and the type of planning process for which the instrument is intended.
The second group of questions aimed to identify the main planning goals considered in
the development of the instrument, or in other words, the planning goals the
instruments are able to consider or provide an answer to. Within this group of
questions, planning goals were divided into public stakeholder goals, private investor
goals and personal/individual goals.
The third group of questions aimed to summarize the main operational characteristics
of the accessibility instruments surveyed, including accessibility measures type
(identifying if the measure follows traditional contour measures, gravity measures, utility
Page 233
Chapter 4. Accessibility Instruments Survey 209
measures, etc.) and the components considered (from the 4 main components of
Transport, Land use, Temporal and Individual components), the level of disaggregation
with regard to spatial, socio-economic and temporal data and analysis, and the
transport modes and opportunities considered. This group also includes questions
evaluating the developer’s perception on the ability of the instrument to replicate reality
and on the speed of the tool.
Finally, the last group of questions aimed to evaluate the developer’s perception on the
usefulness of the accessibility instrument in planning practice and to understand the
relationship with the potential end users. With regard to the developer’s perception of
usefulness, respondents are asked to rate how easy it is to use the instrument, the
knowledge and skills required to use the instrument, the ability to provide
understanding on the quality and experience of travel and the success of the instrument
in its intended role in urban planning. Additional questions include issues on potential
users, the role in connecting service users and accessibility providers and the role in
urban planning. This group ends with questions on the main issues blocking
implementation of the accessibility instrument.
With the exclusion of the rating questions, most questions allowed multiple responses.
The large majority of questions allowed an answer of “Not applicable” or “Don’t know
yet” (in this case only for instruments marked as “in development” in question 1.3
identifying the status of development of the instrument).
4.3 Accessibility Instruments in TU1002
4.3.1. Coverage of Accessibility Instruments
The aim of this section is to present an overview of accessibility instruments and to
show the coverage of the tools reviewed by this research, identifying which types and
which application are represented or are absent and to provide a tool for urban and
transport planning practitioners for choosing what they may need. In other words, this
paragraph illustrates a “coverage analysis”, showing how many instruments of each
type have been proposed in the COST Action, through a clear and quick synopsis of the
main characteristics of the different instruments.
The coverage analysis of accessibility tools has been developed starting from the point
of view of the potential user and the instruments have been categorized starting from
five basic questions planning practitioners may have when they have to choose the
instrument that best fits their requirements: For each planning question a category and
several classes have been defined as summarized in the following table.
Page 234
210 Accessibility Instruments for Planning Practice
Table 4.1 Categories of how the Accessibility Instruments inform planning goals
Practitioners’ planning question Category Class
What is the geographical scale?
(question 1.1 of the survey)
Geographical scale Supra-national
National
Supra-municipal
Municipal
Neighbourhood
Street
What is the planning goal?
(question 2.1 of the survey)
Planning goal How to decide on the loc
ation of residences
/activities / services?
How to manage, encoura
ge or reduce the use of a
particular transport
mode(s)?
How to stimulate
economic development?
How to ensure economic
equity?
How to ensure social
equity and/or cohesion?
How to ensure reductions
of emission/energy use?
What kind of support are you
looking for? (question 3.1 of
the survey)
Decision support task Passive decision support
tool
Active decision support
tool
Cooperative decision sup
port tool
Used in the ex-post evalu
ation of the decision
impact
What will you need support on?
(question 4.7 of the survey)
Role in urban planning to create new insights
to justify decisions/ positi
ons already taken
to support strategy/ optio
n generation
to support strategy/ optio
Page 235
Chapter 4. Accessibility Instruments Survey 211
Practitioners’ planning question Category Class
n selection
What are the transport modes
you want to consider? (question
3.8 of the survey)
Transport mode Any mode
Walking
Bicycle
Public Transport
Car
Truck
What are the trip purposes you
want to consider? (question 3.9
of the survey)
Trip purpose No purpose / not applica
ble
All purposes (aggregate
measure)
Work
Leisure
Healthcare
Shopping
In order to show the coverage of the accessibility instrument, the following tables (from
Table 4.2 to Table 4.7) demonstrate how the tools presented in this research can be
used and in which circumstances, according to the different services provided by the
instruments. From the coverage analysis some clusters of accessibility instruments
were defined according to the categories used.
The accessibility instruments presented in this research cover all the geographic scales
from the supra-national scale to the street level, but only IMaFa and RIN can be used at
the supranational scale; IMaFa, GDATI, TRACE and RIN can be applied at the national
scale. Only IMaFa, PlaSynt, ASAMeD and MoSC consider the street level. Almost all of
the instruments have been developed for the use at the supra-municipal scale and
around 3/4 for the municipal scale. On the other hand, the instruments for applications
at the macro or micro scale are less numerous. Most of the instruments, as showed in
Table 4.2, can be used also for applications at two or more geographic scales.
Page 236
212 Accessibility Instruments for Planning Practice
Table 4.2 Coverage of each Accessibility Instrument according to the geographical scale
Accessibility instrument Geographic scale
Acronym
Co
un
try
su
pra
_n
ati
on
al
na
tio
na
l
su
pra
-mu
nic
ipa
l
mu
nic
ipa
l
ne
igh
bo
urh
oo
d
str
ee
t
IMafA ES
RIN DE
TRACE BE
PlaSynt SE
MoSC USA
GDATI PL
SAL PT
InViTo IT
EMM DE
SNAMUTS AU
SOTO NO
ABICA DK
UrbCA PT
HIMMELI FI
GraBAM IT
JAD NL
SNAPTA UK
ATI SL
SoSINeTi SW
ASAMeD UK
PST SE
MaReSi SC NO
multi scale
under
municipal
municipal
and/ or
supramunicipal
Page 237
Chapter 4. Accessibility Instruments Survey 213
Table 4.3 Coverage of the Accessibility Instruments according to the planning goals
Accessibility Instruments Public Sector Planning goal
Acronym
Co
un
try
Ho
w t
o d
ecid
e o
n t
he
lo
ca
tio
n o
f re
sid
en
ce
s
/a
cti
vit
ies /
se
rvic
es?
Ho
w t
o m
an
age
, e
nco
ura
ge
or
red
uce
th
e
use
of
a p
art
icu
lar
tra
nsp
ort
mo
de
(s)?
Ho
w t
o e
nsu
re e
co
no
mic
eq
uit
y?
Ho
w t
o e
nsu
re s
ocia
l e
qu
ity
an
d/o
r
co
he
sio
n?
Ho
w t
o s
tim
ula
te e
co
no
mic
de
ve
lop
me
nt?
Ho
w t
o e
nsu
re r
ed
ucti
on
s o
f
em
issio
n/e
ne
rgy
use
?
Oth
er
SNAMUTS AU
ATI SL
ABICA DK
EMM DE
PST SW
PlaSynt SW
IMaFa ES
SoSINeTi SW
ASAMeD GR
SNAPTA UK
HIMMELI FI
TRACE BE
SOTO NO
INVITO IT
MSC USA
UrbCA PT, ES
GDATI PL
MaReSi SC NO
GraBAM IT
SAL PT
multi objective
urban planning
oriented
trasport planning
oriented
Page 238
214 Accessibility Instruments for Planning Practice
According to the planning goals (see Table 4.3), nine accessibility tools proposed in this
research have a multi objective structure. The other tools are mainly aimed at deciding
on the location of residences /activities / services (urban planning oriented) or at
managing, encouraging or reducing the use of a particular transport mode (transport
planning oriented). One instrument (EMM) has the objective of stimulating economic
development. The economic and social equity goals are covered by two instruments
(SNAMUTS and ATI). None of the accessibility tools has any particular relevant aim to
reduce emissions/energy use. Several instruments have also identified other specific
objectives besides of the once available, which nevertheless could be settled within the
existing list of general objectives and concerns (focussing on particular transport, land
use, social or economic objectives).
The tools that are “transport planning oriented”, aiming to manage, encourage or
reduce the use of a particular transport mode, can be divided into different categories
according to the particular transport mode they are oriented towards. Two instruments
(SAL and ABICA) have the goal of managing all the transport modes. GraBAM has the
aim of reducing car use and encouraging public transport, while PST has the objective of
managing car, bicycle and walking modes. PlaSynt and MaReSi SC focus on car use and
SNAMUTS and GDATI have the aim of managing public transport modes (see Table 4.4).
Table 4.4 Coverage of the Accessibility Instruments according to the planning goals –
transport modes
Accessibility Instruments
Public Planning goal – transport modes
(How to manage, encourage or reduce the use
of a particular transport mode(s)?)
Acronym
Co
un
try
Ca
r
Pu
blic
Tra
nsp
ort
Bic
ycle
Wa
lkin
g
SAL PT
ABICA DK
GraBAM IT
PlaSynt SW
PST SW
MaReSi SC NO
SNAMUTS AU
GDATI PO
Page 239
Chapter 4. Accessibility Instruments Survey 215
As regards the decision support task, the accessibility tools can be categorized
according to their mission in the planning process: a passive decision support tool (aids
the process of decision making, but cannot bring out explicit decision suggestions or
solutions), an active decision support tool (can bring out such decision suggestions or
solutions), a cooperative decision support tool (allows the decision maker or advisor to
modify, complete, or refine the decision suggestions provided by the system, before
sending them back to the system for validation) or a tool used in the ex-post evaluation
of the decision impact.
The accessibility instruments cover all the different decision support tasks, with a
significant (nearly half of the instruments) prevalence of strategic planning support tools
(see Table 4.5). We can find two passive decision support tools; three active decision
support tools; four cooperative decision support tools; three can be used in the ex-post
evaluation of the decision impact. Finally, one instrument is used in many different
parts of the planning, appraisal and project delivery process.
Page 240
216 Accessibility Instruments for Planning Practice
Table 4.5 Coverage of the Accessibility Instruments according to the decision support
task
Accessibility Instruments Decision support task
Acronym
Co
un
try
Pa
ssiv
e d
ecis
ion
su
pp
ort
to
ol
Acti
ve
de
cis
ion
su
pp
ort
to
ol
Co
op
era
tive
de
cis
ion
su
pp
ort
too
l
Use
d in
th
e e
x-p
ost
eva
lua
tio
n
of
the
de
cis
ion
im
pa
ct
Str
ate
gic
pla
nn
ing s
up
po
rt
too
l
Oth
er
PST SW
SAL PT
MaReSi SC NO
GraBAM IT
RIN DE
GDATI PO
TRACE BE
MSC USA
UrbCA PT, ES
SNAPTA UK
ASAMeD UK;NL;SE;BRA;CH;SA;JA
SoSINeTi SW
PlaSynt SE
EMM DE
HIMMELI FI
SNAMUTS AU
SOTO NO
IMaFa ES
ATI SL
JAD NL
INVITO IT
ABICA DK
ACCALC UK;EC;Global
ADSS
CDSS
Ex post
evaluation
Strategic
planning DSS
DSS
PDSS
Page 241
Chapter 4. Accessibility Instruments Survey 217
Table 4.6 Coverage of the Accessibility Instruments according to the instrument’s role in
urban planning
Accessibility Instruments Role in urban planning
Acronym
Co
un
try
To
cre
ate
ne
w in
sig
hts
To
ju
sti
fy d
ecis
ion
s/ p
osit
ion
s
alr
ea
dy
tak
en
To
su
pp
ort
str
ate
gy/
op
tio
n
ge
ne
rati
on
To
su
pp
ort
str
ate
gy/
op
tio
n
se
lecti
on
To
su
pp
ort
in
tegra
tio
n o
f u
rba
n
pla
nn
ing p
ers
pe
cti
ve
s
Oth
er
PST SW
CAM PT, ES
PlaSynt SW
EMM DE
SNAMUTS AU
ASAMeD UK;NL;SE;BRA;CHI;SA;JA
SAL PT
INVITO IT
IMaFa ES
TRACE BE
RIN DE
–SOTO NO
JAD NL
ABICA DN
HIMMELI FI
GDATI PL
GraBAM IT
SNAPTA UK
ATI SL
MaReSi SC NO
GDATI PO
MoSC USA
SoSINeTI SW
ACCALC UK /EC/ Global
multi role
specific role
Page 242
218 Accessibility Instruments for Planning Practice
The accessibility instruments have different (intended) roles in the urban planning
process: they can be used to create new insights, to justify decisions/ positions already
taken, to support strategy/ option generation, to support strategy/ option selection, to
support integration of urban planning perspectives. According to this categorization, two
tools (PST and UrbCA) have all the above mentioned functions.
PlaSynt, EMM, SNAMUTS, ASAMeD, SAL and InViTo can be used to create new insights,
strategy/ option generation, strategy/ option selection and integration of urban planning
perspectives. SOTO, JAD and ABICA have the function of creating new insights and of
supporting strategy / option generation.
In general, it is fair to say that around half of the accessibility instruments have a multi-
role in urban planning, focussing most of the different urban planning roles for which
planning support systems generally developed. The other half has more specific roles,
concentrating on one of two of these roles at a time. Within these instruments, the roles
of creating new insight, supporting strategy/ option generation and to supporting
integration of urban planning perspectives are most frequently found.
Page 243
Chapter 4. Accessibility Instruments Survey 219
Table 4.7 Coverage of the Accessibility Instruments according to the transport modes
used in the instrument
Accessibility Instruments Transport modes used in the instruments
Acronym Country
An
y m
od
e
Ca
r
Pu
blic T
ran
sp
ort
Wa
lkin
g
Bic
ycle
Oth
er
No
t a
pp
lica
ble
PST SW
MaReSi SC NO
ACCALC UK /EC/ Global
EMM DE
SAL PT
RIN DE
JAD NL
ABICA DK
HIMMELI FI
UrbCA PT, ES
INVITO IT
GraBAM IT
IMaFa ES
SNAPTA UK
SNAMUTS AU
GDATI PO
SOTO NO
SoSINeTi SW
PlaSynt SW
ASAMeD UK;NL;SE;BRA;CHI;SA;JA
MoSC USA
TRACE BE
Multi modal
Car
Car + sm
Sustainable
mobility
Page 244
220 Accessibility Instruments for Planning Practice
Accessibility instruments use different transport modes and in most cases combinations
of them. All main transport modes are covered by the accessibility instruments
researched in this Action, although analysis on accessibility by public transport, have
more instruments to choose from. Instruments, such as, PST, MaReSi SC and ACCALC
can use any mode, while EMM, SAL and RIN consider accessibility by the major
transport mode groups (car, public transport, bicycle and walking). Most instruments
consider more than one transport mode. Instruments dedicated exclusively to one
particular transport mode can be found for car accessibility (HIMMELI and UrbCA) and
for public transport (SNPTA, SNAMUTS, GDATI, SOTO and SoSINeTi).
According to the trip purposes/ opportunities used in the instruments, the majority of
the instruments make use of all purposes (work, leisure, healthcare, shopping,
education). Some of these use aggregate measure and thus are unable to specify the
accessibility to particular activities while others may consider accessibility to any
particular activity type. From the remaining instruments some focus on work and
shopping activities can be inferred.
Page 245
Chapter 4. Accessibility Instruments Survey 221
Table 4.8 Coverage of the Accessibility Instruments according to the trip purpose
Accessibility Instruments Trip purposes / opportunities used in the instrument
Acronym Country
An
y p
urp
ose
(d
isa
ggre
ga
te)
or
All
pu
rpo
se
s (
aggre
ga
te m
ea
su
re)
Wo
rk
Le
isu
re
He
alt
hca
re
Sh
op
pin
g
Ed
uca
tio
n
Oth
er
SNAPTA UK
PST SW
PlaSynt SW
SNAMUTS AU
SOTO NO
SAL PT
MoSC USA
RIN DE
UrbCA PT, ES
EMM DE
IMaFa ES
ABICA DK
GraBAM IT
HIMMELI FI
TRACE BE
MaReSi SC NO
JAD NL
ACCALC UK /EC/ Global
Multi purpose
Systematic trips
Shopping
Page 246
222 Accessibility Instruments for Planning Practice
All the characteristics of each instrument have been summarized in Appendix 2 in order
to clearly show the characteristics and coverage of each instrument presented in the
research and their specific differences.
4.3.2. Planning Context and Usability of Accessibility Instruments
This section covers what the survey has told us about the planning context in which the
accessibility instruments are designed to be used, the planning goals the instruments
can address, the characteristics of the instruments, and developers’ perceptions of how
useful their instruments are for end users.
Planning Context
In three of the countries sampled (UK, Norway and Germany) there is a policy
requirement to assess accessibility in urban planning and/ or transport planning (See
Figure 4.1). Whilst in Sweden, Belgium, Spain, Greece and Denmark it is advised to use
an accessibility instrument in either urban planning or transportation planning.
Undertaking an accessibility assessment does not appear to be a requirement, at least
in the context of Finland, Australia, Poland, Italy, Portugal, Slovenia, and the
Netherlands.
Figure 4.1 Policy requirements to undertake an accessibility analysis
Twelve of the instruments have been already used in either urban/ transport or health
service planning. Five of these tools are also used in research by the tool developer.
The remaining instruments are research tools which have either been developed or are
in the process of development.
3
8
10
2
There are legal
requirements to use
an accessibility
assessment
It is advised to use
an accessibility
assessment
It is neither required
nor advised
Other
0
2
4
6
8
10
12
Page 247
Chapter 4. Accessibility Instruments Survey 223
All the instruments are designed to be used by spatial or urban planners. In four cases
these users were the only ones perceived to be potential users. Eighteen (78%) are also
relevant for transport planners. Just over half (52%) of tool initiators also feel that their
instruments would be appropriate for other tool initiators/ developers or researchers to
use too.
Twelve tool initiators thought a range of other users would be interested in their
instrument besides urban and transport planners. Of the 3 retail location instruments,
two mention retailers and two mention politicians. Politicians are mentioned by 6 other
tool initiators in combination with citizens/ citizens and retailers/ and health, education,
and retailers. 3 other tool initiators anticipate that either health and education, or
health, education, retailers and citizens could be potential users.
Planning Goals
Thirteen of the instruments only address one of the public stakeholder planning goals
as shown in
Table 4.3 above. 7 instruments address multiple goals (See Table 4.9), and in 4 cases
no answer was given.
Page 248
224 Accessibility Instruments for Planning Practice
Table 4.9 Instruments that address multiple public stakeholder goals
Instrument Public Stakeholder Goals Addressed
PST How to manage, encourage or reduce the use of a particular
transport mode(s)
Traffic and urban planning in municipalities
PlaSynt How to manage, encourage or reduce the use of a particular
transport mode(s)
The impact of planning/ development proposals on travel habits
such as route choice and mode choice, the retail potential and the
potential for public space to be used
EMM How to decide on the location of residences/ activities/ services
How to stimulate economic development
How to ensure reductions of emissions/ energy use
SNAMUTS How to decide on the location of residences/ activities/ services
How to manage, encourage or reduce the use of a particular
transport mode(s)
How to ensure social equity and/ or cohesion
How to ensure economic equity
How to secure speed/ cost efficiency/ potential of a particular
transport mode. How to manage urban growth/ transformation/
revitalization. How to enhance stakeholders’ understanding of the
link between land use and transport planning, and best practice in
public transport network and service design.
ASAMeD How to decide on the location of residences/ activities/ services
How to improve cycling and pedestrian access; how to revitalize
central areas; how to achieve social sustainability or cohesive
communities; how to ensure access to basic services (health,
education, welfare, food, shopping); how to increase the quality
and experience of travel; how to create a low energy built
environment.
ATI How to decide on the location of residences/ activities/ services;
How to ensure economic equity;
How to ensure social equity and/ or cohesion.
ABICA How to decide on the location of residences/ activities/ services
How to manage, encourage or reduce the use of a particular
transport mode(s)
PST, PlaSynt and SNAMUTS are research tools that are already used by urban or
transport planners; EMM and ASAMeD are accessibility instruments used by
researchers; and ATI and ABICA are instruments “in development”.
Page 249
Chapter 4. Accessibility Instruments Survey 225
Figure 4.2 Private investor concerns addressed by the instruments
Figure 4.2 shows that nearly two-thirds (61%) of the instruments address private
investors’ concerns of where to locate their business. Thirteen of the instruments focus
only on this and/or the issue of where to invest in real estate. JAD specifically addresses
the private investors’ goal of how to create places with high land values through
transport investment.
PST and ASAMeD also address the public stakeholder concern of developing efficient
transport services.
EMM, SNAMUTS, GDATI, and InVio provide information to private transport operators on
where and how to develop public transport services. Except for GDATI, these
instruments also address the issues of where to locate a business and/ or invest in real
estate.
PlaSynt and MaReSi SC specifically focus on private sector retailers and public sector
goals of managing transport. PlaSynt aims to identify the local market catchment area
for retail and MaReSi SC answers the question of how large a shopping centre do we
need in this location?
Figure 4.3 shows that 43% of instruments address the key issue for individuals of
choosing where to live. Eight of the 10 instruments focus on this individual goal only;
EMM also aims to support decisions on where to find the nearest activity, and MaReSi
SC also supports decisions on where to find the nearest activity and choosing the best
route to that activity.
SNAMUTS and ASAMeD address both how to choose the best route to a particular
activity and how to choose the nearest activity. The latter specifically has the aim of
“Choosing a neighbourhood/ housing area with a good choice of services available
(health, education, etc), the quickest route to work, and how to get to the nearest
opportunity”. TRACE assesses how to choose the nearest retail activity.
14
7
4
0 0
4
1 2
02468
10121416
Wh
ere
to
lo
ca
te b
usin
ess
(fo
r co
mm
erc
e,
se
rvic
e
an
d o
the
r co
mp
an
ies)
Wh
ere
to
in
ve
st
in r
ea
l
esta
te (
for
rea
l e
sta
te
ow
ne
rs a
nd
tra
de
rs)
Wh
ere
an
d h
ow
to
de
ve
lop
pu
blic t
ran
sp
ort
se
rvic
es (
pri
va
te
op
era
tors
)
Wh
ere
an
d h
ow
to
de
ve
lop
fre
igh
t su
pp
ly
ch
ain
s (
fre
igh
t o
pe
rato
rs)
En
ha
ncin
g p
atr
on
age
leve
ls t
hro
ugh
in
form
ati
on
an
d m
ark
eti
ng –
acce
ss
to in
form
ati
on
Oth
er
No
t a
pp
lica
ble
Do
n’t
kn
ow
ye
t
Page 250
226 Accessibility Instruments for Planning Practice
Four instruments are able to help in the choice of the best route to a particular activity.
SNAMUTS focuses on only district centres within the metropolitan area where there are
spatial concentrations of two or more activities (employment, education, leisure, retail
or health facilities). SNAPTA focuses on how to choose the best route to a destination by
public transport and covers the activities of employment, education, leisure and health
facilities. The two other instruments that enable choosing the best route to a particular
activity are MaReSi SC and ASAMeD.
Figure 4.3 Individual goals addressed by the instruments
Accessibility Instrument Characteristics
Several questions sought information on the specific characteristics or the components
of accessibility which the instruments focussed on. The transport modes and the trip
purposes analysed have already been addressed in tables Table 4.7 and Table 4.8
above. This section focuses on the accessibility components, the accessibility measure
traditions the instrument is attached to, how well instrument developers perceive their
instrument represents reality, and what the perceived user experience is.
Only 3 instruments (13%) take into account all the accessibility components of land use,
transport, temporal and individual characteristics as shown in Figure 4.4. These are
PlaSynt, ATI, and RIN. The remaining instruments (87%) take into account some of the
components.
10
4
1
5
0 1
5
0
2
4
6
8
10
12
Ch
oo
sin
g h
ou
se
ho
ld
loca
tio
n
Ch
oo
sin
g t
he
be
st
rou
te
to (
a)
pa
rtic
ula
r
acti
vit
y(ie
s)
Ch
oo
sin
g t
he
be
st
mo
de
(s)
for
(a)
pa
rtic
ula
r
rou
te(s
)
Ch
oo
sin
g t
he
ne
are
st
acti
vit
y(ie
s)
No
t a
pp
lica
ble
Do
n't k
no
w y
et
Oth
er
(sp
ecif
y)
Page 251
Chapter 4. Accessibility Instruments Survey 227
Figure 4.4 Accessibility components addressed by the instruments
There are four main accessibility measures that the instruments rely on. These are
gravity-based measures, network measures, spatial separation measures and contour
measures (See Figure 4.5). Ten instruments are attached to only one of these
traditions; the other instruments use combinations of accessibility measures in their
analysis. Table 4.9 shows a grouping of the instruments around the accessibility
measure traditions.
Figure 4.5 Accessibility measures used in the instruments
15 15
7 8
1 1
0
2
4
6
8
10
12
14
16
La
nd
-use
Tra
nsp
ort
ati
on
Te
mp
ora
l
Ind
ivid
ua
l
No
t a
pp
lica
ble
Do
n't k
no
w y
et
8 8
9
1
6
2
9
0
2
0 0 0 0
1
2
3
4
5
6
7
8
9
10
Sp
ati
al se
pa
rati
on
me
asu
res (
1)
Co
nto
ur
me
asu
res (
2)
Gra
vit
y m
ea
su
res (
3)
Co
mp
eti
tio
n m
ea
su
res (
4)
Tim
e-s
pa
ce
me
asu
res (
5)
Uti
lity
me
asu
res (6
)
Ne
two
rk m
ea
su
res (
7)
info
rma
tio
n a
cce
ssib
ilit
y m
ea
su
res
(use
‘o
the
r’ f
ield
s in
fo
llow
ing
qu
esti
on
s t
o d
escri
be
)
Oth
er
Oth
er
(sp
ecif
ic)
No
t a
pp
lica
ble
Do
n’t
kn
ow
ye
t
Page 252
228 Accessibility Instruments for Planning Practice
Table 4.10 Accessibility measures used in the instruments
Accessibility Instruments Accessibility measure traditions
Acro
nym
Co
un
try
Sp
ati
al
se
pa
rati
on
Co
nto
ur
Gra
vit
y
Ne
two
rk
Tim
e-s
pa
ce
Info
rma
tio
n
Uti
lity
Co
mp
eti
tio
n
Oth
er
SNAPTA UK
SNAMUTS AU
TRACE BE
IMaFa ES
ASAMeD UK;NL;SE;BRA;CHI;SA;JA
ATI SL
SOTO NO
SAL PT
MSC USA
GDATI PO
PST SW
PlaSynt SW
RIN DE
MRSC NO
EMM DE
HIMMELI FI
JAD NL
ABICA DK
GraBAM IT
UrbCA PT, ES
INVITO IT
SoSINeTi SW
ACCALC UK /EC/ Global
Few of the instruments have been designed to evaluate the quality and experience of
travel. Tool developers were asked to rate their instruments on this attribute on a scale
of 1-7, with 7 being the highest rating The mean and median scores in Table 4.11 show
that the sample accessibility instruments are relatively weak in their ability to
demonstrate understanding of the quality and experience of travel.
Spatial separation/ contour
measures
Gravity-based measures
Network
measures
Page 253
Chapter 4. Accessibility Instruments Survey 229
Table 4.11 Developer’s perception on a number of issues influencing usability of
Accessibility Instruments
Theme Question Min. Max Mean Median
Usability of tool in
understanding the quality
and experience of travel
Social evaluation 1 7 4 4.5
Environmental
evaluation
1 7 3.9 4
Safety and security
evaluation
1 7 2.5 2
Physical skills
evaluation
1 6 2.4 1
Quality, accuracy and
speed of the instrument
Quality of data 3 7 5.6 6
Quality of calculations 3 7 5.6 5
Accuracy of the model 3 7 5.2 5
Speed of the tool 1 7 3.9 4
Knowledge and Skill
levels required by
practitioners
Modelling and
computational skills
1 7 4.5 4
Spatial awareness skills 2 7 4.6 5
Understanding policy
context
1 6 3.7 4
Tool Initiators Evaluation
of the Ease of Using
Accessibility Instruments
Ease of collecting data 2 7 4.2 4
Ease to play 1 7 3.8 3
Transparency 3 7 5.4 5
Flexibility 3 7 5.4 6
Understandable output 4 7 5.3 5
Visual representation 2 7 5.5 6
Page 254
230 Accessibility Instruments for Planning Practice
A number of questions explored how ‘easy to use’ the instruments would be for
practitioners, Table 4.11 above shows the four categories of questions with each
question rated by tool developers on a scale of 1-7, with 7 being the highest rating.. The
first category focused on the quality and experience of travel. The table shows that the
mean and median scores are the lowest ratings given overall for this suite of questions,
with tool developers being more confident that their instrument would be able to
provide evaluation of the social aspects of accessibility.
Tool developers were asked to rate the quality of the data and the calculations as well
as the accuracy of the model and the speed of the instrument’s calculations. Tool
developers gave slightly higher ratings for the quality of data and the quality of
calculations than the accuracy and the speed of the instrument. The best performing
instruments on these representations of reality were both gravity-based accessibility
measures.
Tool developers rated the prior knowledge and skills required from practitioners to be
able to use their instrument. Modelling and computational, and spatial awareness, skills
were seen as more necessary than knowledge and understanding of the policy context
The visual representation of accessibility instruments for end users and the flexibility of
the instrument in terms of the ease of changing parameters and variables are both
highly rated in this sample. In both cases the median score shows that the distribution
is influenced by a few low scoring instruments. Tool initiators also consider their
instruments have a high level of transparency in terms of the main causal assumptions
and that the output is understandable. Problems arise more from the ease of playing
with the instrument and the ease of collecting the necessary data, both of which have
lower ratings.
Two of the instruments described as ‘in use’ by practitioners received higher scores on
the usability of instruments, as did many of the instruments classified as ‘in
development’. This suggests that engagement with practitioners does lead to positive
refinement of the instruments and also that the more recent tool developers are
starting to address the usability of their instruments.
Institutional barriers to using Accessibility Instruments
This last section looks at some of the known barriers to using accessibility instruments.
Tool developers identified a number of institutional issues that block the effective use of
accessibility instruments in their country. Data availability is the most problematic issue
identified, followed by separate institutions for urban and transport planning and formal
government processes. The different objectives of organisations and the political
commitment to implement accessibility instruments are also seen as problematic.
Page 255
Chapter 4. Accessibility Instruments Survey 231
Table 4.12 Barriers to the use of Accessibility Instruments
Barrier No. of
responses % of sample
Separate urban and transport planning institutions 9 39%
Formal processes 7 30%
Financial arrangements 2 9%
Data availability 11 48%
Different planning objectives and/ or assumptions 6 26%
Staff technical skills 4 17%
Political commitment 6 26%
Other 5 22%
Four respondents were not aware of any institutional issues that might create a barrier
to the use of accessibility instruments. Two respondents mentioned only barriers which
were not included in the question. Seven respondents identified three or more barriers.
Several respondents identified additional barriers.
Table 4.13 Institutional and other issues that might block the effective use of
accessibility instruments
Instrument Barriers
SNAPTA Resources including time available to planning agencies to engage in
such deliberation;
Sometimes - timely and consistent data availability
TRACE Data availability, tool in development
SAL The instrument considers several activities (any you want but this does
not mean it does so in an aggregate manner)
MaReSi
SC
Black-boxing and competing analyses (non-transparent, non-
understandable, incomprehensible assumption etc) from the initiators'
consultants
ACCALC Most money in transport planning is linked to the delivery of a project not
to the analysis of problems for users so there will always be relatively
more analysis to make the case for than to understand the accessibility
needs of people
IMaFa Not easy to elaborate and high cost instrument
SoSiNeTi Long term data, post evaluation data
Page 256
232 Accessibility Instruments for Planning Practice
4.3.3. Cross-analysis
In this cross-analysis questions from three survey sections – Planning Context (Q 1.1-
1.4), Planning Goals (Q 2.1-2.3), and Characteristics of the Instrument (Q 3.1-3.12) –
were tested against evaluative answers of End-users and how they use the tool (Q 4.1-
4.9).
It was clear from the very beginning, that the survey composed as the first stage of the
Action will contain inconsistencies in terminology and it became clear in the analysis of
the survey that the respondents from different backgrounds bring natural uncertainties,
fluctuation and mismatch to their answers. Therefore at this stage it is not feasible to try
a comprehensive cross analysis, but instead to seek to find some preliminary main
characteristics of the instruments.
A systematic check was made for clusters of answers in each question according to the
most obviously recognised components and mapped against Qs 4.2, 4.4 and 4.5. For
each class the mean values of the answers have been calculated and histogram have
been defined, in order to understand if any relation exists between the Accessibility
Instruments and the usage potential of the tool. For most of the analyses no significant
relations have been found.
Figure 4.6 Cross-analysis of selected questions
Typical histograms of cross analyses in Figure 4.6 above show the variation in answers
that make further explanation using cluster analysis difficult. So far the best candidate
for providing a common explanatory factor for the end-use characteristics was found
from the group of questions concerning the aggregation/disaggregation level of data
(Q3.4-3.6).
0
1
2
3
4
5
6
7
8
Formal Planning
Process
Both/Other/Not
Applicable/Don't Know
Yet
0
1
2
3
4
5
6
7
8
None/Aggregate
Measure
Dissaggregate
measure
Page 257
Chapter 4. Accessibility Instruments Survey 233
Some tentative results can be seen through a single analysis. Questions in section 3.4
required respondents to identify the level(s) of spatial aggregation in their instrument.
Detailed sub questions were divided in four and included aggregation by area units
(administrative unit level), local level spatial enclaves (plot level), networks (street
segment level) and social grouping (individual group level). Of these the last three
contain a description of disaggregated spatial entities in models, which might give a hint
of the complexity of the operation procedure. This was used as a clustering principle
that is easily recognized. Five instruments 13 are based solely on aggregated data and
four instruments 14 use only a single type of disaggregated data. The remaining twelve
instruments 15 were ones containing multiple disaggregate data sources.
13 SoSINeTi, ABICA, GraBAM, SOTO, SNAMUTS
14 MoSC, ATI, IMaFa, SNAPTA
15 UrbCA, RIN, IN.VI.TO, JAD, SAL, ASAMeD, MaReSi SC, TRACE, GDATI, HIMMELI, PST; PlaSynt
Page 258
234 Accessibility Instruments for Planning Practice
Table 4.14 Grouping by spatial aggregation and the difference between three
instrument groups
3.4 Identify the
level(s) of
spatial
aggregation of
data used in
the
instrument.
. E
ase
of
co
lle
cti
ng d
ata
ea
se
to
pla
y w
ith
in
str
um
en
t
tra
nsp
are
ncy
of
ma
in c
au
sa
l a
ssu
mp
tio
ns
fle
xib
ilit
y o
f in
str
um
en
t (e
ase
of
ch
an
gin
g
pa
ram
ete
rs a
nd
va
ria
ble
s)
un
de
rsta
nd
ab
le o
utp
ut
vis
ua
lly
rep
rese
nta
tio
n
Ple
ase
ra
te t
he
kn
ow
led
ge
an
d s
kills
req
uir
ed
to
use
th
e t
oo
l in
te
rms o
f:
mo
de
llin
gco
mp
uta
tio
na
l sk
ills
sp
ati
al a
wa
ren
ess s
kills
un
de
rsta
nd
ing p
olicy
co
nte
xt
usa
bilit
y in
en
vir
on
me
nta
l e
va
lua
tio
n
usa
bilit
y in
sa
fety
an
d s
ecu
rity
eva
lua
tio
n
usa
bilit
y fo
r p
hys
ica
l sk
ills
eva
lua
tio
n
Q 4.2 Q 4.4 Q 4.5
A B C D E F A B C B C D
Only aggregate
data (N=6);
MEAN
2,3
33
2,3
33
3,6
67
3,8
33
3,6
67
2,8
33
3,0
00
2,6
67
1,5
00
1,5
00
0,8
33
1,0
00
One
disaggregate
source (N=4);
MEAN
4,7
50
2,7
50
5,5
00
5,5
00
5,7
50
6,5
00
5,2
50
4,0
00
2,0
00
4,0
00
3,5
00
2,7
50
Multiple
disaggregate
data source
(N=12); MEAN
4,3
08
4,1
54
5,3
08
5,3
08
5,1
54
5,5
38
4,2
31
4,9
23
4,3
08
4,0
77
2,1
54
2,1
54
Difference:
row1 | row2
-
2,4
17
-
0,4
17
-
1,8
33
-
1,6
67
-
2,0
83
-
3,6
67
-
2,2
50
-
1,3
33
-
0,5
00
-
2,5
00
-
2,6
67
-
1,7
50
Difference:
row1 | row3
-
1,9
74
-
1,8
21
-
1,6
41
-
1,4
74
-
1,4
87
-
2,7
05
-
1,2
31
-
2,2
56
-
2,8
08
-
2,5
77
-
1,3
21
-
1,1
54
Difference:
row2 | row3
0,4
42
-
1,4
04
0,1
92
0,1
92
0,5
96
0,9
62
1,0
19
-
0,9
23
-
2,3
08
-
0,0
77
1,3
46
0,5
96
Although it is obvious that the visual representation benefits from detailed data
collection in the same way as the applicability of the instrument for social-economic
evaluation is correlated with the level of the socioeconomic disaggregation of the data,
it appears that it also has the effect of wider usage and operation of the instrument.
Even though the sample sizes are small and the objectivity of respondents can be
further debated, it is probably not too much to say that the level of
aggregation/disaggregation divides instruments into two major categories that also
have very different usage potentials.
Page 259
Chapter 4. Accessibility Instruments Survey 235
Figure 4.7 Images showing two extreme principles of accessibility instruments: zonal
aggregation vs. detailed morphology
Page 260
236 Accessibility Instruments for Planning Practice
4.4 Conclusions
This conclusion summarises the main findings of the questionnaire survey and draws
out some salient points that will be reflected on in Section 5 of this report.
We have heterogeneity evident in the accessibility instruments in this COST Action. This
may reflect the diversity of the urban planning contexts across Europe and the different
institutional contexts for urban planning such as the legal underpinnings,
responsibilities and the spatial levels at which urban planning governance takes place.
The instruments in this Action focus essentially on the needs of spatial/ urban planners
(27%) and transport planners (24%) for data on accessibility.
In particular, the instruments are intended to support the following urban planning
tasks:
The integration of urban planning perspectives (27%). 1.
Strategy/ option generation (25%). 2.
Strategy/ option selection (23%). 3.
Create new insights (16%). 4.
Justify decisions/ positions already taken (10%). 5.
Few instruments are able to understand the quality and experience of travel.
An accessibility analysis is required in 3 EU member states for some aspects of urban
and transport planning. The survey confirms that the instruments developed in these
countries tend to have a higher level of transparency of the main causal assumptions,
since they have been used by practitioner and other stakeholders. The visual
representation of the findings is also more developed in these instruments. Where there
is a legal requirement, the instruments focus more on aspects of a liveable, sustainable
community/ settlement, than the other instruments.
The survey suggests that in another four member states it is advised to undertake
accessibility assessments and in the remaining countries in this Action, it does not yet
appear to be supported. Respondents drew attention to a number of barriers to using
accessibility instruments in their country. These included data availability (mentioned by
48% of respondents), separate urban and transport planning institutions (39%), formal
processes (30%), different planning objectives/ assumptions (26%), and political
commitment (26%). Five respondents mentioned other barriers too.
Despite the diversity of instruments and their purposes, the Tables in this section have
started to cluster and categorize the instruments based on the questionnaire
responses. Clustering has been analyzed for the issues of geographic scale (Table 4.2),
public sector planning goals (
Table 4.3), decision support task (Table 4.5), role in urban planning (Table 4.6),
transport modes used in the instruments (Table 4.7), trip purposes (Table 4.8), and
accessibility measure traditions (Table 4.10).
Page 261
Chapter 4. Accessibility Instruments Survey 237
Tool developers were asked to rate how user-friendly their instruments were on a
number of dimensions. Generally higher ratings were given for the quality of the data
used, the quality of the instrument calculations, the visual representation of outputs
and the flexibility of the instrument in terms of changing parameters. Lower ratings were
generally given for the speed and accuracy of the instrument, the ease of playing with
the instrument and the ease of collecting data by end –users. However, some
instruments “in development” were given higher ratings on these aspects by their tool
developers.
Page 262
238 Accessibility Instruments for Planning Practice
Page 263
Chapter 5. CONCLUSIONS
Angela Hull, Luca Bertolini, Cecilia Silva
Page 264
240 Accessibility Instruments for Planning Practice
Page 265
Chapter 5. Conclusions 241
5.1 Introduction
This Action seeks to find out why Accessibility Instruments are not more often used in
urban planning practice and how to improve this. Accessibility Instruments have been
around since the 1960s but practitioners do not appear to have found them useful or
usable enough for addressing the tasks of sustainable urban management.
This Action has brought together the developers of 24 Accessibility Instruments to work
with land use and transport planning practitioners to explore how these instruments can
play a more supportive role in enhancing accessibility in European cities and beyond.
This report has sought to understand in detail the characteristics and specific purposes
of these instruments. Chapter 1 and Chapter 2 of this report summarize the types of
Accessibility Instruments discussed in the literature and provides an overview of how
these are used in practice. Chapter 3 presents 22 16 of the instruments brought
together for this Action in some detail covering the purpose or planning issues
addressed, the definition and measurement of accessibility, the perceived relevance for
urban planning, and the instrument’s strengths and weaknesses.
Chapter 4 provides a cross-analysis of 23 of the instruments using the findings of a
questionnaire survey completed by their developers. This sought to attempt a
systematic categorization of the instruments in terms of the planning purpose or goal
they address, the measurement of accessibility, the spatial aggregation of the data, the
perceived representation of reality and the ease of use by practitioners/end users.
This final chapter 5 draws on the concluding comments of the chapter authors to
highlight the many different ways in which accessibility is considered in transportation
research and urban planning practice, the salient features of the specific collection of
accessibility instruments discussed here, and the implications for the next stages of this
Action. The chapter first summarizes the traditions of accessibility instruments in the
urban geography and transportation literatures and then moves on to examine the
research on the practical value of these instruments in urban planning practice. It then
focuses on the potential for use in planning practice of the instruments in this Action
and highlights some of the issues which will have to be addressed by the instrument
developers to ensure their usability in the complex transport planning, land use
planning and private development decision making environment.
5.2 Traditions in planning and transport evaluation
The literature review on accessibility demonstrated that authors defined accessibility in
terms of both the components and the indicators of accessibility. These definitions tend
to encompass some of the following:
People’s preferences and choice sets, including the timing of travel;
16 Two of the instruments brought together for this COST Action only participated in the survey
detailed in Chapter 4.
Page 266
242 Accessibility Instruments for Planning Practice
Land use in terms of existing opportunities (location of housing, jobs, and
other activities); and
Transport provision, including the degree and intensity, by mode between
origins and destinations.
The review found that some accessibility instruments focus on people or origins, some
on opportunities, and some on the connection. The review suggests that instrument
developers and users have taken quite a pragmatic approach to defining the
measurement of accessibility including balancing the importance of detailed
representation of reality against the speed and ease of using the instrument. Various
proxy and aggregate measures have been used to represent people’s preferences, the
representation of origins and destinations or the spatial separation between land uses,
and for assessing the benefits of increasing the degree and intensity of transport
provision.
The population has often been regarded as homogenous with similar preferences
according to the location of their residence, possibly with some distinction in terms of
workers/ non-workers. Rarely has the characteristics of the population been
disaggregated to gender, age, physical condition, family responsibilities, and type of job.
This blindness to heterogeneity in people’s preferences and choice sets also extends to
the selective representation of the attractiveness of land uses/ facilities and the
representation of the transport system.
This selectivity in representing reality has been influenced by the instrument developers’
interests in scientific research, government policy requirements, and the available
computer power and datasets. The criteria, in many countries, for gaining access to
public sector funds for major infrastructure projects has also skewed the focus of the
instruments developed. In particular, a requirement to demonstrate time savings
benefits, as a proxy for welfare benefits, of new transport infrastructure has encouraged
the development of instruments that focus on calculating/predicting the time required
to reach desired destinations. Speed and mobility have been considered the
cornerstones of economic competitiveness and personal freedom and, therefore,
perceived as the appropriate indicators for assessing welfare benefits in the cost
benefit models used in evaluating the relative value of transport projects.
The initial focus on car travel has expanded to analysing travel times by public transport
modes often in comparison with private motorized vehicles. The rapid increase in
computing power and the availability of a wide range of electronic data sets allowed the
much more flexible use of GIS software packages to replace the complex land use
transportation models. In addition to estimating travel time savings from new
infrastructure, these packages lend themselves to road and/or public transport journey
planning .
Retail and other service planners have been using accessibility instruments to plan
service provision for their customers or residents to enable/improve access to facilities
based on an analysis of the potential customers in the local population surrounding
their proposed/actual facilities and the existing transportation system. This function of
accessibility usually incorporates some normative benchmark setting of how long the
Page 267
Chapter 5. Conclusions 243
journey should be to reach the type of facility and is displayed using contour or
catchment indicators. Some instruments focus on the public transport accessibility to
facilities and more recently instruments have been developed to analyse the walk times
to public transport services and to local facilities. These instruments have proved useful
both to the providers of public services (schools, hospitals, etc.) and commercial
facilities (retail, etc.).
The focus of these early instruments has, thus, been mainly on the accessibility
characteristics of transport networks in terms of travel speeds to certain destinations –
a narrow transport planning focus. Transport planning has provided for accessibility
through improved mobility using economic assessments of the overall costs and
benefits of public sector infrastructure investment.
This focus on mobility may help to explain the limited use of accessibility instruments by
land use practitioners since these measures and indicators are too simple and say little
about proximity to be of use in analysing the more complex interactions between land
use change, transport provision, and individual preferences.
0 concluded by identifying the gaps in the focus of accessibility instruments referred to
in the literature:
Walking and cycling modes were under-represented in the instruments as
was the representation of the different walk access speeds by the type of
area and the physical condition of population groups. This would introduce
deeper analysis of different walk/cycling access thresholds (time or
distance) to destinations taking into account the physical obstructions along
the journey;
Public transport accessibility analysis should consider mode choice by
including all public transport networks (i.e. bus, tram, rail, underground,
ferry, air, etc.) in the modelled area rather than the bus network only. The
interchange options between these public transport services should be
considered based on minimum accepted times/ number of interchanges
required and the best route (fastest, cheapest, shortest);
The temporal component of accessibility should be improved by including
real time updates due to traffic congestion, roadwork or delay and the
analysis should be widened beyond the morning rush hour peak times;
People’s preferences should be analysed more carefully to understand the
accessibility needs of different population groups (physically impaired,
passengers with luggage/ wheelchair/ pushchair). Passengers’ perceptions
of safety and security on different modes and different routes should also be
included;
Accessibility analysis should consider the quality and environment of the
journey including opportunities for shelter from weather and for rest points;
comfort of waiting areas and vehicles; attractiveness and aesthetics of
walking routes; support services when travelling (e.g. catering); and
assistance and helpfulness of public transport staff;
Accessibility analysis should give an indication of the environmental impact
of the route choice, for example emissions resulting from the journey;
Page 268
244 Accessibility Instruments for Planning Practice
Accessibility instruments need to be developed so that they are able to
identify feedback mechanisms or changes in demand and in land-use
patterns that might result from an improvement – or deterioration – in
accessibility in an area.
5.3 The Use of Accessibility Instruments in Urban
Planning Practice
0 aimed to present evidence of the usability of accessibility instruments for urban
planning tasks. In particular, it set out to find out how Accessibility Instruments have
been used to identify how to make places more liveable and identify the opportunities
available to people when planning new facilities or destinations.
The literature review in Chapter 2 focussing on the usability of Accessibility Instruments
found that simple measures of accessibility have been used in urban planning practice
to audit, monitor or set standards for planning policies, such as parking policy standards
based on accessibility criteria or public transport service delivery requirements based
on people’s accessibility needs. However, these accessibility measures were unable to
understand and quantify the complex nature of people’s preferences and choice sets
and the real barriers to individuals’ accessibility.
It is also unclear whether Accessibility Instruments currently available can support the
planning task of assessing the appropriateness of locations for residential or
commercial development through identifying whether a proposed location will result in,
on average, increasing or decreasing travel distances and times, compared to
alternative locations. Alternatively, land use planners may require Accessibility
Instruments that support policy decisions on compactness and proximity already agreed
by their political masters by demonstrating that development on the urban fringe will
result in poorer accessibility to facilities, and more time/ energy/ greenhouse gas
emissions spent in traveling to relevant destinations than one in the inner city.
Chapter 2 concludes that little research has been carried out on the practical value and
usefulness of Accessibility Instruments. Curl et al.’s (2011) research in the UK found
that accessibility measures are too complex, abstract and hard to comprehend and
interpret for non-modellers, including planners. Research with transport planning
practitioners on the usability of transport models in the UK (Hull, 2010) and in the
Netherlands (te Brömmelstroet, 2010) confirm these weaknesses and identified several
other weaknesses with existing tools. These include inadequately supporting the
generation and testing of new strategies and projects, and not providing insights into
land use and transport dynamics.
Chapter 2concludes by setting a research agenda on how to arrive at useful
accessibility measures and indicators that will cover the relevant dimensions of
planning problems. The measures need to represent urban dynamics accurately enough
whilst being understandable and interpretable for all involved stakeholders (urban,
transport, and environmental planners, commercial developers, politicians). Providing
this common language requires:
Page 269
Chapter 5. Conclusions 245
More transparency in the data aggregation methods;
Collaboration with practitioners/ end users to ensure that accessibility
measures provide enough input and stimulation;
Ensure the instruments are not skewed by the priorities of individual
interests but serve existing and emerging public welfare needs e.g. the
reduction of greenhouse gases from the transport sector;
Understanding the different planning contexts and the interaction between
the different spatial levels of planning from the household, neighbourhood
level, metropolitan area, region to the national level in order to understand
the relationship between accessibility and associated outcomes, and
therefore target interventions appropriately.
5.4 State of practice on the design of accessibility-
based planning instruments
The Accessibility Instruments collected by this COST Action represent a new tranche of
instruments which will be tested with urban planning practitioners to assess and
improve their usability. Chapter 3 of this Report presented details about each of the
instruments covering their purpose and/or the planning issues addressed, the definition
and measurement of accessibility, the perceived relevance for urban planning, and the
instrument’s strengths and weaknesses.
An extensive comparative assessment of the instruments along the different
dimensions of the individual reports is reported at the end of Chapter 3. The main
findings are summarized below.
The main motivation to develop an accessibility instrument can be roughly divided in
three categories: policy and planning support, scientific enquiry, or a combination of the
two. Within the instruments primarily motivated by a policy and planning support aim,
two further groups can be identified. A first group is primarily directed at supporting
policy development and delivery in a multi-disciplinary (both transport and land use) and
multi-stakeholder (including different levels of expertise) context. A second group rather
aims to develop tools for the assessment of land use and/or transport development
proposals and/or service provision. On the other extreme of the spectrum are
instruments that are primarily motivated by scientific enquiry, even though the potential
relevance for planning is also envisaged, as it might be expected from participants in
this COST action. A middle category is rather motivated by the wish to innovatively apply
in planning practice insights already fairly consolidated in the scientific domain.
The ease or difficulty in reaching different activities dominates among the instruments
as a conceptual definition of accessibility. What kind of activities or services are
included in measurements however, varies. The theoretical underpinnings vary from
geography to architecture. Most of the activity related instruments utilise gravity based
accessibility measures and are thus related to the modelling tradition of urban
geography. Instruments that emphasise the spatial and structural properties of urban
Page 270
246 Accessibility Instruments for Planning Practice
environments mostly refer to the ‘space syntax school’ which has its origins in
architecture and urban morphology. Instruments that are part of larger model structures
are related to different traditions of modelling theories like systems theory, complexity
theory and the theory of cellular automata. Some instruments like refer to space-time
geography or information visualisation.
With respect to operational aspects, most instruments deal with aggregated measures
of accessibility, by either considering a network distance (despite the mode) or the
different modes together. The techniques for computing accessibility, when mentioned,
vary from spatial syntax and gravity models, to activity based, social based approaches
and clustering. Part of the instruments deal with the impact of land-use changes, some
instruments deal with accessibility to shops, while few deal with the accessibility to
other facilities. In general, data needed is transportation info (maps, origin-destination
matrices, times/costs) and population data. Most of the authors mention that the info
they need is available on the web or is provided by planning/local authorities. Only a few
authors mention that data must be purchased. The time for applying the instruments
depend on the type of tool used and the size of the case study, but most of the authors
mention the duration of hours or days. Several instruments are based on GIS software,
some use data management software, and only a few authors mention that they used
(or developed) open source tools. The level of expertise need to use the instruments
also vary between instruments – most authors mention that no specific expertise is
needed for interpretation of the results, but they are divided as to whether this is the
case for use of the instrument. A high level of expertise seems needed in all cases for
preparing the data. .
There are also similarities and differences in the ways the reviewed instruments see
their role with respect to supporting planning practice: some are intended as tools to aid
calculation, some are rather repeatable analytical methods using existing and widely
available tools like GIS systems, and yet others are expert systems to help define and
answer problems.
Finally, the accessibility instruments show a variety of visualization forms. Sometimes
the output of accessibility tools can be numerical and listed in tables, matrix or
datasheets, without offering any kind of visual outcome. But the latter can be needed
for some users to make sense of accessibility which can otherwise be treated as a
‘slippery’ concept and not trusted by decision makers. Most of accessibility tools
generates a visual product, generally represented by bi-dimensional maps. Main
categories include: 2D areal aggregation(data are grouped in macro-zones and
classified on the basis of a colour scale); 2D axis-based maps (data are defined by the
road network or by lines connecting points); 2D point-based maps (data are represented
by points on 2D maps); 3D images (maps with a third, z-axis). In determining the
required visualization approach it seems necessary to first understand the intended
audience and what the planner hoped they will do when they see the visualization.
Among the accessibility tools presented in this report, the purposes of visualizations
mostly focus on data explanation to high and medium-level experts, with map-based
knowledge. All the visual outputs, both concerning policy support and scientific enquiry,
provide representations which distil complex concepts into relatively simple maps and
graphs helping planners to understand spatial dimensions of key accessibility statistics.
Page 271
Chapter 5. Conclusions 247
5.5 Accessibility Instrument Survey
Chapter 4 presented the main results of the Accessibility Instrument Survey (AIS),
collecting basic information on 23 17 of the accessibility instruments reviewed in this
work. The aim of the survey was to enable quick, objective and comparable overviews of
each of the reviewed accessibility instruments for systematic comparison purposes. The
summary sheets produced for each instrument are presented in Appendix B.
Chapter 4 discusses the survey findings in three broad areas:
The operationalization or treatment of the different components of
accessibility and the data requirements;
The planning problem or policy goal addressed, and the context within which
the instrument is being deployed, and;
The interpretability and communicability of the findings.
The 23 Accessibility Instruments are quite diverse in terms of focus on the components
of accessibility, the aggregation/ disaggregation of data, the policy goal addressed, the
transparency of the calculations, and the visual representation of findings. They focus
essentially on the needs of spatial/ urban planners (27%) and transport planners (24%)
and aim to support the following urban planning tasks:
The integration of urban planning perspectives (27%). 1.
Strategy/ option generation (25%). 2.
Strategy/ option selection (23%). 3.
Create new insights (16%). 4.
Justify decisions/ positions already taken (10%). 5.
Few instruments are able to understand the quality and experience of travel.
Since this Action concerns the usefulness of Accessibility Instruments in planning
practice tool developers were asked to rate how user-friendly their instruments were on
a number of dimensions. Generally higher ratings were given for the quality of the data
used, the quality of the instrument calculations, the visual representation of outputs
and the flexibility of the instrument in terms of changing parameters. Lower ratings were
generally given for the speed and accuracy of the instrument, the ease of interactively
playing with the instrument and the ease of collecting data by end –users. However,
some instruments “in development” were given higher ratings on these aspects by their
developers.
Several barriers to using accessibility instruments were identified by survey respondents
in their country. These included data availability (mentioned by 48% of respondents),
separate urban and transport planning institutions (39%), formal processes (30%),
different planning objectives/ assumptions (26%), and political commitment (26%).
17 One of the accessibility instruments brought together by this action did not participate in the
survey conducted for Chapter 4.
Page 272
248 Accessibility Instruments for Planning Practice
5.6 Concluding Remarks and next steps in this COST
Action
This report started off with the promise of a new approach to measuring accessibility,
moving from the widely shared expectation that the concept of accessibility could play
an integrative force to bring land use and transport planners working collaboratively in
managing urban change in a sustainable way.
The report has shown that there are new approaches in accessibility which include, for
instance, applications in the following areas:
Public transport planning;
Network design for non-motorized modes (walking, cycling);
Land-use planning / location choice;
Social inclusion and basic service provision;
Information planning;
GIS: increasing detail/ visualization;
Distributional justice/ extent of spatial (in) equity;
Travel data collection: Smartphones, etc.
The review of the state of practice of accessibility instruments and of their use in
planning practice produced by this report (Chapter 1 and Chapter 2), together with the
accessibility instruments here presented and compared (Chapter 3 and Chapter 4),
provides the baseline for the future European-wide assessment of the usability of
accessibility instruments in planning practice to be developed in the next steps of the
COST Action, also including an Australian assessment case. This assessment will bring
together local planning practitioners, the accessibility instruments reviewed here and
their developer’s, across different planning or decision making contexts aiming to
further contribute to a new approach to measuring accessibility and to bridging the
implementation gap of accessibility instruments in planning practice. It will shed further
light on the debate reviewed by Chapter 1 and Chapter 2 (as summarised in section 5.2
and 5.3) which shows somehow contradicting concerns in research focussed on the
development of accessibility instrument and in the research focussed on the
implementation of accessibility-based design support systems in planning practice.
While the gaps identified in the first research stream point towards increasing
complexity and thoroughness of accessibility instruments, the second research stream
highlights the importance of simple, usable and understandable instruments for
planning practice. This ‘rigour-relevance dilemma’ (Bertolini et al. 2005) will be further
discussed throughout the upcoming local workshops across several European and
Australian cities.
Taking a closer look at the accessibility instruments participating in this research,
diversity of background, contexts, concerns and purposes comes out as both a
challenge and an advantage.
The variety of motivations for developing the instruments seems both a challenge and
an asset for the COST Action. It is a challenge because it demands establishing a
Page 273
Chapter 5. Conclusions 249
common language and sense of direction between researchers coming from different
backgrounds and having different primary motivations. It is an asset because it gives
the Action a rich variety of expertise spanning the scientific and policy domains.
On the conceptual, theoretical and operational side, the compatibility of different
perspectives can also be a major challenge for the Action but it also provides unique
opportunities. For instance, different transport modes and opportunities are focused
upon by the authors. Furthermore, some authors focus on urban-level accessibility,
while others focus on neighboorhood-level accessibility or interregional-level
accessibility. Ways of merging modes, opportunities and scales, for instance by jointly
using more than one instrument can be explored as part of the Action.
Most authors present instruments that deal with accessibility in a static fashion, i.e.
they try to get the picture for a given scenario (in the past, present or future), but a few
authors mention that their instruments focus on measuring the impacts on time of land
use changes and impacts of infrastructure investments. The Action may explore these
different approaches, trying to understand how they can differently be used by planners
and, if they provide different answers, for which uses and which approaches can be
better.
Also differences in views of how to support planning practice can be the basis of a
‘contingency approach’ to using accessibility instruments. Where there are clear policies
defined for accessibility, then ‘calculation aid’ tools have an application since they can
be optimized to implement the policy and make calculation easier. Where accessibility
analysis contributes to another policy goal like transport or land use planning then
repeatable analytical methods can be most useful. Accessibility can be a difficult
concept so both of the above can use expert systems to guide people through the
process of data collection, analysis, policy formulation and planning.
A key strength seems the ability of the instrument to link (1) some information on
transportation networks, land uses and the urban fabric, to (2) their impact on location
and mobility behaviour and therefore (3) implications for the achievement of policy
goals ranging from economic development, to social equity and environmental
preservation. In the view of the instrument developers, accessibility, in its various forms,
is a key indicator of the performance of the built environment. This notion should be
also central in communication with intended users.
A second key strength cited by many is the straightforwardness, ease of interpretation
and communicative power of the indicators, often in map form. These last claims,
however, are not always supported by actual applications in planning practice, or by
applications going beyond a pilot study. Accordingly, several authors also cite the need
to embark in practice applications and to learn through them how usable the
instruments actually are, and how to improve usability. This provides, of course, a clear
focus for the next steps of this Action.
Requirements in terms of data availability, calculation time and technical expertise are
also often cited as limitations and areas of improvement. These limitations will now be
tested in practice producing comparable assessments and enabling a better view of
what characteristics make an accessibility instrument more or less data consuming,
Page 274
250 Accessibility Instruments for Planning Practice
time consuming or demanding on technical expertise, and this from the point of view of
planning practitioners.
Other areas of improvement mentioned concern, perhaps somewhat contradictorily with
the previous one, the need to extend the range of inputs (e.g. more transportation
modes, more qualitative urban morphology features) and outputs (e.g. more impacts),
or to increase the realism of the underlying behavioural assumptions (e.g. by including
distance decay and competitions effects, or transport-land use feedback mechanisms).
Other authors, however, point to the fact that models are by definition limited in their
realism, and that the aim should rather be to ensure that the accessibility instrument is
transparent in its assumptions and logic, and easy to use. The rigor-relevance dilemma
referred here sums up this conundrum and points to a key area of discussion and
exploration for the following phases of the Action.
The work developed so far and compiled in this report has set the scene for the
upcoming local workshops were local practitioners will now have the main role in
assessing usability of accessibility instruments in planning practice. These workshops
will be developed in different European and Australian cities to solve different planning
problems resorting to different accessibility instruments. Comparability of results is thus
a baseline issue for these workshops, and has been tackled through a common
workshop methodology developed in the COST Action (in Working Group 3). This asset
will allow comparability throughout all the variability making challenges into added
value. Transferability of workshop methodology to all local contexts and accessibility
instruments will be guaranteed through testing and joint improvement of the
methodology in two Pilot workshops. Once consolidated, the methodology will be
applied to discuss the main questions arising from the review presented here and to
raise new questions and awareness on usability of accessibility instruments in planning
practice.
The following questions provide a summary outlook into the main questions pursued in
the upcoming workshop assessment with local planning practitioners:
Do the instruments reflect planning needs in terms of their understanding of
political goals and planning issues?
Do the instruments represent transport behaviour and activity choices made
within the context of the distribution, and attractiveness, of opportunities in
specific cities?
Have the instruments balanced the need for data requirements versus the
need for comprehensiveness so that they are easy to use by end-users?
Have the instruments configured the interface with end-users so that
instrument parameters can be altered and the visualization of findings is
easy to understand?
Results produced by the local workshops are expected to provide important
contributions to the debate on the general usefulness and usability of accessibility
instruments in planning practice. One of the main outcomes of this research will be the
development of recommendations for the development of the practice of accessibility
instruments (intended for planning practice) incorporating concerns of potential users
Page 275
Chapter 5. Conclusions 251
(planning practitioners). This will require balancing the rigour-relevance dilemma
identified before. At the strategic level this Action aims to achieve increased
implementation of accessibility-based planning support tools in practice.
Page 276
252 Accessibility Instruments for Planning Practice
Page 277
GLOSSARY
Enrica Papa, Gennaro Angiello
Page 278
254 Accessibility Instruments for Planning Practice
Page 279
Glossary 255
The Glossary of the Action “Accessibility Instrument for Planning Practice” was born in
order to create a common platform where to share a common language/understanding
between all the participants of the Cost Action. All members were involved in the choice
of the terms to define and their meanings in a collaborating way. A first version of the
glossary was proposed in the first stage of the work of the Action, in order to better
explain the accessibility survey and it was published in the action website during the
first year of work. The published glossary received several comments by the action
members suggesting to add, to eliminate or to modify some terms, as detailed in the
appendix. The work here presented is a result of this first phase of work and do not
consist into a final product, but into a first step of a continuous process.
Accessibility
is a concept expressing the relationship between the activity system located in a region
and the transportation system serving it (Cascetta, 2012).
Accessibility evolution definition
“the opportunity which an individual or type of person at given location possesses to
take part in a particular activity or set of activities” Hansen (1959)
“the accessibility of a point in a system is a function of its location in space with
respect to all other points in the system” and “implies relative nearness either in the
sense of a direct linkage or a minimum expenditure of travel cost or time” Hack
(1976) and de Lannoy (1978)
“the average opportunity which the residents of the area possess to take part in a
particular activity or set of activities” Wachs and Kumagai (1972)
“the consumer surplus, or net benefit, that people achieve from using the transport
and land-use system” Leonardi (1978)
“the ease and convenience of access to spatially distributed opportunities with a
choice of travel” U.S. Department of Environment (1996)
Accessibility instrument
A tool that aims to provide explicit knowledge on accessibility to actors in the planning
domain, a tool of measure, interpretation and modelling of accessibility developed to
support planning practice (analysis, design support, evaluation, monitoring etc.).
Mostly, they consist of computer model(s) that transfers data/information about urban
systems into meaningful knowledge, by providing visualization tools such as maps or
numerical indicators.
“Accessibility Instruments can be:
Measuring attributes of places or people – e.g. planning tools to identify 1.
how to make places more liveable or ways of identifying the opportunities
available to people when planning new facilities or destinations;
Analytical methods to apply accessibility principles within planning – e.g., 2.
parking policy standards based on accessibility criteria or public transport
service delivery requirements based on people’s accessibility needs;
Page 280
256 Accessibility Instruments for Planning Practice
Models to understand dynamic effects and connectedness in transport 3.
networks, in particular the dynamics between spatial plans and transport
investments;
Indicator calculation methods where indicators are used to audit, monitor or 4.
set standards for planning policies (e.g. travel time indicators)”.
Accessibility Measure
are used to translate the concept of accessibility in quantitative indicators that take
into account both the socio-economical and the transportation systems. Each
accessibility measure has a general conception and a general formulation of its
accessibility indicator (distance measures, contour measures, potential measures,
gravity measure. inverse balancing factors, utility-based measures, etc.)
Table A classification on accessibility measure (proposed by Cascetta, 2012)
Approach
Non Behavioral approach: Behavioral approach
Type of
measure
Utility-based
measures
Random Utility models
(Trip-based measure or
Activity-based measure)
Gravity models
Opportunity-
based Isochrones
Perceived opportunity
models
Component of accessibility
Opportunity component (of accessibility) – dealing with the (qualities of the) desired
goods, services, activities and destinations (together called opportunities) as objects to
the study of accessibility.
Perceptional component (of accessibility) – dealing with the perception (by an
individual/people) of other components of accessibility; concerning individual
subjective measures of availability and attraction of opportunities.
Individual component (of accessibility) – The needs, abilities (depending on people’s
physical condition, availability of travel modes, etc.) and opportunities (depending on
people’s income, travel budget, educational level, etc.) of individuals.
Land use component (of accessibility) – The land-use system, consisting of the amount,
quality and spatial distribution of identifiable opportunities.
Temporal component (of accessibility) – The availability of opportunities at different
times of the day, and the time available for individuals to participate in certain
activities.
Transportation component (of accessibility) – The transport system, expressed as the
disutility for an individual to cover the distance between an origin and a destination
using a transport mode.
Page 281
Glossary 257
Contour measures
Defines catchment areas by drawing one or more travel time contours around a node,
and measures the number of opportunities within each contour (jobs, employees,
customers, etc) ( C. Curtis, J. Scheurer 2010).
Decision Support System (DSS)
A computer-based information system that supports decision-making activities. DSS
serve the management, operations, and planning levels of an organization and help to
make decisions, which may be rapidly changing and not easily specified in advance.
Network measures
A group of measure based on graph theory and network analysis that correlate
accessibility with topological measures of the transportation network. In some case
this measures can include also opportunity components.
Planning
Planning, as a general activity is the making of an orderly sequence of action that will
lead to the achievement of a stated goal or goals” (Peter Hall, Urban and Regional
Planning, 4th edition)
“The specification of a proposed future coupled with systematic intervention and/or
regulations in order to achieve that future […] a control parameter – something which
can have a profound influence on the future which comes to pass”. Byrne (2003:174)
Planning Support Systems (PSS)
PSS is a subset of geoinformation-based instruments that incorporate a suite of
components (theories, data, information, knowledge, methods, tools, etc) that
collectively support all of, or some part of, a unique planning task (Geertman and
Stillwell; 2003).
Potential measures
Are based on the concept of attraction and impedence. These measures assumes that
accessibility of a region is proportional to the attractiveness of destinations
surrounding(e.g. , the distribution of population, employment, income, etc) and
inversely proportional to the spatial impedance of travel required to reach those
destinations (e.g. travel time, distance, generalised cost etc.).
Spatial separation measures
Measures travel impediment or resistance between origin and destination, or between
nodes. Travel impediment measures can include: Physical (Euclidean) distance
Network distance (by mode) Travel time (by mode) Travel time (by network status—
congestion, free-flow, etc.) Travel cost (variable user cost or total social cost) Service
quality (e.g. public transport frequency) ( C. Curtis, J. Scheurer, 2010).
Page 282
258 Accessibility Instruments for Planning Practice
Statutory planning
The part of the planning process that is concerned with the regulation and
management of changes to land use and development. (Source: Wikipedia)
Time-space measures
Measures travel opportunities within pre-defined time constraints. (C. Curtis, J.
Scheurer 2010)
Urban Simulation
Use of a wide range of modeling concepts to capture and reproduce any type of
physical or socioeconomic phenomena observed in urban systems, allowing the
forecast of potential evolutions under controlled conditions to assist planning or
decision-making processes in general.
Usability (of an instrument)
A qualitative indicator of the extent to which an accessibility instrument is accepted
and applied in planning or decision making process by its end-users.
Utility measures
Measures individual or societal benefits of accessibility. This can occur in monetarised
form as a measure of economic utility, or as an indicator for social equity (or for other
sustainability objectives). It can also be applied as a behavioural indicator, measuring
the value individuals afford to the accessibility of particular activities (C. Curtis, J.
Scheurer 2010).
Page 284
260 Accessibility Instruments for Planning Practice
Page 285
References 261
Bahn.Ville 2-Konsortium: Die Bahn als Rückgrat einer nachhaltigen Siedlungs- und
Verkehrsentwicklung – Synthesebericht zum Projekt Bahn.Ville 2. München, December
2010.
Banfield, E. C. (1959/ 1973) Ends and Means in Planning. Reprinted from the
International Social Science Journal, Vol. XI, No 3, 1959. In Faludi, A. (1973): A reader in
planning theory. Oxford: Pergamon Press.
Banister, D., (2002) Transport Planning, 2nd edition, Spon Press, London.
Baradaran, S., Ramjerdi, F. (2001) Performance of accessibility measures in Europe.
Journal of Transportation and Statistics, September/December, pp.31-46.
Bertolini, L. (2005) Cities and transport: Exploring the need for new planning
approaches. in L. Albrechts & S. J. Mandelbaum (Eds.), The network society. A new
context for planning. Oxford, UK: Routledge.
Bertolini, L., le Clercq, F., L. Kapoen (2005) Sustainable accessibility: a conceptual
framework to integrate transport and land use plan-making. Two test-applications in the
Netherlands and a reflection on the way forward. In Transport Policy, Vol. 12, No. 3, pp.
207-220.
Bhat, C.R., Handy, S., Kockelman, K., Mahmassani, H.S., Chen, Q., Weston, L. (2000)
Accessibility Measures: Formulation Considerations and Current Applications, Report
4938-2, prepared for the Texas Department of Transportation, September 2000.
Bishop, S. (2007) (Steer Davies Gleave Ltd.): Accessing all areas: integrating
accessibility planning into the local transport planning process. Proceedings of the
European Transport Conference 2007.
Camerlingo, E. (2000) Le stazioni come occasione di riqualificazione urbana. In: La
metropolitana di Napoli, nuovi spazi per la mobilità e la cultura, edizioni Electa Napoli,
Novembre 2000.
Cascetta, E. (2001) Transportation Systems Engineering: Theory and Methods. Kluwer
Academic Publishers, Dordrecht, The Netherlands.
Cascetta, E. (2006) Integrated Land-Use and Transport Planning: the Metro Systems of
Naples and Campania. Amsterdam: Presentation given for AMIDSt.
Cascetta E. (2009) Transportation System Analysis: models and applications. 2nd
edition. Springer.
Cascetta E. et al. (2012). A behavioral indicator for cumulative accessibility to
opportunities: definition and application to a real case. Submitted to WCTR 2013.
Citilabs (a), ACCMAP Manual.
Citilabs (b), Accession [online]. Available from:
http://www.citilabs.com/products/accession (Accessed 28 November 2011).
Comune de Napoli (1997) Piano Comunale dei Transporti.
Page 286
262 Accessibility Instruments for Planning Practice
Condeço-Melhorado, A., J. Gutiérrez, García-Palomares, J. C. (2011) Spatial impacts of
road pricing: Accessibility, regional spillovers and territorial cohesion. Transportation
Research A 45:185-203.
Cumbria County Council (2002) Local Transport Plan 2001-2006, 2nd Edition.
Curl, A., Nelson, J.D., Anable, J. (2011) Does Accessibility Planning address what
matters? A review of current practice and practitioner perspectives. Research in
Transportation Business & Management 2 (2011) 3–11.
Curtis, C. and Scheurer, J. (2010) Planning for sustainable accessibility: Developing
tools to aid discussion and decision-making, Progress in Planning, vol. 74, No. 2, pp.53-
106.
de Jong, T. and van Eck, J.R. (1996) Location profile-based measures as an
improvement on accessibility modelling in GIS, Journal of Computers, Environment, and
Urban Systems, vol.20, no.3, pp.181-190.
de Lannoy, W., van Oudheusden, D. (1978) The accessibility of nodes in the Belgian
road network. Geojournal, 1978, 2, 1, 65-70.
Department for Transport (2000) Social Exclusion and the provision of Public Transport,
DfT, London.
Department for Transport (2004) Technical Guidance on Accessibility Planning in Local
Transport Plans. DfT, London.
Department for Transport (2006) Technical Guidance on Accessibility Planning in Local
Transport Plans, DfT, London.
Department of Environment (1996), Policy and Procedure Guidelines, PPG 6.
DHC (2007) Land Transport New Zealand: neighbourdood accessbility assessment tool.
Envall, P. (2007): Accessibility planning: a chimera? Leeds, 2007
Fischer T., Dalkmann H., Lowry M., Tennøy A., (2010): The dimensions and context of
transport decision making. In Joumard R. and Gudmundsson H. (eds), Indicators of
environmental sustainability in transport: an interdisciplinary approach to methods.
INRETS report, Recherches R282, Bron, France, chap. 3, p. 79-102.
http://cost356.inrets.fr.
Friedmann, J. (1996/2003) Toward a Non-Euclidian Mode of Planning. In Campbell, S.
and Fainstein, S.S. (eds.) Readings in Planning Theory. Blackwell.
Friedmann, J. (1998) Planning Theory Revisited. European Planning Studies, 6, No 3,
245-253.
Geertman et al. (1995). GIS and models of accessibility potentials: an application in
planning. International Journal of GIS, 9(1), 67-80.
Geertman, S., de Jong, T., Wessels, C. (2003) Flowmap: a support tool for strategic
network analysis', in Geertman, S. and Stillwell, J. (eds). Planning support system in
practice. Berlin: Springer Verlag.
Page 287
References 263
Geertman, S., de Yong, T., Wessels, C. and Bleeker, J. (2004) The relocation of
ambulance facilities in central Rotterdam, in Stillwell, J. and Clarke , G. Applied GIS and
spatial analysis. London: John Wiley & Sons. Ltd.
Geurs, B., van Wee, B. (2004) Accessibility evaluation of land-use and transport
strategies: review and research directions. Journal of Transport Geography 12 (2004)
127–140.
Geurs, K.T. and Ritsema van Eck, J.R. (2001) Accessibility measures: review and
applications. RIVM report 408505 006. Bilthoven: National Institute of Public Health
and the Environment.
Geurs, K.T., van Wee, B. (2006) Ex-post evaluation of Thirty years of compact urban
development in the Netherlands, Urban Studies, 43 (1), 139-160.
Gutiérrez, J., Condeço-Melhorado, A. and Martín, J.C. (2010). Using accessibility
indicators and GIS to assess spatial spillovers of transport infrastructure
investment. Journal of Transport Geography 18:141-152.
Gutiérrez, J., Condeço-Melhorado, A., López, E., Monzón, A. (2011) Evaluating The
European Value Added Of Ten-T Projects: A Methodological Proposal Based on Spatial
Spillovers, Accessibility and GIS, Journal of Transport Geography, 19:840-850.
Hack, J S. (1976) Land use transport interaction - a new approach to accessibility.
Development Plans Regional Strategies 2 Division, Department of the Environment,
WorkingNote No 151. London.
Halden, D. (2004) Accessibility planning [online]. Available from:
http://www.dhc1.co.uk/features/accessibility_planning.html (Accessed 05 May 2010).
Halden, D. (2010) A typology of accessibility instruments currently in use, paper
presented to the COST TU1002 meeting January 2011, Porto.
Halden, D. (2011) The Use and Abuse of Accessibility Measures in UK Passenger
Transport Planning. Edinburgh, 2011.
Halden, D., Jones, P. and Wixey, S. (2005) Accessibility analysis literature review.
Transport Studies Group – University of Westminster.
Hall P. (2010), Urban and Regional Planning, 4th edition.
Handy, S.L., Niemeier, D.A. (1997) Measuring accessibility: an exploration of issues and
alternatives, Environment and Planning A, vol.29, pp.1175–1194.
Hansen (1959). How accessibility shaped land-use. Journal of the American Institute of
Planning, 25, 73-76.
Hansen, W.G. (1959): How accessibility shapes land-use. Journal of the American
Institute of Planners, Vol. 25, Issue 2.
Helm, A. (1999) SONATA briefing note. Steer Davies Gleave, Leeds.
Hillier, B. (1996) Space is the Machine. Cambridge University Press, Cambridge.
Page 288
264 Accessibility Instruments for Planning Practice
Hillier, B., Turner, A., Yang, T., Park, H. T. (2007) Metric and topo-geometric properties of
urban street networks: some convergences, divergences and new results, Proceedings
of the 6th International Space Syntax Symposium, ITU, Istanbul, Turkey, 12-15 June.
Hull, A.D. (2009) Implementing Innovatory Transport Measures: What Local Authorities
in the UK say about their problems and requirements, European Journal of Transport
and Infrastructure Research, 9(3), 202-218.
Hull, A.D. (2011) Transport Matters. Integrated approaches to planning city regions,
Routledge: London.
Jiang, B., Claramunt, C. and Klarqvist, B. (2000) Integration of Space Syntax into GIS for
modelling urban spaces, JAG, vol.2, no.3/4.
Jones, P., Wixey, S., Titheridge, H., Christodoulou, G. (2005) Developing accessibility
planning tools. Transport Studies Group – University of Westminster.
Jun, C., Hyoun Kwon, J., Choi, Y. and Lee, I. (2006) An alternative measure of public
transport accessibility based on Space Syntax, ICHIT 2006 Proceedings of the 1st
international conference on Advances in hybrid information technology. Berlin: Springer
Verlag.
Keller, J., Leysens, T. (2011) Fostering rail-based accessibility by land management.
Proceedings of the European Transport Conference 2011.
L’Hostis, A. (ed.) Rapport final du projet Bahn.Ville 2 sur un urbanisme orienté vers le
rail. 2009.
Leonardi, G. (1978) Optimum facility location by accessibility maximising. Environment
and Planning A, 10, 1287-305.U.S. Department of Environment (1996).
Liu, S. and Zhu, X. (2004) An integrated GIS approach to accessibility analysis, Journal
of Transportation in GIS, vol.8, no.1, pp.45-62.
London Transport (1999) Calculator for Public Transport Accessibility in London
(CAPITAL), Technical Note, July.
López, E., Monzón, A., Ortega, E., Mancebo, S. (2009). Assessment of Cross-Border
Spillover Effects of National Transport Infrastructure Plans: An Accessibility Approach',
Transport Reviews, 29:4, 515-536.
Martin, K. and Dalvi, M. (1976) The measurement of accessibility: some preliminary
results, Transportation, vol.5, no.1, March, pp.17-42.
Monzón, A., Ortega, E. and López, E. (2010) Social impacts of high speed rail projects:
addressing spatial equity effects, Proceedings of 12th WCTR, July 11-15, 2010 –
Lisbon, Portugal.
Monzón, A., Ortega, E. and López, E. (in press). Efficiency and spatial equity impacts of
high-speed rail extensions in urban areas. J. Cities, doi:10.1016/j.cities.2011.11.002
MVA Consultancy (2006) Transport Model for Scotland (TMfS).
Page 289
References 265
Ney, S., (2001) Understanding Accessibility, in Giorgi, L; Pohoryles, R. J., (eds) Transport
Policy and Research: What Future? Ashgate, Aldershot.
Nielsen, J. B., Schultz, A. T. Hovgesen, H. H. og Nielsen, T. S. (2005) Byen, Vejen og
Landskabet: Motorvejen - landskabskunst og hverdagslandskab. Skov og Landskab,
København.
Ortega, E., López, E. and Monzón, A. (in press). Territorial cohesion impacts of high-
speed rail at different planning levels. Journal of Transport Geography,
doi:10.1016/j.jtrangeo.2011.10.008
Papa, E. (2004). The 100 Station Plan: integrated transport and land−use planning
(Italy. Naples). Naples: Comune di Napoli.
Regionalplanekontoret (2009) Tätare Stockholm (Denser Stockholm). URL:
http://www.tmr.sll.se/MOSS-dokument/Publikation/Publikationer_rapport_8-
2009_tatare_stockholm.pdf
Reneland, M. (1998) Begreppet tillgänglighet, - GIS-projektet Tillgänglighet i svenska
städer 1980 och 1995. Chalmers University of Technology, Gothenburg. (The concept of
accessibility. The GIS project: Accessibility in Swedish Towns 1980 and 1995).
Robbins, N. (1999) Multi-modal transport accessibility - the TRANSAM approach, The
journal of the Institution of Highways & Transportation, vol.46, no.04, pp.16-18.
Rose, A. and Stonor, T. (2009) Syntax: Planning Urban Accessibility, in Christ, W. (ed.)
Access for all approaches to the built environment, Basel: Springer, pp.79-93.
Ross, W. (2000) Mobility & accessibility: the yin & yang of planning. World Transport
Policy & Practice. Volume 6, Number 2, 2000.
Schäfer-Sparenberg, C.; Bongardt, D.; Dalkmann, H. (2006) Steuerung nachhaltiger
Daseinsvorsorge im öffentlichen Nahverkehr. Schriftenreihe „Wuppertal Papers“ des
Wuppertal Instituts für Klima, Umwelt, Energie GmbH, Wuppertal, 2006
Schwarze, B. (2005) Erreichbarkeitsindikatoren in der Nahverkehrsplanung.
Arbeitspapier 184. Institut für Raumplanung der Universität Dortmund.
Silva, C. (2008) Comparative Accessibility for Mobility Management – The Structural
Accessibility Layer, PhD Thesis, Oporto University, Portugal.
Social Exclusion Unit (2003) Making the connections: final report on transport and
social exclusion. SEU, London.
Somerset County Council, Public Transport Plan, 1997-2000 (draft copy).
Spiekermann, K. and Neubauer, J. (2002) European accessibility and peripherality:
concepts, models and indicators. Nordregio, Stockholm.
Steer Davies Gleave (2004) Report on accessibility assessment for Cornwall County
Council.
Stockholm Municipality (2003) The Sociotop Guide – Planning Public Open Space with
Stockholmers and the Sociotop Map (SOCIOTOPHANDBOKEN). URL:
Page 290
266 Accessibility Instruments for Planning Practice
http://www.stockholm.se/Global/Stads%C3%B6vergripande%20%C3%A4mnen/Tra
fik%2026%20Stadsmilj%C3%B6/Stadsplanering/SociotopA.pdf
Straatemeier, T., Bertoline, L., te Brömmelstroet, M., Hoetjes, P. (2010) An experiential
approach to research in planning. Environment and Planning B: Planning and Design,
2010, volume 37.
Straatemeier, T., Bertolini, L. (2008) Joint Accessibility Design: Framework Developed
with Practitioners to Integrate Land Use and Transport Planning in the Netherlands.
Transportation Research Record: Journal of the Transportation Research Board, Issue
2077. 2008.
te Brömmelstroet, M. and Bertolini, L. (2008) Developing land use and transport PSS:
Meaningful information through a dialogue between modelers and planners, Transport
Policy, vol.15, pp.251-259.
te Brömmelstroet, M. (2010) Equip the warrior instead of manning the equipment: state
of practice of land use and transport planning support in the Netherlands. Journal of
Transport and Land Use, Vol. 3, 1.
Titheridge, H. (2004) Accessibility planning and accessibility modelling: a review,
scoping study published with permission of the author. Available from:
http://www.sortclearinghouse.info/research/3/ (Accessed 23 March 2012).
Transport Scotland (2003) Scottish Transport Appraisal Guidance (STAG), version 1.0,
September.
Transport Scotland (a), LATIS (Land Use and Transport Integration in Scotland)[online].
Available from: http://www.transportscotland.gov.uk/analysis/scottish-transport-
analysis-guide/LATIS (Accessed 29 November 2011).
Transport Scotland (b) LATIS (Land Use and Transport Integration in Scotland) [online].
Available from: http://www.latis.org.uk/index.html (Accessed 01 December 2011).
Utrecht University (2011) Flowmap: About Flowmap [online]. Available from:
http://flowmap.geog.uu.nl/ (Accessed 22 August 2011).
Van Nes, A., Berghauser Pont, M., Mashhoodi, B. (2012) Combination of Space Syntax
with Spacematrix and the mixed use index. The Rotterdam South test case. In:
Proceedings of Eighth International Space Syntax Symposium. Santiago.
Vaughan, L., Geddes, I. (2009) Urban form and deprivation: a contemporary proxy for
Charles Booth's analysis of poverty, Radical Statistics, no.99, appendix,
http://www.radstats.org.uk/no099/VaughnGeddes99.pdf.
Wachs, M., Kumagai, T.G. (1973). Physical accessibility as a social indicator.
Socioeconomic Planning Science, 7, 327-456.
Wu, B.M., Hine, J.P. (2003) A PTAL approach to measuring changes in bus service
accessibility, Transport Policy, vol.10, pp. 307-320.
Page 292
268 Accessibility Instruments for Planning Practice
Page 293
Appendix A 269
General Information
1. Planning Context
On which mail address can we reach you?
For which university/institute are you working?
What is the name of your accessibility instrument?
In which country is the accessibility instrument used/developed?
For which university/institute are you working?
1.1 What geographic scale does the instrument cover?
□ Supra-National
□ National
□ Supra-Municipal
□ Municipal
□ Neighbourhood
□ Street
1.2 Are there policy requirements to assess accessibility?
□ There are legal requirements to use an accessibility assessment
□ It is advised to use an accessibility assessment
□ It is neither required nor advised
□ Other:
Page 294
270 Accessibility Instruments for Planning Practice
2. Planning Goals
1.3 What is the status of the instrument?
□ Implemented as part of the urban/ transport planning process
□ Functioning as a research tool
□ In development/ prototype
□ Other:
1.4 Is the planning process in which the instrument is (intended to be) used:
□ Formal planning process (top-down)
□ Informal planning process (bottom-up)
□ A combination of both
□ Not applicable
□ Don’t know yet (only for instruments marked as “in development” in question
1.3)
□ Other:
2.1 What are the main public stakeholder goals to be achieved with the
instrument?
□ How to decide on the location of residences /activities / services (What is
the influence of accessibility in the location of residences /activities / services)
□ How to manage, encourage or reduce the use of a particular transport
mode(s) (Understanding how to measure and how to develop efficient transport
services by a particular mode or combination of modes)
□ How to stimulate economic development
□ How to ensure economic equity
□ How to ensure social equity and/or cohesion
□ How to ensure reductions of emission/energy use
□ Not applicable
□ Don’t know yet (only for instruments marked as “in development” in question
Page 295
Appendix A 271
1.3)
□ Other:
Additional Explanation If you checked “manage, encourage or reduce the use of a
particular transport mode(s), please specify which mode here. Please separate
your answers with a semicolon.
2.2 What are the main private investors’ concerns that can be tackled with the
instrument?
□ Where to locate business (for commerce, service and other companies)
□ Where to invest in real estate (for real estate owners and traders)
□ Where and how to develop public transport services (private operators)
□ Where and how to develop freight supply chains (freight operators)
□ Enhancing patronage levels through information and marketing – access to
information
□ Not applicable
□ Don’t know yet (only for instruments marked as “in development” in question
1.3)
□ Other:
2.3 What are the main individual goals that can be achieved with the
instrument?
□ Choosing household location
□ Choosing the best route to (a) particular activity (ies)
□ Choosing the best mode(s) for (a) particular route(s)
□ Choosing the nearest activity (ies)□
□ Not applicable
□ Don’t know yet (only for instruments marked as “in development” in question
1.3)
□ Other:
Additional Explanation If you checked “choosing the best route to (a) particular
activity (ies) please specify which activity (ies).
Page 296
272 Accessibility Instruments for Planning Practice
3. Characteristics of the Instrument
3.1 Classify the instrument with regard to the decision support task.
□ Passive decision support tool (aids the process of decision making, but
cannot bring out explicit decision suggestions or solutions)
□ Active decision support tool (can bring out such decision suggestions or
solutions)
□ Cooperative decision support tool (allows the decision maker or advisor to
modify, complete, or refine the decision suggestions provided by the system,
before sending them back to the system for validation)
□ Used in the ex-post evaluation of the decision impact
□ Not applicable
□ Don’t know yet (only for instruments marked as “in development” in question
1.3)
□ Other :
3.2 Identify the accessibility measure tradition(s) the instrument is attached to.
□ Spatial separation measures [1]
□ Contour measures [2]
□ Gravity measures [3]
□ Competition measures [4]
□ Time-space measures [5]
□ Utility measures [6]
□ Network measures [7]
□ Information accessibility measures (use ‘other’ fields in following questions
to describe)
□ Not applicable
□ Don’t know yet (only for instruments marked as “in development” in question
1.3)
□ Other:
Page 297
Appendix A 273
3.3 Identify the components used in the instrument.
□ The instrument takes into consideration all accessibility components (Land-
use, transportation, temporal and individual)
□ The instrument takes into consideration some accessibility components.
Additional Explanation If you checked "The instrument takes into consideration some
accessibility components", please specify which:
□ Land-use
□ Transportation
□ Temporal
□ Individual
□ Not applicable
□ Don’t know yet (only for instruments marked as “in development” in question
1.3)
3.4 Identify the level(s) of spatial disaggregation of data used in the instrument.
a. Administrative units.
□ NUTS 1 level (e.g. Country based)
□ NUTS 2 level (e.g. Regional)
□ NUTS 3 level (e.g. Supra-municipal)
□ NUTS 4/LAU 1 level (e.g. Municipal)
□ NUTS 5/LAU 2 level (e.g. Parish)
□ Census tract
□ Not applicable
□ Don’t know yet ( only for instruments marked as “in development” in
question 1.3)
□ Other:
b. Plot level data.
□ Plots
Page 298
274 Accessibility Instruments for Planning Practice
□ Buildings
□ Transportation terminal/ hubs
□ Not applicable
□ Don’t know yet (only for instruments marked as “in development” in question
1.3)
□ Other:
c. Street segment level data.
□ Axial lines
□ Road centre lines
□ Intersections
□ Not applicable
□ Don’t know yet (only for instruments marked as “in development” in question
1.3)
□ Other:
d. Individual level data.
□ Households
□ Individuals
□ Other:
□ Not applicable
□ Don’t know yet (only for instruments marked as “in development” in question
1.3)
3.5 Identify the level of socio-economic disaggregation used in the instrument.
□ None/ aggregate measure
□ Gender
□ Age
□ Physical ability
Page 299
Appendix A 275
□ Work/ non-Work
□ Income
□ Education
□ Car ownership
□ Not applicable
□ Don’t know yet (only for instruments marked as “in development” in question
1.3)
□ Other:
3.6 Identify the level of temporal disaggregation used in the instrument.
□ None/ aggregate measure
□ Year
□ Month
□ Week
□ Day
□ Peak/ off-peak
□ Hour
□ Dynamic (real-time)
□ Not applicable
□ Don’t know yet (only for instruments marked as “in development” in question
1.3)
□ Other:
3.7 Identify how ‘travel cost’ is assessed in the instrument.
□ Actual travel expense (cost)
□ Imputed from travel distance
□ Imputed from travel time
□ Imputed from observation area structure
Page 300
276 Accessibility Instruments for Planning Practice
□ Generalised cost
□ Not applicable
□ Don’t know yet (only for instruments marked as “in development” in question
1.3)
□ Other:
Additional Explanation If you checked “Generalised cost”, please provide a more
detailed description of the generalised costs.
3.8 Identify the transport modes that are used in the instrument.
□ Any mode
□ Walking
□ Bicycle
□ Public Transport (specify below)
□ Taxi
□ Car
□ Plane
□ Truck
□ Not applicable
□ Don’t know yet (only for instruments marked as “in development” in question
1.3)
□ Other:
Additional Explanation When you checked Public Transport, please specify which
specific transport modes are includes (i.e. bus, train, tram, metro)
□ Bus
□ Train
□ Tram
□ Metro
□ Other
Page 301
Appendix A 277
3.9 Which trip purposes/ opportunities are used in the instrument?
□ No purpose / not applicable
□ All purposes (aggregate measure)
□ Work
□ Leisure
□ Healthcare
□ Shopping
□ Education
□ Don’t know yet (only for instruments marked as “in development” in question
1.3)
□ Other:
3.10 How well does the instrument replicate reality?
a. Please rate the quality of data.
Bad quality ○ 1 ○ 2 ○ 3 ○ 4 ○ 5 ○ 6 ○ 7 Good quality
□ Not applicable
□ Don’t know yet (only for instruments marked as “in development” in question
1.3)
b. Please rate the quality of calculations.
Bad quality ○ 1 ○ 2 ○ 3 ○ 4 ○ 5 ○ 6 ○ 7 Good quality
□ Not applicable
□ Don’t know yet (only for instruments marked as “in development” in question
1.3)
c. Please rate the accuracy of the model.
Bad accuracy ○ 1 ○ 2 ○ 3 ○ 4 ○ 5 ○ 6 ○ 7 Good accuracy
□ Not applicable
□ Don’t know yet (only for instruments marked as “in development” in question
1.3)
Page 302
278 Accessibility Instruments for Planning Practice
4. End-Users and How They Use the Tool
3.11 Please rate the speed of the tool.
Fast – interactive ○ 1 ○ 2 ○ 3 ○ 4 ○ 5 ○ 6 ○ 7 Slow –static report
□ Not applicable
□ Don’t know yet (only for instruments marked as “in development” in question
1.3)
4.1 Who are the potential users?
□ Spatial/ Urban Planners
□ Transport Planners
□ Health service planners
□ Education service planners
□ Politicians
□ Retailers
□ Citizens
□ Tool initiators
□ Developers/Researchers
□ Not applicable
□ Don’t know yet (only for instruments marked as “in development” in question
1.3)
□ Other:
4.2 Please rate how easy it is for practitioners to use the instrument.
a. Please rate the ease of collecting data.
Difficult ○ 1 ○ 2 ○ 3 ○ 4 ○ 5 ○ 6 ○ 7 Easy
□ Not applicable
□ Don’t know yet (only for instruments marked as “in development” in question
1.3)
Page 303
Appendix A 279
b. Please rate the ease to play with instrument.
Difficult ○ 1 ○ 2 ○ 3 ○ 4 ○ 5 ○ 6 ○ 7 Easy
□ Not applicable
□ Don’t know yet (only for instruments marked as “in development” in question
1.3)
c. Please rate the transparency of main causal assumptions.
Not transparent ○ 1 ○ 2 ○ 3 ○ 4 ○ 5 ○ 6 ○ 7 Very transparent
□ Not applicable
□ Don’t know yet (only for instruments marked as “in development” in question
1.3)
d. Please rate the flexibility of instrument (ease of changing parameters and
variables).
Not transparent ○ 1 ○ 2 ○ 3 ○ 4 ○ 5 ○ 6 ○ 7 Very transparent
□ Not applicable
□ Don’t know yet (only for instruments marked as “in development” in question
1.3)
e. To what extent are the accessibility measures (output) understandable for the
end user.
Difficult to understand ○ 1 ○ 2 ○ 3 ○ 4 ○ 5 ○ 6 ○ 7 Easy to understand
□ Not applicable
□ Don’t know yet (only for instruments marked as “in development” in question
1.3)
f. To what extent the accessibility measures visually represented.
Not very well ○ 1 ○ 2 ○ 3 ○ 4 ○ 5 ○ 6 ○ 7 Very well
□ Not applicable
□ Don’t know yet (only for instruments marked as “in development” in question
1.3)
Page 304
280 Accessibility Instruments for Planning Practice
4.3 Does the accessibility instrument make use of interpretable units?
□ Define
□ Not applicable
□ Don’t know yet (only for instruments marked as “in development” in question
1.3)
4.4 Please rate the knowledge and skills required to use the tool in terms of:
a. Modelling/computational skills.
Very low ○ 1 ○ 2 ○ 3 ○ 4 ○ 5 ○ 6 ○ 7 Very high
□ Not applicable
□ Don’t know yet (only for instruments marked as “in development” in question
1.3)
b. Spatial awareness skills.
Very low ○ 1 ○ 2 ○ 3 ○ 4 ○ 5 ○ 6 ○ 7 Very high
□ Not applicable
□ Don’t know yet (only for instruments marked as “in development” in question
1.3)
c. understanding policy context
Very low ○ 1 ○ 2 ○ 3 ○ 4 ○ 5 ○ 6 ○ 7 Very high
□Not applicable
□ Don’t know yet (only for instruments marked as “in development” in question
1.3)
4.5 How is the instrument used to understand the quality and experience of travel?
a. Please rate the usability in social evaluations.
Very low ○ 1 ○ 2 ○ 3 ○ 4 ○ 5 ○ 6 ○ 7 Very high
□ Not applicable
□ Don’t know yet (only for instruments marked as “in development” in question
1.3)
b. Please rate the usability in environmental evaluations.
Page 305
Appendix A 281
Very low ○ 1 ○ 2 ○ 3 ○ 4 ○ 5 ○ 6 ○ 7 Very high
□ Not applicable
□ Don’t know yet (only for instruments marked as “in development” in question
1.3)
c. Please rate the usability in safety and security evaluations.
Very low ○ 1 ○ 2 ○ 3 ○ 4 ○ 5 ○ 6 ○ 7 Very high
□ Not applicable
□ Don’t know yet (only for instruments marked as “in development” in question
1.3)
d. Please rate the usability for physical skills evaluations.
Very low ○ 1 ○ 2 ○ 3 ○ 4 ○ 5 ○ 6 ○ 7 Very high
□ Not applicable
□ Don’t know yet (only for instruments marked as “in development” in question
1.3)
4.6 How is the instrument intended to be used to connect service users (e.g.
citizens, companies) and providers (e.g. governments)?
□ A marketing tool to inform people what providers offer (top-down)
□ A networking tool for users to inform providers (bottom-up)
□ A tool to monitor consistency of perceptions/ expectations between providers,
users, suppliers (matching top-down to bottom-up)
□ Not applicable
□ Don’t know yet (only for instruments marked as “in development” in question
1.3)
□ Other:
4.7 What is the (intended) role of the instrument in urban planning?
□ To create new insights
□ To justify decisions/ positions already taken
□ To support strategy/ option generation
Page 306
282 Accessibility Instruments for Planning Practice
□ To support strategy/ option selection
□ To support integration of urban planning perspectives
□ Other (specify):
□ Not applicable
□ Don’t know yet (only for instruments marked as “in development” in question
1.3)
Additional Explanation When you checked “to support integration…” please specify which
perspectives are aimed at.
a. How successful is the instrument in that role?
Not successful ○ 1 ○ 2 ○ 3 ○ 4 ○ 5 ○ 6 ○ 7 Very successful
□ Not applicable
□ Don’t know yet (only for instruments marked as “in development” in question
1.3)
4.8 Are there any institutional issues that block the effective use of the instrument?
□ Separate urban and transport planning institutions
□ Formal processes
□ Financial arrangements
□ Data availability
□ Different planning objectives/ and assumptions
□ Staff technical skills
□ Political commitment
□ Not applicable
□ Don’t know yet (only for instruments marked as “in development” in question
1.3)
4.9 Do you see any other issues that block the effective use of the instrument (if so,
please specify which)?
Page 308
284 Accessibility Instruments for Planning Practice
Page 310
286 Accessibility Instruments for Planning Practice
Page 312
288 Accessibility Instruments for Planning Practice
Page 314
290 Accessibility Instruments for Planning Practice
Page 316
292 Accessibility Instruments for Planning Practice
Page 318
294 Accessibility Instruments for Planning Practice
Page 320
296 Accessibility Instruments for Planning Practice
Page 322
298 Accessibility Instruments for Planning Practice
Page 324
300 Accessibility Instruments for Planning Practice
Page 326
302 Accessibility Instruments for Planning Practice
Page 328
304 Accessibility Instruments for Planning Practice
Page 330
306 Accessibility Instruments for Planning Practice
Page 332
308 Accessibility Instruments for Planning Practice
Page 334
310 Accessibility Instruments for Planning Practice
Page 336
312 Accessibility Instruments for Planning Practice
Page 338
314 Accessibility Instruments for Planning Practice
Page 340
316 Accessibility Instruments for Planning Practice
Page 342
318 Accessibility Instruments for Planning Practice
Page 344
320 Accessibility Instruments for Planning Practice
Page 346
322 Accessibility Instruments for Planning Practice
Page 348
324 Accessibility Instruments for Planning Practice
Page 350
326 Accessibility Instruments for Planning Practice
Page 352
328 Accessibility Instruments for Planning Practice
Page 354
330 Accessibility Instruments for Planning Practice
Page 355
Appendix C 331
Overall plans and political steering documents.
The governmental purviews for shopping centres (Ministry of the Environment, 2008)
state in §1 that it aims to contribute to a stronger regional coordination of the shopping
centres policies. The objectives are to strengthen existing city and town centres, and to
contribute to a more efficient land use and to more environmental travel behaviour in
order to avoid a development causing urban sprawl, car dependency and worsened
accessibility for those without a car. The long-term objective is to achieve a more
sustainable and robust development of cities and urbanised areas and to limit GHG-
emissions.
The rules for the development of shopping centres are listed in § 3. They say that
shopping centres can only be established or enlarged in accordance with approved
county plans or county sector plans which include directions for localisation of retail and
other service functions. In areas which are not covered by such plans, shopping centres
cannot be established which are larger than totally 3.000 m2, or enlarged so that they
exceed this. The County Governor can approve to disregard these purviews if, after a
concrete analysis, it is found that the development is in accordance with §1 in these
purviews.
One of four main objectives in the comprehensive municipal plan for Oslo is that “Oslo
shall have a sustainable urban development” (Municipality of Oslo, 2007: 39). One of
the strategies for achieving this is to continue following a coordinated land use and
transport development strategy. This explicitly includes among others compact land use
development in order to minimize car use. Business, retail etc. should be developed in
designated public transport nodes. Økern is one of these.
The municipal sector plan for retail and services
The overall objective or goal for development of the retail- and centre structure in Oslo is
in the municipal sector plan for localisation of retail trade and other services 18
(Municipality of Oslo, 2003) stated as to contribute to a sustainable urban
development, with a compact land use and a coordinated land use and transport
development. Oslo shall also have an efficient and robust centre structure with vital
retail centres. For the inhabitants this means good coverage, proximity and accessibility
for all to shopping and service, for the society it means localisations which contribute to
improve the environment by hindering urban sprawl, and to reduce travel lengths and
car use, and for the retail business it means to offer predictable and favourable
conditions as terms for enable them to develop good local services in a suitable centre
structure which offers stability over time. A main idea is that regional and car-based
shopping centres shall not be allowed in Oslo.
These goals or objectives are well supported by the directions and the binding purviews
in the plan, which make the plan a strong and powerful tool for steering retail
development. According to the planning authorities (department of urban development),
the plan is strong and well-functioning. The City Council has mainly been loyal to the
18 This is also regarded as a county sector plan, for instance in relation to the governmental
purviews, since Oslo is both a municipality and a county.
Page 356
332 Accessibility Instruments for Planning Practice
plan, and the developers have hence in general accepted it as a strong signal regarding
what will be allowed. The planners at the planning authorities know that this is
something which is taken very seriously, and they ask the experts in this field for help
when necessary. The planning authorities find that the clarity and understandability of
the plan is a strength. Still, it is dynamic since it is designed so that it follows the urban
development. It is not detailed, and distinguishes only between two types of goods.
Theoretical and empirical knowledge in the sector plan
The municipal sector plan for location of retail and service in Oslo accounts for the
understandings of how localisation of retail and services affect the retail structure, the
accessibility to retail and traffic generation caused by retail shopping, as well as the
empirical knowledge in an Oslo-context. It does, however, not refer to theoretical
knowledge, or to empirical knowledge from other cities or to more general empirical
knowledge.
The empirical knowledge, and the understandings based on it, is accounted for in five
chapters 19. In chapter three, data showing status and development for retail in the
area, development over time, distribution in the region and in the city and changes of
location of existing and future retail centres are presented.
The main understandings of the sector plan
Readings of the sector plan, and an interview with a representative from the
department responsible for the municipal sector plan, have disclosed the
understandings and knowledge embedded in the plan. This includes among others that
the chances are higher that people walk or bicycle on a journey if the journey is short
than if it is long, and that more people will use public transport on a journey if the
services are good than if they are bad. Hence, if a shopping centre is located in walking
and bicycling distance from as many customers as it needs to provide for the necessary
turnover, and if it is located in an area well served by public transport, fewer will use a
car on their travel to this shopping centre than if the location had the opposite
characteristics (in the Norwegian debate one often discusses ’external shopping
centres’).
Following from this, it contributes to less car use if the retail centre structure consists of
many smaller retail centres than of few big ones, and if these are located in the public
transport nodes and in densely populated areas. Fewer and bigger centres would
increase the average travel distances from the homes in the city to the nearest
shopping opportunity, and hence increase car use on shopping journeys.
In order to be profitable, a shopping centre needs a certain turnover per square metre,
and data exist regarding how much this approximately is in various contexts. Given that
one knows approximately how much the average person spends on shopping (and there
are good data for this as well) at different kinds of centres (regional city centre, local
shopping area, nearest grocery store etc.), one can make rough calculations regarding
19 Descriptions of methods, together with more results, maps etc, are presented in a more detailed
‘Part II Background material’ to the plan.
Page 357
Appendix C 333
the number of customers needed for the profitability of the centre. This background
information is described and analysed in the municipal sector plan, and is regularly
updated. This updating is normally based on information from Statistics Norway and
about planning initiatives reported to the planning authorities.
The sector plan states that the customers should live in walking or bicycling distance to
the centre. The dimensions of a retail centre are hence defined (according to the
municipal sector plan) by the number of people living in walking and bicycling distance
from the centre.
An important condition for this to work is that only the main city centre of Oslo is allowed
to grow big enough to be a regional shopping centre which to a large extent attracts
customers from outside its own ‘neighbourhood’. It is of course acknowledged that
there is competition between centres, but also that most people do much of their
shopping at the nearest facility. It is also acknowledged that people do shop other
places than at their nearest centre. Still, as the overall planner at the planning
authorities explained, since this is happening in more or less similar ways all over the
city one still can define the size of the centres based on the number of people living in
walking and bicycling distances from the each
This strategy has created the present retail structure
This way of thinking and acting regarding the retail development in Oslo is what has
created the structure one finds today, and which in the analysis is found to be a good
and in general satisfactory structure which serves the objectives of the sector plan well.
A dynamic and adaptive – but clear and strong - steering tool
This also makes the sector plan dynamic, since the maximum size of the shopping
centres changes as the population size and retail structure change. However, if major
changes are implemented in this system, for instance that a new regional shopping
centre which draws large parts of its customers from other centres’ a market area is
established, this will affect the whole retail structure. The smallest centres may be
forced to close down, and others may offer less than today. Both of these effects would
cause people to travel longer distances in order to do their shopping, which also would
cause more road traffic. Hence, it is an important part of the Oslo plan that only the city
centre is allowed to grow big and regional. This is in accordance with the understanding
of the city as a complex and dynamic system.
By deciding the location of the shopping centres (marked on map), as well as the
criteria for their dimensioning, Oslo has created a steering instrument which allows the
city to develop a centre structure with many and smaller shopping centres rather than
few and large ones. According to their own analyses, this will contribute to a centre
structure which ensures good accessibility to necessary services for the inhabitants,
and which requires rather low car use on travels related to shopping.
This is also recognised several times in the developers’ analyses and descriptions,
where it for instance is expressed that the longer journeys the higher car shares, the
higher share of the customers living close to the centre the less car use, the bigger
centre the higher car use and so forth.
Page 358
334 Accessibility Instruments for Planning Practice
The developers/initiators expressed in interview that they find the sector plan to be un-
democratic. It is too rigid due to political directives regarding how the retail structure is
supposed to develop. The initiator doubts that there can be any real planning and
steering of retail development, but agrees that some kind and degree of steering is both
necessary and desirable.
Page 360
336 Accessibility Instruments for Planning Practice
Page 361
Appendix D 337
SECTION 3: ACCESSIBILITY INSTRUMENTS
Accessibility is considered in many ways within planning practice and this guidance on
writing short reports about each instrument is intended to provide a flexible framework
to communicate the different practices in place. The report guideline below has some
main headlines and you should complete one report for each instrument you highlight.
Accessibility Instruments can be:
Measuring attributes of places or people – e.g. planning tools to identify how to make
places more liveable or ways of identifying the opportunities available to people when
planning new facilities or destinations.
Analytical methods to apply accessibility principles within planning – e.g., parking policy
standards based on accessibility criteria or public transport service delivery
requirements based on people’s accessibility needs.
Models to understand dynamic effects and connectedness in transport networks, in
particular the dynamics between spatial plans and transport investments.
Indicator calculation methods where indicators are used to audit, monitor or set
standards for planning policies (e.g. travel time indicators)
Others?
An overarching consideration is that we are focussing on information/knowledge to
support the planning/policymaking process not on planning/policy measures as such.
For example, a policy to locate large traffic generators close to railway stations is not an
'Accessibility Instrument'. On the other hand, information/knowledge that helps identify
what in this context a 'large traffic generator' is, or what the level of service of the
railway station should be, could be considered an 'Accessibility Instrument'.
The report should not exceed 2000 words and be at least 1000 words. To better
illustrate the application and/or methodology of the Accessibility Instrument, the report
should ideally include a minimum of 1 and a maximum of 3 figures.
The report should be posted on the website AND sent by e-mail to [email protected] by
19th December 2011. Instructions on how to post the report on the website will follow in
due time.
Each report will be reviewed by two people: a member of the section 3 working group
(Luca Bertolini, Sanna Iltanen, Bruno Santos, or Derek Halden) and a member of
another working unit (you will be each asked to review a report).
Reviewers will send guidance on corrections to be made by January 13th 2012.
The final version must be posted on the website AND sent by e-mail to [email protected]
by January 27th 2012.
Please write your report according to the following structure and taking into account the
following questions:
Page 362
338 Accessibility Instruments for Planning Practice
Sub-section title Questions to answer Word length
1.Background What was the motivation for developing your
accessibility instrument?
What were the scientific questions it wanted to
answer, if any?
What were the planning problems it wanted to
address, if any?
Min 150
words; Max
300 words
2.Conceptual
framework and
theoretical
underpinnings
How does your instrument define accessibility?
How does your instrument measure accessibility?
Which are the theoretical underpinnings of this
definition and measures?
Why did you choose this definition and measures?
Min 150
words; Max
300 words
3.Operational
aspects
Which types of accessibility does the instrument
measure (see examples below)?
Examples of accessibility types are:
walk times to public transport services or to local
facilities,
travel times using public transport systems,
travel times by private car,
potential customers within a defined catchment
area,
degree of spatial separation/integration
etc.
How does your instrument calculate accessibility?
Which data is required? Is the data publicly and
freely available? If not at which conditions can it
be obtained?
How is the data processed? What are the
hardware and software requirements? Is the
software publicly and freely available? If not, at
which conditions can it be used?
How much time does the calculation require?
Min 250
words; Max
500 words
Page 363
Appendix D 339
Sub-section title Questions to answer Word length
Which degree of technical expertise is required to
perform the calculation?
Which degree of technical expertise is required to
interpret the results?
4.Relevance for
planning practice
What information does your instrument produce
that can be useful for planning practitioners?
Has the instrument been used before in a real
planning context?
If yes:
Where and when?
Which planning problem, or problems, did the
instrument address?
How did the instrument help in decision-making?
What difference did it make in the planning
outcome and/or in the decision-making process?
If no:
Why not?
Has the possibility of using the instrument to
address a planning problem and support a
decision-making process been otherwise
explored? If yes, provide a brief description of the
planning problem and how the instrument can
provide support to decision makers.
Min 200
words; Max
400 words
5.Strengths and
limitations
What are the most important strengths and
weaknesses of your instrument from a scientific
point of view?
What are the most important strengths and
limitations of your instrument from a practice point
of view?
If the instrument has been used before in a real
planning context:
What where the most important positive and
negative reactions of planning practitioners?
If the instrument has not yet been used in a real
Min 250
words; Max
500 words
Page 364
340 Accessibility Instruments for Planning Practice
Sub-section title Questions to answer Word length
planning context:
What do you expect to be important advantages
and disadvantages of using your instrument to
support planning practice?
Are you planning any future improvements to the
instrument, either from a scientific or practice
point of view?
If yes:
Which improvements are you planning to address
scientific limitations?
Which improvements are you planning to address
practice limitations?
Figures Figures are meant to illustrate the report (e.g. in
sub-section 3 or 4).
Provide each figure with a number and a short
description/caption.
Refer to figures in the text wherever appropriate.
Min 1 figure
Max 3 figures
Note: If the Accessibility Instrument presented by the WU is part of a broader
instrument, please focus the paper on the Accessibility Instrument with very brief
reference (in the ‘Background’ section) to the broader planning instrument of which it is
part (answer all remaining questions with regard to the Accessibility Instrument only).
Page 366
342 Accessibility Instruments for Planning Practice
Page 367
Appendix E 343
Table Comparison of the operational aspects of the Accessibility instruments
Instrument Type of Accessibility Data required &
availability
Calculation
requirements
Expertise
SNAMUTS Relation between
public transport (PT)
service and land use
(LU) activities
Utilizes six indicators:
1) ease of movement
along PT network;
2) directness of
journeys on PT;
3) combine effect of PT
on LU intensity;
4) competitiveness of
PT vs car;
5) geographical
distribution of
attractive travel paths;
6) nodal connectivity.
Not described Time
Not described
Software
ArcGIS
Not described
TRACE Distance of retail
clusters to relevant
infrastructure (e.g.,
train stations, major
roads)
Other accessibility
measures could be
calculated (such as
gravity-based)
Geo-referenced data
of shops
Type o retails, net
floor surface, and
type of shopping
area
Data available from
Locatus database
(payable)
Time
1 to 1.5h for a
set of 34000
records in a
mid-range
laptop
Software
ArcGIS with
Spatial Analysis
extension
Both
performing
calculations
and
understandin
g the results
is relatively
easy
The tool is
intuitive and
can be used
by anyone
familiar with
ArcGIS
Page 368
344 Accessibility Instruments for Planning Practice
Instrument Type of Accessibility Data required &
availability
Calculation
requirements
Expertise
ASAMeD Degree of spatial
separation/integration
Travel from one line to
another across the
graph in topological
terms (referred to as
depth)
Axial (vector) maps,
with the set of lines
of sight passing
through every public
space
Automatically
generated from
vector maps or
manually from
image files of maps
Time
Few minutes for
small urban
areas
Few hours for a
city
Software
Depthmaps
(Windows) is
publicly and
freely available
Open-source
The analysis
is calculated
automatically
without any
special
knowledge or
technical
expertise
Broad
knowledge on
theory of
space syntax
is needed to
interpret the
results
ABICA Activity based indicator
Visualization of
interaction patters –
desire-line traces that
indicate loads, demand
for capacity, and
spatial patterns of
dependency and
centrality.
OD datasets
(generally not free)
Danish case:
obtained from either
Danish commuter
survey or the Danish
National Travel
Survey
Time
Not described
Software
Software to
handle with
large datasets,
geo-statistics
and maps (e.g.,
ArcGIS or open-
source R)
Handling of
data and
analysis does
require some
technical
expertise
(more than
general GIS
courses)
HIMMELI
Proximity of
households to retail
units in travel cost
Clustering of each
retail units (with
respect to other retail
units)
Data concerning
households + retail
services (typology
and location) and
transportation
systems (travel cost
matrix)
Time
20000 discrete
spaces = 50
minutes
Software
MapInfo (script
coded in Basic
and C#)
Not described
Page 369
Appendix E 345
Instrument Type of Accessibility Data required &
availability
Calculation
requirements
Expertise
Contactability Travel time using
public transport (rail
and air)
Data available from
OAG (www.oag.com)
for flights and by
automatic queries of
the public website
DieBahn.de for the
train timetables
Time
1,5 months to
do a case study
(from data
collection to
cartography)
Software
MySQL+Musliw
(not publicly
available)
The degree of
technical
expertise is
high for
calculation
and
processing
information
The degree of
technical
expertise for
interpretation
is low
EMM Regional Level: gravity
index that estimates
accessibility to
population and job
potentials (travel time
in car and transit)
Local Level: large
variety of indicators
combining travel times
in car, transit, cycling &
walking, analyzing
accessibility to
facilities, transport
hubs, and other POI
Structural data:
population and
employment (public
in Germany at the
municipality level)
Transport data from
OpenStreetMap
(free-online), transit
web-sites
Time
Varies but is
generally high
(several hours
to several days)
Software
Online (GIS-
based) tool has
been developed
that, currently,
is still not
publicly
available
Only usable
by
experienced
modellers
(GIS &
databases)
No technical
skill will be
needed to
access the
online tool
RIN Journey times between
central locations and
residential areas
Transport network
sections are classified
according to the level
of central locations
connected and their
function
Not described Time
Not described
Software
Not described
Not described
Page 370
346 Accessibility Instruments for Planning Practice
Instrument Type of Accessibility Data required &
availability
Calculation
requirements
Expertise
MoSC Street connectivity
(space syntax)
Street centre line
information from
standard GIS street
network or CAD files
Time
Ranges from
seconds to few
hours
Software
Spatialist_lines
(upon request)
– plug-in of
ArcView
Basic
knowledge of
GIS software
to perform
calculations
Visual maps
are easy to
understand
InViTo Walking time from the
nearest public
transport access point
Network information
(usually free from
OpenStreetMaps)
Time
Not described
Software
Rhinoceros
(commercial)
combined with
its free plug-in
Grasshopper
Not described
GraBAM Gravity indicator for:
residents
towards
workplaces
economic
activities
towards
residents
Distance measured in
generalized travel cost
Socioeconomic
(National Statistics)
Land use
characteristics and
transport network
Time
Not described
Software
TransCAD GIS
software
The use of
the software
requires a
medium level
of expertise,
for
calculation
and
interpretation
Page 371
Appendix E 347
Instrument Type of Accessibility Data required &
availability
Calculation
requirements
Expertise
JAD The accessibility
measure varies with
the applications
Are related to societal
goals (cohesion,
competitiveness,
sustainability)
The accessibility is
measured with a
distance decay
function
Spatial and travel
time data (usually
owned by
municipalities)
Time
One day for
travel times
calculation + 15
min for maps
production
Software
ArcGIS
GIS skills are
sufficient
MaReSi SC Real walking distance
from dwelling to
shopping centre
Residences location
Retail structure
(time spent on
shopping, turnover,
etc)
Plans and probable
developments
Population
extrapolation
Spatial GIS data
Data available in a
plan-making process
Time
Not very work-
consuming
Software
ArcGIS
No advanced
skills are
needed
Planning
knowledge is
the main
competence
necessary
GDATI Geographic and
demographic
accessibility of transit
linear and punctual
infrastructure
Geographic and
demographic data
(obtained from GIS
maps)
Transport data can
be obtained online
or via transit
operators
Time
Calculations are
not time-
consuming,
data collection
is!
Software
Not described
Basic level of
technical
knowledge is
needed to
perform
calculations
Advanced
level of
technical
knowledge is
needed to
interpret
results
Page 372
348 Accessibility Instruments for Planning Practice
Instrument Type of Accessibility Data required &
availability
Calculation
requirements
Expertise
SAL Compares the variety
of travel generating
activity types reachable
by different transport
modes within a given
travel time/cost limit
Geo-referenced data
(population,
employment,
activities location -
by CENSUS;
transport
infrastructure,
service level,
demand)
The data is generally
purchased and
owned by local
authorities
Time
May reach out
to weeks
Software
GIS with
network
analysis
Advanced
technical
skills are
needed if no
processing
scripts are
available
Results are
easy to
understand,
considering
both
perceptions
of
accessibility
and map
reading
UrbCA Travel time by private
car
Land use changes are
used to represent
accessibility variations
throughout time
(forecast)
Land use
information
(obtained from
National Statistics
and local planning
authorities)
Transportation
network, including
future
investment/change
planned (obtained
from local
authorities)
Time
Vary from hours
to 1.5 days
Software
Standalone
Visual Basic tool
Some GIS
expertise is
needed to
preprocessin
g data
No specific
expertise is
needed to
interpret
results
Page 373
Appendix E 349
Instrument Type of Accessibility Data required &
availability
Calculation
requirements
Expertise
ATI Physical distance and
capacity of the existing
and proposed technical
infrastructure
Accessibility is
determined by 1) the
distance; 2) the
capacity of elements;
3) costs.
Land use info,
density, housing
construction
typology, land
subdivision,
private/public land
ownership
Technical
infrastructure data
(distance, capacity,
etc)
Most data is
available for free in
public records;
others can be
measured; others
will be based on
surveys and
workshops
Time
Not described
Software
ArcGIS with
spatial analyst
The
interpretation
of the results
will be easy
IMaFa Travel time by transit to
shopping centres
Digital transit
network (with travel
times, scheduling,
transfer times,
stations/stops etc)
Street network (for
walking times)
Location of shops
Population data
Time
Not described
Software
ArcGIS &
EMME3 for
traffic
assignment
(commercial) or
other traffic
assignment
software
Some
technical
knowledge of
network
analysis
using GIS is
required
Results can
be
understood
by everyone
Page 374
350 Accessibility Instruments for Planning Practice
Instrument Type of Accessibility Data required &
availability
Calculation
requirements
Expertise
PST Space syntax Not described Time
Not described
Software
Place Syntax
Tool for MapInfo
A DLL library
coded in C/C++
Not described
SoSINETi It measures different
types of accessibility
and compared over the
years:
Travel times between
municipalities
Connectivity
Rent market changes
(social)
- All the data is
available but needs
own investigation
and research
All observations are
long-term
observations within
5 up to 10 years
Time
Depends, but no
longer than one
or two weeks.
However, it has
to be repeated
every year,
maybe more
often.
Software
No soft- or
hardware is
needed but a
statistical
program, such
as SPSS, can be
used
No special
requirements
in technical
expertise are
needed
Some interest
in social
sciences and
empirical
methods will
help
Page 375
Appendix E 351
Instrument Type of Accessibility Data required &
availability
Calculation
requirements
Expertise
SNAPTA Time access to city
centre by transit
Total number of
economic activities or
destinations within a
defined catchment
area using transit
Gravity-based measure
using morning PH
travel times and
quantity of activity
opportunities per zone
Population: uses UK
Census Data Zones
Jobs, gross floor
area of retail shops
and facilities,
number of patients:
obtained under
license from
government
organization
Number of students
per school and
university, number
of recreation
facilities: obtained
from websites
Transportation
network info
Time
Data collection
is very time
consuming
Running
SNAPTA in GIS
does not take a
long time
Software
GIS (ARC/INFO)
Data input
and
performing
the
calculation
requires a
good
knowledge of
GIS
The ease of
interpretation
of results
depends on
the
accessibility
measure
used
Page 376
352 Accessibility Instruments for Planning Practice
Instrument Type of Accessibility Data required &
availability
Calculation
requirements
Expertise
ACCALC Travel time or costs for
different purposes and
for different periods of
the day, by different
modes (transit,
walking, etc),
Land-uses, data on
locations, OD
demand data, travel
times, etc
Data has become
much more freely
available over the
last 2years with the
open data
government
initiative.
Data on commercial
facilities, like shops
and theatres, can
still be quite
expensive to
purchase
Time
Building the
matrices takes
many hours;
Once built,
ACCALC uses
these matrices
and can analyze
policy questions
in real time
Software
Microsoft
Access or MS
SQL (recently) +
Excel
ACCALC is
hoped to
provide web-
based user front
end so that
anyone can use
the tool free of
charge
A high level of
technical
expertise is
needed to
run the
analysis
Page 378
354 Accessibility Instruments for Planning Practice
Page 379
Appendix F 355
Table Comparison of the planning relevance of the accessibility instruments
Instrument Information Produced Use in real planning
SNAMUTS Visualises a public transport
network’s strengths and
weaknesses
Interactive design tool for scenario
planning
2007 - Perth radial suburban
railway and land use plans for
intensification of activities
2009 – Benchmarking
accessibility between cities
2009 - Impacts of orbital bus
service in Melbourne
TRACE Developed and tested to analyse
retail landscape in Flanders.
Analysing balance between sector
efficiency and spatial goals
Not identified
ASAMeD Space Syntax spatial configuration
of social issues
Not identified
Space Syntax
and SAL
Describes links between space
quality, environmental
characteristics and pedestrian
activity
Not identified
ABICA Analysing the connectedness of a
municipality towards other areas
Research project referenced in
practice
HIMMELI Observation of factors behind
different development paths
allowing planners to influence
development more effectively
Not as yet
Contactability Travel times using public transport
to compare cities
Used in a competitiveness
indicator for cities
EMM Potential for transit orientated
development
Neighbourhood accessibility
Indicators for land use planning
Mainly in development stage but
has been used in stress tests for
sustainable mobility showing
resilience of places to energy
price fluctuations.
RIN System of central locations for
defining spatial components of
standards
Set standards for slow modes and
public transport for improvement
and for car to maintain current
standards
Standards set and guidance
issued to authorities.
MoSC Measures of connectivity including
spatial and cognitive influences on
behaviour
2010 - master-plan for the King
Abdullah University of Science
and Technology Science Town
Page 380
356 Accessibility Instruments for Planning Practice
Instrument Information Produced Use in real planning
InViTo Relationship between facilities and
settlements as an influence on
localism
Pilot in northern Turin to
investigate the transformations
resulting from the new subway
Identifying new functions in the
city of Asti
GraBAM Spatial distribution of accessibility
levels
Many applications most recently
the Regional Metro System Plan
of the Campania Region (South-
Italy)
JAD Develop measures jointly with
practitioners in each local setting
Collaborative approach largely
research so far but undertaken
in the context of current real
planning problems in the
Netherlands
MaReSi SC Number of square metres of
shopping space recommended to
serve a population
Applied by planning authorities
in Oslo for some years.
GDATI Various indicators relating public
transport network characteristics
to urban density
Only used in research so far
SAL Diversity of accessibility indicator
Accessibility cluster indicator
Information on spatial
inequalities used in research in
Oporto
UrbCA Simulate different planning
scenarios of land use evolution
taking the influence of the
transport system explicitly into
account.
Not yet fully used in real-world
planning processes but to be
tested shortly
ATI Indicators of different degrees of
accessibility presented separately
for example different services or
combined
Under development and not yet
applied
IMaFa Total population within time
thresholds to measure
accumulated opportunities
Applied in 2005 in the
Autonomous Region of Madrid,
in a collaboration between the
regional Public Transport
Authority and the Regional
Health Department
PST Axial distance to facilities Application in research on
access to green spaces.
SoSINeTi Accessibility to infrastructure
defined in terms of economic,
ecological and social evidence
Development not completed
Page 381
Appendix F 357
Instrument Information Produced Use in real planning
SNAPTA Zonal accessibility by public
transport to show impacts from
transport infrastructure changes
Development recently
completed and not yet applied
ACCALC Car and non-car user accessibility
opportunities to various land uses
in terms of travel time and
accessibility opportunities
Used by Scottish Government
and local authorities since 1999
and recommended as a suitable
tool in Scottish land use
planning guidance and Scottish
transport appraisal guidance.
Used by UK department of
transport for calculating
neighbourhood statistics across
UK.
Page 382
358 Accessibility Instruments for Planning Practice
Page 383
AFFILIATION OF EDITORS/AUTHORS
Page 384
360 Accessibility Instruments for Planning Practice
Page 385
Affiliation of Authors 361
Alain L'Hostis
Université Paris-Est
LVMT-IFSTTAR
20 rue Elisée Reclus,
59 666 Villeneuve d'Ascq, France
[email protected]
Alexander Ståhle
KTH School of Architecture
Östermalmsgatan 26,
100 44 STOCKHOLM, SWEDEN
[email protected]
Ana Condeço-Melhorado,
Universidad Complutense de Madrid
C/ profesor Arangüren, s/n
28040 Madrid
[email protected]
Ann Verhetsel, Jeroen Cant & Thomas Vanoutrive
University of Antwerp
Prinssstraat 13 – CST S.B. 412
2000 Antwerpen, Belgium
[email protected]
Angela Hull
School of the Built Environment
Heriot-Watt University
Edinburgh EH14 4AS
[email protected]
Page 386
362 Accessibility Instruments for Planning Practice
Anssi Joutsiniemi
EDGE urban research laboratory
Institute of Urban Planning and Design
Tampere University of Technology
P.O.Box 600, Korkeakoulunkatu 5
33101 Tampere
[email protected]
Aud Tennøy,
Norway Institute of Transport Economics
TØI, Gaustadalleen 21,
NO 0349 Oslo
[email protected]
Bruno Filipe Santos
Faculty of Sciences and Technology of the University of Coimbra
Rua Sílvio Lima, Univ. Coimbra - Pólo II
3030-790 Coimbra
[email protected]
Carey Curtis
Curtin University of Technology
GPO Box U1987, Perth
Western Australia. 6845
[email protected]
Page 387
Affiliation of Authors 363
Cecília Silva
Research Centre for Territory, Transports and Environment (CITTA)
Faculty of Engineering of Oporto University
Rua Dr Roberto Frias s/n
4200-465 Porto
[email protected]
Derek Halden
DHC
2 Dean Path
EH4 3BA Edinburgh
[email protected]
Emilio Ortega
Universidad Politécnica de Madrid
TRANSYT, UPM
E.T.S.I. de Montes
Ciudad Universitaria. 28040 Madrid
[email protected]
Enrica Papa
University or Rome "Tor Vergata"
Department of Civil Engineering
via del Politecnico 1,
00133, Roma, Italy
[email protected]
Page 388
364 Accessibility Instruments for Planning Practice
Enrique J. Calderón
ETSI de Ingenieros de Caminos, Canales y Puertos
Universidad Politecnica de Madrid
Ciudad Universitaria
28040 Madrid
[email protected]
Gebhard Wulfhorst
Technische Universität München
Department of Urban Structure and Transport Planning
Arcisstr. 21
D-80333 München
[email protected]
Gennaro Angiello
Land Use, Mobility and Environment Laboratory - Tema Lab
Department of Urban and Regional Planning
University of Naples Federico II
Piazzale Tecchio, 80
80125, Napoli Italy
[email protected]
Jan Scheurer
RMIT University/Curtin University
RMIT-AHURI Research Centre
School of Global, Urban and Social Studies
GPO Box 2476
Melbourne VIC 3001, Australia
[email protected]
Page 389
Affiliation of Authors 365
Johannes Keller
Technische Universität München
Department of Urban Structure and Transport Planning
Arcisstr. 21
80333 München
[email protected]
Juergen Gerlach
University of Wuppertal, Department of Civil Engineering, Institute for Road Traffic
Planning and Engineering
Pauluskirchstraße 7,
D-42285 Wuppertal
[email protected]
Lidia Zakowska
Cracow University of Technology, CUT
Warszawska 24,
31-155 Krakow, Poland
[email protected]
Luca Bertolini
University of Amsterdam
Department of Geography Planning and International Development Studies, Nieuwe
Prinsengracht 130
1051PH Amsterdam
[email protected]
Magda Mavridou
Ionos Dragoumi 4
54624 Thessaloniki
[email protected]
Page 390
366 Accessibility Instruments for Planning Practice
Maik Hoemke
ETH Zurich, DARCH-gta
Wolfgang-Pauli-Strasse 15,
HIL D74.1, CH-8093 Zurich
[email protected]
Maruška Šubic Kovač
Faculty of Civil and Geodetic Engineering/Municipal Economics Institute
University of Ljubljana
Jamova 2
1000 Ljubljana
[email protected]
Metka Sitar
Faculty of Civil Engineering University of Maribor
Smetanova 17
2000 Maribor
[email protected]
Nadia Charalambous
Department of Architecture, University of Cyprus,
P.O. Box 20537,
1678 Nicosia, Cyprus
[email protected]
Nuno Norte Pinto
Department of Civil Engineering
University of Coimbra
R. Luis Reis Santos, Pólo II da Universidade
3030-788 Coimbra, Portugal
[email protected]
Page 391
Affiliation of Authors 367
Pierluigi Coppola
Dipartimento d’Ingegneria dell’Impresa, Università degli Studi di Roma “Tor Vergata”
Via del Politecnico 1,
00133 Roma
[email protected]
Roger Mellor
Curtin University of Technology
GPO Box U1987, Perth
Western Australia. 6845
[email protected]
Rosa M. Arce-Ruiz
Universidad Politécnica de Madrid
TRANSYT, UPM
E.T.S.I. de Caminos, Canales y Puertos.
UPM. Profesor Aranguren, s/n. Ciudad Universitaria. 28040 Madrid
[email protected]
Sabina Pulawska
Cracow University of Technology, CUT
Warszawska 24,
31-155 Krakow, Poland
[email protected]
Saleem Karou
Heriot-Watt University
Edinburgh, United Kingdom
[email protected] ; [email protected]
Sanna Iltanen
EDGE urban research laboratory
Page 392
368 Accessibility Instruments for Planning Practice
Institute of Urban Planning and Design
Tampere University of Technology
BOX 600
FIN-33101, Tampere
[email protected]
Stefano Pensa
SiTI – Politecnico di Torino
Via Pier Carlo Boggio 61,
10138 Torino
[email protected]
Tobias Nordström
Spacescape
Östgötagatan 100
11664 Stockholm
Tel. 0046709360209
[email protected]
Thomas Sick Nielsen
Technical University of Denmark
Bygningstorvet 116 B,
DK-2800 Kgs. Lyngby
[email protected]
Petter Næss
Aalborg University
Skibbrogade 5
DK-9000 Aalborg
[email protected]
Page 393
Affiliation of Authors 369
Thomas Straatemeier
Goudappel Coffeng & Universiteit van Amsterdam
De Ruijterkade 143,
1011 AC Amsterdam
[email protected]
Vasileia Trova
Dept. of Architecture, University of Thessaly
Pedion Areos,
Volos 38334, Greece
[email protected]
Wieslaw Starowicz
Cracow University of Technology, CUT
Warszawska 24,
31-155 Krakow, Poland
[email protected]
Page 394
370 Accessibility Instruments for Planning Practice