Page 1
Industry Snapshot Report
Accommoda on and Food Services
in Hampden County, MA
MassHire Hampden County Workforce Board
1441 Main Street Suite 133
Springfield, Massachuse s 01103
Emsi Q3 2021 Data Set | www.economicmodeling.com
Industry Snapshot Report
Emsi Q3 2021 Data Set | www.economicmodeling.com
Page 2
. . . . . . . . . . . . . . . . . . . . . . . . . . . . . . . . . . . . . . . . . . . . . . . . . . . . . . . . . . . . . . . . . . . . . . . . . . . . . . . . . . . . . . . . . . . . . . . . . . . . . . . . . . . . . . . . . . . . . . . . . . . . . . . . . . . . . . . . . . . . . . . . . . . . . . . . . . . . . . . . . . . . . .1
. . . . . . . . . . . . . . . . . . . . . . . . . . . . . . . . . . . . . . . . . . . . . . . . . . . . . . . . . . . . . . . . . . . . . . . . . . . . . . . . . . . . . . . . . . . . . . . . . . . . . . . . . . . . . . . . . . . . . . . . . . . . . . . . . . . . . . . . . . . . . . . . . . . . . . . . . . . . . . . . . . . . . .2
. . . . . . . . . . . . . . . . . . . . . . . . . . . . . . . . . . . . . . . . . . . . . . . . . . . . . . . . . . . . . . . . . . . . . . . . . . . . . . . . . . . . . . . . . . . . . . . . . . . . . . . . . . . . . . . . . . . . . . . . . . . . . . . . . . . . . . . . . . . . . . . . . . . . . . . . . . . . . . . . . . . . . .3
. . . . . . . . . . . . . . . . . . . . . . . . . . . . . . . . . . . . . . . . . . . . . . . . . . . . . . . . . . . . . . . . . . . . . . . . . . . . . . . . . . . . . . . . . . . . . . . . . . . . . . . . . . . . . . . . . . . . . . . . . . . . . . . . . . . . . . . . . . . . . . . . . . . . . . . . . . . . . . . . . . . . . .4
. . . . . . . . . . . . . . . . . . . . . . . . . . . . . . . . . . . . . . . . . . . . . . . . . . . . . . . . . . . . . . . . . . . . . . . . . . . . . . . . . . . . . . . . . . . . . . . . . . . . . . . . . . . . . . . . . . . . . . . . . . . . . . . . . . . . . . . . . . . . . . . . . . . . . . . . . . . . . . . . . . . . . .5
. . . . . . . . . . . . . . . . . . . . . . . . . . . . . . . . . . . . . . . . . . . . . . . . . . . . . . . . . . . . . . . . . . . . . . . . . . . . . . . . . . . . . . . . . . . . . . . . . . . . . . . . . . . . . . . . . . . . . . . . . . . . . . . . . . . . . . . . . . . . . . . . . . . . . . . . . . . . . . . . . . . . . .7
. . . . . . . . . . . . . . . . . . . . . . . . . . . . . . . . . . . . . . . . . . . . . . . . . . . . . . . . . . . . . . . . . . . . . . . . . . . . . . . . . . . . . . . . . . . . . . . . . . . . . . . . . . . . . . . . . . . . . . . . . . . . . . . . . . . . . . . . . . . . . . . . . . . . . . . . . . . . . . . . . . . . . .9
. . . . . . . . . . . . . . . . . . . . . . . . . . . . . . . . . . . . . . . . . . . . . . . . . . . . . . . . . . . . . . . . . . . . . . . . . . . . . . . . . . . . . . . . . . . . . . . . . . . . . . . . . . . . . . . . . . . . . . . . . . . . . . . . . . . . . . . . . . . . . . . . . . . . . . . . . . . . . . . . . . . . . .11
Contents
What is Emsi Data?
Report Parameters
Workforce Map
Execu ve Summary
Supply (Jobs)
Demographic Details
Demand
What skills are they pos ng for?
Industry Snapshot Report
Emsi Q3 2021 Data Set | www.economicmodeling.com
Page 3
What is Emsi Data?
Emsi data is a hybrid dataset derived from official government sources such as the US Census Bureau, Bureau of
Economic Analysis, and Bureau of Labor Sta s cs. Leveraging the unique strengths of each source, our data
modeling team creates an authorita ve dataset that captures more than 99% of all workers in the United States.
This core offering is then enriched with data from online social profiles, resumés, and job pos ngs to give you a
complete view of the workforce.
Emsi data is frequently cited in major publica ons such as The Atlan c, Forbes, Harvard Business Review, The New
York Times, The Wall Street Journal, and USA Today .
Industry Snapshot Report
Emsi Q3 2021 Data Set | www.economicmodeling.com 1
Page 4
1 Industry
1 County
Class of Worker
QCEW Employees, Non-QCEW Employees, and Self-Employed
The informa on in this report pertains to the chosen industry and geographical area.
Report Parameters
72 Accommoda on and Food Services
25013 Hampden County, MA
Industry Snapshot Report
Emsi Q3 2021 Data Set | www.economicmodeling.com 2
Page 5
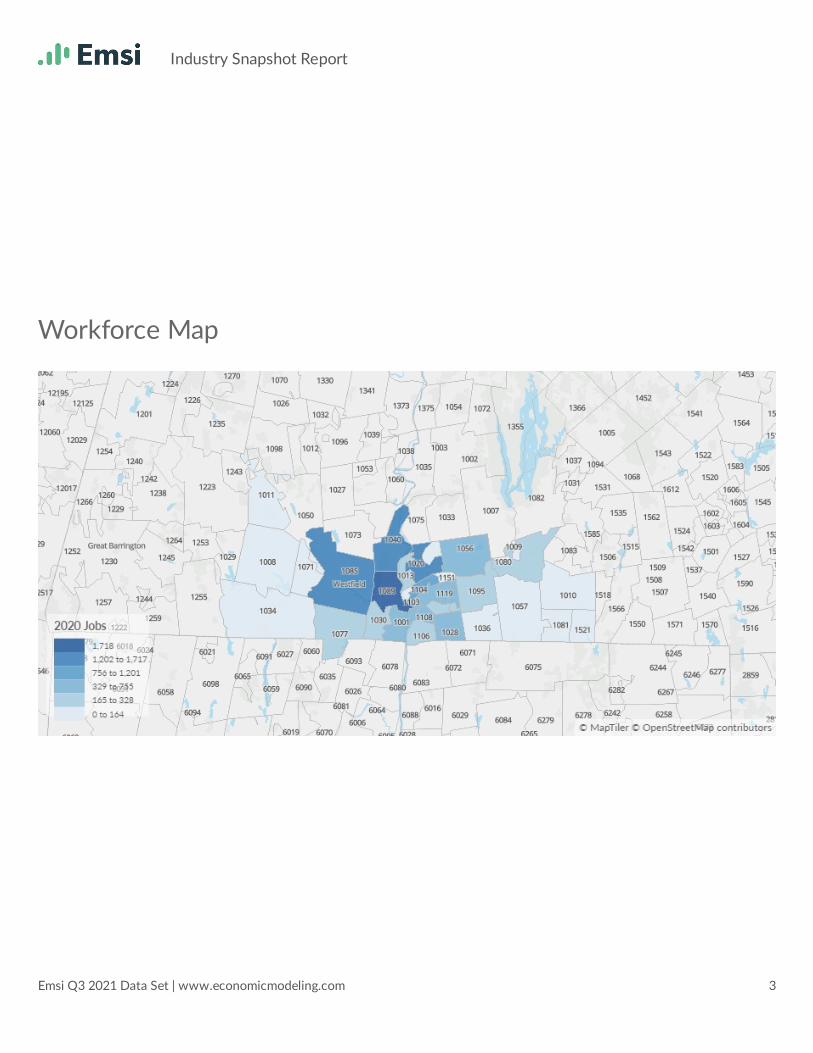
Workforce Map
Industry Snapshot Report
Emsi Q3 2021 Data Set | www.economicmodeling.com 3
Page 6
Hampden County, MA is not a
hotspot for this kind of talent. The
na onal average for an area this
size is 15,449* employees, while
there are 13,403 here.
Earnings per job are about the
same as the na onal average. The
na onal average salary for
Accommoda on and Food Services
in an area this size is $26,374,
while in Hampden County, MA it is
$26,611. Earnings per jobs is the
total industry earnings divided by
the number of jobs in the industry.
Compe on from online job
pos ngs is low in Hampden
County, MA. The na onal average
for an area this size is 968* job
pos ngs/mo, while there are 805
here.
Execu ve Summary
Light Hiring Compe on Over a Thin Supply of Regional Talent
*Na onal average values are derived by taking the na onal value for Accommoda on and Food Services and scaling it down to account for the
difference in overall workforce size between the na on and Hampden County, MA. In other words, the values represent the na onal average
adjusted for region size.
13,403
Supply (Jobs)
$26,611
Earnings Per Job
805
Demand (Job Pos ngs)
Industry Snapshot Report
Emsi Q3 2021 Data Set | www.economicmodeling.com 4
Page 7
Supply (Jobs)
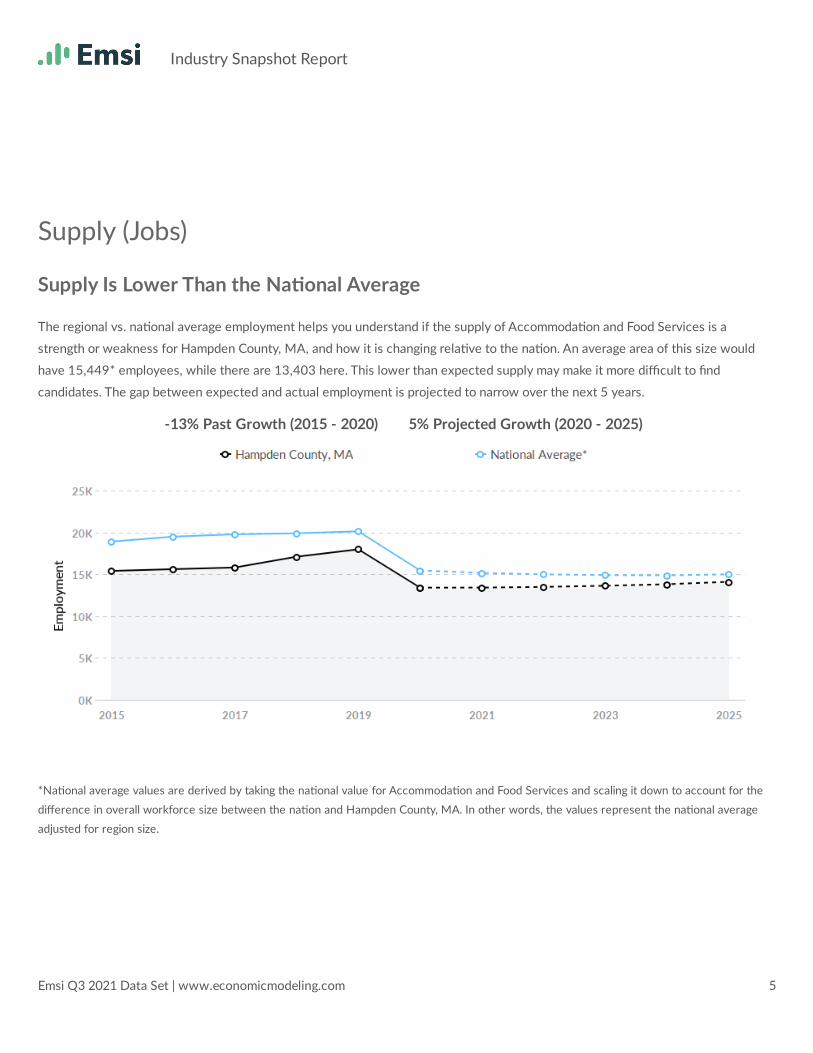
Supply Is Lower Than the Na onal Average
The regional vs. na onal average employment helps you understand if the supply of Accommoda on and Food Services is a
strength or weakness for Hampden County, MA, and how it is changing rela ve to the na on. An average area of this size would
have 15,449* employees, while there are 13,403 here. This lower than expected supply may make it more difficult to find
candidates. The gap between expected and actual employment is projected to narrow over the next 5 years.
-13% Past Growth (2015 - 2020) 5% Projected Growth (2020 - 2025)
*Na onal average values are derived by taking the na onal value for Accommoda on and Food Services and scaling it down to account for the
difference in overall workforce size between the na on and Hampden County, MA. In other words, the values represent the na onal average
adjusted for region size.
Industry Snapshot Report
Emsi Q3 2021 Data Set | www.economicmodeling.com 5
Page 8
Re rement risk is low in Hampden
County, MA. The na onal average
for an area this size is 1,919*
employees 55 or older, while there
are 1,638 here.
Racial diversity is about average in
Hampden County, MA. The
na onal average for an area this
size is 6,038* racially diverse
employees, while there are 5,646
here.
Gender diversity is about average
in Hampden County, MA. The
na onal average for an area this
size is 7,234* female employees,
while there are 7,410 here.
Re rement Risk Is Low, While Overall Diversity Is About Average
*Na onal average values are derived by taking the na onal value for Accommoda on and Food Services and scaling it down to account for the
difference in overall workforce size between the na on and Hampden County, MA. In other words, the values represent the na onal average
adjusted for region size.
Unemployment Rate Trends
Unemployment shown at the 2-digit sector level.
Jan 2017 Jan 2018 Jan 2019 Jan 2020 Jan 2021
1,000
2,000
3,000
4,000
5,000
6,000
7,000
Ind
ust
ry U
ne
mp
loym
en
t
1,638
Re ring Soon
5,646
Racial Diversity
7,410
Gender Diversity
Industry Snapshot Report
Emsi Q3 2021 Data Set | www.economicmodeling.com 6
Page 9
Demographic Details
Industry Age Breakdown
Industry Race/Ethnicity Breakdown
% of Jobs Jobs
A 14-18 11.6% 1,555
A 19-24 23.2% 3,114
A 25-34 25.1% 3,365
A 35-44 16.1% 2,160
A 45-54 11.7% 1,570
A 55-64 8.7% 1,168
A 65+ 3.5% 470
% of Jobs Jobs
A White 57.9% 7,757
A Hispanic or La no 26.5% 3,556
A Black or African American 7.8% 1,048
A Asian 5.4% 724
A Two or More Races 2.0% 271
A American Indian or Alaska Na ve 0.2% 32
A Na ve Hawaiian or Other Pacific Islander 0.1% 15
Industry Snapshot Report
Emsi Q3 2021 Data Set | www.economicmodeling.com 7
Page 10
Industry Gender Breakdown
Most Jobs are Found in the Food Prepara on and Serving Related Occupa onsIndustry Sector
% of Jobs Jobs
A Males 44.7% 5,993
A Females 55.3% 7,410
Occupa on% of Industry in Occupa on
(2020)
A Food Prepara on and Serving Related Occupa ons 79.9%
A Management Occupa ons 4.5%
A Sales and Related Occupa ons 3.4%
ABuilding and Grounds Cleaning and MaintenanceOccupa ons
3.0%
A Personal Care and Service Occupa ons 2.4%
A Office and Administra ve Support Occupa ons 2.3%
A Other 4.6%
Industry Snapshot Report
Emsi Q3 2021 Data Set | www.economicmodeling.com 8
Page 11
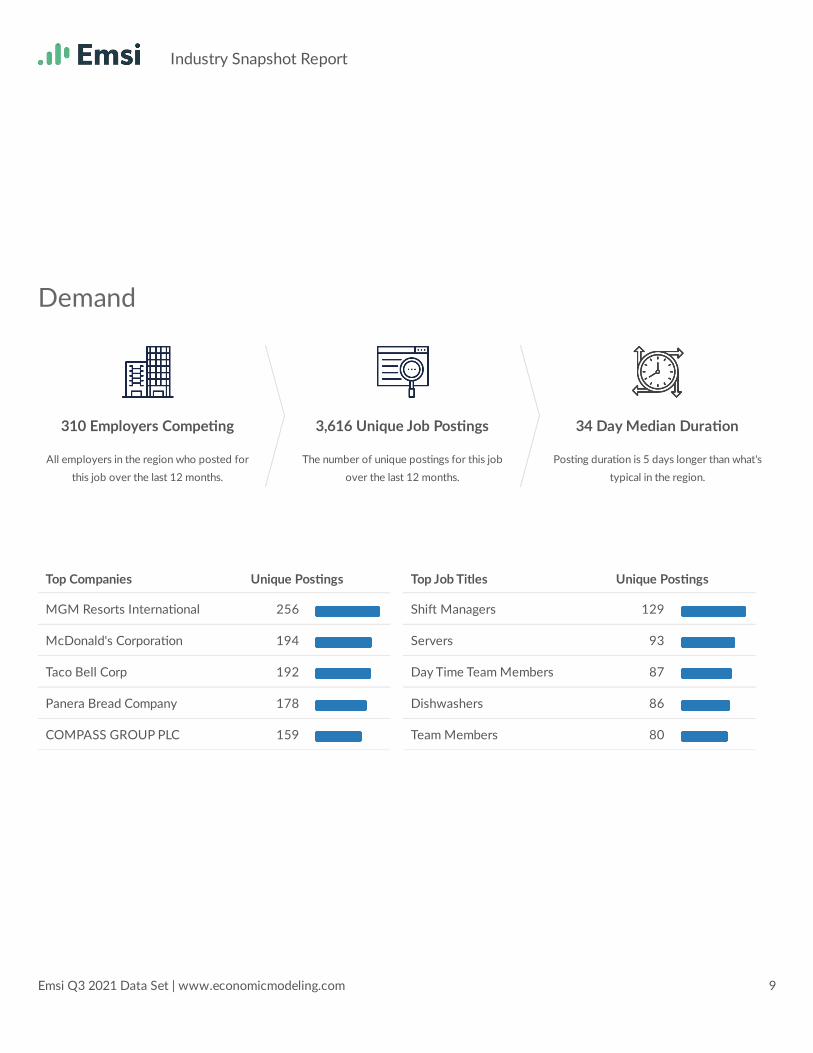
Demand
310 Employers Compe ng
All employers in the region who posted for
this job over the last 12 months.
3,616 Unique Job Pos ngs
The number of unique pos ngs for this job
over the last 12 months.
34 Day Median Dura on
Pos ng dura on is 5 days longer than what's
typical in the region.
MGM Resorts Interna onal 256
McDonald's Corpora on 194
Taco Bell Corp 192
Panera Bread Company 178
COMPASS GROUP PLC 159
Top Companies Unique Pos ngs
Shi Managers 129
Servers 93
Day Time Team Members 87
Dishwashers 86
Team Members 80
Top Job Titles Unique Pos ngs
Industry Snapshot Report
Emsi Q3 2021 Data Set | www.economicmodeling.com 9
Page 12
Industry Gain and Drain
Reliable Gain and Drain informa on is not available for the currently selected industry.
Industry Snapshot Report
Emsi Q3 2021 Data Set | www.economicmodeling.com 10
Page 13
What skills are they pos ng for?
Top 15 Skills for All Job Types by Quarter
Skills help us understand the direc on an industry is headed.
Jul 2020 - Sep 2020 Oct 2020 - Dec 2020 Jan 2021 - Mar 2021 Apr 2021 - Jun 2021 Jul 2021 - Sep 2021
Restaurant Opera on Restaurant Opera on Restaurant Opera on
Restaurant Opera on
Franchising Franchising Franchising
Franchising
Sanita on Sanita on Sanita onSanita on
Food Safety
Food SafetyFood Safety
Food Safety
Food Services
Food ServicesFood Services
Food ServicesRestaurant Management
Restaurant ManagementRestaurant Management
Restaurant ManagementFood Prepara on
Food Prepara on
Food Prepara on
Food Prepara on
Cash Handling
Cash Handling
Cash Handling
Cash Handling
Mopping
Mopping
Mopping
Mopping
Cooking
Cooking
Cooking
Cooking
Grilling GrillingGrilling
Grilling
Profit And Loss (P&L) Management
Profit And Loss (P&L) Management
Profit And Loss (P&L) Management
Profit And Loss (P&L) Management
Resolving Guest Concerns
Resolving Guest ConcernsResolving Guest Concerns
Resolving Guest Concerns
Customer Experience
Customer Experience
Customer Experience
Customer Experience
Gree ng Guests
Gree ng GuestsGree ng Guests
Gree ng Guests
Gross Regional Product (GRP)
$388.0M $118.7M $78.9M $585.6M
Earnings (2020)Property Income
(2020)Taxes (2020) Total GRP (2020)
Industry Snapshot Report
Emsi Q3 2021 Data Set | www.economicmodeling.com 11
Page 14
2007 2008 2009 2010 2011 2012 2013 2014 2015 2016 2017 2018 2019 2020
$400M
$600M
$800M
Gro
ss R
egi
on
al P
rod
uct
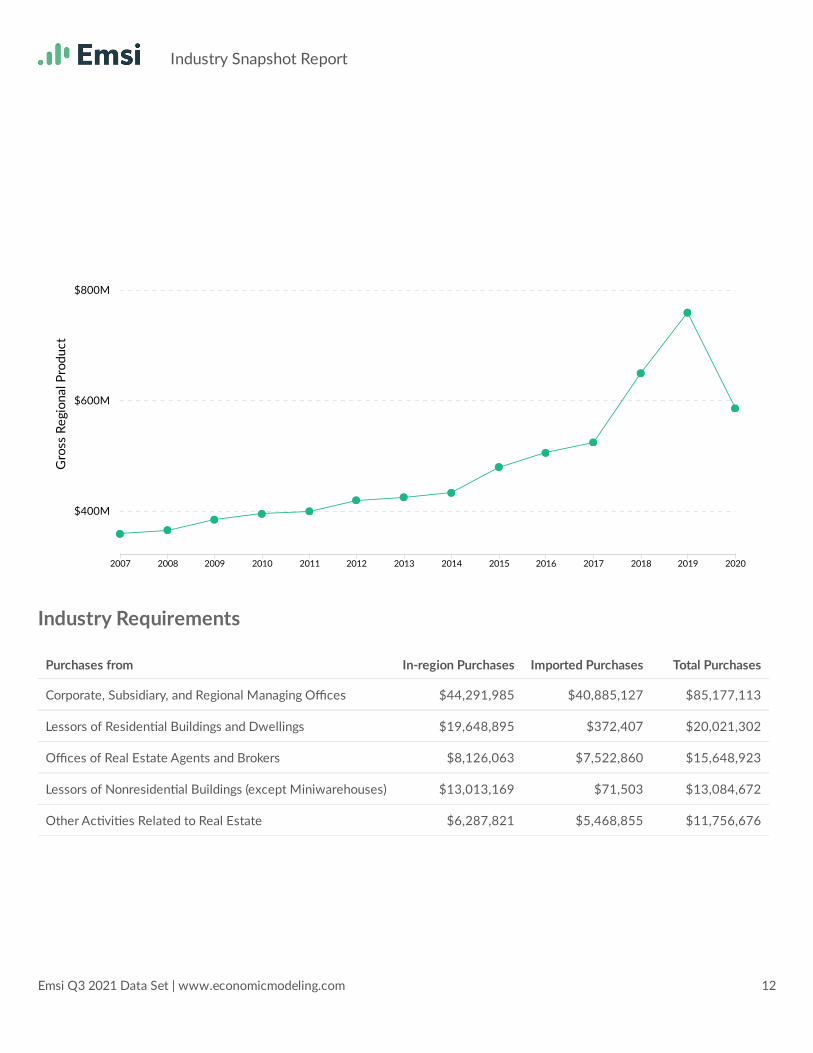
Industry Requirements
Corporate, Subsidiary, and Regional Managing Offices $44,291,985 $40,885,127 $85,177,113
Lessors of Residen al Buildings and Dwellings $19,648,895 $372,407 $20,021,302
Offices of Real Estate Agents and Brokers $8,126,063 $7,522,860 $15,648,923
Lessors of Nonresiden al Buildings (except Miniwarehouses) $13,013,169 $71,503 $13,084,672
Other Ac vi es Related to Real Estate $6,287,821 $5,468,855 $11,756,676
Purchases from In-region Purchases Imported Purchases Total Purchases
Industry Snapshot Report
Emsi Q3 2021 Data Set | www.economicmodeling.com 12