Value and Accountability: Preparing for the Future American College of Healthcare Execu=ves March 3, 2016 Michael J. Consuelos, MD MBA Senior Vice President, Clinical Integra4on The Hospital & Healthsystem Associa4on of Pennsylvania
Transcript
Value and Accountability: Preparing for the Future American College of Healthcare Execu=ves
March 3, 2016
Michael J. Consuelos, MD MBA Senior Vice President, Clinical Integra4on The Hospital & Healthsystem Associa4on of Pennsylvania
• PA trends • How is PA measuring up? • Alterna4ve Payment Models
# Hospitals in Health Systems # Independent Hospitals
1General Acute Care hospitals include community and children’s hospitals. Source: PA Department of Health, data compiled by The Hospital & Healthsystem Associa8on of PA (HAP)
Note: Several indicators have changed since the 2009 State Scorecard. Therefore, the 2009 Scorecard ranking has been revised to reflect the addition of several new indicators and updated definitions for others. The revised 2009 Scorecard ranking generally reflects the period five years prior to the time of observation for the latest year of data available, though this varies by indicator. If historical data were not available for a particular indicator, the most current year of data available were used as a substitute in the revised 2009 Scorecard ranking.Source: Commonwealth Fund Scorecard on State Health System Performance, 2014.
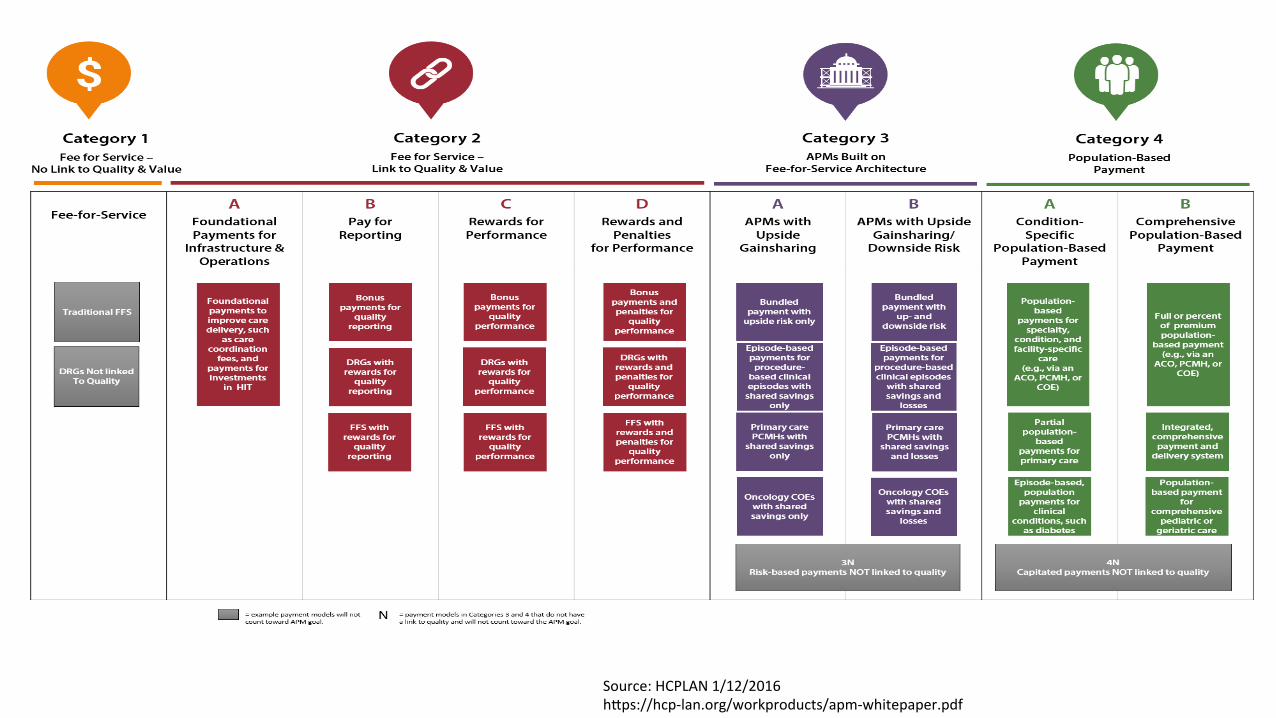
Category 1: Fee for Service – No Link to Quality Category 2: Fee for Service – Link to Quality Category 3: Alternative Payment Models with FFS Infrastructure Category 4: Population Based Payment
HHS sets clear goals and 4meline for shi[ing Medicare reimbursements from volume to value
2015 HAP Payment Reform Summit “Forging our Path from Volume to Value”
11
6%
50% 44%
0% 0%
25%
56%
19%
Fee-‐for-‐service with no link of payment to quality
Fee-‐for-‐service with a link of payment to quality
Alterna=ve payment models built on fee-‐for-‐service architecture
Popula=on-‐based payment
HHS payment framework: Where are HAP members?
Today 2018
50%
31%
6%
13%
How will a shiZ to value-‐based reimbursement affect your organiza=on?
Benefit somewhat
Benefit substan=ally
Lose a li_le
Lose a lot
Not be affected one…
None
Survey:70 clinical, administrative, and financial leaders from hospitals and health systems
Top 3 challenges in preparing for value-based payment:
12
0% 10% 20% 30% 40% 50% 60% 70% 80%
Nurse engagement
Administrator engagement
Lack of capital
Other (please specify)
IT infrastructure
Health policy uncertainty
Physician engagement
63%
63%
50%
38%
13%
6%
69%
The Other Challenges
13
• Lack of reimbursement to support required pa4ent care
• Pa4ent engagement
• Movement to value before payment mechanisms catch up and adap4ng to a risk model
• Lack of control of the full con4nuum of care necessary to make value-‐based reimbursement work appropriately
• Lack of ac4onable data from payers; living in both FFS and value worlds simultaneously
• Some4mes the quality measures do not really add value or pa4ent quality
• Redesign of the health system for popula4on health
• Have all the providers working in synch
• Ongoing modifica4on of core measures
Michael J. Consuelos, MD MBA Senior Vice President, Clinical Integration The Hospital & Healthsystem Association of Pennsylvania [email protected]
FROM ANALYTICS TO ACTION –
SPEED, COST & RATIONAL BEHAVIOR REALLY MATTERS NOW
HEALTHCARE EXECUTIVE FORUM - CENTRAL PA
Listening to Employers: How Health Systems Can Support Population Health Management and Accountability for Care We Provide
Thomas Northrop, FACHE - CEO NorHealth Management Group, LLC March 3, 2016
ANALYTICS TO ACTION – Speed, Cost & Rational Behavior
The Landscape � US Healthcare falls significantly short of potential for: Quality, Consistency, Cost and Access.
� Determinants of how ‘well’ we live: 40% lifestyle; 30% genetics; 20% - public health & environment; 10% - health delivery.
� High medical costs, yet Providers have little impact on 90% of life factors. � ‘More of the same’ behavior in Health sector increases costs, not our results.
� 95% of dollars spent go to medical care, only 5% to population-wide health improvement efforts.
� Healthcare cost growth far outstrips growth in US disposable income. � More health spending reduces money available for rest of Economy (education, defense, infrastructure,
social security, etc.)
� Rate of ‘waste’ in current health spending – 30-50% of dollars spent.
ANALYTICS TO ACTION – Speed, Cost & Rational Behavior
The Landscape (cont.) � Integrated delivery Systems (Intermountain, Kaiser) have addressed Quality of care and Cost of
care for decades: Not called ‘PHM’ then, simply trying to deliver care/cost balance for patients and community.
� ‘Accountable Care’ boils down to: (1) Manage fixed-price contracts for the treatment/
management of individual patient health; (2) Apply patient-specific concepts of balancing cost-of-care with quality-of-care to large populations of patients.
� Data-driven, clinician-led performance improvement combined with market pressures will
produce change. How Long Will It Take? � For the rest of us, PHM is in Early Development: inconsistent definitions; limited operational
understanding; and hype from vendors combine with misaligned incentives in provider space, payment space and employer space. Result is a far too slow-moving, costly mess. We can do better.
ANALYTICS TO ACTION – Speed, Cost & Rational Behavior
The Landscape (and how to move beyond it)
� Just 18.2 million U.S. lives now managed under an ACO – very small sample.
� Current economic models insufficient to drive change. Example from PA data: 6% FFS w/ no link of payment to quality; 50% FFS w/ some link between payment and quality; 44% with alternative payment models based on FFS architecture; 0% with population-based payments in place.
� New attempts: a) HTA Alliance b) Bree Initiative- Wash State; c) Intel-Portland Collaborative. Good attempts to redefine the game. Basic measures used: 1) Evidence-based care? 2) Patients satisfied? 3) Same-day access? 4) Rapid return to function? 5) Care affordable & savings produced?
� Value-based payment push will accelerate Winners & Losers – Which will your organization be?
� Use achieved savings to build internal data warehouse for future gains.
ANALYTICS TO ACTION – Speed, Cost & Rational Behavior
Cost-effective Innovation –
� Healthy Partners - 400+ San Diego physician group (Key Benefits Group). Direct Employer contracting thru self-funded Ins. Establish proven Care Regimens based on evidence-based medicine – Operates on gain-sharing that rewards Providers for reducing each Employer’s net health spend.
pop hlth mgmt app). Disease/case mgmt reduces SNF Readmits & ER visits: 66% less readmits, 61% drop in Pt LOS.
� U Miss Med Ctr - “Analysis of initial Pt group with (Jvion RevEgis app). Acute Myocardial
Infarction case prediction nearly two times better than with Stress tests, 20% better than CT coronary angiograms in predicting AMI events in low risk pop. w/in 12 months of discharge.” Dr. John Showalter, UMMC Chief Hlth Information Officer. Video: www.jvion.com/client.html
ANALYTICS TO ACTION – Speed, Cost & Rational Behavior
Sequential PHM Criteria (Typical) Use criteria to build roadmap & evaluate progress. Get started NOW. Reasonable yet aggressive typical
roadmaps & timeline include:
Year 1 - Pt Registries, Patient Attribution.
Year 2 - Precise Numerators, Clinical & Cost Metrics.
Year 3 - Clinical Practice Guidelines, Risk Management Outreach. Year 4 - Acquiring External Data, Patient Communication System, Patient Education/Engagement System.
Year 5 - Complex Clinical Production Guidelines, Care Team Coordination System, Pt Specific Clinical Outcomes System.
[*PHM ‘Criteria’ used with permission approval of Health Catalyst, Inc.]
ANALYTICS TO ACTION – Speed, Cost & Rational Behavior
Recommended Time/Cost Sequence
� Five years is far too slow to generate savings and results.
� Identify your biggest presumed problems impacting Revenue/Quality.
� Access ‘external national data’ now as temporary ‘data warehouse surrogate’.
� Evaluate external data against your ‘vital few’ clinical/financial indicators.
� Confirm accuracy of ‘vital few’ indicators in your organization then act on them.
� Build multiple ‘Change Teams’ to address process changes needed.
� Develop/implement/assess Incentives needed to support changed behaviors.
� Monitor, Adjust, Improve further … based on results achieved thus far.
� Pursue addtl key clinical/financial challenges from your organization.
� Use achieved savings to invest in future internal Data Warehouse.
ANALYTICS TO ACTION – Speed, Cost & Rational Behavior
� Questions & Discussion
ANALYTICS TO ACTION – Speed, Cost & Rational Behavior
� Thank You!
Thomas Northrop, FACHE – CEO NorHealth Management Group, LLC [email protected] 804-405-4983 March 3, 2016
Accountability for the Care We Provide
Health Care Executive Forum of Central PA March 3, 2016
Gerald Walsh Vice President, Provider Contracting & Relations Highmark Inc.
HIGHMARK.COM
“Accountable Care”
Beyond CMS’ Rules and Regulations
An Insurers Perspective
ACO Defined The ACO concept is one that is s4ll evolving,… a group of health care providers...who voluntarily come together to provide coordinated high-‐quality care to popula4ons of pa4ents. The goal of coordinated care provided by an ACO is to ensure that pa4ents and popula4ons — especially the chronically ill — get the right care, at the right 4me and without harm, while avoiding care that has no proven benefit or represents an unnecessary duplica4on of services.
27
Source: Health Catalyst (What is an accountable care organiza4on), Dr. John Haugom and Dr. David Burton
The Institute for Healthcare Improvement
28
My Point of View
• Clinical/Care Management of a Population
• Total Cost of Care - Measured
• Quality – Measured
• Patient Satisfaction
• Shared and Aligned Reward
29
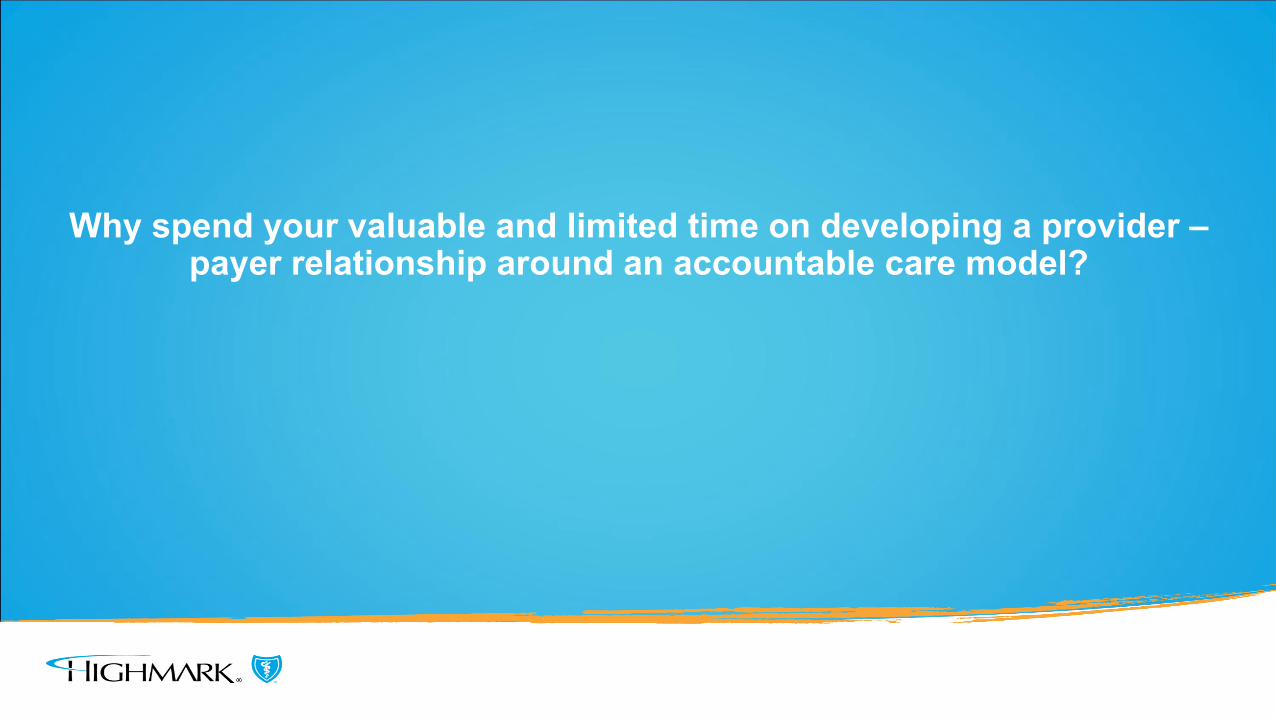
Change the Conversation
Why spend your valuable and limited time on developing a provider – payer relationship around an accountable care model?
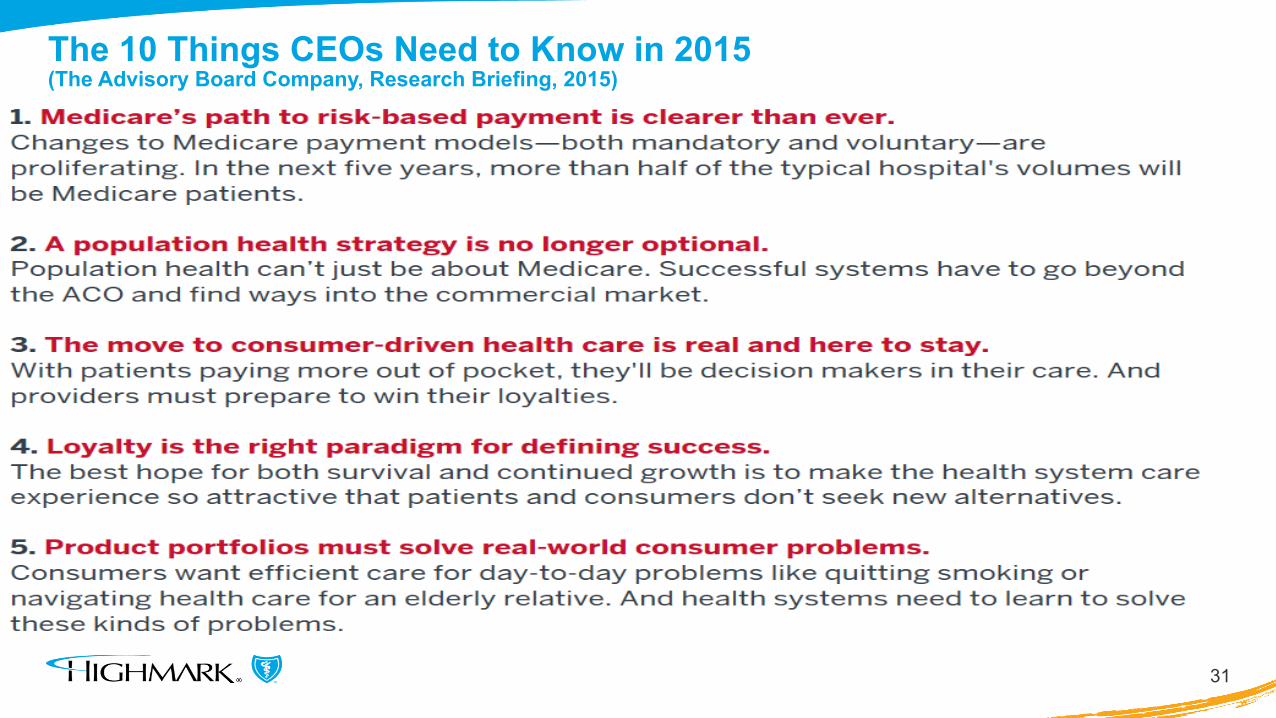
The 10 Things CEOs Need to Know in 2015 (The Advisory Board Company, Research Briefing, 2015)
31
32
The 10 Things CEOs Need to Know in 2015 (The Advisory Board Company, Research Briefing)
Payment Continuum
33
Fee for Service
P4V Incentives
Bundles Gain Share Risk Share % of Premium
34
The Advisory Board Company, Care Transformation Center Population Health Survey Results, 2014
Medicare is pushing you in this direction Your making investments in people and tools Maximize your investments and create efficiencies
Consumerism (B2C)
35
Price
Network
Key Components and Key Challenges of a
Payer – Provider Accountable Care Relationship
37
Key Components of a Commercial Payer ~ Provider Accountable Care Relationship Attributed Population Physician Leadership – Champions Clinically Integrated Network Primary Care Driven Care Coordinators Post Acute Care Collaboration Information Sharing – Bi-directional Quality Metrics Financial Alignment Governance Committee Measureable Goals
Key Challenges
38
Population Health
Management
Trust
Data Share
and Use
Key Challenges: Data Share and Use (beyond reports from health plans)
• Will/Can the health plan share claims data : raw or filtered? • Will/Can the provider share clinical data? • Who houses the data (health plan, provider, third party)? • What tools and technology will be used and who pays for it?
• Can the tool match clinical and claims data?
• Is the reporting real time and robust enough? • How do you make it actionable?
39
“Almost 12% of providers who responded to our survey even said that there would be a positive impact on their organizations if their health plans stopped sending data.”
The Advisory Board Company, 2015 HIPAC Data-Sharing Survey