ACCOUNTING FOR ENVIRONMENTAL DAMAGE BY MATERIAL PRODUCTION AND USE A comparison of seven Western European countries Background Report Corjan Brink, Eric Drissen, Herman Vollebergh and Harry Wilting June 2020
Transcript
ACCOUNTING FOR ENVIRONMENTAL DAMAGE BY MATERIAL PRODUCTION AND USE
A comparison of seven Western European countries
Background Report
Corjan Brink, Eric Drissen, Herman Vollebergh and Harry Wilting
Contents SUMMARY AND FINDINGS 5 1 INTRODUCTION 10 2 MATERIALS, ENVIRONMENTAL DAMAGE AND THE CIRCULAR ECONOMY 12
2.1 Natural resource use in the economic system 12 2.2 The production-based and production-chain perspective 13 2.3 Scope of the study 14
3 ENVIRONMENTAL ACCOUNTING FOR MATERIAL PRODUCTION AND USE 16
3.1 Computing monetary environmental damage 16 3.2 Physical environmental damage from the two perspectives 17
3.2.1 Environmental damage from a production-based perspective 17 3.2.2 Environmental damage from a production-chain perspective 18
3.3 Monetary environmental damage estimates 19
4 COMPARISON OF SEVEN COUNTRIES 22
4.1 Economic sector structure 22 4.2 Environmental damage in the seven countries, from a production-based perspective 23 4.3 The role of the material-related sectors in the seven economies 24
5 PRODUCTION-BASED ANALYSIS 26
5.1 Overview of the environmental damage caused by material-related industries and waste 26
5.1.1 Environmental damage caused by raw material extraction (Phase 1) 27 5.1.2 Environmental damage caused by material production (Phase 2a) 27 5.1.3 Environmental damage caused by manufacturing of products (Phase 2b) 28 5.1.4 Environmental damage in phases 1, 2a and 2b by type of pollutants, over
time 28 5.1.5 Environmental damage caused by waste management (Phase 4) 29
5.2 Environmental efficiency of material-related industries 31
5.2.1 Overview of environmental damage, per industry 31 5.2.2 Overall performance per country 32
5.3 Environmental damage from material production 33
6 PRODUCTION-CHAIN ANALYSIS 36
6.1 Overview of the environmental damage caused along the production-chain of materials and products 36
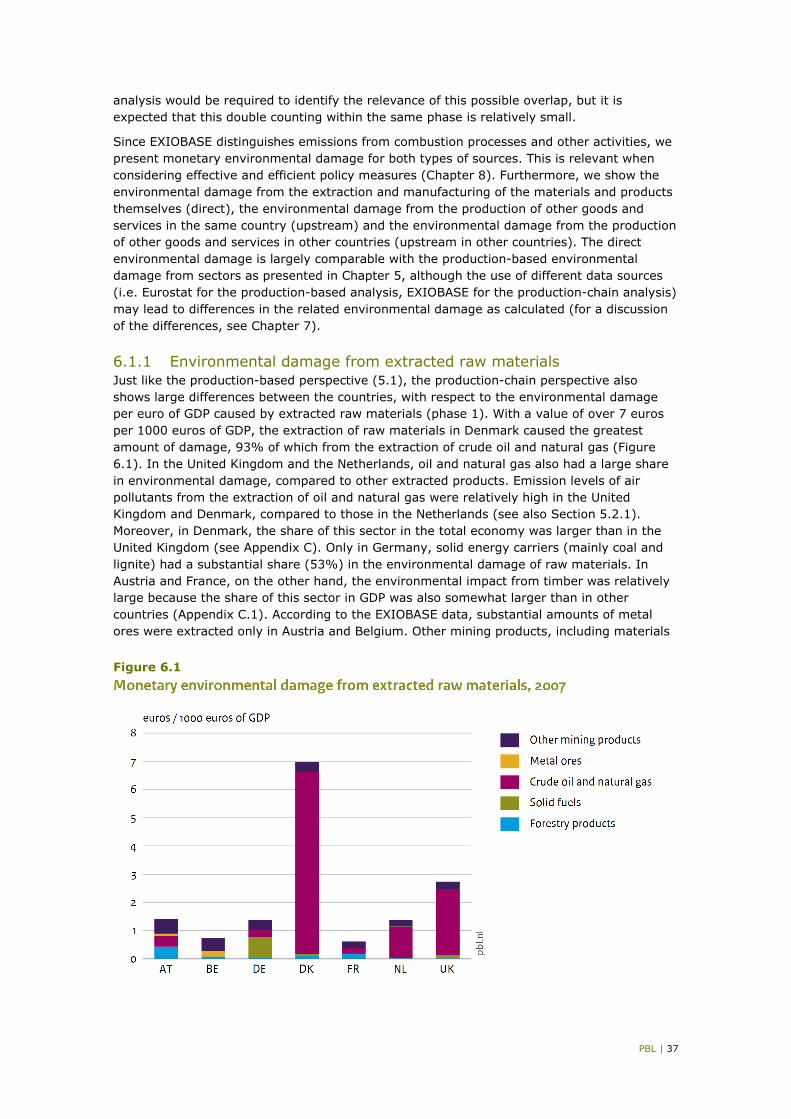
6.1.1 Environmental damage from extracted raw materials 37
PBL | 4
6.1.2 Environmental damage from manufactured materials 38 6.1.3 Environmental damage from manufactured products 39 6.1.4 Environmental damage in phases 1, 2a and 2b by type of pollutants 41
6.2 Comparison of environmental damage, per material 42
6.2.1 Overview of environmental damage, per material 42 6.2.2 Performance per country 43 6.2.3 Explanation of differences in production-chain damage per country 44
6.3 Detailed results for four groups of basic materials 44
6.3.1 Coke and refinery products 44 6.3.2 Chemicals and chemical products 45 6.3.3 Basic metals 46 6.3.4 Other mineral products 47
6.4 Globalisation of supply chains 48
7 COMPARISON AND VALIDATION 50
7.1 Comparing the production-based results with the production-chain results 50 7.2 Comparison of direct environmental damage 51
8 KEY FINDINGS, IMPLICATIONS AND CONCLUSIONS 54
8.1 Key findings of the comparative analysis 54
8.2.1 Accounting for environmental damage 56 8.2.2 Environmental damage and pricing policies in production 57 8.2.3 Options for additional instruments 59
REFERENCES 62 APPENDICES 64
PBL | 5
Summary and findings The environmental impact related to the production and use of materials is one of the main motives behind the wide interest in the transition to a circular economy. This study looks at the relationship between the production and use of materials and environmental impacts in seven EU countries (Austria, Belgium, Denmark, Germany, France the Netherlands and the United Kingdom) to find out which materials cause what and how much damage in the chain from extraction to waste. To this end, we calculated the monetary environmental damage from the production and use of materials in these countries as far as this is related to emissions to the atmosphere. The result provides insight into the differences and similarities between these countries both as far as their environmental damage is concerned and how this damage is associated with the production and use of materials.
This study investigates the environmental damage of the production and use of materials in different phases of the material chain, namely the extraction of resources (phase 1), the production of materials (phase 2a), the manufacturing of products and construction (phase 2b), and waste management (phase 4). Our focus is on the environmental damage related to emissions to the atmosphere. Damage from other environmental externalities, such as noise, land use and the impact of microplastics, was not included in these estimates because of data limitations and large uncertainties with regard to the environmental impacts and their value. Taking into account these additional externalities would add to the environmental damage presented in this study.
In order to obtain a useful comparative overview of the environmental impact at different phases of production and use of materials in the seven countries, this report presents two different types of analyses. First, we employed a production-based perspective that uses data from the national and environmental accounts as published by Eurostat to provide insight into how these countries differ in terms of their economic structure and the associated environmental pressure and environmental damage, in particular with respect to the production sectors related to the extraction, use and disposal of materials.
Second, we also investigated the emissions and damage of material extraction and production from a production-chain perspective. This production-chain analysis considers the environmental pressures and damage over the complete production chain of a material or product up to the moment that the product is sold. This approach therefore not only takes into account the environmental damage caused by emissions directly occurring during the production of a certain product, but also damage related to emissions that occur throughout the production chain both within the country and abroad. Moreover, by using data from EXIOBASE for this approach, we were able to make a distinction between emissions related to fuel combustion and emissions related to other activities, including the non-energy use of fuels and industrial processes such as cement production.
The key findings that follow from both the production-based and production-chain analysis can be summarised as follows:
• The overall monetary environmental damage was found to have been considerable in all seven countries, varying from 4% to 18% of GDP in 2015, which implies a direct welfare loss of between 1500 and 2000 euros per capita for most countries (Figure 4.2).
• Air pollutants, such as NOx and SO2, contributed for more than two thirds to total environmental damage in countries with an upward outlier of 91% for Denmark (Figure 4.3).
• The most important sectors contributing to this damage were agriculture, transport, households and manufacturing (Figure 4.2).
PBL | 6
• Despite a considerable decline between 2008 and 2015, in 2015 the environmental damage was still mainly related to air quality and to a lesser extent to greenhouse gas emissions (Figure 4.3).
• The share of the material-related sectors (extraction of raw materials and the production and use of materials) in gross value added was on average around 20%, in 2015, while the share of environmental damage varied from less than 5% for Denmark to almost 40% for Belgium (Figure 4.4).
• For all countries, except Denmark and Germany, the share of these sectors in environmental damage was considerably larger than in gross value added. Material producing industries (phase 2a), in particular, were responsible for the overall environmental damage caused by the material-related sectors, whereas their contribution in terms of gross value added was relatively small (Figures 4.4 and 5.4).
• Sectors using materials in the manufacturing of products and construction (phase 2b) also contributed considerably to the overall damage in 2015, whereas the contribution by the extraction (phase 1) and waste sectors (phase 4) was much smaller and more country-dependent (Figures 4.4 and 5.4). For instance, the relative damage from the extraction industry (mainly mining and quarrying) in Austria and the United Kingdom was much larger than its contribution to GDP in narrow economic terms (see also Figure 5.1), whereas the opposite is true for Denmark and the Netherlands.
• The industries mainly responsible for the environmental damage from material production in 2015 varied considerably between the countries and clearly reflected international specialisation (Figure 5.2). Dominant polluters were the chemical industry and refineries (in particular, in Belgium and the Netherlands), the manufacturing of basic metals (in particular, in Austria) and the manufacturing of other materials (in particular, in Austria and Belgium). These four industries contributed more or less equally in both Germany and France.
• The sector that by far dominated the contribution to environmental damage in phase 2b was the construction sector (Figure 5.3). In Germany and the United Kingdom, the composition of the contribution was very different, with a substantial role for the automotive industry (Germany) and rubber and plastics industry (United Kingdom). Manufacturing of metal products was also relatively important, in all of the countries. The contribution of the waste sector appeared to have been quite modest (Figure 5.5).
• There was rather a large variation in environmental efficiency in both the extraction and certain material-producing industries (see Figure 5.7). The variation was largest for the manufacture of wood and wood products, basic metals and other minerals, and for refineries. In particular, France showed the lowest environmental efficiency for the materials production industries and made modest improvements, between 2008 and 2015 (Figures 5.9–5.12).
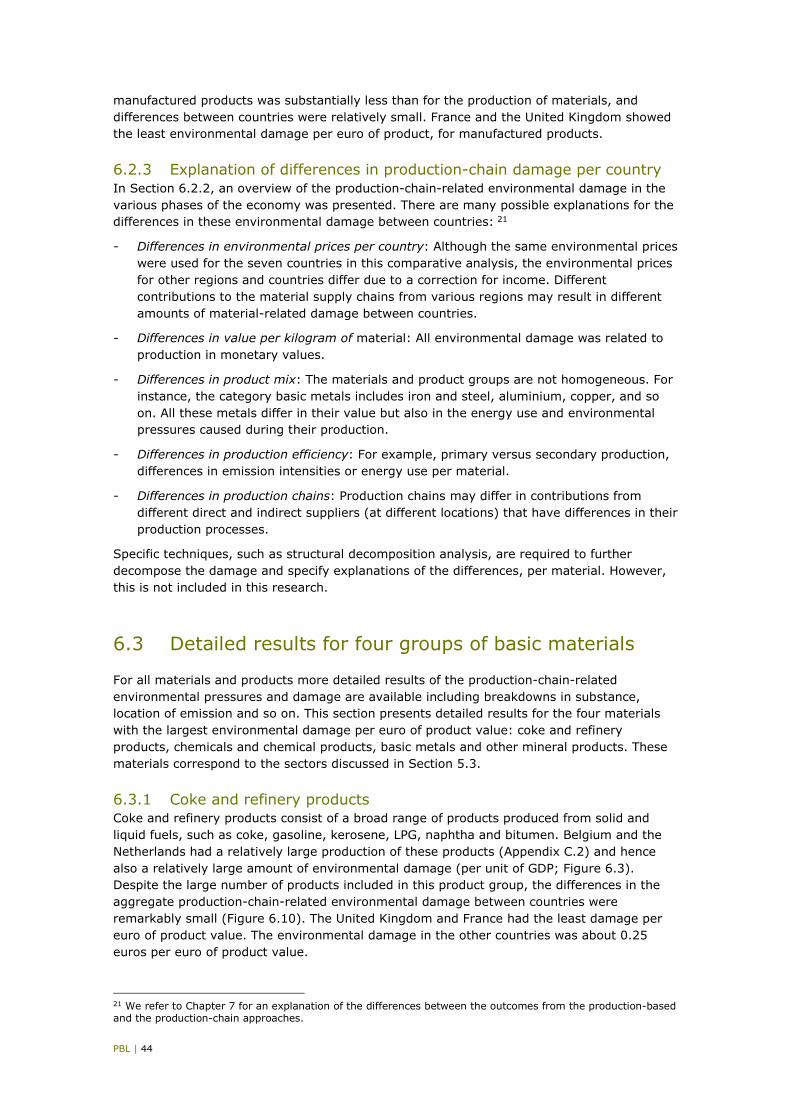
• The results of the production-chain analysis show considerably greater environmental damage from material production and manufacturing of products, compared to that from the production-based analysis. This result can be expected, because the production-chain analysis also includes damage of upstream domestic origin and from other countries (Figure 7.1).
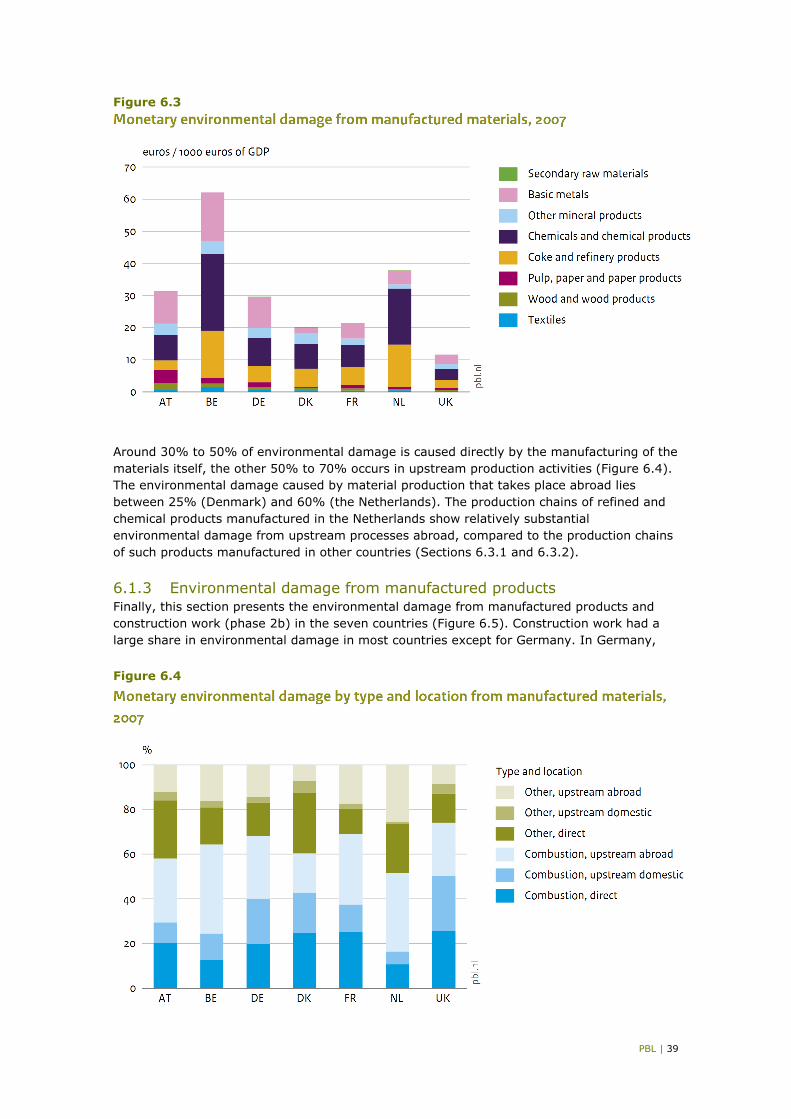
• The production of coke and refinery products, chemical products and basic metals contributed significantly to total environmental damage of material production, regardless of whether emissions upstream in the production chain were included (Figure 6.3) or not (Figure 5.2).
• The damage caused by construction dominated phase 2b, according to the production-based approach (Figure 5.3), but would be much smaller if the damage caused by upstream sectors would also be included (Figure 6.5). The contributions by other sectors, in particular the automotive sector, other equipment and metal product manufacturing,
PBL | 7
was found to be much more important in most countries under the production-chain approach. This reflects the significant contribution of upstream emissions, such as from the production of materials, to the overall environmental damage caused by the production chains in these sectors. Germany stands out in this analysis, because of the relatively large share of the manufacturing of motor vehicles and other machinery in its economy (Appendix C).
• The production-chain analysis also shows relatively large variation in environmental efficiency for extracted raw materials and for manufactured materials (see Figure 6.8). The variation in the environmental damage per euro of product value was particularly large for the extraction of fossil fuels. Variation was much smaller for manufactured products, similar to that in the production-based analysis.
• A closer look at some of the manufactured materials, such as coke and refinery and basic metals, also shows variations in the findings for the various countries. Apparently, in 2007, comparable materials were produced with differing environmental damage per euro of product value (see Figures 6.9–6.12).
Our detailed data also allow for several other important conclusions relevant for circular economy considerations:
• Clear indications were found that, in 2007, a considerable share of overall emissions from raw material extraction and material producing industries was not directly linked to combustion but to ‘other activities’, including industrial processes and non-energy use of fuels (Figures 6.2 and 6.4). On average, about 40% of the environmental damage was not related to combustion. A relatively large share was found to relate to the production of chemicals and basic metals (Figures 6.10–6.13).
• In general, the share of direct emissions related to combustion, in 2007, was also relatively large for material production (see Figure 6.4). This was true in particular for the production of basic metals and other mineral products (Figures 6.12 and 6.13). This result is indicative for the fact that material processing plays an important role in environmental damage related to both combustion and other use.
• The contribution of ‘other activities’ to environmental damage was considerably smaller in the manufacturing industry. In addition — and not surprisingly — most of the damage from those activities occurred outside this sector, even often abroad (Figure 6.6).
Government policies could give incentives to reduce the environmental damage related to the production and use of materials. Obvious candidates to reduce environmental damage are policies that cover multiple or all sectors. Such policies may have more impact than those focusing specifically on one sector or that are unidimensional. One set of cross-cutting instruments concerns pricing policies such as environmental taxation. Most countries have implemented environmental taxes, but for all countries, the monetary environmental damage was substantially greater than the revenues from those taxes, which implies that current prices of fossil fuels, natural resources and materials do not reflect the entire amount of environmental damage caused by the extraction, processing, use and consumption of natural resources.
In summarising our key findings, in the search for a proper pricing policy, we conclude:
- Environmental damage during the first phase of the production chain (the extraction of raw materials), was much smaller than that caused during the second phase. In particular, producing materials was most polluting. Not only the direct environmental damage, but also the damage upstream the production chain — as revealed in the production-chain analysis — was relatively great for material production. In most countries, the share of the material production industries in total gross value added was much smaller than their share in total monetary environmental damage.
- Note that, furthermore, the largest part of the environmental damage considered in this study was found to be related to air pollutants. This applies to both the production-based
PBL | 8
and production-chain analysis and implies also that most of the damage directly affected the population of the country from where these emissions were generated.
- Environmental damage from material production was not only related to combustion of fossil fuels, but also to a large extent to non-energy use of fuels and other industrial processes.
From these key findings of the comparative analysis we derive the following suggestions for policies that aim to internalise environmental damage in relation to circular economy considerations:
- Pricing of emissions is the first-best strategy for the circular economy to work properly. As much of the damage was found to be directly related to the use of fossil fuels, the most effective cross-cutting policy is likely to implement pricing of fossil fuel use over the entire base of its usage, i.e. both emissions from combustion and from non-energy use of fuels.1
- A substantial part of installations within the material production (phase 2a) as well as large production installations in phase 2b, is part of the EU Emissions Trading System (EU ETS). The EU ETS, however, only prices the direct emissions of greenhouse gases. Emissions of air pollutants, that according to our findings contribute to more than 50% of the environmental damage of these industries, are not explicitly priced by the EU ETS.
- Taxes on energy not only implicitly put a price on CO2 emissions, but also other emissions related to energy use. Most energy taxes, however, only apply to consumption-based fossil fuel use, such as heating from natural gas in households or motor fuels in cars. In general, energy taxes for energy-intensive industries are relatively low compared to energy taxes paid by households (Parry and Vollebergh, 2017).
- The scope of the pricing approach should go beyond the pricing of CO2 emissions from combustion only and also apply to emissions from the non-energy use of fuels and other industrial processes. Our findings show that, in 2007 and 2015, in particular four sectors were responsible for the main part of the environmental damage in the materials production sector: basic metals, other mineral materials, refinery and chemicals. A substantial part of the environmental damage caused by these industries came from energy use (combustion), but another part related to the non-energy use of fossil fuels, such as the use of natural gas in the production of ammonia and the use of coking coals for the production of iron and steel. Moreover, in these industries several industrial processes not related to fossil fuel use contributed to environmental damage, such as the production of non-ferrous metals and cement.
- The environmental damage from other activities than the combustion of fossil fuels also relates to other substances than greenhouse gases which fall beyond the scope of the EU ETS. The EU ETS, therefore, not necessarily contributes to reduced emissions of air pollutants. Whereas the resulting air quality improvements would lead to a direct improvement of the welfare of European citizens, the reduction of greenhouse gases primarily contributes to welfare improvements for world citizens in the long run. Therefore, an obvious candidate for better environmental pricing is to increase the stringency of policies that are directly or indirectly aiming at emissions related to air quality, such as emission standards on car exhausts and other installations as well as energy taxes.
- This study shows that, also in their extraction phase, fossil fuels were mainly responsible for the estimated damage. As explained before, crude oil and natural gas extraction were responsible for considerable damage in both Denmark and the United Kingdom and, to a lesser extent, also in the Netherlands. Although pricing of extraction of fossil fuels may be advisable from a theoretical perspective (i.e. tax an activity on the place where the damage occurs), it might not be from a practical perspective. More downstream pricing
1 Section 2.2 describes the various emissions related to the non-energy use of fuels.
PBL | 9
measures, such as EU ETS and energy taxes, also contribute to lower levels of upstream damage, as higher fuel prices reduce the demand for fossil fuels, and may more easily be enforced.
- In refineries and the chemical industry, for example, part of the carbon contained in fossil fuels remains stored in the products, such as in motor fuels, plastics and lubricants. Substances are emitted during the use of those products and their disposal by way of incineration (see also Section 2.2). Pricing the total input of fossil fuels in these industries based on their carbon content, therefore, would not only put a price on the direct emissions, but also on downstream emissions of CO2 (note that the major part of these emissions was not included in the analysis in Chapter 6). To avoid a double pricing of the emissions related to coke and refinery products, downstream CO2 emissions, for example, from fuel used in transportation and from plastic waste incineration, should not be priced again, in this case. Emissions of other substances, however, may still justify pricing downstream emissions.
- Our estimates of the environmental damage to the air from waste management are relatively low compared to the damage from the other phases in the material production chain. Pricing measures in the waste management phase should account properly for both the direct and indirect damage. Part of the CO2 emissions might be exempted as long as this compensates for carbon captured from the atmosphere earlier in the production chain, which is true for biowaste in particular, but should not apply to damage caused by other substances. Also, the fossil-carbon part of the waste, such as plastics, should be priced as long as these products or materials were not taxed earlier in the production chain.
- Markets for basic materials and also for the manufacturing of products are, in general, global markets. Pricing of (the inputs of the) products in these markets, may have harmful impacts on the competitiveness of companies that produce these materials or products. Such negative impacts, however, can be mitigated by implementing pricing in a coalition of countries, for example in (a part of) the European Union (Parry and Vollebergh, 2017). Other ways of mitigating the impact on the competitiveness include introducing import tariffs on comparable materials or products from abroad or recycling environmental tax revenues by reducing corporate taxes or providing a subsidy on environmentally friendlier production processes (Vollebergh et al., 2019). In any case, a gradually increasing pricing level may be more efficient as it stimulates innovations and the switch to cleaner production processes. Note that the current EU ETS price is substantially lower than the environmental price for greenhouse gases as used in this study (57 euros per tonne CO2).
PBL | 10
1 Introduction The ever-stronger use of natural resources and its impact has triggered a wide interest in what is called a circular economy these days. The focus of a circular economy is a reduction in the use of natural resources and the production of waste, i.e. a smaller uptake of resources and less waste at the end of the life cycle of physical goods and services. Apart from concerns over the strategic role and availability of resources in the international arena, natural resource use also has many environmental impacts. For instance, the use of raw materials has serious consequences for climate change through greenhouse gas emissions, and for air pollution through emissions of, for example, nitrogen oxides, sulphur dioxide and particulate matter, with a harmful impact on human health and ecosystems. Also, biodiversity losses are closely linked to the use of materials, varying from direct reduction in natural areas because of land use for extraction to quality deterioration of ecosystems through pollution of water and soil.
The reduction in environmental impacts because of the use of raw materials is one of the main objectives behind the transition to a circular economy. What is usually less clear however, is which materials cause what and how much damage in the chain from extraction to waste. To help policy makers to identify the environmental effectiveness of policies aimed at improving the circular economy we studied the relationship between the use of raw materials and the overall monetary damage of environmental pressure in the chain from extraction to waste for the Dutch economy (Vollebergh et al., 2017). The use of monetary estimates not only enables direct comparisons of overall damage from many different emissions related to specific production and consumption processes, but also to identify their relevance from a narrow economic perspective measured by their overall value added or value of production. Accordingly, the analysis not only shows where the main damage occurred in the overall production chain of the economy from extraction to waste, but also helps to identify the main sectors responsible for this damage. Note, however, that the focus both in their as well as this study is – due to data limitations – on the environmental damage related to emissions to the atmosphere.
From this earlier study about the relationship between the production and use of materials and environmental impacts, we know that, for the Dutch economy, a large environmental impact measured in monetary terms arises from the production of materials, such as steel, plastics and fertiliser, in heavy industries (Vollebergh et al., 2017). However, production of these materials takes place in industries that operate internationally. Unilateral policy measures therefore affect the competitiveness of these industries. One way to prevent the negative effect on competitiveness is to form a coalition of countries to take such policy measures jointly, for instance with some neighbouring countries (Ministerie van Infrastructuur en Waterstaat 2019). For that purpose, it is useful to gain insight into the differences and similarities between these countries both as far as their environmental damage is concerned and how this damage is associated with the production and use of materials. Therefore, this study focusses on those European countries that either are an important player or an important competitor for the Netherlands in the markets for specific materials and products, or have the intention to develop policy measures to reduce the use of raw materials. After consulting the Ministry of Infrastructure and Water Management, the following EU countries were selected for comparison with the Netherlands in this study: Austria, Belgium, Denmark, Germany, France and the United Kingdom.
In order to obtain a useful comparative overview of the environmental impact at different phases of the production and use of materials across the seven countries we used two different types of analysis. First, we employed a production-based perspective to gain insight into how the countries differ in terms of their economic structure and its associated environmental pressure and environmental damage. This perspective provides data on relevant economic variables, such as value added and production value as well as the
PBL | 11
monetary environmental damage estimates caused by the direct emissions using data from the environmental accounts. Apart from an overall picture per country we also analysed the production sectors that are related to the extraction of raw materials, the production of basic materials and semi-finished and finished products, and the final phase of the materials cycle, waste management. When possible and considered useful, we also present developments over time by showing results for both the years 2008 and 2015. Note that our focus is on the different phases in the production and consumption chain of materials.
Second, we also investigated the emissions and damage caused by material extraction and production from a production-chain perspective. The production-chain analysis considers the environmental pressures and damage over the production chains of materials or products. Hence, this approach shows both the direct and the indirect impacts in production chains, including those abroad. Moreover, the database used for this approach allowed us to make a distinction between emissions related to fuel combustion and emissions related to other activities. Both distinctions are important when considering effective and efficient policy measures.
The next chapter (Chapter 2) discusses the relationships between natural resources, economic activities and the environment, and explains the two perspectives in more detail. Chapter 3 explains the methodology we used to obtain a useful comparative overview of countries using environmental accounting measures based on the environmental impact of emissions, in relation to the flow of materials from extraction to waste, throughout the economy. In particular, it explains in more detail how we calculated the monetary damage caused by environmental pressures, for the two perspectives. Chapter 4 compares the seven EU countries with respect to their economic sector structure and the overall monetary damage caused by the environmental impacts related to emissions of greenhouse gases and air pollutants. Chapter 5 presents our results from the production-based perspective and shows how the environmental damage is related to the economic activities in various sectors relevant for the material flows within the economies. Subsequently, Chapter 6 presents results from the production-chain perspective. This shows the supply-chain-related damage caused by different materials and products. Chapter 7 discusses the differences and similarities of both approaches and some limitations. Finally, Chapter 8 provides a tentative discussion of possible implications of the outcomes for policy application, such as the option to tax emissions associated with production and use of materials.
PBL | 12
2 Materials, environmental damage and the circular economy In this chapter we describe in more detail how the extraction, production and use of materials is related to environmental pressure. For that purpose, it is essential to understand how resource use from extraction to disposal is linked to activities in the economic system. In particular, understanding what natural resources are used where for what purpose contributes strongly to better targeting of circular economy policies that aim to reduce resource flows and their associated environmental damage. The first section explains the usefulness of this identification procedure and the second section relates this procedure to our two approaches, i.e. the production-based and production-chain analysis.
2.1 Natural resource use in the economic system
In order to gain more insight in the transition to a circular economy, it is important to take the physical aspects of the production processes into account. All resource units used for consumption pass through a number of phases, namely those of resource extraction, resource processing into materials and usable semi-finished products and finished products and services, followed by the end use (including repairs and reuse via the second-hand market) and the final phase where they end up as waste (Figure 2.1). Each of these phases also creates a waste flow.
Figure 2.1
Moreover, in many cases natural resource use at a certain point involves environmental pollution. The distinction of the various phases is useful to identify where environmental damage of natural resource use is caused precisely in the chain from extraction to disposal and how large this damage is relative to the economic importance of the sectors causing it. Subsequently we subdivided Phase 2 in this study into two sub-phases, i.e. the processing of raw materials into usable materials (Phase 2a) and the processing of materials in semi-finished and finished products (Phase 2b).2
2 Due to composed product groups and sectors in the classifications in the data sources used, the allocation to Phase 2a or Phase 2b is not always obvious. Appendix A.1 presents the allocation applied in this study.
PBL | 13
The materials used in production processes can only originate from two sources: either they have been newly extracted from nature (the ‘primary flow’), or they have been recovered from material or are reused from product parts in the waste flows of products produced earlier (the ‘secondary flow’). Proponents of a more circular economy argue that current market economies do not lead to sufficient levels of recycling and reuse, which is why they aim to reduce primary resource consumption in order to reduce the impacts on the environment. This involves the important question where and how environmental damage is related to the chain from extraction to disposal. After all, the production and disposal of each and every product causes environmental damage that leads to a decrease in the quality of that environment (e.g. air pollution and surface water flooding due to climate change). Without government intervention, production processes use the environment ‘for free’, in addition to the natural resources they apply. As long as polluters do not pay the full cost to society, i.e. pay for the externalities to which they contribute, natural resource use is likely to be well above the social optimal levels.
2.2 The production-based and production-chain perspective
Environmental damage from material use is the consequence of harmful emissions and polluting substances. These harmful emissions are created during and after the use of natural resources and materials, in combination with energy use. In this study, we focused on environmental damage from the use of metal and other minerals (e.g. metal ore and rock) and fossil fuels as material input.
As explained in the introduction we employed two different methods to obtain a more detailed comparative overview of the environmental impact at the different phases of material use across the seven countries. The production-based analysis (Chapters 4 and 5) uses the systemwide inventory of emissions and their allocation to the economic sectors from which they are emitted (e.g. mining, agriculture, manufacturing, services, households and waste management). Accordingly, this approach covers all economic sectors including households and can be used to account for the overall environmental damage and relate this to the national economic accounts (Muller et al., 2011).
Apart from this overall estimate for the national economy, we also used the inventory of emissions to determine which material-related sectors are responsible for which amount of direct environmental damage within a country. Moreover, the environmental damage was linked to circular economy aspects of resource flows by allocating the relevant sectors to the different phases of material flows as described in the previous section. Accordingly, we identified the main sectors responsible for environmental damage related to materials.
The production-chain analysis (Chapter 6) takes account of environmental damage over the whole upstream production chain. For every material or product used at a specific stage in the chain from extraction to the end product, the analysis computes the environmental damage for all stages in its production chain up to the moment that the product is sold (‘from cradle to gate’). Hence, contrary to the production-based approach, the production-chain approach not only takes into account emissions within the relevant sector and country, but also emissions in other sectors and emissions in other countries as far as they are part of the production chain of the material or product. An additional advantage for this study is that the database used for the production-chain analysis also allowed for a distinction between the environmental damage that is related to energy use and damage that is caused by other activities including, for instance, the non-energy use of fossil fuels or industrial processes. More specific, the environmental damage from energy use is related to the combustion of fossil fuels and biomass. Non-energy use of fuels relates to (i) the use of fossil fuels as feedstocks, such as naphtha in the petrochemical industry and natural gas in the production of ammonia; (ii) the use of fossil fuels as reductant, such as coke used in the production of
PBL | 14
iron and steel; and (iii) the use of non-energy products derived from fuels, such as lubricants and bitumen. Emissions from the use of fuels as feedstocks in some cases directly occur during the production process (e.g. CO2 emissions during the production of ammonia), but in other cases part of the carbon contained in the feedstock remains largely stored in the products (e.g. plastics) and emissions do not occur until these products are disposed of by incineration (EEA, 2018). For non-energy products derived from fossil fuels, substantial emissions occur during their recovery and during disposal by incineration, while for the use of fuels as reductant generally only a very small amount of carbon remains fixed in the products for a longer time and the larger part of the carbon is emitted as CO2 during the reduction process (EEA, 2018). In addition, several industrial processes not related to fossil fuel use also contribute to environmental damage, such as the production of non-ferrous metals and cement.
In addition, globalisation has strongly intertwined natural resource and material chains. In each of the phases discussed above, there are large global import and export flows. Resources are often extracted in developing countries, while processing occurs mainly in the developed countries. In various stages of processing — from the primary industry to semi-finished products and end products — there is also a large amount of trade. This implies that it is not easy to obtain a clear insight into the processing and consumption of resources, materials and end products, per country. Special modelling approaches are necessary to obtain reliable estimates of those linkages in the entire production chain. Such an analysis requires a model that follows physical material uses from extraction to its final application in end products. The model we used for this analysis will be explained in more detail in the next chapter.
2.3 Scope of the study
For this study, we compared the environmental damage caused by material use and production in seven countries, namely Austria, Belgium, Denmark, Germany, France, the Netherlands and the United Kingdom. Therefore, we were primarily interested in the overall production chain of physical products that links natural resources, materials, semi-finished and finished products, and, finally, the waste product.
In this study, we focused on the environmental damage related to emissions to the atmosphere. Because of limitations to the available data, environmental damage related to emissions to water were included only for a limited number of substances and environmental damage related to emissions to soil were not taken into account. Moreover, possible environmental damage of substances for which the environmental impacts are largely unknown, such as microplastics, was not included in this study. Also, damage from other environmental externalities, such as noise and land use, and non-environmental externalities, such as congestion, was not included in the estimated environmental damage. Drissen and Vollebergh (2018a) find that, for emissions of 171 substances to air, water and soil in the Netherlands, in 2015, 98% of their total environmental damage was related to the emissions of greenhouse gases and air pollutants included in our calculations.
As a starting point, Chapter 4 presents the overall environmental damage in each of the seven countries included in our analysis, including also environmental damage related to the production of food, electricity, transport and other services, as well as environmental damage directly caused by households. This overall picture allows us to put the role of the specific sectors engaged in material processing into perspective. In the more detailed comparisons in Chapters 5 and 6, however, materials that are only used for food and feed were not taken into account. Biomass as a resource for materials and consumer products, such as wood for timber and furniture or cotton for clothes, was included in this study, but the use of biomass for food or energy was not.
PBL | 15
In Chapter 5, we present environmental damage for 21 sectors that are the most relevant for the transition to a circular economy, because their production processes are mainly responsible for the extraction, production and use of materials. Following the phases presented in 2.1, these sectors include two raw material extraction sectors (phase 1), seven material producing sectors (basic industry, phase 2a) and twelve sectors using materials in the manufacturing of finished products and in construction (phase 2b). In addition, Chapter 5 also presents the environmental damage related to the processing of waste (phase 4).
In Chapter 6, we present the environmental damage using the production-chain approach for 25 materials and products from these sectors, including five raw materials (phase 1), eight materials (phase 2a) and twelve semi-finished and finished products (phase 2b). In contrast to Vollebergh et al. (2017) we did not include environmental damage from waste management because of data reliability issues.3 Note also that sectors that only produce biomass for food and feed were not taken into account (see also Appendix A). Finally, the use of other natural resources, such as land, fresh water or biodiversity, was not included in this study even if they were used in the production chain of physical products.
3 The product based estimates for the damage from waste management, however, indicate that damage of emissions to the atmosphere is relatively small compared to the processing stages (see Chapter 4).
PBL | 16
3 Environmental accounting for material production and use Following Vollebergh et al. (2017), we aim to identify the environmental effectiveness of policies aimed at improving the transition to a circular economy by studying the relationship between the use of raw materials and the overall value of the damage caused by environmental pressure in the entire production chain from extraction to waste. This monetary environmental damage based on environmental accounting (see Muller et al., 2011) represents the direct loss of economic welfare caused by the environmental pressure due to these economic activities. Such a descriptive analysis requires a lot of detailed information on the quantities of different resource flows and their interaction with other used resources such as fossil fuels and bioenergy in all four phases from extraction to disposal. Moreover, physical environmental damage must be quantified for each of these phases as well, and these quantities have to be transformed into monetary value estimates by using environmental prices.4 We explain these different steps in Section 3.2 and 3.3 respectively. We start with a short explanation of how monetary environmental damage estimates can be obtained.
3.1 Computing monetary environmental damage
The extraction and use of raw materials is associated with environmental pressures, such as emissions to air, soil and water. These environmental pressures on their turn have impacts on biodiversity and nature in terms of biodiversity losses, but also on human health in terms of lost years of life. The valuation of such impacts (or physical damage) in monetary terms enables the comparison of impacts from emissions of different substances and makes it possible to calculate overall damage caused by economic activities or physical processes by adding environmental impacts from emissions of different substances.
Monetary environmental damage is calculated with environmental prices that represent the environmental damage per kilogram of emission for a certain substance in monetary terms. These environmental prices include the impacts on all impact categories, such as biodiversity and human health, and vary widely per substance. By calculating the monetary environmental damage per substance and aggregating over all substances emitted during the production of a product or in a sector, the total monetary environmental damage caused by such an economic activity can be calculated.
As explained in the previous chapter, we computed the monetary environmental damage (i) from the emissions from all industries and households, per country, from a production-based perspective; and (ii) from the emissions associated with the extraction of raw materials and the production of materials and products from a production-chain perspective. For the production-chain perspective all upstream production-chain-related contributions to the environmental impact were included and aggregated (‘cradle to gate’). Accordingly, both environmental accounting exercises produce monetary environmental damage estimates for each country or group of countries by simply multiplying the physical amount of emissions identified in each approach with country-specific environmental prices.
4 The environmental price of a substance, sometimes also referred to as a shadow price, represents the monetary value of the change in environmental quality due to the emission of the substance. As environmental quality is not traded directly in markets, these prices must be derived from studies on human preferences for avoiding the impacts of pollution (Muller et al., 2011; CE Delft, 2018). Section 3.3 further discusses the environmental prices used in this study.
PBL | 17
3.2 Physical environmental damage from the two perspectives
3.2.1 Environmental damage from a production-based perspective Environmental damage from the production-based perspective includes all environmental damage directly related to all activities from firms and households in a country. National environmental accounts usually report emissions that lead to the environmental damage from sectors and households from a production perspective. Information on the emissions within the countries that are analysed in this study, were taken from the Eurostat environmental accounts (Eurostat, 2019a). This data set presents environmental information broken down into 64 industries (classified by NACE Rev. 2) plus households (see Appendix A.1). The concepts and principles in the environmental accounts are the same as in national accounts that are residence-based including all activities from domestic firms and consumers, within or outside the borders of a country.5
In order to determine the environmental damage from emissions, all substances that were available in the Eurostat database were included in this study. The Eurostat environmental accounts only report on emissions to air (Eurostat, 2019b), including greenhouse gases and pollutants contributing to air pollution that are targeted in the National Emission Ceilings (NEC) Directive (Table 3.1).6 Note that, in accordance with the UNFCCC emission inventory guidelines, CO2 emissions from biomass were not included in the damage calculations. Environmental damage related to emissions of other substances, such as particulate matter from biomass combustion, were included (Eurostat, 2015).
For particulate matter we distinguished between two groups in this study: particulates smaller than 2.5 micrometres (PM2.5) and particulates with a size between 2.5 and 10 micrometres (PM2.5–10), because their impact on health, differs.7 We derived the latter group from the Eurostat data by subtracting the category PM2.5 (particulates smaller than 2.5 micrometres) from the category PM10 (particulates smaller than 10 micrometres). We compared emission data between the years 2008 and 2015 in the production-based analysis in order to assess developments in environmental pressures and impacts in this period. The year 2008 is the first year for which data are available from the Eurostat database for all seven countries in our analysis. Eurostat contains no air emission data on Austria, France and Germany for years before 2008.
Table 3.1 Substances included in the production-based and the production-chain perspectives
Air pollutants SO2, NOx, NH3, NMVOC, PM2.5, PM2.5–10
SO2, NOx, NH3, NMVOC, PM2.5, PM2.5–10
Other air pollutants CO CO, PAHs, PCBs, dioxin, benzene, heavy metals
Emissions to water - Nitrogen, Phosphorus a See Appendix B.1 for a complete list of substances. b The production-based analysis used data from the Eurostat environmental accounts. c The production-chain analysis used data from EXIOBASE 2.2.
5 Accordingly this study differs from Drissen and Vollebergh (2018a), who start from a territorial approach based on air emission inventories including all emissions inside Dutch borders, either caused by domestic companies or consumers or by foreign companies or consumers. 6 This also differs from Drissen and Vollebergh (2018a) who include substances emitted to soil and water as well. In their calculations, however, only two percent of the total monetary environmental damage relates to substances emitted to soil and water. 7 Note, that only PM2.5 is part of the NEC Directive.
PBL | 18
3.2.2 Environmental damage from a production-chain perspective To calculate the production-chain-related environmental damage of materials and products we used a multi-regional input-output (MRIO) model. Such an MRIO model not only takes the emission of environmental damaging substances that directly take place at extraction and production of raw materials and materials into account, but also indirect environmental pressures throughout the production chain both within and outside the country where the specific material or product is produced (see also Appendix B.2).
The MRIO approach used in this study is similar to the method used to calculate the environmental damage of raw materials and materials produced in the Netherlands in 2007 (Vollebergh et al., 2017) and is based on the method to calculate environmental footprints of industries (Wilting and Van Oorschot, 2017).8 In this study, only the upstream emissions that occur in the life cycle up to the moment that the product is sold were taken into account (‘from cradle to gate’). The production chain includes both a domestic part and a foreign part. The use of an MRIO model enabled a specification of the foreign part of the production chain by (a group of) countries where upstream production and emissions take place. This analysis is not only relevant for identifying the relative role of domestic pollution and how this is related to materials processing, but also for a correct valuation of the environmental damage (see Section 3.3).
The MRIO database used in this study is EXIOBASE, version 2.2, with data for the year 2007 (Wood et al., 2014). Although an updated version of EXIOBASE 2.2 became publicly available in 2018, i.e. version 3.4 with data for the period 1995–2011 (Stadler et al., 2018), we abstained from using this newer version. Initial analysis of the outcomes for 2007 from both EXIOBASE versions showed significant differences and we learned from a comparative analysis of both databases that the data in EXIOBASE2 correspond better to the official data from Eurostat than the data in EXIOBASE3 (De Koning, 2018). Our choice to use EXIOBASE2 implies that the environmental damage from the production-chain approach was calculated for a year that is relatively far back in time, i.e. 2007.
In EXIOBASE the required information for the determination of the environmental damage from a production-chain perspective, is available for products but also for sectors ("industries"). Products and sectors to a large extent correspond, but there are differences related to by-products. For example, the product information for the material aluminium contains all aluminium regardless of the production sector of origin. This not only includes the environmental damage related to aluminium produced by the sector aluminium production (i.e. firms that primarily produce aluminium), but also the environmental damage related to the aluminium produced as by-product in other sectors. The industry information of the sector aluminium contains the environmental damage caused by all firms that have as their main product aluminium, including environmental damage related to various by-products these firms may produce. The environmental damage related to aluminium produced as a by-product is not assigned to the industry aluminium, but to the sectors based on the firms’ main product. Following Vollebergh et al. (2017), here we focused on the product classification.
Although EXIOBASE distinguishes 200 different products and product groups (goods and services), we used a more aggregated allocation to 59 product groups because this level of aggregation matches reasonably well with the sector classification in the analysis from a production-based perspective. Therefore, we aggregated the 200 product groups in EXIOBASE to these 59 product groups.9
8 Wilting and Van Oorschot (2017) systematically investigated the supply-chain-related impacts of Dutch economic sectors on worldwide biodiversity by exploring the contribution of direct and indirect suppliers to these impacts. 9 Note that Vollebergh et al. (2017) used the differentiation in 200 product groups.
PBL | 19
Both direct and indirect emissions for our production chain estimates were based on EXIOBASE2. Since in the production-chain analysis we included all substances for which EXIOBASE2 includes data on emissions to air and water, more substances were included in this approach compared to the production-based perspective (see Table 3.1).10 Like the production-based perspective, we accounted for differences between particulate matter smaller than 2.5 micrometres and with a size between 2.5 and 10 micrometres by subtracting the category PM2.5 in EXIOBASE from the category PM10. For some products, for instance air transport in several countries, this difference was negative. For those cases, the emission of PM2.5–10 was set to zero.
Furthermore, EXIOBASE distinguishes emissions from fossil fuel combustion and emissions from other sources. This distinction is relevant when identifying possible policy measures and their effectiveness with respect to reducing environmental damage related to materials (see Chapter 8).
3.3 Monetary environmental damage estimates
The next step in the valuation exercise to obtain monetary environmental damage estimates from overall direct emissions (for the production-based perspective) or more specifically the use of certain materials and products (for the production-chain perspective) is to multiply the amount of physical substances emitted with an environmental price (see also Vollebergh et al., 2017; Drissen and Vollebergh, 2018a). In that study we were able to link emissions to air, water and soil of over 100 substances to environmental prices that are representative for current knowledge on the aggregated environmental impacts on health and biodiversity.
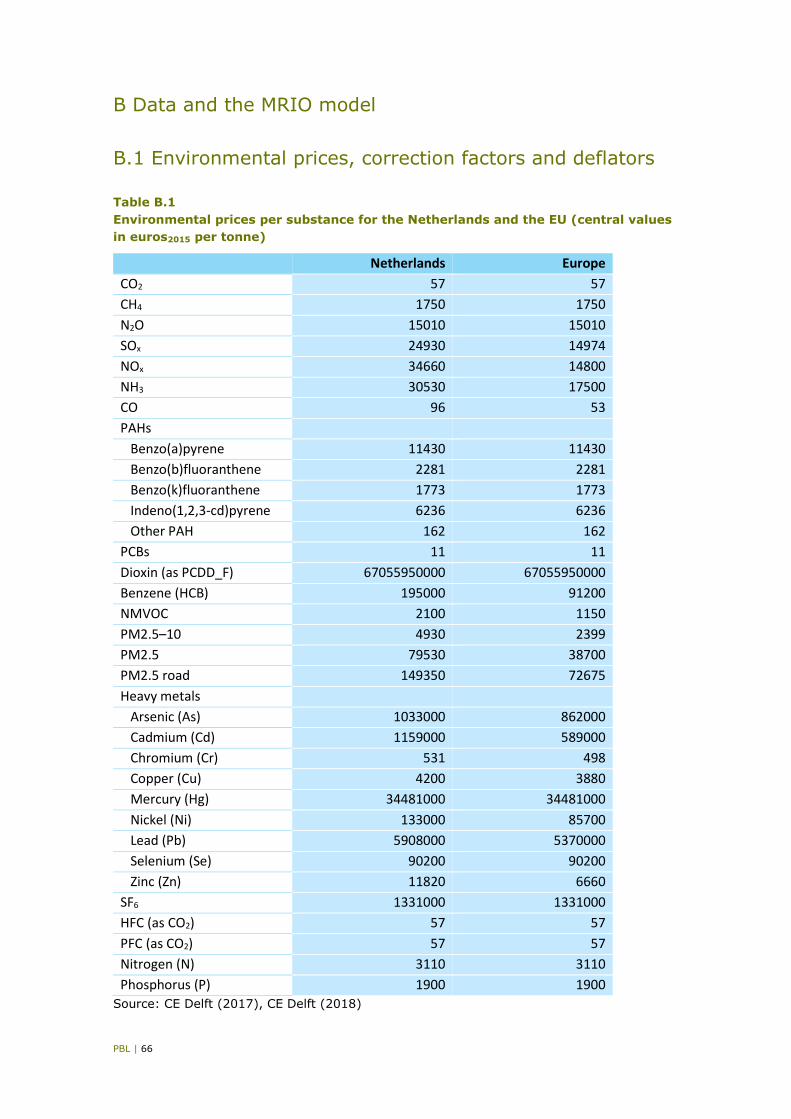
For the substances included in this study, we used environmental prices expressed in euros per kilogram emission of a certain substance from the Handbooks on Environmental Prices with data for the Netherlands (CE Delft, 2017) and the EU28 (CE Delft, 2018). All environmental prices are in euros from 2015 and representative for the Dutch and EU28 situation, respectively. These environmental prices reflect the value of the damage of one additional kilogram emission of the specific substance. Table 3.2 summarises the environmental prices for the most important emissions used in our accounting exercise.11 The Handbooks include both central values for environmental prices as well as upper and lower values. In this study we only used the central values which provide the best possible estimate of the environmental damage given the uncertainties of the valuation of the impacts at the end points such as health and biodiversity.12
The environmental prices for greenhouse gases as presented by CE Delft do not directly reflect the so-called social cost of carbon, i.e. the estimated climate change damage. Instead these prices are based on a so-called prevention cost approach, i.e. an estimate of the abatement cost necessary to obtain a certain predefined climate goal such as the current EU target of a 40% reduction in greenhouse gas emissions. More ambitious targets, such as limiting global warming to 2 °C or less, would imply higher abatement cost and therefore a higher environmental price, in this approach (CE Delft, 2018; Aalbers et al., 2016)). Note that environmental prices are subject to large uncertainties and would require a sensitivity analysis. However, this was beyond the scope of this study.13
10 This difference also partly explains the differences between both approaches (see also Chapter 7) 11 Appendix B.1 presents the full list of environmental prices included in this study. See also CE Delft (2018) for an explanation of their approach. 12 The upper and lower values provide some insight into the uncertainty range of the central values of the environmental prices. For a comprehensive uncertainty analysis of the environmental damage caused by the production and use of materials in the Netherlands, see Vollebergh et al. (2017). 13 Drissen and Vollebergh (2018a) provide an extensive sensitivity analysis for the environmental prices they use to calculate the environmental damage in the Netherlands.
PBL | 20
Table 3.2 Environmental prices for some key substances for the Netherlands and the EU (central values in euros2015 per tonne)
NL EU
CO2 57 57
CH4 1,750 1,750
SOx 24,930 14,974
NOx 34,660 14,800
NH3 30,530 17,500
PM2.5–10 4,930 2,399
PM2.5 79,530 38,700
PM2.5 road 149,350 72,675
Nitrogen (N) to water 3,110 3,110
Phosphorus (P) to water 1,900 1,900
Source: CE Delft (2017), CE Delft (2018)
The prices for greenhouse gas emissions were assumed to be similar for all countries and regions. The reason is that climate change caused by greenhouse gases is a global problem irrespective of where the greenhouse gases are emitted. Therefore, the environmental damage caused by greenhouse gases and their valuation are not location-specific.
For non-greenhouse gases, we considered the higher Dutch environmental prices more representative for the countries neighbouring on the Netherlands than the EU28 environmental prices. Dutch environmental prices are higher than the EU28 average because both the physical damage from emissions and the income levels are higher. Physical damage to health and biodiversity differs between countries due to differences in population density, age profile, biodiversity present in a country and atmospheric conditions. The valuation of environmental damage differs because higher income levels justify higher prices.14 Both physical damage and income levels are relatively great for the Netherlands (CE Delft, 2017), which implies that the environmental prices are higher for the Netherlands than for the EU28 (CE Delft, 2018).
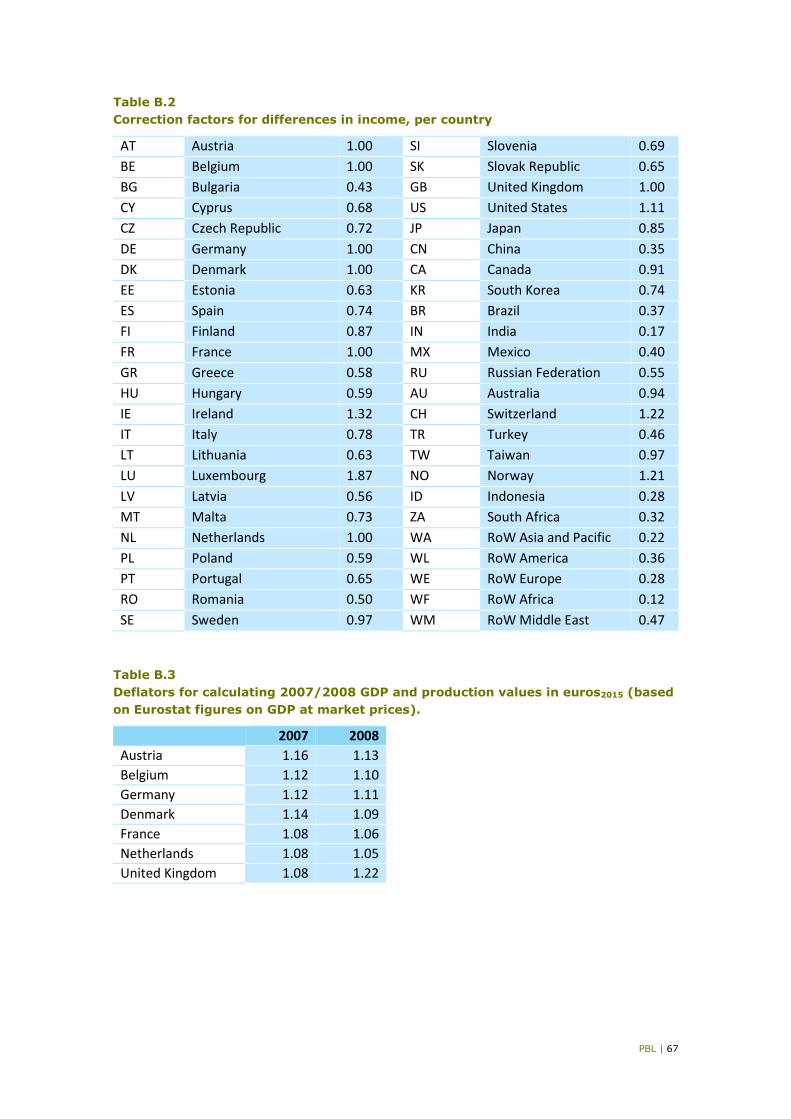
For all countries, other than the seven countries compared in this study, the EU28 environmental prices used for the damage by non-greenhouse gas emissions were corrected for income differences to account for differences in the valuation of environmental damage. The correction for income differences was based on GDP (Gross Domestic Product) per capita in international dollars PPP-corrected (World Bank (2017)) and accounted for an income elasticity of 0.85. We did not correct environmental prices for income changes over time, which implies that the same environmental prices were used for 2007, 2008 and 2015. Table B.2 (Appendix B) presents the correction factors for each country and group of countries distinguished in EXIOBASE.
For the finer fraction of particulate matter (PM2.5), the Handbooks on Environmental Prices (CE Delft 2017, 2018) distinguish between emissions from road traffic and emissions from other activities. The environmental damage per kilogram of PM2.5 emissions from road
14 Countries with higher income levels usually value the same physical damage at higher levels due to the higher income elasticity of environmental goods relative to other products. The Dutch and EU28 Handbooks of CE Delft did not assign a positive income elasticity of environmental quality as it was argued that such a phenomenon would be compensated by the diminishing marginal utility of an additional life year at the end of a person’s life. This is in line with the recommendations of the Werkgroep Discontovoet (Ministry of Finance, 2015). While this may be valid when considering the impacts of income elasticities over time, they may be less valuable for intercountry comparisons. Therefore, in this study we follow CE Delft and Infras (2019), on the valuation of EU28 transport emissions, who loosen the assumption of an income elasticity of zero and calculate values using an income elasticity of 0.85.
PBL | 21
traffic is much greater than the damage from PM2.5 emissions from other sectors. Therefore, we used a higher environmental price for the particulate matter emissions from road traffic (PM2.5, combustion), which is a weighted average of the environmental prices for urban and rural areas, as presented in the Handbooks of CE Delft.
Emissions from international shipping mainly occur on open sea where no people live. This reduces the damage of emissions on human health significantly, in particular for emissions of substances that mainly lead to health damage on a local scale (particulate matter, CO, PAHs, PCBs, dioxin, benzene and heavy metals). We assumed for these substances that emissions from sea shipping on the open sea have no impacts on health for emissions beyond 1000 kilometres offshore and a reduced impact of, say, 50% between 500 and 1000 kilometres offshore.15 Because approximately 80% of the emissions from international shipping occurs beyond 1000 kilometres offshore and 10% occurs between 500 and 1000 kilometres offshore, effectively only 15% of these substances emitted by international shipping lead to direct health damage (Vollebergh et al., 2017). For substances that travel long distances (which is the case for SO2, NOx, NH3 and NMVOC), we assumed that all emissions lead to environmental damage. Because greenhouse gases contribute to global warming irrespective of where they are emitted, these were also fully included.
It should be noted that the results from the production-chain analysis for the Netherlands are slightly different from those in Vollebergh et al. (2017), because of the use of newly published environmental prices for the EU28 and a different allocation of environmental prices to countries outside the Netherlands. Only the environmental damage caused by greenhouse gas emissions is similar, since the same environmental prices were applied for greenhouse gas emissions in all countries.
Vollebergh et al. (2017) show results for total production in the Netherlands, but, here, we also present relative damage per unit of production or product value (in euros) to enable comparisons between countries. All prices, GDP and production values are in 2015 prices (Table B.3 presents deflators used for the 2008–2015 period).
15 A similar reasoning as for international shipping can be applied to international aviation. There are, however, indications that the environmental damage of emissions of aviation on high levels is much higher than on ground level. Therefore, we assumed that all emissions of aviation lead to environmental damages.
PBL | 22
4 Comparison of seven countries This chapter compares the seven EU countries with respect to their economic sector structure and the monetary damage of the environmental impacts related to emissions of greenhouse gases and air pollutants. The focus is on the environmental damage caused by direct emissions in the sectors related to the production and use of materials. We present results for both 2008 and 2015 if useful in order to also observe recent changes over time.
4.1 Economic sector structure
Figure 4.1 shows the per-capita gross value added of various sectors in the seven countries in 2015. Together, the sum of gross value added in all sectors is equal to the gross domestic product (GDP)16 of a country. Of the seven countries compared in this study, Denmark had the highest level of GDP per capita, about 40% higher than per-capita GDP in France, which was the lowest level. Services was the dominant sector in all the countries by creating almost two thirds of total GDP in Austria and Germany and up to three quarters in the United Kingdom.
Countries with large shares of services had small shares of manufacturing and vice versa. Manufacturing in the United Kingdom had only a share of 10% of GDP, while in Germany and Austria, the manufacturing sector contributed 23% and 19% to value added in 2015. For this report, relevant sectors are manufacturing, other material sectors (including forestry, mining and construction), and waste management. Section 4.3 discusses the role of the material-related sectors in the total economy, for each of the seven countries.
In most countries, GDP per capita remained about the same in the period between 2008 and 2015, except for Germany where it increased by 8%. The share of services slightly increased in all countries.
Figure 4.1
16 GDP in basic prices.
PBL | 23
4.2 Environmental damage in the seven countries, from a production-based perspective
Figure 4.2 shows the computed monetary environmental damage from economic activities in the seven countries calculated based on the emission data provided by the Environmental Accounts (from Eurostat). This overall damage estimate therefore represents the direct environmental damage of all activities of households and businesses of a country according to the residential principle, both domestically and abroad.
While the services sector in all countries was the dominant sector in terms of gross value added, the environmental damage by this sector was relatively small. The agricultural and transportation sector significantly contributed to the environmental damage, while these sectors were relatively small in terms of gross value added. The large amount of per-capita environmental damage caused by the transport sector in Denmark is striking. This accounted for about 80% of the total environmental damage from Denmark and was mainly related to water transport. Indeed, Denmark has a number of large companies that transport containers by sea and their worldwide emissions were included in these computations.
Belgium had the largest amount of per-capita environmental damage caused by manufacturing and Denmark the smallest. In France, Austria and Belgium, the per-capita environmental damage caused by the energy sector was relatively small because of their relatively large share of nuclear energy (France and Belgium) and renewable energy sources (Austria) in electricity production. Per-capita environmental damage caused by households, which includes private transportation, was least in the Netherlands, while households in Denmark caused the most damage per capita.17 The environmental damage caused by the material-related sectors analysed in this study varies considerably across the countries and will be discussed in more detail in Section 4.3.
Figure 4.2
As Figure 4.3 shows, Denmark is also the country with the strongest decrease in the per-capita environmental damage between 2008 and 2015, with a decrease of approximately 30%. In Germany, the decrease in per-capita environmental damage was the weakest, with
17 In most countries, more than half of the environmental damage by households results from private transportation, mainly due to PM2.5 emissions.
PBL | 24
approximately 14%. This is not surprising since Germany is the only country where per-capita gross value added increased substantially between 2008 and 2015. Both in Denmark and the United Kingdom, the environmental damage by the energy sector decreased considerably, between 2008 and 2015, with policies supporting cleaner power production. For all countries, except Austria and Germany, per-capita environmental damage caused by the manufacturing sector was reduced more than the total environmental damage of those countries between 2008 and 2015.
Another important observation from the data is that, in all countries, the environmental damage from air-polluting substances was much greater than from greenhouse gases. Denmark had the largest share, with 90% (Figure 4.3), which is not surprising because of the large share of water transport in Denmark and the related SO2 emissions. Denmark also had relatively large per-capita environmental damage from greenhouse gas emissions.
Figure 4.3
The reduction in damage of air-polluting substances was more substantial than the reduction in damage of greenhouse gases between 2008 and 2015. The reduction in per-capita CO2 emissions between 2008 and 2015 ranged from less than 10% in the Netherlands and Germany to approximately 25% in Denmark and the United Kingdom. The reduction in per-capita air pollution ranged from 15% in Germany to almost 30% in Denmark, the Netherlands and the United Kingdom. These differences reveal that reductions in emissions of CO2 and air pollutants not necessarily go together, which relates to EU air quality policies that focus on reducing emissions of air pollutants by end-of-pipe measures (Bollen and Brink, 2014).
4.3 The role of the material-related sectors in the seven economies
Our report focuses on sectors responsible for material extraction, production and use, including forestry, mining, manufacturing of materials and finished products, and waste disposal. It distinguishes 2 raw material extraction sectors (phase 1), 7 material producing sectors (phase 2a), 12 sectors using materials in the manufacturing of finished products and
PBL | 25
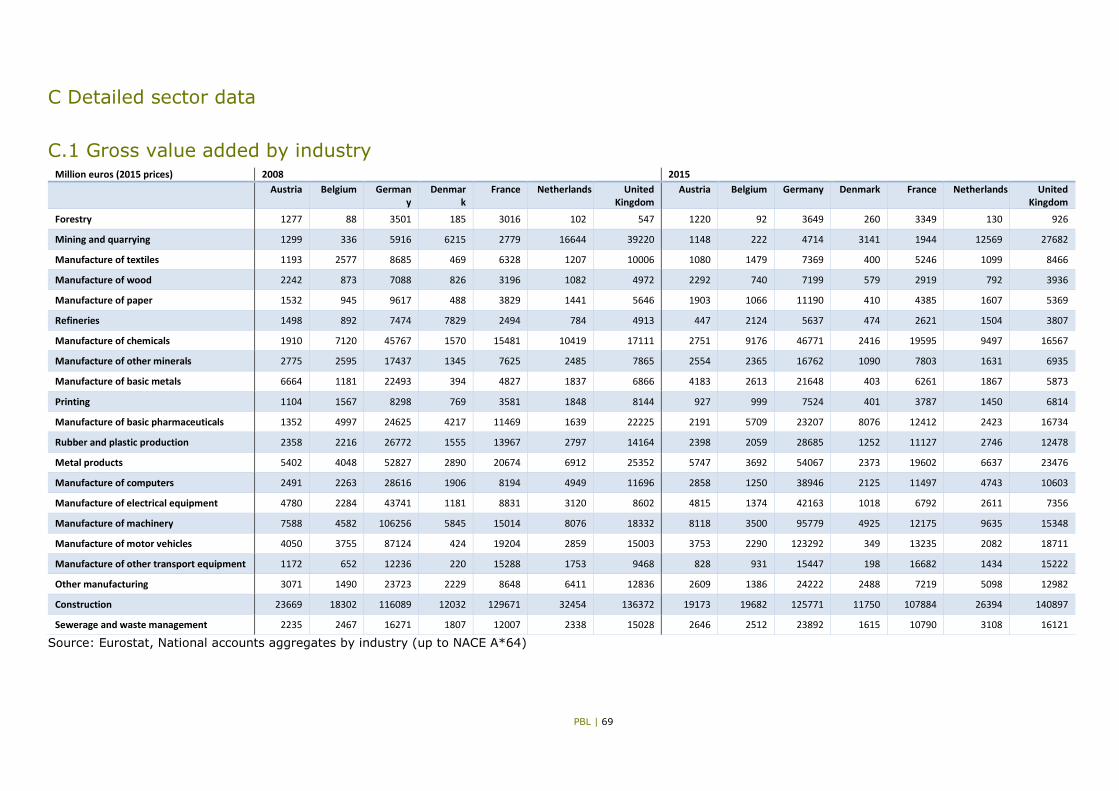
in construction (phase 2b), and 1 sector on processing of waste (phase 4).18 Figure 4.4 presents the shares of gross value added and monetary environmental damage of these sectors per phase in the national totals. Together, their shares in total gross value added varied from 14% (in France) up to 25% (in Germany), in 2015.
The shares of the material-related sectors (in phases 1, 2a, 2b and 4) in total environmental damage due to production ranged from 3% in Denmark to 39% in Belgium (Figure 4.3.b). Except for Germany and Denmark, the share in environmental damage of these sectors exceeded the share in gross value added. The small share in Denmark is due to the high value for the environmental damage related to water transport, as described above. While in all countries, sectors in phase 2b contributed more to total gross value added than those in phases 1, 2a and 4 together, the environmental damage was mainly caused by the sectors that produce materials (phase 2a).
Figure 4.4
18 See Appendix A.1 for the sectors included.
PBL | 26
5 Production-based analysis This chapter presents the environmental damage caused by direct emissions in the sectors related to the production and use of materials from a production-based perspective. The monetary environmental damage from the production-based perspective was calculated based on the emission data provided by the Environmental Accounts (from Eurostat). First, we present the environmental damage in phases 1, 2a, 2b and 4 in the seven countries. Next, we analyse the differences in the environmental efficiency of the various sectors between countries and finally we present a more detailed analysis of the four most polluting industries. We present the environmental damage for 2015, but also analyse changes over time by comparing 2008 and 2015 data and have a closer look at the contribution of different types of pollution.
5.1 Overview of the environmental damage caused by material-related industries and waste
This section presents environmental damage estimates by industries related to raw material extraction (phase 1), material production (phase 2a), manufacturing of products using materials and construction (phase 2b) and waste management (phase 4). The section ends with an analysis of the contribution of greenhouse gases and air pollutants to the environmental damage in the different phases and changes therein between 2008 and 2015. We compare the damage in this section in environmental damage in euros per euro of GDP rather than population since our focus here is on production activities.19
Figure 5.1
19 We used GDP in market prices in all production-based and production-chain calculations of the material-related sectors and products. Presenting the environmental damage per capita will give a similar picture, although there are small differences because of differences in GDP per capita between countries.
PBL | 27
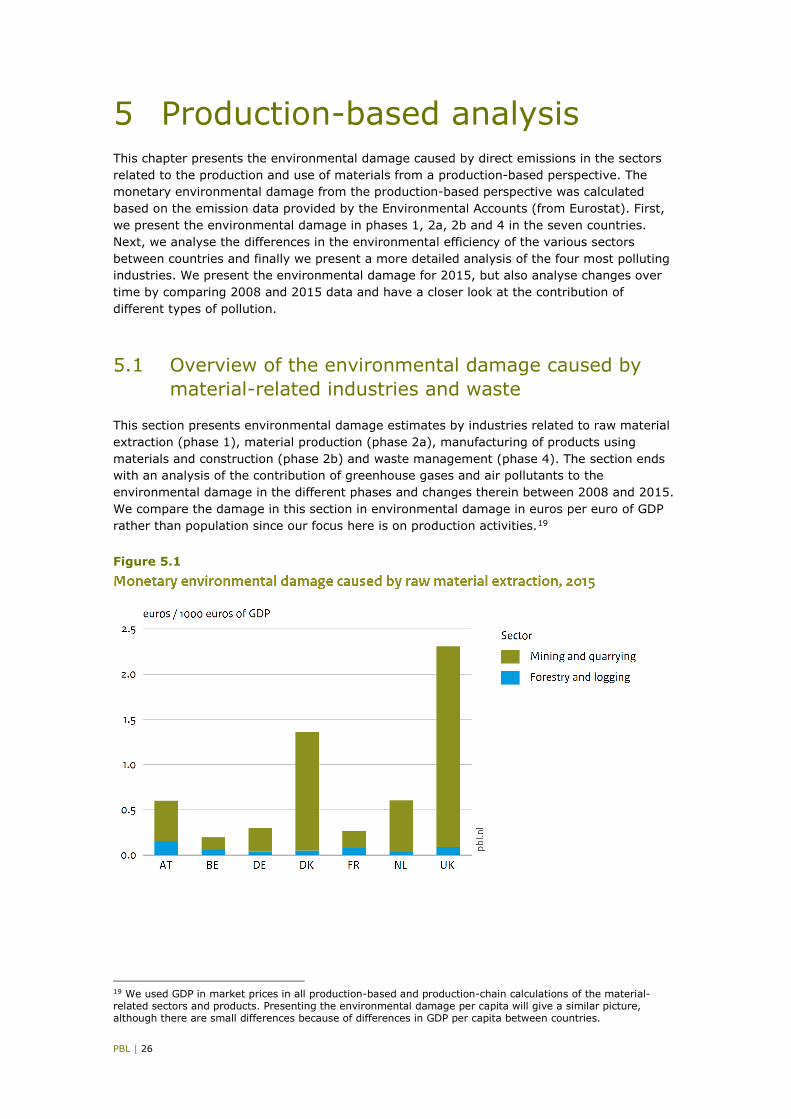
5.1.1 Environmental damage caused by raw material extraction (Phase 1) The Eurostat database distinguishes only two industries that extract raw materials: forestry and mining. The latter showed the largest environmental damage related to GDP per country (Figure 5.1). In all countries, the mining sector had a larger environmental damage than forestry. The differences between countries in the damage per euro of GDP were large, since the mining sector is very diverse with mining of ores, solid fuels, crude oil and natural gas that all have their specific environmental pressures and externalities. In the United Kingdom and Denmark, the two countries with the largest environmental damage per euro of GDP caused by raw material extraction, the mining sector was dominated by the extraction of crude petroleum and, to a lesser extent, by the extraction of natural gas.
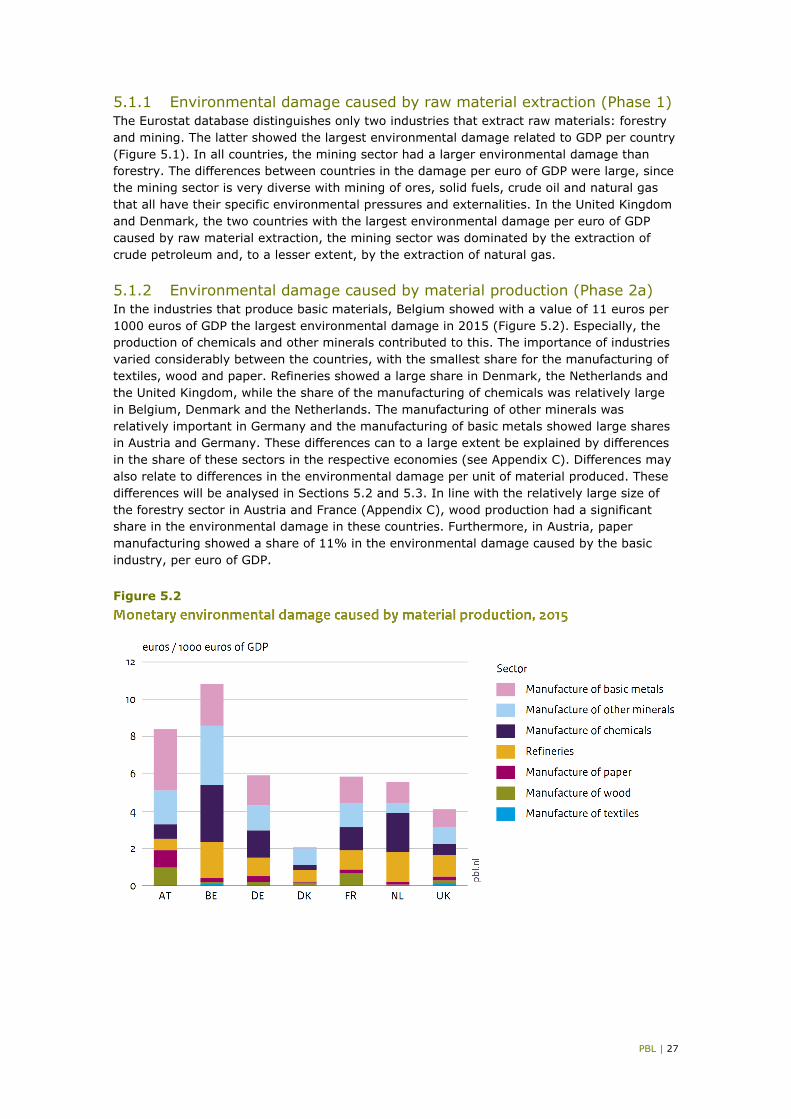
5.1.2 Environmental damage caused by material production (Phase 2a) In the industries that produce basic materials, Belgium showed with a value of 11 euros per 1000 euros of GDP the largest environmental damage in 2015 (Figure 5.2). Especially, the production of chemicals and other minerals contributed to this. The importance of industries varied considerably between the countries, with the smallest share for the manufacturing of textiles, wood and paper. Refineries showed a large share in Denmark, the Netherlands and the United Kingdom, while the share of the manufacturing of chemicals was relatively large in Belgium, Denmark and the Netherlands. The manufacturing of other minerals was relatively important in Germany and the manufacturing of basic metals showed large shares in Austria and Germany. These differences can to a large extent be explained by differences in the share of these sectors in the respective economies (see Appendix C). Differences may also relate to differences in the environmental damage per unit of material produced. These differences will be analysed in Sections 5.2 and 5.3. In line with the relatively large size of the forestry sector in Austria and France (Appendix C), wood production had a significant share in the environmental damage in these countries. Furthermore, in Austria, paper manufacturing showed a share of 11% in the environmental damage caused by the basic industry, per euro of GDP.
Figure 5.2
PBL | 28
Figure 5.3
5.1.3 Environmental damage caused by manufacturing of products (Phase 2b)
In all seven countries considered here, the environmental damage caused by the industry using materials in the manufacturing of products and construction (Phase 2b) was much less than that in the basic industry producing these materials (Phase 2a) (Figures 5.2 and 5.3). The environmental damage per euro of GDP for construction (which largely relates to emissions from non-road mobile machinery) was greater than the total environmental damage related to all manufacturing of products, combined, in each of the countries, with the exception of Germany. Germany and the United Kingdom showed the largest amount of environmental damage per euro of GDP from product manufacturing. In Germany, the manufacturing of motor vehicles, which is also an important sector in economic terms (Appendix C.1), substantially contributes to the environmental damage of the industries manufacturing products, with a share of almost 30%. In the United Kingdom, manufacturing of rubber and plastic products was the main contributor, also with a share of almost 30%. Manufacturing of metal products and machinery are other industries that showed relatively large shares in the environmental damage in most countries, in 2015.
5.1.4 Environmental damage in phases 1, 2a and 2b by type of pollutants, over time
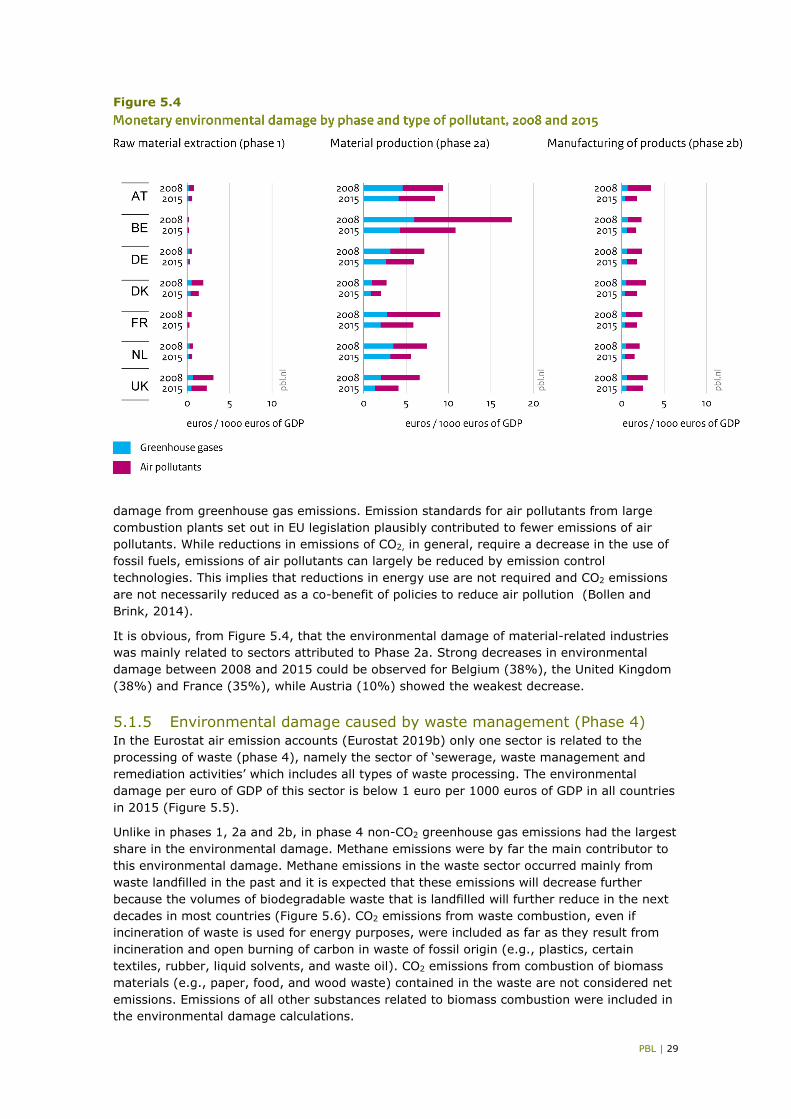
Figure 5.4 presents the environmental damage caused by the sectors in the phases 1, 2a and 2b in 2015 as presented in the previous sections and extends this by the environmental damage calculated for 2008. Moreover, the figure distinguishes into various types of pollutants contributing to the environmental damage.
In all countries, except for the Netherlands, the share of air pollutants in the environmental damage was above 50% in each of these phases. Only in Phase 2a, in 2015 more than half of the environmental damage in the Netherlands (57%) related to emissions of greenhouse gases. Greenhouse-gas-related environmental damage in these phases was mainly related to emissions of CO2.
In all countries, the environmental damage per euro of GDP decreased, between 2008 and 2015. In this period, the environmental damage from air pollutants decreased faster than the
PBL | 29
Figure 5.4
damage from greenhouse gas emissions. Emission standards for air pollutants from large combustion plants set out in EU legislation plausibly contributed to fewer emissions of air pollutants. While reductions in emissions of CO2, in general, require a decrease in the use of fossil fuels, emissions of air pollutants can largely be reduced by emission control technologies. This implies that reductions in energy use are not required and CO2 emissions are not necessarily reduced as a co-benefit of policies to reduce air pollution (Bollen and Brink, 2014).
It is obvious, from Figure 5.4, that the environmental damage of material-related industries was mainly related to sectors attributed to Phase 2a. Strong decreases in environmental damage between 2008 and 2015 could be observed for Belgium (38%), the United Kingdom (38%) and France (35%), while Austria (10%) showed the weakest decrease.
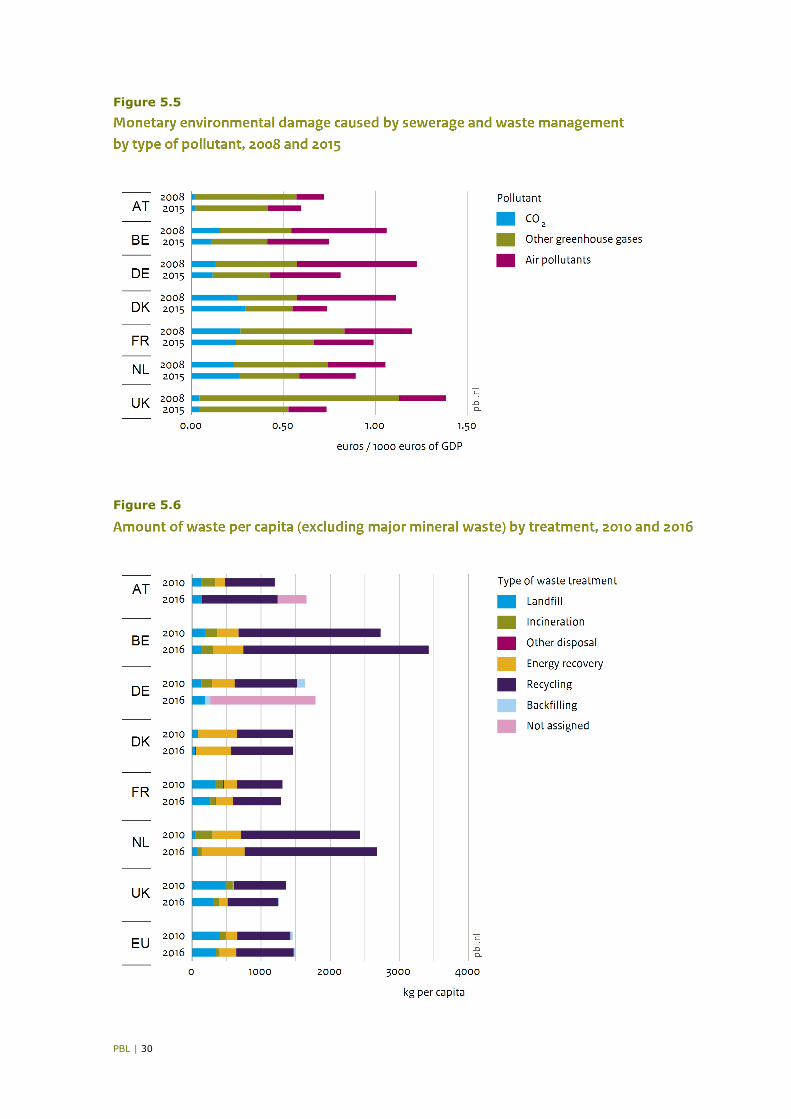
5.1.5 Environmental damage caused by waste management (Phase 4) In the Eurostat air emission accounts (Eurostat 2019b) only one sector is related to the processing of waste (phase 4), namely the sector of ‘sewerage, waste management and remediation activities’ which includes all types of waste processing. The environmental damage per euro of GDP of this sector is below 1 euro per 1000 euros of GDP in all countries in 2015 (Figure 5.5).
Unlike in phases 1, 2a and 2b, in phase 4 non-CO2 greenhouse gas emissions had the largest share in the environmental damage. Methane emissions were by far the main contributor to this environmental damage. Methane emissions in the waste sector occurred mainly from waste landfilled in the past and it is expected that these emissions will decrease further because the volumes of biodegradable waste that is landfilled will further reduce in the next decades in most countries (Figure 5.6). CO2 emissions from waste combustion, even if incineration of waste is used for energy purposes, were included as far as they result from incineration and open burning of carbon in waste of fossil origin (e.g., plastics, certain textiles, rubber, liquid solvents, and waste oil). CO2 emissions from combustion of biomass materials (e.g., paper, food, and wood waste) contained in the waste are not considered net emissions. Emissions of all other substances related to biomass combustion were included in the environmental damage calculations.
PBL | 30
Figure 5.5
Figure 5.6
PBL | 31
5.2 Environmental efficiency of material-related industries
The differences in monetary environmental damage between countries have various causes. Not only differences in the production volume of a sector, but also differences in the environmental efficiency of production, that is the environmental damage per unit of material or product, can explain variations in environmental damage. This section presents a comparison between the countries of the environmental damage of the production in sectors that produce and use materials, including raw material extraction, material production and industries manufacturing products. The environmental efficiency is here defined as the monetary environmental damage per euro of production value of the industry itself using the production value as a measure, although an imperfect proxy, for the physical material content of production directly contributing to the environmental damage.
5.2.1 Overview of environmental damage, per industry Here we compare the environmental efficiency between countries for the 21 material-related sectors in 2015. For every sector, a range for the environmental efficiency is given from the country with the least environmental damage per unit of production to the country with the most environmental damage. The mark in this range gives the median environmental efficiency for this sector.
Figure 5.7
PBL | 32
The results reveal a large variation in the environmental efficiency of sectors that in Section 5.1 were found to contribute significantly to total environmental damage in most countries: raw material extraction and the basic industry (Figure 5.7). The three sectors with the greatest median monetary environmental damage per unit of production are mining and quarrying, the production of basic metals and the production of other minerals (mainly construction materials such as cement, bricks and glass). In mining and quarrying, the United Kingdom was an upward outlier, with a relatively large amount of monetary damage per unit production (0.12 euros/euro) whereas the Netherlands was a downward outlier (0.02 euros/euro). The difference can be explained by differences in the emission of air pollutants from the extraction of crude oil and natural gas. According to Eurostat data, emission levels of air pollutants per unit of energy extracted were much lower in the Netherlands than in the United Kingdom. The environmental damage caused by other material extraction and material production sectors was significantly less. Refineries, which had a significant share in total environmental damage in most countries (Figure 5.2), also had a large range in environmental efficiency. The United Kingdom was here an upward outlier with a relatively large amount of monetary environmental damage per unit production. The sectors of textiles, wood products and paper products, which had a relatively small share in the total environmental damage caused by material production (Figure 5.2) were also the sectors with the least environmental damage per euro of production value. The large range found for the environmental efficiency in the manufacturing of wood and wood products was due to a very high value in France as compared to other countries (0.13 euros/euro).
The amount of environmental damage per euro of production value in the manufacturing of products was relatively small, compared to that caused by raw material extraction and material production. Among the sectors using materials, the environmental damage per unit of production was the largest for construction with a value of 0.01 euros per euro production value. The median environmental damage for other industries manufacturing products per euro production value was more than a factor two smaller. The variation between countries was also relatively small for these sectors, except for the manufacturing of rubber and plastic products. Especially the United Kingdom showed a large value (0.03 euros/euro) compared to other countries for this sector.
5.2.2 Overall performance per country The overall performance of countries in raw material extraction and production and use of materials was determined by dividing total environmental damage per phase with total production per phase. For every country the average performance on environmental efficiency was determined for three phases extraction, material production, manufacturing of products and waste management. In the Netherlands, raw material extraction (phase 1) caused a relatively small amount of environmental damage per unit of production value, compared to that in the other countries (Figure 5.8). The United Kingdom had a relatively large amount of environmental damage, in this phase. Note, however, that this was based on only two industries, since the Eurostat database distinguishes only two sectors of raw material extraction (forestry and mining and quarrying). In the Netherlands extraction of natural gas dominated this phase. Denmark, the Netherlands and Germany showed minor environmental damage per unit of production value for material production. The environmental damage from manufacturing of products was relatively small compared to the other phases. The United Kingdom showed largest environmental damage per euro of production for industries manufacturing products (phase 2b). Per euro of production value, the environmental damage from waste management in France was more than twice as large as the damage from waste management in Austria and Germany.
PBL | 33
Figure 5.8
5.3 Environmental damage from material production
This section presents a more detailed analysis of the environmental damage caused by the four material-producing sectors with the largest amount of monetary environmental damage per unit of production (Figure 5.7): basic metals, other mineral materials, refineries and chemicals.
UK coke and refined petroleum product manufacturing had by far the largest amount of damage per unit of production, in 2008. France and the Netherlands were able to considerably reduce the environmental damage per unit of production caused by this sector,
Figure 5.9
PBL | 34
Figure 5.10
between 2008 and 2015, due to a decrease in the environmental damage attributable to air pollutants. In Austria, Germany and Denmark, environmental damage caused by this sector increased, significantly, over the same period.
The environmental damage per unit of production associated with the production of basic chemicals and chemical products (excluding pharmaceuticals and rubber and plastic products) was much smaller in Denmark than in the other countries considered in this study. In Denmark the share of basic chemistry, which was much more polluting per unit of
Figure 5.11
PBL | 35
Figure 5.12
production than the processing chemistry, was relatively small. Austria and the United Kingdom and, to a lesser extent also France, showed large increases in the environmental efficiency of the chemical industry, which was expressed by the relatively strong reduction in the monetary environmental damage per unit of production, between 2008 and 2015. As a result, the amount of monetary environmental damage per unit of production in the chemical industry of Austria and the United Kingdom, in 2015, was smaller than in Belgium, Germany and the Netherlands, while it was substantially larger in 2008.
What is most striking in Figure 5.11 is that the amount of environmental damage per unit of production from the manufacturing of basic metals was by far the smallest in Denmark. This is not surprising, as Denmark is the only country that produces steel only using electric arc furnaces, which is a production process with relatively few direct emissions due to the use of electricity. Moreover, it should be noted that this sector is very small in Denmark and in 2015 contributed less than 0.1% to the total environmental damage in Denmark (Figure 5.2). While, in Belgium and the United Kingdom, the environmental damage per unit of product from the basic metal sector decreased by approximately one third, in Austria, Germany, France and the Netherlands, the environmental damage per unit of production increased, between 2008 and 2015. In these four countries, the damage from CO2 emissions increased. In Austria, Germany and France, the environmental damage from air pollutants increased, as well.
In all countries, except for the Netherlands, the environmental efficiency of the production of non-metallic mineral materials decreased between 2008 and 2015. Reductions in the United Kingdom and Belgium were even more than 20%, which was mainly due to reductions in the emission of air pollutants.
PBL | 36
6 Production-chain analysis Whereas the previous chapter presented the environmental damage caused by direct emissions in the sectors themselves (from a production-based perspective), this chapter presents the results of the production-chain analysis. The production-chain analysis is an extension of the production-based perspective and includes the environmental damage along the production chains of materials and products. In this study, only the upstream environmental damage, occurring in the production chain up to the point that a material or product is sold (cradle to gate), was taken into account. The production-chain-related damage was calculated with an MRIO model with data from EXIOBASE2 at the level of 59 products (goods and services) for 2007 (see Section 3.2.2). The use of an MRIO model provides insights into the contributions of countries and regions in the production-chain-related environmental damage of materials and products.
This chapter presents the results of the environmental damage calculations per material and product per country. The production-chain analysis has been performed for 25 products, which can be further divided in five raw materials, eight materials and twelve finished products (see Appendix A.1). These products largely correspond with the 21 sectors that Sections 5.1 and 5.2 focus on. In order to be able to explain the most important differences between environmental damage of materials and products in the seven countries, we selected the main outcomes for this report.
6.1 Overview of the environmental damage caused along the production-chain of materials and products
First the environmental damage from a production-chain perspective is presented for extracted raw materials (phase 1), manufactured materials (phase 2a) and manufactured finished products (phase 2b) in the seven countries, where the damage is presented for each phase separately. The results are presented in unit of GDP, as in Section 5.1. The production-chain perspective also implies that environmental damage related to other activities, such as power production and transportation, is also taken into account as far as these activities contribute to the relevant production chain. Part of this environmental damage will occur within the country, but another part will occur abroad. Note that the production-chain-related damage caused by products (phase 2b), therefore, also includes damage from raw materials (phase 1) and materials (phase 2a) that occur upstream in the production chain. For instance, basic metals are input to the manufacturing of vehicles, so the environmental damage of the production chain of motor vehicles (phase 2b) also includes the environmental damage caused by the production of basic metals (phase 2a). As these basic metals are produced from raw materials such as iron ore and bauxite, the environmental damage during the extraction of these raw materials (phase 1) is also included in the environmental damage of the production chain of motor vehicles. Also, other activities contribute to the environmental damage, such as the transport of the raw materials and the basic metals and the production of electricity that is used at different stages in the production chain. If the raw materials and basic metals are imported, the related environmental damage occurs predominantly abroad.
In presenting the results for the various phases in this section, the environmental damage caused by the production chains of several materials or products within each phase are added up. This might lead to some double counting in case production chains partially overlap. For instance, the production chains of rubber and plastic products and motor vehicles (both in phase 2b) in a country may overlap when the rubber and plastic products produced in this country are used in manufacturing the vehicles in this same country. Further
PBL | 37
analysis would be required to identify the relevance of this possible overlap, but it is expected that this double counting within the same phase is relatively small.
Since EXIOBASE distinguishes emissions from combustion processes and other activities, we present monetary environmental damage for both types of sources. This is relevant when considering effective and efficient policy measures (Chapter 8). Furthermore, we show the environmental damage from the extraction and manufacturing of the materials and products themselves (direct), the environmental damage from the production of other goods and services in the same country (upstream) and the environmental damage from the production of other goods and services in other countries (upstream in other countries). The direct environmental damage is largely comparable with the production-based environmental damage from sectors as presented in Chapter 5, although the use of different data sources (i.e. Eurostat for the production-based analysis, EXIOBASE for the production-chain analysis) may lead to differences in the related environmental damage as calculated (for a discussion of the differences, see Chapter 7).
6.1.1 Environmental damage from extracted raw materials Just like the production-based perspective (5.1), the production-chain perspective also shows large differences between the countries, with respect to the environmental damage per euro of GDP caused by extracted raw materials (phase 1). With a value of over 7 euros per 1000 euros of GDP, the extraction of raw materials in Denmark caused the greatest amount of damage, 93% of which from the extraction of crude oil and natural gas (Figure 6.1). In the United Kingdom and the Netherlands, oil and natural gas also had a large share in environmental damage, compared to other extracted products. Emission levels of air pollutants from the extraction of oil and natural gas were relatively high in the United Kingdom and Denmark, compared to those in the Netherlands (see also Section 5.2.1). Moreover, in Denmark, the share of this sector in the total economy was larger than in the United Kingdom (see Appendix C). Only in Germany, solid energy carriers (mainly coal and lignite) had a substantial share (53%) in the environmental damage of raw materials. In Austria and France, on the other hand, the environmental impact from timber was relatively large because the share of this sector in GDP was also somewhat larger than in other countries (Appendix C.1). According to the EXIOBASE data, substantial amounts of metal ores were extracted only in Austria and Belgium. Other mining products, including materials
Figure 6.1
PBL | 38
Figure 6.2
such as stone and sand, substantially contributed to the environmental damage by raw materials in Belgium, France and Austria.
Emissions from combustion had a relatively small share in the environmental damage of raw materials extracted in Germany, while methane emissions from coal and lignite mining and handling had a large share. Eighty-six per cent of the monetary damage from raw materials extracted in Denmark was related to direct emissions from the extraction itself, two thirds from combustion processes (CO2 and NOx) and one third from other processes (CH4 and NMVOC). In the other countries, except for the Netherlands, the share of direct emissions direct from extraction itself was also above 50%. The Netherlands shows the largest share of environmental damage from combustion upstream in the own country in the production-chain-related damage of raw materials (39%). The production-chain-related environmental damage abroad was between 5% for Denmark and 39% for Belgium. Chapter 7 discusses how the direct environmental damage related to raw materials was production-based, as calculated in Chapter 5.
6.1.2 Environmental damage from manufactured materials In all countries, the amount of environmental damage from manufactured materials was much larger than from extracted raw materials, not only because we included the environmental damage upstream in the production chains, such as raw material extraction, but also because of the large amount of direct environmental damage from the manufacturing of the materials, as also described in Chapter 5. The amount of environmental damage caused by manufactured materials per unit of GDP was the largest in Belgium (almost 70 euros per 1000 euros of GDP) (Figure 6.3). In all countries, chemical products, basic metals and refinery products had the largest contribution to the environmental damage caused by material production. The contribution of other mineral materials (with cement as an important contributor) to the environmental damage of materials was between 4% and 16%. Austria had a relatively large amount of damage from wood and paper, which is in line with the relatively extensive direct environmental damage in the wood and paper manufacturing sectors, as described in the previous chapter (Figure 5.2), and also with the relatively large amount environmental damage from forestry. The damage from Austrian forestry products (Figure 6.1) partly belongs to the production chain of wood and paper materials.
PBL | 39
Figure 6.3
Around 30% to 50% of environmental damage is caused directly by the manufacturing of the materials itself, the other 50% to 70% occurs in upstream production activities (Figure 6.4). The environmental damage caused by material production that takes place abroad lies between 25% (Denmark) and 60% (the Netherlands). The production chains of refined and chemical products manufactured in the Netherlands show relatively substantial environmental damage from upstream processes abroad, compared to the production chains of such products manufactured in other countries (Sections 6.3.1 and 6.3.2).
6.1.3 Environmental damage from manufactured products Finally, this section presents the environmental damage from manufactured products and construction work (phase 2b) in the seven countries (Figure 6.5). Construction work had a large share in environmental damage in most countries except for Germany. In Germany,
Figure 6.4
PBL | 40
Figure 6.5
Denmark and the United Kingdom, the amount of production-chain-related monetary environmental damage from products was larger than the damage from the production of materials (phase 2a). In the other four countries, the damage from materials was greater. Germany, with a damage of slightly more than 40 euros per 1000 euros of GDP, had the greatest monetary environmental damage per euro of GDP. This is due to the importance of the product manufacturing industries in the German economy, such as the automotive and machinery industry.
Figure 6.6 shows that in all countries the environmental damage directly caused by the production of the manufactured products was only a small part of the total production-chain-related environmental damage. The share of the direct environmental damage was largest in Belgium (13%), which means that a large part of the environmental damage occurred upstream in the production chains. This is different from raw and basic materials, where the share of the direct environmental damage was larger than 50%. For all countries, more than
Figure 6.6
PBL | 41
50% of the environmental damage related to the production of manufactured products occurred abroad. This is due to the interdependence of countries as a result of international trade. Semi-finished and finished products are traded in large amounts.20
6.1.4 Environmental damage in phases 1, 2a and 2b by type of pollutants For products in all of the phases 1, 2a and 2b, the monetary environmental damage on average consisted of slightly more than 50% of damage caused by air pollutants (Figure 6.7). The rest of the monetary environmental damage was mainly due to the emission of greenhouse gases. The contribution of other pollutants (see Table 3.1) was negligible for the environmental damage from raw materials in most countries and on average about 6% for products in phases 2a and 2b.
With slightly more than 50%, the Netherlands had a relatively large share of greenhouse gas emissions in the monetary environmental damage from materials. Main contributions were CO2 emissions from abroad, caused by upstream combustion processes of chemicals and refined oil products and methane emissions from non-combustion processes in the upstream production chain of refined oil products. In all other countries, air pollutants, such as NOx and SO2, formed the largest share.
For all countries, the share of air pollutants in the production-chain-related environmental damage was larger than that of greenhouse gas emissions. This damage was mainly caused by emissions from combustion.
Figure 6.7
20 A complete analysis of the degree of globalisation of the production chains of materials and products was beyond the scope of this study. We elaborated on this in Section 6.4 for basic metals and motor vehicles as an example.
PBL | 42
6.2 Comparison of environmental damage, per material
The differences in monetary environmental damage between countries have various causes. One of these causes is the environmental efficiency of production, which is here defined as the environmental damage per unit of product value. In this section the environmental efficiency of materials and products is compared between the seven countries. As we have seen in Chapter 5, differences in the environmental efficiency between countries not only result from differences in production technologies used, but may also relate to variations within the product categories we distinguish. Moreover, environmental efficiency is not the only reason that the monetary environmental damage per euro of GDP differs between countries. Section 6.2.3 presents some other explanations for differences in environmental damage between countries.
6.2.1 Overview of environmental damage, per material A comparison of the environmental efficiencies of materials and products between countries, should preferably be done by comparing the production-chain-related environmental damage (cradle to gate) per physical unit (e.g. kilogram) of materials and products. Unfortunately, this was not possible, since the calculations with the MRIO model are based on monetary data. Therefore, the monetary environmental damage per euro of product value was used for the comparison between countries.
Figure 6.8
PBL | 43
The monetary environmental damage from raw materials was found to vary significantly between the countries (Figure 6.8). Especially, the extraction of fossil fuels showed a large variability, where Germany and Denmark had the largest amount of damage, per euro of raw material. The materials with the largest amount of environmental damage per unit of product (based on the median of seven countries) were all basic materials: refined products, chemical products, basic metals and other mineral materials. The amount of environmental damage caused by other materials was significantly smaller. Wood products and textiles were the manufactured materials with the smallest amount of environmental damage per unit of material (euros) among the materials distinguished in this study. Austria had the largest amount of environmental damage per euro for pulp and paper products.
The amount of environmental damage per euro of product was relatively small, compared to that of raw materials and basic materials. In general, the costs of materials and therefore the related environmental damage formed only a small part of the total production costs of these products (Wilting and Hanemaaijer 2014). The products with the largest environmental damage per unit of product were found to be the manufactured metal products and motor vehicles, although the differences with other products are small. The range of values across countries for other transport equipment was larger than for the other products. Especially Belgium showed a large damage (0.19 euros/euro) compared to other countries for other transport equipment. Wearing apparel, office machinery and computers, and radio and television devices were among all countries the products with the least environmental damage per unit of product.
6.2.2 Performance per country As in Chapter 5 for the production-based perspective, the performance of countries for the production-chain perspective was determined by dividing total environmental damage and production per phase. Figure 6.9 shows the performance for the three production phases raw material extraction (phase 1), manufacturing of materials (phase 2a) and manufacturing of products (phase 2b). For phase 1, the Netherlands revealed a relatively small amount of environmental damage per unit of raw material, compared to that in the other countries, which was also found in the production-based calculations (Figure 5.8). In contrast, the Netherlands had the most environmental damage in phase 2a, the production of materials. Of all seven countries, the United Kingdom showed the least environmental damage from the production of materials. In all countries, the environmental damage per euro of product for
Figure 6.9
PBL | 44
manufactured products was substantially less than for the production of materials, and differences between countries were relatively small. France and the United Kingdom showed the least environmental damage per euro of product, for manufactured products.
6.2.3 Explanation of differences in production-chain damage per country In Section 6.2.2, an overview of the production-chain-related environmental damage in the various phases of the economy was presented. There are many possible explanations for the differences in these environmental damage between countries: 21
- Differences in environmental prices per country: Although the same environmental prices were used for the seven countries in this comparative analysis, the environmental prices for other regions and countries differ due to a correction for income. Different contributions to the material supply chains from various regions may result in different amounts of material-related damage between countries.
- Differences in value per kilogram of material: All environmental damage was related to production in monetary values.
- Differences in product mix: The materials and product groups are not homogeneous. For instance, the category basic metals includes iron and steel, aluminium, copper, and so on. All these metals differ in their value but also in the energy use and environmental pressures caused during their production.
- Differences in production efficiency: For example, primary versus secondary production, differences in emission intensities or energy use per material.
- Differences in production chains: Production chains may differ in contributions from different direct and indirect suppliers (at different locations) that have differences in their production processes.
Specific techniques, such as structural decomposition analysis, are required to further decompose the damage and specify explanations of the differences, per material. However, this is not included in this research.
6.3 Detailed results for four groups of basic materials
For all materials and products more detailed results of the production-chain-related environmental pressures and damage are available including breakdowns in substance, location of emission and so on. This section presents detailed results for the four materials with the largest environmental damage per euro of product value: coke and refinery products, chemicals and chemical products, basic metals and other mineral products. These materials correspond to the sectors discussed in Section 5.3.
6.3.1 Coke and refinery products Coke and refinery products consist of a broad range of products produced from solid and liquid fuels, such as coke, gasoline, kerosene, LPG, naphtha and bitumen. Belgium and the Netherlands had a relatively large production of these products (Appendix C.2) and hence also a relatively large amount of environmental damage (per unit of GDP; Figure 6.3). Despite the large number of products included in this product group, the differences in the aggregate production-chain-related environmental damage between countries were remarkably small (Figure 6.10). The United Kingdom and France had the least damage per euro of product value. The environmental damage in the other countries was about 0.25 euros per euro of product value.
21 We refer to Chapter 7 for an explanation of the differences between the outcomes from the production-based and the production-chain approaches.
PBL | 45
Figure 6.10
The share of greenhouse gases in environmental damage, for most countries, was between 40% and 55%, with the Netherlands as an upward outlier (67%). Only a small part of the environmental damage was caused by direct emissions from the production of coke and refinery products, with a share varying from 17% in the Netherlands to up to 50% in Denmark. For most countries, the main share of the environmental damage from coke and refinery products was caused upstream in the production chain and for the Netherlands, Belgium, Austria and France this upstream damage came for more than 50% from abroad. About 80% of the environmental damage caused by Dutch refined products took place in other countries, as the Dutch refineries process crude oil that mostly is imported from abroad.
6.3.2 Chemicals and chemical products Chemicals and chemical products are a diverse group that includes plastics, fertiliser and biofuels. As they do for coke and refinery products, Belgium and the Netherlands also produced a relatively large amount of these products (Appendix C.2) resulting in relatively large environmental damage (per unit of GDP; Figure 6.3). In the United Kingdom, the amount of environmental damage per unit of GDP was the smallest compared to that in the other countries, partly due to the small amount of environmental damage per euro of product (Figure 6.11). The production of chemicals and chemical products in Austria, the Netherlands and Denmark caused the largest amount of environmental damage per euro of product value, with a relatively large share of damage caused by non-combustion processes related to the production itself. The main contributors to this damage were emissions of SO2 and NOx.
PBL | 46
Figure 6.11
The share of greenhouse gases in the environmental damage was for most countries not larger than 40%, which implies that the environmental damage from chemicals was mainly caused by air pollutants. Between one third and two thirds of the environmental damage from chemicals and chemical products was caused by production itself, which implies that between one third and two thirds of that damage was upstream damage. For all countries, less than 55% of the damage caused by chemicals and chemical products was caused outside the country.
6.3.3 Basic metals Basic metals include the production of all types of metals, such as iron and steel, aluminium, copper, lead, zinc, tin and precious metals. Belgium, Austria and Germany had a relatively large share of basic metals in the total environmental damage of their economies (Figure 6.3). These countries, together with the Netherlands and the United Kingdom, had the greatest damage per euro of product (Figure 6.12). The environmental damage of basic metals per unit of product value of basic metals produced in France and Denmark was considerably less than in the other countries.
For all countries the majority of the environmental damage was caused by air pollutants and for most countries a significant part of the environmental damage took place abroad. A large part of the environmental damage during production in the Netherlands and to a lesser extent in Austria occurred from emissions caused by other (non-combustion) processes in its own sector, which were mainly emissions of CO2 and Pb (lead).
PBL | 47
Figure 6.12
6.3.4 Other mineral products The other (non-metallic) mineral products mainly consist of construction materials, such as cement, plaster, bricks, tiles and glass. Compared to the other basic materials, the contribution of the other mineral products to the total environmental damage was relatively small in the countries analysed (Figure 6.3). In Germany and Denmark, other mineral products had the largest amount of production-chain-related environmental damage per euro of product value. In these two countries, the damage ratio was almost 80% higher than in the Netherlands (Figure 6.13). Especially air pollutants (SO2, NOx and PM2.5) caused more damage in Germany and Denmark.
The shares of production-chain-related damage in most countries were caused by emissions within their own country with a downwards outlier for the Netherlands (61%).
PBL | 48
Figure 6.13
6.4 Globalisation of supply chains
Production of materials and products is not limited to environmental damage on a national level, but also leads to environmental damage in other countries. The previous section already showed that the supply chains of products had a larger share of their environmental damage abroad than the supply chains of raw and basic materials. This section shows how the seven countries are intertwined with their production chains of basic metals and motor vehicles.
Between a third and a half of the environmental damage caused by the production of basic metals took place during the production itself (Figure 6.14). For all countries, between 30% and 40% of the production-chain-related environmental damage from basic metals took place in countries outside Europe. About 10% of the environmental damage from basic metals in Austria and Denmark took place in Germany.
PBL | 49
Figure 6.14
Less than 10% of the environmental damage caused by the production of motor vehicles took place during the production itself (Figure 6.15). For all countries, more than 50% of the environmental damage caused by the production of motor vehicles took place outside the home country, especially in non-OECD countries outside Europe. Germany is an important link in the manufacturing industry of many of the other countries, especially in the motor vehicle industry. As a consequence, 10% or more of the environmental damage caused by car production in each of the other six countries, was generated in Germany.
Figure 6.15
PBL | 50
7 Comparison and validation The monetary environmental damage of material-related economic sectors in seven countries (from a production-based perspective), was presented in Chapter 5. The monetary environmental damage of materials and products (from a production-chain perspective) was presented in Chapter 6. This chapter compares the results from both perspectives, in order to validate and further explain the differences between the countries.
7.1 Comparing the production-based results with the production-chain results
Figure 7.1 summarises the per-country results for the production-based as well as for the production-chain perspective for the three phases in our analysis. The figure combines the results of Figures 5.4 and 6.7.22 Furthermore, we distinguish for the production-chain environmental damage, the damage caused from production in the corresponding sectors themselves and the upstream damage from the production-chains of these sectors. Note that the environmental damage from the producing sectors in Figure 7.1 not only includes the direct emissions of these sectors, but also the damage from the upstream emissions as far as they occur within the sectors themselves. In this way, for each phase this part of the environmental damage from the production-chain perspective relates to the total emissions of the relevant producing sectors within this phase and therefore can be compared with the emissions in the production-based analysis.
Figure 7.1
22 To have more comparable numbers, Figure 7.1 presents the environmental damages from the production-based perspective for 2008 while Figure 5.4 presents results for 2015.
PBL | 51
The confrontation of the results from the production-based analysis (in Chapter 5) and the production-chain analysis (in Chapter 6) provides more insight into the similarities and differences per phase and country between these two approaches. Here, we summarise the major findings. First of all, in both approaches, the environmental damage from the producing sectors mainly occurred during the material production (phase 2a), except for Denmark, where the environmental damage from the production-based perspective was of comparable magnitude in both phases 2a and 2b. Damage from raw material extraction (phase 1) was relatively small in all countries.
Second, in all countries, the environmental damage from emissions in other sectors had a significant share in the total environmental damage of all phases in the production-chain analysis. Particularly in the manufacturing of products (phase 2b), the share of the emissions in the producing sectors was relatively small, 9% on average. Much of the environmental damage in phase 2b thus resulted from emissions by other sectors both domestically and in other countries. In phases 1 and 2a, the average share of the emissions in the producing sectors in total environmental damage was much larger, 61% and 39% respectively, with large variations between countries for phase 1, with shares ranging from 30% in the Netherlands to 86% in Denmark.
Third, differences between countries in environmental damage per unit of GDP are remarkable, in particular, in phase 1. Both from the production-based and the production-chain perspective, the environmental damage per unit of GDP in phase 1 was the least in Belgium and most in Denmark and the United Kingdom. In phase 2a, the environmental damage was largest in Belgium (more than twice the average from both perspectives), as production in this phase had a relatively large share in the Belgian economy (Appendix C). In the production-based analysis, the amount of environmental damage in phase 2a was the smallest in Denmark while, in the production-chain analysis, it was smallest in the United Kingdom. For the Netherlands, the amount of environmental damage in phase 2a was relatively large from the production-chain perspective, but close to the average from the production-based perspective. A relatively large share of phase 2b industries in the German economy, as well as a relatively large amount of upstream damage caused the environmental damage in phase 2b for Germany to be the greatest.
One would expect the environmental damage as calculated in the production-based analysis to be in line with the damage caused by emissions from the sectors producing the products in the same phase in the production-chain analysis. For some countries, however, there are substantial differences. Section 7.2 discusses the possible reasons for these differences.
7.2 Comparison of direct environmental damage
The comparison of the monetary environmental damage from the production-based with the damage from the emissions of the producing sectors in the production-chain analysis reveals substantial differences between the results of both approaches (see Figure 7.1). For several countries, the environmental damage from the emissions by the producing sectors in the production-chain analysis was larger than the calculated damage from the production-based analysis. This is in particular the case for phase 2a, with the exception of France and the United Kingdom. For phase 2b, it is just the opposite, environmental damage from the production-based analysis being larger than for the producing sectors in the production-chain analysis, with the exception of Belgium and Germany. For Denmark, differences are remarkable for phases 1 and 2a, the direct environmental damage in the production-chain analysis being more than 3 and 4 times larger than in the production-based analysis respectively.
A couple of reasons might explain these differences. First, the production-chain approach includes more substances in the calculation of the environmental damage than the production-based analysis (see Table 3.1). The contribution of these additional substances is
PBL | 52
substantial for the environmental damage of some production processes, such as the emission of lead in the production of basic metals in the Netherlands and Austria (see 6.3.3). Figure 7.2 compares the environmental damage based on emission data from Eurostat and EXIOBASE only for those pollutants that are included in both databases and therefore excludes differences that may result from the extra substances included in the production-chain analysis. The comparison in Figure 7.2 shows that even for the same pollutants there are substantial differences between the two databases.
Second, the two approaches differ as the production-based analysis used the sector classification, while the production-chain analysis used the product classification, as explained in Section 3.2.2. Although sectors cannot be compared one to one with products, differences because of the different classifications are expected to be small. Differences may be due to the fact that sectors have by-products in their production and that some materials are produced as by-product in other sectors. We expect that at the level of phases, where sectors (production-based analysis) and products (production-chain analysis) within the same phase are aggregated, these differences are cancelled out, but did not investigate this further.
Third, the production-based analysis calculated environmental damage on the basis of 2008 emission data, while the production-chain analysis was based on 2007 emission data. The production-based analysis used 2008 data, because Eurostat has no air emission data for Austria, France and Germany for years before 2008, while the production-chain analysis used EXIOBASE data which are for 2007. To control for the effect of using different years in both data sets, as much as possible, Figure 7.2 presents the environmental damage for 2007, for those countries for which 2007 emission data are available in Eurostat (i.e. Belgium, Denmark, the Netherlands and the United Kingdom).
From the comparison of the 2007 and 2008 emission data from Eurostat for those countries that have data for both years, we discovered that environmental damage had decreased due to considerable reductions in emissions. This was in particular the case in phase 2a, where the amount of environmental damage in 2008 was 8% (the Netherlands) to 17% (Denmark) smaller than in 2007, mainly because of fewer emissions of sulphur dioxides, nitrogen oxides and carbon dioxide. For phase 2b, in Belgium, this was just the opposite, as environmental damage increased by 5%, mainly due to an increase in the same emissions.
Finally, differences result from the fact that different data sets are used for the two approaches. The environmental damage from the production-based perspective was calculated by using Eurostat data based on ‘official’ data from national statistical institutes. The production-chain analysis used data from the EXIOBASE database which, in turn, is a compilation of data from various sources. In order to include national data in a consistent multi-regional database, the original data had to be changed; for example, because national supply and use tables and trade data are inconsistent. These changes resulted in deviations from the official statistics, for example, with respect to the allocation of emissions to sectors and countries (e.g. De Koning, 2018).
Figure 7.2 illustrates the differences between the emission data from EXIOBASE and Eurostat. This comparison of both data sources confirms that the emission data differ considerably.23 Figure 7.2 shows the relative contribution of different substances to the environmental damage in the phases for only those substances that are included in both databases. For each country, the environmental damage calculated from Eurostat data was set at 100% and the environmental damage based on EXIOBASE emission data is presented relative to the environmental damage based on Eurostat.
23 Vollebergh et al. (2017) also observe substantial differences between emission data in EXIOBASE and official data sources for the Netherlands.
PBL | 53
Figure 7.2
A closer look at the environmental damage per substance shows that the differences between both databases vary widely per country and phase. In several countries, non-CO2 greenhouse gas emission levels are higher in EXIOBASE than in Eurostat, which particularly in phase 1 contributed to greater environmental damage. Also, emission levels of SOx and PM2.5 are higher in EXIOBASE than in Eurostat, in several countries, which particularly contributed to greater environmental damage in phases 2a and 2b. However, the opposite is true for France and the United Kingdom, where EXIOBASE reports lower emission levels for SOx and PM2.5 than Eurostat, in various phases. Emission levels of NOx are lower in EXIOBASE than in Eurostat, in most countries and phases, with phase 1 in Belgium and phase 2a in Denmark and the Netherlands being notable exceptions. For CO2, the comparison gives a mixed picture, where for some countries EXIOBASE is rather in line with Eurostat (Austria, France and the Netherlands) while in other countries EXIOBASE clearly deviates from Eurostat.
Figure 7.2 thus shows that the emission data from EXIOBASE differ substantially from the data from Eurostat. This largely explains the differences in the calculated environmental damage in Figure 7.1. We recommend to take the outcomes of the production-based perspective as leading, since they are based on ‘official’ statistics. The production-chain analysis on the basis of EXIOBASE can then be used to indicate the environmental damage that occurs upstream in the production chain, but when it comes to the results for specific sectors or substances, one should be aware of the substantial deviations of EXIOBASE from the official statistics.
PBL | 54
8 Key findings, implications and conclusions In the previous chapters we analysed the environmental damage caused by material production and use in Austria, Belgium, Denmark, Germany, France, the Netherlands and the United Kingdom. Investigating the environmental damage from two different perspectives provided a wide view on the sources of environmental damage related to material production and use. Moreover, as the reliability of the outcome depends on the quality of underlying data, which are subject to large uncertainties and depend on various assumptions, using two data sources side by side provided more robust insight into the various sources of environmental damage and their relative contribution.
Our focus is on the environmental damage related to emissions to the atmosphere. Note that the damage from other environmental externalities, such as noise, land use and the impact of microplastics, was not included in these estimates, because of data limitations and large uncertainties with regard to the environmental impacts and their value. Taking into account these additional externalities would add to the environmental damage presented in this study.
8.1 Key findings of the comparative analysis
We summarise the key findings from the previous chapters as follows:
• The overall monetary environmental damage was found to have been considerable in all seven countries, varying from 4% to 18% of GDP in 2015, which implies a direct welfare loss of between 1500 and 2000 euros per capita for most countries (Figure 4.2).
• Air pollutants, such as NOx and SO2, contributed for more than two thirds to total environmental damage in countries, with an upward outlier of 91% for Denmark (Figure 4.3).
• The most important sectors contributing to this damage were agriculture, transport, households and manufacturing (Figure 4.2).
• Despite a considerable decline between 2008 and 2015, in 2015 the environmental damage was still mainly related to air quality and to a lesser extent to greenhouse gas emissions (Figure 4.3).
• The share of the material-related sectors (extraction of raw materials and the production and use of materials) in gross value added was on average around 20%, in 2015, while the share of environmental damage varied from less than 5% for Denmark to almost 40% for Belgium (Figure 4.4).
• For all countries, except Denmark and Germany, the share of these sectors in environmental damage was considerably larger than in gross value added. Material producing industries (phase 2a), in particular, were responsible for the overall environmental damage caused by the material-related sectors, whereas their contribution in terms of gross value added was relatively small (Figures 4.4 and 5.4).
• Sectors using materials in the manufacturing of products and construction (phase 2b) also contributed considerably to the overall damage in 2015, whereas the contribution by the extraction (phase 1) and waste sectors (phase 4) was much smaller and more country-dependent (Figures 4.4 and 5.4). For instance, the relative damage from the extraction industry (mainly mining and quarrying) in Austria and the United Kingdom was
PBL | 55
much larger than its contribution to GDP in narrow economic terms (see also Figure 5.1), whereas the opposite is true for Denmark and the Netherlands.
• The industries mainly responsible for the environmental damage from material production in 2015 varied considerably between the countries and clearly reflected international specialisation (Figure 5.2). Dominant polluters were the chemical industry and refineries (in particular, in Belgium and the Netherlands), the manufacturing of basic metals (in particular, in Austria) and the manufacturing of other materials (in particular, in Austria and Belgium). These four industries contributed more or less equally in both Germany and France.
• The sector that by far dominated the contribution to environmental damage in phase 2b was the construction sector (Figure 5.3). In Germany and the United Kingdom, the composition of the contribution was very different, with a substantial role for the automotive industry (Germany) and rubber and plastics industry (United Kingdom). Manufacturing of metal products was also relatively important, in all of the countries. The contribution of the waste sector appeared to have been quite modest (Figure 5.5).
• There was rather a large variation in environmental efficiency in both the extraction and certain material-producing industries (see Figure 5.7). The variation was largest for the manufacture of wood and wood products, basic metals and other minerals, and for refineries. In particular, France showed the lowest environmental efficiency for the materials production industries and made modest improvements, between 2008 and 2015 (Figures 5.9–5.12).
• The results of the production-chain analysis show considerably greater environmental damage from material production and manufacturing of products compared to that from the production-based analysis. This result can be expected, because the production-chain analysis also includes damage of upstream domestic origin and from other countries (Figure 7.1).
• The production of coke and refinery products, chemical products and basic metals contributed significantly to total environmental damage of material production, regardless of whether emissions upstream in the production chain were included (Figure 6.3) or not (Figure 5.2).
• The damage caused by construction dominated phase 2b, according to the production-based approach (Figure 5.3), but would be much smaller if the damage caused by upstream sectors would also be included (Figure 6.5). The contributions by other sectors, in particular the automotive sector, other equipment and metal product manufacturing, was found to be much more important in most countries under the production-chain approach. This reflects the significant contribution of upstream emissions, such as from the production of materials, to the overall environmental damage caused by the production chains in these sectors. Germany stands out in this analysis, because of the relatively large share of the manufacturing of motor vehicles and other machinery in its economy (Appendix C).
• The production-chain analysis also shows relatively large variation in environmental efficiency for extracted raw materials and for manufactured materials (see Figure 6.8). The variation in the environmental damage per euro of product value was particularly large for the extraction of fossil fuels. Variation was much smaller for manufactured products, similar to that in the production-based analysis.
• A closer look at some of the manufactured materials, such as coke and refinery and basic metals, also shows variations in the findings for the various countries. Apparently, in 2007, comparable materials were produced with differing environmental damage per euro of product value (see Figures 6.9–6.12).
Our detailed data also allow for several other important conclusions relevant for circular economy considerations:
PBL | 56
• Clear indications were found that, in 2007, a considerable share of overall emissions from raw material extraction and material producing industries was not directly linked to combustion but to ‘other activities’, including industrial processes and non-energy use of fuels (Figures 6.2 and 6.4). On average, about 40% of the environmental damage was not related to combustion. A relatively large share was found to relate to the production of chemicals and basic metals (Figures 6.10–6.13).
• In general, the share of direct emissions related to combustion, in 2007, was also relatively large for material production (see Figure 6.4). This was true in particular for the production of basic metals and other mineral products (Figures 6.12 and 6.13). This result is indicative for the fact that material processing plays an important role in environmental damage related to both combustion and other use.
• The contribution of ‘other activities’ to environmental damage was considerably smaller in the manufacturing industry. In addition — and not surprisingly — most of the damage from those activities occurred outside this sector, often even abroad (Figure 6.6).
8.2 Environmental damage and pricing policies for materials
8.2.1 Accounting for environmental damage
Our analysis of environmental damage from the production and use of materials accounted for direct welfare losses in the seven different countries. Using the production-based analysis, we could simply aggregate the overall environmental damage from the different sectors related to the extraction and the use of materials in production. Figure 8.1 provides a rough estimate relative to GDP. With the exception of Denmark, in 2007 and 2015, environmental damage from emissions to the air for all countries was around 5% of GDP. Although this damage declined considerably between 2007 an d2015, still it was found to have been considerable in 2015. Moreover, one should note that the damage caused by the emission of polluting substances to the air is not the only externality relevant for environmental damage. There is also damage from other environmental externalities that were not included in these estimates, such as noise, land use and litter (including the plastic soup), as well as non-environmental externalities, such as congestion.
In principle, the environmental damage could be reduced by using fewer primary resources. This could be achieved through more efficient use of natural resources, as well as by increased levels of recycling and reuse of products and materials. Reusing products means that fewer products need to be manufactured, which in turn means a reduction in the amount of natural resources extracted. Recycling of products into secondary resources means that primary resources are being substituted with secondary resources. This usually requires less energy compared to the manufacturing of materials and products from primary resources. Thus, a further closing of resource loops would save energy and reduce environmental damage. This is also the reason that striving for a circular economy is closely related to the energy transition and to climate policy.
Government policy could give incentives to improve production processes with respect to the environmental damage they cause and hence reduce environmental pressure caused by product use. In many cases, current prices of fossil fuels, natural resources and materials do not reflect the entire environmental damage caused by the extraction, processing, use and consumption of natural resources. Government policies, such as taxation and regulation, could then particularly contribute to reducing the environmental damage. In short, when not all environmental damage is incorporated into the prices of the primary flow, insufficient use will be made of the secondary flow, which is when we speak of a relatively linear economy.
PBL | 57
Figure 8.1
8.2.2 Environmental damage and pricing policies in production
Obvious candidates to reduce environmental damage are policies that cover multiple or all sectors. Such policies may have more impact than those focusing specifically on one sector or that are unidimensional. One set of cross-cutting instruments are pricing policies such as environmental taxation. Figure 8.2 summarises revenues from existing environmental taxes for the seven countries in our comparison.
Most countries have implemented environmental taxes, with revenues between somewhat below 2% (Germany) and 4% (Denmark) of GDP in 2015. Revenues relative to GDP decreased in Denmark, the Netherlands, Germany and also in Belgium, and only slightly increased in the other countries between 2008 and 2015. More importantly, in all seven countries, in 2008 and 2015, revenues were mainly obtained from taxes on energy use, including taxes on fuels for transport. In Denmark, the Netherlands and to a lesser extent in Austria and Belgium the contribution of transport taxes, such as taxes on car sales, was also substantial. However, the contribution of pollution and resource taxes was rather small for all countries. The tax revenues as a percentage of GDP were the highest in the Netherlands (approximately 0.5%) while in Denmark, Belgium and France, this was no more than 0.1% of GDP.
Tax revenues as a percentage of GDP can be directly compared with the monetary environmental damage caused by the emissions of polluting substances to find out whether the material using sectors pay for their damage. The environmental damage as calculated in
PBL | 58
Figure 8.2
Note 1: Energy taxes include also taxes on fuel for transport and on greenhouse gases. Transport taxes are without taxes on fuel for transport. Pollution taxes consist of taxes on the emission of other substances than greenhouse gases to the air, water or soil, on noise and on waste management, including taxes on specific waste products such as packaging. Resource taxes consist of taxes on the extraction of raw materials, on the harvesting of biological resources (such as logging, hunting, fishing), on water abstraction and on landscape changes. Note 2: in Belgium, France and the Netherlands, pollution and resource taxes are not differentiated Source: Eurostat (June 2019)
the Chapters 5 and 6 typically relates to the tax base and rate of so called corrective Pigouvian prices, such as environmental taxes. For all countries, the monetary environmental damage was substantially greater than the environmental tax revenues. Although this so-called Pigouvian price gap decreased between 2008 and 2015, for all countries, it was still substantial in 2015. This gap even remains if the revenues from other pricing instruments, such as the EU ETS CO2 price, would also be taken into account. Under this cap-and-trade programme, companies also have to pay for their greenhouse gas emissions. The ETS price was about 24 euros per tonne CO2 in 2008, and 8 euros per tonne in 2015. Recently the price considerably increased to approximately 25 euros per tonne, in the second half of 2019, but this price is still substantially lower than the social cost of carbon estimate for the environmental damage caused by greenhouse gases. We therefore conclude from our comparison of the monetary environmental damage with the revenues of environmental taxes, that a Pigouvian gap exists and social welfare would increase if emissions would be priced according to the damage they cause to society.
PBL | 59
8.2.3 Options for additional instruments
The Pigouvian price gap indicates there is room for additional pricing policies to better internalise the environmental damage, in particular in relation to the extraction and use of materials in the economy. Implementing pricing policies such as taxes, levies or other price-based instruments to reduce environmental damage requires insight into existing environmental market-based policies. Vollebergh et al. (2017), for instance, show that taxes in the Netherlands are mainly related to the burning of fossil fuels, but that the main part of environmental damage from using raw materials is still untaxed (except for waste).
A next logical step is to investigate to what extent (‘scope’) and how strongly (‘stringency’) environmental damage is priced in the different countries and how this differs across these countries. This step, however, is beyond the aim of this study. The rough comparison of the overall country specific damage and its current tax base suggests that the findings for the Netherlands are likely to carry over to the other countries in this comparison.
In summarising our key findings, in the search for a proper pricing policy, we conclude:
- Environmental damage during the first phase of the production chain (the extraction of raw materials), was much smaller than that caused during the second phase. In particular, producing materials was most polluting. Not only the direct environmental damage, but also the damage upstream the production chain — as revealed in the production-chain analysis — was relatively great for material production. In most countries, the share of the material production industries in total gross value added was much smaller than their share in total monetary environmental damage.
- Note that, furthermore, the largest part of the environmental damage considered in this study was found to be related to air pollutants. This applies to both the production-based and production-chain analysis and implies also that most of the damage directly affected the population of the country from where these emissions were generated.
- Environmental damage from material production was not only related to combustion of fossil fuels, but also to a large extent to non-energy use of fuels and other industrial processes.
From these key findings of the comparative analysis we derive the following suggestions for policies that aim to internalise environmental damage in relation to circular economy considerations:
- Pricing of emissions is the first-best strategy for the circular economy to work properly. As much of the damage was found to be directly related to the use of fossil fuels, the most effective cross-cutting policy is likely to implement pricing of fossil fuel use over the entire base of its usage, i.e. both emissions from combustion and from non-energy use of fuels.24
- A substantial part of installations within the material production (phase 2a) as well as large production installations in phase 2b, is part of the EU Emissions Trading System (EU ETS). The EU ETS, however, only prices the direct emissions of greenhouse gases. Emissions of air pollutants, that according to our findings contribute to more than 50% of the environmental damage of these industries, are not explicitly priced by the EU ETS.
- Taxes on energy not only implicitly put a price on CO2 emissions, but also other emissions related to energy use. Most energy taxes, however, only apply to consumption-based fossil fuel use, such as heating from natural gas in households or motor fuels in cars. In general, energy taxes for energy-intensive industries are relatively low compared to energy taxes paid by households (Parry and Vollebergh, 2017).
- The scope of the pricing approach should go beyond the pricing of CO2 emissions from combustion only and also apply to emissions from the non-energy use of fuels and other
24 Section 2.2 describes the various emissions related to the non-energy use of fuels.
PBL | 60
industrial processes. Our findings show that, in 2007 and 2015, in particular four sectors were responsible for the main part of the environmental damage in the materials production sector: basic metals, other mineral materials, refinery and chemicals. A substantial part of the environmental damage caused by these industries came from energy use (combustion), but another part related to the non-energy use of fossil fuels, such as the use of natural gas in the production of ammonia and the use of coking coals for the production of iron and steel. Moreover, in these industries several industrial processes not related to fossil fuel use contributed to environmental damage, such as the production of non-ferrous metals and cement.
- The environmental damage from other activities than the combustion of fossil fuels also relates to other substances than greenhouse gases which fall beyond the scope of the EU ETS. The EU ETS, therefore, not necessarily contributes to reduced emissions of air pollutants. Whereas the resulting air quality improvements would lead to a direct improvement of the welfare of European citizens, the reduction of greenhouse gases primarily contributes to welfare improvements for world citizens in the long run. Therefore, an obvious candidate for better environmental pricing is to increase the stringency of policies that are directly or indirectly aiming at emissions related to air quality, such as emission standards on car exhausts and other installations as well as energy taxes.
- This study shows that, also in their extraction phase, fossil fuels were mainly responsible for the estimated damage in 2007 and 2015. As explained before, crude oil and natural gas extraction were responsible for considerable damage in both Denmark and the United Kingdom and, to a lesser extent, also in the Netherlands. Although pricing of extraction of fossil fuels may be advisable from a theoretical perspective (i.e. tax an activity on the place where the damage occurs), it might not be from a practical perspective. More downstream pricing measures, such as EU ETS and energy taxes, also contribute to lower levels of upstream damage, as higher fuel prices reduce the demand for fossil fuels, and may more easily be enforced.
- In refineries and the chemical industry, for example, part of the carbon contained in fossil fuels remains stored in the products, such as in motor fuels, plastics and lubricants. Substances are emitted during the use of those products and their disposal by way of incineration (see also Section 2.2). Pricing the total input of fossil fuels in these industries based on their carbon content, therefore, would not only put a price on the direct emissions, but also on downstream emissions of CO2 (note that the major part of these emissions was not included in the analysis in Chapter 6). To avoid a double pricing of the emissions related to coke and refinery products, downstream CO2 emissions, for example, from fuel used in transportation and from plastic waste incineration, should not be priced again, in this case. Emissions of other substances, however, may still justify pricing downstream emissions.
- Our estimates of the environmental damage to the air from waste management are relatively low compared to the damage from the other phases in the material production chain. Pricing measures in the waste management phase should account properly for both the direct and indirect damage. Part of the CO2 emissions might be exempted as long as this compensates for carbon captured from the atmosphere earlier in the production chain, which is true for biowaste in particular, but should not apply to damage caused by other substances. Also, the fossil-carbon part of the waste, such as plastics, should be priced as long as these products or materials were not taxed earlier in the production chain.
- Markets for basic materials and also for the manufacturing of products are, in general, global markets. Pricing of (the inputs of the) products in these markets, may have harmful impacts on the competitiveness of companies that produce these materials or products. Such negative impacts, however, can be mitigated by implementing pricing in a coalition of countries, for example in (a part of) the European Union (Parry and
PBL | 61
Vollebergh, 2017; Text box 1). In any case, a gradually increasing pricing level may be more efficient as it stimulates innovations and the switch to cleaner production processes. Note that the current EU ETS price is substantially lower than the environmental price for greenhouse gases as used in this study (57 euros per tonne CO2).
Text box 1 Unilateral pricing policies and industrial competitiveness Differences between countries in the stringency level of their environmental policies may affect the competitiveness of industries. For example, policies that put a price on greenhouse gas emissions are likely to increase the production cost of emissions-intensive industries, while their competitors in other countries might not be confronted with this additional cost. As a result, these companies may lose international market shares due to lower export levels, higher import levels, and, in the long run, relocation of production to countries with less stringent environmental policies. An alternative view is that environmental regulation could actually trigger innovation and may thus have a net positive effect on corporate competitiveness (Porter and Van der Linde, 1995). Empirical evidence to support this so-called Porter hypothesis is, however, inconclusive (Ellis et al., 2019; Ambec et al., 2013). More in general, there is also little evidence, to date, of environmental regulations having a large adverse effect on competitiveness (Ellis et al., 2019; World Bank Group, 2019). Dechezleprêtre and Sato (2017) provide an extensive review of ex-post empirical studies on the impact of environmental regulations on industrial competitiveness. They concluded that ‘implementing ambitious environmental policies can lead to small, statistically significant adverse effects on trade, employment, plant location, and productivity in the short run, particularly in pollution- and energy-intensive sectors.’ (Dechezleprêtre and Sato, 2017, p. 201). The sectors most vulnerable to adverse effects on competitiveness were found to be the basic industries in phase 2a of the current study, such as the manufacture of basic metals, other minerals, chemicals and paper, and refineries, because they compete mostly on international markets. Dechezleprêtre and Sato also concluded, however, that ‘the scale of these impacts is small compared with other determinants of trade and investment location choices’ (Dechezleprêtre and Sato, 2017, p. 201). Another, related issue is that, in the case of global environmental problems such as climate change, environmental benefits of unilateral policies are also at risk if domestic emission reductions are offset by increasing emission levels in other parts of the world (e.g. Verde, 2020). However, the larger the size of a country coalition implementing policies to reduce emissions, the smaller the potential magnitude of such emission leakages (Burniaux and Oliviera Martins, 2012; Böhringer et al., 2014). Extending coalitions, therefore, would increase the environmental effectiveness of unilateral emission pricing policies. Alternatively, if a coalition fails, countries may introduce measures to counter emission leakages, such as a border charge on imports, a border rebate for exports, or compensation for the additional costs incurred by the affected industries (Böhringer et al., 2014). Such compensation may consist of tax exemptions and rebates and free allocation of emission allowances in the case of cap-and-trade systems. Compensating companies for cost increases by subsidising investments in emission-reducing technologies may also reduce emission leakage. Bollen et al. (2019) show that carbon leakage, i.e. the increase in CO2 emissions elsewhere in the world, as a result of a carbon tax on the energy-intensive industry in the Netherlands alone, can be reduced by 80% if tax revenues would be recycled by providing a subsidy on emission abatement to the industry rather than by a lump sum transfer to households. Brink and Vollebergh (2019) compare the impacts of unilateral carbon pricing in the Netherlands with carbon pricing in a coalition of north-western European countries. They analysed the impacts of a carbon tax on the power sector and the energy-intensive industry, in addition to the price of EU ETS emission allowances by simulations with a global computable general equilibrium model. They found the carbon leakage rate to be 60% lower if the Netherlands would implement such carbon pricing together with Belgium, Germany and France, compared to the leakages that would occur if the same carbon price would be implemented unilaterally.
PBL | 62
References Aalbers R, Renes G and Romijn G. (2016). Valuation of CO2 emissions in CBA: implications of
the scenario study Welfare, Prosperity and the Human Environment, CPB/PBL Background document.
Ambec S, Cohen MA, Elgie S and Lanoie P. (2013). The Porter Hypothesis at 20: Can Environmental Regulation Enhance Innovation and Competitiveness? Review of Environmental Economics and Policy 7: pp. 2–22.
Böhringer C, Fischer C and Rosendahl KE. (2014). Cost-Effective Climate Policy Design: Size Matters. Journal of Environmental Economics and Management 67: pp. 318–339.
Bollen J and Brink C. (2014). Air pollution policy in Europe: Quantifying the interaction with greenhouse gases and climate change policies. Energy Economics 46: pp. 202–215.
Bollen J, Brink C, Romijn G, Tijm J and Vollebergh H. (2019). Verantwoording, behorend bij de Policy Brief: Economische effecten van CO2-beprijzing: varianten vergeleken. [background report to economic impact of CO2 pricing; comparing variants] CPB/PBL Achtergronddocument. CPB/PBL, Den Haag.
Brink, C and Vollebergh H. (2019). National measures complementary to EU ETS. Assessment of unilateral and multilateral options. Presentation at workshop “Coordinating the next wave of EU climate policies”, Potsdam Institute for Climate Impact Research, 20 November 2019, Berlin (https://www.pik-potsdam.de/research/transformation-pathways/research/climate-and-energy-policy/events/).
Burniaux J-M and Oliveira Martins J. (2012). Carbon leakages: a general equilibrium view. Economic Theory 49: pp. 473-495.
CE Delft (2017). Handboek Milieuprijzen 2017 [Environmental Prices Handbook 2017]. CE Delft, Delft.
CE Delft (2018). Environmental Prices Handbook EU28 version, Methods and numbers for valuation of environmental impacts. CE Delft, Delft.
CE Delft and Infras (2019). Handbook on the external costs of transport. Version 2019 – 1.1. CE Delft, Delft.
De Koning A. (2018). A comparison between EXIOBASE, Eurostat and WIOD input-output tables. Institute of Environmental Sciences (CML), Leiden.
Dechezleprêtre A and Sato M. (2017). The impacts of environmental regulations on competitiveness. Review of Environmental Economics and Policy 11: pp. 183-206.
Drissen E and Vollebergh H. (2018a). Monetaire milieuschade in Nederland. Een verkenning [monetary environmental damage in the Netherlands, outlook study]. PBL Netherlands Environmental Assessment Agency, The Hague.
Drissen E and Vollebergh H. (2018b). Kan de circulaire economie een bijdrage leveren aan de energietransitie? [could the circular economy contribute to the energy transition?] PBL Netherlands Environmental Assessment Agency, The Hague.
EEA (2018). Annual European Union greenhouse gas inventory 1990–2016 and inventory report 2018. Submission to the UNFCCC Secretariat. European Environment Agency, Copenhagen.
Ellis J, Nachtigall D and Venmans F. (2019). Carbon pricing and competitiveness. OECD Environment Working Papers No. 152. OECD, Paris.
Eurostat (2015). Manual for air emission accounts, 2015 edition. Publications Office of the European Union, Luxembourg.
Eurostat (2019a). Environmental statistics and accounts. https://ec.europa.eu/eurostat/web/environment.
Eurostat (2019b). Air emissions accounts by NACE Rev. 2 activity.
Ministry of Finance (2015). Rapport Werkgroep Discontovoet 2015, Ministry of Finance, The Hague.
Ministry of Infrastructure and Water Management (2019). Uitvoeringsprogramma Circulaire Economie, 2019-2023. Ministry of Infrastructure and Water Management, also on behalf of the Dutch Ministries of Economic Affairs and Climate Policy; Interior and Kingdom Relations; Agriculture, Nature and Food Quality; and Foreign Trade and Development Cooperation, The Hague.
Muller NZ, Mendelsohn R and Nordhaus W. (2011). Environmental Accounting for Pollution in the United States Economy. American Economic Review 101: pp. 1649-75.
Parry I and Vollebergh H. (2017). Reforming the EU Energy Tax Directive: Assessing the Options. In: Parry I, Pittel K, Vollebergh H (Eds), Energy Tax and Regulatory Policy in Europe. Reform Priorities. The MIT Press.
Porter ME and Van der Linde C. (1995). Toward a new conception of the environment-competitiveness relationship. Journal of Economic Perspectives 9: pp. 97-118.
Stadler K, Wood R, Bulavskaya T, Södersten C-J, Simas M, Schmidt S, Usubiaga A, Acosta-Fernández J, Kuenen J, Bruckner M, Giljum S, Lutter S, Merciai S, Schmidt JH, Theurl MC, Plutzar C, Kastner T, Eisenmenger N, Erb K-H, de Koning A and Tukker A. (2018). EXIOBASE 3: Developing a Time Series of Detailed Environmentally Extended Multi-Regional Input-Output Tables. Journal of Industrial Ecology 22: pp. 502–515.
Verde SF. (2020). The impact of the EU emissions trading system on competitiveness and carbon leakage: the econometric evidence. Journal of Economic Surveys 34: pp. 320-343.
Vollebergh H, Dijk J, Drissen E, Eerens H and Vrijburg H. (2017). Fiscale vergroening: belastingverschuiving van arbeid naar grondstoffen, materialen en afval; Verkenning van belastingen voor het stimuleren van de circulaire economie. [greening tax reform, taxation for stimulating the circular economy] PBL Netherlands Environmental Assessment Agency, The Hague.
Vollebergh H, Romijn G, Tijm J, Brink C and Bollen J. (2019). Economische effecten van CO2-beprijzing: varianten vergeleken. [economic impact of CO2 pricing; comparing variants] CPB Netherlands Bureau for Economic Policy Analysis and PBL Netherlands Environmental Assessment Agency, The Hague.
Wilting HC and Hanemaaijer A. (2014). Share of raw material costs in total production costs. PBL Netherlands Environmental Assessment Agency, The Hague.
Wilting HC and Van Oorschot MMP. (2017). Quantifying biodiversity footprints of Dutch economic sectors: A global supply-chain analysis. Journal of Cleaner Production 156: pp. 194–202.
Wood R, Stadler K, Bulavskaya T, Lutter S, Giljum S, de Koning A, Kuenen J, Schütz H, Acosta-Fernández J, Usubiaga A, Simas M, Ivanova O, Weinzettel J, Schmidt J, Merciai S and Tukker A. (2014). Global Sustainability Accounting — Developing EXIOBASE for Multi-Regional Footprint Analysis. Sustainability 7: pp. 138–163.
World Bank (2017). World Development Indicators, World Bank, Washington, D.C.
World Bank Group (2019). Report of the High-Level Commission on Carbon Pricing and Competitiveness. World Bank Group, Washington, D.C.
PBL | 64
Appendices
A Classifications
A.1 Sectors, materials and products
Table A.1 Overview of the sectors, materials and products that were included in the production-based (Chapter 5) and production-chain analysis (Chapter 6).
Phase Sectors (Eurostat) Materials and products (EXIOBASE) 1 Forestry and logging Products of forestry
Mining and quarrying Coal lignite peat Crude petroleum and natural gas Metal ores Other mining and quarrying
2a Manufacture of textiles, wearing apparel, leather and related products
Textiles
Manufacture of wood and of products of wood and cork, except furniture; manufacture of articles of straw and plaiting materials
Wood and wood products
Manufacture of paper and paper products Pulp paper and paper products Manufacture of coke and refined petroleum products
Coke and refinery products
Manufacture of chemicals and chemical products
Chemicals and chemical products
Manufacture of other non-metallic mineral products
Other mineral products
Manufacture of basic metals Basic metals Secondary raw materials
2b Wearing apparel leather Printing and reproduction of recorded media
Manufacture of basic pharmaceutical products and pharmaceutical preparations
Manufacture of rubber and plastic products Rubber and plastic products Manufacture of fabricated metal products, except machinery and equipment Manufacture of computer, electronic and optical products
Fabricated metal products Office machinery computers Radio television etc
Medical and other instruments
Manufacture of electrical equipment Electrical machinery Manufacture of machinery and equipment n.e.c.
Machinery and equipment other
Manufacture of motor vehicles, trailers and semi-trailers
Motor vehicles
Manufacture of other transport equipment Other transport equipment Manufacture of furniture; other manufacturing
Furniture, other manufactured goods
Construction Construction work 4 Sewerage, waste management, remediation
activities
PBL | 65
A.2 Countries and regions
Table A.2 EXIOBASE countries and regions
Aggregated regions EXIOBASE regions
Countries in analysis Austria, Belgium, Germany, Denmark, France, Netherlands, United Kingdom
Rest of Europe Bulgaria, Cyprus, Czech Republic, Estonia, Spain, Finland, Greece, Hungary, Ireland, Italy, Lithuania, Luxembourg, Latvia, Malta, Norway, Poland, Portugal, Romania, Sweden, Slovenia, Slovak Republic, Switzerland, Rest of Europe
Rest of OECD Australia, Canada, Japan, Mexico, South Korea, Turkey, United States
Rest of the world Brazil, China, India, Indonesia, Russian Federation, South Africa, Taiwan, Rest of Asia and Pacific, Rest of America, Rest of Africa, Rest of Middle East
PBL | 66
B Data and the MRIO model
B.1 Environmental prices, correction factors and deflators
Table B.1 Environmental prices per substance for the Netherlands and the EU (central values in euros2015 per tonne)
Table B.2 Correction factors for differences in income, per country
AT Austria 1.00 SI Slovenia 0.69 BE Belgium 1.00 SK Slovak Republic 0.65 BG Bulgaria 0.43 GB United Kingdom 1.00 CY Cyprus 0.68 US United States 1.11 CZ Czech Republic 0.72 JP Japan 0.85 DE Germany 1.00 CN China 0.35 DK Denmark 1.00 CA Canada 0.91 EE Estonia 0.63 KR South Korea 0.74 ES Spain 0.74 BR Brazil 0.37 FI Finland 0.87 IN India 0.17 FR France 1.00 MX Mexico 0.40 GR Greece 0.58 RU Russian Federation 0.55 HU Hungary 0.59 AU Australia 0.94 IE Ireland 1.32 CH Switzerland 1.22 IT Italy 0.78 TR Turkey 0.46 LT Lithuania 0.63 TW Taiwan 0.97 LU Luxembourg 1.87 NO Norway 1.21 LV Latvia 0.56 ID Indonesia 0.28 MT Malta 0.73 ZA South Africa 0.32 NL Netherlands 1.00 WA RoW Asia and Pacific 0.22 PL Poland 0.59 WL RoW America 0.36 PT Portugal 0.65 WE RoW Europe 0.28 RO Romania 0.50 WF RoW Africa 0.12 SE Sweden 0.97 WM RoW Middle East 0.47
Table B.3 Deflators for calculating 2007/2008 GDP and production values in euros2015 (based on Eurostat figures on GDP at market prices).
2007 2008
Austria 1.16 1.13 Belgium 1.12 1.10 Germany 1.12 1.11 Denmark 1.14 1.09 France 1.08 1.06 Netherlands 1.08 1.05 United Kingdom 1.08 1.22
PBL | 68
B.2 MRIO model A multi-regional input-output (MRIO) model was used to calculate the environmental damage of materials and products. The model is based on a model that was used for calculating the supply-chain-related biodiversity losses for economic sectors (Wilting and Van Oorschot, 2017) and adjusted for environmental prices and damage. Our model for calculating the production-chain environmental damage caused by materials or products j, Ej, was:
Ej = i (P ∘ D) (I – A)-1 xj (1)
With (for an r-region economy with s sectors per region and t the number of environmental pressures):
i i is a (1 x t) vector of ones used for adding up the environmental damage caused by individual environmental pressures;
𝑷𝑷 = �𝒑𝒑1,1 ⋯ 𝒑𝒑1,r
⋮ ⋱ ⋮𝒑𝒑t,1 ⋯ 𝒑𝒑t,r
� P is the (t x r·s) matrix of environmental prices; pi,j is a (1 x s) row vector of environmental prices of direct environmental pressure i in region j (depicting the environmental price per unit of environmental pressure);
𝑫𝑫 = �𝒅𝒅1,1 ⋯ 𝒅𝒅1,r
⋮ ⋱ ⋮𝒅𝒅t,1 ⋯ 𝒅𝒅t,r
� D is the (t x r·s) matrix of direct environmental pressures; di,j is a (1 x s) row vector of direct environmental pressure intensities of pressure i in region j (depicting the direct environmental pressures of one unit of production, for all sectors);
I Matrix I is the identity matrix; (I – A)-1 is the Leontief inverse matrix (named after Russian economist Wassilli Leontief who received the Nobel Prize in 1973 for his pioneering work on input-output analysis). For a specific material or product, the corresponding column in the Leontief inverse shows how much of each product in the table must be produced to produce one unit of the specific product. Each column describes the entire chain of the corresponding product.
𝑨𝑨 = �𝑨𝑨𝟏𝟏𝟏𝟏 ⋯ 𝑨𝑨𝟏𝟏𝟏𝟏⋮ ⋱ ⋮𝑨𝑨𝟏𝟏𝟏𝟏 ⋯ 𝑨𝑨𝟏𝟏𝟏𝟏
� A is the (r·s x r·s) matrix of input coefficients; Aij, i=j is the (s x s) matrix of domestic input coefficients of region i, Aij, i≠j is the (s x s) matrix of import coefficients of region j importing from region i.
The domestic and import coefficients depict the intermediate input requirements per unit of production (output), for each sector.
xj xj is the (r·s x 1) adjusted vector of production with zeros for all sectors except for sector j. Note that this is different from consumption-based footprints that have a focus on final demand (often characterised by y).
Operation ∘ is the element-wise multiplication of two matrices, named the Hadamard product.
PBL | 69
C Detailed sector data
C.1 Gross value added by industry Million euros (2015 prices) 2008 2015 Austria Belgium German
y Denmar
k France Netherlands United
Kingdom Austria Belgium Germany Denmark France Netherlands United