60
Accounting For Pensions 2009

Accounting For Pensions 2009

We would like to thank those from LCP whohave made this report possible:
For further information about UK issues please contact Bob Scott
or Jerome Melcer in our London office. For international issues
contact Colin Haines or alternatively the partner who normally
advises you.
For further copies of the report, download a copy from our
website at www.lcp.uk.com, contact Mark Roberts on
+44 (0) 20 7439 2266, or email [email protected].
This report may be reproduced in whole or in part, without
permission, provided prominent acknowledgement of the source
is given. The report is not intended to be an exhaustive analysis
of IAS19 and FAS158. Although every effort is made to ensure
that the information in this report is accurate, Lane Clark &
Peacock LLP accepts no responsibility whatsoever for any errors,
or the actions of third parties. Information and conclusions are
based on what an informed reader may draw from each
company’s annual report and accounts. None of the companies
has been contacted to provide additional explanation or further
details.
©© LLaannee CCllaarrkk && PPeeaaccoocckk LLLLPP AAuugguusstt 22000099
Mark AlexanderDavid Alward Jonathan BalkwillJeremy DellCatherine DrummondMark FolwellHannah GillinsonKaren GoldschmidtAnika Grant-BrahamJonathan GriffithGeorgina Griffiths Tricia GulliverColin HainesStephen HuntSam JenkinsGillian Kearney
Stuart LevyDaniel LewingtonSarah Lossin Sajivan MangaleswaranTim MarklewJerome MelcerRichard MillsRoss MurrayJenny PikeElla Purkiss Mark RobertsRebeccah RobinsonBob ScottVictoria Snowden Laura StrachanDavid Wong Min
UK Professional Pensions Awards
FT Business Pensions &Investment Provider Awards
Corporate Adviser Awards
Actuarial Consultancy of the Year 2005 | 2006 | 2007Investment Consultancy of the Year 2007
Actuarial Consulting 2007 | 2008Investment Consulting 2007 | 2008
Best Member Communication Strategy 2008Best use of Technology by a Corporate Adviser 2008Best Strategy for Investment Advice on Pensions 2009

1
MAIN
FINDINGS
Accounting For Pensions 2009
View a full list of our services at www.lcp.uk.com
CONTENTS
Accounting For Pensions 2009
1. Main findings Page 2
2. Summary of UK findings Page 8
3. Developments in UK pension provision Page 20
4. Accounting standards for pensions Page 25
5. Analysis of FTSE 100 IAS19 disclosures Page 28
6. Non-UK schemes of the FTSE 100 Page 40
Appendix 1 – FTSE 100 accounting disclosure listing Page 47Appendix 2 – FTSE 100 accounting risk measures Page 50
Introduction – content overviewPension scheme deficitsIAS19 under strainDefined benefit scheme changesInvestment riskPension risk compared with other financial risksConnecting up all the risksScheme contributionsLife expectancyLooking ahead
5.1 Analysis of results5.2 Key assumptions
6.16.26.36.46.56.66.7
2.12.22.32.42.52.62.72.82.92.10
Key findingsAnalysis of disclosuresManaging risks overseasConsistency of assumptionsLife expectancyPost-retirement medical plansMulti-employer pension schemes

1. Main findings
1.1 Deficits rise to record levels
• Lane Clark & Peacock LLP (“LCP”) estimates that under the accountingstandard IAS19, the aggregate FTSE 100 UK pensions deficit stood at£96 billion at mid-July, the highest deficit ever recorded. This is despite thefact that the full extent of pension schemes’ financial difficulties is masked byrecent levels of corporate bond yields.
• We estimate that this position was made up of £388 billion of liabilities offsetby £292 billion of assets in FTSE 100 UK pension schemes.
• Since we published our report in August last year, the financial world hasfundamentally changed. Following the collapse of Lehman Brothers onSeptember 15th 2008, asset values fell sharply, leaving pension fundsweakened financially.
• Paradoxically, for a short period in the immediate aftermath of the LehmanBrothers’ collapse, deficits reported on company balance sheets under IAS19actually fell, as corporate bond yields rose. This highlights a fundamentalshortcoming of the accounting standard.
• Further details and analysis can be found in section 2.2.
1.2 IAS19 under severe strain
• Before the credit crunch, credit spreads (ie the difference between yields oncorporate and government bonds) had been stable for a number of years ashad the relationship between pension liabilities measured by IAS19 and typicaltrustee funding measures. Consequently, if company accounts showed aworsening deficit under IAS19, this was a reliable warning that the trusteefunding measure was likely to have deteriorated similarly, with potentialimplications for increased contributions after the next trustee funding valuation.
• In the current economic climate, however, IAS19 has become an unreliableindicator.
• Not only have the IAS19 numbers diverged from trustee funding numbers butthe wide range of corporate bond yields means that there is no longer areliable comparison of the pension numbers for two companies reporting atthe same date.
• Some commentators have suggested that IAS19 should be amended so thatdiscount rates are based on gilt yields at the balance sheet date. Such achange would help to address the issues described above but at the cost ofpotentially overstating the ultimate cost of providing pensions. At mid-July2009, we estimate that such a change would potentially have added£125 billion to the deficit figure above.
2
Accounting For Pensions 2009
View a full list of our services at www.lcp.uk.com
MAIN
FINDINGS
• This may put further pressure on companies to close their defined benefitpension schemes. In any event, corporate bond yields have shown signs ofreturning to more “normal” levels in recent months. We therefore questionwhether there is any immediate need to amend the standard.
• Further details and analysis can be found in section 2.3.
1.3 Income statements may now have to weather the storm
• The International Accounting Standards Board (“IASB”) is expected toannounce proposals that would move potentially volatile pension schemegains and losses into the income statement for the first time.
• Where pension liabilities are material relative to the size of the company, thiscould have a significant effect on reported company profits. We calculate that,had these proposed changes applied for 2008, pre-tax profits for 48 FTSE 100companies with December year-ends (ie post-Lehman Brothers’ insolvency)would be over 70% lower, at £13 billion rather than the £46 billion actuallyposted, with some individual company profits being wiped out under the newproposals.
• Further details and analysis can be found in section 4.
1.4 Dealing with pension risk
• FTSE 100 pension schemes were hit hard by post-Lehman Brothers’ markets– we estimate that the 48 companies reporting in December 2008 disclosedpension-related investment losses of £42 billion, whereas they had anticipatedgains of £18 billion in their profit figures for 2008.
• However, companies that had previously taken measures to reduce pensionrisk were far better placed to deal with the financial turbulence toward the endof 2008. We found that 23 companies of the FTSE 100 disclosed, in theirannual report, measures taken to reduce pension risk. Some steps takeninclude a substantial reduction in equity holdings, use of financial swaps andthe purchase of annuities.
• Examples of companies that took such steps – and therefore protectedthemselves from the worst effects of falling equity values – include StandardLife (pension assets rose by 14% over 2008), Rolls-Royce Group (up by 8%),and Friends Provident (up by almost 3%).
• The disparity in pension performance between those that took steps to reducerisk and FTSE 100 companies generally raises the question of whether somecompanies are paying sufficient attention to their pension risks.
• Further details and analysis can be found in section 2.5.
3
Accounting For Pensions 2009
View a full list of our services at www.lcp.uk.com
MAIN
FINDINGS
Standard Life
Rolls-RoyceGroup
Friends Provident

1.5 Pension risk compared with other financial risks
• Our research found that 46 of the 90 FTSE 100 companies who have definedbenefit arrangements referred to pensions as a principal or key risk to theirbusiness in their most recent annual report.
• However, only a few disclosed details of how they deal with pension risksmoving forward. In particular, we found only 17 companies that disclosed asubstantive policy for managing pension risk.
• This compares poorly with the comprehensive disclosure approach of FTSE100 companies in relation to other financial risks such as changing interestrates on company debt, movements in foreign exchange rates and rising fuelprices.
• We see company policy on pension risk as a crucial disclosure issue wherepension risks are material. It should be treated in the same way thatcompanies treat other financial risks.
• Further details and analysis can be found in sections 2.6 and 2.7.
1.6 We are continuing to live longer
• On average, FTSE 100 companies have assumed their male pensioners willlive for 0.7 years longer than they assumed last year. On top of this, FTSE 100companies assume that members will gain an extra 1.7 years of lifeexpectancy over the coming 20 years, compared to 1.3 years last year.
• As a result, we estimate that FTSE 100 companies have added £8 billion totheir balance sheet liabilities. Increasing life expectancy is a risk that has beennotoriously difficult to manage cost-effectively but solutions are now beingdeveloped.
• This year saw the first longevity hedge deal by a UK pension scheme, asBabcock International transferred longevity risk for pensioners to the capitalmarkets. LCP expects a number of deals of this type from FTSE 100companies in the coming months.
• Further details and analysis can be found in section 2.9.
1.7 Support for final salary eroded further
• Recent events have demonstrated that the potential volatility of defined benefitpension schemes poses significant threats to employers’ ability to competeand thrive. Therefore, more companies are taking action to replace theirdefined benefit schemes with arrangements that they believe will be moresustainable.
• Only four FTSE 100 companies reported defined benefit schemes open to newUK employees in their 2008 reports. One of the four, BP, has since announcedplans to close its scheme to new members. Others have announcedmeasures to reduce or freeze benefits completely for existing members.
4
Accounting For Pensions 2009
View a full list of our services at www.lcp.uk.com
BP
MAIN
FINDINGS
BabcockInternational

• With the Chancellor’s 2009 Budget delivering proposals to reduce the tax reliefavailable on pensions savings to high earners, pension provision will becomemuch less attractive to senior executives than it is to their workforces. Thisdecoupling of interests of management and employees is likely to providemore impetus to the shift away from providing defined benefit pensions.
• Further details and analysis can be found in section 2.4.
1.8 International schemes sponsored by FTSE 100 companies
• Overseas pension and other post-retirement liabilities are significant for manyFTSE 100 companies.
• Local legislation, custom and practice are often different from the UK. Forexample, different rules on funding pension schemes in overseas territoriesmean that the funding levels are not directly comparable to those in the UK.
• Many companies adopt different assumptions for calculating their IAS19liabilities overseas from those that they use in the UK. It is not always clearthat such different treatment is justifiable.
• Risk mitigation is a key issue for FTSE 100 companies in respect of theiroverseas schemes as well as for their UK arrangements. A number ofcompanies have made some disclosure of the measures that they have takento manage pensions risks although, as for the UK, many others have made nodisclosure.
• Some FTSE 100 companies face risks as a result of their participation inoverseas multi-employer schemes. The level of contributions, particularlythose due on withdrawal from the scheme, are often outside the control of thecompany.
• Post-retirement medical plans are not common in the UK but a number ofFTSE 100 companies have liabilities overseas, particularly in the USA. FTSE100 companies disclosed healthcare liabilities totalling £11 billion in their 2008accounts.
• Further details can be found in section 6.
5
Accounting For Pensions 2009
View a full list of our services at www.lcp.uk.com
MAIN
FINDINGS

Lane Clark & Peacock LLP (“LCP”) estimates that
under the accounting standard IAS19, the aggregate
FTSE 100 UK pensions deficit stood at £96 billion at
mid-July, the highest deficit ever recorded. This is
despite the fact that the full extent of pension schemes’
financial difficulties is masked by the level of corporate
bond yields.
Bob ScottPartner, LCP
“
”
VIEWPOINT

7
Accounting For Pensions 2009
View a full list of our services at www.lcp.uk.com
The disparity in pension performance between those
that took steps to reduce risk and FTSE 100
companies generally raises the question of whether
some companies are paying sufficient attention to their
pension risks.
Jerome MelcerPartner, LCP
“”VIEWPOINT

8
UKFINDINGS
Accounting For Pensions 2009
View a full list of our services at www.lcp.uk.com
2. Summary of UK findings
2.1 Introduction – content overview
This section provides an insight into the disclosure of pension scheme costs incompanies’ accounts, comparing the different practices adopted by the largest UKcompanies and highlighting the financial implications.
By analysing their pension disclosures we aim to measure the exposure thatcompanies have to their pension obligations, particularly in the context of theirmarket capitalisation, and we identify the steps that companies are taking to addresstheir pensions issues.
FTSE 100 companies scrutinised
This report covers 90 of the FTSE 100 companies, analysing annual reports basedon FTSE 100 constituents as at 31st December 2008. Ten companies were excludedas their reports did not show evidence of significant funded defined benefit pensionschemes. A full list and summary details of the 90 companies’ key pensiondisclosures are set out in appendix 1.
We have also included updated analysis of the 26 FTSE 100 companies who publishedaccounts before 30th June 2009 for accounting years up to 31st March 2009.
All the UK companies analysed have reported under international accountingstandards (IAS19 for pension costs) as required under EU regulations.
The information and conclusions of this report are based solely on detailed analysisof the information that companies have disclosed in their annual report andaccounts. We do not approach companies or their advisers for additionalinformation or explanation.
2.2 Pension scheme deficits
Balance sheets protected by high bond yields in spite of tumbling assets
Financial markets and economies have fundamentally changed since last year. Thecollapse of Lehman Brothers in September 2008 sent shock waves across thefinancial markets, causing assets to tumble, banks to disclose huge losses andgovernment bailouts to be announced. The effects of the credit crunch have beenwidespread, leaving virtually no part of any economy or market untouched. It istherefore no surprise that this has had a material impact on company pensionschemes although the impact on the figures in the accounts is less marked thanmight have been expected.
Lane Clark & Peacock LLP (“LCP”) estimates that under the accounting standard IAS19,the aggregate FTSE 100 UK pensions deficit stood at £96 billion at mid-July, the highestdeficit ever recorded. This is despite the fact that the full extent of pension schemes’financial difficulties is masked by the level of corporate bond yields.
We estimate that this position was made up of £388 billion of liabilities, offset by£292 billion of assets in FTSE 100 UK pension schemes.

The chart below shows how the position has developed over the past seven years.Our figures exclude, where possible, the overseas pension schemes sponsored byFTSE 100 companies and any employee benefits other than pensions. The figuresdo include unfunded pension promises. We have included a separate analysis ofoverseas arrangements in section 6.
For pension schemes of the FTSE 100, the short period following the LehmanBrothers’ insolvency in September showed a sharp reduction in deficits. This wasdue to:
• Increased corporate bond yields, which cut the reported value of pensionliabilities by £57 billion; and
• Lower inflation forecasts which reduced those liabilities by a further £34 billion.
These factors more than offset the falls in asset values, which wiped around£51 billion off FTSE 100 pension scheme assets.
Overall, despite the economic turmoil, company balance sheets initially benefitedfrom the full post-Lehman Brothers’ effect, returning briefly to overall surplus duringOctober and November 2008.
The position then remained highly volatile throughout the first quarter of 2009.
Since then, in the wake of the government’s programme of “quantitative easing”,deficits have ballooned, driven by a combination of higher expectations for futureinflation and narrowing credit spreads on corporate bonds, leading to an estimateddeficit of £96 billion in mid-July – the highest ever recorded.
9
UKFIN
DINGS
Accounting For Pensions 2009
Estimated IAS19 position for UK schemes of FTSE 100 companies (£ billion)
40
20
0
-20
-40
-60
-80
-100
-120
£billion
Jun2002
Dec2002
Jun2003
Dec2003
Jun2004
Dec2004
Jun2005
Dec2005
Jun2006
Dec2006
Jun2007
Dec2007
Jun2008
View a full list of our services at www.lcp.uk.com
Dec2008
Jun2009
Lehman Brothers’insolvency
Start of“quantitative
easing”

10
UKFINDINGS
Accounting For Pensions 2009
View a full list of our services at www.lcp.uk.com
2.3 IAS19 under strain
The cracks in IAS19 that we reported were beginning to appear last year havebecome crevasses. We see the emergence of two major issues in relation to thestandard, which are both linked to the use of discount rates based on yields on highquality corporate bonds, as required under IAS19 (the discount rate is a keyassumption in placing a value today on future pension liabilities).
Numbers are no longer comparable
IAS19 now fails a key test of any accounting standard; it no longer allows users ofaccounts to make a meaningful comparison between the pension numbers of twocompanies, even those reporting as at the same date.
This is because whereas it was once the case that yields on high quality corporatebonds fell into a narrow range – thus forcing companies to use similar discount rates– the credit crunch has scattered corporate bond yields. The graph below illustratesthis.
For companies reporting as at December 2008, the range of discount rates used wasfrom 5.6% pa to 6.75% pa. To illustrate the impact of this wide range of discountrates, we estimated how each FTSE 100 company, reporting as at December 2008,would value the same pension liabilities, but using the actual discount rates theydisclosed. The chart overleaf demonstrates how such a range of values confoundsattempts by the reader to compare pension liabilities of FTSE 100 companiesreporting as at December 2008.
High quality corporate bond yields
20
18
16
14
12
10
8
6
4
2
Yield(%pa)
Duration (years)
0 5 10 15 20
31st December 2006
31st December 2008

11
UKFIN
DINGS
Accounting For Pensions 2009
View a full list of our services at www.lcp.uk.com
As can be seen, the range of results is extremely wide, with a 25% differencebetween the highest and lowest value. So, for a pension scheme with liabilities thaton average would be valued at £1 billion, FTSE 100 companies reporting as at31st December 2008 would have disclosed pension liabilities spread over a rangespanning £900 million at the lower end and £1.15 billion at the top end.
Numbers no longer relate to cash funding measures
Before the credit crunch, credit spreads had been stable for a number of years as hadthe relationship between pension liabilities measured under IAS19 and typical trusteefunding measures. Consequently, if company accounts showed a worsening deficitunder IAS19, this was a reliable warning that the trustee funding measure is likely tohave deteriorated similarly, with potential implications for increased contributionsafter the next trustee funding valuation.
In the current climate, IAS19 has diverged widely from typical funding targets used inthe UK – to such an extent that the Pensions Regulator stated in June 2009 thatIAS19 and FRS17 accounting numbers are no longer a reliable measure for fundingpurposes. This means that the information provided in company accounts bearseven less relationship to the calculations that drive cash contributions and this, inturn, has led to confusion amongst users of accounts.
Range of values placed on identical liabilities under IAS19
20
15
10
5
0
25
Numberofcompanies
0.9 0.95 1 1.05 1.1 1.15
£ billion
12
UKFINDINGS
Accounting For Pensions 2009
View a full list of our services at www.lcp.uk.com
BP
Cadbury
Diageo
Tesco
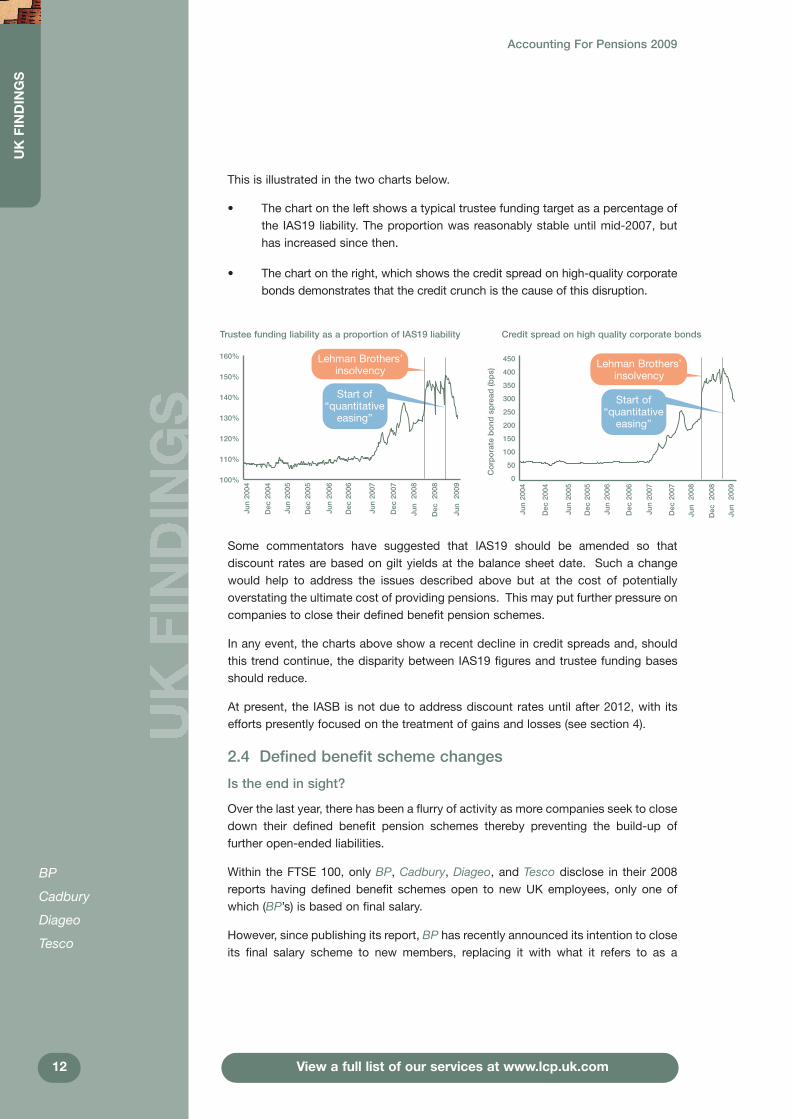
This is illustrated in the two charts below.
• The chart on the left shows a typical trustee funding target as a percentage ofthe IAS19 liability. The proportion was reasonably stable until mid-2007, buthas increased since then.
• The chart on the right, which shows the credit spread on high-quality corporatebonds demonstrates that the credit crunch is the cause of this disruption.
Some commentators have suggested that IAS19 should be amended so thatdiscount rates are based on gilt yields at the balance sheet date. Such a changewould help to address the issues described above but at the cost of potentiallyoverstating the ultimate cost of providing pensions. This may put further pressure oncompanies to close their defined benefit pension schemes.
In any event, the charts above show a recent decline in credit spreads and, shouldthis trend continue, the disparity between IAS19 figures and trustee funding basesshould reduce.
At present, the IASB is not due to address discount rates until after 2012, with itsefforts presently focused on the treatment of gains and losses (see section 4).
2.4 Defined benefit scheme changes
Is the end in sight?
Over the last year, there has been a flurry of activity as more companies seek to closedown their defined benefit pension schemes thereby preventing the build-up offurther open-ended liabilities.
Within the FTSE 100, only BP, Cadbury, Diageo, and Tesco disclose in their 2008reports having defined benefit schemes open to new UK employees, only one ofwhich (BP’s) is based on final salary.
However, since publishing its report, BP has recently announced its intention to closeits final salary scheme to new members, replacing it with what it refers to as a
Jun2004
Dec2004
Jun2005
Dec2005
Jun2006
Dec2006
Jun2007
Dec2007
Jun2008
Dec2008
Jun2009
Credit spread on high quality corporate bonds
450
400
350
300
250
200
150
100
50
0
Jun2004
Dec2004
Jun2005
Dec2005
Jun2006
Dec2006
Jun2007
Dec2007
Jun2008
Dec2008
Jun2009
Corporatebondspread(bps)
Trustee funding liability as a proportion of IAS19 liability
Start of“quantitative
easing”
Lehman Brothers’insolvency
Lehman Brothers’insolvency
Start of“quantitative
easing”
160%
150%
140%
130%
120%
110%
100%

13
UKFIN
DINGS
Accounting For Pensions 2009
View a full list of our services at www.lcp.uk.com
Legal & GeneralGroup
Marks & SpencerGroup
“flexible benefits” arrangement for new employees, but leaving existing membersunaffected.
Meanwhile, others have taken more drastic action. Barclays andMorrisons have bothannounced plans to cease accrual of all final salary benefits to existing members,with Barclays proposing a “cash balance” alternative and Morrisons moving to acareer average arrangement.
Some companies whose schemes were already closed to new members haveadopted measures that restrict how benefits accrue, rather than freezing benefitscompletely. For example, Legal & General Group and Marks & Spencer Groupannounced proposals to cap pensionable salary increases to 2.5% pa and 1% parespectively in a bid to reduce costs and risk.
It is only a matter of time before other companies emulate the sorts of actions takenby these large companies.
We look in more detail at different types of pension arrangements and thecorresponding risks borne by the company and employees in section 3.
2.5 Investment risk
Changes to future benefits may have cut the cost of providing pensions toemployees, but companies are still exposed to a variety of risks through pensionliabilities previously built up, and the assets held to meet them.
The fallout from the Lehman Brothers’ collapse has highlighted the scale of thoserisks. The 48 FTSE 100 companies reporting full-year results as at 31st December2008 disclosed losses amounting to £42 billion on their pension assets over the year,or 16.3% of assets held at the start of the financial year.
These are not merely paper losses. A large pension deficit on the company balancesheet can affect capital raising and complicate corporate transactions. Largerfunding deficits will lead pension trustees to put pressure on companies to allocatemore of their free cashflow to bring down those deficits, rather than paying dividendsor investing in the business. For example, following losses of £6.8 billion on pensionassets over the year to 31st March 2009, BT Group announced that deficit fundingwould increase to £525 million per year, equivalent to more than 50% of forecast freecashflow.
Some companies have disclosed the steps taken to reduce pension-relatedinvestment risks. We found that 23 companies of the FTSE 100 disclosed suchmeasures in their most recent annual report, including a substantial reduction inequity holdings, use of financial swaps and the purchase of annuities.
However, companies are not presently required to disclose full details of pensionassets nor whether risk reduction measures, such as financial swaps, are in place.This means that it is difficult to assess how exposed a company may be to adverseconditions. Unfortunately, the situation will remain unclear until companies arerequired to disclose greater detail on pension assets – we note that such changeshave been proposed by standard-setters and are encouraged on a voluntary basis.
Barclays
Morrisons
BT Group

Where action had previously been taken to manage these risks, companies were farbetter protected against the financial storm in late 2008 and early 2009. The chartbelow shows how measures taken protected balance sheets for some companies inthose difficult conditions.
Looking at information disclosed in company reports, there is a continued downwardtrend in the proportions held in equities by the schemes of FTSE 100 companies,reducing from 53% in 2007 to 46% in 2008. The charts below compare assetallocations as revealed by FTSE 100 companies in their 2007 and 2008 reports.
The fall over the year is likely to be attributable mainly to the relative weakness inequity markets, rather than widespread selling of equity holdings in order to reducepension risks.
2008
46%
2007
53%
13%
34%
15%
39%
Equities
Bonds
Other
14
UKFINDINGS
Accounting For Pensions 2009
View a full list of our services at www.lcp.uk.com
Performance of pension assets over year to 31st December 2008 (%)
20%
15%
10%
5%
0%
-5%
-10%
-15%
-20%
Standard Life Rolls-Royce Group Friends Provident
Schroders
AverageFTSE 100company
2008 2007
Standard Life
Rolls-RoyceGroup
FriendsProvident
Schroders

15
UKFIN
DINGS
Accounting For Pensions 2009
View a full list of our services at www.lcp.uk.com
Although companies disclosed 15% of their assets, on average, as “other” (ie notequities or bonds) they do not generally provide sufficient information for a moredetailed breakdown into alternative asset classes.
Those companies that have not put in place measures to reduce pension risk maynevertheless have assessed those risks and concluded that they are manageable inthe context of the overall business. Other companies may be in the process of takingsteps to de-risk, in conjunction with the scheme trustees. However, de-risking canbe expensive as companies lock in to lower expected returns. The price of stabilityis to increase expected contributions.
2.6 Pension risk compared with other financial risks
Pensions aside, companies face a variety of other large and volatile financial risks,some with the potential for causing substantial harm to corporate financial health.These risks include adverse movements in interest rates (which can increase the costof corporate debt), exchange rates (which can reduce the value of revenues or assetsdenominated in foreign currencies), and commodity and fuel prices (which driveoperating and manufacturing costs).
There are strict disclosure requirements governing financial risk and, as a result,FTSE 100 companies set out details of their policies for managing these. Thefollowing excerpt from the report of a FTSE 100 company is a typical introduction tosuch a disclosure:
“The Group’s policies for risk management are established to identify the risks facedby the Group, to set appropriate risk limits and controls, and to monitor risks andadherence to limits. These policies, and the systems used to monitor activities, arereviewed regularly.”
FTSE 100 companies also take action to mitigate financial risks that are seen asexcessive. For example, travel companies use financial instruments to hedge againstadverse movements in fuel prices, and mining companies do the same for risksarising from changing commodity prices.
Overall, when it comes to financial risks other than pensions, FTSE 100 companiesprovide shareholders with comfort that they have a policy in place for dealing withthese risks moving forward.
Pensions is a key risk for many FTSE 100 companies - of the 90 FTSE 100 companieswith significant defined benefit pension liabilities, 46 named pensions in their annualreport as either a “principal risk and uncertainty” or a key financial risk. Whilstdisclosure requirements do not at present require companies to set out their policy formanaging pension risk moving forward, we would expect this to be a concern forshareholders of such companies where pensions is identified as a key risk.
We reviewed FTSE 100 reports for references to a company policy on this issue,either as part of a company’s overall financial risk management process, or througha separate statement on pension risk.
We concluded that for many FTSE 100 companies, and non-financial companies inparticular, there was little or no disclosure on company policy for managing pensionrisk moving forward.

The superior disclosure performance by financial companies is not surprising, giventhat banks and insurers are required to address pension risk specifically as part oftheir modelling of regulatory capital requirements.
Examples of non-financial companies that disclosed a substantive policy were:
• AstraZeneca, who set out group-wide “Financing Principles”, which it appliesin funding its pension arrangements; and
• Diageo, who state “The group’s objective for the investment strategy is toachieve a target rate of return in excess of the return on the liabilities, whiletaking an acceptable amount of investment risk relative to the liabilities”. Thestatement then sets out in detail how Diageo intend to achieve this objective.
We noted a number of companies disclosing actions to mitigate their pension risk,such as paying contributions or reviewing fund performance, but they did notarticulate a clear statement as to how this risk will be managed going forward.
For non-financial companies, the relative lack of disclosure is a concern and, inparticular, for those FTSE 100 companies most affected by their pension liabilities.Out of the ten companies most affected by pensions (when ranked by IAS19 pensionliabilities as a proportion of market capitalisation) the only companies that discloseda policy for managing pension risk were financial companies. These were Barclays,HBOS, Lloyds TSB Group and Royal Bank Of Scotland Group.
In a post-Lehman Brothers world, where investors are more keenly aware of theimplications of unmanaged financial risk, this seeming lack of meaningful disclosureon the management of pension risk is a potential concern for shareholders and otherusers of company reports.
2.7 Connecting up all the risks
The separate treatment of pension risk, compared to other financial risks, can leadto unexpected consequences, for example:
• Some companies whose pension schemes invest heavily in equities, state thattheir exposure to equity price risk is not material.
• Some companies do not disclose a link between pension risks and otherfinancial risks. For example, utility companies benefit from high inflation on theoperating side (as this can drive up customer revenue) but may then lose outthrough higher pension liabilities.
One solution would be for companies to set out a “joined-up” risk disclosure,covering both financial and pension risks together. We note that some financialcompanies already take this approach in their risk disclosures (for example Aviva,Barclays and Lloyds TSB Group). In this respect, financial companies again seem to
16
UKFINDINGS
Accounting For Pensions 2009
Out of 90 FTSE 100 companies with pension liabilities, only 17 disclosed whatwe saw as a substantive company policy for managing pension risk. Ofthose, the majority were financial companies.
View a full list of our services at www.lcp.uk.com
Barclays
HBOS
Lloyds TSBGroup
Royal Bank OfScotland Group
Aviva
Barclays
Lloyds TSBGroup
AstraZeneca
Diageo

17
UKFIN
DINGS
Accounting For Pensions 2009
View a full list of our services at www.lcp.uk.com
be leading the way in connecting up these risks – we have seen evidence of this inthe work that we have done with many on modelling regulatory capital.
2.8 Scheme contributions
Payments to defined benefit scheme ease slightly
FTSE 100 companies paid £12.3 billion to their defined benefit pension schemes foraccounting periods ending in 2008. This is slightly down from the £12.9 billion paidinto schemes by the same companies for the previous year.
The largest reported contribution was by British Airways at £944 million, up by morethan £400 million on contributions paid over the previous year. The top sixcontributions are shown in appendix 2.
For accounting periods ending in 2008, payments to defined contribution pensionarrangements have increased by nearly 30% to £2.8 billion compared to the previous year.
The chart below shows how company payments to defined contribution pensionarrangements have more than doubled over the last five years, and how contributionsto defined benefit schemes have eased slightly from their peak in 2006.
With many companies considering the closure of their defined benefit schemes toexisting members, the employer’s “service cost” is likely to reduce in future; and, indue course, payments to defined contribution pension arrangements will overtakethose to defined benefit schemes.
The overriding feature yet to appear is the impact that difficult market conditions willhave on deficit funding as trustees now put pressure on companies to make goodnew shortfalls.
Further discussion on how contributions interact with other company cashflows canbe found in section 3.
16
14
12
10
8
6
4
2
0
£billion
2004 2005 2006 2007 2008
Employer costs (DC)
Deficit contributions (DB)
Employer service cost (DB)
British Airways

18
UKFINDINGS
Accounting For Pensions 2009
View a full list of our services at www.lcp.uk.com
2.9 Life expectancy
Longevity becomes key?
Companies have again re-visited and increased life expectancies they assume forpension scheme members. On average, FTSE 100 companies have in 2008increased expected longevity by 0.7 years for their current UK pensioners, withassumed life expectancy for males, from 60, now reaching 26.1 years on average(2007: 25.4 years). We estimate this increase has added an extra £5 billion ofliabilities to company balance sheets.
Companies have also made greater allowance for future improvements in lifeexpectancy, with companies assuming the average male reaching age 60 in 20 years’time will then live 1.7 years longer than a 60 year old today (2007: 1.3 years), addinga further £3 billion to liabilities since 2007.
Individually, some companies hiked their assumptions considerably, with BritishEnergy Group adding over three years to the life expectancy for a male currentlyaged 65, and over five years to the expected improvements over the next twodecades compared to 2007.
Some companies have disclosed that they revised their mortality assumption in thelight of findings from a formal trustee-driven scheme funding valuation. With thePensions Regulator highlighting the importance of the allowance for mortality, wemay see more companies revising their assumptions in the coming months, as theycomplete their scheme funding valuations.
The seemingly eternal upward trend is making companies consider their longevityrisk more carefully, and look for ways to reduce it. At the same time, banks andinsurance companies have been looking for ways to diversify their risk and designinnovative products to bring to market. As a result, 2009 has seen the first longevityswap deal for a pension scheme, with Babcock International hedging its currentpensioner mortality risk in a deal with Credit Suisse.
2.10 Looking ahead
What does the future hold?
Given the recent financial turmoil, the future economic climate is more uncertain thanever. Companies are finding themselves in a rapidly changing financial environment,and consequently the accounting position of their retirement obligations, in say ayear’s time, may look very different from the current position.
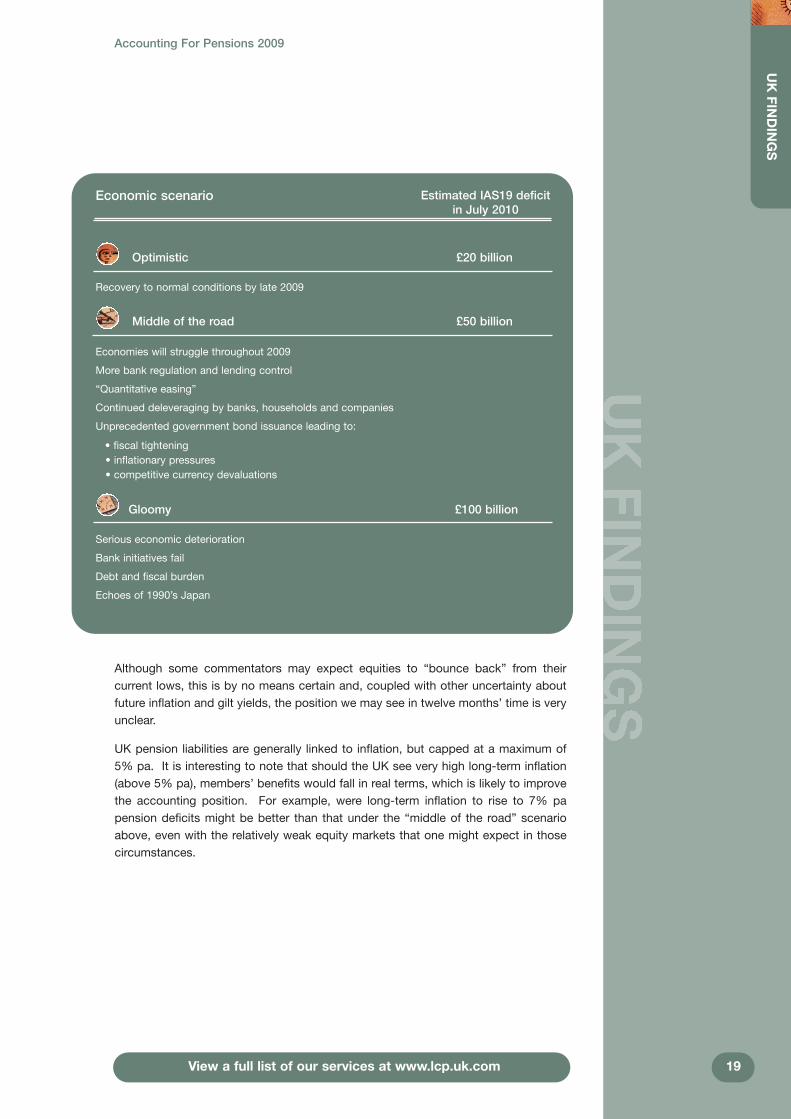
Set out overleaf are three possible economic scenarios that may be borne out overthe next year as the UK attempts to recover from recession, together with possibleeffects on the FTSE 100 pension position over the same period.
British EnergyGroup
BabcockInternational
19
UKFIN
DINGS
Accounting For Pensions 2009
View a full list of our services at www.lcp.uk.com
Although some commentators may expect equities to “bounce back” from theircurrent lows, this is by no means certain and, coupled with other uncertainty aboutfuture inflation and gilt yields, the position we may see in twelve months’ time is veryunclear.
UK pension liabilities are generally linked to inflation, but capped at a maximum of5% pa. It is interesting to note that should the UK see very high long-term inflation(above 5% pa), members’ benefits would fall in real terms, which is likely to improvethe accounting position. For example, were long-term inflation to rise to 7% papension deficits might be better than that under the “middle of the road” scenarioabove, even with the relatively weak equity markets that one might expect in thosecircumstances.
Economic scenario Estimated IAS19 deficitin July 2010
Optimistic £20 billion
Recovery to normal conditions by late 2009
Middle of the road £50 billion
Economies will struggle throughout 2009
More bank regulation and lending control
“Quantitative easing”
Continued deleveraging by banks, households and companies
Unprecedented government bond issuance leading to:
• fiscal tightening• inflationary pressures• competitive currency devaluations
Gloomy £100 billion
Serious economic deterioration
Bank initiatives fail
Debt and fiscal burden
Echoes of 1990’s Japan

20
DEVELO
PMENTS
Accounting For Pensions 2009
View a full list of our services at www.lcp.uk.com
Morrisons
Tesco
Barclays
British SkyBroadcastingGroup
Tullow Oil
3. Developments in UK pension provision
Alternatives to final salary
As discussed in section 2.4, more and more companies are turning their backs onfinal salary schemes. Some are looking to other forms of defined benefit to provideemployees in retirement, where risk is shared between employee and employer.Many companies, particularly those outside the FTSE 100, are looking to cut theirlosses altogether and move straight to defined contribution pension arrangements,leaving employees to deal with the significant investment and mortality risks thatemployers used to bear.
With defined contribution pension arrangements now becoming the rule rather thanthe exception, defined benefit pension provision is no longer a HR vehicle for attractingand retaining staff, rather an onerous legacy for the companies that once offered it.
Different schemes and different risks
As reported in section 2.4, companies are offering various types of arrangement thatprovide employees an income on retirement. We have set out below details of the maintypes of arrangement together with how risks are shared between employer and employee.
Type What is it? Examples of FTSE 100companies that offerthis to new employees
Final salary Benefits build up each year as a fixedproportion of salary on retirement (eg1/60th). All risk remains with employer,unless the employer fails.
None disclosed
Career average Similar to final salary, but based onaverage salary over an entire workinglifetime. Earlier years’ earnings areusually revalued in line with inflation.Earnings growth risk is largely removed,but all other risks remain with theemployer, unless the employer fails.
MorrisonsTesco
Cash Balance Fixed percentage of salary (eg 20%) ispaid by the company into a pot. Itattracts guaranteed investment returnsuntil retirement, when the sum is used topurchase an annuity from the open market.Longevity risk and most interest rate andinflation risks are passed to member.Employer retains investment risk.
Barclays
Definedcontribution
Company pays a fixed percentage ofsalary each year (eg 10%) into a pot whichaccumulates investment returns untilretirement. The sum at retirement is thenused to buy an annuity from the openmarket. All risks are passed to members.
Most of the FTSE 100,for example:British Sky BroadcastingGroupTullow Oil

21
DEVELO
PMENTS
Accounting For Pensions 2009
Cable & Wireless
RSA InsuranceGroup
View a full list of our services at www.lcp.uk.com
Employees take on more risk
As companies move away from final salary arrangements, employees must bear agreater burden of risk. However, it should be noted that risk can be accompanied byreward, with defined contribution pension arrangements offering the prospect forcertain employees reaping the benefit of favourable experience to increase theirbenefits post retirement.
With defined contribution pension arrangements still in their relative infancy, we willhave to wait several years before generations of the population begin to retire fromthese arrangements. Only then will we fully understand whether experience and thelevel of retirement savings have been sufficient to meet the expectations of today’sworkforce. However, many commentators have expressed concern that currentpayments to defined contribution pension arrangements may be inadequate toprovide post-retirement benefits at a similar level to the average benefit provided bydefined benefit schemes.
Trustees and companies de-risk further
Not only are companies looking to provide less risky future benefits to employees, butthey are also looking to work with trustees of their schemes to reduce the risk inproviding benefits already granted to members.
September 2008 saw the first £1 billion buy-in, with Prudential taking on theresponsibility for benefits payable to current pensioners by the Trustee of the Cable& Wireless Superannuation Fund.
However, the Lehman Brothers’ crisis in the same month has meant that bulk annuitymarkets have seen a considerable reduction in buyout and buy-in activity since then,as a result of:
• insurers adopting more conservative pricing bases, pushing up premiums;
• illiquid investment markets, impeding asset transfers; and
• the erosion of confidence in financial institutions.
Nevertheless, we expect that buyout and related activity will pick up over the next fewmonths as confidence begins to return to financial markets.
In particular, in July 2009, RSA Insurance Group announced the biggestpension risk transfer arrangement by a UK pension scheme to date, with the grouppassing to Goldman Sachs all risks relating to £1.9 billion of its pensioner liabilities.The deal employed an innovative structure that allowed the RSA Insurance Groupschemes to keep control of the assets, thus providing additional security against therisk of provider default.
The introduction of longevity protection products, such as swaps, has made itpossible to hedge against the risk of the rising cost of members living longer.Together with interest rate and inflation hedging instruments, companies and trusteescan now pick off pension risks one by one when the price is right – in effect allowingthem to operate like insurance companies – and carry out a “DIY buyout”.
22
DEVELO
PMENTS
Accounting For Pensions 2009
View a full list of our services at www.lcp.uk.com
3i Group
British Airways
Experian
Scottish & SouthernEnergy
SABMiller
Smith & Nephew
Standard Life
AstraZeneca
Diageo
National Grid
Smiths Group
Xstrata
Cable & Wireless
Whitbread
This year saw the first longevity hedge deal by a UK pension scheme, as BabcockInternational transferred longevity risk for pensioners to the capital markets. LCPexpects a number of deals of this type as this new market evolves and matures.Deals will be limited mainly to larger schemes, which are best placed to manage thecomplexities of these new instruments for risk transfer.
Contingent assets prove popular
With company cashflows under severe pressure, there is growing tension betweentrustees’ requirements for contributions to meet ever increasing deficits,shareholders’ demands for dividends and companies’ needs for capital expenditure.The question of how to allocate available funds is proving increasingly difficult. Thisis particularly the case for the large number of companies undertaking schemefunding valuations with effective dates during the first quarter of 2009, at what maywell prove to be the point of maximum disruption by financial markets. Of the 61FTSE 100 companies that disclose the date of the next UK scheme fundingvaluation, 27 face a valuation that falls within that quarter.
The Pensions Regulator has released guidance over the past nine months that hasattempted to help trustees and companies address funding valuations in the currenteconomic downturn. The Regulator is concerned that pension scheme trustees maybe disadvantaged compared with shareholders. For instance, it is keen to ensurethat the extent of pension schemes’ financial difficulties is not masked by using lessprudent funding assumptions. However it has conceded that, if cashflow is tight,pension contributions can be back-end loaded to enable companies to maintain thecashflow needed to ensure they are able to continue to trade.
Another way of mitigating company cash costs now, whilst offering trustees theprospect of more support in the future, is to link the amount of future contributionsto a company’s financial performance. From the trustees’ perspective, this sharessome similarities with a “debt for equity” swap, a type of arrangement frequentlyused in the banking world.
We have also seen further evidence that contingent assets are becoming a popularway of giving trustees greater security from sponsors without the need for tyingcompany cash irrevocably to pensions. We have seen the number of companiesdisclosing that they are making use of such assets increase by two thirds since lastyear.
3i Group, British Airways, Experian, Scottish & Southern Energy, SABMiller, Smith &Nephew and Standard Life all disclosed that significant company guarantees were inplace for some or all of their defined benefit schemes.
AstraZeneca, Diageo, National Grid, Smiths Group and Xstrata all reported that someor all of their schemes had either escrow accounts or letters of credit in place toprovide additional security to members of their schemes. Cable & Wireless operatean arrangement that provides support to its scheme on specific trigger events linkedto company financial performance. Whitbread disclosed that the company had givenundertakings to the trustees of its scheme that are similar to some of the bankingcovenants it has in place.
BabcockInternational

23
DEVELO
PMENTS
Accounting For Pensions 2009
View a full list of our services at www.lcp.uk.com
Marks &SpencerGroup
BritishAirways
However, there are now signs that some companies, having previously pledgedassets to their pension schemes, are looking to loosen those arrangements, toprovide support for the business. For example, earlier this year, Marks & SpencerGroup announced a change to its contingent asset arrangement whereby propertyincome, which is presently being paid to its pension scheme, would instead bedeferred if dividends to shareholders are not being paid. In July 2009, British Airwaysannounced that it had reached agreement with the pension trustees for presentfinancial guarantees to be released subject to a suitable alternative form of security.
Budget discourages executive support of pensions
Earlier this year Alistair Darling, Chancellor of the Exchequer, delivered his secondBudget, revealing plans to reduce the tax relief available on retirement saving to highearners from April 2011. Covering not only employee and employer pensioncontributions to money purchase arrangements but also accrual of final salarybenefits, all individuals with total income of £150,000 pa or more will be affected.
It is the Government’s intention that those with income (ie not just earnings) over thisthreshold will experience a progressive reduction in tax relief enjoyed on pensionsavings, such that those earning more than £180,000 pa will receive relief at only thebasic rate of tax (currently 20%).
The Government is expected to consult on this over the summer, when further detailsof how these changes will be implemented is expected to become clearer.
Effectively, many executives will have no material tax incentive to make long-termsaving. As such, these changes can only result in company executives becomingmuch less interested in their own pension provision. As a result, the corporate viewof company pension provision may also change, prejudicing yet further the future ofdefined benefit pension schemes (or indeed any quality pension scheme).
2012 auto-enrolment
Companies must now also face the financial headache of Government pensionreforms that are expected to come into effect in 2012. These reforms will require theautomatic enrolment of all employees aged between 22 and State Pension Age to aminimum standard pension arrangement. Broadly speaking, employers will berequired to auto-enrol their employees into either a defined benefit scheme ofsufficient quality or to a defined contribution pension arrangement with a minimumemployer contribution rate of 3% of pay within a stated range for every individual ontheir payroll.
The Department for Work and Pensions has calculated the additional cost to UKcompanies of the minimum employer contributions to be around £2.5 billion pa.However, the cost for employers does not stop there as these measures will incuradditional set-up costs, estimated to amount to £350 million, and further ongoingcosts of around £100 million pa.
With changes needed to be implemented within the next three-year planning cycle,employers need urgently to evaluate whether their existing pension schemes meetthe quality requirements and the impact on their payroll costs of auto-enrolment.

24
DEVELO
PMENTS
Accounting For Pensions 2009
View a full list of our services at www.lcp.uk.com
Many employers may cut back existing provision to mitigate cost increases fromincreased pensions take-up rates. The overall effect is likely to spread corporatebudgets even more thinly, potentially reducing existing provision and perhaps havinga knock-on effect on workers’ pay.
There remains considerable political risk associated with auto-enrolment. With anelection due within the next nine months, opposition politicians have stated that theyare yet to be convinced by details of the current government’s proposed system. Inparticular, there is concern over the complexity of the proposed arrangements.
This uncertainty inevitably means that planning for these changes is difficult.

25
ACCOUNTIN
GSTANDARDS
Accounting For Pensions 2009
View a full list of our services at www.lcp.uk.com
4. Accounting standards for pensions
Income statements vulnerable
The IASB is now expected to take forward its earlier proposals to change the waycompanies account for pensions in financial reporting.
Their proposals were twofold:
• to reform the way in which potentially volatile movements in pension assetsand liabilities (the so-called “actuarial gains and losses”) are reflected infinancial statements; and
• to eliminate the corridor mechanism used by some companies to smooth outthe pension amounts recognised on the balance sheet (it is still in use by nineFTSE 100 companies).
This is a major change in how pensions are reflected in company accounts, withramifications for the reporting of company profits.
Accounting impact
We estimate that had the IASB’s proposals been adopted for 2008, the combinedreported pre-tax profits of £46 billion for the 48 FTSE 100 companies with year-endsin December would have been slashed by over 70% to £13 billion.
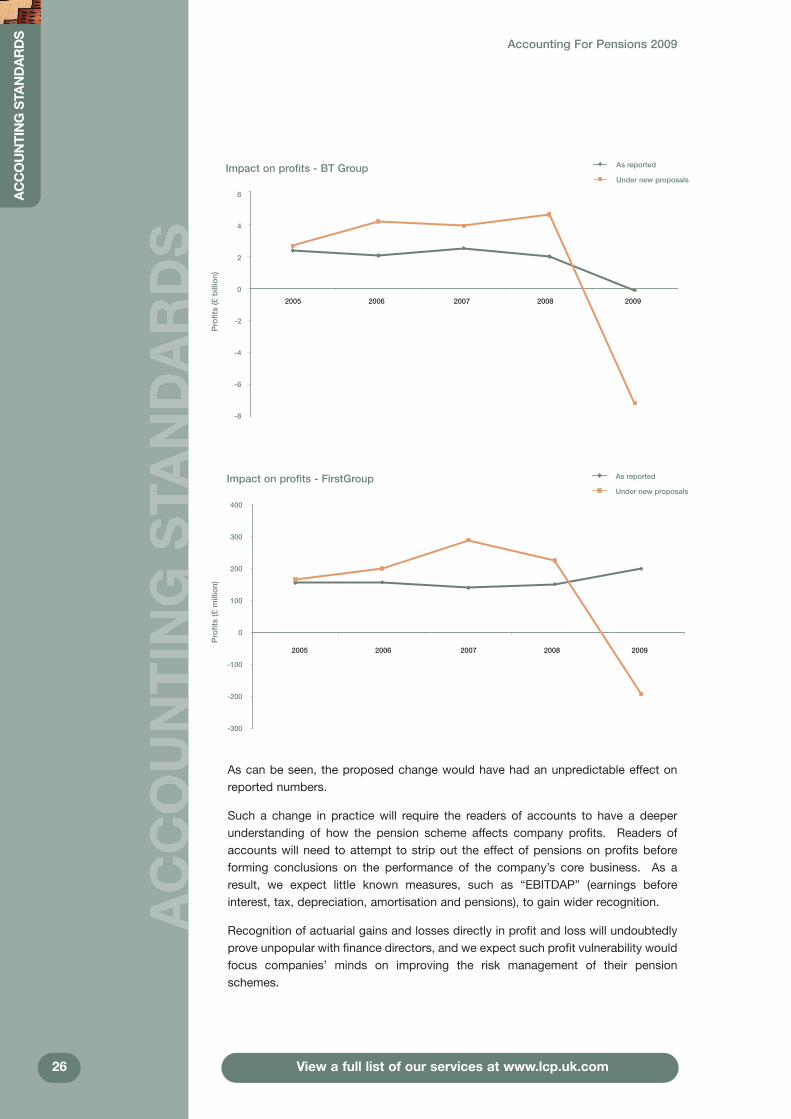
We have also looked at pre-tax profits for the last five years for two FTSE 100companies with substantial pension schemes: BT Group and FirstGroup. We thenconsidered the impact on profits for those years had the IASB’s present proposalsbeen in force over that period with actuarial gains and losses recognised immediatelyin profit and loss. Our findings are set out in the charts overleaf.
What are actuarial gains and losses?
From year to year, pension assets and liabilities chart an unpredictable course.To allow a smoother stream of reported profits, companies have until now beenallowed to include in the calculation of profit and loss their predictions of howpension assets and liabilities will move through the year. The differencesbetween a) what companies predict and b) what actually happens are termed“actuarial gains and losses”. For assets, this will be the extent to which assetsoutperform or underperform predictions (which can be large, especially where ascheme is heavily invested in equities). For liabilities this is mainly the impact ofchanges in assumptions – eg discount rate or longevity.
BT Group
FirstGroup
26
ACCOUNTINGSTANDARDS
Accounting For Pensions 2009
View a full list of our services at www.lcp.uk.com
As can be seen, the proposed change would have had an unpredictable effect onreported numbers.
Such a change in practice will require the readers of accounts to have a deeperunderstanding of how the pension scheme affects company profits. Readers ofaccounts will need to attempt to strip out the effect of pensions on profits beforeforming conclusions on the performance of the company’s core business. As aresult, we expect little known measures, such as “EBITDAP” (earnings beforeinterest, tax, depreciation, amortisation and pensions), to gain wider recognition.
Recognition of actuarial gains and losses directly in profit and loss will undoubtedlyprove unpopular with finance directors, and we expect such profit vulnerability wouldfocus companies’ minds on improving the risk management of their pensionschemes.
Impact on profits - BT Group
6
4
2
0
-2
-4
-6
-8
Profits(£billion)
Impact on profits - FirstGroup
400
300
200
100
0
-100
-200
-300
2005 2006 2007 2008 2009
Profits(£million)
Under new proposals
As reported
Under new proposals
As reported
2005 2006 2007 2008 2009

27
ACCOUNTIN
GSTANDARDS
Accounting For Pensions 2009
View a full list of our services at www.lcp.uk.com
IFRIC14
This year has seen a variety of treatments of IFRIC 14, which is the guidance releasedby the IASB setting out how companies’ actual commitments to fund pensionschemes could affect what they disclose on their company balance sheet.
We note that where companies have mentioned IFRIC 14, they say either:
• they are affected by IFRIC 14;
• they are accounting under IFRIC 14 but they are not affected; or
• they are not yet accounting under IFRIC 14 (the guidance only applies toaccounting periods starting on or after 1st January 2008).
Whether or not a company can show a pension surplus on its balance sheet hingesmainly on whether the scheme’s rules would allow the company to benefiteconomically from any emerging surplus. Effectively this requires the rules to containprovisions for an unconditional refund of surplus back to the employer at some pointin the future.
Companies now have to scour their scheme rules in search of such provisions whicheffectively dictate whether potentially large sums can or cannot be recognised ontheir balance sheet. With 2009 being the first time in which all companies mustconsider IFRIC 14, we expect more companies to disclose its effects over the nextyear.

28
ANALYSIS
Accounting For Pensions 2009
View a full list of our services at www.lcp.uk.com
5. Analysis of FTSE 100 IAS19 disclosures
We have analysed 90 FTSE 100 companies reporting in 2008. Ten companies wereexcluded as there was no evidence in their reports of significant funded definedbenefit pension schemes. A full listing can be found in appendix 1.
We have concentrated on the financial position of the defined benefit schemes inwhich the companies’ employees participate. Some companies offer post-retirementhealthcare, which we have excluded from our analysis where possible, as this reportfocuses on pension provision. Overseas pension arrangements have been included,except where otherwise indicated.
The disclosures
The average pension note runs to over four pages, with most companies also havingseveral paragraphs of pension commentary in the main body of their reports. Onceagain, the longest disclosure was by Friends Provident, which has 14 pages of itsreport dedicated to pensions.
For many FTSE 100 companies, pensions are financially significant and the volumeof information disclosed in the accounts reflects this. However, for those companieswhose pension arrangements are not so material, the minimum disclosurerequirements under IAS19 can be quite onerous.
5.1 Analysis of results
Funding levels
IAS19 takes a snapshot of the accounting surplus or deficit at the company’s year-end and, if the company has not chosen to “spread” gains and losses, this is thenumber that appears on the balance sheet.
This year the number of companies reporting that they have at least enough assetsto meet their accounting liabilities in their 2008 accounts remained stable comparedto their 2007 accounts. 28 companies out of the 90 FTSE 100 companies disclosedassets equal to or in excess of their accounting liabilities, the same number as lastyear.
A full list of the disclosed accounting surpluses and deficits of the FTSE 100companies is set out in appendix 1.
Cable & Wireless disclosed the highest IAS19 funding level over 2008 of 120%, as at31st March 2008, and more than half of the 90 companies reported being more than90% funded on an accounting basis.
Changes over 2008
The chart below shows how worldwide funding levels have changed over the year forthe 48 FTSE 100 companies in our report that have December 2008 year-ends.
Friends Provident
Cable & Wireless

29
ANALYSIS
Accounting For Pensions 2009
View a full list of our services at www.lcp.uk.com
The median reported IAS19 funding level for companies with December year-endsdecreased by 7% from 97% in 2007 to 90% in 2008.
However, the story is different for companies with other accounting dates. The 31companies reporting in the first quarter of 2008 disclosed on average animprovement of around 6% in their IAS19 funding compared to their 2007disclosures.
Sources of deficits and surpluses
For the 48 companies with December year-ends, worldwide deficits increased by£29 billion in absolute terms over 2008. Negative investment returns (£42 billion) andinterest charges (£15 billion) have been partly offset by the reduced IAS19 valuesplaced on the projected benefits (£25 billion). Aggregate contributions paid(£9 billion) have exceeded the IAS19 cost of extra benefits earned by employees(£6 billion). The overall effect is a net increase in deficits of £29 billion.
Ratio of assets to IAS19 liabilities at end December (%)
20
15
10
5
0
Numberofcompanies
under 70 70 to 79 80 to 89 90 to 99 100 to 109 110 or over
2007
2008
IAS19 sources of deficits and surpluses for companies with December year-ends only (£ billion)
-70 -60 -50 -40 -30 -20 -10 0 10 20 30
Benefits earned (£6 billion) Contributions paid (£9 billion)
Unfavourable investmentreturns (£57 billion)
Change in bondyields / assumptions
(£25 billion)
Overall change (£29 billion)
£ billion

BAE Systems
30
ANALYSIS
Accounting For Pensions 2009
View a full list of our services at www.lcp.uk.com
Pension scheme risk for companies
Whilst corporate bond yields used to discount pension scheme liabilities have continuedto be high, thus reducing the value placed on company accounting liabilities, the fall inequity markets, and hence the value of companies, means pension scheme liabilitiesrepresent a larger proportion of company market capitalisations.
The chart below shows the size of accounting liabilities relative to a companies’market capitalisations. For some companies, the size of the pension scheme dwarfsthe value of the company itself.
Comparing the size of pension scheme deficits to market capitalisation tells a similarstory. Deficits represent a greater proportion of company market capitalisationscompared to previous years, with BAE Systems’1 deficit representing 31% of thecompany’s market capitalisation compared to 11% at its accounting date last year.
Accounting deficits as a proportion of market capitalisation (%)
60
50
40
30
20
10
0
Numberofcompanies
under 5 5 to 9 10 to 14 15 to 19 20 to 24 25 to 29 30 or over
2007
2008
Accounting liabilities as a proportion of market capitalisation (%)
25
20
15
10
5
0
Numberofcompanies
under 5 5 to 14 15 to 24 25 to 49 50 to 74 75 to 99 100 to 149
2007
2008
150 to 199 200 or over
1BAE Systems allocated £891 million of its 2008 deficit (£450 million in 2007) to equity accounted investments and other participating employers.

31
ANALYSIS
Accounting For Pensions 2009
View a full list of our services at www.lcp.uk.com
What have companies done to tackle their deficits?
Despite the global recession, companies continue to pay high levels of contributions,though not quite at the levels paid in recent years. This may reflect companies beingtied into existing recovery plans agreed as part of scheme funding valuations. Mostcompanies pay contributions at a rate greater than the IAS19 value of benefits earnedover the year, which if IAS19 assumptions were borne out in reality would reduce theIAS19 deficit.
However, 19 companies paid lower contributions than the value of the IAS19 liabilitiesearned over the year. HBOS paid lower contributions than the total value of thebenefits earned by employees but still managed to reduce its deficit by around£800 million largely through the change in financial assumptions used to value IAS19liabilities.
The chart below shows the “excess” contributions that companies paid during theyear (ie contributions over and above the IAS19 value of the benefits earned duringthe year) as compared to the deficit disclosed in the accounts at the end of the year.
Despite reduced cashflow in the general economy, companies have continued to payoff a considerable proportion of their deficits over the year. The highest proportion ofdeficit paid off was by Morrisons which paid off 69% of its year-end deficit.
Pension schemes versus shareholders
The chart overleaf shows how pension scheme deficits compare to dividends paid.Of the 62 FTSE 100 companies with a pension deficit, 46 disclosed that they paiddividends to shareholders that were greater than or equal to the pension deficit in2008 and, in 31 cases, the dividends were greater than or equal to double the 2008deficit.
Proportion of year-end deficits paid off over the year (%)
25
20
15
10
5
0
Numberofcompanies
Nil 0 to 9 10 to 19 20 to 29 30 to 39 40 to 49 50 to 59 60 or over
2007
2008
HBOS
Morrisons

Percentage of deficit that could be paid off with one year’s declared dividends (%)
Numberofcompanies
under 50 50 to 99 100 to 149 150 to 199 200 to 249 250 to 299 300 to 349 350 to 399 400 or over
30
25
20
15
10
5
0
2007
2008
32
ANALYSIS
Accounting For Pensions 2009
View a full list of our services at www.lcp.uk.com
However, looking overall, FTSE 100 companies with schemes in deficit paid anincreased level of dividends in 2008 (£52 billion) compared to 2007 (£45 billion).
The chart below shows the company contributions paid over the 2008 and 2007accounting years as a percentage of dividends paid over the same accounting yearsand illustrates the amount of cash paid to shareholders in preference to the pensionscheme. In 2008, only five companies paid more contributions into their pensionschemes than they paid in dividends over the 2008 accounting year.
Contributions paid as a proportion of dividends paid (%)
Numberofcompanies
under 10 10 to 19 20 to 29 30 to 39 40 to 49 50 to 59 60 to 69 70 to 79 80 to 89
30
25
20
15
10
5
0
2007
2008
90 to 99 100 or over

33
ANALYSIS
Accounting For Pensions 2009
View a full list of our services at www.lcp.uk.com
5.2 Key assumptions
We consider below the various assumptions used to place an IAS19 value on pensionbenefits. Where a company operates pension schemes in more than one country, wehave considered the assumptions used for the UK if separately given. Where acompany has disclosed a range of assumptions, we have taken the mid-point.
Our analysis is of the assumptions disclosed as at the accounting year-end.
Life expectancy
Under the IAS19 standard, companies are required to disclose any “material actuarialassumptions”. Whilst no specific mention is made of mortality assumptions, themajority of companies have disclosed this assumption. 80 of the 90 companies withdefined benefit pension schemes have provided sufficient information for us to derivebasic mortality statistics – specifically a male life expectancy at age 60 in the UK.This is a marginal improvement on last year, when 78 companies disclosedmeaningful mortality assumptions. 58 companies provided previous yearcomparators to allow us to analyse to what extent companies have revised theirassumptions over their accounting year.
The following charts show the range of life expectancies assumed under IAS19 byFTSE 100 companies for males retiring on the balance sheet date.
The average assumption was that male members in the UK who retire at age 60 onthe accounting date would live to 86.1 years – up from 85.4 years in their 2007accounts. Companies continue to revise their life expectancy assumptions upwards;44 companies have disclosed that they moved to more conservative longevityassumptions in 2008, adding 1.0 years on average to the assumed life expectancy.3i Group has adopted the strongest mortality assumptions, assuming that malepensioners currently aged 60 will live for a further 30.2 years.
Life expectancy assumptions reported in 2008Males retiring at age 60 on the accounting date
20
15
10
5
0
Numberofcompanies
Life Expectancy (rounded to nearest age)
82 or below 83 84 85 86 87 88 90 or above
2007
2008
89
3i Group

Life expectancy assumptions reported in 2008 split by sectorMales retiring at age 60 on accounting date
Lifeexpectancyfrom60
Number of companies in sector
Healthcare Financials BasicMaterials
ConsumerServices
ConsumerGoods
Industrials UtilitiesTelecommuni-cations
2 16 12 6 3 2 7 2 8
Oil and Gas
2007
2008
92
90
88
86
84
82
80
78
34
ANALYSIS
Accounting For Pensions 2009
View a full list of our services at www.lcp.uk.com
1The sector is the Industry Classification Benchmark as published by FTSE.
3i Group
British EnergyGroup
Research has shown that two of the main factors influencing life expectancies aresocio-economic group and income. In this respect it is interesting to analyse theFTSE 100 companies’ assumed life expectancies by the sector in which thecompany operates as this should loosely be connected to the socio-economic groupand income levels of the employees.
In the charts below the horizontal bars show the average life expectancy for a maleaged 60 in the UK for each sector. The vertical lines show the extent of the variationwithin each sector, which clearly increases the greater the number of companieswithin the sector1.
This chart shows that the highest assumed life expectancies are found in thehealthcare, financials and consumer services sectors. The lowest assumed lifeexpectancies are found in the utilities, basic materials and consumer goods sectors.Compared to the same chart in our 2007 report, there is less variability in theassumed life expectancies between sectors, perhaps as result of a generalstrengthening in mortality assumptions across all companies. Notably, 3i Group andBritish Energy Group have increased their current longevity assumptions by well overthree years compared to last year’s accounts.
Future improvements in mortality
As well as setting assumptions to estimate how long current pensioners will live onaverage, companies must also decide how quickly life expectancies for futurepensioners will increase as a result of future improvements in mortality. Allowing forfuture improvements can result in a significant increase in reported pension schemeliabilities, and therefore deficits. Several companies have indicated that they haveassumed future rates of improvement at no less than a minimum rate or “underpin”and this practice is becoming more prevalent in companies’ pension accountingdisclosures.

35
ANALYSIS
Accounting For Pensions 2009
View a full list of our services at www.lcp.uk.com
54 companies disclosed enough information in their accounts to analyse how theirallowance for future improvements in mortality has changed over their accountingyear. The chart below shows the allowance that these companies have made forincreases to longevity over a period of 20 years.
The rise in the use of underpins to the rate of future improvements has led to anincrease in the assumed life expectancy of a 60 year old in 20 years’ time of 1.1 years,from 26.7 years in 2007 to 27.8 years in 2008.
Discount rates
The discount rate assumption used by each company for its main UK pensionscheme is set out in appendix 1.
The discount rate is used to calculate a present value of the projected pensionbenefits. Under IAS19 the discount rate should be based on “high quality” corporatebonds and the term of the corporate bonds should be consistent with the estimatedterm of the pension obligations.
The yields on high quality corporate bonds, and hence the discount rates, willfluctuate from day to day in line with market conditions. We have analysed March2009 year-ends (where data was available at time of writing) in addition to December2008 year-ends.
Additional life expectancy improvements reported in 2008Improvements for male members aged 60 now versus aged 60 in 2028
20
18
16
14
12
10
8
6
4
2
0
Numberofcompanies
Increase in life expectancy over next 20 years
Under 0.5 years 0.5 to 0.99 1 to 1.49 1.5 to 1.99 2 to 2.49 2.5 to 2.99 3 to 3.49
2007
2008
Over 3.5 years

36
ANALYSIS
Accounting For Pensions 2009
View a full list of our services at www.lcp.uk.com3.2 to 3.99
Barclays
InterContinentalHotels Group
British Airways
Land SecuritiesGroup
British LandCompany
As corporate bond yields rose, the average discount rate also rose, from 5.8% pa inDecember 2007, to 6.2% pa in December 2008, and to 6.6% pa in March 2009. Weestimate that the impact of these increases was to take 16% off companies’ reportedpension liabilities by the end of March 2009 – equivalent to about £50 billion acrossthe FTSE 100. However, the second quarter of 2009 saw a reversal of this trend, ascorporate bond yields fell sharply.
The range of discount rates continued to widen over the year to 31st March 2009against a background of highly dispersed corporate bond yields.
As at December 2008, the highest discount rate (6.75% pa) was disclosed byBarclays and the lowest (5.6% pa) was disclosed by InterContinental Hotels Group.As at March 2009, the highest discount rate (7.0% pa) was disclosed by BritishAirways and Land Securities Group. The lowest (5.8% pa) was disclosed by BritishLand Company.
The typical FTSE 100 company has pension liabilities that are linked to price inflation.It is therefore the discount rate net of assumed future price inflation which is the keyassumption.
The chart below shows the difference between the discount rate and the assumptionfor price inflation (the net discount rate) for companies reporting as at 31st December2007, 31st December 2008 and 31st March 2009.
The net discount rate has widened since December 2007, due to a combination ofrising corporate bond yields and, following Lehman Brothers’ collapse, decreasingexpectations of future inflation. This has had the effect of reducing companies’reported pension liabilities.
Discount rates used in December 2007, 2008 and March 2009 (% pa)
Numberofcompanies
30
25
20
15
10
5
0
under 5.2 5.4 to 5.6 5.6 to 5.8 5.8 to 6
Dec 2007
Dec 2008
Mar 2009
6.6 to 6.86 to 6.2 6.4 to 6.66.2 to 6.45.2 to 5.4 6.8 to 7 7 or over

37
ANALYSIS
Accounting For Pensions 2009
View a full list of our services at www.lcp.uk.com
Inflation
Details of the assumption for future price inflation used by each company are set outin appendix 1.
The chart below shows that the average long-term inflation assumption decreasedfrom December 2007 to December 2008 but that it then increased for companies withMarch 2009 year-ends. An increase in the price inflation assumption will lead directlyto a higher level of projected benefit payments, and hence a larger value being placedon those benefits, all other things being equal.
Discount rates used in excess of inflation used in December 2007, 2008 & March 2009 (% pa)
Numberofcompanies
25
20
15
10
5
0under1.8
1.8 to1.99
Dec 2007
Dec 2008
Mar 2009
2 to2.19
2.2 to2.39
2.4 to2.59
2.6 to2.79
2.8 to2.99
3 to3.19
3.2 to3.39
3.4 to3.59
3.6 to3.79
3.8 orover
Inflation assumptions used in December 2007, 2008 and March 2009 (% pa)
Numberofcompanies
25
20
15
10
5
0
under 2.8 2.8 to 2.99 3 to 3.19 3.2 to 3.39 3.4 or over
Dec 2007
Dec 2008
Mar 2009

Salary growth rates used in excess of inflation (% pa)
Numberofcompanies
40
35
30
25
20
15
10
5
0
under 0.5 0.5 to 0.99 1 to 1.49 1.5 to 1.99 2.5 or over
2007
2008
2 to 2.49
38
ANALYSIS
Accounting For Pensions 2009
View a full list of our services at www.lcp.uk.com
Land Securities
Experian
FirstGroup
There is currently considerable uncertainty about the level of future inflation over thelong term, which is illustrated by the wide range of assumptions adopted at31st March 2009: Land Securities and Experian adopted an inflation assumption of3.4% pa whereas FirstGroup adopted an assumption of 2.6% pa.
The Bank of England publishes statistics for future price inflation rates implied by giltspot rates. This showed long-term price inflation implied by 20-year gilt spot rateswas around 3.5% pa at December 2007 and around 3.2% pa at the end of December2008 and March 2009.
Salary growth
The assumed rate of salary growth affects the disclosed IAS19 liability and the costof benefits being earned. A lower assumption for salary growth produces a lowerprojected pension and hence lower pension liabilities as well as a lower charge tooperating income.
The average real salary increase (ie the increase above inflation) has fallen slightlyover the year and so this will have helped reduce deficits further. This is shown below.
The average real salary growth rate has decreased from last year from 1.29% paabove price inflation to around 1.19% pa above price inflation. Of the 75 companieswhich disclosed sufficient information to analyse, 13 companies have decreasedtheir assumption for real salary increases and 7 have increased it. WPP disclosedone of the largest decreases in its assumption for real salary increases compared tolast year, reducing its assumption by 1.3% pa.
WPP
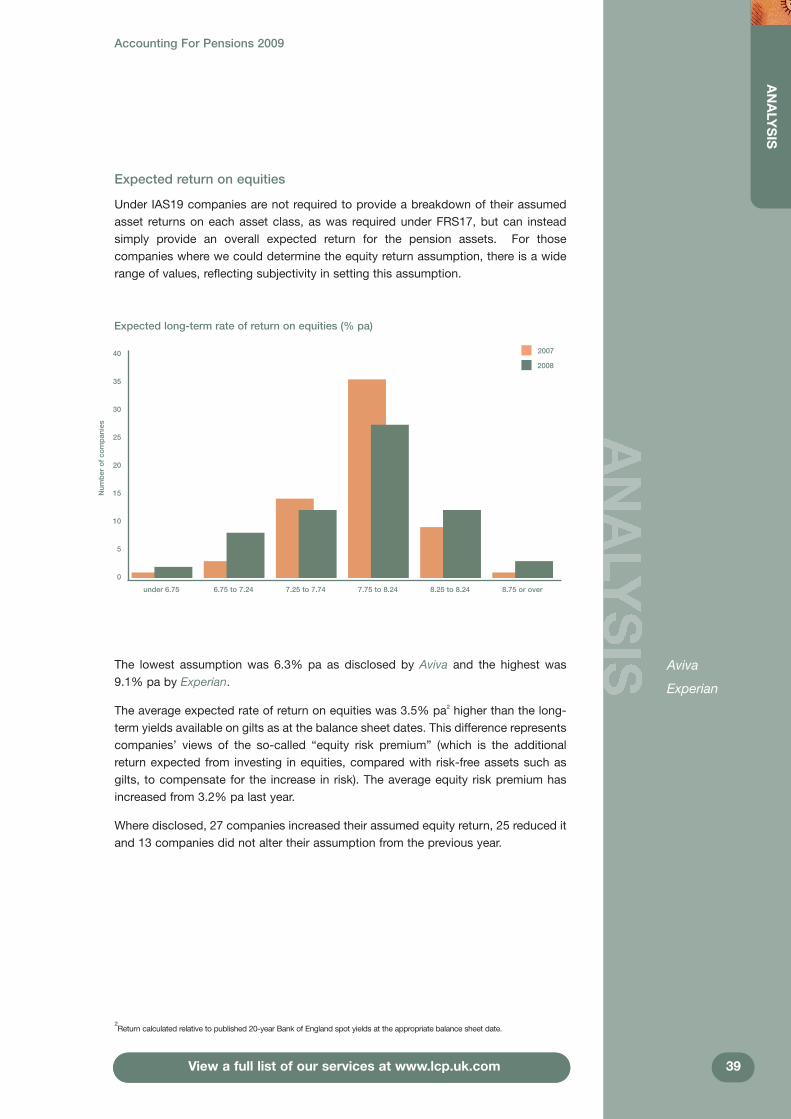
View a full list of our services at www.lcp.uk.com 39
ANALYSIS
Accounting For Pensions 2009
Aviva
Experian
View a full list of our services at www.lcp.uk.com
Expected return on equities
Under IAS19 companies are not required to provide a breakdown of their assumedasset returns on each asset class, as was required under FRS17, but can insteadsimply provide an overall expected return for the pension assets. For thosecompanies where we could determine the equity return assumption, there is a widerange of values, reflecting subjectivity in setting this assumption.
The lowest assumption was 6.3% pa as disclosed by Aviva and the highest was9.1% pa by Experian.
The average expected rate of return on equities was 3.5% pa2 higher than the long-term yields available on gilts as at the balance sheet dates. This difference representscompanies’ views of the so-called “equity risk premium” (which is the additionalreturn expected from investing in equities, compared with risk-free assets such asgilts, to compensate for the increase in risk). The average equity risk premium hasincreased from 3.2% pa last year.
Where disclosed, 27 companies increased their assumed equity return, 25 reduced itand 13 companies did not alter their assumption from the previous year.
Expected long-term rate of return on equities (% pa)
Numberofcompanies
40
35
30
25
20
15
10
5
0
under 6.75 6.75 to 7.24 7.25 to 7.74 7.75 to 8.24 8.25 to 8.24
2007
2008
8.75 or over
2Return calculated relative to published 20-year Bank of England spot yields at the appropriate balance sheet date.
6. Non-UK schemes of the FTSE 100
We have separately analysed the disclosures made by FTSE 100 companies inrelation to their non-UK arrangements and compared these to their UK disclosures.
6.1 Key findings
• Overseas pension and other post-retirement liabilities are significant for manyFTSE 100 companies.
• Local legislation, custom and practice are often different from those in the UK.For example, different rules on funding pension schemes in overseasterritories mean that the funding levels are not directly comparable to those inthe UK.
• Many companies adopt different assumptions for calculating their IAS19liabilities overseas from those that they use in the UK. It is not always clearthat such different treatment is justifiable.
• Risk mitigation is a key issue for FTSE 100 companies in respect of theiroverseas schemes as well as for their UK arrangements. A number ofcompanies have made some disclosure of the measures that they have takento manage pensions risks although, as in the UK, many others have made nodisclosure.
• Some FTSE 100 companies face risks as a result of their participation inoverseas multi-employer pension schemes. The level of contributions,particularly those due on withdrawal from the scheme, are often outside thecontrol of the company.
• Post-retirement medical plans are not common in the UK but a number ofFTSE 100 companies have liabilities overseas, particularly in the USA.
6.2 Analysis of disclosures
Significance of overseas arrangements
50 FTSE 100 companies provided separate details of overseas pension liabilitiesamounting to £56 billion, of which at least a third was for US plans. The averageIAS19 funding level in 2008 was 73% for their overseas pension arrangementscompared to 98% for the UK schemes of the same companies.
A further ten global companies, with total global pension liabilities of £88 billion,disclosed some information on their overseas pension arrangements but did notprovide sufficient breakdown by country or region for us to analyse them.
Figure 1 below shows the 15 companies with the largest disclosed non-UK pensionliabilities relative to market capitalisation at their 2008 year-end. Invensys, Rexamand Royal Bank Of Scotland Group all have non-UK liabilities which exceed 50% ofmarket capitalisation.
40
Accounting For Pensions 2009
NON-UKFINDINGS
View a full list of our services at www.lcp.uk.com
Invensys
Rexam
Royal Bank OfScotland Group

6.1
Figure 2 below shows the 15 companies with the highest overseas pension
liabilities relative to UK pension liabilities. Twelve of these companies have overseas
liabilities which are more than 50% of their UK liabilities. WPP has disclosed that
its overseas liabilities are double its UK liabilities.
41
NON-UKFIN
DINGS
Accounting For Pensions 2009
View a full list of our services at www.lcp.uk.com
WPP
Disclosed non-UK pension liabilities as % of Market Capitalisation
Royal Bank Of Scotland Group
Rexam
Invensys
Xstrata
Aviva
BAE Systems
British Airways
Rolls-Royce Group
Tate & Lyle
WPP
BP
Smiths Group
Wolseley
Barclays
Cadbury
0 10% 20% 30% 40% 50% 60%
Disclosed non-UK liabilities as % of UK liability
WPP
Rexam
Smith & Nephew
BP
Royal Bank Of Scotland Group
Anglo American
AstraZeneca
International Power
GlaxoSmithKline
HSBC Holdings
Reckitt Benckiser
Bunzl
Standard Chartered
Diageo
InterContinental Hotels Group
0 50% 100% 150% 200%
70%
250%
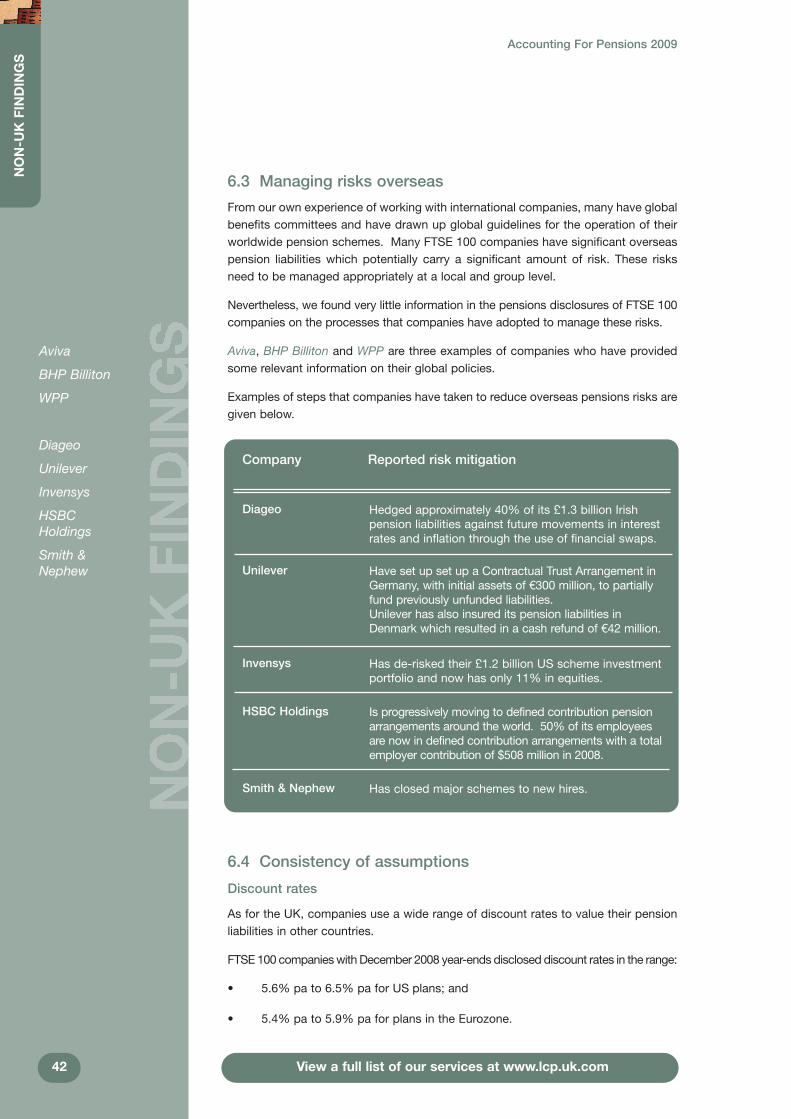
6.3 Managing risks overseas
From our own experience of working with international companies, many have globalbenefits committees and have drawn up global guidelines for the operation of theirworldwide pension schemes. Many FTSE 100 companies have significant overseaspension liabilities which potentially carry a significant amount of risk. These risksneed to be managed appropriately at a local and group level.
Nevertheless, we found very little information in the pensions disclosures of FTSE 100companies on the processes that companies have adopted to manage these risks.
Aviva, BHP Billiton and WPP are three examples of companies who have providedsome relevant information on their global policies.
Examples of steps that companies have taken to reduce overseas pensions risks aregiven below.
6.4 Consistency of assumptions
Discount rates
As for the UK, companies use a wide range of discount rates to value their pensionliabilities in other countries.
FTSE 100 companies with December 2008 year-ends disclosed discount rates in the range:
• 5.6% pa to 6.5% pa for US plans; and
• 5.4% pa to 5.9% pa for plans in the Eurozone.
42
NON-UKFINDINGS
Accounting For Pensions 2009
View a full list of our services at www.lcp.uk.com
Company Reported risk mitigation
Diageo Hedged approximately 40% of its £1.3 billion Irishpension liabilities against future movements in interestrates and inflation through the use of financial swaps.
Unilever Have set up set up a Contractual Trust Arrangement inGermany, with initial assets of €300 million, to partiallyfund previously unfunded liabilities.Unilever has also insured its pension liabilities inDenmark which resulted in a cash refund of €42 million.
Invensys Has de-risked their £1.2 billion US scheme investmentportfolio and now has only 11% in equities.
HSBC Holdings Is progressively moving to defined contribution pensionarrangements around the world. 50% of its employeesare now in defined contribution arrangements with a totalemployer contribution of $508 million in 2008.
Smith & Nephew Has closed major schemes to new hires.
Aviva
BHP Billiton
WPP
Diageo
Unilever
Invensys
HSBCHoldings
Smith &Nephew

Expected return on equities
A number of companies disclose the expected returns on equities for their USschemes. This reveals that companies are using much wider range of assumptionsfor their US schemes (6% pa to 9.5% pa) than they do for their UK schemes. It is notclear why the range should be so much greater for US schemes.
6.5 Life expectancy
As we have highlighted in previous years’ reports, companies adopt a range ofdifferent assumptions about life expectancy.
The table below shows the average life expectancy assumption disclosed byFTSE 100 companies in various countries, with the UK being the highest.
It is not clear that such different treatment is justified.
43
NON-UKFIN
DINGS
Accounting For Pensions 2009
View a full list of our services at www.lcp.uk.com
Expected return on equities for companies with US and UK schemesreporting at 31st December 2008
4
3
2
1
0
US
UK
Numberofcompanies
6% 6.25% 6.5% 6.75% 7% 7.25% 7.5% 8% 8.25% 8.5% 8.75% 9.25%7.75% 9% 9.5%
% pa (rounded to nearest 0.25%)
Country Average FTSE 100 life expectancy fora male age 60 on the accounting date
UK 86.1
Canada 84.2
USA 83.4
Netherlands 83.1
Germany 83.0

6.6 Post-retirement medical plans
Post-retirement medical arrangements are widespread in the USA due to the lowlevels of state-sponsored healthcare for US citizens, and employers have beenencouraged to set up plans which provide healthcare benefits to former employeesonce they reach retirement. The liabilities for these arrangements can be significantwith over £11 billion disclosed by FTSE 100 companies.
BP, GlaxoSmithKline, National Grid and Royal Dutch Shell all have post-retirementhealthcare liabilities of more than £1 billion.
In recent years, spiralling healthcare costs have led to US companies reviewing theirpost-retirement healthcare arrangements. Many companies are likely to havechanged the design to manage those costs, but few have disclosed details in theirmost recent accounts.
6.7 Multi-employer pension schemes
A handful of FTSE 100 companies, including British Airways, Friends Provident, RioTinto and RSA Insurance Group disclose that they participate in multi-employerpension schemes. Such schemes are widespread in countries like the USA, theNetherlands and Sweden.
Contributions to these schemes are usually determined by a scheme board orinsurance company, and companies may not be able to influence the level ofcontributions, particularly when they leave the scheme and have to meet their shareof underfunding.
None of the FTSE 100 companies in overseas multi-employer schemes disclose thelevel of underfunding it may be required to pay if it were to leave the scheme.However the risk is real, and SABMiller disclose it is required to make contributionsof $4 million pa until 2013 to a scheme it left in 1997.
44
NON-UKFINDINGS
Accounting For Pensions 2009
View a full list of our services at www.lcp.uk.com
BP
GlaxoSmithKline
National Grid
Royal Dutch Shell
British Airways
Friends Provident
Rio Tinto
RSA InsuranceGroup
SABMiller

Many FTSE 100 companies have significant overseas
pension liabilities which potentially carry a significant
amount of risk. These risks need to be managed
appropriately at a local and group level.
Colin HainesPartner, LCP
“”VIEWPOINT

Accounting For Pensions 2009
APPENDICES

Appendix1–FTSE100accounting
disclosurelisting
This
tab
lesh
ows
the
key
dis
clos
ures
mad
eb
yth
eco
mp
anie
sin
the
FTS
E10
0as
at31
stD
ecem
ber
2008
that
dis
clos
edsi
gnifi
cant
fund
edd
efin
edb
enef
itlia
bili
ties
inth
eir
2008
acco
unts
.Th
eso
urce
ofth
ed
ata
isea
chco
mp
any’
san
nual
rep
orta
ndac
coun
tsfo
rthe
acco
untin
gp
erio
den
din
gin
2008
.The
mar
ketv
alue
ofas
sets
and
surp
lus/
(def
icit)
figur
esb
efor
eta
xre
late
toth
ew
orld
wid
ep
ositi
onof
each
com
pan
y,no
tju
stth
eU
Ksc
hem
es.A
llfig
ures
are
roun
ded
toth
ene
ares
tm
illio
np
ound
s.Th
eas
sum
ptio
nsfo
rth
ed
isco
unt
rate
and
pric
ein
flatio
nre
fer
toth
ose
dis
clos
edfo
rth
eco
mp
anie
s’m
ain
UK
sche
mes
whe
reav
aila
ble
.“N
D”
mea
nsno
UK
figur
esw
ere
dis
clos
ed.
3iG
roup
Mar
477
(38)
(38)
6.00
3.50
ND
Y47
9(1
)(1
)5.
003.
00N
DY
Alli
ance
Trus
t(T
he)
Jan
212
26.
003.
357.
20Y
210
05.
253.
257.
50N
Am
ecD
ec1,
221
156
156
6.00
2.80
7.30
Y1,
328
237
237
5.70
3.20
8.10
N
Am
linD
ec25
6(4
)(4
)6.
302.
807.
50Y
318
2323
5.70
3.40
7.60
Y
Ang
loA
mer
ican
Dec
1,43
0(5
8)17
ND
ND
ND
Y1,
574
2781
ND
ND
ND
Y
Ass
ocia
ted
Brit
ish
Food
sS
ep2,
424
9612
66.
003.
707.
70Y
2,47
431
034
15.
803.
307.
30Y
Ast
raZ
enec
aD
ec4,
051
(1,9
20)
(1,5
11)
6.20
2.80
7.90
Y4,
492
(1,0
22)
(789
)5.
803.
308.
00Y
Avi
va2
Dec
9,33
8(6
13)
(509
)6.
202.
906.
30Y
9,83
9(1
78)
(71)
5.80
3.40
9.20
N
BA
ES
yste
ms3
Dec
12,9
78(4
,155
)(4
,013
)6.
302.
908.
25Y
15,1
10(1
,999
)(1
,901
)5.
803.
308.
00N
Bar
clay
s4D
ec14
,496
(1,1
19)
(990
)6.
753.
168.
50Y
18,0
2755
164
15.
823.
458.
30Y
BG
Gro
up4
Dec
506
(191
)(1
64)
6.30
3.30
8.20
Y59
1(1
63)
(136
)5.
603.
507.
90N
BH
PB
illito
nJu
n88
4(6
1)(2
7)6.
603.
808.
40Y
878
(16)
165.
803.
408.
60N
BP
Dec
17,9
59(3
,918
)(2
79)
6.30
3.00
8.00
Y21
,418
1,42
94,
272
5.70
3.20
8.00
Y
Brit
ish
Airw
ays4
Mar
14,2
7272
272
96.
803.
50N
DN
13,3
16(1
,294
)(1
,287
)5.
353.
00N
DN
Brit
ish
Am
eric
anTo
bac
coD
ec4,
169
(583
)(4
54)
6.00
2.90
6.90
Y4,
209
(150
)(3
9)5.
803.
407.
50Y
Brit
ish
Ene
rgy
Gro
upM
ar2,
710
(216
)(2
16)
6.00
3.30
8.00
Y2,
671
(65)
(65)
5.40
3.00
8.30
Y
Brit
ish
Land
Com
pan
y5M
ar80
00
6.00
5.60
7.00
Y79
99
5.40
3.20
7.00
N
BT
Gro
upM
ar37
,448
2,77
92,
779
6.85
3.50
8.50
Y38
,390
(389
)(3
89)
5.35
3.00
7.40
Y
Bun
zlD
ec20
2(5
1)(3
7)N
DN
DN
DN
230
(14)
(4)
ND
ND
ND
N
Cab
le&
Wire
less
Mar
2,34
239
142
76.
803.
508.
00Y
2,28
951
915.
303.
007.
80N
Cad
bur
yD
ec2,
269
(225
)(1
44)
6.10
2.65
8.00
Y2,
742
117
174
5.80
3.25
8.00
Y
Cap
itaG
roup
Dec
427
(25)
(25)
6.20
2.70
6.65
Y48
84
45.
903.
207.
60Y
Car
niva
lN
ov12
34
46.
503.
00N
DY
145
1313
5.90
3.15
ND
Y
Cen
tric
aD
ec2,
642
(113
)(8
9)6.
703.
308.
50Y
3,32
797
128
5.80
3.40
8.10
Y
Cob
ham
Dec
407
(51)
(51)
6.30
3.00
ND
Y42
1(3
7)(3
7)5.
823.
30N
DY
Com
pas
sG
roup
Sep
1,41
9(1
33)
66.
403.
607.
80Y
1,44
2(7
0)64
5.80
3.20
8.00
Y
Dia
geo
Jun
5,16
5(3
94)
(252
)6.
704.
008.
30Y
5,01
9(4
02)
(272
)5.
803.
208.
40Y
Dra
xG
roup
Dec
94(2
1)(2
1)6.
103.
00N
DY
105
(14)
(14)
5.80
3.40
ND
Y
Exp
eria
nM
ar52
574
916.
903.
609.
10Y
545
5372
5.40
3.10
8.10
Y
Firs
tGro
upM
ar2,
911
123
123
6.85
3.30
8.95
N2,
507
1818
5.45
2.80
8.45
N
Company
Year-end
Market
valueof
assets
Total
Funded
schemes
Discount
rate
Inflation
Expected
returnon
equities
Disclosed
Mortality?1
Market
valueof
assets
Total
Funded
schemes
Discount
rate
Inflation
Expected
returnon
equities
Disclosed
Mortality?1
£m£m
£m%pa
%pa
%pa
£m£m
£m%pa
%pa
%pa
2008
Surplus/(deficit)
Surplus/(deficit)
2007

Appendix1–continued
Frie
nds
Pro
vid
ent6
Dec
1,17
191
935.
98S
eeno
te6
6.87
Y1,
126
(22)
(20)
5.51
3.53
7.16
Y
G4S
Dec
1,12
1(3
28)
(286
)6.
303.
10N
DY
1,24
0(1
67)
(136
)5.
803.
40N
DN
Gla
xoS
mith
Klin
eD
ec9,
288
(1,6
92)
(1,3
74)
6.20
2.70
7.75
Y10
,182
(156
)10
35.
753.
258.
00N
Ham
mer
son
Dec
42(8
)2
6.50
2.80
ND
Y47
(6)
15.
903.
20N
DY
HB
OS
7D
ec7,
241
532
581
6.25
3.00
7.55
Y7,
329
(294
)(2
50)
5.70
3.40
ND
Y
Hom
eR
etai
lGro
upM
ar64
784
946.
103.
508.
10Y
637
920
4.90
3.10
7.90
Y
HS
BC
Hol
din
gsD
ec14
,330
(2,1
64)
(1,8
10)
6.50
2.90
8.10
Y15
,175
(953
)(7
44)
5.80
3.30
8.30
Y
ICA
PM
ar6
(1)
(1)
ND
ND
ND
N6
(1)
(1)
ND
ND
ND
N
Imp
eria
lTob
acco
Gro
upS
ep2,
769
(105
)43
77.
303.
408.
20Y
3,23
820
559
05.
903.
408.
10Y
Inm
arsa
tD
ec24
(8)
(5)
6.10
3.15
8.15
Y26
(7)
(3)
5.80
3.45
7.75
Y
Inte
rCon
tinen
talH
otel
sG
roup
Dec
379
(32)
215.
603.
007.
90Y
378
(13)
335.
503.
407.
90Y
Inte
rnat
iona
lPow
er4
Dec
219
(82)
(82)
5.70
2.90
7.40
Y26
4(5
)(5
)5.
803.
408.
00Y
Inve
nsys
Mar
4,72
2(1
91)
(72)
6.10
3.70
8.30
Y4,
681
(489
)(3
70)
5.35
3.20
7.90
N
John
son
Mat
they
Mar
915
4654
6.50
3.50
8.00
Y95
230
345.
403.
107.
75N
Kin
gfis
her
Feb
1,47
277
856.
203.
308.
10Y
1,37
7(5
5)(3
9)5.
302.
907.
80Y
Land
Sec
uriti
esG
roup
Mar
139
1515
6.90
3.60
7.50
Y14
4(6
)(6
)5.
403.
257.
50Y
Lega
l&G
ener
alG
roup
Dec
1,04
7(1
40)
(140
)6.
502.
707.
00Y
1,20
2(1
82)
(182
)5.
703.
407.
50Y
Lib
erty
Inte
rnat
iona
lD
ec50
(6)
(6)
5.70
2.70
ND
Y59
(0)
(0)
5.60
3.20
ND
Y
Lloy
ds
TSB
Gro
up4,
7D
ec13
,693
(1,9
24)
(1,9
24)
6.30
3.00
8.20
Y16
,112
(683
)(6
83)
5.80
3.30
8.00
Y
Lond
onS
tock
Exc
hang
eG
roup
Mar
233
412
6.60
3.60
7.90
Y22
5(1
5)(1
5)5.
303.
107.
60Y
Man
Gro
up4
Mar
172
(5)
(5)
6.90
3.80
8.30
Y18
2(2
5)(2
5)5.
403.
208.
00N
Mar
ks&
Sp
ence
rG
roup
Mar
5,04
650
250
36.
803.
508.
30Y
5,22
8(2
61)
(260
)5.
303.
008.
40Y
Mor
rison
(Wm
)Sup
erm
arke
tsFe
b1,
939
(68)
(68)
5.75
3.75
7.00
Y1,
774
(198
)(1
98)
5.00
3.20
7.00
Y
Nat
iona
lGrid
Mar
16,5
3614
530
36.
603.
70N
DY
15,4
68(6
59)
(576
)5.
403.
20N
DY
Nex
tJa
n38
3(4
6)(4
0)6.
153.
507.
30Y
380
(47)
(41)
5.30
3.00
6.55
Y
Old
Mut
ual4
Dec
828
5050
5.65
2.95
7.75
N85
518
018
05.
003.
337.
75N
Pea
rson
Dec
1,57
8(1
6)0
6.40
2.80
ND
Y1,
853
4254
5.80
3.30
ND
Y
Pru
den
tial2
Dec
5,21
454
172
16.
103.
006.
80Y
5,32
230
749
65.
903.
307.
50Y
Rec
kitt
Ben
ckis
erD
ec71
0(1
71)
(171
)6.
502.
607.
70Y
873
(60)
(60)
5.80
3.30
7.90
Y
Ree
dE
lsev
ier
Dec
2,68
2(3
69)
(241
)N
DN
DN
DN
3,01
850
141
ND
ND
ND
N
Rex
amD
ec2,
505
(81)
(5)
6.00
2.80
7.47
Y2,
361
(63)
(3)
5.60
3.30
7.87
Y
Rio
Tint
oD
ec7,
295
(1,8
26)
(1,2
07)
6.30
2.80
7.70
Y8,
116
(1,2
87)
(237
)5.
903.
407.
50Y
Rol
ls-R
oyce
Gro
upD
ec7,
446
900
1,33
76.
403.
007.
20Y
6,90
3(9
)27
55.
803.
507.
80N
Roy
alB
ank
Of
Sco
tland
Gro
upD
ec25
,756
(1,9
96)
(1,7
95)
6.50
2.70
8.40
Y27
,662
115
327
6.00
3.20
8.10
Y
Roy
alD
utch
She
ll4D
ec29
,679
(5,5
88)
(3,7
89)
ND
ND
ND
Y37
,692
6,76
48,
004
ND
ND
ND
N
RS
AIn
sura
nce
Gro
upD
ec5,
042
506
581
6.20
2.80
7.50
Y5,
244
158
232
5.60
3.20
7.50
N
Company
Year-end
Market
valueof
assets
Total
Funded
schemes
Discount
rate
Inflation
Expected
returnon
equities
Disclosed
Mortality?1
Market
valueof
assets
Total
Funded
schemes
Discount
rate
Inflation
Expected
returnon
equities
Disclosed
Mortality?1
£m£m
£m%pa
%pa
%pa
£m£m
£m%pa
%pa
%pa
2008
Surplus/(deficit)
Surplus/(deficit)
2007

APPENDIX
1Th
isco
lum
nin
dic
ates
com
pan
ies
who
dis
clos
edsu
ffici
ent
info
rmat
ion
toca
lcul
ate
thei
ras
sum
ptio
nfo
rlif
eex
pec
tanc
yfo
ra
mal
ep
ensi
oner
aged
60in
the
UK
.
2A
viva
,Leg
al&
Gen
eral
and
Pru
den
tials
plit
thei
rp
ensi
onsc
hem
esu
rplu
s/(d
efic
it)b
etw
een
shar
ehol
der
and
with
-pro
fitfu
nds.
3B
AE
Sys
tem
sal
loca
ted
£891
mof
its20
08d
efic
it(£
450m
in20
07)t
oeq
uity
acco
unte
din
vest
men
tsan
dot
her
par
ticip
atin
gem
plo
yers
.
4Th
e20
08fig
ures
are
asat
the
end
ofth
eac
coun
ting
per
iod
sen
din
gin
2008
.Th
e20
07fig
ures
are
asat
the
star
tof
the
acco
untin
gp
erio
d.
All
figur
essh
own
abov
ew
ere
take
nfr
omIA
S19
dis
clos
ures
.A
llof
the
com
pan
ies
abov
eac
coun
ted
usin
gim
med
iate
reco
gniti
onof
gain
san
dlo
sses
(thro
ugh
the
SO
RIE
),w
ithth
eex
cep
tion
ofB
arcl
ays,
BG
Gro
up,
Brit
ish
Airw
ays,
Inte
rnat
iona
lPow
er,
Lloy
ds
TSB
Gro
up,
Man
Gro
up,
Old
Mut
ual,
Roy
alD
utch
She
llan
dTh
omso
nR
eute
rsw
hoop
ted
tosp
read
gain
san
dlo
sses
und
erIA
S19
.
5W
hils
tB
ritis
hLa
ndC
omp
any
dis
clos
edits
infla
tion
assu
mp
tion
and
sala
ryin
crea
seas
sum
ptio
nat
31st
Mar
ch20
08to
be
5.6%
pa
and
3.4%
pa
resp
ectiv
ely,
we
susp
ect
this
isa
typ
ogra
phi
cale
rror
and
the
figur
essh
ould
be
reve
rsed
.
6Fr
iend
sP
rovi
den
td
idno
td
iscl
ose
anin
flatio
nra
teas
sum
ptio
nas
at31
stD
ecem
ber
2008
only
stat
ing
that
itw
asb
ased
onth
eC
itigr
oup
Zer
oC
oup
onR
PIs
wap
scu
rve.
7 On
19th
Janu
ary
2009
Lloy
ds
TSB
Gro
upw
asre
nam
edLl
oyd
sB
anki
ngG
roup
,fol
low
ing
the
acq
uisi
tion
ofH
BO
S.
The
mar
ketv
alue
ofas
sets
and
surp
lus/
(def
icit)
figur
esb
efor
eta
xre
late
toth
ew
orld
wid
ep
ositi
onof
each
com
pan
y,no
tjus
tthe
UK
dis
clos
ure.
Trad
ition
ally
,som
eco
mp
anie
sw
ithov
erse
asp
ensi
onsc
hem
esd
ono
tfun
dth
emvi
aan
exte
rnal
sche
me,
inst
ead
bac
king
the
pen
sion
sche
me
with
com
pan
yas
sets
,whi
chm
ayre
sult
ina
larg
erd
efic
itb
eing
dis
clos
ed.W
here
dis
clos
ed,t
hesu
rplu
s/(d
efic
it)at
trib
utab
leto
fund
edsc
hem
esis
also
show
nab
ove.
All
figur
esar
ero
und
edto
the
near
est
mill
ion
pou
nds.
The
figur
esha
veb
een
conv
erte
dto
Ste
rling
whe
rea
com
pan
yha
sre
por
ted
figur
esin
itsac
coun
tsin
ad
iffer
ent
curr
ency
.
The
assu
mp
tions
for
dis
coun
tra
tean
dp
rice
infla
tion
refe
rto
thos
ed
iscl
osed
for
the
com
pan
ies’
mai
nU
Ksc
hem
e(s)
.W
here
aco
mp
any
has
dis
clos
eda
rang
eof
assu
mp
tions
,w
eha
veta
ken
the
mid
-poi
nt.
Whe
rea
com
pan
yop
erat
esp
ensi
onsc
hem
esin
mor
eth
anon
eco
untr
y,w
eha
veco
nsid
ered
the
assu
mp
tions
used
for
UK
ifse
par
atel
ygi
ven.
“ND
”m
eans
noU
Kfig
ures
wer
ed
iscl
osed
.
We
have
excl
uded
from
our
surv
eyth
efo
llow
ing
ten
com
pan
ies
who
had
noev
iden
ceof
sign
ifica
ntfu
nded
def
ined
ben
efit
pro
visi
on:
Ant
ofag
asta
,A
uton
omy
Cor
por
atio
n,A
dm
iralG
roup
,B
ritis
hS
kyB
road
cast
ing,
Cai
rnE
nerg
y,E
uras
ian
Nat
ural
Res
ourc
esC
orp
orat
ion,
Kaz
akhm
ys,R
and
gold
Res
ourc
es,S
hire
and
Tullo
wO
il.
The
follo
win
gfiv
eco
mp
anie
sha
veen
tere
dth
eFT
SE
100
ind
exsi
nce
31st
Dec
emb
er20
08an
dhe
nce
are
noti
nclu
ded
inou
rsu
rvey
:For
eign
&C
olIn
vest
Trus
t,Fr
esni
llo,I
nter
tek
Gro
up,L
onm
inan
dP
etro
fac.
The
follo
win
gfiv
eco
mp
anie
sha
veex
ited
the
FTS
E10
0in
dex
sinc
e31
stD
ecem
ber
2008
:Am
lin,D
rax
Gro
up,F
irstG
roup
,Ta
te&
Lyle
and
Whi
tbre
ad.
SA
BM
iller
Mar
681
(186
)(6
7)N
DN
DN
DY
564
(160
)(6
5)N
DN
DN
DY
Sag
eG
roup
Sep
16(4
)(4
)N
DN
DN
DN
13(5
)(5
)N
DN
DN
DN
Sai
nsb
ury
(J)
Mar
4,17
149
550
36.
90N
DN
DY
4,29
8(1
03)
(97)
5.30
ND
ND
Y
Sch
rod
ers
Dec
548
2222
5.70
3.00
7.80
Y55
543
435.
703.
107.
80Y
Sco
ttis
h&
Sou
ther
nE
nerg
yM
ar2,
081
162
162
6.90
3.50
8.00
Y2,
110
(92)
(92)
5.40
3.10
8.00
Y
Ser
coG
roup
Dec
1,19
4(1
49)
(98)
ND
ND
ND
Y1,
343
(158
)(1
20)
ND
ND
ND
Y
Sev
ern
Tren
tM
ar1,
332
(126
)(1
20)
6.40
3.40
8.00
Y1,
365
(135
)(1
28)
5.40
3.00
8.25
Y
Sm
ith&
Nep
hew
Dec
467
(224
)(2
10)
6.10
3.20
7.90
Y51
6(7
7)(6
6)5.
803.
307.
60Y
Sm
iths
Gro
upJu
l2,
960
4910
36.
603.
608.
20Y
3,31
924
830
05.
803.
108.
20N
Sta
ndar
dC
hart
ered
Dec
1,18
2(2
89)
(184
)6.
402.
908.
00Y
1,25
3(1
52)
(23)
5.90
3.20
8.50
Y
Sta
ndar
dLi
feD
ec1,
629
116
153
6.10
3.35
ND
Y1,
384
(203
)(1
55)
5.75
3.45
ND
N
Tate
&Ly
leM
ar1,
112
(16)
(16)
6.60
3.60
8.50
Y1,
188
(52)
(52)
5.40
3.00
7.80
Y
Tesc
oFe
b4,
089
(838
)(8
04)
6.40
3.50
8.90
Y4,
007
(950
)(9
23)
5.20
3.00
8.10
Y
Thom
asC
ook
Gro
upS
ep58
2(1
90)
(26)
ND
ND
ND
Y63
5(1
75)
(13)
ND
ND
ND
N
Thom
son
Reu
ters
4D
ec2,
503
(133
)24
ND
ND
ND
N1,
148
(12)
95N
DN
DN
DN
TUIT
rave
lS
ep92
4(2
54)
(190
)6.
903.
608.
20Y
995
(294
)(2
31)
5.60
3.40
7.90
Y
Uni
leve
rD
ec11
,447
(2,5
91)
(1,3
40)
6.50
2.80
7.80
Y12
,654
(225
)89
35.
803.
008.
00N
Uni
ted
Util
ities
Mar
1,86
3(1
01)
(94)
5.95
3.40
ND
Y2,
706
6169
5.25
3.00
ND
Y
Ved
anta
Res
ourc
esM
ar14
(21)
(21)
ND
ND
ND
N9
(18)
(18)
ND
ND
ND
N
Vod
afon
eG
roup
Mar
1,27
1(3
9)54
ND
ND
ND
Y1,
251
(41)
57N
DN
DN
DY
Whi
tbre
adFe
b1,
372
(33)
(33)
6.20
3.40
8.30
Y1,
366
(196
)(1
96)
5.20
3.00
8.00
N
Wol
sele
yJu
l67
2(2
36)
(173
)6.
304.
008.
20Y
711
(107
)(5
3)5.
703.
307.
90Y
WP
PD
ec55
0(2
69)
(129
)6.
002.
807.
30Y
504
(134
)(4
0)5.
803.
307.
30N
Xst
rata
Dec
1,14
6(2
17)
(213
)N
DN
DN
DN
1,25
7(1
14)
(111
)N
DN
DN
DN
Company
Year-end
Market
valueof
assets
Total
Funded
schemes
Discount
rate
Inflation
Expected
returnon
equities
Disclosed
Mortality?1
Market
valueof
assets
Total
Funded
schemes
Discount
rate
Inflation
Expected
returnon
equities
Disclosed
Mortality?1
£m£m
£m%pa
%pa
%pa
£m£m
£m%pa
%pa
%pa
2008
Surplus/(deficit)
Surplus/(deficit)
2007

50
Accounting For Pensions 2009
Largest deficits
View a full list of our services at www.lcp.uk.com
Appendix 2 – FTSE 100 accounting risk measures
Largest liabilities
Largest liabilities compared to market capitalisation
These tables show the key results ofanalysis of the disclosures made by thecompanies in the FTSE 100 as at 31stDecember 2008 that were reported intheir 2008 accounts. The figures relateto the worldwide position of eachcompany (not just the UK disclosure)but excludes healthcare and definedcontribution pension arrangementswhere possible.
The source of the data is eachcompany’s annual report and accountsfor the accounting period ending in2008.
The surplus/(deficit) figures are beforeallowing for deferred tax.
Traditionally, some companies withoverseas pension schemes do not fundthem via an external scheme, insteadbacking the pension scheme withcompany assets, which may result in alarger deficit being disclosed.
The source of market capitalisationfigures is the FTSE All-Share IndexSeries Weightings reports as at thecompanies’ year-ends.
All figures shown here have beencalculated using unrounded numbers.Therefore, some metrics shown maydiffer to those calculated using therounded figures.
Name 2008Liabilities £m
2007Liabilities £m
Royal Dutch Shell 35,267 30,927
BT Group 34,669 38,779
Royal Bank Of Scotland Group 27,752 27,547
BP 21,877 19,989
BAE Systems1 17,133 17,109
HSBC Holdings 16,494 16,128
Name 2008Deficit £m
2007Deficit £m
Royal Dutch Shell 5,588 -6,764
BAE Systems1 4,155 1,999
BP 3,918 -1,429
Unilever 2,591 225
HSBC Holdings 2,164 953
Royal Bank Of Scotland Group 1,996 -115
Name Liabilities£m
Market Cap£m
2008Liabilities /Market Cap %
2007Liabilities /
Market Cap %
British Airways 13,550 2,694 503 261
Invensys 4,913 1,791 274 229
Lloyds TSB Group 15,617 7,526 208 63
BT Group 34,669 17,091 203 153
HBOS 6,709 3,716 181 28
Royal Bank Of Scotland Group 27,752 19,602 142 31
1BAE Systems allocated £891 million of its 2008 deficit (£450 million in 2007) to equity accounted investments and other participating employers.

51
APPENDIX
Accounting For Pensions 2009
Lowest funding level
View a full list of our services at www.lcp.uk.com
Largest deficit compared to market capitalisation
Name Deficit£m
Market Cap£m
2008Deficit /
Market Cap %
2007Deficit /
Market Cap %
BAE Systems1 4,155 13,285 31 11
Lloyds TSB Group 1,924 7,526 26 3
G4S 328 2,887 11 5
Invensys 191 1,791 11 22
TUI Travel 254 2,410 11 10
Wolseley 236 2,246 11 2
Highest funding level
Name Assets£m
Liabilities£m
2008Assets /
Liabilities %
2007Assets /
Liabilities %
Cable & Wireless 2,342 1,951 120 102
Experian 525 451 116 111
Home Retail Group 647 563 115 101
Amec 1,221 1,065 115 122
Rolls-Royce Group 7,446 6,546 114 100
Sainsbury (J) 4,171 3,676 113 98
Name Assets£m
Liabilities£m
2008Assets /
Liabilities %
2007Assets /
Liabilities %
WPP 550 819 67 79
Smith & Nephew 467 690 68 87
AstraZeneca 4,051 5,971 68 81
BG Group 506 697 73 78
International Power 219 301 73 98
Wolseley 672 908 74 87

52
Accounting For Pensions 2009
View a full list of our services at www.lcp.uk.com
Appendix 2 – continued
Largest employer contributions compared to service cost2
2The service cost (representing the value of benefits earned over the accounting period) includes the value of any past service benefits awarded to members during the year.
Largest employer contributions
Name2008
Contribut’ns£m
2007Contribut’ns
£m
British Airways 944 543
Royal Dutch Shell 888 628
Royal Bank Of ScotlandGroup
810 599
BT Group 708 926
BAE Systems 598 594
Unilever 594 790
Name Contributions£m
Service Cost£m
2008Contributions /Service Cost %
2007Contributions /Service Cost %
British Airways 944 199 474 163
Legal & General Group 58 13 446 229
Morrisons 193 44 439 177
Invensys 116 27 430 98
National Grid 465 127 366 240
Kingfisher 103 29 355 305
Largest employer contributions compared to dividends paid
Name Contributions£m
Dividends£m
2008Contributions /Dividends %
2007Contributions /Dividends %
Invensys 116 1 11,600 6
Serco Group 61 22 284 18
Morrisons 193 108 179 104
BAE Systems 598 489 122 67
TUI Travel 70 70 100 47
FirstGroup 75 81 94 72
Largest service cost2
Name2008ServiceCost £m
2007ServiceCost £m
Royal Bank Of ScotlandGroup
733 706
Royal Dutch Shell 612 545
BT Group 576 600
BP 483 433
Tesco 461 208
HSBC Holdings 416 404

53
Accounting For Pensions 2009
View a full list of our services at www.lcp.uk.com
Largest Equity Allocation
Name 2008 EquityAllocation %
2007 EquityAllocation %
Inmarsat 84 84
Centrica 71 75
BP 71 75
Vodafone Group 69 72
HomeRetail Group 68 70
Experian 66 69
Smallest Equity Allocation
Name 2008 EquityAllocation %
2007 EquityAllocation %
Hammerson 0 0
Sage Group 9 12
Invensys 13 23
London StockExchange Group
14 16
Prudential 17 25
Rolls-Royce Group 17 26
Largest dividends paid compared to deficits
Smallest dividends paid compared to deficits
Name
Dividends £m Deficit £m
2008Dividends /Deficit %
2007Dividends /Deficit %
Vodafone Group 3,771 39 9,669 8,754
ICAP 96 1 9,590 4,964
Man Group 288 5 6,343 636
Sage Group 106 4 2,723 925
Anglo American 1,267 58 2,186 N/A
Liberty International 123 6 2,016 61,050
Name
Dividends £m Deficit £m
2008Dividends /Deficit %
2007Dividends /Deficit %
Invensys 1 191 1 1
BAE Systems1 489 4,155 12 20
Serco Group 22 149 14 12
Smith & Nephew 59 224 26 68
G4S 87 328 27 38
TUI Travel 70 254 28 5

54
Accounting For Pensions 2009
View a full list of our services at www.lcp.uk.com
Appendix 2 – continued
Largest % decrease in funding level
Name2008
Funding level%
2007Funding level
%
Decrease inFunding level
%
Royal Dutch Shell 84 122 38
International Power 73 98 25
BP 82 107 25
Old Mutual 106 127 21
Smith & Nephew 68 87 19
Unilever 82 98 16
3 Figures calculated as a percentage of assets at the start of the accounting year.
Largest % increase in funding level
Name2008
Funding level%
2007Funding level
%
Increase inFunding level
%
Standard Life 108 87 21
Cable & Wireless 120 102 18
Land Securities Group 112 96 16
Sainsbury (J) 113 98 15
Marks & Spencer Group 111 95 16
British Airways 105 91 14
Largest gain on assets3
Name2008Gain%
2007Gain%
Standard Life 14 5
Rolls-Royce Group 8 9
Friends Provident 3 7
Schroders -1 7
HBOS -2 8
Old Mutual -2 10
Largest loss on assets3
Name2008Loss%
2007Loss%
Royal Dutch Shell 29 -9
Centrica 26 -6
Legal & General Group 22 -2
Inmarsat 21 -8
BG Group 21 -11
International Power 20 -9

55
Accounting For Pensions 2009
Notes
View a full list of our services at www.lcp.uk.comView a full list of our services at www.lcp.uk.com

56
Accounting For Pensions 2009
Notes
View a full list of our services at www.lcp.uk.com


*
UK
Lane Clark & Peacock LLP
30 Old Burlington Street
London W1S 3NN
Tel: +44 (0)20 7439 2266
Fax: +44 (0)20 7439 0183
UK
Lane Clark & Peacock LLP
St Paul’s House
St Paul’s Hill
Winchester
Hampshire SO22 5AB
Tel: +44 (0)1962 870 060
Fax: +44 (0)1962 849 802
Belgium
Lane Clark & Peacock
Belgium CVBA
Marcel Thirylaan 200
Avenue Marcel Thiry 200
B-1200 Brussel
Bruxelles, Belgium
Tel: +32 (0)2 761 45 45
Fax: +32 (0)2 761 45 46
Ireland
Lane Clark & Peacock
Ireland Limited
Office 2
Grand Canal Wharf
South Dock Road
Dublin 4 Ireland
Tel: +353 (0)1 614 43 93
Fax: +353 (0)1 668 63 03
Jersey
Lane Clark & Peacock LLP
Oriel House
York Lane, St Helier
Jersey JE2 4YH
Tel: +44 (0)1534 887 600
Fax: +44 (0)1534 837 888
Netherlands
Lane Clark & Peacock
Netherlands B.V.
“Galghenwert” (9th floor)
Herculesplein 40
3584 AA Utrecht
Netherlands
Tel: +31 (0)30 256 76 30
Fax: +31 (0)30 256 76 31
Switzerland
LCP Libera AG
Stockerstrasse 34
Postfach
CH-8022 Zürich
Switzerland
Tel: +41 (0)43 817 73 00
Fax: +41 (0)43 817 73 99
Switzerland
LCP Libera AG
Aeschengraben 10
Postfach
CH-4010 Basel
Switzerland
Tel: +41 (0)61 205 74 00
Fax: +41 (0)61 205 74 99
UK Professional Pensions AwardsFT Business Pension &
Investment Provider AwardsCorporate Adviser Awards
Actuarial Consultancy of the Year 2005 | 2006 | 2007Investment Consultancy of the Year 2007
Actuarial Consulting 2007 | 2008Investment Consulting 2007 | 2008
Best Member Communication Strategy 2008Best use of Technology by a Corporate Adviser 2008Best Strategy for Investment Advice on Pensions 2009
* No regulated business is carried out from this officeAll rights to this document are reserved to Lane Clark & Peacock LLP. This document may be reproduced in whole or in part, without permission, provided prominent acknowledgement of the source is given. LCP is a limited liability partnership registered in England and Wales with registered number OC301436. LCP is a registered trademark in the UK (Regd. TM No 2315442) and in the EU (Regd. TM No 02935583). All partners are members of Lane Clark & Peacock LLP. A list of members’ names is available for inspection at 30 Old Burlington Street W1S 3NN, the firm’s principal place of business and registered office.The firm is regulated by the Institute of Actuaries in respect of a range of investment business activities. LCP is part of the Alexander Forbes group of companies, employing over 4000 people internationally.
www.lcp.uk.com www.lcpeurope.com
A member of the Multinational Group of Actuaries & Consultants. www.mgac.orgMain offices in: AFRICA ASIA AUSTRALIA EUROPE AND NORTH AMERICA


