We appreciate the comments of Dan Kahan, Ed Laumann, Bill Landes, Sam Peltzman, John * Wallis, and seminar participants at Clemson University, and the research assistance of John Allread and Rob McMillan. Accounting for the Growth of Government * by Gary S. Becker and Casey B. Mulligan University of Chicago November 1999 preliminary, for discussion only Abstract Why has government grown in so many countries during the 20th century? We present a simple model of political competition and show how different sources of the growth of government have different effects on the amount and structure of taxes, spending, and regulatory programs undertaken by the government. Those sources include: demographic shifts, more efficient taxes, more efficient spending, a shift in the “political power” from those taxed to those subsidized, shifts in political power among taxed groups, and shifts in political power among subsidized groups. We also show how the effects of each source varies according to the model of public decision-making. Based on a variety of empirical indicators of regulation, we suggest that regulation has grown over the last 100 years, but less rapidly than tax revenues. Regulation grew more slowly during the 1980's and, according to some measures, declined. We suggest that the long term regulatory and budgetary trends are consistent with growth in the political power of those subsidized – especially the elderly. The 1980's decline in regulation together with its growth in taxes is not consistent with any one of the theories of government growth.
Transcript
We appreciate the comments of Dan Kahan, Ed Laumann, Bill Landes, Sam Peltzman, John*
Wallis, and seminar participants at Clemson University, and the research assistance of John Allread andRob McMillan.
Accounting for the Growth of Government*
by
Gary S. Becker and Casey B. Mulligan
University of Chicago
November 1999
preliminary, for discussion only
Abstract
Why has government grown in so many countries during the 20th century? We present a simplemodel of political competition and show how different sources of the growth of government have differenteffects on the amount and structure of taxes, spending, and regulatory programs undertaken by thegovernment. Those sources include: demographic shifts, more efficient taxes, more efficient spending, ashift in the “political power” from those taxed to those subsidized, shifts in political power among taxedgroups, and shifts in political power among subsidized groups. We also show how the effects of eachsource varies according to the model of public decision-making.
Based on a variety of empirical indicators of regulation, we suggest that regulation has grown overthe last 100 years, but less rapidly than tax revenues. Regulation grew more slowly during the 1980's and,according to some measures, declined. We suggest that the long term regulatory and budgetary trends areconsistent with growth in the political power of those subsidized – especially the elderly. The 1980'sdecline in regulation together with its growth in taxes is not consistent with any one of the theories ofgovernment growth.
I. Introduction
Why has government grown in so many countries during the 20th century? Many explanations
have been proposed, explanations ranging from an increased demand for government services to changes
in the distribution of skill. Our study helps estimate the importance of each theory by partitioning the set
of possible explanations according to their implications for the quantity, composition, and incidence of
taxes, spending, and regulation. The partition is the following categories:
(i) increases in the efficiency of taxes, spending, and/or regulation
(ii) decreases (increases) in the political power of taxpayers (those subsidized)
(iii) changes in the political power of particular taxpaying or subsidized groups
(iv) demographic shifts
We begin with an interest group model to derive the implications of (i)-(iv) for the quantity,
composition, and incidence of taxes, spending, and regulation. The “social redistribution” and “merit
good” models often have similar implications for the effects of (i)-(iv) on taxes, spending, and regulation;
we discuss those cases when the three models differ.
We present some evidence on the growth of American federal, state and municipal spending
together with some crude aggregate measures of federal regulation over the period 1890-1990, and the
subperiods 1890-1930, 1930-1980, 1980-1990. Improvements in the measurement of the quantity,
composition, and incidence of regulation are desperately needed, but the empirical analysis serves three
purposes. First, it illustrates how one might account for the growth of government using our framework.
Second, we compare a remarkable variety of aggregate measures of federal regulation and show how each
of them apparently grows less rapidly than taxes and spending. Third, we offer some tentative conclusions
regarding the sources of the growth of government. Growth in the “political power” of the elderly appears
to be an important source of the growth of government because both spending and regulation benefitting
the elderly has grown relatively rapidly over the entire period – and probably over each of the subperiods.
More efficient means of tax collection may have facilitated the growth of government between 1890 and
Accounting for Government - 2
1980, since nonelderly government programs have also grown (albeit less slowly) and spending apparently
more rapidly than regulation. The 1980's witnessed a reduction in regulation, an increase in government
spending (although at a slower rate than for previous periods), and a constant share of government
spending on the elderly despite their substantial growth in numbers, which we cannot explain with any
single one of the theories we consider.
We show how, in principle, a study of the quantity, composition, and incidence of taxes, spending,
and regulation can not only distinguish among potential causes for the growth of government, but also
among the various models of public decision-making by which those causes affect public policy. This
proves to be difficult in practice because each of the models considered – interest group competition, social
redistribution, and merit goods – have in common the majority of their implications for public policy
responses to various stimuli. If, as our evidence suggests, increased tax efficiency and power of the elderly
are the main stimuli, then all three public decision models predict the same changes in the composition of
spending and regulation. The three models do differ according to their predictions for the amount and
incidence of nonelderly regulation, but not enough is known about regulation for us to favor one model
over the others.
II. The basic interest group model
Consider a simple model of competition for political power between two interest groups, A and
B (this is an extension of the political competition model developed by Becker 1983 and Becker and
Mulligan 1998). At the equilibrium, group A is made worse off in order to make group B better off. Let
I denote an “index of interference”, which measures how much the government is doing to interfere with
A in order to benefit B. The index might denote amounts of taxes collected or regulations imposed on A.
Group A spends resources, A, on lobbying legislators, influencing voters, etc. to persuade them to vote to
keep taxes or regulations relatively low. Conversely, B spends resources, B, also trying to influence
legislators and the electorate to vote to raise the transfers to them or beneficial (from B's point of view)
regulation of group A.
We bypass an explicit discussion of the process involved in reaching government decisions on
spending, taxes, and regulation. Instead, we assume a reduced form “influence function” that is the end
result of what may be a very complicated process of electoral voting, legislative decisions, and executive
branch initiatives. In this reduced form, government spending and regulation directly depend on the
amounts A and B spent on gaining political influence:I I
Accounting for Government - 3
I = F (2A , 8B ), where F <0, F >0, F >0, and F <0. (1)I I I a b aa bb
where 2 and 8 are parameters indexing the “political power” of A and B, respectively. The derivatives
mean that increased political pressure by the taxed group A lowers government spending and regulation,
while increased pressure by the subsidized group B raises government spending and regulation of the A's,
and both effects are subject to diminishing returns.
Each group is assumed to spend the amount on influencing the political outcome that maximizes
its net income, given political spending by the other group. In the noncooperative equilibrium, each group
is maximizing, given the equilibrium level of spending by the other group. Therefore, group A minimizes
the sum of its political spending and the cost to members of its group of the taxes or regulations assessed
against it. The cost of government activity per group member is C(I/",* ), where " is group A's share ofI
the population and * is the parameter indexing the dead weight cost (dwc) of each dollar of taxes (or eachI
unit of regulation) used to achieve the index of interference I/" per member of group A. So A minimizes
A /" + C(I/",* )I I
Since per member costs are likely to be nonlinear in interference per member, aggregate costs for the group
are likely to depend on the group's size " as well as aggregate pressure A and the aggregate index of
interference I.
Similarly, B maximizes the difference between the value to members of B of the subsidies it
receives and the amount it spends on political activity. The value of the subsidy is S(I/$,F ), where $ is B'sI
share of the population ("+$=1) and F is a parameter indexing the dwc to the B's of each dollar of taxesI
(or each unit of regulation) used to achieve the index of interference I/$ per member of group B. So B
maximizes
S(I/$,F ) - B /$I I
We interpret aggregate pressures A and B , aggregate costs "C, and aggregate benefits $S as fractions ofI I
potential aggregate GDP. Although we recognize that actual GDP responds to the amount of government
interference, henceforth we hold potential GDP fixed and suppress any reference to it.
II.A. Regulations vs Taxes and Subsidies
Accounting for Government - 4
Although textbook analyses often suggest that cash transfers dominate regulation, this is no longer
true once the deadweight costs of raising and spending the cash are taken into account: a taxpayer changes
his behavior to avoid the taxes and a subsidized person changes his behavior to increase his subsidy. The
reduction in labor supply occurring in order to reduce incomes and thereby decrease tax liabilities or
increased subsidies is one well-known example of such change behavior. Hence, we assume that income
is redistributed by two means in a political equilibrium: taxes and regulations. We let T and R denote these
two indices of interference, which are determined according to the political pressures A ,A ,B ,B appliedT R T R
by the two groups:
T = F (2A , 8B )T T T
R = F (2A , 8B )R R R
We assume for simplicity that each index of interference is measured in the same units (say, dollars)
as the pressures A ,A ,B ,B . This is more natural when taxes are the means of interference, but might alsoT R T R
apply to regulation if the index R were measured in the right way. We also decompose the costs and
benefits of interference I into a “transfer” I and a “deadweight loss” so that the functions C and S are:
C(I/",* ) = (I/") + * ) (I/")I I I
S(I/$,F ) = (I/$) - F E (I/$) (2)I I I
) O, E O $ 0 , I = T, RI I
Notice that, when ) and E are positive, I costs group A more than I and benefits group B less than I.
The social deadweight cost of government is ) + ) + E + E plus the resources groups devoteT R T R
to influencing policy, A + A + B + B . We do not assume that ) + ) + E + E is positive for allT R T R T R T R
government activities or even that marginal social deadweight cost be positive for all government activities.
Taxes, subsidies, and mandates “correcting market failures” or “providing public goods” are government
activities which may have negative average and marginal social deadweight cost. We only assume ) O,T
E O, ) O, E O $ 0 – that the marginal government tax, transfer, or regulation has the largest marginalT R R
deadweight cost.
Our notation (2) and interpretation suggest that the government has a budget constraint for
interference that balances – namely that, other than the dead-weight costs, every unit of interference
enjoyed by group B is a unit of interference suffered by group A. Our suggestion is quite natural when
“interference” refers to taxes and spending, but less natural when interference refers to regulation.
However, another legitimate interpretation of the equations (2) is as definitions of the deadweight costs as
a function of the total costs C and surpluses S – that the “dwc” suffered by each A (each B) from
interference I/" per A (I/$ per B) is defined to be the difference between C(I/",* ) and I/" (the differenceI
Accounting for Government - 5
Summers et al (1993), for example, suggest that some labor market regulations decrease the1
marginal deadweight cost of labor income taxes.
Another way of stating this assumption is that F is independent of A and B while F is2T R R R
independent of A and B .T T
between I/$ and S(I/",* )). What is crucial for our results that this difference be a convex function of I.I
Each group knows the “political process” F and F and applies pressures A and A (or B and B )T R T R T R
to maximize their net surplus per member taking as given the pressure applied by the other group and the
number of group members.
A minimizes: C (T/",* ) + C (R/",* ) + (A + A )/"T T R R T R
B maximizes: S (T,F ) + S (R,F ) - (B + B )/$T T R R T R
A few relevant assumptions have been made above. First, given the parameters * ,* ,F ,F , the costs ofT R T R
taxes are independent of the costs of regulation. It is unclear whether, in fact, the marginal deadweight cost
of taxes is increasing in the amount of regulation (as in the case of payroll taxes and minimum wage
regulations) or vice-versa, although an interesting analysis of such interactions is possible. Second, since1
A ,A ,B ,B are separate choice variables, groups are assumed to be able to perfectly target their politicalT R T R
pressure towards either taxes or regulation. In other words, political pressure is “specific” to an index of2
interference. We explore the consequences of this assumption by imposing the constraints A = A and BT R T
= B on the problems describing the groups' political behavior, which means that pressure is “general”R
rather than “specific”.
The first order conditions describing the optimal pressures are:
-2(MF /MA)(1+* ) ') = 1, -2(MF /MA)(1+* ) ') = 1T T T R R R
8(MF /MB)(1-F E ') = 1, 8(MF /MB)(1-F E ') = 1 (3)T T T R R R
The left-hand-side of each first order condition is the marginal benefit (in “dollars”) of pressure, which
depends on four factors: (1) the group's political power index (2 or 8), (2) the magnitude of the first
derivative of the influence function F or F , (3) the deadweight cost parameter (* ,* ,F , or F ), and (4)T R T R T R
interference per group member.
The first two factors each increase the marginal benefit. Since A's are trying to decrease
interference and B's increase it, an increase in the relevant deadweight cost parameter increases the
marginal benefit of pressure for the A's and decreases it for the B's. Of particular interest is the fourth
factor, interference per group member. The deadweight cost functions () ,) ,E , or E ) are nonconcave,T R T R
Accounting for Government - 6
Becker and Mulligan (1998) emphasize that * parameterizes “tax efficiency” in the sense that3
(for )'>0) a lower * means lower average and marginal deadweight costs of taxes for any given amountof taxes to be collected.
so more interference tends to increase marginal deadweight costs. This is an important source of the
dependence of political outcomes on groups size (and one emphasized by Becker 1983). Furthermore,
aside from nonzero cross-derivatives of the influence functions, the fourth factor is the way in which one
group's pressure affects the other groups marginal benefit of pressure. More pressure by one group tends
to increase the marginal benefit of pressure by the other group unless the cross-derivative of the relevant
influence function is sufficiently far from zero.
Since we place no restrictions on the magnitude of the first derivatives of the influence functions
F and F or even the sign of the marginal deadweight costs, the first order conditions (3) show that ourT R
definition of “political equilibrium” does not presume there is either too little or too much government
interference. Negative equilibrium average and marginal deadweight costs are perfectly consistent with
our model.
Before deriving the effects of the various parameters on equilibrium taxes and spending, we
mention some examples of changes in those parameters. Aging and increased retirement in an economy
where taxes are on labor income and subsidies are mainly for the elderly is an example in the growth of the
fraction of people subsidized (ie, a decrease in " and an increase in $). The invasion of an enemy army
can be a circumstance of a decrease in average and marginal deadweight cost (equivalently, and increase
in average and marginal benefits) of spending and regulation - namely those that help defend against the
enemy. Technological and structural economic changes - such as increased urbanization and monetization
of the economy or decreased monitoring costs - can allow taxes, subsidies, and regulations to be
administered more efficiently.3
II.B. Equilibrium Mix of Regulations and Cash Transfers
Our model is convenient for analyzing the effect of various parameter changes on the quantity,
composition, and incidence of regulations and cash transfers. A few of the parameter changes have been
derived in the literature and used to explain the growth of government – as in Kau and Rubin (1981),
Turner (1984), Wilson (1990), and Becker and Mulligan (1998) – but our purpose here is to contrast the
implications of various theories from the literature. As we show below, the theories have substantially
different empirical implications.
The first order conditions with respect to A and B alone determine the reaction functions and theT T
Accounting for Government - 7
(F ) -F F > 0 at an equilibrium is sufficient for the equilibrium to be “stable.” -F F /(-F )4 2ab aa bb b aa a
< F < F F /F at the equilibria is necessary and sufficient for the equilibria to be “strategicallyab a bb b
separable.” If the influence functions are either additively separable or homogeneous of degree zero,then any Nash equilibrium is stable and strategically separable.
Nash equilibrium A , B , and T. These equations are studied more carefully by Becker and MulliganT T
(1998). The first order conditions with respect to A and B alone determine the reaction functions and theR R
Nash equilibrium A , B , and R.R R
Proposition 1 With perfectly “specific” pressure, an exogenous change in the efficiency of taxes * or theT
efficiency of spending F affects the Nash equilibrium A , B , and the size of the budget T, but not A , B ,T T T R R
or the quantity of regulation R. An exogenous change in the efficiency of regulation (* or F ) affects theR R
Nash equilibrium A , B , and the amount of regulation R, but not A , B , or the size of the governmentR R T T
budget T.
Proposition 1 is a strong result and obviously depends on our assumption that dwcs are important
and that groups can expend resources to change taxes without changing regulation and vice versa. But the
qualitative result - that * and F have a greater effect on taxes than on regulation - is quite general and,T T
as we demonstrate below, allows us to distinguish changes in tax or spending efficiency from changes in
the political power of those taxed or subsidized.
Henceforth, we restrict our attention to particular Nash equilibria: those that are “stable” and
“strategically separable”. The stability condition is familiar from game theory and restricts how B's reaction
function might cross A's in the [A,B] plane. Unfamiliar is “strategic separability”, by which we mean an
exogenous increase in A's pressure or an exogenous decrease in B's pressure decreases equilibrium
interference. Our “strategic separability” restricts the magnitude of the cross-derivative F , but is weaker4ab
than additive separability (ie, is weaker than F = 0).ab
The stability and strategic separability of the equilibrium gives us a Corollary to Proposition 1,
Corollary An increase in efficiency of taxes or spending increases T relative to R. An increase in the
efficiency of regulation increases R relative to T.
II.C. Causes of the Growth of Government Budgets
A number of reasons for the growth of government budget can be analyzed, which we do in
Propositions 2 - 4:
Accounting for Government - 8
Proposition 2 A decrease in the political power of the taxed group (2) or an increase in the power of the
subsidized group (8) increases aggregate taxes.
Proposition 3 An increase in the efficiency of taxes or spending (which is a decrease in * or F when ) 'T T T
or E ' are positive) increases taxes and spending. If political pressure is somewhat “general,” an increaseT
in the efficiency of regulation (which is a decrease in * or F when ) ' or E ' are positive) increases taxesR R R R
and spending.
Proposition 4 An increase in the efficiency of regulation increases regulation. If political pressure is
somewhat “general,” an increase in the the efficiency of taxes or spending increases regulation.
Propositions 3 and 4 point out that, when pressure is somewhat “general”, the amount of taxation
depends on the efficiency of regulation and the amount of regulation depends on the efficiency of taxation.
Even with completely specific pressure, these dependencies would arise if the marginal deadweight costs
of taxation (regulation) were decreasing in the amount of regulation (taxation).
We begin to summarize these results of the interest group (IG) model in Table 1 and the Appendix
Table. The Tables also summarize results for two other models of government activity: the social
redistribution (SR) model and the merit goods (MG) model. The SR and MG models are discussed in
section III. In order to simplify the exposition, we look ahead to our empirical findings and report in Table
1 theoretical results for only three sources of government growth (more efficient taxes, more efficient
regulation, and growing political influence of one subsidized group) and the empirical measures that might
be used to distinguish them (the amount of regulation, the composition of taxes and spending taxes per
regulation, and the relative incidence of taxes and regulation). Our framework can also distinguish among
five other sources of government, which we compare in the Appendix Table.
Accounting for Government - 9
Table 1: Accounting for the Growth of Government
(both General and Specific Pressure)
Model of betweenamount of of taxes
Public regulation ®ulation spending & per
Decisions tax incidenceregulation regul.Source of growing spending & taxes ††
changes in
correlationcomposition
more efficient taxes or spending IG + 0 + +
SR - 0 + +
MG + 0 0 -
more efficient regulation IG + 0 - +‡
SR - 0 + +
MG + 0 0 -
power of one subsidized group IG, SR + yes 0 +*
Notes: result requires somewhat stronger assumptions than stability and strategic separability (F = 0*ab
sufficient)
Models of Public Decisions: IG = interest group, SR = social redistribution, MG = merit goods††
SR model predicts growing government budgets when regulations become less efficient‡
According to our Table 1, data on the amounts and composition of taxes, spending, and regulation
are not enough to say whether growing government derives from increases in the efficiency of taxes or of
spending. We can, however, distinguish these causes from a mere increase in the (relative) power of those
subsidized because the former predict an increase in taxes per regulation. With measures of the efficiency
of taxes and spending, we can begin to distinguish increased tax efficiency from increased spending
efficiency, and show elsewhere how to do so (see our 1998 analysis of wartime and “flypaper” effects).
It is also easy to show that the effects of tax and spending efficiency on tax collections increases
with the relative political power of those subsidized. From Young’s Theorem, it then follows that more
relative political power for those subsidizes leads to a greater increase in government when efficient means
of distribution are available. Hence, increased efficiency of redistribution (the “supply” of government)
and increased political power of those demanding redistribution (the “demand” for government) are
complementary explanations for the growth of government. Some in the literature, such as Kau and Rubin
(1981) have suggested that the supply and demand models are alternative explanations for government
growth.
Accounting for Government - 10
See Wittman (1989, p. 77) for a discussion. Demsetz (1982), Friedman and Friedman (1980),5
Becker (1983) and others derive this result.
With three groups, more complicated restrictions on the pressure and deadweight cost6
functions are required to guarantee that any Nash equilibrium is stable and strategically separable.
How do demographic shifts affect aggregate interference, interference per taxpayer, and
interference per person subsidized? Holding fixed aggregate interference I, a movement of some people
from the subsidized group to the taxed group increases I/$ which decreases the marginal benefit of $1 of
pressure by group B. But the same movement of people decreases I/" and, because the marginal
deadweight cost of taxes is lower for the larger taxpaying group, decreases the marginal benefit of $1 of
pressure by group A. With both groups reducing their pressure, we cannot sign the effect on aggregate
interference. The reduced pressure by group A is likely to dominate when deadweight losses are more
convex on the taxpayer side or when the taxpaying group is relatively small.
It is unambiguous, however, that I/" must fall and I/$ increase. There is a large literature
suggesting that group size is an important determinant of taxes per taxpayer and subsidies per person
subsidized, with smaller subsidized groups enjoying more subsidies (or beneficial regulation) per member
and larger tax paying groups enjoying fewer taxes or (less costly regulation) per member.5
II.D. Predictions for the Composition of Spending, Taxes, and Regulation
In order to analyze the composition of spending and taxes, we introduce an additional taxed group
for a total of three groups: A , A , and B with population shares " , " , $ (" +" +$ = 1). Let A (A )1 2 1 2 1 2 Ti Ri
denote the political pressure applied by taxpaying group i against the subsidized group in order to reduce
taxes (regulation) and let T (R ) denote the amount of taxes (regulation) levied against group i. Let B (B )i i T R
denote the political pressure applied by the subsidized group i in order to increase taxes (regulation).
T = F (2A , 8B ), R = F (2A , 8B ),i T i Ti T i R i Ri R
A minimizes: C (T /" ,* ) + C (R /" ,* ) + (A + A )/" , i = 1,2i Ti i i Ti Ri i i Ri Ti ri i
B maximizes: S ((T +T )/$,F ) + S ((R +R )/$,F ) - (B + B )/$T 1 2 T R 1 2 R T R
We interpret the parameters as in the two group case, and point out that a similar set of assumptions are
made about the nature of politics and interference: costs of taxes are independent of the costs of regulation
and political pressure is specific to either taxes or regulation. We also assume that the subsidized group
cannot target its pressure against a particular taxpaying group.
We continue to restrict our attention to stable and strategically separable Nash equilibria.6
Accounting for Government - 11
Additively separable influence functions and nonconcave deadweight cost functions are sufficient butnot necessary.
Proposition 5 states the familiar separability result which, of course, would not hold if political pressure
were general:
Proposition 5 With perfectly “specific” pressure, an exogenous change in the efficiency of taxes (* orT1
* ) or the efficiency of spending (F ) affects the Nash equilibrium A , A , B , and the size of the budgetT2 T T1 T2 T
T = T +T , but not A , A , B , or the quantity of regulation R = R +R . An exogenous change in the1 2 R1 R2 R 1 2
efficiency of regulation (* , * or F ) affects the Nash equilibrium A , A , B , and the amount ofR1 R2 R R1 R2 R
regulation R, but not A , A , B , or the size of the government budget T.T1 T2 T
Although complete separability of the politics of taxes and regulation would not occur if political pressure
were general to some degree, we still expect * , * and F to have greater effects on taxes than onT1 T2 T
regulation and * , * and F to have greater effects on regulation than on taxes.R1 R2 R
Some other familiar results can be obtained from the three group model and are reported in
Propositions 6 - 7:
Proposition 6 An increase in the power of the subsidized group (8) increases taxes and regulations levied
on both taxpaying groups.
Proposition 7 A decrease in the political power of taxed group i (2 ) increases taxes and regulation paidi
by i. The change in 2 must either increase aggregate taxes or decrease taxes paid by the other taxed groupi
(and either increase aggregate regulation or decrease regulation paid by the other taxed group). If the
influence functions are additively separable, then aggregate taxes and regulation increase and taxes and
regulation paid by the other taxed group decrease.
Stability and strategic separability are not sufficient to guarantee that less power by some taxpayers
(and more taxes paid by them) decrease taxes and regulation levied against other taxpayers. This can be
seen in the special case that E'' = 0 and F is negative (but not so negative so as to violate strategicab
separability): the decrease in A increases the marginal product of pressure for the subsidized group. Thei
subsidized group raises its pressure. Since strategic separability has been assumed, B's increase cannot be
enough to increase T . However, to the extent that B's pressure cannot be targeted towards A , morei i
Accounting for Government - 12
pressure is applied against the other taxed group which can increase taxes paid by that group (and thus
aggregate taxes).
Additive separability of the influence functions (F = 0) and strict convexity of B's deadweightab
costs (E''>0) is sufficient to guarantee that less power by some taxpayers increase aggregate taxes and
regulation and decrease taxes and regulation levied against other taxpayers. Our Table 1 assumes that
aggregate taxes and regulation increase and, more weakly, that the composition of taxes and regulation
changes.
“Political power” is relative in our model, so it is important to notice that we model a decrease in
the power of taxed group i (2 ) as a decrease relative to the other taxed group and relative to thosei
subsidized. In other words, the relative power of those subsidized and the other taxed group is unchanged.
A decrease in the power of taxed group i that does not change the power of i relative to those subsidized
will still change the composition of taxes as indicated in Proposition 7, but need not lead to an increase in
total taxes and spending.
Propositions 3-4 considered “exogenous” changes in the efficiency of taxes, subsidies, and
regulation. Our results in this regard are most interesting when there are “exogenous” differences over time
or across governments in technology, industrial composition, or government knowledge of public finance
that permit exogenous differences in tax efficiency. But a government's system of taxes, subsidies, and
regulations may become more efficient because those harmed by the more efficient taxes and regulations
lose political power, or because those benefiting from more efficient subsidies and regulations gain political
power. These possibilities can be worked out in the version of our model with two taxed (or two
subsidized groups) by shifting the index of political power for the group with the lower * or * (or F orT R T
F ) and applying Proposition 7. Even if 8 were decreased so as to remain unchanged relative to an averageR
of 2 and 2 , we expect government to grow because resistance by the efficiently taxed group is relatively1 2
more important while that group is least willing to resist because it suffers relatively few deadweight costs
for a given amount of revenue to be extracted from it. But this endogenous increase in tax efficiency is
different from the exogenous increase considered in the first row of Table 1 because: (a) the composition
of taxes changes, (b) the composition of spending changes, and (c) there is no change in taxes per
regulation.
Proposition 8 An increase in the efficiency of spending (which is a decrease in F when E ' is positive)T T
increases taxes levied on both taxed groups. An increase in the efficiency of regulation for group B (which
is a decrease in F when E ' is positive) increases regulation levied on both taxed groups. If politicalR R
Accounting for Government - 13
pressure is somewhat “general,” an increase in the efficiency of regulation for group B increases taxes
levied on both taxed groups and an increase in the efficiency of spending increases regulations levied on
both taxed groups.
Proposition 9 An increase in the efficiency of taxes for one taxed group (which is a decrease in * whenTi
) ' is positive) increases taxes levied on that group. An increase in the efficiency of regulation for oneTi
taxed group (which is a decrease in * when ) ' is positive) increases regulation levied on that group. IfRi Ri
political pressure is somewhat “general,” an increase in the efficiency of regulation for one taxed group
increases taxes levied on that group and an increase in the efficiency of taxes for one taxed group increases
regulations levied on that group.
Proposition 7 suggests that stronger assumptions are required to sign the effects of one groups tax
efficiency on the other taxed group and on aggregate taxes. Proposition 10 makes the required assumption.
Proposition 10 Let F = 0. An increase in the efficiency of taxes for one taxed group decreases taxesab
levied on the other group and increases aggregate taxes. An increase in the efficiency of regulation for one
taxed group decreases regulation levied on the other group and increases aggregate regulation. If political
pressure is somewhat “general,” an increase in the efficiency of regulation for one taxed group decreases
taxes levied on the other group and increases aggregate taxes while an increase in the efficiency of taxes
for one taxed group decreases regulation levied on the other group and increases aggregate regulation.
By introducing an additional taxed group into the two group model, we have derived results for
the composition of taxes. An analogous set of results could be derived for the composition of spending
by introducing an additional subsidized group. We do not present the details of the analysis here, but enter
the analogous results in the Appendix Table.
III. Interest Group Approach Compared with Other Models of Public Decisions
We model public decisions as an outcome of a competition among interest groups, but there are
a number of other models of public decisions in the literature. Three of those – the efficiency
maximization, social redistribution, and merit good models – have in common the majority (but not all)
of their implications for public policy responses to various stimuli. Hence, in principle, accounting for the
growth of government requires identifying a growth stimulus and a model of the effect of that stimulus on
Accounting for Government - 14
The limiting case is F(A,B) proportional to B - A.7
public policy. In practice, the different implications of the public decision models are too subtle for us to
test with our data.
III.A. Efficiency Maximization
Many have suggested that government policy can be described as maximizing efficiency (taking
as given that each person paying taxes and being subsidized will act in his individual interest). The
literature includes Wittman's (1995) claim that democratic institutions are efficient and Barro's (1979)
argument that U.S. federal government debt policy efficiently allocated tax burdens over time. Efficiency
can be defined in our model as the set of transfers (T ,T ,R ,R ) minimizing the sum of deadweight costs1 2 1 2
across those paying taxes and receiving subsidies (although this ignores the costs associated with attempts
$F E ((T +T )/$) + $F E ((R +R )/$)T T 1 2 R R 1 2
A necessary condition for efficiency maximization is the equation of marginal deadweight costs across
various taxes described by Frank Ramsey (1927).
Although there are no influence functions F and F satisfying our assumptions (1) for which theT R
equilibrium is the efficient set of transfers, there are functions that would approximate it arbitrarily closely.
Thus we consider efficiency maximization as a limiting case of our analysis.7
In addition to equating marginal dwc across types of taxes and regulations, efficiency maximization
has strong implications for the level of taxes and regulation. Namely, the aggregate marginal dwc of each
tax and each regulation is zero:
* ) N(T /" ) + F E N((T +T )/$) = 0T1 T1 1 1 T T 1 2
* ) N(T /" ) + F E N((T +T )/$) = 0T2 T1 2 2 T T 1 2
* ) N(R /" ) + F E N((R +R )/$) = 0R1 R1 1 1 R R 1 2
* ) N(R /" ) + F E N((R +R )/$) = 0R2 R1 2 2 R R 1 2
In other words, taxes and regulations are used only because they enhance efficiency.
In that limiting case, the amount of regulation is independent of the efficiency of taxes and the
amount of taxation is independent of the efficiency of taxes or spending, as in our Propositions 1 and 5.
However, not all interest group pressure is general so, in the interest group model, we expect more efficient
taxes to increase regulation and more efficient regulation to increase taxes. The other qualitative results
Accounting for Government - 15
It has been shown (eg., Mueller 1989; Ledyard 1984) how democratic and other political8
institutions might deliver policies as if a social welfare function were being maximized.
reported in Table 1 are shared by the efficiency maximization model. The efficiency maximization model
has been modified in the literature in two important ways, which we refer to as the “social redistribution”
and “merit good” models.
III.C. Social Redistribution
The efficiency model has been enhanced, most famously by Mirrlees (1971), by allowing for a
social objective for redistribution. In our notation, this might be thought of as maximizing a monotonic
“social welfare function” of each group's surplus. Groups do not enter symmetrically in the social welfare8
function, because some group’s surplus is assumed to contribute more to “social welfare” than others. For
example, as in the utilitarian models, the surplus of each group contributes to social welfare in proportion
to its average marginal utility. Political power and other considerations can also be reflected in the form
of the social welfare function. We refer to this model as the social redistribution (SR) model.
Adding a social welfare function to the efficiency model has important implications for the amount
of tax, spending, and regulation. Taxes and regulations can be used beyond the point of efficiency – so that
equilibrium aggregate marginal deadweight costs are positive – in order to transfer resources from groups
receiving less importance in the social welfare function to groups receiving more importance.
It is straightforward to derive implications from the SR model for the effect of changes in the
relative size of the taxpaying and subsidized groups, and those implications are similar to those of the IG
model. Some implications differ between the SR and IG models, and we discuss those in section IV.
III.D. Merit Goods
Over some range, the aggregate marginal deadweight cost of regulation ) N + E N may be negative.R R
For example, some regulations may be used to discourage activities with negative external effects (“demerit
goods”) and encourage activities with positive external effects (“merit goods”). The merit and demerit
goods can have external effects in the technical sense – as with pollution or donating blood – or it may be
that some citizens prefer to see other citizens consume merit goods and avoid demerit goods. Regulations
encouraging merit behavior and discouraging demerit behavior may harm some individuals, even though
they enhance aggregate efficiency.
This environment is included as a special case of our interest group model, because nowhere have
we ruled out the possibility that ) N + E N < 0. As a special case, our Table 1 predictions for the amount,R R
Accounting for Government - 16
This point is made by Becker (1983).9
mix and incidence of taxes, spending, and regulation are the same even if most of regulatory activity is
motivated by efficiency considerations (ie, ) N + E N < 0) rather than as a means of redirecting resourcesR R
to the politically powerful. In particular, the existence of such regulation does not, according to the IG
model, tell us anything about the quantity or composition of taxes and spending.
As long as there are losers from the marginal regulation, political competition as we have modeled
it does not guarantee that the efficient amount of regulation will occur (ie, to the point where ) N + E N =R R
0). Indeed, there will tend to be less regulation than is efficient (ie, equilibrium R is such that ) N + E NR R
< 0) unless those who benefit most from efficient regulation also happen to be the politically powerful. The
negative marginal deadweight costs mean that, starting from zero regulation, those who gain from
regulation have more incentive to fight for regulation than those who lose have incentive to fight back –
political competition can move regulation in the direction of efficiency. However, the gainers run into9
diminishing returns to political pressure and hence have a lesser incentive to fight for additional regulation.
Only if the gainers also enjoy more than average political power can it be expected that they will continue
to pressure for regulation up to or beyond the point where aggregate efficiency is maximized.
Hence, even ignoring the inefficient “rent-seeking” nature of political action, our interest group
model leaves some gains from trade in the case when ) N + E N < 0. This leaves open the possibility that,R R
excluded from our model, are political institutions which can arrange for those who lose from regulations
(say, the B’s) to be granted a cash transfer from those who gain (say, the A’s). Some (eg., Harberger 1984,
Sala-i-Martin 1996, Mulligan and Philipson 1999, and many others) have argued that the bulk of
government spending can be understood as payment by those who want changes in behavior to those
changing their behavior (which Mulligan and Philipson call “purchasing merit goods”). The authors argue
that schooling, health expenditures, and an early retirement are important examples of merit goods.
One institution that might exploit these gains from trade is a protocol for bargaining between the
two interest groups (A’s and B’s in our model). A social redistribution model would also predict these
gains from trade to be exploited and, assuming that the social motives for redistribution discussed in
subsection III.D are relatively unimportant (ie, each group’s surplus enters the social welfare function
symmetrically), those who benefit from regulation would pay taxes to subsidize those harmed. This
mechanism for public decisions analyzed by Mulligan and Philipson (1999), which we refer to as the merit
good (MG) model. It is really a special case of the social redistribution model, but a different case than
we consider above for which redistribution of resources to the poor and/or the politically powerful are the
primary motives for policy. We refer to this latter case as the social redistribution (SR) model.
Accounting for Government - 17
Sala-i-Martin (1996) has argued that one of the largest government programs, Social Security, is
an exchange of cash transfers for merit goods. The merit good is elderly leisure (because, he argues, more
leisure by the old enhances productivity for the young), the cash transfer is a Social Security check, and
regulation requires that recipients of the cash transfer exit the labor force. Olsen and York (1984),
Mulligan and Philipson (1999), have argued that housing assistance, public medical insurance, public
retirement savings programs, and other subsidy programs are also an exchange of cash transfers for merit
goods.
IV. Explanations from the Literature as Special Cases of Our Model
The analysis summarized in Table 1 and the Appendix Table allows a reader to categorize various
explanations for the growth of government according to their implications for the level and composition
of taxes, spending, and regulation. We illustrate this with a number of examples from the literature.
IV.A. Better Technologies for Tax Collection
Building on the insights of Brennan and Buchanan (1980), Buchanan and Lee (1982), Wilson
(1990), and others, Kau and Rubin (1981) and Becker and Mulligan (1998) blame some of the growth of
government over time on the emergence of better means of tax collection. Theirs is an increase in the
efficiency of taxes for all taxpayers (a reduction in the parameters * and * when ) ' > 0) and results inT1 T2 T
more spending, more taxes, more regulation, more taxes per regulation, and no change in the composition
of taxes, spending, and regulation.
As long as there are multiple policy instruments for achieving the socially optimal distribution of
income, the SR model equates aggregate marginal deadweight costs across each instrument – as in the
efficiency maximizing model. For example, if the poor, or the elderly, or some other preferred group can
be assisted with both cash transfers and regulations, the aggregate marginal deadweight cost of transfers
will be equated to the aggregate marginal deadweight cost of regulation. This means that an exogenous
enhancement of the efficiency of taxes (regulation) decreases the use of regulation (taxes). This is an
important difference from the predictions of the IG model, so we enter separate rows for the SR model in
Table 1 and in the top part of the Appendix Table.
Taxes, spending, regulation are simultaneously determined in the MG model. Taxes are levied in
order to compensate losers from regulation, and regulation is politically acceptable because the losers can
be compensated with subsidies. Hence, an increase in the efficiency of taxes increases the scope for
compensating the losers from regulation, and thereby increases regulation – as with the IG model.
Accounting for Government - 18
For example Warner and Asch (1996) and others have suggested that conscription is10
efficiency enhancing.
In order to sign the effect of war on regulation, we need to make additional assumptions about11
the effect of war on the struggle between A's and B's. If, holding pressure constant, the effect of war isto increase total taxes and spending without reducing nondefense spending, then the increasedresistance by taxpayers will result in a net decrease in regulation. If, holding pressure constant, theeffect of war is to reduce nondefense spending without increasing taxes, then the increased pressure bythose subsidized will result in more regulation.
Regulation also increases in the IG model, but the incidence of the regulatory and tax changes are very
different. The same group gains from additional taxes and regulation (namely, the B’s) in the IG model
while those who gain from the additional regulation in the MG model are those who lose from additional
taxes and spending. The IG and MG models differ in similar ways according to the public policy response
to an increase in the efficiency of regulation.
IV.B. Changes in Military Spending
Military spending is, of course, affected by domestic political forces. But, with the intention of
explaining government policies during wars like World War II or the policies of a threatened state like
Israel or Egypt, consider an increase in military spending motivated by “efficiency” considerations. This
fits into our analysis as an increase in the efficiency of spending and, because the efficiency of nonmilitary
spending is roughly unchanged, an increase in efficiency for only a subset of those subsidized (ie, a
reduction in F holding F and other parameters constant). As shown in the Appendix Table, we predictT1 T2
an increase in spending, a reduction in nonmilitary spending, and an increase in taxes.
The need to fight a war may also be associated with an increase in the efficiency of regulation,10
but we presume that relatively more wartime “needs” are for Treasury revenue rather than increased
mandates. Thus we cannot predict whether regulation increases or decreases, but any increase should be
less than the increase in Treasury revenue.11
IV.C. Changing Political Influence
Some argue that government has grown because particular subsidized groups have gained political
influence. Examples from the literature include Peltzman's (1980) theory of the homogeneity of subsidy
groups, Lott and Kenny's (1999) analysis of female suffrage and Mulligan and Sala-i-Martin's (1999) study
of the growing political influence of the elderly. We model this as an increase in the political power index
8 for a subset of those subsidized (or in Peltzman's case, perhaps an increase in 8 for all those subsidized).
Accounting for Government - 19
Mancur Olson (1986) appropriately qualifies the argument, pointing out that free-riding12
among subcoalitions of a “collective” organization might be just as important as the free-riding amongorganizations.
As reported in Table 1, we expect an increase in total spending and regulation and an increase in spending
and regulation for the group gaining influence, a decline in spending and regulation benefitting others, and
no change in the relative amount of spending and regulation.
As our analysis has shown, it is important in these applications that a subsidized group's power
increases relative to taxpayers and relative to those not in the group and being subsidized. If the increase
in political influence were only relative to other subsidy recipients, there may only be a reallocation of
spending but not an increase in total spending and taxes. Some in the literature (eg., Browning 1975,
Boadway and Wildasin (1989)) have derived an increase in elderly influence relative to taxpayers from the
fact that many taxpayers expect to become elderly themselves. Mulligan and Sala-i-Martin (1999) also
suggest that the elderly have become more “single-minded” or “group-conscious” relative to taxpayers.
The social redistribution approach typically offers an ethical rather than a positive interpretation
of the marginal importance of each group’s contribution to social welfare, but changes in the social welfare
function, for whatever reason, might be used to explain the growth of government. The qualitative
implications of, say, increased social importance of those subsidized are similar to those of the IG model
in response to the growth of the political power of those subsidized. We therefore enter these implications
of the SR and IG models in the same rows of Table 1.
IV.D. “Corporatism”
Summers et al (1993, pp. 385-86) and Olson (1982) explain that “corporatist” economies might
make labor supply decisions collectively, and collective labor supply decisions reduce the marginal
deadweight cost of labor income taxes. In other words, the marginal dwc of taxes and subsidies decrease12
with the amount of regulation. This means that taxpayers are less enthusiastic about resisting regulations
against them, because such regulations have the benefit of reducing dwcs of taxes. And, given an
additional amount of regulation, taxpayers have less reason to resist spending because the marginal dwc
of taxes has fallen. We leave it to the reader to prove that the results in our interest group (IG) model
obtain when the function ) and E depend on R in this way, because the added interaction between taxesT T
and regulation only reinforces the positive correlation between the two predicted by the model.
The “corporatism” theory may modify one of the implications of the social redistribution (SR)
model of public decisions. It explains how an increase in the efficiency of regulation might lead to a
Accounting for Government - 20
growth in taxes and spending. As explained above, the “social planner” reacts to more efficient regulation
by increasing regulation but, rather then substituting away from cash transfers, the planner may increase
them because the additional regulation has reduced their marginal dwc.
IV.E. Marxist Theories
Marxist theories of government also fit into our framework, where the interest groups might be
labeled as “labor” and “capital”. One rendition of that theory (Foley 1978) supposes that capitalists tend
to control government and limit subsidies to which laborers are entitled, but that the degree of capitalist
control changes over time. Growing government could then be explained by a reduction in the political
power of capital which we would predict to be associated with a less favorable regulatory environment for
capital as well as capital's bearing a greater share of the tax burden. A full analysis of the functional
incidence of taxes, and how that incidence has changed over time, is beyond the scope of this paper, but
the decline over time in the importance of property and corporate income tax revenues (Barro 1987)
suggest that capital is not bearing an increasing share of the tax burden. We suggest in the next section that
business regulation has increased over the century, although the trend for recent decades is more
ambiguous.
V. Evidence from the U.S.
It is well known that government spending has grown over time in developed countries. We
present time series measures of the quantity and composition of government spending, taxes and regulation
in the U.S. The time series are compared with the predictions from Table 1 to evaluate which
explanation(s) for the growth of government might be the primary explanation. Our preliminary empirical
findings are summarized in Table 2.
V.A. Spending over Time
Figure 1 shows how American government spending has grown over time, especially at the federal
level. Over the period 1890-1990, the fraction of GNP spent by the Federal government (including grants
to state and local governments) has grown from 0.023 to 0.23 while real GNP grew by a factor of 25. Thus
federal government spending grew by a factor of 250 in real terms and by a factor of 10 relative to GNP.
We measure general government spending (federal plus state and local, net of intergovernmental transfers)
back to 1902 when the fraction of GNP spend by all levels of government was 0.066 (0.022 Federal plus
fiscal year (spending), calendar year (GNP)1890 1910 1930 1950 1970 1990
0
0.1
0.2
0.3
0.4
0.5
Federal Total Government
Accounting for Government - 21
Figure 1 U.S. Spending Measures 1890-1990, normalized by real GNP
0.044 state and local). General government spending reach 34% of GNP by 1990 - an increase by a factor
of five since 1902. Interrupted only by WWII and the Korean War, the increase in government spending
is spread pretty evenly over the period 1932-90. The Reagan and postReagan periods are not a
quantitatively important interruption of this trend, although some of the spending has been shifted to state
and local governments during this period. Government spending growth was slow for a longer period of
time prior to 1930.
Accounting for Government - 22
We have only computed Congressional Committee Staff sizes for the years 1891, 1914, 1930,13
1935, 1947, 1950, 1955, 1960, 1965, and 1970-90 so any high frequency variation in the associatedregulation measure is from the real GNP series used in the normalization.
Table 2: Summary of Preliminary Empirical Measuresof the Amount, Composition, and Incidence of Taxes, Spending, and Regulation
Pages in Fed Register (adjusted; lower) Pages in U.S. Code (lower)
US Distr Civ Court cases (lower) Hopkins' Regulatory Costs (middle)
Accounting for Government - 23
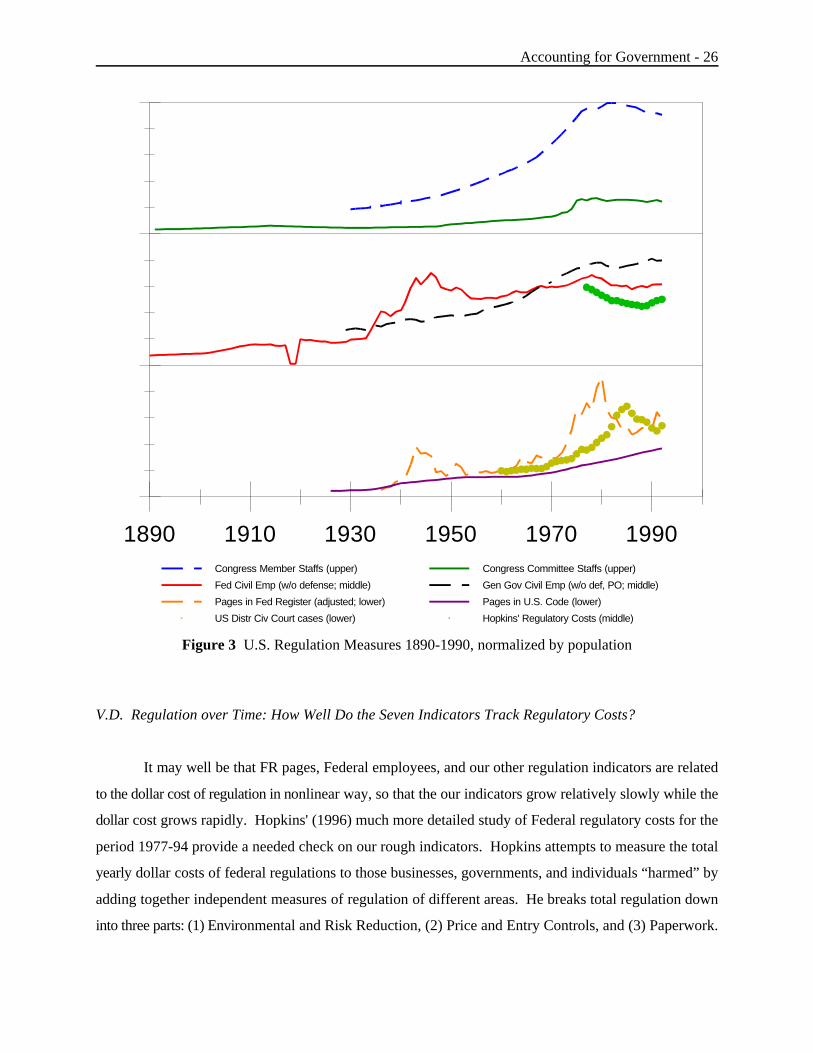
Figure 2 U.S. Regulation Measures 1890-1990, normalized by real GNP
for fewer years. The postwar trend relative to GNP has been downward for Federal employees and slightly
upward for Congressional Committee and Member Staff sizes. General Government Civilian Employment
does not trend down since the War - unlike Federal Civilian Employment - mainly because of the increased
school-related employment by states and localities. Both the Congressional Committee Staff and
Congressional Member Staff Size series suggest a postwar regulatory peak in the 1970's. The fastest
growing of these indicators – Congressional Committee Staff sizes has grown by only a factor of 1.7
relative to GNP since 1930.
Three other indicators of regulation are pages in the Federal Register (FR), pages in the U.S. Code
of Federal Regulations, and the number of U.S. District Civil Court cases commenced. Pages in the FR
Accounting for Government - 24
Figure 2 includes an adjustment for the passage of the Freedom of Information, the Privacy,14
and the Sunshine Acts between 1967 and 1974. The Acts require additional reporting in the FR byFederal government agencies of their activities and contributed to the tripling of the page countsbetween 1967 and 1975 (U.S. Office of the Federal Register 1980, p. 1). We adjust all page countsafter 1970 by a factor of 0.8, an adjustment which implies that 20% of the pages would not exist in theabsence of the acts and that the Acts were responsible for roughly one third of the 1967-75 page countgrowth.
Otherwise, our examinations suggest that the font size and legalese of the FR have beenconstant over time.
As a measure of regulation, Congressional Staff Sizes also share many of the shortcomings of15
FR pages: large Congressional staffs might indicate an increased flow of regulation rather than a largerstock; staff sizes might be larger when lots of deregulation or reregulation occurs.
is an interesting measure of federal regulation since, with only a few exceptions, all federal regulations are
recorded there. The FR consists of laws passed by Congress, executive orders, and federal government
agency reports. The inclusion of agency reports is of interest because federal agencies often interpret and
elaborate on fairly vague statutes, although changes in FR rules have resulted in some increase in agency
reporting that is not associated with increase regulation.14
V.C. Regulation over Time: Two Refinements of FR Pages
There are a variety of other reasons why FR pages are not a perfect quantitative measure of the
amount of federal regulation. For example, extensive deregulation or reregulation might actually
temporarily increase the number of pages in the FR without increasing - or even decreasing - the stock of
Federal regulation. And the amount of regulation might increase substantially with a decrease in the
number of pages. It can also be argued that each volume of the FR reports increments to the stock of
regulation rather than the stock itself. We suggest several alternative measures that might alleviate some
of these problems with FR pages. The first alternative is the number of pages in the U.S. Code. The U.S.15
Code has been issued every six years since 1926 and reports the federal statutes in effect at the time of
publication. Hence, it is a more direct measure of the stock of federal regulation than is FR pages. Unlike
the FR, the U.S. Code excludes executive orders and agency reports, which can be an advantage when
comparing regulation before and after the period 1967-75 (see the previous footnote). Pages in the U.S.
Code have increased less than pages in the FR since the 1930s and, unlike FR pages, have continued to
increase since 1980. Nevertheless, pages in the U.S. Code have not increased as much as real tax revenue.
Other alternatives to FR pages are resources devoted to the enforcement of regulation –
government employees and the number of civil court cases. Since we believe that some categories of
government employees are not typically involved with enforcing government regulations, we try to exclude
Accounting for Government - 25
employees such as uniformed military personnel, defense civilian employees, postal employees, and (in a
series not shown in the figure) municipal school employees. Including or excluding the categories of
government employees does not substantially affect the estimation of trends from the data. Court cases did
not trend relative to GNP for the years 1930-70, but have increased at least 50% relative to GNP since.
None of the regulation measures increase as rapidly as real tax revenue. But it is presumed that,
without any change in interference, both real tax revenue and regulation measures would increase
proportionally with real GNP. Perhaps real tax revenue should be normalized by real GNP and the
regulation measures by population? We let the reader answer this question and display in Figure 3 the
alternative population normalization. We see that Federal Civilian Employment (excluding defense)
increases by a factor of 3 or 4 during the period 1890-1990, with most of the increase from 1890-1950.
Congressional Committee Staff sizes increase by a factor of 5.5, but most of its increase is since 1950.
Factor of 3 or 4 increases relative to population are fairly typical for the regulation measures available only
for the latter part of the period 1890-1990. Since federal government spending's share of GNP increased
by a factor of 10 and general government's by a factor of 5, it is difficult to refute our conclusion that taxes
have grown more rapidly than regulation merely by renormalizing the regulation series.
1890 1910 1930 1950 1970 1990Congress Member Staffs (upper) Congress Committee Staffs (upper)
power of one subsidized group IG, SR + yes yes 0 + 0 +* *
Notes (see also notes for Table 1):whether aggregate spending and taxes are increased by relatively more taxpayers or more of those subsidized depends on the†
parameters of the model composition changes are different from those for the IG model**
“exogenous” changes in efficiency are reductions in * ,F ,* , or F .***T T R R
Accounting for Government - 37
IX. References
Barro, Robert J. “On the Determination of the Public Debt.” Journal of Political Economy. 87(5),
October 1979: 940-71.
Becker, Gary S. "A Theory of Competition among Pressure Groups for Political Influence." Quarterly
Journal of Economics. 98(3), August 1983: 371-400.
Becker, Gary S. and Casey B. Mulligan. “Deadweight Costs and the Size of Government.” NBER
Working paper #6789, October 1998.
Becker, Gary S. and Kevin M. Murphy. “The Family and the State.” Journal of Law and Economics.
31(1), April 1988: 1-18.
Bibby, J.F., T.E. Mann, and N.J. Ornstein. Vital Statistics on Congress, 1980. Wash. DC: American
Enterprise Institute for Public Policy Research, 1980. p. 69-71.
Brennan, H. Geoffrey and James M. Buchanan. The Power to Tax: Analytical Foundations of a Fiscal
Constitution. Cambridge, MA: Cambridge University Press, 1980.
Boadway, Robin W. and David E. Wildasin. "A Median Voter Model of Social Security." International
Economic Review. 30(2), May 1989: 307-28.
Browning, Edgar K. "Why the Social Insurance Budget Is Too Large in a Democracy." Economic
Inquiry. 13(3), Sept. 1975: 373-88.
Buchanan, James M. and Roger Congleton. "Proportional and Progressive Income Taxation with
Utility-Maximizing Governments" Public Choice. 34(2), 1979: 217-30.
Buchanan, James M. and Dwight R. Lee. "Politics, Time, and the Laffer Curve." Journal of Political
Economy. 90(4), August 1982: 816-19.
Demsetz, Harold. Economic, Legal, and Political Dimensions of Competition. Amsterdam: North-
Holland, 1982.
Foley, D. K. "State Expenditures from a Marxist Perspective." Journal Public Economics. 9,1978: 221-
38.
Fox, H.W. Jr. and S.W. Hammond. Congressional Staffs: The Invisible Forcein American Lawmaking.
New York: The Free Press, 1977. p.171.
Friedman, Milton and Rose D. Friedman. Free to Choose. New York: Harcourt Brace Jovanovich, 1980.
Harberger, Arnold C. ''Basic Needs versus Distributional Weights in Social Cost-Benefit Analysis.''
Economic Development and Cultural Change. 32(3), April 1984: 455-74.
Hopkins, Thomas D. Regulatory Costs in Profile. CSAB Policy Study Number 132, August 1996.
Judicial Conference of the United States. Annual Report of the Director. Washington D.C.: Statistics
Accounting for Government - 38
Division of the Administrative Office of the United States Courts, various issues.
Kau, James B. and Paul H. Rubin. “The Size of Government.” Public Choice. 37(2), 1981: 261-74.
Ledyard, John O. “The Pure Theory of Large Two-Candidate Elections.” Public Choice. 44(1), 1984:
7-41.
Lott, John, Jr. and Larry Kenny. “Did Women's Suffrage Change the Size and Scope of Government?”
Forthcoming, Journal of Political Economy, 1999.
Mirrlees, James A. “An Exploration in the Theory of Optimal Income Taxation.” Review of Economic
Studies. 38, 1971: 175-208.
Mueller, Dennis C. Public Choice II. Cambridge: Cambridge University Press, 1989: 124-34.
Mulligan, Casey B. and Tomas J. Philipson. “Policy Design and Incidence in a Merit Good Economy.”
Working paper, University of Chicago, June 1999.
Mulligan, Casey B. and Xavier Sala-i-Martin. “Gerontocracy, Retirement, and Social Security.” NBER
Working Paper #7117, May 1999.
Olsen, Edgar O. and Kathy A. York. ''The Effect of Different Measures of Benefit on Estimates of the
Distributive Consequences of Government Programs.'' in Marilyn Moon, ed. Economics Transfers
in the United States. Studies in Income and Wealth , vol. 49. Chicago and London: University of
Chicago Press 1984: 177-95.
Olson, Mancur. The Rise and the Decline of Nations. New Haven, CT: Yale University Press, 1982.
Olson, Mancur. “An Appreciation of the Tests and Criticisms.” Scandinavian Political Studies. 9(1),
March 1986: 65-80.
Ornstein, Norman J., Thomas E. Mann, and Michael J. Malbin. Vital Statistics on Congress 1997-1998.
Washington, DC: American Enterprise Institute, 1998.
Peltzman, Sam. “The Growth of Government.” Journal of Law and Economics. 23(2), October 1980:
209-87.
Peltzman, Sam. "George Stigler's Contribution to the Economic Analysis of Regulation." Journal of
Political Economy. 101(5), October 1993: 818-32.
Ramsey, Frank. “A Contribution to the Theory of Taxation.” Economic Journal. 37, March 1927: 47-61.
Sala-i-Martin, Xavier X. “A Positive Theory of Social Security.” Journal of Economic Growth. (1)2,
June 1996: 277-304.
Summers, Lawrence H., Jonathan Gruber, and Rodrigo Vergara. “Taxation and the Structure of Labor
Markets: The Case of Corporatism.” Quarterly Journal of Economics. 108(2), May 1993:
385-411.
Accounting for Government - 39
Turner, John A. "Population Age Structure and the Size of Social Security." Southern Economic Journal.
50(4), April 1984: 1131-46.
United States Department of Labor, Women's Bureau. British Policies and Methods in Employing Women
in Wartime. Women's Bureau Bulletin no. 200. Washington, DC: U.S. Government Printing
Office, May 1944.
United States Department of Labor, Women's Bureau. State Labor Laws for Women with Wartime
Modifications. Women's Bureau Bulletin no. 202. Washington, DC: U.S. Government Printing
Office, 1945.
U.S. General Accounting Office. "Regulatory Reform: Information on Costs, Cost-Effectiveness, and
Mandated Deadlines for Regulations," GAO/PEMD-95-18BR, March 1995.
United States, Department of Commerce, Bureau of the Census. Historical Statistics of the United States,
Colonial Times to 1970. Bicentennial edition. Washington: U.S. Dept. of Commerce, Bureau of
the Census, 1975.
United States Office of the Federal Register. Code of Federal Regulations. Washington, DC: Office of
the Federal Register, various issues.
United States Office of the Federal Register. Federal Register. Washington, DC: Office of the Federal
Register, various issues.
United States, Office of the Federal Register. The Federal Register: What It Is and How to Use It.
Washington, DC: Office of the Federal Register, 1980.
United States Office of Management and Budget. Historical Tables, Budget of the United States
Government, Fiscal Year 1996. Washington, DC: Government Printing Office, 1996.
United States Office of Management and Budget. Historical Tables, Budget of the United States
Government, Fiscal Year 1997. Washington, DC: Government Printing Office, 1997.
Vawter, Roderick L. Industrial Mobilization: the Relevant History. Fort Lesley J. McNair, Washington,
D.C.: National Defense University Press, 1983.
Warner, John T. and Beth J. Asch. “The Economic Theory of a Military Draft Reconsidered.” Defence
and Peace Economics. 7(4), 1996: 297-312.
Wilson, John Douglas. "Are Efficiency Improvements in Government Transfer Policies Self Defeating in
Political Equilibrium?" Economics and Politics. 2(3), November 1990: 241-58.
Wittman, Donald A. "Pressure Group Size and the Politics of Income Redistribution." Social Choice and
Welfare. 6, 1989: 275-86.
Wittman, Donald A. The Myth of Democratic Failure: Why Political Institutions are Efficient. Chicago: