Accounting Fraud and Institutional Investors by Chad R. Larson A dissertation submitted in partial fulfillment of the requirements for the degree of Doctor of Philosophy (Business Administration) in The University of Michigan 2008 Doctoral Committee: Professor Russell J. Lundholm, Chair Associate Professor Michelle L. Hanlon Associate Professor Emre Ozdenoren Associate Professor Tyler G. Shumway
Transcript
Accounting Fraud and Institutional Investors
by
Chad R. Larson
A dissertation submitted in partial fulfillmentof the requirements for the degree of
Doctor of Philosophy(Business Administration)
in The University of Michigan2008
Doctoral Committee:
Professor Russell J. Lundholm, ChairAssociate Professor Michelle L. HanlonAssociate Professor Emre OzdenorenAssociate Professor Tyler G. Shumway
To Amy and Jack
ii
ACKNOWLEDGEMENTS
I would like to thank members of my dissertation committee, Russell Lundholm
(Chair), Michelle Hanlon, Tyler Shumway, and Emre Ozdenoren for their insights
and support. I would also like to thank Lian Fen Lee, Mike Minnis, and
participants of the Brigham Young University Accounting Symposium and the
5.3 Changes in institutional ownership over the fraud period . . . . . . . . . . . . . . . 385.4 Pooled OLS regressions of changes in institutional ownership surrounding account-
Although accounting manipulations result in significant investor losses and are
associated with firm characteristics and performance, little evidence exists on
whether sophisticated investors are able to avoid losses associated with accounting
fraud.
1
2
Institutional investors have become a significant market force over the last several
decades. From the early 1980s to the late 1990s, institutional investors doubled
their ownership in the equity markets to over 50 percent (Gompers and Metrick,
2001). The rising presence of institutional investors in the U.S. markets has spurred
a significant body of literature investigating whether they execute profitable trades.
The results of the literature are mixed. Several studies document positive
associations between changes in institutional investors’ holdings and future
earnings and returns, suggesting that institutions are informed traders (e.g., Ke
and Ramalingegowda 2005; Ke and Petroni 2004; Ali, Durtschi, Lev, and
Thrombley 2004). On the other hand, some literature suggests that informed
trading might be more limited, finding that superior mutual fund performance is
rarely persistent (Carhart 1997; Brown and Goetzmann 1995) and trading patterns
previously considered informed might simply be the result of momentum trading
(Bushee and Goodman, 2007).
The predictability of accounting fraud and the large market losses associated with
accounting fraud suggest that it is an ideal setting to examine the sophistication of
institutional investors. If institutional investors possess superior information and
are sophisticated users of accounting information with respect to accounting fraud,
they should sell shares in fraud firms prior to public revelations of fraud. My
primary research question is whether institutional investors anticipate accounting
fraud revelations and divest shares in fraud firms prior to the public revelation of
frauds. As a secondary research question, I examine whether institutions act as
effective firm monitors in the prevention of fraud. I use Accounting, Auditing, and
Enforcement Releases (AAER) involving accounting manipulations as a proxy for
fraud and the first press article in Factiva mentioning an accounting irregularity as
3
the public revelation of fraud.1 I examine institutional trading patterns in 322 firms
that the Securities and Exchange Commission (SEC) identified in enforcement
actions from 1982 through 2005 as having manipulated their accounting earnings.
My analysis is conducted in two stages. The first stage is a firm-level analysis that
aggregates institutions at the firm-level and examines their trading behavior in
fraud firms. The second stage is an institution-level analysis that exploits the
heterogeneity among institutional investors and examines their trading behavior in
fraud firms.
For my firm-level analysis, I follow Bushee (2001) by grouping institutions into
three categories based on their investment styles: quasi-indexer, transient, and
dedicated. Quasi-indexer institutions are characterized by diversified portfolios and
low portfolio turnover. Transient institutions are characterized by diversified
portfolios and high portfolio turnover, and dedicated institutions are characterized
by highly concentrated portfolios and low portfolio turnover. Consistent with prior
literature, I expect to find that transient institutions are the most likely to initiate
profitable trades in anticipation of a fraud revelation and quasi-indexer institutions
are unlikely to initiate profitable trades in anticipation of a fraud revelation (e.g.,
Ke and Ramalingegowda 2005; Hribar, Jenkins, and Wang 2006). I make no strong
predictions for dedicated institutions as research typically finds that they do not
trade based on impending future events. However, fraud is a unique setting that
may lead dedicated institutions to divest their positions. If dedicated institutions
invest in firms based on their confidence in the vision and integrity of management,
detecting a fraud might lead dedicated institutions to divest their shares. In
1In AAERs the Securities and Exchange Commission (SEC) typically alleges manipulation of financial statements.This does not necessarily mean that firms are guilty of fraud under the strict definition. By legal definition, fraudrequires both knowledge of the falsity (scienter) and the intent to deceive and induce reliance. The vast majorityof AAERs are settled between parties and the SEC without parties “admitting or denying guilt.” In the followingsections, I discuss the implications of this for my research design.
4
addition, since dedicated institutions are characterized by highly-concentrated
portfolios, they are likely to have a larger percentage of their portfolios at risk if
fraud is revealed. Therefore, they are likely to have the strongest incentives to
anticipate fraud and divest their shares in fraud firms.
A body of literature suggests that institutional investors act as firm monitors (e.g.
Chung, Firth, and Kim 2002; Chen, Harford, and Li 2007). If this is the case, then
it is possible that fraud firms have low levels of institutional investment prior to
committing fraud because they lack effective monitoring. Therefore, my first set of
tests examines whether institutional ownership levels in fraud firms immediately
prior to the release of a first fraudulent earnings report differ from a population of
control firms. In univariate analysis, I find that fraud firms actually have higher
levels of total institutional ownership, quasi-indexer ownership, and transient
institutional ownership than non-fraud firms. Dedicated institutional ownership is
not significantly different from the non-fraud sample of firms. Next, I conduct
regression analysis that controls for firm characteristics. I find that immediately
prior to the beginning of a fraud, fraud firms’ total level of institutional ownership
is higher than institutional ownership for a sample of control firms. However, I find
that the higher level of institutional ownership is primarily the result of a
significantly higher level of transient institutional ownership, while quasi-indexer
and dedicated institutional ownership is nearly identical after controlling for firm
characteristics. The univariate and regression results suggest that the level of
institutional ownership does not act as a sufficient monitoring device in the
prevention of fraud.
My next sets of tests provide evidence relating to my primary research question. I
first examine changes in institutional ownership levels in fraud firms over the
5
periods firms commit fraud. From the quarter prior to the issuance of a first
fraudulent earnings report until the quarter prior to the public revelation of an
accounting fraud, I find that institutional ownership in fraud firms increases by
almost 14 percent, representing 3.9 percent of a fraud firm’s outstanding stock.2
Because fraud firms experience stock price declines of approximately 35 percent
once the fraud is revealed, the 3.9 percent increase in institutional ownership over
the fraud period is not trivial. In fact, calculations suggest that total institutional
losses for the 322 fraud firms in my sample are on the order of $138 billion. The 3.9
percent increase in institutional ownership over the fraud period represents
approximately $20 billion of those losses.
Prior research has examined whether institutions can predict impending events
over short windows (Hribar, Jenkins, and Wang, 2006). Accordingly, in my next set
of tests, I observe changes in institutional ownership in the quarters immediately
prior to and following the public revelation of fraud. I find that in the quarter
immediately prior to a fraud revelation, institutional ownership decreases by
approximately one and a half percent of a fraud firm’s outstanding stock. I find
significant decreases for transient institutional holdings, while changes in
quasi-indexer and dedicated institutional holdings are insignificant. I also find
significant decreases in the quarter immediately following the fraud revelation.
These results are robust to several control variables including current and past
stock returns, unexpected earnings, and changes in share turnover. Although I find
some evidence that transient institutions are able to anticipate fraud one period
prior to its revelation, this evidence must be interpreted in light of evidence from
my previous tests. The one and a half percent decrease in institutional ownership
2I assume that the first quarter a firm committed fraud is the first quarter that the SEC alleged in an AAER afirm manipulated its earnings.
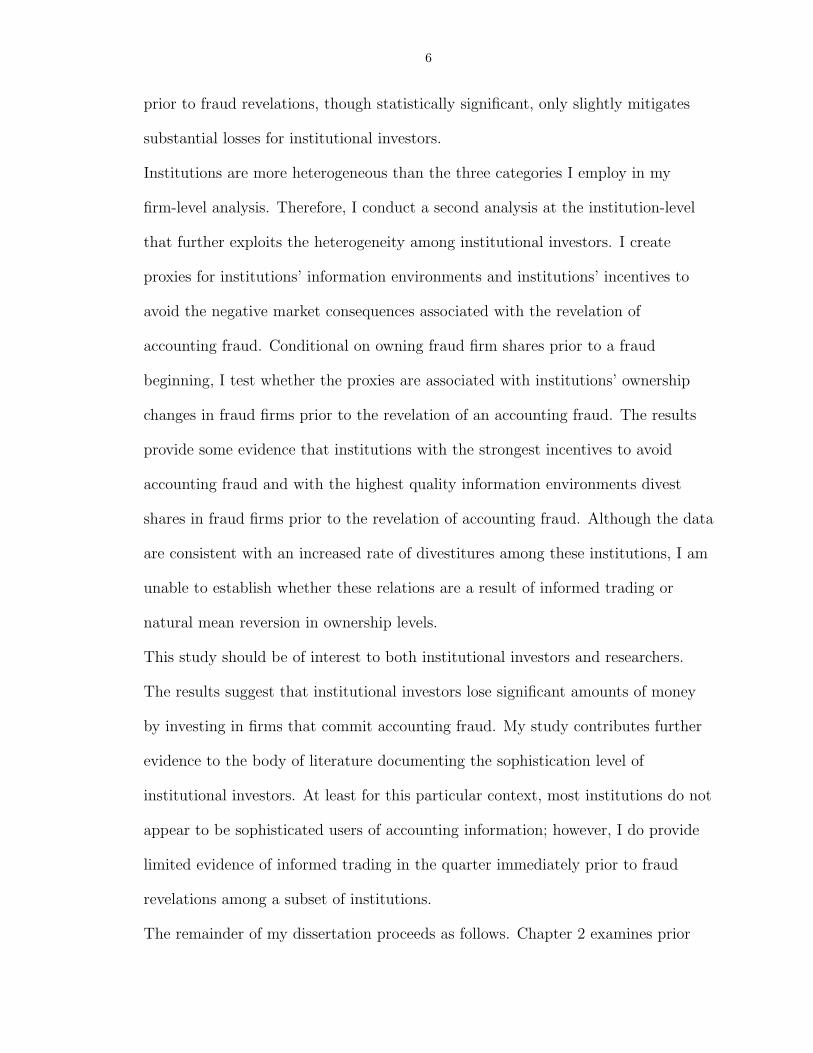
6
prior to fraud revelations, though statistically significant, only slightly mitigates
substantial losses for institutional investors.
Institutions are more heterogeneous than the three categories I employ in my
firm-level analysis. Therefore, I conduct a second analysis at the institution-level
that further exploits the heterogeneity among institutional investors. I create
proxies for institutions’ information environments and institutions’ incentives to
avoid the negative market consequences associated with the revelation of
accounting fraud. Conditional on owning fraud firm shares prior to a fraud
beginning, I test whether the proxies are associated with institutions’ ownership
changes in fraud firms prior to the revelation of an accounting fraud. The results
provide some evidence that institutions with the strongest incentives to avoid
accounting fraud and with the highest quality information environments divest
shares in fraud firms prior to the revelation of accounting fraud. Although the data
are consistent with an increased rate of divestitures among these institutions, I am
unable to establish whether these relations are a result of informed trading or
natural mean reversion in ownership levels.
This study should be of interest to both institutional investors and researchers.
The results suggest that institutional investors lose significant amounts of money
by investing in firms that commit accounting fraud. My study contributes further
evidence to the body of literature documenting the sophistication level of
institutional investors. At least for this particular context, most institutions do not
appear to be sophisticated users of accounting information; however, I do provide
limited evidence of informed trading in the quarter immediately prior to fraud
revelations among a subset of institutions.
The remainder of my dissertation proceeds as follows. Chapter 2 examines prior
7
literature and outlines my empirical predictions. Chapter 3 outlines my research
design. Chapter 4 describes my sample selection process and provides descriptive
statistics. Chapter 5 details my tests and presents results and chapter 6 concludes.
CHAPTER II
Prior Literature and Empirical Predictions
My dissertation builds on two streams of prior literature. The first stream of
literature examines the determinants and consequences of accounting
manipulations. The second stream of literature examines the trading behavior of
institutional investors.
2.1 Accounting Manipulations
Prior research has identified characteristics of firms that manipulate their financial
statements. Dechow, Ge, Larson, and Sloan (2007) investigate a comprehensive
sample of all 895 firms subject to Accounting, Auditing, and Enforcement Releases
(AAER) from 1982 through July 2005. They examine the use of several financial
statement variables, off-balance sheet and non-financial variables, and
market-related variables to predict accounting manipulations. They find that firms
accused by the SEC of manipulating their financial performance tend to have had
strong performance prior to manipulations. They also find that manipulations
appear to be motivated by managers’ desire to obfuscate deteriorating financial
performance. During manipulation years, they find that cash profit margins and
return on assets are declining while accruals are increasing. They also find that
firms manipulating financial reporting are more likely to issue debt and equity.
8
9
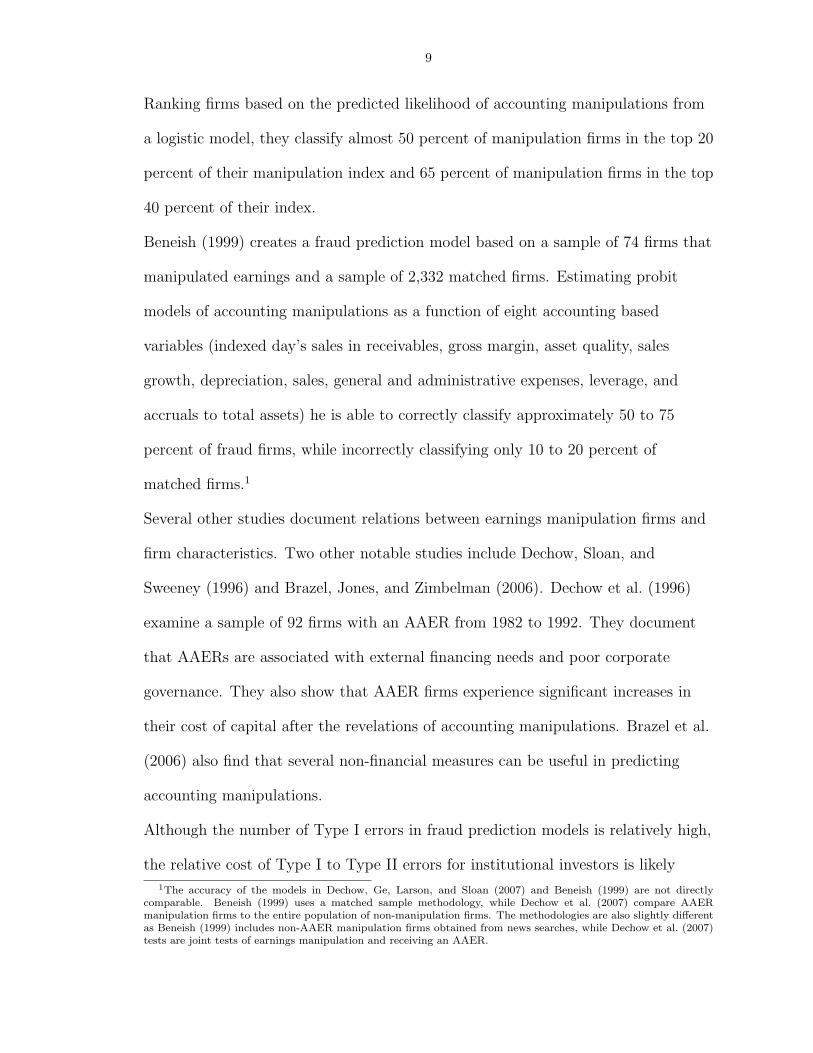
Ranking firms based on the predicted likelihood of accounting manipulations from
a logistic model, they classify almost 50 percent of manipulation firms in the top 20
percent of their manipulation index and 65 percent of manipulation firms in the top
40 percent of their index.
Beneish (1999) creates a fraud prediction model based on a sample of 74 firms that
manipulated earnings and a sample of 2,332 matched firms. Estimating probit
models of accounting manipulations as a function of eight accounting based
growth, depreciation, sales, general and administrative expenses, leverage, and
accruals to total assets) he is able to correctly classify approximately 50 to 75
percent of fraud firms, while incorrectly classifying only 10 to 20 percent of
matched firms.1
Several other studies document relations between earnings manipulation firms and
firm characteristics. Two other notable studies include Dechow, Sloan, and
Sweeney (1996) and Brazel, Jones, and Zimbelman (2006). Dechow et al. (1996)
examine a sample of 92 firms with an AAER from 1982 to 1992. They document
that AAERs are associated with external financing needs and poor corporate
governance. They also show that AAER firms experience significant increases in
their cost of capital after the revelations of accounting manipulations. Brazel et al.
(2006) also find that several non-financial measures can be useful in predicting
accounting manipulations.
Although the number of Type I errors in fraud prediction models is relatively high,
the relative cost of Type I to Type II errors for institutional investors is likely
1The accuracy of the models in Dechow, Ge, Larson, and Sloan (2007) and Beneish (1999) are not directlycomparable. Beneish (1999) uses a matched sample methodology, while Dechow et al. (2007) compare AAERmanipulation firms to the entire population of non-manipulation firms. The methodologies are also slightly differentas Beneish (1999) includes non-AAER manipulation firms obtained from news searches, while Dechow et al. (2007)tests are joint tests of earnings manipulation and receiving an AAER.
10
extremely low. Several studies have estimated investment losses when accounting
manipulations are revealed. The latest large sample evidence suggests that the cost
of Type II errors average approximately 40 percent of an institution’s investment in
a fraud firm (Karpoff, Lee, and Martin, 2007). On the other hand, the cost of a
Type I error is extremely low in a market with many substitute assets as investors
can simply choose not to hold firms with a high probability of fraud. Investors may
also be privy to private information regarding firm performance and accounting
manipulations. To the extent that investors possess private information and choose
to use other qualitative information, they may be able to significantly reduce the
number of Type I and II errors incurred when attempting to identify accounting
frauds.
The high number of Type I errors associated with using earnings manipulation
prediction models might also suggest that investors would be willing to live with
the negative returns associated with fraud firms if the negative returns are balanced
out with sufficiently positive returns from non-fraud firms with strong signals of
fraud. In a concurrent working paper, Beneish and Nichols (2007), show that this is
not the case. Their results reveal that firms with a high probability of manipulated
earnings have lower future earnings and returns. They also show that a trading
strategy based on the probability of earnings manipulation yields an abnormal
hedge return of 13.9 percent.2 Through additional tests they conclude that the
returns, which are concentrated on the short side, are not a result of asymmetric
arbitrage costs, but rather a result of asymmetric errors in market expectations.
Beneish and Nichols (2007) do not provide direct evidence on firms that actually
manipulate earnings, rather they examine portfolios of firms with a high
2I conduct a similar analysis using the F-score in Dechow, Ge, Larson, and Sloan (2007), which uses the samesample I employ, and find results qualitatively similar to Beneish and Nichols (2007).
11
probability of manipulation. They find that institutional investors increase their
holdings in firms with a high probability of manipulation. My study focuses on the
actual incidence of fraud. I am able to provide more detailed and direct evidence
on the trading behavior of institutions in actual fraud firms before, during, and
after the period in which firms commit fraud and the frauds become public.
2.2 Institutional Investors
From 1980 to 1996, institutional investors doubled their share of the market and
now control over half of the U.S. equity market (Gompers and Metrick, 2001). The
increased importance and perceived sophistication of institutional investors has
spawned a large body of literature.
One branch of the literature examines whether institutional investors act as
monitors and influence managements’ decisions. The evidence suggests that the
level of institutional ownership and the composition of a firm’s institutional
ownership base matters when determining whether institutional owners are likely to
act as effective monitors. Bushee (1998) finds that managers are less likely to cut
research and development expenses when facing an earnings shortfall if institutional
ownership is high. But he also finds that a large proportion of ownership by
institutions that trade based on momentum and have high portfolio turnover
increase the likelihood that a firm will cut research and development to meet an
earnings shortfall. Chung, Firth, and Kim (2002) find that large institutional
shareholdings in a firm reduce the likelihood of earnings management using
accruals. Chen, Harford, and Li (2007), using acquisition decisions to reveal
monitoring, find that institutions with long-term investments specialize in
monitoring while other institutions do not monitor. Bushee (2001) finds that high
12
levels of short-term investors are associated with an over-weighting of near-term
expected earnings and an under-weighting of long-term expected earnings. In light
of this combined evidence, my first prediction is that fraud firms, prior to the
issuance of their first fraudulent earnings report, are likely to have low levels of
institutional ownership. I also expect that fraud firms will have higher levels of
short-term, transient, institutional ownership and lower levels of long-term,
dedicated, institutional ownership.
Much of the accounting research on institutional investors’ trading behavior
suggests that institutional investors are sophisticated users of accounting
information. For example, previous literature has documented that the higher the
level of institutional ownership, the smaller the market reaction surrounding
earnings announcements (El-Gazzar, 1998). Balsam, Bartov, and Marquardt (2002)
find that the valuation implications of large discretionary accruals are incorporated
into stock prices more quickly for firms with large institutional investor bases. The
presence of institutional investors is also positively associated with the extent that
prices lead earnings (Jiambalvo, Rajgopal, and Venkatachalam, 2002). Studies have
also shown that institutional investors exploit accounting based stock price
anomalies such as the post-earnings announcement drift (Ke and Ramalingegowda,
2005) and the accruals anomaly (Collins, Gong, and Hribar, 2003). Lev and Nissim
(2006) also show that the accruals anomaly is exploited by some institutional
investors, but the magnitude of this accruals-related trading is rather small. They
show that the continued persistence of the accruals anomaly is not explained by a
lack of understanding among institutions, but rather an institutional distaste for
extreme-accruals firms that are typically small, unprofitable, and risky. Ke and
Ramalingegowda (2005) find that institutions also possess information that allows
13
them to avoid negative stock price shocks associated with a break in a string of
consecutive earnings increases.
Although much of the literature on institutional investors suggests that they are
sophisticated users of financial information, this literature stands in contrast to
evidence that questions whether institutions profit from informational advantages.
For example, much of the literature on mutual fund performance suggests that
superior performance is not persistent (e.g., Brown and Goetzmann 1995).
Additionally, O’Brien and Bhushan (1990) find that institutions are attracted to
firms with more analyst following. Similarly, Bushee and Noe (2000) find that
institutions are attracted to firms with high-quality disclosure regimes. Therefore,
if public and private information are substitutes, institutions should have fewer
opportunities to benefit from informational advantages. If institutional investors
possess superior private information or information processing abilities, I expect to
find support for my second prediction that institutional investors divest shares in
firms that are committing accounting fraud. A lack of evidence that institutions
divest shares in fraud firms prior to public revelations of fraud would suggest that
either investors are unable to use private information to anticipate public
announcements of fraud or the cost of anticipating the public announcements of
fraud are too great relative to the benefits.
Institutional investors exhibit heterogeneity in their investment styles. Prior
literature has shown that the likelihood of informed trading varies with institutional
investors’ characteristics (e.g., Hribar and Jenkins 2004; Ke and Ramalingegowda
2005). Much of the prior literature has relied on a methodology proposed by
Bushee (1998). In this methodology, institutions are first classified into one of three
investment strategies (quasi-indexer, transient, and dedicated institutional
14
investors) based on portfolio turnover and stake sizes. The institutions are then
aggregated at the firm level. The body of evidence that uses this methodology
typically finds that profitable trading in anticipation of future events is only
identifiable for the transient investor category. Therefore, I expect any evidence
that institutional investors predict accounting fraud will be concentrated among
transient institutional investors. Because dedicated institutional owners have the
largest portion of their portfolios at stake when a fraud is revealed, I also anticipate
the possibility that they may divest shares in anticipation of fraud revelations.
In a recent paper, Bushee and Goodman (2007) exploit the heterogeneity among
institutional investors and the positions they hold by conducting an analysis that
includes not only institution-level variables such as portfolio size and trading
strategy but also institution-firm-level characteristics such as the size of a position
in a particular firm and the size of the position in a firm relative to an institution’s
portfolio size. They find that private information trading is most pronounced when
large positions are taken by investment advisers in small firms. In the spirit of
Bushee and Goodman (2007), I conduct an institution-level analysis that exploits
the heterogeneity among institutional investors that is not captured by the three
types of trading strategies employed in my firm-level analysis. Using proxies for the
quality of an institution’s information environment and the incentives an
institution has to avoid fraud firms, I expect to find that institutions with the
strongest incentives to avoid accounting fraud and higher-quality information
environments are more likely to divest shares in fraud firms prior to the revelation
of accounting fraud. I define and discuss in the institution-level analysis section the
proxies I employ.
15
2.3 Accounting Fraud and Restatements
A body of literature exists examining the determinants and consequences of
accounting restatements (e.g., Palmrose, Richardson, and Scholz 2003; Palmrose,
Scholz, and Wahlen 2004; Hribar and Jenkins 2004). For example, Desai,
Krishnamurthy, and Venkataraman (2006) find that short interest increases in the
months immediately prior to an earnings restatement. Also, in a current working
paper, Hribar, Jenkins, and Wang (2006) examine institutional investors and
accounting restatements and find that transient institutional investors significantly
reduce their holdings in the quarter prior to a restatement. Although there is some
overlap with my work on accounting fraud, it is important to note that
restatements and accounting fraud are not the same.
Firms in my sample are firms that are accused by the SEC of manipulating their
earnings. Restatements, on the other hand, can occur for a number of reasons,
including unintentional errors and legitimate disagreements over the application of
generally accepted accounting principles. Additionally, not all firms accused of
accounting manipulations restate their earnings. Often, firms that have
manipulated their earnings are not required to restate their earnings as part of an
SEC settlement. These firms may also delist or enter bankruptcy before they have
a chance to restate their earnings. Palmrose, Richardson, and Scholz (2003) find
that in a sample of 403 restatements fewer than 23 percent resulted in an AAER.
This is consistent with restatements resulting from a number of behaviors other
than intentional manipulations.
The differences between accounting fraud and accounting restatements are
significant because they affect both the determinants and consequences of
16
accounting irregularities. For example, Palmrose, Richardson, and Scholz (2003)
document a much more negative market reaction to accounting fraud than to
accounting restatements. This more negative price reaction to accounting fraud
increases the benefits of early detection of accounting fraud by institutional
investors. In addition, substantial differences in the ability of institutional investors
to detect accounting manipulations and accounting restatements likely exist. For
example, accounting restatements can come in waves as a consequence of SEC and
FASB clarifications on generally accepted accounting principles (such as SAB 101),
whereas accounting frauds require intent and the desire to hide manipulations from
investors.
CHAPTER III
Research Design
My research design involves classifying firms into two samples: a fraud sample and
a non-fraud sample. I use SEC Accounting, Auditing, and Enforcement Releases
(AAERs) as a proxy for accounting fraud. The SEC takes enforcement actions
against firms, auditors, and managers who violate securities laws. In 1982, the SEC
began issuing AAERs in cases where securities law violations involved accounting
or auditing issues. Although AAERs all relate somehow to accounting and auditing
issues, not all AAERs are the result of reported accounting manipulations. Some
AAERs are the result of disclosure issues, bribery, and other violations of securities
laws. I exclude these AAERs from my sample and focus on AAERs that allege
manipulation of reported accounting earnings.
The use of AAERs as a proxy for fraud is consistent with much of the prior
literature (e.g., Bonner, Palmrose, and Young 1998; Erickson, Hanlon, and Maydew
2004). This methodology has advantages and disadvantages. The use of AAERs as
a proxy for fraud is a straightforward and consistent methodology that avoids
potential biases induced in samples based on a researcher’s classification scheme.
AAERs are also likely to capture a group of economically significant frauds as the
SEC has limited resources and likely pursues cases against large firms (Dechow, Ge,
17
18
Larson, and Sloan, 2007). On the other hand, using AAERs as a proxy for fraud
may result in a sample that includes firms that the SEC targeted for political
reasons rather than fraud.1 This methodology also excludes an unknown number of
firms the SEC did not take action against.
Any research design that attempts to classify firms into fraud and non-fraud
samples will have an unknown number of Type I and Type II errors. Assuming
that the number of Type I errors is relatively low in my fraud sample, then my
tests, at worst, can be interpreted as joint tests of committing fraud and receiving
an enforcement action. If the number of Type I errors is relatively high then, at
worst, my results can be interpreted as tests of firms engaging in accounting
activities that result in enforcement actions. My non-fraud sample is also likely to
have an unknown number of Type I errors as the SEC clearly does not catch all
frauds. Although this weakens the power of my tests, it is unlikely to be a
significant problem in my research design as the number of Type I errors in my
non-fraud sample is likely relatively small. In addition, the event of interest in my
study is the revelation of the accounting fraud. Frauds that go undiscovered are
unlikely to have as significant a negative effect on institutional investors.
My research design and the power of my tests would benefit by including a proxy
for the magnitude of the frauds. Unfortunately, the inconsistency in details across
AAERs makes collection of the fraud magnitudes from the AAERs unfeasible.
Magnitudes are measured inconsistently and many times are not reported at all.
1Using a stricter legal definition of fraud, Feroz, Park, and Pastena (1991) point out that not all AAERs are theresult of fraud. Therefore, in some studies, such as Erickson, Hanlon, and Maydew (2004), where managerial intentis central to the hypotheses being tested, all AAERs are read and only those firms that the SEC specifically allegedcommitted fraud are included. I elect not to take this approach, because managerial intent is not as critical in mysetting. Therefore, my approach increases my sample size at a relatively low cost. In addition, after a detailed readingof many AAERs it becomes clear that the wording and level of detail in the AAERs varies greatly. Although thisvariation is likely associated with the severity and types of violations, the variation is also likely to be associated withthe SEC regime at the time of the enforcement action, the individuals investigating the violations, who is assignedto write the AAER, and negotiations between the SEC and those receiving the enforcement action. Therefore anymethodology that seeks to separate AAER firms into fraud and non-fraud firms based on direct allegations of fraudin an AAER is likely reducing Type I errors while increasing Type II errors.
19
An AAER may report magnitudes on a before or after tax basis, a gross or net
income basis, or a raw dollar or per share basis.2 As a result, I focus on the
incidence of fraud rather than the magnitude.
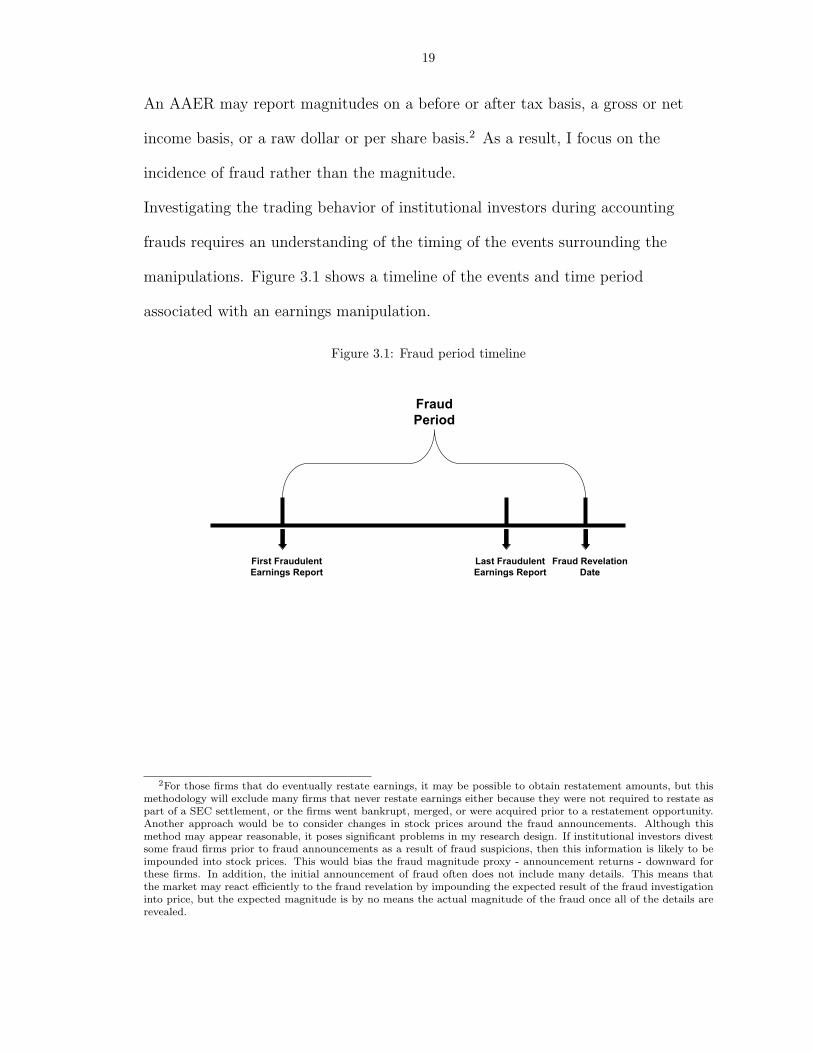
Investigating the trading behavior of institutional investors during accounting
frauds requires an understanding of the timing of the events surrounding the
manipulations. Figure 3.1 shows a timeline of the events and time period
associated with an earnings manipulation.
Figure 3.1: Fraud period timeline
Last FraudulentEarnings Report
First FraudulentEarnings Report
Fraud RevelationDate
FraudPeriod
2For those firms that do eventually restate earnings, it may be possible to obtain restatement amounts, but thismethodology will exclude many firms that never restate earnings either because they were not required to restate aspart of a SEC settlement, or the firms went bankrupt, merged, or were acquired prior to a restatement opportunity.Another approach would be to consider changes in stock prices around the fraud announcements. Although thismethod may appear reasonable, it poses significant problems in my research design. If institutional investors divestsome fraud firms prior to fraud announcements as a result of fraud suspicions, then this information is likely to beimpounded into stock prices. This would bias the fraud magnitude proxy - announcement returns - downward forthese firms. In addition, the initial announcement of fraud often does not include many details. This means thatthe market may react efficiently to the fraud revelation by impounding the expected result of the fraud investigationinto price, but the expected magnitude is by no means the actual magnitude of the fraud once all of the details arerevealed.
20
The timeline includes three events. The first event is the issuance of a first
fraudulent earnings report, which is then followed by the second event, the issuance
of a final fraudulent earnings report. The number of quarters between these two
events varies considerably across firms some only manipulate 1 quarter while a
handful of firms manipulate over 20 quarters. The last event in the timeline is the
public announcement of the earnings manipulations. I define the time period
between the issuance of a first fraudulent earnings report and the fraud revelation
date as the fraud period. The fraud period in my sample varies in length from 1
quarter to 39 quarters. Figure 4.1 displays the distribution of fraud period lengths
for the 322 firms in my fraud sample. My non-fraud sample consists of all firms
never included in my fraud sample.
I conduct both firm-level and institution-level analyses. For the firm-level analysis,
I conduct three sets of tests. Each set of tests is conducted on total, quasi-indexer,
transient, and dedicated institutional ownership. I use the classification scheme in
Bushee (2001) to characterize institutional investors.3 Following Ke and
Ramalingegowda (2005) and Hribar, Jenkins, and Wang (2006), I assign each
institution to the type that is most frequent over my sample period.4 First, I test
whether levels of institutional ownership in fraud firms the quarter prior to the
fraud period differ from non-fraud firms. Second, I test for unusual changes in
institutional ownership levels and numbers of institutional investors owning shares
in fraud firms from the quarter prior to the fraud period until the last quarter of
3Bushee (2001) uses several variables from prior studies that describe institutional trading behaviors includingportfolio concentration, average percentage holding, percent held in large blocks, Herfindahl measure of concentration,stability of holdings, and portfolio turnover. He then uses principal factor analysis to generate factors that explainthe variation across institutions. The institutions are then classified into groups using K-means cluster analysis. Iwould like to thank Brian Bushee for providing me with the institution classifications through 2005.
4Thomson Financial has reused approximately 500 manager identification numbers out of approximately 2500manager identification numbers in the Institutional Ownersip Database. I have not made any attempts to fix thisissue. This reuse of manager numbers will add an unknown amount of noise to my classification scheme. This shouldhave no effect on the total institutional ownership inferences.
21
the fraud period. Third, I examine changes in institutional ownership in the
quarters immediately prior to and following the public revelation of the fraud. In
my second analysis, I test whether institution-level proxies for 1) incentives to
avoid accounting fraud and 2) private information and superior information
processing ability are negatively associated with changes in ownership of fraud
firms prior to fraud revelations. The next chapter describes my sample selection
and provides descriptive statistics for the fraud and non-fraud samples.
CHAPTER IV
Sample Selection and Descriptive Statistics
I obtain data for my tests from four data sources: the Dechow, Ge, Larson, and
Sloan (2007) AAER database, the CDA/Spectrum S34 database, the Center for
Research in Stock Prices (CRSP), and COMPUSTAT. Dechow et al. (2007) read
and code AAER one through 2,261. After reading the AAERs, they identify 895
separate firms identified by the SEC as having committed wrongdoing. Of the 895
firms, 677 were alleged to have manipulated at least one specific quarterly earnings
report. The Dechow et al. (2007) quarterly database includes observations for each
quarter that AAERs alleged firms manipulated earnings.1 I use this quarterly
database of 677 firms as the starting point for the construction of my fraud sample.
Table 4.1 details my sample selection process.
Table 4.1: Sample selectionFirms
Firms alleged in AAERs to have manipulated their earnings 677Missing a Cusip (139)Fraud begins before 1981 (20)Do not have a Compustat match with data during the fraud quarters (77)Do not have a CRSP Match (55)Do not have institutional ownership data in CDA/Spectrum (15)Do not have an identifiable fraud revelation date in Factiva (46)No institutional report date during the fraud period (3)Fraud Sample 322
1Dechow et al. (2007) include a detailed description of the data collection process and the AAER database theycreate. They also include numerous descriptive statistics on the firms in the databases including the number ofAAERs per firm, firm industries, and who the AAERs were against, just to mention a few.
22
23
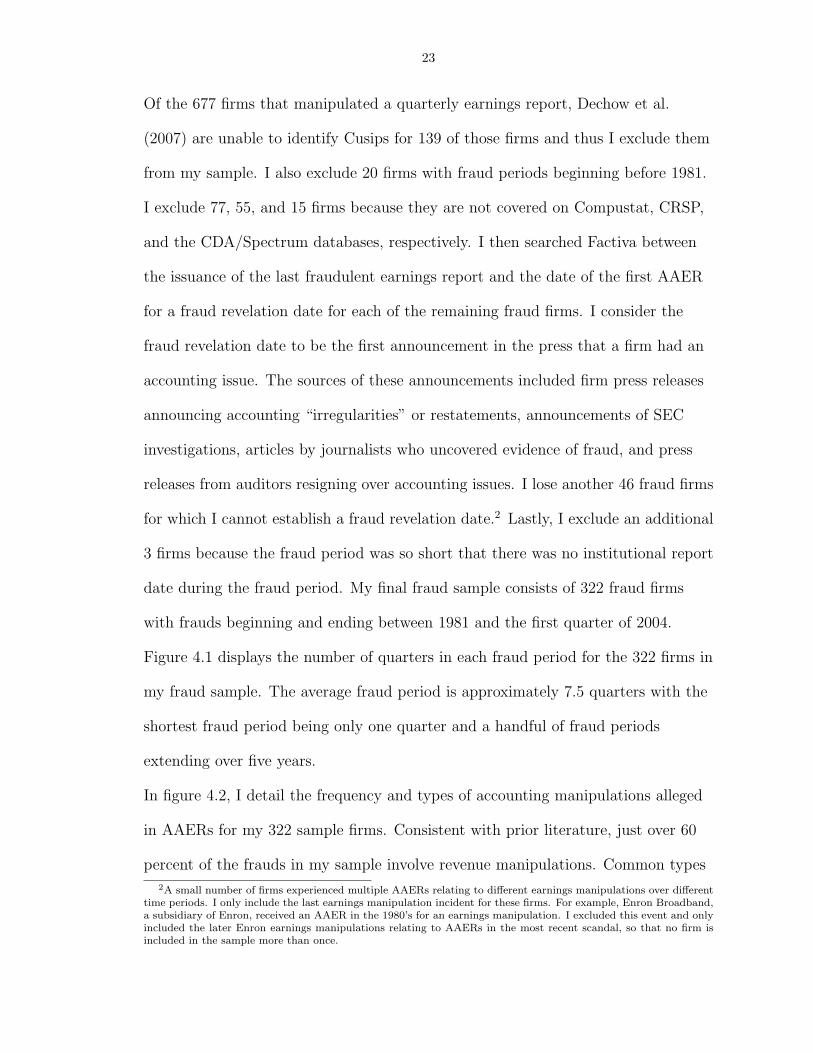
Of the 677 firms that manipulated a quarterly earnings report, Dechow et al.
(2007) are unable to identify Cusips for 139 of those firms and thus I exclude them
from my sample. I also exclude 20 firms with fraud periods beginning before 1981.
I exclude 77, 55, and 15 firms because they are not covered on Compustat, CRSP,
and the CDA/Spectrum databases, respectively. I then searched Factiva between
the issuance of the last fraudulent earnings report and the date of the first AAER
for a fraud revelation date for each of the remaining fraud firms. I consider the
fraud revelation date to be the first announcement in the press that a firm had an
accounting issue. The sources of these announcements included firm press releases
announcing accounting “irregularities” or restatements, announcements of SEC
investigations, articles by journalists who uncovered evidence of fraud, and press
releases from auditors resigning over accounting issues. I lose another 46 fraud firms
for which I cannot establish a fraud revelation date.2 Lastly, I exclude an additional
3 firms because the fraud period was so short that there was no institutional report
date during the fraud period. My final fraud sample consists of 322 fraud firms
with frauds beginning and ending between 1981 and the first quarter of 2004.
Figure 4.1 displays the number of quarters in each fraud period for the 322 firms in
my fraud sample. The average fraud period is approximately 7.5 quarters with the
shortest fraud period being only one quarter and a handful of fraud periods
extending over five years.
In figure 4.2, I detail the frequency and types of accounting manipulations alleged
in AAERs for my 322 sample firms. Consistent with prior literature, just over 60
percent of the frauds in my sample involve revenue manipulations. Common types
2A small number of firms experienced multiple AAERs relating to different earnings manipulations over differenttime periods. I only include the last earnings manipulation incident for these firms. For example, Enron Broadband,a subsidiary of Enron, received an AAER in the 1980’s for an earnings manipulation. I excluded this event and onlyincluded the later Enron earnings manipulations relating to AAERs in the most recent scandal, so that no firm isincluded in the sample more than once.
24
Figure 4.1: Number of quarters during the fraud period (n=322)
of revenue manipulations in the AAER sample include the creation of fictitious
sales, recognition of revenue with side letters granting return provisions, and
holding the quarter open to recognize revenue from the subsequent quarter. Other
common manipulations include the understatement of expenses or overstatement of
shareholder equity accounts (24%), the overstatement of accounts receivable (19%),
the overstatement of other asset accounts (15%), and the overstatement of
inventory accounts (14%).3 In additional analyses, I test whether institutional
investors are more or less likely to detect certain types of accounting
manipulations. I discuss those results in the empirical tests and results chapter.
3The percentages sum to over 100 percent as many firms manipulate multiple accounts.
25
Figure 4.2: Frequency of manipulation types mentioned in Accounting Auditing and EnforcementReleases (n=322)
0%
10%
20%
30%
40%
50%
60%
70%
REVE
NUEOES
E AR
ASSE
TS INV
COGS
OTHER
LIAB
RESE
RVE
ALLO
WDD
MKT_S
EC PAY
Firms may have multiple manipulations therefore the percentages sum to over 100 percent.REVENUE = Manipulated revenueOESE = Manipulation of other expense/shareholder equity accountAR = Manipulated accounts receivableASSETS = Manipulated assetsINV = Manipulated inventoryCOGS = Manipulated cost of goods soldOTHRLIAB = Manipulated liabilitiesRESERVE = Manipulated a reserve accountALLOWDD = Manipulated allowance for bad debtMKTSEC = Manipulated marketable securitiesPAYABLE = Manipulated payables
26
I construct my non-fraud sample by running the firms never receiving an AAER
through a similar sample selection criteria. I require that non-fraud firms have data
on Compustat, CRSP, and at some point during the sample period, institutional
ownership on the CDA/Spectrum S34 database. As in previous research, I find that
the distributions of my variables are characterized by a small number of extreme
outliers. Therefore, with the exception of returns, indicator variables, and
institutional ownership levels and changes, for my firm-level analysis I winsorize
variables at the 1st and 99th percentiles. I also winsorize institutional holdings
levels at 100% and changes at +/- 100%.4
I obtain institutional investor data from the CDA/Spectrum S34 database of 13f
filings. According to SEC rule 13f, managers of institutions with more than $100
million in equity must report on a quarterly basis all equity holdings that are
greater than $200,000 or 10,000 shares. I have two sets of dependent variables in
my tests. Institutional ownership levels defined as the sum of
end-of-calendar-quarter institutional holdings scaled by a firm’s total shares
outstanding (TOTALHELDt, QIXt, TRAt, and DEDt for total, quasi-indexer,
transient, and dedicated institutional investors, respectively) and quarterly changes
in institutional holdings as a percentage of a firm’s total shares outstanding
(∆TOTALHELDt, ∆QIXt, ∆TRAt, and ∆DEDt for total, quasi-indexer, transient,
and dedicated institutional investors, respectively).
The quality of the institutional data limits my analysis and the inferences I can
draw in two ways. First, quarterly measurements of institutional ownership
4These observations are clearly data errors, likely a result of rounding in shares outstanding. Where possibleI obtain shares outstanding from CRSP as CRSP only rounds to the thousands. Unfortunately, CDA/Spectrumrounds to the nearest million. Therefore, firms with institutional holdings close to 100% and shares outstandingunavailable on CRSP might appear to have holdings slightly above 100% although this is clearly impossible. Astotal holdings for these firms are likely near 100% it makes sense to winsorize these observations at 100% rather thaneliminate them.
27
weakens the power of my event study tests because changes in institutional
ownership, which are measured over an entire quarter, do not match the event date,
which is measured on a specific day. Second, 13f institutional data is measured at
the institution level rather than the fund level. For example, Fidelity, which
manages hundreds of funds, reports as one entity for 13f purposes. The result is
that methodologies that consider institution-level characteristics, such as splitting
institutions into investment styles, are measured with noise.
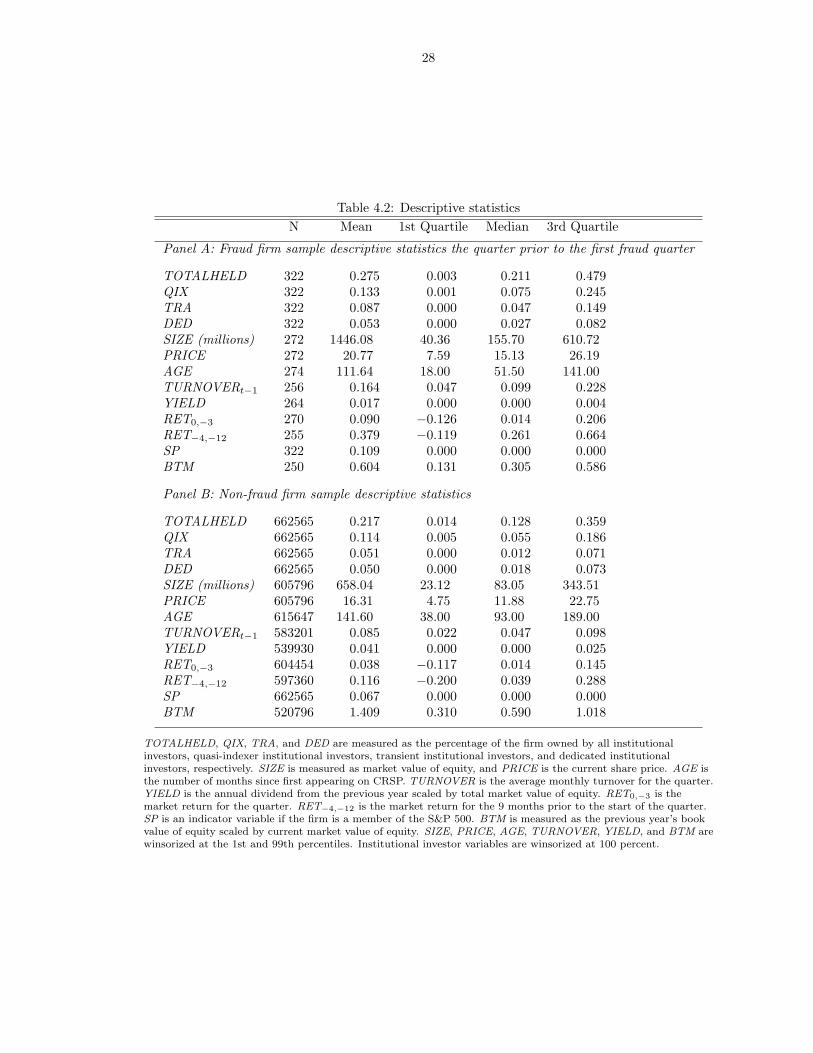
Table 4.2 Panel A presents descriptive statistics for the 322 fraud firms in the
quarter immediately prior to the first fraudulent earnings report. Panel B presents
descriptive statistics for 662,565 firm-quarter observations in the non-fraud control
sample. Total institutional ownership is higher for fraud firms (27.5 percent) than
non-fraud firms (21.7 percent). The table shows that fraud firms in my sample tend
to be larger. They also tend to be younger and to have extremely positive earnings
momentum and low book-to-market ratios, consistent with prior evidence that
managers may commit fraud to maintain high stock prices.
28
Table 4.2: Descriptive statisticsN Mean 1st Quartile Median 3rd Quartile
Panel A: Fraud firm sample descriptive statistics the quarter prior to the first fraud quarter
TOTALHELD, QIX, TRA, and DED are measured as the percentage of the firm owned by all institutionalinvestors, quasi-indexer institutional investors, transient institutional investors, and dedicated institutionalinvestors, respectively. SIZE is measured as market value of equity, and PRICE is the current share price. AGE isthe number of months since first appearing on CRSP. TURNOVER is the average monthly turnover for the quarter.YIELD is the annual dividend from the previous year scaled by total market value of equity. RET0,−3 is themarket return for the quarter. RET−4,−12 is the market return for the 9 months prior to the start of the quarter.SP is an indicator variable if the firm is a member of the S&P 500. BTM is measured as the previous year’s bookvalue of equity scaled by current market value of equity. SIZE, PRICE, AGE, TURNOVER, YIELD, and BTM arewinsorized at the 1st and 99th percentiles. Institutional investor variables are winsorized at 100 percent.
CHAPTER V
Empirical Tests and Results
In this chapter, I present my empirical tests and results. The first section conducts
my firm-level analysis. The second section reports my institution-level analysis.
The third section provides some additional tests.
5.1 Firm-level Analysis
In this section, I conduct tests on levels and changes in institutional holdings
aggregated at the firm level. All of my tests are conducted on total, quasi-indexer,
transient, and dedicated institutional ownership.
5.1.1 Pre-fraud institutional ownership levels
To test whether levels of institutional ownership in fraud firms differ from
non-fraud firms in the quarter prior to the fraud period, I first conduct univariate
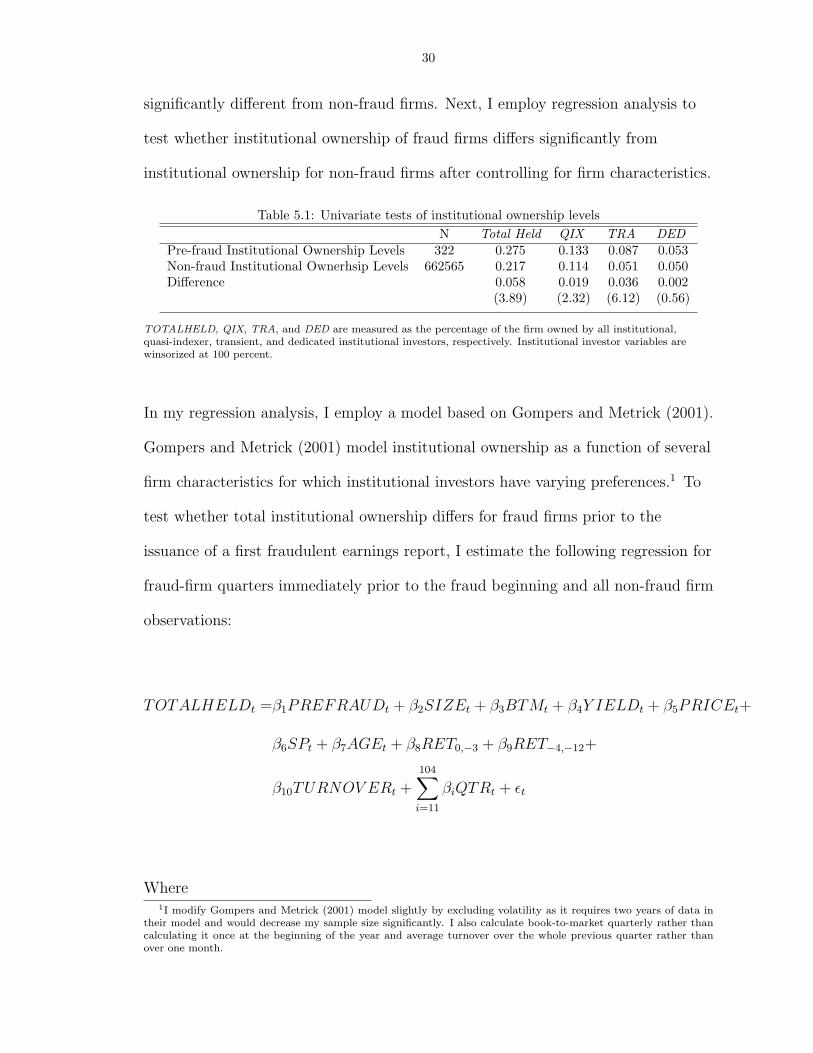
tests and then regression analysis. Univariate tests in Table 5.1 show that total
institutional ownership for fraud firms immediately prior to committing fraud is
0.058 higher than for non-fraud firms and significant at the one percent level.
Quasi-indexer ownership and transient institutional ownership for fraud firms are
also higher and significantly different from non-fraud firms at the one percent level.
Dedicated institutional ownership for fraud firms is slightly higher but not
29
30
significantly different from non-fraud firms. Next, I employ regression analysis to
test whether institutional ownership of fraud firms differs significantly from
institutional ownership for non-fraud firms after controlling for firm characteristics.
Table 5.1: Univariate tests of institutional ownership levelsN Total Held QIX TRA DED
TOTALHELD, QIX, TRA, and DED are measured as the percentage of the firm owned by all institutional,quasi-indexer, transient, and dedicated institutional investors, respectively. Institutional investor variables arewinsorized at 100 percent.
In my regression analysis, I employ a model based on Gompers and Metrick (2001).
Gompers and Metrick (2001) model institutional ownership as a function of several
firm characteristics for which institutional investors have varying preferences.1 To
test whether total institutional ownership differs for fraud firms prior to the
issuance of a first fraudulent earnings report, I estimate the following regression for
fraud-firm quarters immediately prior to the fraud beginning and all non-fraud firm
Where1I modify Gompers and Metrick (2001) model slightly by excluding volatility as it requires two years of data in
their model and would decrease my sample size significantly. I also calculate book-to-market quarterly rather thancalculating it once at the beginning of the year and average turnover over the whole previous quarter rather thanover one month.
31
TOTALHELD = shares held by all institutions scaled by total shares outstanding
PREFRAUD = indicator variable equal to one for a quarter immediately prior
to a fraud and zero otherwise
SIZE = market value of equity
BTM = book value divided by market value of equity
YIELD = cash dividends for the fiscal year divided by market value of equity
PRICE = price per share
SP = indicator variable equal to one if the firm is a member of the
S&P 500 and zero otherwise
AGE = number of months since first return appears in the CRSP file
RET0,−3 = past three-month return, the return earned in the current quarter
RET−4,−12 = nine-month return preceding the quarter
TURNOVER = average monthly share turnover from the previous quarter
QTR = indicator variables for quarterly fixed effects
To test for differences in quasi-indexer, transient, and dedicated institutional
ownership levels, I estimate the same model replacing the dependent variable
TOTALHELD with QIX, TRA, and DED respectively. For consistency with
Gompers and Metrick (2001) and to ease interpretation of the coefficients because
the dependent variable is measured as a percentage, I take natural logs of all
independent variables with the exception of returns and indicator variables. I also
include quarterly fixed effects to control for time-series trends in institutional
holdings. A significantly positive (negative) coefficient on PREFRAUD would
imply higher (lower) institutional holdings for a fraud firm prior to the fraud period
32
after controlling for fraud firms’ characteristics.2 Typically, firm-level
auto-correlation of the error terms is a concern in an estimation procedure where
firms appear multiple times. To adjust for this possibility, I estimate Rogers (1993)
standard errors clustered at the firm level. These standard errors are robust to
heteroskedasticity and within cluster correlation.
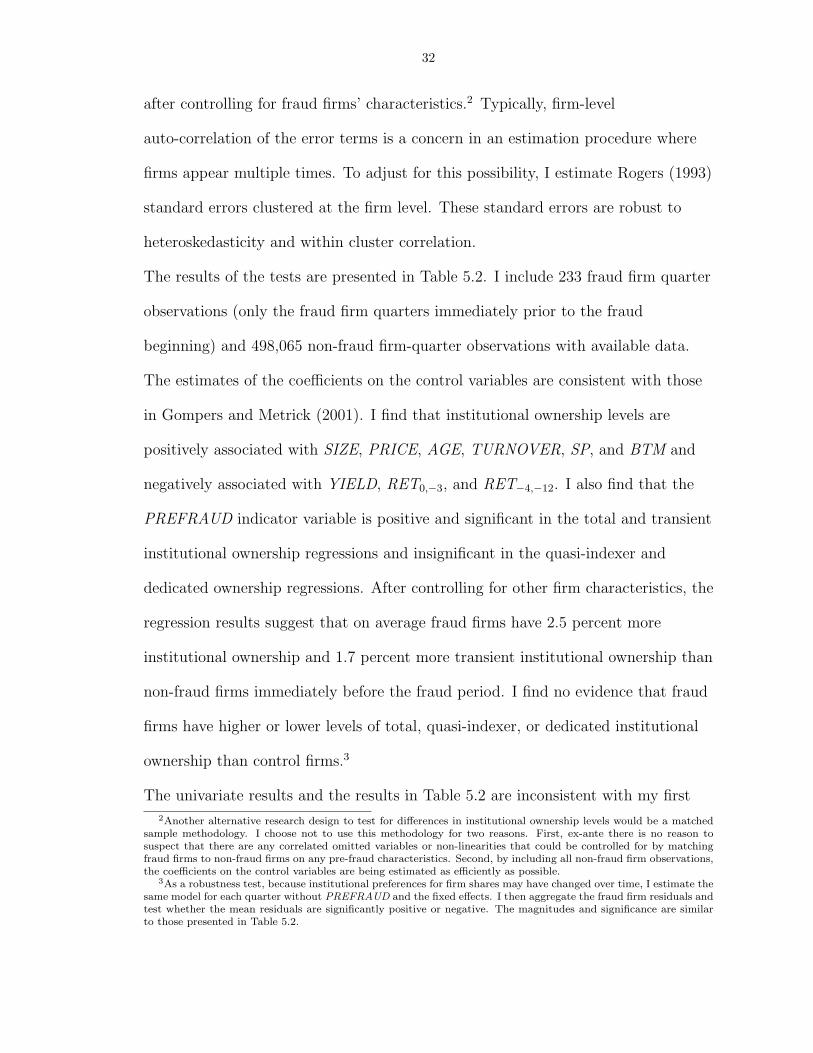
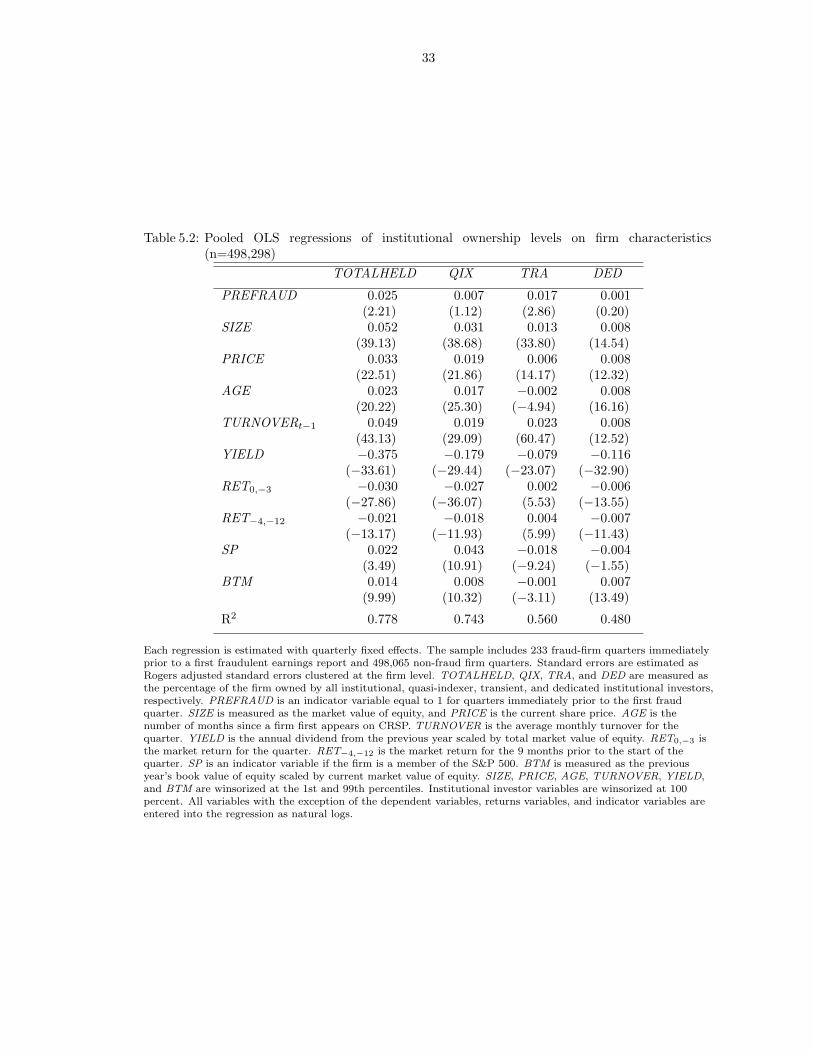
The results of the tests are presented in Table 5.2. I include 233 fraud firm quarter
observations (only the fraud firm quarters immediately prior to the fraud
beginning) and 498,065 non-fraud firm-quarter observations with available data.
The estimates of the coefficients on the control variables are consistent with those
in Gompers and Metrick (2001). I find that institutional ownership levels are
positively associated with SIZE, PRICE, AGE, TURNOVER, SP, and BTM and
negatively associated with YIELD, RET0,−3, and RET−4,−12. I also find that the
PREFRAUD indicator variable is positive and significant in the total and transient
institutional ownership regressions and insignificant in the quasi-indexer and
dedicated ownership regressions. After controlling for other firm characteristics, the
regression results suggest that on average fraud firms have 2.5 percent more
institutional ownership and 1.7 percent more transient institutional ownership than
non-fraud firms immediately before the fraud period. I find no evidence that fraud
firms have higher or lower levels of total, quasi-indexer, or dedicated institutional
ownership than control firms.3
The univariate results and the results in Table 5.2 are inconsistent with my first
2Another alternative research design to test for differences in institutional ownership levels would be a matchedsample methodology. I choose not to use this methodology for two reasons. First, ex-ante there is no reason tosuspect that there are any correlated omitted variables or non-linearities that could be controlled for by matchingfraud firms to non-fraud firms on any pre-fraud characteristics. Second, by including all non-fraud firm observations,the coefficients on the control variables are being estimated as efficiently as possible.
3As a robustness test, because institutional preferences for firm shares may have changed over time, I estimate thesame model for each quarter without PREFRAUD and the fixed effects. I then aggregate the fraud firm residuals andtest whether the mean residuals are significantly positive or negative. The magnitudes and significance are similarto those presented in Table 5.2.
33
Table 5.2: Pooled OLS regressions of institutional ownership levels on firm characteristics(n=498,298)
Each regression is estimated with quarterly fixed effects. The sample includes 233 fraud-firm quarters immediatelyprior to a first fraudulent earnings report and 498,065 non-fraud firm quarters. Standard errors are estimated asRogers adjusted standard errors clustered at the firm level. TOTALHELD, QIX, TRA, and DED are measured asthe percentage of the firm owned by all institutional, quasi-indexer, transient, and dedicated institutional investors,respectively. PREFRAUD is an indicator variable equal to 1 for quarters immediately prior to the first fraudquarter. SIZE is measured as the market value of equity, and PRICE is the current share price. AGE is thenumber of months since a firm first appears on CRSP. TURNOVER is the average monthly turnover for thequarter. YIELD is the annual dividend from the previous year scaled by total market value of equity. RET0,−3 isthe market return for the quarter. RET−4,−12 is the market return for the 9 months prior to the start of thequarter. SP is an indicator variable if the firm is a member of the S&P 500. BTM is measured as the previousyear’s book value of equity scaled by current market value of equity. SIZE, PRICE, AGE, TURNOVER, YIELD,and BTM are winsorized at the 1st and 99th percentiles. Institutional investor variables are winsorized at 100percent. All variables with the exception of the dependent variables, returns variables, and indicator variables areentered into the regression as natural logs.
34
prediction. I find no evidence that institutional ownership levels are lower than
would be expected given firm characteristics. This evidence suggests that the level
of institutional ownership does not act as a sufficient monitoring device in the
prevention of fraud. I do find some evidence consistent with my predictions
regarding institutional ownership levels for transient institutions. I find that
transient ownership levels are higher in fraud firms than expected given firm
characteristics. Although the magnitude is small and I cannot determine the
causality of this result (transient institutions have an increased demand for firms
with “aggressive” accounting practices or transient institutions place pressure on
firms to use “aggressive” accounting), it is interesting in light of evidence that
transient institutions overweight short-term expected earnings and underweight
expected long-term earnings (Bushee, 2001) and that firms with high transient
ownership make myopic decisions (Bushee, 1998).
5.1.2 Changes in institutional ownership over the fraud period
In my second set of tests, I investigate whether institutional investors increase or
decrease their positions in fraud firms over the course of the fraud period. I first
provide univariate tests of mean changes in institutional ownership levels and in the
number of institutional investors owning shares in fraud firms from the quarter
prior to the first fraudulent earnings report to the quarter immediately prior to the
revelation of the fraud.
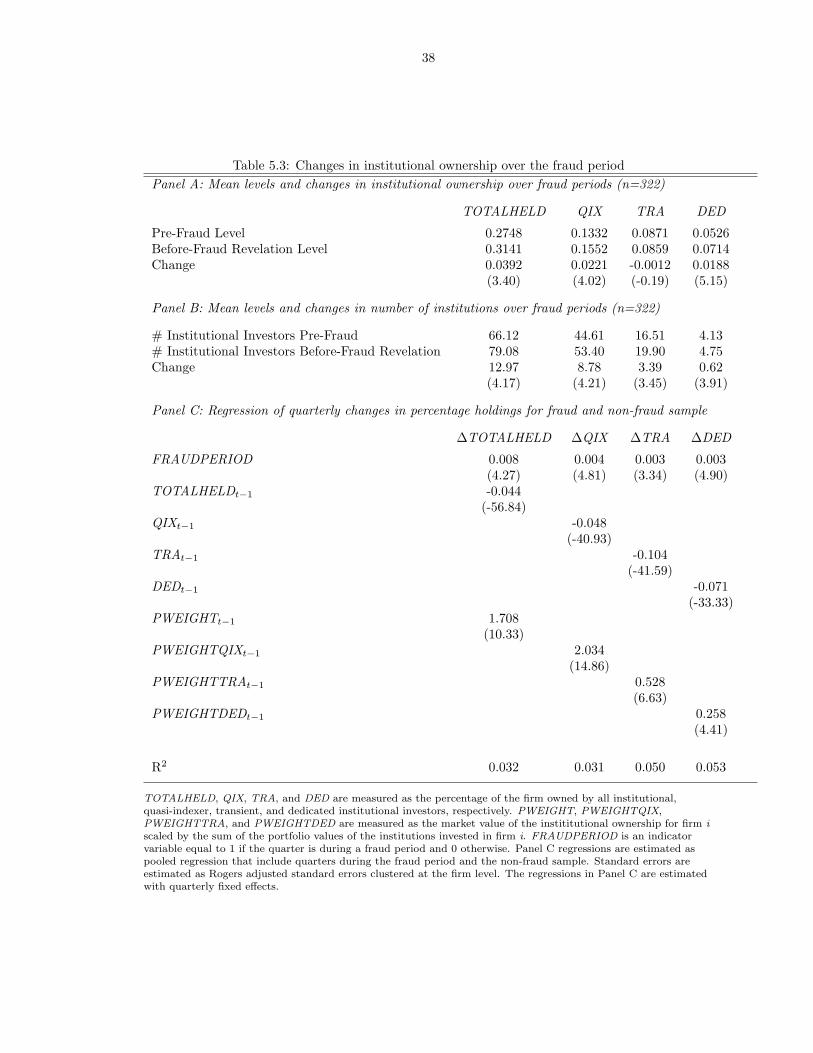
Table 5.3 Panel A presents the univariate results. I find that the level of total
institutional ownership significantly increases by 3.92 percent of shares outstanding
over the entire fraud period – a 14 percent increase in institutional ownership. The
total number of institutions owning shares also significantly increases from almost
66 institutions to 79 institutions, an 18 percent increase. Both quasi-indexer and
35
dedicated institutional ownership levels and the number of owners significantly
increase over the fraud period. Transient institutional ownership slightly but
insignificantly decreases, while the number of transient institutions owning shares
significantly increases.
It is possible that the changes in institutional ownership observed in Table 5.3
Panel A are simply the result of general trends in institutional ownership.
Therefore, I estimate regressions controlling for time-series trends in institutional
ownership and institutional ownership levels in Panel C. If ownership levels over
the entire fraud period were decreasing, it would be necessary to establish that the
decline was abnormal and a result of sophisticated trading and not poor
performance. But because institutional ownership levels are increasing over the
fraud period, I am only interested in testing whether the increase is not the result
of general time-series trends in institutional ownership levels. I am uninterested in
controlling for performance as fraud firms’ performance is a direct result of the
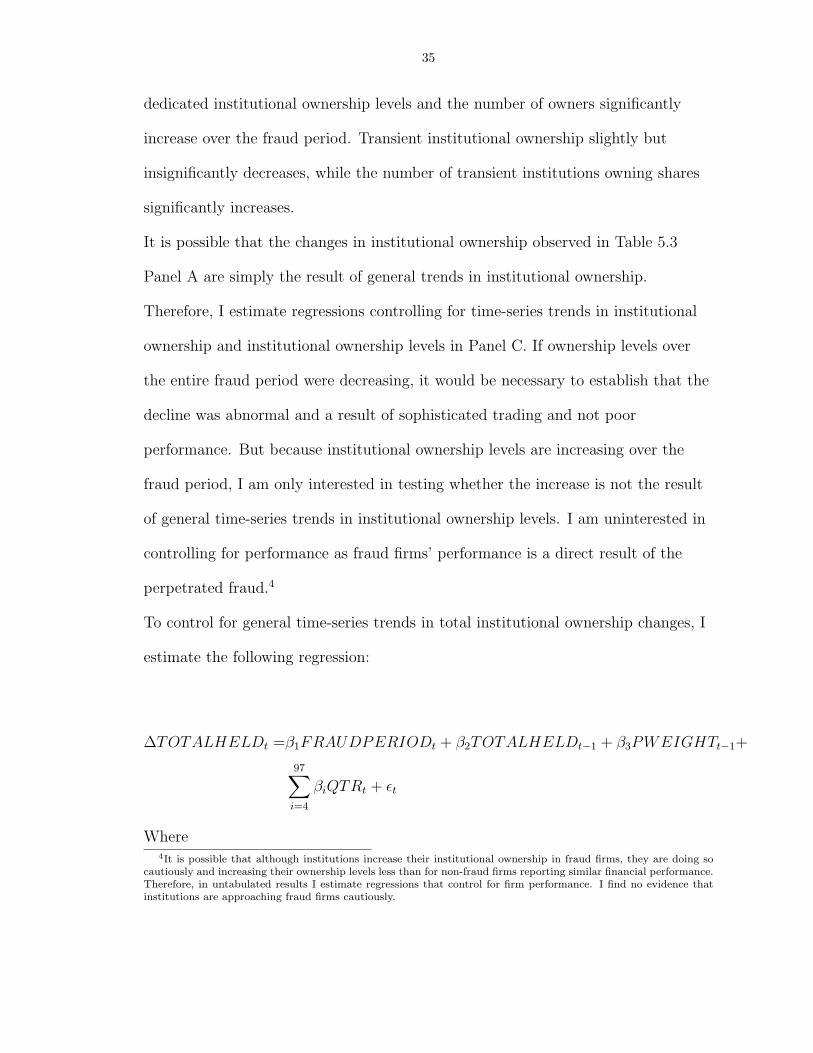
perpetrated fraud.4
To control for general time-series trends in total institutional ownership changes, I
Where4It is possible that although institutions increase their institutional ownership in fraud firms, they are doing so
cautiously and increasing their ownership levels less than for non-fraud firms reporting similar financial performance.Therefore, in untabulated results I estimate regressions that control for firm performance. I find no evidence thatinstitutions are approaching fraud firms cautiously.
36
∆TOTALHELD = quarterly change in shares held by all institutions scaled
by total shares outstanding
FRAUDPERIOD = indicator variable equal to one for a quarter during a fraud
and zero otherwise
TOTALHELD = shares held by all institutions scaled by total shares outstanding
PWEIGHT = market value of firm i held by a group of institutions in period
t scaled by the market value of all firms held by the same group
of institutions in the same period t
QTR = indicator variables for quarterly fixed effects
I estimate this regression for the entire non-fraud sample and for the quarters
during the fraud period for the fraud sample. In addition to to this first regression,
I estimate additional regressions for QIX, TRA, and DED, replacing
∆TOTALHELD, PWEIGHT, and TOTALHELD with each groups change in
ownership, portfolio weight, and ownership level. Portfolio weights and lagged
levels of institutional ownership are included to control for the influence of level
and concentration of holdings on future changes in institutional ownership.
Quarterly fixed effects control for general time-series trends in institutional
ownership changes. If positive changes in institutional ownership are not increasing
as a result of general time-series trends in institutional ownership, I expect to find a
positive coefficient on FRAUDPERIOD. If the coefficient on FRAUDPERIOD is
insignificant or negative, this would suggest that the increase in institutional
ownership over the fraud period is simply the result of an increasing trend in
institutional ownership. To adjust for firm-level auto-correlation of the error terms,
I estimate Rogers standard errors clustered at the firm level. Panel C presents the
37
regression results.
I find that all FRAUDPERIOD indicator variables are positive and significant,
suggesting that institutional ownership in fraud firms is significantly increasing over
the fraud period over and above the general trend in institutional ownership for all
three institutional ownership types. The coefficient on FRAUDPERIOD for the
total ownership regression equals 0.008. This means that for the average fraud
period, which is approximately 7.5 quarters in length, institutional ownership is
increasing by approximately 6.0 percent after controlling for institutional ownership
levels, portfolio weights, and quarterly fixed effects. The coefficients on the levels
are negative, consistent with mean reversion in institutional ownership. The
increase in institutional ownership is similar across all three groups of institutional
owners.
These results show that over the course of the fraud period institutional investors
increase their ownership in fraud firms. Because fraud firms experience significant
stock price declines once frauds are revealed, the 3.9 percentage point increase in
institutional ownership over the fraud period is not trivial. To access the
magnitude of the losses that institutional investors suffer, I present raw returns
over the fraud period and estimates of the dollar returns institutional investors
experience over the entire period firms commit fraud.
I calculate returns over two periods. The first period is from the first institutional
report date prior to the issuance of a first fraudulent quarterly report until the
institutional report date immediately prior to the quarter in which the fraud is
made public. The second period covers the quarter in which the fraud is revealed to
the public. I find that over the fraud quarters prior to the fraud revelation quarter,
fraud firms experience total positive mean returns of 21.6 percent over an average
38
Table 5.3: Changes in institutional ownership over the fraud periodPanel A: Mean levels and changes in institutional ownership over fraud periods (n=322)
TOTALHELD, QIX, TRA, and DED are measured as the percentage of the firm owned by all institutional,quasi-indexer, transient, and dedicated institutional investors, respectively. PWEIGHT, PWEIGHTQIX,PWEIGHTTRA, and PWEIGHTDED are measured as the market value of the instititutional ownership for firm iscaled by the sum of the portfolio values of the institutions invested in firm i. FRAUDPERIOD is an indicatorvariable equal to 1 if the quarter is during a fraud period and 0 otherwise. Panel C regressions are estimated aspooled regression that include quarters during the fraud period and the non-fraud sample. Standard errors areestimated as Rogers adjusted standard errors clustered at the firm level. The regressions in Panel C are estimatedwith quarterly fixed effects.
39
of 7.5 quarters. While in the fraud revelation quarter, fraud firms experience
significant negative mean returns of 32.5 percent.5 Next, I calculate the dollar
returns institutional investors are likely to have experienced. Because institutions
only report holdings on a quarterly basis, I must assume when institutional
investors buy and sell their shares. For simplicity, I assume that all of an
institutions buying and selling occurs on one date, the end of quarter report date. I
find that from the first institutional quarterly report prior to the fraud beginning
through the quarter that the accounting frauds are revealed institutional investors
lose a total of $137.8 billion from their investments in 322 fraud firms.6
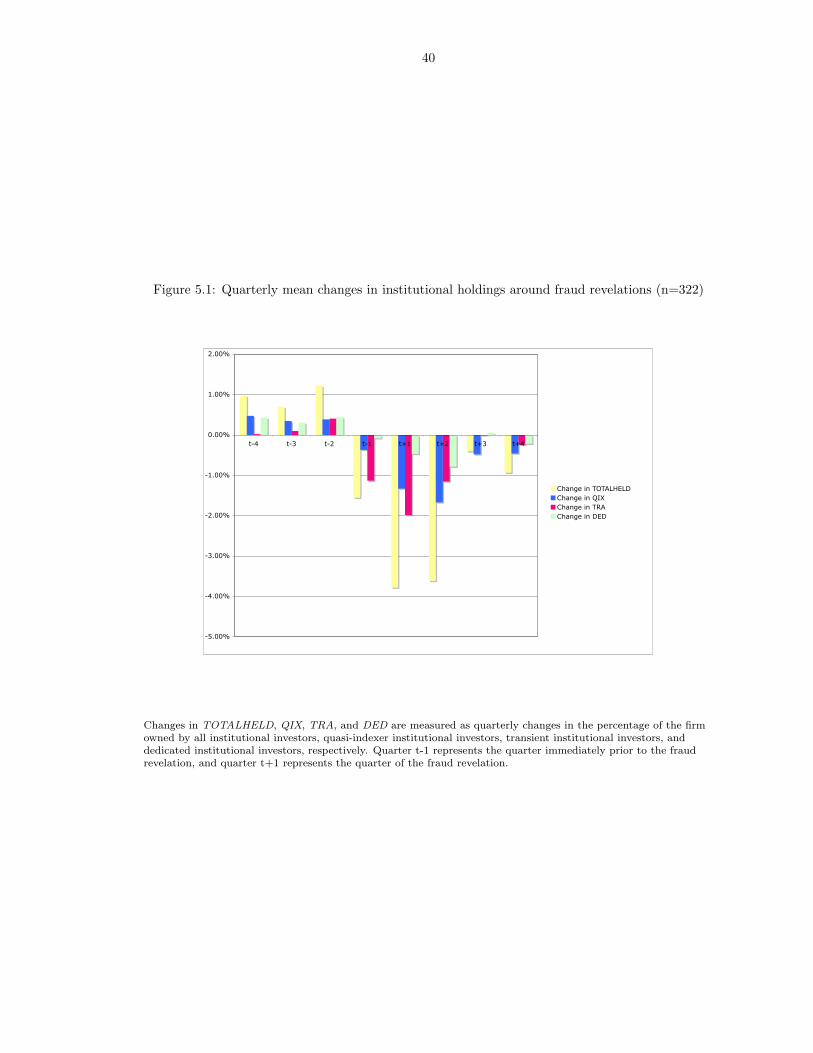
5.1.3 Changes in institutional ownership around fraud revelations
In my third set of tests, I examine quarterly changes in institutional ownership in
the two quarters immediately prior to and the quarter following the public
revelation of the fraud. I first present descriptive evidence of changes in
institutional ownership around fraud revelations in Figure 5.1. I find that
institutional ownership is increasing up to one quarter prior to the fraud revelation
at which point institutional ownership decreases by approximately one and one half
percent of shares outstanding. The decrease in t-1 is particularly strong for
transient institutional owners, representing almost 75 percent of the total decrease.
Following the fraud revelation, institutional ownership drops by approximately 4
percent of shares outstanding in each of the next two quarters.
Although the drop in institutional ownership prior to the fraud revelation is
significant, it is far from complete and may have nothing to do with the detection
5Returns are calculated from the CRSP monthly stock file. Returns are inclusive of delisting returns from theCRSP monthly event file. Missing quarterly returns are set equal to 0.
6I also conduct the same analysis making two different assumptions about the timing of institutions’ trades. Ifirst assume that firms make all of their trades on the first day of the quarter rather than the last. Second, I assumethat firms hold the average of the beginning of quarter and end of quarter holdings for each quarter. Using theseassumptions, the losses over the fraud period are $ 34.4 billion and $86.1 billion respectively.
40
Figure 5.1: Quarterly mean changes in institutional holdings around fraud revelations (n=322)
-5.00%
-4.00%
-3.00%
-2.00%
-1.00%
0.00%
1.00%
2.00%
t-4 t-3 t-2 t-1 t+1 t+2 t+3 t+4
Change in TOTALHELDChange in QIXChange in TRA Change in DED
Changes in TOTALHELD, QIX, TRA, and DED are measured as quarterly changes in the percentage of the firmowned by all institutional investors, quasi-indexer institutional investors, transient institutional investors, anddedicated institutional investors, respectively. Quarter t-1 represents the quarter immediately prior to the fraudrevelation, and quarter t+1 represents the quarter of the fraud revelation.
41
of fraud; it may simply be due to poor firm performance. Figure 5.2 presents
returns over the same period, and shows that in quarter t-1 institutional ownership
begins to drop consistent with the idea that the decrease in institutional ownership
might be due to poor performance. Therefore, I test whether institutional
ownership changes around fraud announcements are significant after controlling for
firm performance.
Figure 5.2: Quarterly mean raw returns around fraud revelations
-0.4
-0.35
-0.3
-0.25
-0.2
-0.15
-0.1
-0.05
0
0.05
0.1
t-4 t-3 t-2 t-1 t+1 t+2 t+3 t+4
Returns are calculated from the CRSP monthly stock file. Returns are inclusive of delisting returns from the CRSPmonthly event file. Quarter t-1 represents the quarter immediately prior to the fraud revelation, and quarter t+1represents the quarter of the fraud revelation. N=295 for period t-4, N=298 for period t-3, N=306 for period t-2,N=310 for period t-1, N=291 for period t+1, N=245 for period t+2, N=216 for period t+3, and N=208 for periodt+4.
Using the Gompers and Metrick (2001) model of institutional ownership levels and
other previous literature, I develop a model of changes in institutional ownership.
Beginning with the levels regression, I convert TURNOVER, and SP (SP+ and
42
SP−, indicator variables equal to one for additions and deletions from the S&P 500
index and zero otherwise) into changes. I retain RET0,−3 and RET−4,−12 because
prior literature has documented that institutional investors tend to be momentum
traders (Cai and Zheng, 2004). I also include market value of equity (SIZE) and
unexpected earnings, measured as earnings before extraordinary items less earnings
before extraordinary items in the previous same quarter scaled by average total
assets (UE), which prior research shows is positively associated with changes in
institutional holdings (Hribar, Jenkins, and Wang, 2006). Consistent with my
previous set of tests, I also include lagged levels of institutional ownership, lagged
portfolio weights, and quarterly fixed effects to control for time-series trends in
institutional ownership. I test changes in institutional ownership around the fraud
revelation by including three indicator variables, FRAUDt−2, FRAUDt−1, and
FRAUDt+1, where t-2 and t-1 indicate two quarters and one quarter before the
fraud revelation respectively and t+1 indicates the quarter immediately following
the fraud revelation. I estimate the following model for the fraud quarters
surrounding the fraud revelation and the non-fraud sample:
∆TOTALHELD =β1FRAUDt+1 + β2FRAUDt−1 + β3FRAUDt−2+
β4TOTALHELD + β5PWEIGHT + β6SIZE + β7RET0,−3+
β8RET−4,−12 + β9∆TURNOV ERt + β10SP+ + β11SP
−+
β12UE +106∑i=13
βiQTR + εt
If institutional investors are anticipating the fraud immediately prior to the
revelation, I expect negative coefficients on FRAUDt−2 or FRAUDt−1. Consistent
with my previous tests, I also estimate regressions for QIX, TRA, and DED by
43
replacing total change in ownership, total level of ownership, and total portfolio
weight with the respective change, level, and weight. To adjust for firm-level
auto-correlation of the error terms, I estimate Rogers standard errors clustered at
the firm level.
44
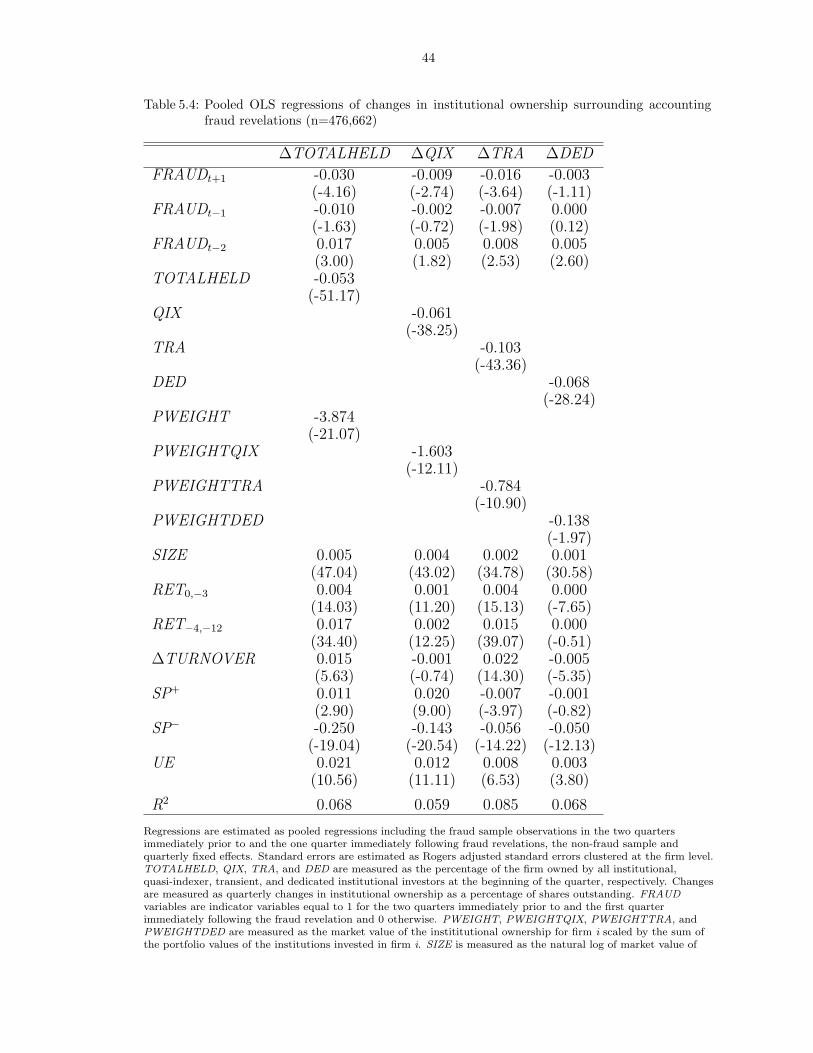
Table 5.4: Pooled OLS regressions of changes in institutional ownership surrounding accountingfraud revelations (n=476,662)
Regressions are estimated as pooled regressions including the fraud sample observations in the two quartersimmediately prior to and the one quarter immediately following fraud revelations, the non-fraud sample andquarterly fixed effects. Standard errors are estimated as Rogers adjusted standard errors clustered at the firm level.TOTALHELD, QIX, TRA, and DED are measured as the percentage of the firm owned by all institutional,quasi-indexer, transient, and dedicated institutional investors at the beginning of the quarter, respectively. Changesare measured as quarterly changes in institutional ownership as a percentage of shares outstanding. FRAUDvariables are indicator variables equal to 1 for the two quarters immediately prior to and the first quarterimmediately following the fraud revelation and 0 otherwise. PWEIGHT, PWEIGHTQIX, PWEIGHTTRA, andPWEIGHTDED are measured as the market value of the instititutional ownership for firm i scaled by the sum ofthe portfolio values of the institutions invested in firm i. SIZE is measured as the natural log of market value of
45
equity. RET0,−3 is the market return for the quarter. RET−4,−12 is the market return for the 9 months prior tothe start of the quarter. ∆TURNOVER is measured as the change in average monthly turnover from the currentquarter to the previous quarter. SP+ and SP- are indicator variables for additions and deletions from the S&P500index respectively. UE is measured as earnings before extraordinary items in period t minus earnings beforeextraordinary items in period t-4 scaled by average total assets. SIZE, PWEIGHT, PWEIGHTQIX,PWEIGHTTRA, PWEIGHTDED, and UE are winsorized at the 1st and 99th percentiles. Institutional investorvariables are winsorized at +/- 100%.
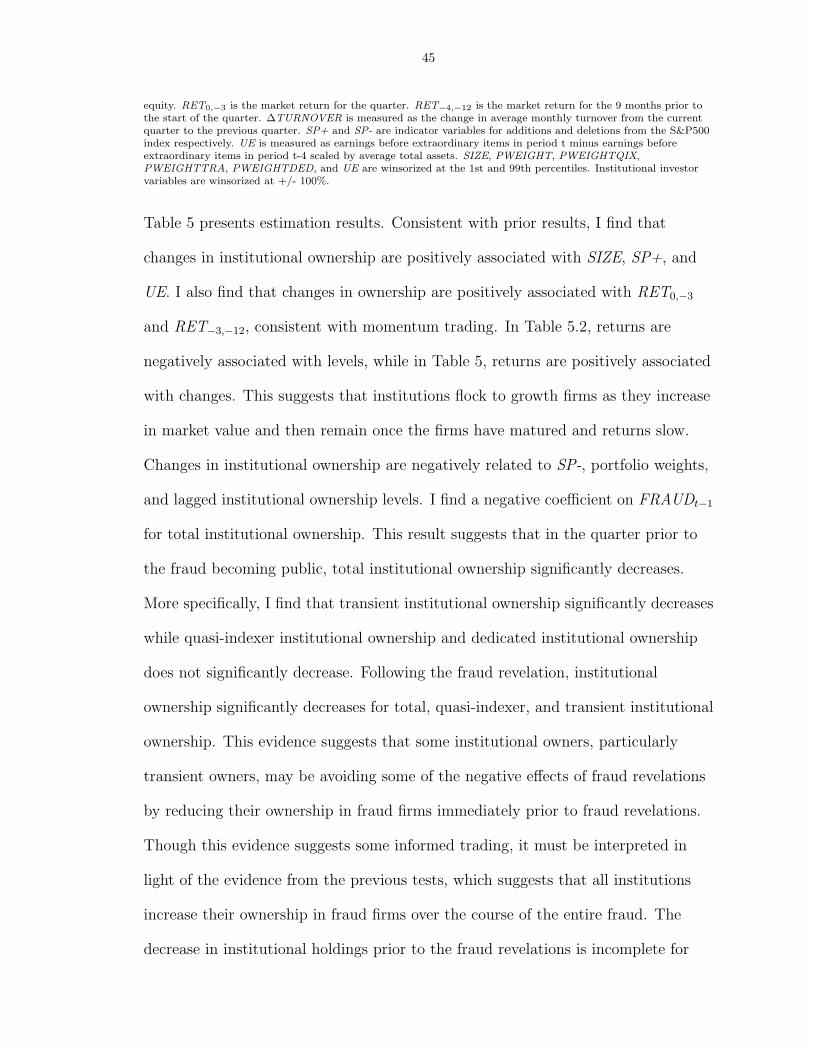
Table 5 presents estimation results. Consistent with prior results, I find that
changes in institutional ownership are positively associated with SIZE, SP+, and
UE. I also find that changes in ownership are positively associated with RET0,−3
and RET−3,−12, consistent with momentum trading. In Table 5.2, returns are
negatively associated with levels, while in Table 5, returns are positively associated
with changes. This suggests that institutions flock to growth firms as they increase
in market value and then remain once the firms have matured and returns slow.
Changes in institutional ownership are negatively related to SP-, portfolio weights,
and lagged institutional ownership levels. I find a negative coefficient on FRAUDt−1
for total institutional ownership. This result suggests that in the quarter prior to
the fraud becoming public, total institutional ownership significantly decreases.
More specifically, I find that transient institutional ownership significantly decreases
while quasi-indexer institutional ownership and dedicated institutional ownership
does not significantly decrease. Following the fraud revelation, institutional
ownership significantly decreases for total, quasi-indexer, and transient institutional
ownership. This evidence suggests that some institutional owners, particularly
transient owners, may be avoiding some of the negative effects of fraud revelations
by reducing their ownership in fraud firms immediately prior to fraud revelations.
Though this evidence suggests some informed trading, it must be interpreted in
light of the evidence from the previous tests, which suggests that all institutions
increase their ownership in fraud firms over the course of the entire fraud. The
decrease in institutional holdings prior to the fraud revelations is incomplete for
46
total institutional ownership representing only a 4.7 percent decrease in total
institutional holdings. The decrease in transient institutional ownership in the
quarter immediately prior to the fraud revelations represents only a 15.1 percent
decrease in their institutional holdings. Thus, although institutions mitigate losses
by divesting fraud firms prior to fraud revelations, overall they still lose a
considerable amount of their investments.
5.2 Institution-level Analysis
Institutions exhibit significant heterogeneity beyond the three investment styles I
employ in my first analysis; therefore, I conduct a second analysis at the institution
level. In this analysis, I test whether institution-level proxies for incentives to avoid
accounting fraud and for private information are negatively associated with changes
in institutions’ ownership of fraud firms. In this section, private information refers
to both an institution’s ability to gather private information and an institution’s
ability to process both private and public information. I employee two sets of
variables in my tests. The first set is measured at the institution level and the
second set is measured at the institution-firm level.
My first variables are measured at the institution level and include an institution’s
investment strategy, fiduciary type, and size. To measure investment strategy, I
create indicator variables for the three trading strategies that I employee in my
firm-level analysis: INDEXERS, TRANSIENT, and DEDICATED. Next, I classify
institutions into four categories based on fiduciary type: bank trusts (BANK),
insurance companies (INSURANCE), investment advisors (IA), and pensions and
endowments (PENSION). Bank trusts and pensions face strict prudent investment
standards under the Employee Retirement Income Securities Act and common law.
47
These investment standards may lead these institutions to tilt their portfolios
toward characteristics that are more likely to justify the prudence of their
investments. For example, Guercio (1996) finds that banks tilt their portfolios
toward firms with high S&P stock ratings. Following Bushee and Goodman (2007),
my last institution-level measure is ISIZE, which is an indicator variable equal to
one if the market value of an institution’s equity portfolio is in the top quintile for
all institutions in a particular quarter and zero otherwise. Because larger
institutions have more resources, I expect that ISIZE is a proxy for an institution’s
ability to acquire and process information. Therefore, I expect that large
institutions will be more likely to divest shares in firms committing fraud.
At the institution-firm level, I employ two additional measures that proxy for an
institution’s private information and incentives to avoid accounting fraud. The
first, BET, is a variable that measures the relative size of the stake an institution
has at risk in a particular firm. BET is measured as the market-value of equity
owned by institution j in firm i in quarter t scaled by the total market value of
institution j’s portfolio in quarter t. I expect BET to be negatively associated with
institutional changes in ownership in fraud firms. Institutions with higher levels of
BET have relatively more value at risk than firms with lower levels of BET;
therefore, these institutions have greater incentives to gather private information
and avoid investments in firms committing fraud. My last institution-firm level
variable is BLOCK, which is an indicator variable equal to one if the percent of
total shares outstanding held by an institution in a firm is in the top quintile of
institutional ownership for that firm and zero otherwise. I expect that BLOCK is
associated with private information advantages because these institutions are more
likely to have access to private information and are more willing to incur the costs
48
of private information acquisition and processing. Therefore, I expect that BLOCK
will be negatively associated with changes in institutional holdings of fraud firms.
Bushee and Goodman (2007) were the first to employ these two measures and point
out that while BET and BLOCK are probably positively correlated, BET is likely a
better measure of incentives to gather private information about a firm. BLOCK,
on the other hand, is a better measure of an institution’s access to management. I
also include the pre-fraud level of institutional ownership, HELDt−1, as a control
variable.
For my institution-level analysis, my sample consists of those institutions holding
fraud firms immediately prior to a fraud firm’s first issuance of a fraudulent
earnings report. Because institutions that purchase fraud firms during the fraud
period and hold shares until the fraud is revealed do not appear to anticipate fraud,
I focus on those institutions that hold fraud firms prior to frauds beginning. To test
the relation between changes in institutional ownership and my proxies for private
information and incentives, I first examine correlations between changes in
institutional ownership and my explanatory variables. I then conduct regression
analysis using my fraud sample and a matched sample. Consistent with my tests in
the firm-level analysis, I measure changes in institutional ownership, ∆HELD, as
changes in percentage ownership of the firm from the period immediately prior to
the first fraudulent earnings report until the period immediately prior to the fraud
revelation. All incentive and information environment proxies are measured in the
quarter immediately prior to the fraud beginning.
The samples for my institution-level tests include a fraud sample of 21,290
institution-fraud firm observations and a matched sample of 21,290
institution-non-fraud firm observations. For the regression analysis, I construct my
49
matched sample by matching each institution-firm observation in my fraud sample
with a different institution-non-fraud firm observation. Matches between
institution-fraud firm observations and non-institution-fraud firm observations are
made in the quarter immediately prior to the first fraudulently-issued earnings
report. Institution-firm observations are first matched to all other
institution-non-fraud observations with the same trading strategy in the same
quarter. I then require that all institution-non-fraud matches be within 30 percent
of the market value of an institution’s portfolio and 30 percent of HELDt−1.7
Lastly, I match the institution-fraud firm observation with the institution
non-fraud observation with the closest value of BETt−1. The dependent variable in
my analysis, ∆HELDt, for the matched institution-non-fraud firm observations is
then measured over the same time-period as the dependent variable for the
matched institution-fraud-firm observations.
Table 5.5 presents descriptive statistics for both the fraud sample and the matched
sample. All of the variables for the institution-fraud firm observations and the
institution-non-fraud firm observations are similar in magnitude and variance. The
pre-fraud level of institutional ownership is 0.38 percent and the average firm has
0.57 percent of their portfolio at risk in a fraud firm. The average ∆HELD is -0.15
percent, which is a decrease of 39.5 percent from the pre-fraud level of institutional
ownership. It is important to note once again that these tests are all conditional on
pre-fraud ownership of fraud firm shares. The evidence in 5.5 suggests that on
average institutions owning fraud firm shares prior to the fraud decrease their
ownership over the fraud period. This result in conjunction with the firm-level
results suggests that the increase in institutional ownership over the fraud period is
7An insignificant number of institution-firm observations did not match using the 30 percent criteria. For theobservations that did not match, I expanded the percentage by 10 percent until all 21,290 observations matched.
50
a result of increased ownership by institutions not owning fraud firm shares prior to
The fraud sample is composed of all institution-firm observations holding fraud firm shares in the quarterimmediately prior to the first fraudulently issued earnings report. The matched sample is composed of non-fraudinstitution-firm observations matched to institution-fraud firm observations. ∆HELDt is the change in shares heldby the institution scaled by total shares outstanding in the firm. INDEXERS, TRANSIENT, and DEDICATEDare indicator variables equal to one if an institution belongs to that particular investment strategy and zerootherwise. HELD is the total shares held by an institution scaled by total shares outstanding. BET is the marketvalue of equity that institution i owns in firm j scaled by the total portfolio value of institution i. BLOCK is anindicator variable equal to one if an institution is in the top quintile of institutional ownership for a particular firm.ISIZE is an indicator variable equal to 1 if an institution is in the top quintile of portfolio size for period t and zerootherwise. BANK, INSURANCE, IA, and PENSION are indicator variables equal to one if an institution belongsto a particular fiduciary group and zero otherwise. Continuous variables are winsorized at the 1st and 99thpercentiles.
In table 5.6, I present the first evidence on associations between my proxies for
private information and incentives and changes in ownership. Consistent with my
predictions, I find negative and significant correlations between ∆HELDt and
TRANSIENT, DEDICATED, BETt−1, BLOCKt−1 and ISIZEt−1. I also find a
negative and significant relation between ∆HELDt and IA, suggesting that
investment advisors decrease their ownership in fraud firms before fraud revelations,
while banks and pensions and endowments increase their ownership in fraud firms.
51
Tab
le5.
6:In
stit
utio
n-le
vel
frau
dco
rrel
atio
nm
atri
x(p
ears
on/s
pear
man
)
∆H
ELD
tIN
DEX
ERS
TRA
NSIE
NT
DED
ICATED
HELD
t−
1BET
t−
1BLO
CK
t−
1IS
IZE
t−
1BA
NK
INSU
RA
NCE
IAPEN
SIO
N∆
HELD
t0.1
20
-0.1
12
-0.0
31
-0.6
25
-0.0
34
-0.3
29
-0.0
55
0.0
55
0.0
04
-0.0
76
0.0
21
(0.0
00)
(0.0
00)
(0.0
00)
(0.0
00)
(0.0
00)
(0.0
00)
(0.0
00)
(0.0
00)
(0.5
91)
(0.0
00)
(0.0
02)
IND
EX
ERS
0.1
37
-0.8
26
-0.3
78
-0.1
55
0.0
44
-0.0
87
0.0
53
0.2
36
-0.0
11
-0.1
45
-0.0
64
(0.0
00)
(0.0
00)
(0.0
00)
(0.0
00)
(0.0
00)
(0.0
00)
(0.0
00)
(0.0
00)
(0.0
99)
(0.0
00)
(0.0
00)
TRA
NSIE
NT
-0.1
28
-0.8
26
-0.1
54
0.0
61
-0.0
23
0.0
43
-0.1
27
-0.2
91
-0.0
21
0.1
35
0.1
35
(0.0
00)
(0.0
00)
(0.0
00)
(0.0
00)
(0.0
01)
(0.0
00)
(0.0
00)
(0.0
00)
(0.0
02)
(0.0
00)
(0.0
00)
DED
ICATED
-0.0
21
-0.3
78
-0.1
54
0.1
94
-0.0
68
0.0
99
0.1
43
0.0
72
0.0
64
0.0
21
-0.1
10
(0.0
02)
(0.0
00)
(0.0
00)
(0.0
00)
(0.0
00)
(0.0
00)
(0.0
00)
(0.0
00)
(0.0
00)
(0.0
02)
(0.0
00)
HELD
t−
1-0
.468
-0.1
38
0.0
83
0.1
34
0.0
13
0.5
27
0.2
69
-0.0
71
-0.0
08
0.1
17
-0.0
43
(0.0
00)
(0.0
00)
(0.0
00)
(0.0
00)
(0.0
63)
(0.0
00)
(0.0
00)
(0.0
00)
(0.2
52)
(0.0
00)
(0.0
00)
BET
t−
1-0
.058
0.0
11
0.0
26
-0.0
95
-0.0
14
0.1
71
-0.1
94
-0.0
96
-0.0
42
0.0
23
0.0
80
(0.0
00)
(0.1
21)
(0.0
00)
(0.0
00)
(0.0
46)
(0.0
00)
(0.0
00)
(0.0
00)
(0.0
00)
(0.0
01)
(0.0
00)
BLO
CK
t−
1-0
.234
-0.0
81
0.0
40
0.0
95
0.5
53
0.2
39
0.2
72
-0.0
48
0.0
00
0.0
77
-0.0
30
(0.0
00)
(0.0
00)
(0.0
00)
(0.0
00)
(0.0
00)
(0.0
00)
(0.0
00)
(0.0
00)
(0.9
81)
(0.0
00)
(0.0
00)
ISIZ
Et−
1-0
.057
0.0
51
-0.1
29
0.1
51
0.3
86
-0.3
48
0.2
71
0.1
28
0.0
21
-0.0
34
-0.0
88
(0.0
00)
(0.0
00)
(0.0
00)
(0.0
00)
(0.0
00)
(0.0
00)
(0.0
00)
(0.0
00)
(0.0
02)
(0.0
00)
(0.0
00)
BA
NK
0.0
27
0.2
40
-0.2
99
0.0
84
-0.0
05
-0.1
73
-0.0
44
0.1
71
-0.1
25
-0.3
62
-0.4
71
(0.0
00)
(0.0
00)
(0.0
00)
(0.0
00)
(0.4
45)
(0.0
00)
(0.0
00)
(0.0
00)
(0.0
00)
(0.0
00)
(0.0
00)
INSU
RA
NCE
-0.0
17
-0.0
24
-0.0
29
0.1
01
0.0
63
-0.0
26
0.0
39
0.0
34
-0.1
35
-0.1
47
-0.1
91
(0.0
11)
(0.0
00)
(0.0
00)
(0.0
00)
(0.0
00)
(0.0
00)
(0.0
00)
(0.0
00)
(0.0
00)
(0.0
00)
(0.0
00)
IA-0
.101
-0.1
60
0.1
54
0.0
13
0.0
85
0.0
52
0.0
50
-0.0
70
-0.3
62
-0.1
49
-0.5
52
(0.0
00)
(0.0
00)
(0.0
00)
(0.0
61)
(0.0
00)
(0.0
00)
(0.0
00)
(0.0
00)
(0.0
00)
(0.0
00)
(0.0
00)
PEN
SIO
N0.0
77
-0.0
53
0.1
34
-0.1
31
-0.1
02
0.1
16
-0.0
25
-0.1
01
-0.4
82
-0.1
98
-0.5
32
(0.0
00)
(0.0
00)
(0.0
00)
(0.0
00)
(0.0
00)
(0.0
00)
(0.0
00)
(0.0
00)
(0.0
00)
(0.0
00)
(0.0
00)
The
fraud
sam
ple
iscom
pose
dof
all
inst
ituti
on-fi
rmobse
rvati
ons
hold
ing
fraud
firm
share
sin
the
quart
er
imm
edia
tely
pri
or
toth
efirs
tfr
audule
ntl
yis
sued
earn
ings
rep
ort
.T
he
matc
hed
sam
ple
iscom
pose
dof
non-f
raud
inst
ituti
on-fi
rmobse
rvati
ons
matc
hed
toin
stit
uti
on-f
raud
firm
obse
rvati
ons.
∆H
ELD
tis
the
change
insh
are
sheld
by
the
inst
ituti
on
scale
dby
tota
lsh
are
souts
tandin
gin
the
firm
.IN
DEX
ERS
,TRA
NSIE
NT
,and
DED
ICATED
are
indic
ato
rvari
able
sequal
toone
ifan
inst
ituti
on
belo
ngs
toth
at
part
icula
rin
vest
ment
stra
tegy
and
zero
oth
erw
ise.H
ELD
isth
eto
tal
share
sheld
by
an
inst
ituti
on
scale
dby
tota
lsh
are
souts
tandin
g.BET
isth
em
ark
et
valu
eof
equit
yth
at
inst
ituti
on
iow
ns
infirm
jsc
ale
dby
the
tota
lp
ort
folio
valu
eof
inst
ituti
on
i.BLO
CK
isan
indic
ato
rvari
able
equal
toone
ifan
inst
ituti
on
isin
the
top
quin
tile
of
inst
ituti
onal
ow
ners
hip
for
apart
icula
rfirm
.IS
IZE
isan
indic
ato
rvari
able
equal
to1
ifan
inst
ituti
on
isin
the
top
quin
tile
of
port
folio
size
for
peri
od
tand
zero
oth
erw
ise.BA
NK
,IN
SU
RA
NCE
,IA
,and
PEN
SIO
Nare
indic
ato
rvari
able
sequal
toone
ifan
inst
ituti
on
belo
ngs
toa
part
icula
rfiducia
rygro
up
and
zero
oth
erw
ise.
Conti
nuous
vari
able
sare
win
sori
zed
at
the
1st
and
99th
perc
enti
les
for
the
fraud
sam
ple
and
matc
hed
sam
ple
.
52
Although I find negative and significant relationships between changes in
institutional ownership in fraud firms and my proxies for private information and
incentives, the correlations must be interpreted cautiously as they may be the
result of mean reversion. For example, by definition transient institutional investors
buy and sell shares over short periods of time; therefore, it should not be surprising
to find a negative relationship between ∆HELD and TRANSIENT for any random
sample of firms. Therefore, I estimate the following regression of ∆HELD on my
proxies for institutional private information and incentives for both my
institution-fraud observations and my matched observations:
INDEXERS and BANK are the excluded groups from the regression. FRAUD is an
indicator variable equal to one if an observation is an institution-fraud firm
observation and zero otherwise. Although I match based on HELDt−1 and BETt−1,
I include these variables in the regression to control for residual variation. If my
proxies explain changes in institutional ownership in fraud firms beyond mean
reversion, I expect to find significantly negative coefficients for my interaction
variables.
53
Although significantly negative coefficients on my interaction variables can provide
strong evidence that specific types of institutions are more likely to make informed
trades in fraud firms, a lack of significance is difficult to interpret. For example, if
BETt−1 is significantly negative and FRAUD*BETt−1 is not significantly negative,
the explanation might simply be that on average large bets taken by institutions
are a result of informed trading and are thus likely to reverse in the near future
after the private information is made public and returns are realized. In fact, this is
consistent with Baks, Busse, and Green (2006), which shows that mutual funds
with more concentrated portfolios are more likely to out perform mutual funds with
more diversified portfolios. To adjust for auto-correlation of the error terms at the
firm-level, I estimate Rogers standard errors clustered at the firm level.
Table 5.7 presents the regression results. The variables of interest, the interactions
between FRAUD and my proxies for incentives and information environments, are
largely insignificant. The two exceptions are the coefficient on
FRAUD*TRANSIENT, which is negative and significant in the direction I
predicted, and the coefficient on FRAUD*ISIZEt−1, which is positive and
significant in the opposite direction. Because many of the variables in the
regression are highly collinear, in other regressions (untabulated) I remove
HELDt−1, BETt−1, BLOCKt−1, ISIZEt−1, and their interaction terms and estimate
new coefficients including each variable and its interaction one at a time. Although
the coefficients on HELDt−1, BLOCKt−1, and ISIZEt−1 are all significant and
negative, none of the coefficients on the interaction terms are significantly negative.
Neither the coefficient on BETt−1 or its interaction was significant. The results of
the regression make it difficult to draw any strong conclusions.
The results of the institution-level analysis suggest that conditional on owning
54
Table 5.7: Institution-level OLS regression of change in percentage ownership for fraud and matchedsamples (n=42,580)
∆HELDt
INTERCEPT -0.0045(-0.75)
TRANSIENT -0.0544(-6.29)
DEDICATED 0.1022(4.47)
HELDt−1 -45.7945(-29.84)
BETt−1 -0.0194(-0.06)
BLOCKt−1 -0.0094(-0.73)
ISIZEt−1 0.1381(9.59)
INSURANCE 0.0099(0.57)
IA 0.0032(0.34)
PENSION 0.0248(3.25)
FRAUD -0.0196(-2.13)
FRAUD*TRANSIENT -0.0264(-1.79)
FRAUD*DEDICATED 0.1027(2.91)
FRAUD*HELDt−1 -1.4830(-0.56)
FRAUD*BETt−1 0.0377(0.06)
FRAUD*BLOCKt−1 -0.0235(-1.13)
FRAUD*ISIZEt−1 0.0605(2.53)
FRAUD*INSURANCE -0.0057(-0.24)
FRAUD*IA 0.0421(2.94)
FRAUD*PENSION 0.0222(1.90)
Coefficient estimates are multiplied by 100 to aid presentation. Standard errors are estimated as Rogers adjusted standarderrors clustered at the firm level. The omitted group from the regression is the BANK and INDEXERS group. ∆HELD ismeasured as the change in shares held by an institution scaled by total firm shares outstanding. INDEXERS,TRANSIENT, and DEDICATED are indicator variables equal to one if an institution belongs to that particularinvestment strategy and zero otherwise. HELD is the total shares held by an institution scaled by total shares outstanding.BET is the market value of equity that institution i owns in firm j scaled by the total portfolio value of institution i.BLOCK is an indicator variable equal to one if an institution is in the top quintile of ownership for a particular firm andzero otherwise. ISIZE is an indicator variable equal to 1 if an institution is in the top quintile of portfolio size for period tand zero otherwise. BANK, INSURANCE, IA, and PENSION are indicator variables equal to one if an institutionbelongs to a particular fiduciary group and zero otherwise. Period t-1 represents the quarter immediately prior to theissuance of the first fraudulent quarterly report. Period t is the entire period over which a firm commits fraud. FRAUD isan indicator variable equal to 1 if an institution-firm observation is a fraud-firm observation and zero if the institution-firmobservation is a matched observation. Continuous variables are winsorized at the 1st and 99th percentiles.
55
fraud firm shares prior to the beginning of a fraud, certain types of institutions are
more likely to divest shares in fraud firms prior to the public revelation of a fraud.
These institutions include those that are transient, dedicated, investment advisors,
make large bets, hold large blocks of shares, or have large portfolios. The lack of
evidence in the regression analysis makes it difficult to conclude whether the
associations are the result of greater incentives to avoid fraud firms and information
advantages or natural mean reversion.
5.3 Additional Tests
I conduct two further sets of tests. The first test examines whether institutional
investors are more likely to divest fraud firms with stronger publicly-available
signals of fraud. The second test examines whether institutional investors are more
likely to anticipate and divest fraud firms engaging in specific types of fraud.
For the first analysis, I use the F-score from the model in Dechow, Ge, Larson, and
Sloan (2007) as a proxy for publicly-available signals of fraud. Using firms accused
of manipulating earnings in AAERs, Dechow et al. (2007) create a prediction model
based on publicly available information. The basic model has six variables: total
accruals, change in receivables, change in inventory, change in cash sales, change in
return on assets, and an indicator variable equal to one if a firm issues debt or
equity. The prediction model produces an annual F-score, which is calculated as
the predicted probability of an earnings manipulation scaled by the unconditional
probability. Because the number of fraud periods varies across firms and fraud
signals vary across time, I select the largest F-score (MAXFSCORE) for each fraud
firm over its fraud period. This seems reasonable, as the largest F-score represents
institutions’ best opportunity to detect the fraud.
56
Using only the sample of fraud firms, I estimate a model (untabulated) of changes
in institutional ownership over the entire fraud period as a function of
MAXFSCORE and four control variables. The control variables include SIZE,
beginning of period institutional ownership levels (TOTALHELDt−1,QIXt−1,
TRAt−1, and DEDt−1), and portfolio weights (PWEIGHTt−1,PWEIGHTQIXt−1,
PWEIGHTTRAt−1, and PWEIGHTDEDt−1). I expect that if institutional
investors are more likely to divest fraud firms with stronger fundamental signals of
fraud, I will observe a negative coefficient on MAXFSCORE.
I find that changes in institutional ownership are not significantly negatively
associated with MAXFSCORE for any of the institutional ownership groups. If
there is a relation at all, it appears that changes in institutional ownership over the
fraud periods may be positively associated with MAXFSCORE. The results suggest
that institutions are not more likely to divest shares in fraud firms with stronger
publicly-available signals of fraud. The failure to find a result suggests a potential
learning opportunity for institutional investors.
It is possible that specific types of manipulations are more likely to be detected by
institutions as they may pay closer attention to specific accounts or line items or
that certain manipulations are more easily observed. For example, for many firms
revenue is an extremely important income statement line item, and therefore,
investors may approach the line item with more scrutiny. On the other hand,
detection of manipulations that involve allowance accounts might be more easily
detected as fundamental analysis and private information might lead investors to
conclude that estimates are not reasonable. Therefore, I estimate similar
regressions as those used in the F-score analysis, but instead of the F-score I
include indicator variables for the types of manipulations alleged in AAERs. The
57
frequency of the types of manipulations are reported in Figure 4.2. The results
(untabulated) do not present any evidence that institutions are more likely to sell
shares in fraud firms manipulating specific accounts.
CHAPTER VI
Conclusion
The purpose of my dissertation is to document the trading patterns of institutional
investors in fraud firms. I examine institutional trading patterns in 322 firms that
the Securities and Exchange Commission identified in enforcement actions from
1982 through 2005 as having manipulated their accounting earnings. I find that
institutional ownership for fraud firms increases by 14 percent, over the fraud
period, representing an increase of 3.9 percent of the firm’s outstanding shares. The
3.9 percent increase consists of significant increases for both quasi-indexer and
dedicated institutional investors. Transient institutional ownership, however,
remains nearly constant. I also find that the number of institutional owners
significantly increases for all three groups over the fraud period. Although
institutional investors lose approximately $138 billion by investing in fraud firms, I
do find that some investors are able to mitigate their losses by anticipating fraud
revelations in the quarter immediately prior to the revelation. I also conduct an
institution-level analysis of trading behavior in fraud firms and find that of the
firms holding shares prior to a fraud, those with greater incentives and private
information divest shares in fraud firms prior to fraud revelations.
This study increases our understanding of the sophistication of institutional
58
59
investors. My results suggest that transient institutional investors have the ability
to predict impending revelations of accounting fraud one quarter prior to fraud
revelations and thus mitigate losses. I also provide evidence that institutional
investors increase their holdings over the course of the fraud period and lose
substantial amounts of money. This piece of evidence, in conjunction with a lack of
evidence that institutional investors use publicly available signals of earnings
manipulations, suggests that institutional investors may be less sophisticated than
previously thought with respect to fraud. It also suggests a potential learning
opportunity for institutional investors.
Future research could explore more fully the questions regarding publicly-available
signals of earnings manipulation and institutional investors. For example, what are
the cost and benefit trade-offs of using publicly-available signals of fraud? Future
research could also consider the different components of the fraud signal I analyze
and how much money institutions could save by using publicly-available signals of
fraud.
BIBLIOGRAPHY
60
61
BIBLIOGRAPHY
Ali, A., Durtschi, C., Lev, B., and Thrombley, M. A. 2004. Changes in institutional ownershipand subsequent earnings announcement abnormal returns. Journal of Accounting, Auditing andFinance, 19.
Baks, K. P., Busse, J. A., and Green, T. C. 2006. Fund managers who take big bets: Skilled oroverconfident. Working Paper, Emory University.
Balsam, S., Bartov, E., and Marquardt, C. 2002. Accruals management, investor sophistication,and equity valuation: evidence from 10-Q filings. Journal of Accounting Research,40(4):987–1012.
Beneish, M. D. 1999. The detection of earnings manipulation. Financial Analyst Journal.
Beneish, M. D. and Nichols, D. C. 2007. The predictable cost of earnings manipulation.Working Paper, Indiana University.
Bonner, S. E., Palmrose, Z.-V., and Young, S. M. 1998. Fraud type and auditor litigation: Ananalysis of sec accounting and auditing enforcement releases. The Accounting Review,73(4):503–532.
Brazel, J., Jones, K., and Zimbelman, M. 2006. What can nonfinancial measures tell us aboutthe likelihood of fraud. Working Paper, Brigham Young University.
Brown, S. J. and Goetzmann, W. N. 1995. Performance persistence. The Journal of Finance,10(2):679–698.
Bushee, B. J. 1998. The influence of institutional investors on myopic R&D investmentbehavior. The Accounting Review, 73:305–333.
Bushee, B. J. 2001. Do institutional investors prefer near-term earnings over long-run value.Contemporary Accounting Research, 18(2):207–246.
Bushee, B. J. and Goodman, T. H. 2007. Which institutional investors trade based on privateinformation about earnings and returns. Journal of Accounting Research, 45(2):289–321.
Bushee, B. J. and Noe, C. F. 2000. Corporate disclosure practices, institutional investors, andstock return volatility. Journal of Accounting Research, 38(Supplement):171–202.
Cai, F. and Zheng, L. 2004. Institutional trading and stock returns. Finance Research Letters,1(3):178–189.
Carhart, M. M. 1997. On persistence in mutual fund performance. The Journal of Finance,52(1):57–82.
Chen, X., Harford, J., and Li, K. 2007. Monitoring: Which institutions matter? Journal ofFinancial Economics, 86(2):279–305.
62
Chung, R., Firth, M., and Kim, J.-B. 2002. Institutional monitoring and opportunistic earningsmanagement. Journal of Corporate Finance, 8:29–48.
Collins, D. W., Gong, G., and Hribar, P. 2003. Investor sophistication and the mispricing ofaccruals. Review of Accounting Studies, 8(2-3).
Dechow, P. M., Ge, W., Larson, C., and Sloan, R. G. 2007. Predicting material accountingmanipulations. Working Paper, University of Michigan.
Dechow, P. M., Sloan, R. G., and Sweeney, A. P. 1996. Causes and consequences of earningsmanipulation: Firms subject to enforcement actions by the SEC. Contemporary AccountingResearch, 13(2).
Desai, H., Krishnamurthy, S., and Venkataraman, K. 2006. Do short sellers target firms withpoor earnings quality? Evidence from earnings restatements. Review of Accounting Studies,11(1):71–90.
El-Gazzar, S. M. 1998. Predisclosure information and institutional ownership: A cross-sectionalexamination of market revaluations during earnings announcement periods. The AccountingReview, 73(1):119–129.
Erickson, M., Hanlon, M., and Maydew, E. L. 2004. How much will firms pay for earnings thatdo not exist? Evidence of taxes paid on allegedly fraudulent earnings. The Accounting Review,79(2):387–408.
Feroz, E. H., Park, K., and Pastena, V. S. 1991. The financial and market effects of the SEC’saccounting and auditing enforcement releases. Journal of Accounting Research,29(Supplement):107–142.
Gompers, P. A. and Metrick, A. 2001. Institutional investors and equity prices. The QuarterlyJournal of Economics.
Guercio, D. D. 1996. The distorting effect of the prudent-man laws on institutional equityinvestments. Journal of Financial Economics, 40(1):31–62.
Hribar, P. and Jenkins, N. T. 2004. The effect of accounting restatements on earnings revisionsand the estimated cost of capital. Review of Accounting Studies, 9(2-3).
Hribar, P., Jenkins, N. T., and Wang, J. 2006. Insitutional investors and accountingrestatements. Working Paper, University of Iowa.
Jiambalvo, J., Rajgopal, S., and Venkatachalam, M. 2002. Institutional ownership and theextent to which stock prices reflect future earnings. Contemporary Accounting Research,19(1):117–146.
Karpoff, J. M., Lee, D. S., and Martin, G. S. 2007. The cost to firms of cooking the books.Forthcoming Journal of Financial and Quantitative Analysis.
Ke, B. and Petroni, K. 2004. How informed are actively trading institutional investors?Evidence from their trading behavior before a break in a string of consecutive earningsincreases. Journal of Accounting Research, 42(5):895–927.
Ke, B. and Ramalingegowda, S. 2005. Do institutional investors exploit the post-earningsannouncement drift. Journal of Accounting and Economics, 39(1):25–53.
Lev, B. and Nissim, D. 2006. The persistence of the accruals anomaly. ContemporaryAccounting Research, 23(1):193–226.
O’Brien, P. and Bhushan, R. 1990. Analyst following and institutional onwership. Journal ofAccounting Research, 28(Supplement):55–76.
63
Palmrose, Z.-V., Richardson, V. J., and Scholz, S. 2003. Determinants of market reactions torestatement announcements. Journal of Accounting and Economics, 37:59–89.
Palmrose, Z.-V., Scholz, S., and Wahlen, J. M. 2004. The circumstances and legal consequencesof non-GAAP reporting: evidence from restatements. Contemporary Accounting Research,21(1):139–190.
Rogers, W. 1993. Regression standard errors in clustered samples. Stata Technical Bulletin,13:19–23.