Page 1
University of Mississippi University of Mississippi
eGrove eGrove
Honors Theses Honors College (Sally McDonnell Barksdale Honors College)
Spring 5-9-2020
Accounting Issues: An Examination of Professional and Accounting Issues: An Examination of Professional and
Academic Accounting Topics Through Case Studies Academic Accounting Topics Through Case Studies
Reynolds Spencer
Follow this and additional works at: https://egrove.olemiss.edu/hon_thesis
Part of the Accounting Commons
Recommended Citation Recommended Citation Spencer, Reynolds, "Accounting Issues: An Examination of Professional and Academic Accounting Topics Through Case Studies" (2020). Honors Theses. 1329. https://egrove.olemiss.edu/hon_thesis/1329
This Undergraduate Thesis is brought to you for free and open access by the Honors College (Sally McDonnell Barksdale Honors College) at eGrove. It has been accepted for inclusion in Honors Theses by an authorized administrator of eGrove. For more information, please contact [email protected] .
Page 2
ACCOUNTING ISSUES: AN EXAMINATION OF PROFESSIONAL AND
ACADEMIC ACCOUNTING TOPICS THROUGH CASE STUDIES
By
Reynolds Spencer
A thesis submitted to the faculty of the University of Mississippi in partial fulfillment of
the requirements of the Sally McDonnell Barksdale Honors College.
Oxford
April 2020
Approved by
__________________________
Advisor: Dr. Victoria Dickinson
___________________________
Reader: Dr. W. Mark Wilder
Page 3
ii
© 2020
John Reynolds Spencer
ALL RIGHTS RESERVED
Page 4
iii
ACKNOWLEDGEMENTS
I have so many people to thank for my education from The University of
Mississippi. First, I must thank my parents for their constant support throughout my
educational career. I have my parents to thank for instilling a work ethic in me that has
driven me through the rigorous Patterson School of Accountancy curriculum. Second,
thank you to the teachers, administrators, alumni, and peers who have made the Patterson
School of Accountancy into such a challenging and high-quality education. Thank you to
the faculty, staff, and fellow students of the Sally McDonnell Barksdale Honors College
that made my experience and education so wonderful. Thank you finally to Dr. Victoria
Dickinson for your guidance and direction as I completed this thesis – your passion for
students does not go unnoticed.
Page 5
iv
ABSTRACT
JOHN REYNOLDS SPENCER: Accounting Issues: An Examination of Professional and
Academic Accounting Topics through Case Studies
(Under the Direction of Dr. Victoria Dickinson)
The following thesis investigates prevalent topics to the accounting profession and
academia. The thesis is comprised of twelve case studies performed over the course of
eight months related to problems facing the accounting profession, things to consider
when entering the profession, and analysis of existing and fictitious companies. The
backgrounds for case studies two, six, seven, eight, nine, ten, and twelve were provided
by Cases in Financial Reporting by Michael Drake, Ellen Engel, Eric Hurst, and Mary
Lea McAnally, as presented in the works cited page. Case study four’s background was
provided by Dr. Brett W Cantrell. All other case study backgrounds were provided by Dr.
Victoria Dickinson. Analysis provided in this thesis is the original analysis of the cited
case studies. Each case study focuses on a different accounting topic and each case study
contains an individual conclusion related to the case study’s topic. The aggregate of the
twelve case studies demonstrates a firm understanding of concepts learned in
undergraduate accounting coursework, as well as a firm understanding of the topics
facing the accounting profession.
Page 6
v
TABLE OF CONTENTS
Case One: Data Analytics Case ...........................................................................................1
Case Two: The Accounting Cycle .......................................................................................9
Case Three: Accounting Career Scenarios Case ...............................................................15
Case Four: Accounting for Debt Securities Sales and Impairments .................................22
Case Five: City Research Case .........................................................................................37
Case Six: Capitalized Costs versus Expenses ...................................................................48
Case Seven: Financial Statement Interpretation and Analysis .........................................59
Case Eight: Contingent Liabilities ....................................................................................75
Case Nine: Equity Method Investments ...........................................................................83
Case Ten: Pension Plan Accounting .................................................................................97
Case Eleven: New Perspectives on the Balance Sheet Model
of Financial Reporting ..............................................................................112
Case Twelve: Earnings Announcements ........................................................................119
Works Cited ....................................................................................................................127
Page 7
vi
LIST OF TABLES
Figure 2-1 Rocky Mountain Chocolate Factory, Inc. Journal …………………………11
Figure 2-2 Rocky Mountain Chocolate Factory, Inc. Income Statement …………….. 12
Figure 2-3 Rocky Mountain Chocolate Factory, Inc. Balance Sheet ………………… 13
Figure 4-1 Generic Bank Available for Sale (AFS) Security Detail …………………. 25
Figure 4-2 Calculation of Generic Bank’s Risk-Weighted Capital Ratio ……………. 28
Figure 4-3 Generic Bank’s Consolidated Balance Sheet for the Year-Ended 20x2 ….. 29
Figure 4-4 Supplemental Investment Securities Available for Sale Information …….. 36
Figure 5-1 Chicago Skyline …………………………………………………………... 39
Figure 5-2 Nashville Skyline …………………………………………………………. 39
Figure 5-3 Affordable Chicago Living ……………………………………………….. 42
Figure 5-4 Affordable Nashville Living …………………………………………….... 43
Figure 5-5 Operating Budget – Chicago …………………………………………….... 46
Figure 5-6 Operating Budget – Nashville …………………………………………….. 46
Figure 6-1 WorldCom, Inc. Consolidated Statement of Operations (as reported)
for the Year Ended December 31, 2001 ……………………………………………… 52
Figure 6-2 WorldCom, Inc. Consolidated Balance Sheet (as reported)
for the Year Ended December 31, 2001 …………………………………………….... 54
Figure 6-3 Summarization of Journal Entries Related to Improper
Capitalization of Line Costs ………………………………………………………….. 55
Figure 6-4 Calculation of Depreciation ………………………………………………. 56
Figure 6-5 WorldCom’s Restated Income Statement, with Line Costs, Depreciation,
and Income Taxes Appropriately Adjusted ………………………………………….. 57
Page 8
vii
Figure 7-1 Starbucks Corporation Financing ……………………………………….... 65
Figure 7-2 Starbucks Corporation Common-Size Consolidated Balance Sheets …….. 66
Figure 7-3 Starbucks Corporation Common-Size Consolidated Statement of
Earnings…………………………………………………………………………….…..68
Figure 7-4 Starbucks Corporation Consolidated Statement of Earnings ….….………. 70
Figure 7-5 Starbucks Corporation Consolidated Statements of Cash Flows………….. 73
Figure 9-1 The Wendy’s Company Consolidated Balance Sheets …….……………... 88
Figure 9-2 Excerpts from Footnote 8 to the Financial Statements …………….……... 89
Figure 9-3 Equity Income from Wendy’s Equity Investments ……………………….. 91
Figure 9-4 The Wendy’s Company Consolidated Statement of Cash Flows ………… 94
Figure 10-1 Pension Plan Flowchart ………………………………………………… 100
Figure 10-2 Johnson & Johnson 2007 Pension Expense Detail and Related Journal
Entries ………………………………………………………………………………... 105
Figure 10-3 Johnson & Johnson 2007 Benefit Obligation and
Pension Assets Detail ………………………………………………………………... 106
Figure 10-4 Discount Rates Used to Develop Actuarial Present Value
of Projected Benefit Obligation ……………………………………………………… 107
Figure 11-1 Fair Value Feedback Loop ……………………………………………… 115
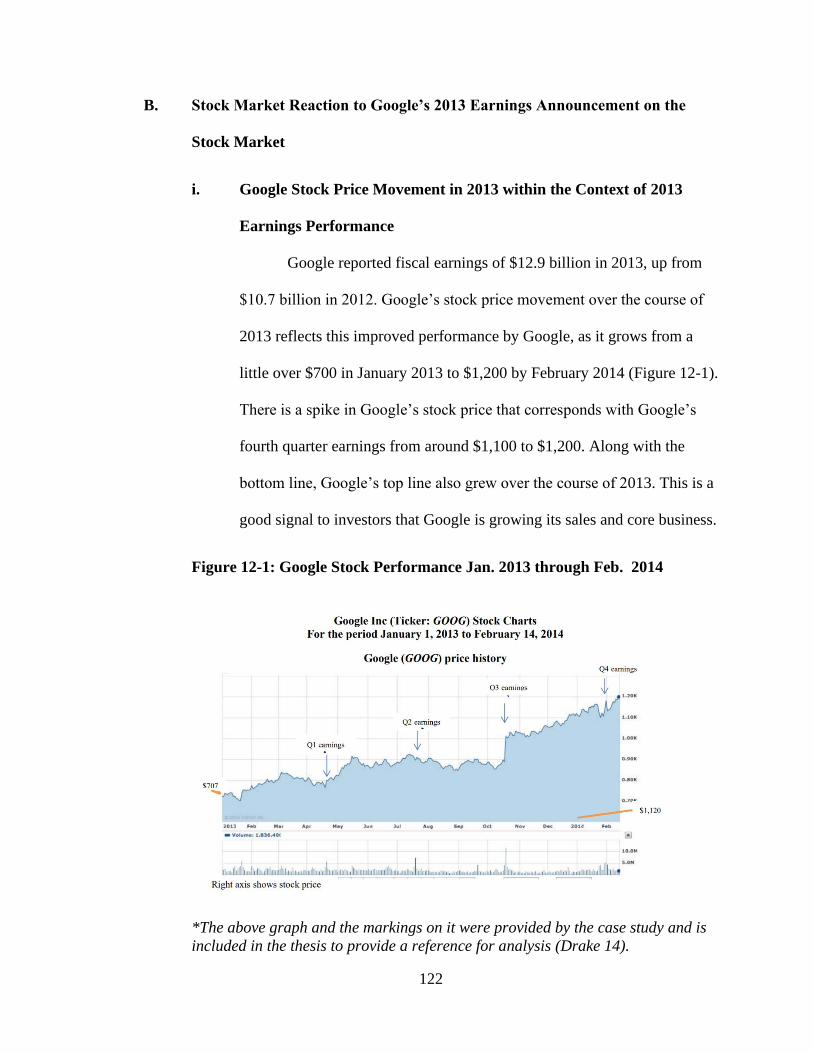
Figure 12-1 Google Stock Performance Jan. 2013 through Feb. 2014 …………….... 122
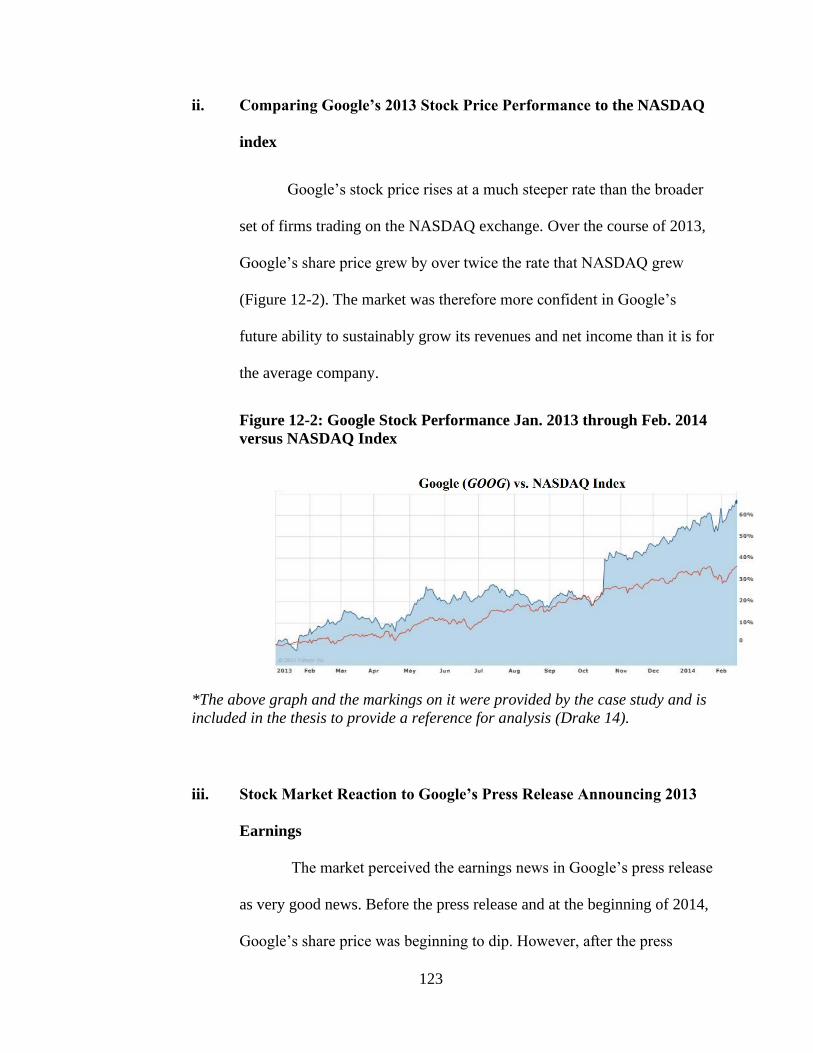
Figure 12-2 Google Stock Performance Jan. 2013 through Feb. 2014
Versus NASDAQ Index ………………………………………………………………123
Page 9
1
Case One
Data Analytics Case
5 September 2018
Page 10
2
Introduction
As technology and computing have exponentially increased over the past couple
of decades, opportunities have increasingly arisen for businesses to collect, process, and
utilize data to make informed decisions. Improvements in technology allow software to
collect data from more sources, more quickly, store more data, and analyze data better
than software has ever been able to in the past. Therefore, data analytics tools have
become increasingly useful for companies to use to gain advantages over their
competitors by making timelier and better-guided decisions. This case will explore the
potential of a data software named Domo to benefit a public accounting firm in its audit
and tax planning practices.
By exploring specific scenarios for which Domo is useful to specific accounting
practices, my understanding for Domo’s software as well as the catch-all term – “data
analytics” – became more concrete in nature. This case provided me with the opportunity
to also explore inefficiencies in accounting practices and how a data analytics software
could smooth-over such inefficiencies. As businesses are turning more and more to data
analytics, this case serves as a useful investigation into the capability of the data analytics
software, Domo, to improve accounting practices in public accounting firms. A career in
public accounting will require finding innovative solutions to complex problems. The
analysis of a software such as Domo as performed in this case study serves as a
meaningful practice in arriving at innovative solutions to problems that accounting firms
face using tools available on the market.
Page 11
3
A. History and purpose of Domo
CEO Josh James founded Domo in 2010 as a technology startup company based
out of Utah. According to Crunchbase, Domo received its first $10 million in funding
during its seed stage in 2011 in the form of angel investors and has raised almost $700
million to date (Domo). Domo is a platform that can bring in data from over 500 data
sources and aggregate all the data so that the data can be viewed dynamically in one
place. CEO James said in an interview with Business Insider that Domo’s dashboard
separates itself from similar products since “There’s no other [dashboard] in the world
that has every bit of data about just one company” (Weinberger). Domo therefore makes
data more available and more visible to those to whom the data is relevant, which allows
everyone in the company to be on the same page in real-time.
B. How Domo is used to make business decisions:
By incorporating all data relevant to companies in real-time, companies can use
Domo to make decisions founded on both timely and holistic information. Domo
provides extensive analytical capabilities through the over 300 different types of
interactive charts and dashboards available on the platform (“Product Overview |
Domo”). Domo also does an excellent job of dispersing information throughout the
company which enables collaboration among those involved in decision-making. Domo
even has a mobile app which permits remote access to the data, so that decision makers
can access the data on the go. This way, the company’s decision makers can get the
information that they need at any time.
Page 12
4
C. Domo’s Use in Audit and Tax Settings
i. Auditing
Syncing client’s data: Auditing requires the validation of immense amounts of
data. Domo has the capability of extracting and combining data from any third-
party source. By using Domo’s platform, an auditor can quickly sync a client’s
inventory data, sales data, or income data with Domo. Domo can more efficiently
clean, organize, and store data than can an auditor, freeing up the auditor’s time to
perform higher-level, more meaningful audit work.
More effectively evaluate internal controls and catch irregularities: Domo’s
extensive information and large number of data connecters provide, according to
its website, “ultimate visibility” into a company (“IT Self-Service and
Governance Tools”). The visibility Domo adds by gathering data from all relevant
sources of a company allows auditors to more easily detect misstatements in a
client’s financial reporting. This transparency also allows auditors to more
effectively evaluate a company’s system of internal controls through the added
visibility into the client’s processes.
Timely insights into deviations from a business’s normal behavior: Not all
irregularities in companies’ statements are due to misreporting. Take a retail
business such as Target for example, which states in its 10-K that, “A larger share
of annual revenues and earnings traditionally occurs in the fourth quarter because
it includes the November and December holiday sales period” (Target, Inc.).
Auditors can use Domo’s real-time industry data to compare Target with
competitors to uncover industry-specific seasonality trends. The real-time
Page 13
5
industry data will allow auditors to more effectively differentiate between
misreporting and genuine changes in operating levels in time for the client to file
their necessary reports with the SEC.
ii. Tax Planning
Better predict tax liabilities: Included in the wide breadth of data that Domo can
extrapolate is external data such as social media and related industry/market data.
With such insight, Domo can better predict demand for a company which will aid
in predicting revenues, income, and ultimately tax liability. If the public
accounting firm’s tax accountants can pull more information on its client with
Domo, they can make more accurate predictions about prospective tax liabilities.
Better Evaluate Current Tax Liabilities: In addition to offering prospective insight
into tax liabilities, Domo’s platform allows a company to retrospectively evaluate
its tax liabilities. For instance, say that a client has discovered a sudden increase
in its tax expenses. Tax accountants can use Domo to pull income information
from internal sources across multiple divisions and pinpoint areas in which the
company’s tax liabilities are higher than others by using Domo’s extensive
analytical tools. After pinpointing what is driving increased tax liabilities, the
accountants can experiment with ways to decrease tax liability in a way that
makes the company more profitable.
Determine Ramifications of Growth: For a company to survive, it must grow.
Growth can come in the forms of mergers and acquisitions or expansion into new
regions. For any sort of growth, there will be tax ramifications. If a client is
Page 14
6
looking to expand, they will need a tax accountant to analyze prospective taxation
ramifications. Such critical analysis requires an extensive look into internal data
of the company as well as external data relating to other companies and tax data
from different regions. Domo would enhance a firm’s services by allowing the
firm to efficiently pull relevant internal and external data and look at it on a single
platform. Visualizing internal and external data on one platform will allow more
efficient analysis of tax ramifications than would looking at such data separate.
D. Example Memo Recommending Use of Domo Software to Accounting Firm
To: John Doe, Partner
From: Reynolds Spencer, Staff
Subject: Domo Software Recommendation
Date: 9/5/2018
This memo serves to provide information about Domo data analytic software and
ultimately recommend the acquisition of the Domo software for the firm’s audit and tax
practices. Domo will enhance the firm’s services to clients through increased efficiency
as well as better analysis. Enhanced efficiency and analysis will provide both price and
product differentiation and open the door to an increase in the client base.
Domo increases efficiency by extracting, storing, and displaying extensive
amounts of information in one place. Domo Application Program Interfaces (APIs)
allows companies to program the management of data so that less time is spent on
finding, downloading, and storing data and more time is spent on analysis of data
(“Domo APIs”). Increased efficiency results in less time as well as lower costs to clients.
While lower costs do equal less revenue to the firm in the short-term, they increase client
Page 15
7
satisfaction and increase retention among current clients while attracting new clients,
increasing revenue in the long-term.
Domo’s analytical capabilities are flexible and can be used for any client. Domo
has its own, ever-expanding Appstore with a multitude of data analytics applications. In
addition to existing applications, Domo has its own design studio which allows the
construction of custom applications. With so many tools available to it, the firm will be
able to meet every analytical need of even the most diverse client base. Domo leaves it up
to the firm to organize the platform how it sees best. This flexibility allows the firm to
differentiate its services from competitors.
For the platform’s full, collaborative potential to be realized, it will need to
adequately train all employees in Domo. Domo allows collaboration through the flow of
information, but this collaboration is possible only if everyone in the firm is literate in the
software. PC Magazine noted in an article that Domo is worthwhile “for those willing to
invest in the steep learning curve required” (Baker). Since the platform is not intuitive,
Domo will require extensive training, but once integrated into the fabric of the company,
the firm will have an extreme advantage over competitors who are less willing to invest
in the product in fear of the steep learning curve.
Acquisition of Domo and related training will require a technologically literate
staff. The training in and maintenance of Domo will require a strong IT department who
can educate all staff-members on the platform, customize the Domo platform to the
management’s specifications, and solve any problems that may arise with the platform.
Domo’s application customization capability also offers the competitive opportunity for
the firm to employ personnel who are capable programmers. The use of Domo will
Page 16
8
strengthen the firm’s analytical capabilities, therefore allowing it to grow its advisory
practice, and the platform’s flexibility will allow the company to handle a larger and
more diverse client base.
Conclusion
An effective data analytics software can enhance client service delivery and
efficiency for a public accounting firm. Domo accomplishes these tasks by aggregating
all the information from the client in one place. By investigating how an accounting firm
could use Domo’s software across its different service lines, I was able to investigate how
data analytics could improve the public accounting profession. Additionally, this case
study was a practice in aggregating and communicating information to higher-ups in the
form of a proposal memo (Part D).
Page 17
9
Case Two
The Accounting Cycle
12 September 2018
Page 18
10
Introduction
This case demonstrates a condensed run through the accounting cycle for the
Rocky Mountain Chocolate Factory, Incorporated. I would expect Rocky Mountain
Chocolate Factory, a chocolate producer and retailer, to have large balance sheet accounts
such as inventory; accounts receivable from sales; property, plant, and equipment for the
production of chocolate; accounts payable for suppliers; and common stock since it is
incorporated and has publicly traded ownership interests. I would also expect the Income
Statement to consist primarily of sales revenues and cost of goods sold, as well as
depreciation on the factories. This case demonstrates the financial statement preparation
process from the origination of journal entries, adjustment and closing entries, and the
ultimate preparation of financial statements. This case also provided technical training in
Excel, such as learning how to effectively link data from the general journal, to the
income statement, and ultimately the balance sheet. A career in public and private
accounting requires extensive understanding of the process of preparing financial
statements.
A. Rocky Mountain Chocolate Factory, Inc. Journal (Figure 2-1)
The next page contains Rocky Mountain Chocolate Factory, Inc.’s journal
entries for February 2009. Activity that the journal entries in Figure 2-1 are based
on was provided by the case background (Drake, Engel, Hirst, McAnally).
Page 20
12
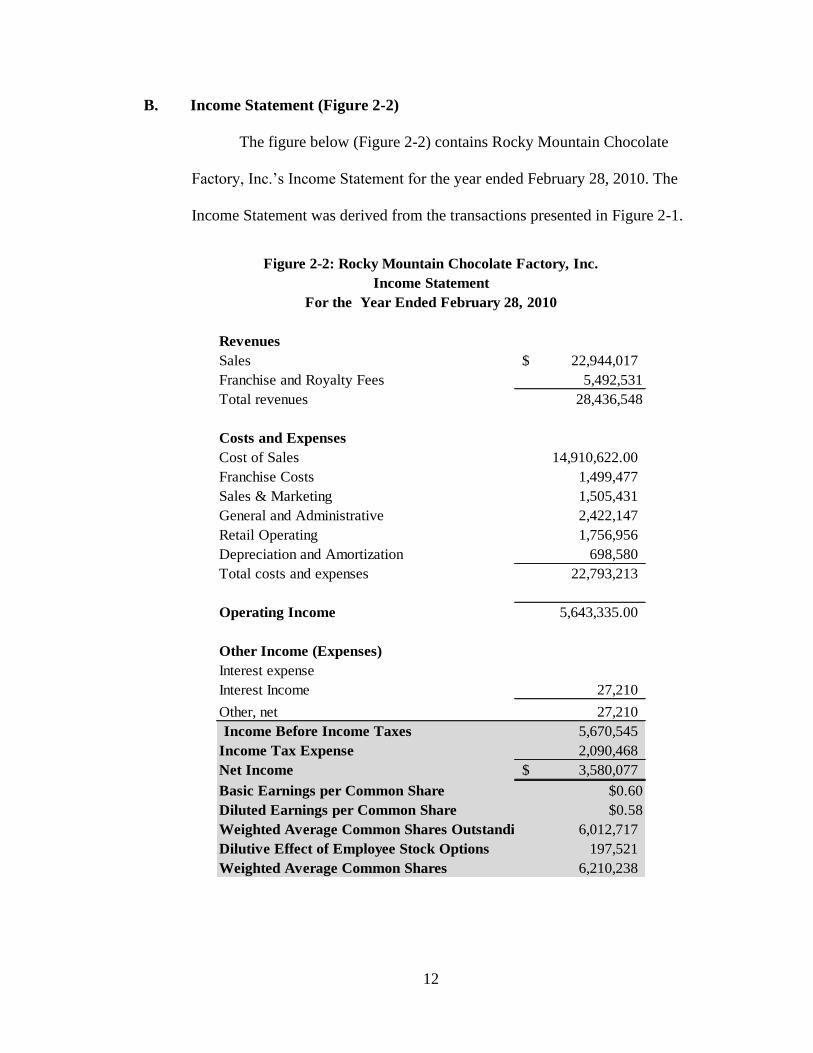
B. Income Statement (Figure 2-2)
The figure below (Figure 2-2) contains Rocky Mountain Chocolate
Factory, Inc.’s Income Statement for the year ended February 28, 2010. The
Income Statement was derived from the transactions presented in Figure 2-1.
22,944,017$
5,492,531
28,436,548
14,910,622.00
1,499,477
1,505,431
2,422,147
1,756,956
698,580
22,793,213
5,643,335.00
27,210
27,210
5,670,545
2,090,468
3,580,077$
$0.60
$0.58
6,012,717
197,521
6,210,238
Franchise and Royalty Fees
Figure 2-2: Rocky Mountain Chocolate Factory, Inc.
Income Statement
For the Year Ended February 28, 2010
Revenues
Sales
Total revenues
Costs and Expenses
Cost of Sales
Franchise Costs
Sales & Marketing
Income Before Income Taxes
General and Administrative
Retail Operating
Depreciation and Amortization
Total costs and expenses
Operating Income
Other Income (Expenses)
Interest expense
Interest Income
Other, net
Weighted Average Common Shares
Income Tax Expense
Net Income
Basic Earnings per Common Share
Diluted Earnings per Common Share
Weighted Average Common Shares Outstanding
Dilutive Effect of Employee Stock Options
Page 21
13
C. Balance Sheet (Figure 2-3)
Figure 2-3 (below) contains Rocky Mountain Chocolate Factory, Inc.’s
Balance Sheet as of February 28, 2010. The Income Statement (Figure 2-2)
presents the activity that occurred throughout the period. The Balance Sheet
(Figure 2-3) displays a snapshot of the company’s financial position after the
period’s activity.
3,743,092$
4,427,526
91,059
3,281,447
461,249
220,163
12,224,536
5,186,709
263,650
1,046,944
110,025
88,050
1,508,669
18,919,914$
877,832$
646,156
946,528
602,694
220,938
3,294,148
894,429
180,808$
7,626,602
6,923,927
14,731,337
18,919,914$
Cash and Cash Equivalents
Figure 2-3: Rocky Mountain Chocolate Factory, Inc.
Balance Sheet
For the Year Ended February 28, 2010
Assets
Current Assets
Goodwill, Net
Accounts Receivable
Notes Receivable, Current
Inventories
Deferred Income Taxes
Other
Total Current Assets
Property and Equipment, Net
Other Assets
Notes Receivable, Less Current Portion
Deferred Income
Intangible Assets, Net
Other
Total Other Assets
Total Assets
Liabilities and Stockholders' Equity
Current Liabilities
Accounts Payable
Accrued Salaries and Wages
Other Accrued Expenses
Dividend Payable
Additional Paid-In Capital
Retained Earnings
Total Stockholders' Equity
Total Liabilities and Stockholders' Equity
Total Current Liabilities
Deferred Income Taxes
Stockholders' Equity
Common Stock
Page 22
14
D. Impact of Fiscal Year 2010 Activity on Statement of Cash Flows
Transactions that affect current assets or current liabilities and general
revenues and expenses impact the operating section of the Statement of Cash
Flows. Of the non-adjusting/closing transactions in the journal (Figure 2-1, entries
one through ten), transactions one through eight all fall into the operating
category, because transactions such as purchasing and paying for inventory,
incurring and paying factory wages, selling inventory and collecting receivables,
and receiving a franchise fee result from Rocky Mountain’s current period
operations. The purchase of property, plant, and equipment (PPE) in transaction
nine (Figure 2-1) impacts the investing section of the Statement of Cash Flows,
because Rocky Mountain will recognize value from its investment in the PPE in
future periods. The declaration and payment of dividends impact the financing
activities section of the Statement of Cash Flows, because such activity relates to
the raising of funds to support Rocky Mountain’s performance of operating and
investing activities through the issuance of stock.
Conclusion
As expected, accounts receivable and inventories account for nearly three quarters
of Rocky Mountain’s current assets. Property, plant, and equipment is also a substantial
asset account. Accounts payable accounted for a smaller portion of Rocky Mountain’s
current liabilities than I had expected, which may be due to Rocky Mountain being
extremely liquid and able to meet current obligation, as its current assets are four times
larger than its current liabilities. As expected, Rocky Mountain’s sales and cost of Goods
Sold account for a substantial portion of its revenues and expenses relatively.
Page 23
15
Case Three
Career Scenarios Case
18 September 2018
Page 24
16
Introduction
This case examines relevant dilemmas faced by soon-to-be accounting
professionals. These dilemmas have been created through conflicting interests of The
Patterson Accounting School, public accounting firms, and accounting students. Public
accounting firms invest a significant amount in new hires and have often suffered
substantial losses from new hires who do not stay with the firm long enough for the firm
to recoup its investment (it is believed that firms recoup their investment on new hires in
three to five years). This dilemma facing public accounting firms is rather unique, since
the firms depend so heavily on their human-capital. The future of the accounting
profession will be determined by career decisions made by those who are entering the
field in the coming years. Reasoning through the following three scenarios elicited
contemplation of professional decisions as well as an enhanced understanding of the
issues interests and conflicts facing the accounting profession.
A. Scenario #1: One student is weighing going to law school upon completion of
their Patterson School of Accountancy program to study tax law over
obtaining a master’s degree in tax accounting at The University of
Mississippi. The student also would like to go through with their Accounting
internship.
Many overlaps exist between tax accounting and tax law in practice. The
advantages to entering tax law are heightened expertise in the tax field, increased
employment demand, and greater salary. The disadvantages are the extreme costs
of law school as well as the idea that interning at an accounting firm without plans
Page 25
17
to work at one after college would be a waste of time and resources for the student
as well as the firm. With all factors considered, the best route for the student
appears to be to enter the Public Accounting field and go back to law school after
years of experience and savings. This path capitalizes on the advantages of
obtaining a law degree while minimizing the noted disadvantages.
Accounting graduates tend to not enter the public accounting field with all
the knowledge necessary to perform their jobs. This fact is not due to
shortcomings of higher education but rather due to knowledge that graduates can
only obtain through experience in tax accounting. Firms know this fact, which is
why firms invest in developing and educating recent graduates. By completing the
accounting internship and then gaining two to three years of experience in tax
accounting at a public accounting firm, the student will hold far more knowledge
in the tax practice than the student did upon graduation from The Patterson
School. Working at a public accounting firm prior to attending law school would
greatly prepare the student for the rigorous law school curriculum. Upon the
completion of law school, the student will be highly sought after due to the
experience in tax accounting coupled with the law degree.
The major drawbacks of this student opting into law school would be the
extreme cost of law school as well as the potential waste of time and resources by
the employer and the student. This potential waste would be material should the
student decide to go through with their internship and then immediately attend
law school upon graduating as opposed to accepting a full-time position with the
firm at which they interned. However, should the student follow the suggested
Page 26
18
path of working for the firm for two to three years before entering law school, the
student would have the opportunity contribute to the firm in a material way and
offer a return on the firm’s investment in recruiting while simultaneously gaining
valuable and relevant experience. Additionally, the student would offset part of
the cost of law school by earning and saving for three years at the firm. The
student could also manage left-over debt from law school with the increased pay
which they would likely earn once re-entering the workforce with a tax law
degree.
B. Scenario #2: A student is looking to enter investment banking via an
accounting degree from The University of Mississippi.
Accounting is known as the “language of business.” Because of this,
accounting expertise enables recent-graduates to work in a variety of business
fields – investment banking included. The student in this scenario finds passion in
investment banking but feels that a degree in accounting holds more merit, so the
student would like to go through with an accounting major and internship. Due to
the portable nature of the accounting degree, the student would benefit greatly
from accounting knowledge, and due to the prestige of an Bachelor degree in
Accounting from The University of Mississippi, the student would become a
sought-after job candidate upon completion of the accounting program. However,
when the time comes for the student to intern as a part of their curriculum, the
student would benefit more from seeking out an investment banking internship
than an accounting internship due to the student’s passion for investment banking
Page 27
19
coupled with increased job prospects that would arise from internship experience
in the relevant field.
While accounting provides a very sturdy foundation for investment
banking, the student will need to learn on the job as an investment banker. For
this reason, doing an internship would benefit the student through the extensive
knowledge and training that the student would gain as an intern. Additionally, job
prospects within the investment banking field would become far greater if the
student were to have experience and references that could speak to the student’s
capabilities in investment banking.
This scenario differs from the previous scenario in that this student’s lies
in a field other than accounting. The overlap between tax law and tax accounting
are greater than the overlap between accounting and banking. A desired focus on
the legal aspects of tax accounting drives the shift in career path in the first
scenario, while a lack of passion in accounting drives the shift in the education
and career paths in this scenario. The student in this scenario would waste time
and resources by pursuing internships and careers in accounting due to the
student’s lack of passion and interest. While it would have been rational for the
student in the first scenario to spend time in tax accounting only to progress into
tax law, the same logic does not apply for the student in this scenario. The student
in this scenario should follow his passion for investment banking. While this
student would benefit from obtaining knowledge in the “language of business” by
way of an accounting major, it would not benefit the student to spend time in an
internship or career field that do not optimize the student’s interests.
Page 28
20
C. Scenario #3: A student is considering a transfer from a Big Four firm in
Washington D.C. to an office in Dallas, Texas upon the completion of their
master’s degree at The University of Mississippi.
One of the greatest decisions that must be made as a student prepares to
launch a career is where to land post-graduation. Finding enjoyment in the
location in which the student work impacts student’s effectiveness as an
employee. An equally (if not more) important consideration is the student’s
personal well-being outside of work. This is a difficult decision for a 20- to 21-
year-old to make – a decision which some may not get right. This student
completed the internship, and as they near the completion of the Accounting
graduate program, the student is exploring the possibility of transferring the firm’s
job offer to the firm’s Dallas office. A position in Dallas’s office is highly
competitive, so there is little guarantee that the student would land a position at
the firm. For this scenario, it is important to consider both the well-being of the
student and the interests of the accounting firm’s D.C. office, which has poured
resources into drawing the student to their office.
Accounting firms invest $175 thousand, on average, in the recruitment and
training of accounting students. Due to this, it would be highly advised that the
student transfer only if the same firm’s Dallas office could take the student. If a
major life event draws the student to Dallas, then the scenario changes and more
measures would reasonably need to be taken to move to Dallas. However, if it is a
matter of disliking the city after a ten-week internship, then it may be worth the
Page 29
21
student staying with the D.C. office for two to three years to get a better sense of
the city, which is also the amount of it takes for the firms to recognize a
reasonable return on their investment in the student. The well-being of the
employee matters, so if the student still does not enjoy the location of the firm or
the office itself after a reasonable amount of time, then opportunities will exist for
the student to eventually move back to Dallas. The decision to transfer nearly a
year after the completion of the internship appears irrational and unfair to the
firm, barring any major life-events. Above all else, throughout the entirety of this
process, the student need be transparent with the firm.
Conclusion
While the specific scenarios and recommendations vary, the overarching theme of
each suggestion is that the students balance self-optimization (personally and
professionally) with the interests of the firms involved in recruitment and employment of
the students. To the extent to which the student can without infringing on personal and
professional advancement, the students ought not to waste the time and resources of the
firms which employ the students as interns or full-time CPAs. While I currently relate
best to the students in the three scenarios, upon entering the profession in 2021, I will
experience the other side of the coin and need to look out for the interests of the
accounting profession. As I placed myself in the shoes of public accounting firms, I
obtained a greater understanding of the problems which the industry I will soon enter faces.
Page 30
22
Case Four
Accounting for Debt Securities Sales and Impairments
3 October 2018
Page 31
23
Introduction
Determination of debt security impairment requires extensive examination of
various factors. This case investigates the factors which determine debt security
impairment through careful analysis of the fictional Generic Bank’s security portfolio,
financial statements, and the short and long-term strategy of the bank. Impairment
determinations are extremely necessary as they materially impact the timing and amounts
of earnings reported by the bank. Completion of this case study allows for a better
understanding of accounting rules and procedures as they pertain to impairment of debt
securities. This case also provided an effective practice in consulting authoritative
literature to arrive at a conclusion. Applications in the accounting profession of
knowledge obtained from this case can be seen in audit and advisory services provided to
banks. For a public accountant to perform an audit of a bank, the CPA must understand
rules and regulations regarding impairment. Advisory professionals will need to factor in
causes and implications of security impairment to advise on banking strategy.
A. Impairment Loss on Securities in Figure 4-1 if Sold in Early 20x3
For this case, all Generic Bank’s securities are assumed to be available for
sale (AFS) securities. Assume that Generic Bank’s CFO intends to sell the
securities listed in Figure 4-1 in early 20x3. According to FAS statement 115,
unrealized gains and losses on AFS securities are excluded from earnings
(“Accounting for Certain Investments in Debt and Equity Securities”). Under this
assumption alone, Generic Bank would realize losses on the seven securities in
Figure 4-1 only when the bank sells the securities in 20x3. However, according to
Page 32
24
ASC 326-30, Generic bank must make the determination of whether the securities
in unrealized loss positions are impaired, since unrealized loss on impaired
securities would reduce income. Therefore, Generic Bank determines that the
securities are impaired, then the bank must recognize an impairment loss in 20x2
(as opposed to when they are sold in 20x3). Therefore, the outcome of the
impairment analysis of the Figure 4-1 securities will determine the timing of loss
recognition.
For Generic Bank to avoid realizing an impairment loss, it must assert that
it has the “intent and ability to hold these unrealized loss debt securities until they
can recover their amortized cost basis” (Cantrell 3). The sale of the seven
securities would result in a material loss of $54.209 million – the net deficit of the
fair values of the seven securities to their amortized costs (Figure 4-1). However,
only five of the seven securities are in unrealized loss positions. Securities 067
and 096 are in unrealized gain positions, which would not be recognized as
impairment losses during 20x2 but rather realized as gains upon sale in 20x3
(assuming little to no change to the fair values of the securities by the time that
Generic Bank sells them). The 20x2 impairment loss would be recorded only for
the securities in unrealized loss positions.
Due to the material loss positions of securities 003, 015, 025, 030, 076 and
the lack of intent to hold the securities, Generic Bank cannot reasonably assert
that the five securities in loss positions are not impaired. Therefore, Generic Bank
should recognize an impairment loss of $78,414 million in 20x2 for the securities
(Figure 4-1) in loss positions.
Page 33
25
Figure 4-1: Generic Bank Available for Sale (AFS) Security Detail (Numbers in
Thousands)
Security Type CUSIP Description Amortized
Cost
Fair
Value
State and Political Subdivisions
0XXXXX003 Municipal Bond – City of Los Angeles 57,652 42,968
Mortgage-Backed
Securities
0XXXXX015 FHLMC Residential Single-Family MBS - 3 77,759 77,586
Mortgage-Backed
Securities
0XXXXX025 FHLMC Residential Single-Family
MBS - 13
52,188 29,650
Mortgage-Backed
Securities
0XXXXX030 FNMA Residential Single-Family MBS - 3 66,785 54,457
Mortgage-Backed Securities
0XXXXX067 FNMA Residential Multi-Family MBS - 5 39,545 55,883
Mortgage-Backed
Securities
0XXXXX076 Private Label Residential Multi-Family
MBS – 4
42,115 13,424
Other Securities 0XXXXX096 Corporate Bonds – JKL Corporation 50,000 57,867
Total 386,044 331,835
*The above detail was borrowed from the case study to provide a reference for the analysis
performed throughout the case (Cantrell 10).
B. Impairment Loss on Securities Other than those Presented in Figure 4-1
The following analysis operates under the assumption that Generic Bank
still sells the securities in Figure 4-1 shortly after year-end 20x2. Upon analysis of
Generic Bank’s remaining securities not mentioned in figure 4-1, mortgage-
backed securities (MBS) account for the most substantial net unrealized losses,
totaling $437 million and around 60 percent of Generic’s unrealized losses are
attributed to securities which have been in unrealized loss positions for over a
year (Figure 4-4). Whether the bank can recover the fair value of the securities
and therefore need-not recognize impairment on securities rests in the intent and
ability of Generic Bank to hold the MBS until they recover their amortized costs.
Generic Bank does intend to hold onto the mortgage-backed securities, but
whether it has the ability to hold the securities is partly determined by the
adequacy of the bank’s existing capital (assuming that none of the impairments
Page 34
26
are due to credit-losses). The Federal Depository Insurance Commission (FDIC)
requires that banks maintain minimum values for two types of capital ratios: risk-
weighted capital ratios and leverage ratios.
i. Generic Bank’s Leverage Ratio
According to FDIC Rules and Regulations § 325.3b.2, depositories such
as Generic Bank must maintain a minimum ratio of tier 1 capital to total assets of
four percent – furthermore, “tier 1 capital is the most loss-absorbing form of
capital. It includes qualifying common stock and related surplus net of treasury
stock; retained earnings; certain accumulated other comprehensive income
(AOCI)” (“Rules, Regulations, Related Acts”). Upon analysis of Generic Bank’s
balance sheet information (Figure 4-3), the bank exceeds the four percent
minimum leverage ratio requirement by maintaining a ratio of 5.39 percent. The
leverage ratio for Generic Bank as of year-end 20x2 is calculated below, where all
Generic Bank’s stockholder’s equity was deemed tier 1 capital:
𝑡𝑖𝑒𝑟 1 𝑐𝑎𝑝𝑖𝑡𝑎𝑙
𝑡𝑜𝑡𝑎𝑙 𝑎𝑠𝑠𝑒𝑡𝑠 =
554,739
10,287,212 = 5.39 %
According to FDIC Rules and Regulations, a tier 1 leverage ratio of five
percent or higher places Generic Bank in the highest capital category, which is –
“well capitalized” (“Risk Management Manual of Examination Policies” 2.1-8).
The leverage ratio backs Generic Bank’s claim that it can hold onto the securities.
Because Generic Bank’s assets are backed by adequate capital, it can absorb more
losses and better-meet financial obligations. A lower value of the leverage ratio
would indicate that the company was backed less-favorably by liabilities, which
Page 35
27
would render the company less able to absorb losses and less capable of meeting
financial obligations. A low leverage ratio would raise concerns about the bank’s
solvency. Since the bank is in position to meet its financial obligations, it can hold
onto the securities until they recover their amortized costs.
ii. Generic Bank’s Risk-Based Capital Ratio
According to Appendix A to FDIC Rules and Regulation § 325, “A bank’s
risk-based capital ratio is calculated by dividing its qualifying total capital base by
its risk-weighted assets,” and the ratio should exceed eight percent (“Rules,
Regulations, Related Acts”). This ratio serves a similar purpose as the leverage
ratio in analyzing a bank’s solvency, but the FDIC implemented the risk-based
capital ratio requirement to better assess banks’ abilities to absorb losses with
their “risk profiles” considered. For example, the denominator in Risk-Based
Capital Ratio (risk-weighted assets) is a total of Generic Bank’s investment assets
(Figure 4-3), weighted by risk factors as stated by the FDIC. Using the guidelines
to risk-weighted factors (“Risk Management Manual of Examination Policies”
2.1-5), the US Treasury and US Agency bonds were given zero percent weights
(little-to-no risk); State/Political securities were given 20 percent weights (little
risk); since all of the bank’s loans held for sale are in real estate, consumer, or
commercial loans, they were given 100 percent weights. The guidelines state that
the bulk of the assets typically found in a loan portfolio are given 100 percent
weights, so when insufficient information was provided in the case for the
investment grade of MBS and “Other” securities, the securities were assigned 100
percent weights as defaults.
Page 36
28
Figure 4-2: Calculation of Generic Bank’s Risk-Weighted Capital Ratio (numbers in
thousands)
Security Type Total Security Type Fair
Value*
Security Risk-Weight
(%)**
Security Risk-Weight ($)
State and Political Subdivisions (AFS)
286,907
20% 57,381.4
U.S. Treasury and Govt.
Agency (AFS)
81,239 0% 0
Mortgage-backed Securities (AFS)
3,535,436 100% 3,535,436
Other AFS Securities 131,110 100% 131,110
Loans Receivable (Figure 4-3) 10,610 100% 10,610
Risk-Weighted Assets 3,734,537.4
*Figure 4-4
**Provided in FDIC Risk Management Manual of Examination Policies (page 2.1-5)
𝑇𝑜𝑡𝑎𝑙 𝐶𝑎𝑝𝑖𝑡𝑎𝑙 𝐵𝑎𝑠𝑒 (𝑎)
𝑅𝑖𝑠𝑘−𝑊𝑒𝑖𝑔ℎ𝑡𝑒𝑑 𝐴𝑠𝑠𝑒𝑡𝑠 =
554,739
3,734,537.4 = 14.85%
(a) Total Capital Base = Total Stockholders’ Equity (Figure 4-3)
Generic Bank’s risk-based capital ratio of 14.85 percent (Figure 4-2) well
exceeds the FDIC minimum requirement of eight percent. Banks with a total risk-
weighted assets ratio of 10 percent or higher are categorized as “well capitalized”
according to section 2.1 of FDIC’s Risk Management Manual of Examination
Policies (“Risk Management Manual of Examination Policies” 2.1-8). Generic
Bank’s high-grade risk-weighted assets ratio indicates that it has enough capital to
absorb losses by its risk-based assets.
Because Generic Bank meets the capital requirements set forth by the
FDIC, it may reasonably assert that it has both the intent and ability to hold the
remainder of its securities until they recover their amortized costs. Additionally,
of the 55 investments in net loss position, none are impaired due to credit loss.
Therefore, Generic Bank does not have any additional impaired securities.
Page 37
29
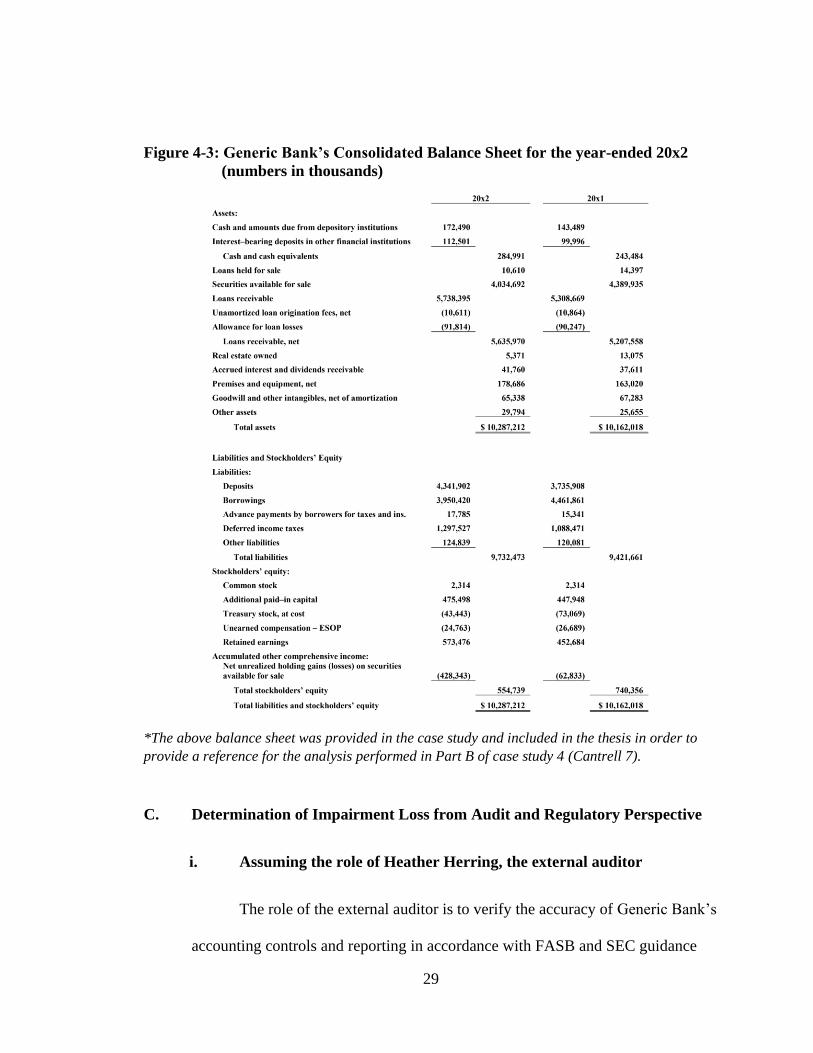
Figure 4-3: Generic Bank’s Consolidated Balance Sheet for the year-ended 20x2
(numbers in thousands)
*The above balance sheet was provided in the case study and included in the thesis in order to
provide a reference for the analysis performed in Part B of case study 4 (Cantrell 7).
C. Determination of Impairment Loss from Audit and Regulatory Perspective
i. Assuming the role of Heather Herring, the external auditor
The role of the external auditor is to verify the accuracy of Generic Bank’s
accounting controls and reporting in accordance with FASB and SEC guidance
Page 38
30
and regulation. An external auditor would be more skeptical as to the bank’s
ability to hold onto the securities than would Generic Bank’s CFO. From a 50
thousand-foot view, the bank’s capital ratios meet regulatory requirements, but
the auditor must now validate the numbers behind the ratios. If credit loss did
exist on the securities, then they would in-fact be impaired. However, without
information present pertaining to credit-loss in this case, the assertion that
remaining securities are not impaired does not change under the assumption of the
role of an external auditor.
ii. Assuming the role of a bank regulator
The role of the bank regulator is to ensure that Generic Bank is well-
capitalized in accordance with FDIC regulation and other regulatory bodies. The
bank regulator will want to ensure that the bank is classifying its securities and
loans in accordance with FDIC regulations. The regulator would investigate how
the company determines impairment of securities and verify that such
determinations are in accordance with FDIC rules. The bank regulator would
focus more on the bank’s ability to hold onto the securities than its intent. If the
bank has a reasonable intent to hold onto its debt securities, which its well-
capitalized nature suggests it does, Generic Bank’s assertion that its securities that
it does not intend to sell (in other words, the rest of Genric’s securities not
mentioned in Figure 4-1) are not impaired still stands.
Page 39
31
iii. Other Factors to Consider
The bank regulator, with more information regarding the individual
securities than were provided in this case, will be able to determine whether the
bank is applying the correct risk factors to the bank’s assets when calculating the
risk-weighted ratio. A bank regulator would need to obtain, for instance, the
investment grades of mortgage-backed securities before determining whether the
bank is well capitalized (“Rules, Regulations, Related Acts”). FASB has recently
implemented a new credit-loss model that will be extensively used by external
auditors in assessing the impairment of securities. According to a publication by
PwC, financial statement preparers under the new model “will need to consider
not only their method for estimating CECL [the new credit loss model], but also
the evidence and documentation their governance and internal control framework
should produce to support their estimates” (Hurden). With this new model in
mind, the external auditor would need physical documentation and evidence
regarding internal controls for impairment of securities as part of the auditing
process – a statement of the financial institution’s methods alone would not
suffice.
Page 40
32
D. Effect of Change in Securities’ Collective and Individual Gain/Loss Positions
on Impairment Assessment from Part A
i. Assuming Securities Sold had been Collectively in a Net Gain
Position
If the securities Generic Bank intended to sell (securities in Figure 4-1)
were collectively in a net gain position, then an impairment loss would still be
recognized on any securities in individual loss positions. This is due to the bank’s
intent to sell the securities in loss positions. Although a reasonable assumption
may exist that the securities could recover their amortized costs, the U.S.
Securities and Exchange Commission reports in Staff Accountancy Bulletin No.
59 that a factor that suggests that impairment of a security has occurred is, “the
intent and ability of the holder to retain its investment in the issuer for a period of
time sufficient to allow for any recovery in market value” (“Codification of Staff
Accounting Bulletins”). Without the intent to hold the securities until the losses
are recovered, the securities in net loss positions must be impaired as FASB staff
has noted that impairment occurs in “situations where the security will be
disposed of before it matures” (“Recognition and Presentation of Other-Than-
Temporary Impairments”).
ii. Assuming Each of the Securities Sold Were in Gain Positions
If each of the securities Generic Bank intended to sell in Part A (Figure 4-
1) were in gain positions, then Generic Bank would not recognize impairment.
The FDIC states that an impairment “occurs when the fair value of the security is
less than its amortized cost basis” (“Accounting News: Other-Than-Temporary
Page 41
33
Impairment of Investment Securities”). If the fair values of all the securities sold
exceed the amortized costs of the securities, then no impairment exists. Although
the bank intended to sell the securities, impairment occurs only when “it is
probable that a creditor will be unable to collect all amounts due according to the
contractual terms of the loan agreement” (“Recognition and Presentation of
Other-Than-Temporary Impairments”). Impairment does not exist under this
assumption, because no reasonable or probable assertion exists that the bank
would not collect all amounts due – the securities’ expected cash flows (fair
values) exceeds their amortized costs. Generic would recognize a gain upon the
sale if the securities listed in Figure 4-1 were each in gain positions. If Generic
Bank’s debt securities which it did not intend to sell (i.e. Generic’s remaining
securities not in Figure 4-1) were in net gain positions, then the held securities
would not be impaired either.
E. Impact of Downgrade in Capitalization Rating from “Well-Capitalized” to
“Adequately Capitalized” on Impairment Loss Assessment
The FDIC categorizes “adequately capitalized” banks one grade below
“well capitalized” banks. If Generic Bank is now assumed to be adequately
capitalized, then it has enough capital to leverage its risk-based assets as well as
its total assets, but it has the bare-minimum necessary to do so. The minimum
leverage ratio to be considered adequately capitalized is four percent, and the
minimum risk-weighted ratio is eight percent, as opposed to minimum five and
ten percent respective leverage and risk-weighted ratio values necessary to be
Page 42
34
considered well capitalized (“Risk Management Manual of Examination Policies”
2.1-8). A slight shift in capital structure or assets would render the bank
undercapitalized.
Under the adequately capitalized assumption, Generic Bank’s ability to
hold onto securities in net loss positions must be reassessed. According to bank’s
financial records, $702 thousand in securities have been in net unrealized loss
positions for over a year (Figure 4-4). Section 2.1 of FDIC’s Risk Management
Manual of Examination policies requires that banks have a comprehensive
strategy for maintaining appropriate levels of capital (“Risk Management Manual
of Examination Policies” 2.1-8).
The bank’s ability to hold onto these securities is hindered by its lack of
capital. While Generic Bank will still have the bare-minimum ability to hold onto
its securities, its strategy and intent will need to be re-evaluated under the lesser,
adequate capital structure. It may be necessary for the bank to liquidate its
securities in order to meet obligations and remain solvent. The FDIC in the
Section 2.1 notes that the FDIC may take formal enforcement actions even against
banks with capital above the minimum amounts, so being adequately capitalized
does not provide Generic Bank the freedom to irresponsibly hold securities (“Risk
Management Manual of Examination Policies” 2.1-7). Aside from those that the
bank sells, there are likely additional impaired securities which the bank would
need to strategically sell due to its only adequate capital structure.
Page 43
35
Conclusion
This case required a careful analysis of FASB, FDIC, and SEC regulation and
guidance. Among other factors, the intent and the ability of Generic Bank to hold onto its
securities were heavily investigated under varied assumptions. Analysis of Generic
Bank’s ability to hold onto securities was focused on the adequacy of its capital structure.
Analysis of the bank’s intent to hold onto securities was focused on the bank’s short and
long-term strategy. Analysis of causes and implications of impairments allowed for a
greater understanding of accounting for securities. A broad summary of findings is as
follows:
• under the assumption that the bank is well capitalized, impairment exists on
securities in net loss positions which the bank intends to sell due to lack of intent
by the bank to recover the amortized costs of the securities.
• Under the same capital structure assumption, securities other than the seven sold
would not be impaired due to the bank’s intent and ability to hold onto securities
that arises from its favorable capital structure.
• Assuming the role of auditors and regulators, the conclusions made in
requirements one and two would not change, but additional information would
need to be gathered before affirming the bank’s impairment claims.
• Securities in net gain positions would not be impaired according to FDIC rules
and regulations, FAS No. 115., and SEC Staff Accountancy Bulletin No. 59.
• Banks with varied capital structures will have varied strategies for holding and
selling securities. Banks with lesser capital structures will need to strategically
sell more securities to free up assets, rendering more securities impaired.
Page 44
36
Appendix A to Case 4
Figure 4-4: Supplemental Investment Securities Available for Sale Information
Amortized
Cost
Gross
Unrealized
Gains
Gross
Unrealized
Losses
Estimated
Fair Value
State/Political 258,246 54,454 (25,792) 286,907
U.S. Treasuries 57,525 0 (5) 57,520
U.S. Agency 25,064 0 (1,345) 23,719
MBS 3,972,606 681,596 (1,118,766) 3,535,436
Other 149,600 8,694 (27,184) 131,110
Total $ 4,463,041 $ 744,743 ($1,173,091) $ 4,034,692
AFS Investment
Securities in Continuous
Unrealized Loss Position
for <12 months
$ 1,148,982
$ 0
($ 471,282)
$ 677,700
AFS Investment
Securities in Continuous
Unrealized Loss Position
for >12 months
$1,586,111
$ 0
($701,809)
$ 884,302
*The information in Figure 4-4 was provided by the case and included in the thesis for reference for analysis
performed in this case study (Cantrell 9).
Page 45
37
Case Five
City Research Case
7 November 2018
Page 46
38
Introduction
This case will comprehensively examine two potential career launching-points:
Nashville, TN and Chicago, IL. These cities vary greatly in size, climate, industries,
culture, and cost of living. The research done in this case made clear the differences
between the two cities and sparked careful thought regarding where to live as I begin to
work full-time. Such thought will ultimately lead to a decision on where to launch a
career. This case offers factors that someone ought to consider when choosing where to
begin a career in accounting.
A. City Climate and Topography
Nashville and Chicago vary greatly in size. Chicago’s 2017 census data
puts its population at over 2.7 million people, compared to Nashville’s near-670
thousand census population. While Nashville’s population is relatively large (25th
largest city by population in the nation), it is only about a quarter of the size of
Chicago (2017 Census Data). The cities’ climates also vary greatly, as Nashville
experiences warm summers and mild winters, with average temperatures reaching
89 degrees in July and falling to 26 degrees in January (“Best Places to Live”).
Chicago, on the other hand, reaches 84 degrees in July and plummets to 14
degrees in January (“Climate for Chicago, IL”). Chicago’s proximity to Lake
Michigan moderates its climate to some extent in the summer, but its winter-time
temperatures are far more extreme than Nashville’s. Chicago receives nine times
as many inches of snow as Nashville. Chicago receives a large amount of
Page 47
39
sunshine in the summer, compared to little in the Winter. The humidity of both
cities is comparable, averaging around 70 percent in both. However, the humidity
is more-so felt in Nashville’s hotter summer temperatures, creating a humid
subtropical climate.
Chicago originally sat at the bottom of Lake Michigan, which caused its
topography to be rather flat. Chicago sits at nearly 600 feet above sea-level. Sand
beaches sit along the shore of Lake Michigan (Willman). Tennessee has varied
topography across the state. While Nashville sits in what is called the “Central
Basin”, a low, flat region, a short drive away from the city will take someone to
the edge of the “Highland Rim”, a region characterized by hills, valleys, and
farmland (Littman). Nashville and Chicago have similar, flat topographies in the
cities, but Nashville’s surrounding areas have more varied topography than
Chicago. Note in the photographs (Figures 5-1 and 5-2), that both cities appear to
be on flat ground, but rolling hills paint the background of the Nashville skyline,
while the background of the Chicago skyline is flat.
Figure 5-1: Chicago Skyline Figure 5-2: Nashville Skyline
Courtesty https://www.cbre.us ©Getty Images / zrfphoto 1
Page 48
40
B. Getting Around
Transportation in the two cities is extremely different. Chicago residents
have public transportation readily available to them. Chicago has the nation’s
second largest public transportation system, with 144 rail stations over town
connecting over 40 communities (“Getting Around Chicago”). Nashville, on the
other hand, has minimal public transportation available. Commutes to work in
Nashville would consist of vehicular commutes ranging from 15 to 45 minutes,
depending on distance and traffic. Commutes in Chicago range from 30 minutes
to an hour on cars, buses, or trains. Additionally, travel home from Chicago to
home in Nashville by air would take one and a half hours, nine hours by car.
Assuming a downtown Nashville living location, driving home to see family
would only take 20 minutes.
C. Prevalent Industries
The prevalent industries in the two cities vary widely. Healthcare,
automobile production, finance, higher ed, insurance, and music production
industries dominate Nashville (“Nashville Statistics and Demographics”). In
Chicago, manufacturing, printing and publishing, finance, insurance, and food
processing dominate (“Chicago: Economy”). Both cities have excellent healthcare
partly due to the prevalence of prestigious universities and research institutions in
both cities. Chicago and Nashville both are on the cutting edge of innovation in
medical research and care. Universities such as University of Chicago and
Page 49
41
Northwestern have specific innovation and startup funds which promote progress
in the medical research field. Chicago has over 26 thousand healthcare related
companies, a 70-billion-dollar industry (Dietsche). No matter the city, Chicago or
Nashville, world-class healthcare will be accessible
D. Living
Chicago has obtained a poor reputation regarding criminal activity.
However, criminal activity is highly centralized to western and southern sides of
Chicago. It is necessary to be diligent no matter where in large city like Chicago,
but dangerous areas can be avoided. The website, neighborhoodscout.com,
attributes a crime index of eight out of 100 to Chicago, but surprisingly only a six
out of 100 to Nashville. This means that Chicago, IL is safer than eight percent of
US cities, while Nashville is safer than only six percent. Areas to avoid in
Nashville include East Nashville and Antioch. Violent crimes occur in Chicago at
a rate of 11.15 out of 1000 people and at a rate of 11.62 out of 1000 in Nashville.
Property crimes occur at a rate of 39.13 out of 1000 people in Nashville,
compared to 32.56 out of 1000 in Chicago (“Neighborhood Scout”). Surprisingly,
at a per capita rate, Nashville’s crime statistics are fairly like Chicago’s. Prior to
research, crime rates were acting as a hinderance to living in Chicago. However,
with due diligence in commutes and living, safety in Chicago is not a major issue.
On deciding where to live in Nashville and Chicago, three factors need be
considered: crime level, distance from city-center, and rent prices. Nashville rents
tend to be lower than Chicago’s on average. Chicago rent hovers around an
Page 50
42
average rate of $1,808 compared to Nashville’s average rate of $1,275
(“RENTCafe”). Three Chicago neighborhoods stood out with these factors taken
into consideration: Edison Park, Evanston, Clarendon Hills. Rents in the three
areas hover around $1,200 to $1,700 per month. The cheapest of the three options
is Edison Park, the most expensive being Evanston. Both neighborhoods sit on the
Eastern side of the city. Clarendon Hills is more of a suburban area, northwest of
the city. Assuming a $50,000 salary, having a roommate to split the cost of rent
would be necessary in Nashville and in Chicago. With rents, crime rates, and
proximity to downtown considered, Nashville has better living options than
Chicago. While Nashville rents have grown over the past decade, it is easier to
live closer to the city-center for cheaper and safer in Nashville than it is in
Chicago. Below are affordable living options in Chicago and Nashville (Zillow,
Inc.):
Figure 5-3: Affordable Chicago Living
Evanston –
2 bed, 2 bath, 800 sqft
$1,695/month
Edison Park –
2 bed, 1 bath, 950 sqft
$1,250/month
Page 51
43
Figure 5-3 (contd.)
Figure 5-4: Affordable Nashville Living
All units sampled had either shared laundry in the buildings or laundry
machines in the individual units. While an in-unit laundry set up would be ideal, it
is not a deal-breaker. In Chicago, Jewel-Osco, Whole Foods, and ALDI
supermarkets can be found near most areas. It is also common in Chicago to
stumble upon small, family-owned grocery stores. Nashville has Publix, Kroger,
Clarendon Hills –
2 bed, 2 bath, 1050 sqft
$1,430/month
Midtown –
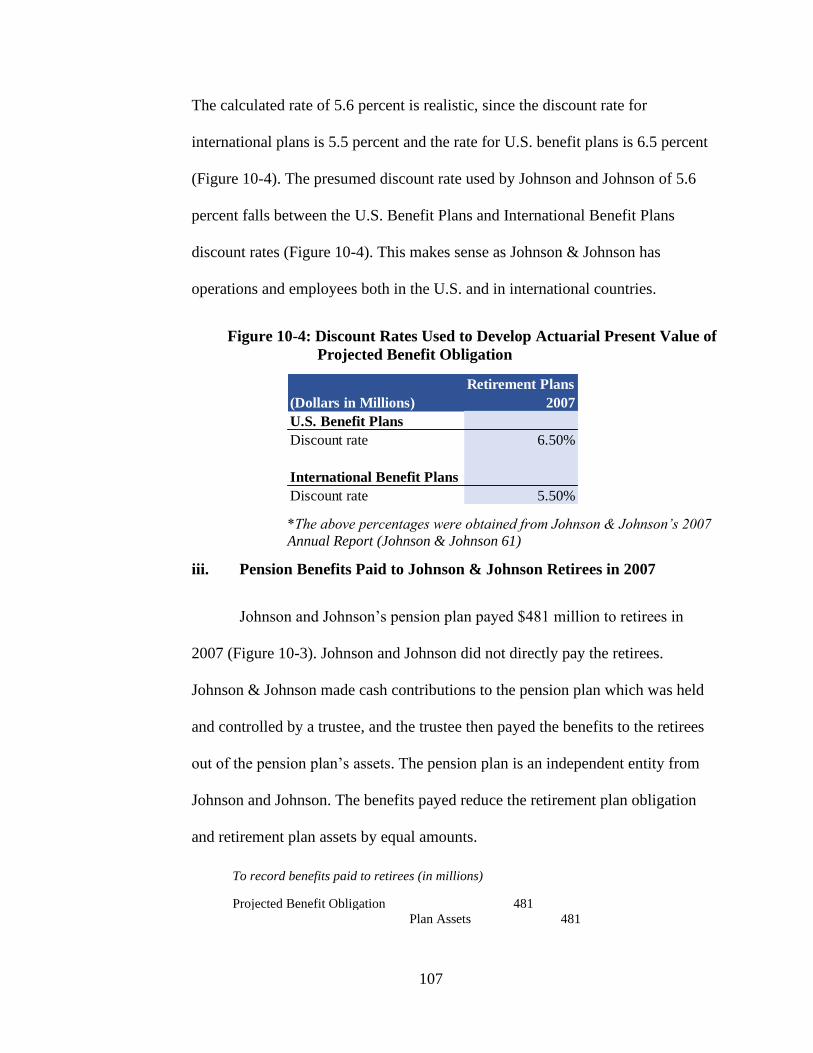
2 bed, 2 bath, 750 sqft
$1,350/month
Sylvan Park –
2 bed, 2 bath, 980 sqft
$1,500/month
Page 52
44
and Harris-Teeter supermarkets in most areas. Nashville has mostly chain
supermarkets with few family-owned stores.
E. Lifestyle
How free time is spent in a respective city will play a large role in
determining ultimate satisfaction with living in a city. Fortunately, both cities are
ripe with entertainment and charitable/religious in which to spend and invest
one’s time. Both cities have professional football, basketball, hockey, baseball,
and soccer teams. Nashville has a Minor League but not a Major League Baseball
(MLB) franchise, while Chicago has two. In a few years, Nashville will have a
Major League Soccer team and Chicago already has one. Both cities have plenty
of live music venues. Chicago has popular spots such as the Navy Pier and
Millennium Park, while Nashville has plenty of scenic parks outside of the city.
Intriguing religious and charitable organizations in Nashville include:
Habitat for Humanity, Westminster Presbyterian Church, and Preston Taylor
Ministries. Habitat for Humanity is an organization which organizes volunteers to
build homes on weekends for those in need. Westminster Presbyterian Church is a
large church near downtown Nashville which attracts people from various areas
of Nashville. Preston Taylor Ministries is an after-school program which provides
children in low-income areas with tutoring and mentor relationships.
Intriguing religious and charitable organizations in Chicago include:
Second Presbyterian Church Chicago, Bridge Communities, Inspiration
Corporation. Second Presbyterian Church Chicago is a medium-size Presbyterian
Page 53
45
church in Chicago. Bridge Communities is a non-profit organization which
houses, mentors, and empowers homeless families, with the goal of moving the
families toward self-sufficiency (“Bridge Communities – Who We Are”).
Inspiration Corporation is a similar organization that caters more toward homeless
individuals, not just families. No matter the city, there will be plenty of different
ways to spend free time.
F. Cost of Living
Chicago has a higher cost of living than does Nashville, essentially due to
its high taxes. Illinois has a flat, five percent income tax across the state, while
Tennessee does not have a state income tax. Chicago’s property taxes sit at
around two percent, while Nashville’s ranges from around 2.8 percent to 3.2
percent of the assessed value (25 percent of the appraised value) depending on
proximity to the downtown district. Sales taxes in Chicago sit around 10 percent,
while Nashville’s sits at nine percent. Food and groceries in Chicago are subject
to an additional two percent tax (SmartAsset).
Although accounting starting salaries are far above average when
compared to other careers, living off $50,000 to $60,000 per year requires careful
budgeting and planning. Different cities cost different amounts to live in. In order
to make an informed decision on where to live immediately after college, it is
important to investigate the differences in costs of living in different cities.
Chicago and Nashville have extremely different costs of living, as the personal
operating budgets in Figures 5-5 and 5-6 demonstrate.
Page 54
46
Figure 5-5: Operating Budget – Chicago
Monthly Income $5,000
Taxes:
Federal Income (15.23%) 761.63
State Income (4.95%) 247.50
Total Taxes 1009.13
FICA:
Social Security 310
Medicare 73
Total FICA withholdings 383
Take-Home Pay 3,607.87
Rent 800
Fuel Cost 121.83
Utilities 121.16
Internet 40.14
Food 500
Health Insurance 244
Car Insurance 93.88
401(k) Contribution 250
Discretionary Income 1,436.86
Figure 5-6: Operating Budget – Nashville
Monthly Income $5,000
Taxes:
Federal Income (15.23%) 761.63
FICA:
Social Security 310
Medicare 73
Total FICA Withholdings 383
Take-Home Pay 3,855.37
Rent 600
Fuel Cost 61.50
Utilities 132.76
Internet 40.14
Food 500
Health Insurance 225
Car Insurance 61.46
401(k) 250
Discretionary Income 1,984.51
*Taxes and FICA, Internet, Utilities via SmartAsset; Rent via RENTCafe averages; Fuel
cost est. with Edmunds.com; health insurance est via valuepenguin.com; auto insurance
est via quotewizard.com; 401k via KPMG benefits plan
Page 55
47
Due to higher rents, insurance costs, total fuel costs (due to longer driving
distances), and taxes, Chicago’s cost of living is significantly higher than
Nashville’s, resulting in over $500 less of discretionary income than could be
expected in Nashville. When making $5,000 per month, an extra $500 in personal
expenses amounts to an extra ten percent of income that is lost when living in
Chicago. This budget does not consider the over one percent higher sales tax in
Chicago compared to Nashville. Therefore, discretionary income in Nashville
would go farther than it would in Chicago.
Conclusion
After extensively researching facts related to Chicago and Nashville, I could still
see myself living in both cities. However, due to the lower cost of living, warmer climate,
and smaller size, Nashville has emerged as my favorite. Having grown up in Nashville,
seeking out new opportunities and new experiences in Chicago is still intriguing. For this
reason, I am still considering Chicago as an initial launching point, with Nashville in
mind as a landing place ten years or so after launching a career. As expenses increase
with starting a family, Nashville’s lower cost of living would be financially easier to raise
a family. This case study, while not accounting-centric, does provide analysis that is
necessary to consider when beginning to launch a career.
Page 56
48
Case Six
Capitalized Costs versus Expenses
16 November 2018
Page 57
49
Introduction
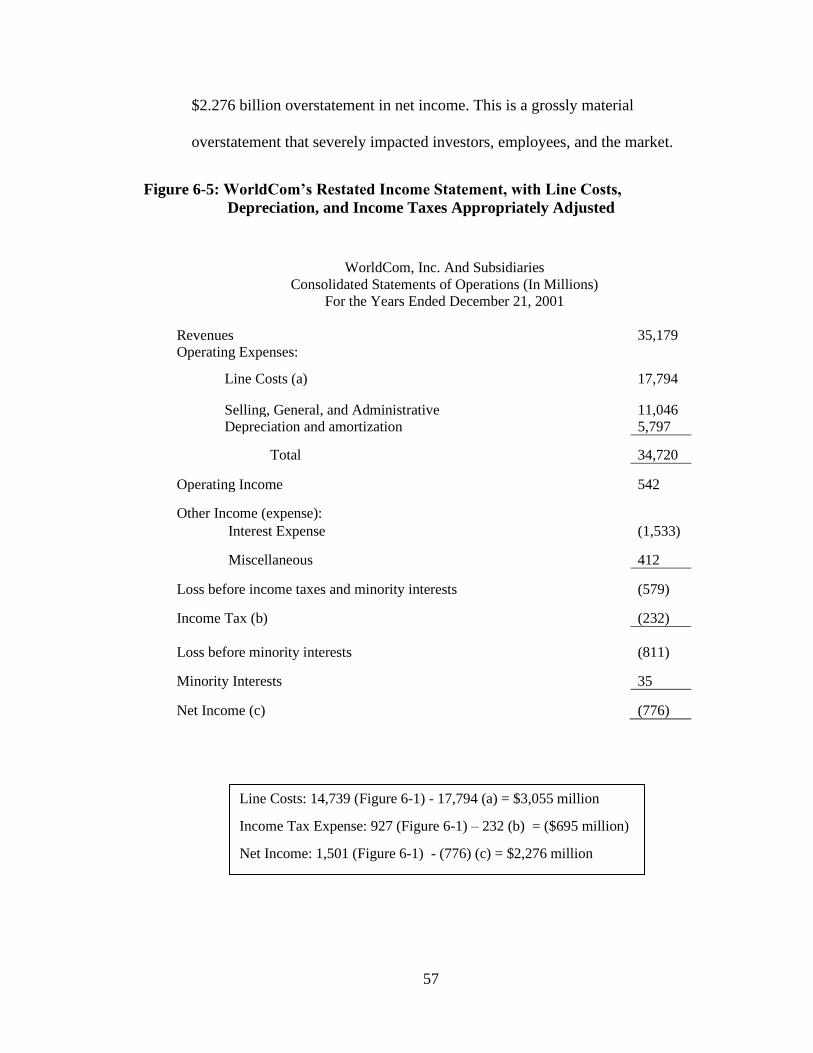
This case will explore the fraudulent errors in WorldCom, Inc.’s accounting
that led to its historic fall as a company in the early 2000s. Analysis of WorldCom,
Inc.’s accounting failures demonstrates the differences between what constitutes an
asset (capitalized cost) and what constitutes an expense and why correct
categorization of an asset or an expense is severely important for external users of
financial statements. This case study of WorldCom will demonstrate how financial
statement users interpret assets differently than expenses. Additionally, this case
demonstrates the impacts and consequences of the mischaracterization of an asset for
the balance sheets, income statements, and statement of cash flows.
A. Assets and Expenses
According to the FASB Statement of Concepts No. 6, paragraph 25, assets
are defined as “probable future benefits obtained or controlled by a particular
entity as a result of past transactions or events.” According to paragraph 80 of
the same statement, “Expenses are outflows or other using of assets or
incurrences of liabilities (or a combination of both) from delivering or producing
goods, rendering services, or carrying out other activities that constitute the
entity’s ongoing major or central operations” (FASB).
An cost would be recorded as an asset if three characteristics of the
expenditure are present, according to the FASB Statement of Concepts No. 6: (1)
it embodies a probable future benefit that involves a capacity, singly or in
combination with other assets, to contribute directly or indirectly to future net
Page 58
50
cash inflows, (2) a particular entity can obtain the benefit and control others’
access to it, and (3) the transaction or other event giving rise to the entity’s right
to or control of the benefit has already occurred (FASB). As an organization
consumes a resource, it recognizes an expense. If the costs do not provide future
benefit to the organization in cash flows, then the company must recognize the
costs as expenses. According to the GAAP expense recognition principle,
expenses should be recognized so that they are matched with the revenues to
which they are related. Costs related to assets are capitalized, then gradually
expensed over the asset’s useful life via amortization or depreciation as the
organization benefits from the asset.
B. What Becomes of “Costs” After Their Initial Capitalization
When costs are capitalized, they are added to an asset account. Therefore,
when initially incurred, the costs appear on the balance sheet as opposed to
expenses on the income statement. However, these capitalized costs will
eventually make their way to the income statement as depreciation expense in
future periods. Instead of the costs hitting the income statement all at once as
period costs, the costs will gradually hit the income statement over the course of
the useful life of the asset for which the costs were capitalized. Capitalizing
expenses results in higher bottom lines in the periods in which they are incurred.
Page 59
51
C. WorldCom, Inc. Statement of Operations – Line Costs
For the year ended December 31, 2001, WorldCom reported line costs of
$14.739 Billion on its Statement of Operations(Figure 6-1). The journal entry for
these costs are as follows (in millions):
Line Cost 14,739
Cash 14,739
WorldCom paid these line costs to other telecommunication providers to gain
access to their infrastructure and networks. These costs immediately hit the income
statements in the form of expenses. This entry increases expenses, decreases income,
decreases assets (cash), and decreases equity.
Page 60
52
Figure 6-1: WorldCom, Inc. Consolidated Statement of Operations (as reported) for
the Year Ended December 31, 2001
2000 2001
Revenues 39,090$ 35,179$
Operating Expenses:
Line costs 15,462 14,739
Selling, general and administrative 10,597 11,046
Depreciation and amortization 4,878 5,880
Other charges - -
Total 30,937 31,665
Operating income 8,153 3,154
Other income (expense):
Interest expense (970) (1,533)
Miscellaneous 385 412
Income before income taxes, minority interests and
cumulative effect of accounting change 7,568$ 2,393$
Provision for income taxes 3,025 927
Income before minority interests and cumulative
effect of accounting change 4,543$ 1,466$
Minority interests (305) 35
Income before cumulative effect
of accounting change 4,238$ 1,501$
Cumulative effect of accounting
change (net of income tax of $50 in 2000) (85) -
Net income 4,153$ 1,501$
For the Years Ended
December 31,
WORLDCOM, INC. AND SUBSIDIARIES
STATEMENT OF OPERATIONS
(In Millions, Except Per Share Data)
*The above WorldCom, Inc. Consolidated Statement of Operations (Figure 6-1) was obtained
from the U.S. Securities and Exchange Commission’s online EDGAR database (WorldCom, Inc.
F3) and provided in the thesis as a reference for analysis performed in case study six.
D. Improperly Capitalized Costs
It was later revealed after WorldCom released their 2001 financial
statements that WorldCom improperly capitalized some of their line costs and that
Page 61
53
the line cost income statement account should have been much larger than $14
billion in 2001 (Figure 6-1). According to the Wall Street Journal article, the
once-booming telecommunications market became over-saturated around 2001
and left the market with excess capacity in fiber-optic networks (Sandberg and
Blumenstein). WorldCom took advantage of this excess capacity by leasing
access to third-parties’ telephone lines. This access was used to carry the calls of
WorldCom’s customers. Therefore, to properly match the expenses incurred by
these lease agreements to revenues generated by this additional capacity, the costs
should have been expensed immediately. Additionally, since these individual
lease payments were not providing WorldCom with future benefit, they should
have been expensed as incurred, rather than capitalized and amortized.
E. Impacts of Improper Capitalization on WorldCom Balance Sheet and
Statement of Cash Flows
“Transmission equipment” on WorldCom’s Balance Sheet increased by
$3.526 billion between 2000 and 2001 (Figure 6-2), as WorldCom began to
inappropriately capitalize line costs. These costs incorrectly appear under
Property and Equipment. WorldCom received only access to and not ownership of
the third-parties’ networks through their contractual arrangements. Since the line
costs were unjustly classified as investments in property, plant, and equipment,
WorldCom understates its cash flows from investing activities. The line costs
should have impacted the operating section of the cash flow statement and
therefore the capitalization overstates the cash flows from operating activities.
Page 62
54
Figure 6-2: WorldCom, Inc. Consolidated Balance Sheet (as reported) for the
Year Ended December 31, 2001
2000 2001
ASSETS
Current assets:
Cash and cash equivalents $761 $1,416
Accounts receivable, net of allowance
for bad debts of $1,532 in 2000 and $1,086 in 2001 6,815 5,308
Deferred tax asset 172 251
Other current assets 2,007 2,230
Total current assets 9,755 9,205
Property and Equipmet:
Transmission equipment 20,288 23,814
Communications equipment 8,100 7,878
Furniture, fixtures, and other 9,342 11,263
Construction in progress 6,897 5,706
44,627 48,661
Accumulated depreciation (7,204) (9,852)
Goodwill and other intangible assets 46,594 50,537
Other assets 5,131 5,363
Total Assets 98,903$ 103,914$
LIABILITIES AND SHAREHOLDERS' INVESTMENT
Current liabilities:
Short-term debt and current maturities
of long-term debt 7,200$ 172$
Accrued interest 446 618
Accounts payable and accrued
line costs 6,022 4,844
Other current liabilities 4,005 3,576
Total current liabilities 17,673 9,210
Long-term liabilities, less current portion:
Long-term debt 17,696$ 30,038$
Deferred tax liability 3,611 4,066
Other liabilities 1,124 576
Total long-term liabilities 22,431 34,680
Minority interests 2,592 101
Company obligated mandatorily redeemable
and other preferred securities 798 1,993
Shareholders' investment:
WorldCom, Inc. common stock, par value $.01 per share; 29 -
authorized: 5,000,000,000 shares in 2000 and none in
2001; issued and outstanding: 2,887,960,378 shares in
2000 and none in 2001
WorldCom group common stock, par value $.01 per share;
authorized: none in 2000 and 4,850,000,000 shares in
2001; issued and outstanding : none in 2000
and 2,967,436,680 shares in 2001 - 30
MCI group common stock, par value $.01 per share;
authorized: none in 2000 and 150,000,000 shares in
2001;
issued and outstanding: none in 2000 and 118,595,711
in 2001
- 1
Additional paid-in capital 52,877 54,297
Retained Earnings 3,160 4,400
Unrealized holding gain (loss) on marketable equity securities 345 (51)
Cumulative foreign currency translation adjustment (817) (562)
Treasury stock, at cost, 6,765,316 shares of
WorldCom, Inc. in 2000, 6,765,316 shares of (185) (185)
Total shareholders' investment 55,409 57,930
Total liabilities and shareholders' investmentA51:A54 98,903$ 103,914$
For the Years Ended
December 31,
WORLDCOM, INC. AND SUBSIDIARIES
CONSOLIDATED STATEMENTS OF OPERATIONS
(In Millions, Except Per Share Data)
Page 63
55
*The WorldCom, Inc. Consolidated Balance Sheet (Figure 6-2) was obtained from the U.S.
Securities and Exchange Commission’s online EDGAR database (WorldCom, Inc. F4) and
provided in the thesis as a reference for analysis performed in case study 6.
The improper capitalization journal entries over the course of the year
(summarized in Figure 6-3) increased property and equipment assets (transmission
equipment) and decreased current assets (cash). Unlike the entry to line costs illustrated
in Part C, equity was not affected by the entry (Figure 6-3) in the period in which it is
capitalized. It will impact equity in later periods by way of depreciation expense
Figure 6-3: Summarization of Journal Entries Related to the Improper
Capitalization of Line Costs
Transmission Equipment 3,055,000,000
Cash 3,055,000,000
F. 2001 Depreciation Related to Improperly Capitalized Line Cost
Expenditures
When capitalized, the costs in question appear on the income statement in
2001 in the amount of $83 million as depreciation expense (Figure 6-4), which
pales in comparison to the $3.055 billion that should have been expensed and
charged to line costs by a debit to line costs (expense) instead of transmission
equipment (asset) in Figure 6-3.
Page 64
56
Figure 6-4: Calculation of Depreciation
Depreciation Equation for Quarter n Expenditures:
Expenditure Amount
Midpoint of Range for Transmission Equipment ( 40−4
2 + 4)
* [ portion of year
depreciated ( 4−𝑛+1
4 quarters) ]
Quarter 1 Expenditures: $771 Million / 22 years * 4
4 quarters = $ 35.045 Million
Quarter 2 Expenditures: $610 Million / 22 years * 3
4 quarters = 20.795 Million
Quarter 3 Expenditures: $743 Million / 22 years * 2
4 quarters = 16.886 Million
Quarter 4 Expenditures: $931 Million / 22 years * 1
4 quarters = 10.580 Million
2001 Depreciation Related to Improper Capitalizations $ 83.306 Million
2001 Depreciation Entry:
G. Analysis of Restated Income Statement (Figure 6-5) versus Original Income
Statement (Figure 6-1)
The difference between WorldCom’s corrected net income (Figure 6-5) and
its originally reported income (Figure 6-1) is certainly material. WorldCom
reported a net income of $1.5 billion in 2001 (Figure 6-1). The improper
capitalizations understated line costs by $3.055 billion (Figure 6-3), overstated
depreciation and amortization expense by $83.306 million (Figure 6-5), and
overstated income taxes by $695 million. Once these adjustments are made,
WorldCom’s bottom line plummets from a $1.5 billion income (Figure 6-1) to a
$776 million loss (Figure 6-5). These improper accounting practices resulted in a
Depreciation Expense 83,306,000
Accumulated Depreciation –
Transmission Equipment 83,306,000
Page 65
57
$2.276 billion overstatement in net income. This is a grossly material
overstatement that severely impacted investors, employees, and the market.
Figure 6-5: WorldCom’s Restated Income Statement, with Line Costs,
Depreciation, and Income Taxes Appropriately Adjusted
WorldCom, Inc. And Subsidiaries
Consolidated Statements of Operations (In Millions)
For the Years Ended December 21, 2001
Revenues 35,179
Operating Expenses:
Line Costs (a) 17,794
Selling, General, and Administrative 11,046
Depreciation and amortization 5,797
Total 34,720
Operating Income 542
Other Income (expense):
Interest Expense (1,533)
Miscellaneous 412
Loss before income taxes and minority interests (579)
Income Tax (b) (232)
Loss before minority interests (811)
Minority Interests 35
Net Income (c) (776)
Line Costs: 14,739 (Figure 6-1) - 17,794 (a) = $3,055 million
Income Tax Expense: 927 (Figure 6-1) – 232 (b) = ($695 million)
Net Income: 1,501 (Figure 6-1) - (776) (c) = $2,276 million
Page 66
58
Conclusion
This case study demonstrated the snowball effect that a mischaracterization of
expenses as capitalized costs causes. Even though the $3.055 billion in line costs were
represented on WorldCom’s financial statements, representing them in the wrong section
(assets instead of expenses) makes an over $2 billion difference in Income. This case also
demonstrated the significance of the timing of expense recognition. By not recognizing
the expenses as incurred, WorldCom pushed them off to succeeding periods by means of
depreciation expense. Although expenses related to the line costs were eventually
recognized as depreciation expense, the mistiming of this recognition exponentially
inflated WorldCom’s income in 2001. This case study of WorldCom illustrated the
devastating shockwaves that are sent out by the misapplication of accounting principles.
Page 67
59
Case Seven
Financial Statement Interpretation and Analysis
6 March 2019
Page 68
60
Introduction
The objective of this case is three-fold. The first objective is to become familiar
with a set of financial statements including auditor opinions and significant accounting
policy footnotes. The second objective is to perform a basic analysis and interpretation of
the financial statements and balance sheets. The last objective is to recognize the role of
estimation in the preparation of financial statements. To accomplish these objectives, this
case will use and analyze Starbucks Corporation and its financial statements from the
fiscal year ended 2013.
A. Nature of Starbucks’s Business
Starbucks purchases and roasts high-quality coffees that it sells, along
with handcrafted coffee and tea beverages and a variety of fresh food items,
through its company-operated stores. It also sells a variety of coffee and tea
products and licenses its trademarks through other channels such as licensed
stores, grocery and national foodservice accounts (Starbucks Corporation 48). It
categorizes its operations by Company-operated Stores, Licensed Stores,
Consumer Packaged Goods, and Foodservice. Starbucks’ primary source of
revenue comes from sales in its Company-operated retail stores (79 percent of
total net revenues in 2013). Product sales to and royalty and license fee revenues
from Starbucks’ licensed stores are the next largest source of revenue nine percent
of total net revenues, and consumer packaged goods sold to grocery stores, etc.
accounted for seven percent of total net revenues. Starbucks controls “purchasing,
roasting and packaging, and the global distribution” of coffee used in its
Page 69
61
operations (Starbucks Corporation 7). Therefore, Starbucks’ business can be
described as that of retail (company-operated stores) and supply/marketing
(licensed stores, consumer packaged goods, foodservice).
B. Consolidated Financial Statements Overview
Typically, companies prepare in their annual 10-k reports the US
Securities Exchange Commission (SEC) the following: Income Statement
(Including Comprehensive Income if applicable), Balance Sheet, Statement of
Cash Flows, Statement of Stockholders’ Equity and notes to the financial
statements. Starbucks provides the following titles for these statements:
Consolidated Statements of Earnings (Consolidated Income Statement),
Consolidated Statements of Comprehensive Income, Consolidated Balance
Sheets, Consolidated Statements of Cash Flows. The “Consolidated” title is
necessary when a company owns a greater than 50 percent stake in another
company. In a consolidated statement, Starbucks reflects its financial position and
operating results by including its wholly owned subsidiaries and investees which
Starbucks controls or has significant influence over.
C. Financial Statement Reporting
Publicly traded corporations are required to prepare quarterly reports (10-
Q), annual reports (10-K), and a report when a significant business event occurs,
such as an acquisition, in an 8-K report. These filings are regulated by the SEC in
the United States.
Page 70
62
D. Financial Statement Uses
Financial statements are prepared internally by Starbucks management and
verified externally by an independent public accounting firm. Additionally, the
CEO and CFO bear the ultimate responsibility for the validity of the statements,
as they are required to sign off on the report as required by The Sarbanes-Oxley
Act of 2002.
The financial statements are primarily used by shareholders of the company.
Since the shares of the company are traded in a public market, companies are
required to provide the financial statements by the SEC. Current and potential
shareholders will be interested in the company’s earnings (especially the earnings
per share). Investors will also be interested in knowing balance sheet information
such as the liquidity (ability to easily turn assets into cash) and solvency (ability
to meet long-term obligations) of the company.
Additionally, creditors will use these reports before lending money to
Starbucks. Potential lenders will look for companies with high solvencies to lend
money to, in order to minimize bad debt expenses that may arise from the debtor
failing to fulfill its obligations.
Financial statement users will investigate the notes to the financial
statements in addition to the financial statements to obtain a greater understanding
of the company’s financial standing and performance than the financial statements
alone could provide.
Page 71
63
E. External Audit
Deloitte & Touche LLP are Starbucks’ external auditors and provided two
opinion letters to Starbucks in 2013.
In the first letter, Deloitte’s Seattle office assumes the responsibility of
expressing an opinion on Starbucks’ financial statements, based on its audits.
Deloitte makes the important distinction that while it is its responsibility to
provide a responsible opinion on the financial statements, the financial statements
themselves are the responsibility of Starbucks’ management. Deloitte makes clear
that its audits are based on the standards as put forth by the Public Company
Accounting Oversight Board (PCAOB). Finally, Deloitte’s Seattle office issues an
opinion that Starbucks’ consolidated financial statements present fairly the
financial position of Starbucks Company and its subsidiaries, as of September 29,
2013 (Starbucks Corporation 77).
In the second letter, Deloitte issues an opinion on Starbucks’ internal
controls as required by the PCAOB’s auditing standards. Deloitte establishes that
the expressed opinion on Starbucks’ internal controls are Deloitte’s responsibility,
while the internal controls themselves are the responsibility of Starbucks.
Deloitte’s internal control audit is guided by Internal Control – Integrated
Framework (1992). Deloitte defines internal controls and its limitations. Finally,
Deloitte issues the opinion that “in all material respects, effective internal control
over financial reporting as of September 29, 2013” (Starbucks Corporation 79).
These opinions are issued several months after Starbucks’ fiscal year end
Page 72
64
(Sept. 29), because the audit takes place after the preparation of Starbucks’
financial statements as of year-end.
F. Starbucks Balance Sheet Analysis (Balance Sheet – Figure 7-2)
i. Assets = Liabilities + Equity
Total liabilities are 61 percent of total assets and total equity is 39 percent
of total assets, so combined they equal 100 percent of assets (Figure 7-2).
Therefore, total liabilities and equity are equal to total assets, and Starbucks
accounting equation balances.
ii. Asset Analysis
For 2013, the three largest categories of assets are property, plant and
equipment, net (28 percent); cash and cash equivalents (22 percent); and
inventories (10 percent) (Figure 7-2). Current assets are 48 percent of total assets,
and noncurrent assets are 52 percent (Figure 7-2). Property, plant and equipment
being the largest category of assets is certainly appropriate for a company like
Starbucks, who owns over 10 thousand stores across the world (Starbucks
Corporation 4). It is also appropriate that Starbucks would have a nearly equal
share of current and noncurrent assets, since Starbucks owns a lot of property,
plant and equipment, but also must maintain large levels of inventories and cash
as a retail business.
Page 73
65
iii. Intangible Assets Analysis
Intangible assets are non-financial instruments that lack physical existence
(Kieso 614). Starbucks reports goodwill as the excess of the price paid by
Starbucks over the fair value of the net assets of previously-acquired businesses.
Goodwill is obtained only when Starbucks purchases another company but can
become impaired. Starbucks reports goodwill as 7.49 percent of its total assets
and other intangible assets as 2.39 percent of total assets. These other intangible
assets likely include trademarks that Starbucks holds over its merchandise. Total
intangible assets equal nearly ten percent of Starbucks’s total assets.
iv. Starbucks Financing Analysis
Starbucks is financed 61.08 percent by liabilities and 38.92 percent by
equity. Long-term debt counts as 11.28 percent of total assets, while contributed
capital from owners counts as only 2.46 percent of total assets. Non-owners
primarily finance Starbucks’ operations by issuing Starbucks debt, as shown in
Figure 7-1.
Figure 7-1: Starbucks Corporation Financing
Owners Non-owners
Page 74
66
Figure 7-2: STARBUCKS CORPORATION
COMMON-SIZE CONSOLIDATED BALANCE SHEETS
(in millions, except per share data)
*Starbucks Corporation’s Balance Sheet (above) was obtained from The U.S. Securities and Exchange
Commission’s EDGAR Database and then made into a common-size statement by dividing all assets,
liabilities, and equity by total assets, liabilities, and equity respectively (Starbucks Corporation 47).
Sep. 29, 2013 Sep. 30, 2012
Assets
Current assets: Cash and cash equivalents 22.36% 14.46%
Short-term investments 5.71% 10.32%
Accounts receivable, net 4.87% 5.91%
Inventories 9.65% 15.10%
Prepaid expenses and other current assets 2.50% 2.39%
Deferred income taxes, net 2.41% 2.90%
Total current assets 47.51% 51.09%
Long-term investments 0.51% 1.41%
Equity and cost investments 4.31% 5.60%
Property, plant and equipment, net 27.79% 32.35%
Deferred income taxes, net 8.40% 1.18%
Other assets 1.61% 1.76%
Other intangible assets 2.39% 1.75%
Goodwill 7.49% 4.86%
TOTAL ASSETS 100.00% 100.00%
Liabilities and Equity
Current liabilities: Accounts payable 4.27% 4.84%
Accrued litigation charge 24.17% 0.00%
Accrued liabilities 11.02% 13.79%
Insurance reserves 1.55% 2.04%
Deferred revenue 5.68% 6.21%
Total current liabilities 46.69% 26.89%
Long-term debt 11.28% 6.69%
Other long-term liabilities 3.11% 4.20%
Total liabilities 61.08% 37.77%
Shareholders' equity: Common stock ($0.001 par value) - authorized, 1,200.0
shares; issued and outstanding, 753.2 and 749.3 shares
(includes 3.4 common stock units), respectively 0.01% 0.01%
Additional paid-in capital 2.45% 0.48%
Retained earnings 35.86% 61.40%
Accumulated other comprehensive income 0.58% 0.28%
Total shareholders' equity 38.90% 62.16%
Noncontrolling interests 0.02% 0.07%
Total equity 38.92% 62.23%
TOTAL LIABILITIES AND EQUITY 100.00% 100.00%
Page 75
67
G. Starbucks Revenue Recognition
Starbucks follows accrual accounting. Starbucks recognizes revenues at
the point of sale for company-operated stores, because they transfer goods and
earn revenue at the point of sale. In the case of in-store transactions, there is little
difference between cash and accrual revenue recognition principles. Starbucks
recognizes revenues from licensed stores “upon shipment to licensees, depending
on contract terms” which indicates Starbucks subscription to the accrual
accounting method for revenue recognition. Starbucks records outstanding
balances on gift cards as unearned revenue and recognizes revenue on the stored
value cards when the cards are presented for payment or when the “likelihood of
redemption, based on historical experience is deemed to be remote” (Starbucks
Corporation 52).
H. Starbucks Expense Analysis
Cost of sales including occupancy costs (43 percent) and store operating
expenses (29 percent) account for a combined 72 percent of total net revenues
(Figure 7-3). Occupancy costs are primarily rents, which would make sense that
this would be a major expense for Starbucks. With so many stores across the
world, its rent costs will naturally be very high. Especially since Starbucks has
multiple stores in major cities, where rents are high. Cost of sales includes food
and drink materials costs, so Starbucks high expense in this area falls in line with
the nature of Starbucks’s business.
Page 76
68
Figure 7-3: STARBUCKS CORPORATION
COMMON-SIZE CONSOLIDATED STATEMENTS OF EARNINGS
(in millions, except per share data)
*Starbucks Corporations Income Statement was obtained from The U.S. Securities And Exchange
Commission’s EDGAR Database and then made into a common-size statement (above) by dividing all
revenues and expenses by total revenues (Starbucks Corporation 45).
12 Months Ended
Sep. 29, 2013 Sep. 30, 2012
Net revenues: Company-operated stores 79.19% 79.21%
Licensed stores 9.14% 9.10%
CPG, foodservice and other 11.67% 11.69%
Total net revenues 100.00% 100.00%
Cost of sales including occupancy costs 42.86% 43.71%
Store operating expenses 28.78% 29.46%
Other operating expenses 3.07% 3.23%
Depreciation and amortization expenses 4.17% 4.14%
General and administrative expenses 6.30% 6.02%
Litigation charge 18.70% 0.00%
Total operating expenses 103.87% 86.57%
Gain on sale of properties 0.00% 0.00%
Income from equity investees 1.69% 1.58%
Operating income (2.19%) 15.02%
Interest income and other, net 0.83% 0.71%
Interest expense (0.19%) (0.25%)
Earnings before income taxes (1.54%) 15.48%
Income taxes (1.60%) 5.07%
Net earnings including noncontrolling interests 0.06% 10.41%
Net earnings attributable to noncontrolling
interest 0.00% 0.01%
Net earnings attributable to Starbucks 0.06% 10.40%
Earnings per share - basic 0.00% 0.01%
Earnings per share - diluted 0.00% 0.01%
Weighted average shares outstanding:
Basic 749.3 754.4
Diluted 762.3 773.0
Cash dividends declared per share 0.01% 0.01%
Page 77
69
I. Cost Structure Changes
Most costs for Starbucks were consistent across 2012 and 2013. However,
in 2013 Starbucks incurred a litigation charge that accounted for 18.7 percent of
Starbucks’ total revenues (Figure 7-3). This significant charge ultimately resulted
in Starbucks’ operating loss of 2.19 percent of total net revenues for 2013. This
litigation charge resulted from litigation with Kraft Foods Global, Incorporated
(Starbucks Corporation 21).
J. Litigation Charge
Starbucks’s ligation charge resulting from its arbitration with Kraft was
indicated separately, because it is an unusual expense that is not typically incurred
as a general and administrative expense. Due to the matching principle set forth
by GAAP, which states that expenses should be recognized so that they match
revenues, Starbucks must recognize this litigation charge as an operating expense.
K. Profitability Analysis
Starbucks reported net earnings attributable to Starbucks of $8.3 million in
2013 and $1.3 billion in 2012 (Figure 7-4). Starbucks reported an operating loss
of $325 million in 2013, down from its operating income around $2 billion in
2012 (Figure 7-4). Since Starbucks was operating at a loss in 2013, it was not
profitable. The large litigation charge of $2.784 billion related to arbitration with
Kraft is the sole reason that Starbucks was not profitable in 2013 (Starbucks
Page 78
70
Corporation 18). Starbucks should return to earning a profit in 2014 barring any
other major events. The company earned a net income of $8.3 million only
because of a $238.7 million tax break that it received. Starbucks’s loss before
taxes was $229.9 million (Figure 7-4). If a company cannot generate a profit
through its core operations, then it is not a profitable company. Largely, Starbucks
is a profitable company, but it was not in 2013 due to the litigation charge related
to the conclusion of its litigation with Kraft.
Sep. 29,
2013
Sep. 30,
2012
Oct. 02,
2011
Net revenues:
Company-operated stores $11,793.20 $10,534.50 $9,632.40
Licensed stores 1,360.50 1,210.30 1,007.50
CPG, foodservice and other 1,738.50 1,554.70 1,060.50
Total net revenues 14,892.20 13,299.50 11,700.40
Cost of sales including occupancy costs
6,382.30 5,813.30 4,915.50
Store operating expenses 4,286.10 3,918.10 3,594.90
Other operating expenses 457.20 429.90 392.80
Depreciation and amortization expenses 621.40 550.30 523.30
General and administrative expenses 937.90 801.20 749.30
Litigation charge 2,784.10 - -
Total operating expenses 15,469.00 11,512.80 10,175.80
Gain on sale of properties - - 30.20
Income from equity investees 251.40 210.70 173.70
Operating income (325.40) 1,997.40 1,728.50
Interest income and other, net 123.60 94.40 115.90
Interest expense (28.10) (32.70) (33.30)
Earnings before income taxes (229.90) 2,059.10 1,811.10
Income taxes (238.70) 674.40 563.10
Net earnings including noncontrolling
interests 8.80 1,384.70 1,248.00
Net earnings attributable to
noncontrolling interest 0.50 0.90 2.30
Net earnings attributable to Starbucks $8.30 $1,383.80 $1,245.70
Earnings per share - basic $0.01 $1.83 $1.66
Earnings per share - diluted $0.01 $1.79 $1.62
Weighted average shares
outstanding:
Basic 749.3 754.4 748.3
Diluted 762.3 773 769.7
Cash dividends declared per share $0.89 $0.72 $0.56
12 Months Ended
Figure 7-4: Starbucks Corporation
Consolidated Statements Of Earnings (USD $)
(In Millions, except Per Share data, unless otherwise specified)
Page 79
71
*Starbucks Corporation’s Statement of Earnings (Figure 7-4) was obtained from The
U.S. Securities and Exchange Commission’s EDGAR Database and provided in the thesis
as a reference for analysis performed (Starbucks Corporation 43).
L. Starbucks Statement of Cash Flows Analysis
i. Net Earnings versus Net Cash
Starbucks’s net cash provided by operating activities was $2,908.3
million in 2013 (Figure 7-5). When preparing a statement of cash flows,
companies arrive at net cash provided by operating activities by adjusting
net earnings by adding back non-cash expenses and adjusting for changes
in operating assets and liabilities. The figure that created the large
disparity between cash flows from operating activities and net earnings
was the Kraft litigation charge of $2.784 billion accrued in 2013.
Additionally, since depreciation and amortization are significant non-cash
expenses, the $655.6 million in depreciation and amortization expenses
(Figure 7-5) also contribute significantly to the difference between cash
provided by operating activities and net income.
ii. PP&E Cash Analysis
Starbucks used $1.15 billion in cash in 2013 for investments in
property, plant, and equipment (Figure 7-5). This amount is up around
$300 million from the figure in 2012.
iii. Dividends Analysis
Starbucks paid $629 million in cash for dividends in 2013 (Figure
7-5). Starbucks declared $668.6 million in dividends in 2013 according to
its Consolidated Statements of Equity (Starbucks Corporation 47). The
disparity between dividends declared and dividends paid is accounted for
Page 80
72
in Starbucks’s $38.4 million increase in “Accrued dividend payable” noted
in note 7 to Starbucks’s financial statements which details accrued
liabilities (Starbucks Corporation 63).
When Starbucks declares a dividend, it will make the following
entry (in millions):
Cash Dividends Declared 668.6
Cash Dividends Payable 668.6
Once Starbucks pays its cash dividends, it will then later make the
following entry (in millions):
Cash Dividends Payable 629
Cash 629
Due to differences in timing of the declaration and payment of
dividends, cash paid for dividends as presented on the statement of cash
flows and the amount of dividends declared in the statement of
stockholders’ equity will not exactly line up.
Page 81
73
Figure 7-5: STARBUCKS CORPORATION
CONSOLIDATED STATEMENTS OF CASH FLOWS
(in millions)
*Starbucks Corporation’s Balance Sheet (above) was obtained from The U.S. Securities and Exchange
Commission’s EDGAR Database and then made into a common-size statement by dividing all assets,
liabilities, and equity by total assets, liabilities, and equity respectively (Starbucks Corporation 47).
For 12 Months
Ended
Sept 29, 2013 Sept 30, 2012
OPERATING ACTIVITIES: Net earnings including noncontrolling interests 8.80 1,384.70
Adjustments to reconcile net earnings to net cash provided by operating activities:
Depreciation and amortization 655.60 580.60
Litigation charge 2,784.10 0.00
Gain on sale of properties 0.00 0.00 Deferred income taxes, net (1,045.90) 61.10
Income earned from equity method investees, net of distributions (56.20) (49.30)
Gain resulting from sale/acquisition of equity in joint ventures (80.10) 0.00
Stock-based compensation 142.30 153.60
Other 23.00 23.60
Cash provided/(used) by changes in operating assets and liabilities:
Accounts receivable (68.30) (90.30) Inventories 152.50 (273.30)
Accounts payable 88.70 (105.20)
Accrued liabilities and insurance reserves 87.60 23.70 Deferred revenue 139.90 60.80
Prepaid expenses, other current assets and other assets 76.30 (19.70)
Net cash provided by operating activities 2,908.30 1,750.30
INVESTING ACTIVITIES: Purchase of investments (785.90) (1,748.60) Sales, maturities and calls of investments 1,040.20 1,796.40
Acquisitions, net of cash acquired (610.40) (129.10)
Additions to property, plant and equipment (1,151.20) (856.20) Proceeds from sale of property, plant, and equipment
15.30 5.30 Proceeds from sale of equity in joint ventures 108.00 0.00
Other (27.20) (41.80)
Net cash used by investing activities (1,411.20) (974.00)
FINANCING ACTIVITIES: Proceeds from issuance of long-term debt 749.70 0.00
Principal payments on long-term debt (35.20) 0.00
(Payments)/proceeds from short-term borrowings 0.00 (30.80)
Purchase of noncontrolling interest 0.00 0.00 Proceeds from issuance of common stock 247.20 236.60
Excess tax benefit from exercise of stock options 258.10 169.80
Cash dividends paid (628.90) (513.00) Repurchase of common stock (588.10) (549.10)
Minimum tax withholdings on share-based awards (121.40) (58.50)
Other 10.40 (0.50)
Net cash used by financing activities (108.20) (745.50)
Effect of exchange rate changes on cash and cash equivalents (1.80) 9.70
Net increase/(decrease) in cash and cash equivalents 1,387.10 40.50
CASH AND CASH EQUIVALENTS: Beginning of period 1,188.60 1,148.10
End of period $ 2,575.70 $ 1,188.60
Cash paid during the period for: Interest, net of capitalized interest $ 34.40 $ 34.40 Income taxes $ 539.10 $ 416.90
Page 82
74
M. Starbucks’s Use of Estimates
Starbucks uses estimates to calculate impairment of assets and goodwill,
stock-based compensation forfeiture rates, future asset retirement obligations,
inventory, and depreciation and amortization, allowance for doubtful accounts.
Cash and cash equivalents are estimate-free, Accounts receivable and Accounts
payable gross (exclusive of allowances for doubtful accounts) will be estimate-
free. Property, Plant, and Equipment gross (exclusive of depreciation) will also be
recorded at cost and estimate free.
Conclusion
This case’s three objectives, as laid out in the introduction, were to become
familiar with public company financial statements, perform basic analysis of the financial
statements, and to recognize the role of estimates in financial statement preparation. In
Parts A through E, I explored the parts of the financial statements and their role in
providing financial statement users with useful information. My analysis uncovered the
owner-dominant financing structure of Starbucks and the cause of the operating loss in
fiscal year 2013 in a litigation charge. I also discovered the numerous estimates that
Starbucks uses in part I. This case study allowed me to interact with financial statements
to better understand how to read and analyze corporate financial information. This is a
skill that I will carry far into my public accounting career.
Page 83
75
Case Eight
Contingent Liabilities
3 April 2019
Page 84
76
Introduction
This case study investigates contingent liabilities through the example of the BP
Deep Horizon Spill that occurred off the Gulf Coast in 2010. Since contingent liabilities
require significant judgement, they pose significant challenges to auditors. Estimates are
not only more risky accounts, but they also are often causes of disputes between auditors
and management as the two parties may arrive at different conclusions about the
appropriate amount for a contingency.
Better understanding contingent liabilities will better equip me to carry out my
duties as an auditor both on my internship in Winter 2020, as well as when I begin full-
time. The critical analysis and study provided by this case study into contingent liabilities
will arm me to better assess clients’ contingent liability assertions. This case examines
how contingent liabilities arise, different types of contingent liabilities, and managerial
judgments that must be made in recording contingencies. BP’s Deep Horizon Spill offers
an excellent case for which to examine all of these factors.
A. Contingent Liabilities
A contingent liability is a liability incurred as a result of probable future
losses that have arisen from current actions. Contingent liabilities are recorded
only when it is both probable that a liability has been incurred, and the amount of
the loss can be reasonably estimated. The existence of the liabilities are
contingent upon uncertain factors, such as litigation outcome or the occurrence of
an event. Examples of contingent liabilities are litigation claims, warranty costs,
Page 85
77
environmental liabilities.
Companies do not record gain contingencies in the body of the financial
statements. However, if it is very likely that a contingent asset exists, then the
company will disclose the gain contingency. Contingent assets are not recorded,
while contingent liabilities are, due to the FASB principle of conservatism, which
says that when in doubt companies should overestimate losses and underestimate
gains by accounting for the “worst-case” scenario.
B. BP Product Warranty – Telescopic Joint Purchased from GE
In the case of a piece of equipment such as a telescopic joint, which BP
purchases from GE Oil and Gas, both GE and BP have product warranties related
to this equipment. For BP, the product warranty related to the joint will be
disclosed in the footnotes to the financial statements, but it will not be recorded as
an asset.
For GE Oil and Gas, the warranty related to the joint is an assurance-type
warranty. GE will estimate the cost of the assurance-type warranty over its life
and record a contingent liability for the estimated costs remaining related to the
warranty at the end of the year. In the case of the telescopic joint sale between GE
and BP, the assurance-type warranty does not create a separate performance
obligation for GE, as the warranty costs are included in the price of the telescopic
joint. The contingent liability of warranty costs will be realized by GE Oil and
Gas if BP discovers defects on the telescopic joint within the two-year life of the
Page 86
78
warranty. The warranty liability account will be adjusted based on changes in
estimates of the contingent costs.
C. Management Judgements Related to Product Warranties
For contingent liabilities in general, management must consider “the
amount payable, the payee, the date payable, or its existence” (Kieso 674). Most
importantly management must determine the likelihood that a contingency exists.
If it is highly likely that the company will eventually absorb a loss directly
resulting from prior actions by the company, then the management will
acknowledge a contingent liability if the amount of the liability can be reasonably
determined.
For warranties, management must first determine the nature of the
warranty. If the warranty is only a guarantee that the product sold will perform as
expected (for a certain period), then it is an assurance-type warranty. If the
warranty is a sold-separate promise to offer a service or coverage beyond an
assurance-type warranty, then it is a service-type warranty. Take for example a
car purchase: if a car manufacturer’s warranty is included in the sales price, then
the manufacturer will shoulder any costs of repairs within a set amount of mileage
on the car. If the car buyer purchases an extended warranty, then the car
manufacturer will cover costs of certain repairs beyond the standard mileage. The
consideration for a service warranty will often be payed up-front and recognized
as unearned warranty revenue during the period that the service warranty (not the
assurance warranty) covers. In addition, management must determine the number
Page 87
79
of potential defects that will arise in the sold products over the life of the warranty
(based on statistical analysis) and the costs of repairs for such defects.
A warranty claim differs from the contingent liability which arises from an
incident such as the Deep Horizon Spill in that warranty claims are typically
easier to estimate than is the spill’s liability. When a company offers an assurance
warranty as a portion of the sales price, it allows itself to estimate and plan for
possible defects in its equipment. BP was not able to as easily prepare for such a
contingent cost, as BP was forced to liquidate assets to raise $30 billion for a
disaster relief fund to handle the recovery costs and contingent liabilities that
arose from the spill (Gyo). Also, warranties typically don’t have as damaging of
an effect on the financial statements of businesses as does the Deep Horizon Spill.
For example, in 2017 GE (the company who sold the telescopic joint) reported
expenditures of $827 million related to commitments, guarantees, product
warranties and other loss contingencies (General Electric Company 183). It is
estimated that BP has incurred nearly $145 billion in costs in the aftermath of the
oil spill (Gyo).
D. Contingent Liability Estimation – Deepwater Horizon Oil Spill
In note 36 of BP’s 2011 annual report, BP breaks provisions relating to the
Gulf of Mexico Oil Spill into four broad categories: environmental, spill response,
litigation and claims, and clean water act penalties (BP p.I.c 232). BP must
estimate potential fines that it might incur based on environmental laws.
Significant legislation, such as the Oil Pollution Act of 1990 and Clean Water Act
Page 88
80
dictate many of environmental penalties. For litigation, BP must estimate the
probability that litigation filed against BP will result in restitution by BP to the
respective parties. This can be done with the help of legal counsel. BP may also
reference litigation related to the Exxon Valdez Spill to estimate the outcomes of
these suits. BP must estimate the cost of clean-up related to the oil spill that it will
likely by law have to pay. If the amounts or likelihood of materialization are
uncertain or inestimable, then BP does not need to record a contingent liability.
According to the Downs Law Group, a Gulf Coast law firm, class action
lawsuits can be broken into medical benefits and property damages. According to
Downs, cleanup workers, Zone A residents (people living on specified beachfront
areas for at least 60 days between April and September 2010 who have been
diagnosed with a specific condition), or Zone B residents (people living on
specified wetland or bayou areas for 60 days between April and September 2010).
Property damages are those related to items such as business economic loss,
individual economic loss, or physical damage to property (Downs Law Group). In
addition to these civil lawsuits are federal and state lawsuits. To draw a boundary
around potential lawsuits, the damages incurred by those filing against BP must
have suffered direct damages from the spill. An example of this requirement is
illustrated by the medical benefits. To qualify for medical benefits from BP,
plaintiffs must have been in the area of the spill, for the 60 days during which the
spill was most severe and have a specific condition that could have arisen directly
from the pollution. Businesses that may be able file against BP would be
commercial fishing businesses, bayside businesses, and even states. The State of
Page 89
81
Alabama filed a lawsuit “seeking damages for alleged economic and
environmental harms” (BP p.I.C 162). BP acknowledges that “there is significant
uncertainty in the extent and timing of costs and liabilities relating to the
incident,” but appears to be very diligently estimating amounts (BP p.I.c 59). BP
discloses at-length its legal proceedings on pages 160 through 163 of its 2011
annual report. It appears that the contingent liability is being accounted for
accurately and effectively, given that BP is accounting for all environmental,
litigation, and clean-up contingencies.
Conclusion
This case study allowed critical analysis into how contingent liabilities arise, the
different types of contingent liabilities, and the judgements that go into contingent
liability estimations through the lens of British Petroleum’s Deep Horizon oil spill.
Before this case I knew of the oil spill, but it was intriguing to explore the financial
impact to BP as a company through the resulting contingent liabilities. This case study
demonstrated how contingencies arise – when events occur (oil spill) such that a liability
(lawsuit and criminal penalties) is probable and estimable. Additionally, this case
demonstrates the different forms that contingent liabilities take, such as product
warranties or lawsuits, and that lawsuits tend to be much costlier liabilities than
warranties do. Finally, this case study demystified how management estimates contingent
liabilities. BP considered a multitude of damages that they would be held liable for by
assessing the impact of the oil spill with the consultation of a law firm. This careful
analysis and study of contingent liabilities has granted me a greater understanding of the
Page 90
82
nature of contingent liabilities. This understanding is essential for a career in audit,
because as a high-risk account, contingent liabilities are frequently scrutinized and tested
extensively in audits to ensure proper expense recognition.
Page 91
83
Case Nine
Equity Method Investments
10 April 2019
Page 92
84
Introduction
This case study examines accounting for equity-method investments by
examining Wendy’s Company’s investment in Tim Hortons. Both Wendy’s and Tim
Hortons are fast food companies. Wendy’s Company’s joint-venture investment is
referred to throughout this case study as TimWen. This case analyzes equity-method
investments’ impacts on the investing company’s balance sheet, statement of cash flows,
and the income statement. Additionally, this case will investigate how equity-method
investments derive their values as presented on the investing company’s books, and why
the carrying value often deviates from the book value of the invested-in company. Since
companies often make equity-method investments, substantial understanding of equity-
method investments and their impacts on financial statements will be useful for a career
in audit.
A. Reasons Companies Enter Joint-Venture Arrangements
There are several advantages to entering a joint-venture arrangement. By
entering a joint-venture, companies can create synergies and expand their
capabilities at a quicker and more efficient rate than they could on their own
without such an arrangement. According to Northern Ireland Business Info’s
website, benefits of joint-venture agreements include: “access to new markets and
distribution networks, increased capacity, sharing of risks and costs with a
partner, and access to greater resources” ("Guide Joint ventures and business
partnerships."). These benefits arise under the assumption that the companies in
the agreement are compatible and have the right business relationship. Also,
Page 93
85
equity method investments allow significant influence over a company’s
operations without having to expend the resources necessary to buy out a
company.
B. Equity Method Accounting Overview
If an investor purchases ownership of a company through the purchase of
shares of common stock, then the extent to which the investor can influence the
managerial decisions of the investee will determine the accounting treatment. If
the company purchases less than a 20 percent ownership stake in the company
(less than 20 percent of shares outstanding), then the company accounts for its
investment at fair value. The fair value of the investment is the price at which the
investment could be readily sold by the investing company in the market.
For an investor with significant influence over a company, accounting for
the investment at fair value and only recognizing the investee’s dividends does
not accurately convey the investor’s relationship with the investee’s profits. For
instance, if an investor exerts significant influence over a company and that
company incurs a loss, but pays out dividends, then the investor’s books will not
reflect any loss and only income from the dividend. For an investor with
significant influence over an investee, this recognition is misleading.
If the investor purchases between a 20 and 50 percent ownership stake in
the investee and can assert “significant control” over the investee, then the
investor accounts for the investment with the equity method. Under the equity
method, the company accounts for the investment at the acquisition cost (the price
Page 94
86
paid for the shares). Under the equity method, the investor does not adjust the
carrying value of the investment to its fair value. The investing company instead
recognizes a portion of the investee’s income in proportion to the investor’s
ownership stake. The investor’s share of income appears on the investor’s books
in the nonoperating section of the income statement and on the balance sheet as an
increase in the investment account. The investor recognizes its share of income
because of the investing company’s significant stake in the investee and the
investor’s ability to significantly influence the operations of the investee.
When the investee pays dividends to the investor, the investor decreases
the investment account by its share of dividends. Dividend payments by the
investee to the investor decreases the investment account because dividends are a
return to the investor of its own portion of income. Additionally, with significant
influence, the investor can direct dividend payments. This method significantly
differs from the fair value method (less than 20 percent investments) in that the
fair value method recognizes income of the investee only through dividend
payments received.
For investments in over 50 percent of a company’s ownership shares, the
investor is said to have a controlling interest and the investor and investee prepare
consolidated income statements. For a company with 20 to 50 percent ownership
of an investee, consolidated statements overstate the influence of the investor on
the investee.
Page 95
87
C. Accounting for Excess of Investment Amount over Book Value of Underlying
Net Assets
The excess of the investment amount over the investor’s share of the
investee’s book value (total assets-total liabilities) is known as the Acquisition
Accounting Premium (AAP). Under the equity method, the AAP is allocated to
the investee’s total assets by writing the assets up to fair value. The AAP consists
of two pieces: (1) the portion used to write up net identifiable assets and liabilities
to fair value and (2) goodwill. Although companies used to amortize goodwill, as
of 2001 goodwill is no longer amortized but rather periodically tested for
impairment. The write up of net identifiable assets and liabilities to fair value
occurs through an increase to the equity investments account on the investor’s
books, since the assets and liabilities of the investee are not on the investor’s
books.
D. Equity Method Investments on Wendy’s Company’s Balance Sheet
Wendy’s included on its 2011 and 2012 balance sheets investment
amounts of $113.3 million and $119.3 million respectively (Figure 9-1). Equity
method investments appear on the investor’s balance sheet in the “investments”
asset account. Wendy’s Company’s joint venture with Tim Horton’s (THI) and
Japan are its only Equity Investments. However, the $1.750 million credit balance
in the Japan JV equity investment account represents a liability Wendy’s books,
since Wendy’s has agreed to finance future cash requirements of the Japan JV,
according to note 8 of Wendy’s financial statements (Figure 9-2a). When
Page 96
88
amortizing excess of purchase price (AAP), Wendy’s debits equity income and
credits Equity Investment.
*The Wendy’s Company’s Balance Sheet was obtained from U.S Securities and
Exchange Commission EDGAR database (The Wendy’s Company 58).
Figure 9-1: The Wendy's Company
Consolidated Balance Sheets (USD $)
For the Year Ended Dec. 30, 2012
(In Thousands, unless otherwise specified)
Dec. 30, 2012 Jan. 01, 2012 Current assets:
Cash and cash equivalents $453,361 $475,231
Accounts and notes receivable 61,164 68,349
Inventories 13,805 12,903
Prepaid expenses and other current assets 24,231 27,397
Deferred income tax benefit 91,489 80,970
Advertising funds restricted assets 65,777 70,547
Total current assets 709,827 735,397
Properties 1,250,338 1,192,200
Goodwill 876,201 870,431
Other intangible assets 1,301,537 1,304,288
Investments 113,283 119,271
Deferred costs and other assets 52,013 67,542
Total assets 4,303,199 4,289,129
Current liabilities: Current portion of long-term debt 12,911 6,597
Accounts payable 70,826 81,301
Accrued expenses and other current liabilities
137,348 178,298
Advertising funds restricted liabilities 65,777 70,547
Total current liabilities 286,862 336,743
Long-term debt 1,444,651 1,350,402
Deferred income taxes 438,217 458,107
Other liabilities 147,614 147,808
Commitments and contingencies
Stockholders' equity Common stock, $0.10 par value; 1,500,000
authorized; 470,424 shares issued
47,042 47,042
Additional paid-in capital 2,782,765 2,779,871
Accumulated deficit (467,007) (434,999)
Common stock held in treasury, at cost (382,926) (395,947)
Accumulated other comprehensive income 5,981 102
Total stockholders' equity 1,985,855 1,996,069
Total liabilities and stockholders' equity $4,303,199 $4,289,129
Page 97
89
Figure 9-2: Excerpts from Footnote 8 to the Financial Statements
Figure 9-2a: Wendy’s
Equity Investments
(in thousands) Year End
2012 2011
Equity investments:
Joint venture with THI $ 89,370 $ 91,742
Joint venture in Japan (a) (1,750) 77
Cost investments:
Arby’s 19,000 19,000
Jurlique — 325
Other cost investments 4,913 8,127
$ 111,533 $ 119,271
(a) In 2012, our equity investment in the Japan JV was included in “Other
liabilities;” Wendy’s has provided certain guarantees and the partners
have agreed on a plan to finance anticipated future cash requirements of
the Japan JV as further described below.
Figure 9-2b: TimWen’s
Balance Sheet
Information (in
thousands) Year End
2012 2011
Balance sheet information:
Properties $ 73,013 $ 73,394
Cash and cash equivalents 3,538 2,621
Cash and cash equivalents 3,274 4,231
Other 2,516 2,565
$ 82,341 $ 82,811
Accounts payable and
accrued liabilities $ 3,215 $ 2,281
Other liabilities 8,561 8,655
Partners’ equity 70,565 71,875
$ 82,341 $ 82,811
Page 98
90
Figure 9-2c: Activity
Related to Equity
Investment in TimWen
(in thousands) Year Ended
2012 2011
Balance at beginning of period $ 91,742 $ 98,631 Equity in earnings for the period
13,680 13,505
Amortization of purchase price adjustments
(3,129) (2,934)
10,551 10,571
Distributions received
(15,274)
(14,942)
Foreign currency translation adjustment included in “Other comprehensive income (loss), net”
2,351 (2,518)
Balance at end of period $ 89,370 $ 91,742
*All of the above information in Figure 9-3 was obtained from U.S
Securities And Exchange Commission EDGAR database (The Wendy’s
Company 77).
E. Carrying Value of The Wendy’s Company’s Investment in TimWen
Wendy’s investment in TimWen at year-end 2012 is $89.37 million
(Figure 9-2a). On TimWen’s books, net assets are equal to $70.57 million (Figure
9-2b). Wendy’s Co.’s share of TimWen’s net assets (50 percent) is equal to
$35.28 million. The difference in Wendy’s share of TimWen’s net assets at cost
($35.28 million) and Wendy’s recorded investment in TimWen ($89.37 million)
is due to the Acquisition Accounting Premium. The net assets are recorded on
TimWen’s books at cost. However, Wendy’s did not pay only the cost of
TimWen’s net assets for its investment. The investment account also grows due to
recognition of TimWen’s income and the investment account decreases as
Page 99
91
Wendy’s receives dividends, amortizes the AAP, and increases or decreases based
on foreign currency translation.
F. Equity Income Analysis
i. Impact of Wendy’s Equity Method Investment in TimWen on
Earnings Before Taxes in 2011 and 2012
In 2012 and 2011, the effect of Wendy’s equity method investment in
TimWen on Wendy’s income increases income by $10.551 million and $10.571
million respectively (Figure 9-2c). These amounts are comprised of equity
earnings for both periods, less the amortization of purchase price adjustments.
These amounts are buried in “Other operating expense, net” on Wendy’s
consolidated statement of operations. The equity income from all Wendy’s equity
investments (not just Tim Hortons) is calculated in Figure 9-3. Wendy’s
Company’s total equity income is less than its income from its TimWen due to the
losses attributable to the Japan JV (Figure 9-3).
Figure 9-3: Equity Income from Wendy’s Equity Investments
(numbers in thousands)
Equity in earnings from investment in TimWen’s 13,680
Amortization of purchase price adjustment - TimWen (3,129)
Equity in losses for the period – Japan JV (1,827)
Equity income (buried in other operating expenses, net) 8,724
Page 100
92
ii. Journal Entry to Record Wendy’s Share of TimWen’s 2012 Earnings
(in thousands)
(Numbers from Figure 9-3)
Equity Investments 13,680
Equity Income 13,680
iii. Journal Entry to Record the Amortization of the Purchase Price
Adjustments for 2012
The amortization of the purchase price adjustments for 2012 equaled
$3.129 million (Figure 9-3). The entry for this amortization would be as follows
(in thousands):
Equity Income 3,129
Equity Investments 3,129
iv. Journal Entry to Record the Wendy’s Receipt of Dividends from
TimWen for 2012
Wendy’s received $15.724 million in dividends from TimWen, as noted in
note 8 to the financial statements (Figure 9-2a), as well as in the statement of cash
flows as “Distributions received from TimWen Joint Venture”. The journal entry
for these dividends received would be as follows (in thousands):
Cash 15,724
Equity Investments 15,724
Page 101
93
G. Wendy’s Company Statement of Cash Flows Analysis
i. Cash Flows from Operating Activities – Adjustment for “Equity in
earnings in joint ventures, net”
Most commonly, companies arrive at cash flows from operating activities
in the statement of cash flows is to use the indirect method – which starts with net
income and adjusts net income from an accrual basis to a cash basis. The $8.724
million under “Equity in earnings in joint ventures, net” (Figure 9-4) is Wendy’s
share of TimWen’s earnings (50 percent), net of the purchase price adjustment
amortization. These earnings have been accrued by Wendy’s but not necessarily
realized in cash. Therefore, to adjust to the cash basis for the statement of cash
flows, the accrued earnings must be backed out of net income.
The adjustment figure in the statement of cash flows ($8.724 million) is
uncoincidentally the same value as the equity income figure derived in Figure 9-3
in part F(i).
Page 102
94
Dec. 30,
2012
Jan. 01,
2012
Cash flows from operating activities:
Net income (loss) $9,467 $9,875
Adjustments to reconcile net income (loss)
to net cash provided by operating
activities:
Depreciation and amortization 154,174 145,302
Loss on early extinguishment of debt 75,076 -
Distributions received from TimWen joint
venture 15,274 14,942
Share-based Compensation, Including Portion
Attributable to Discontinued Operations
11,473 17,688
Impairment of long-lived assets 21,097 14,441
Net (recognition) receipt of deferred vendor
incentives (920) 7,070
Accretion of long-term debt 7,973 8,120
Amortization of deferred financing costs 4,241 6,216
Non-cash rent expense 7,210 7,554
Loss on disposal of Arby's 442 8,799
Equity in earnings in joint ventures, net (8,724) (9,465)
Deferred income tax (31,598) 1,624
Deferred Income Tax Expense (Benefit),
Including Portion Attributable to
Discontinued Operations
Operating investment adjustments, net (27,769) (145)
Other, net 3,093 2,999
Changes in operating assets and liabilities:
Accounts and notes receivable 3,999 (2,690)
Inventories (561) (517)
Prepaid expenses and other current assets (1,360) (7,580)
Accounts payable (9,266) 11,364
Accrued expenses and other current liabilities
(42,906) 11,120
Net cash provided by operating activities 190,415 246,717
Figure 9-4: The Wendy's Company
Consolidated Statement of Cash Flows -
Operating Activities (USD $)
(In Thousands, unless otherwise specified)
12 Months Ended
*All of the above information in Figure 9-4 was obtained from U.S Securities and Exchange
Commission EDGAR database (The Wendy’s Company 79).
Page 103
95
ii. Cash Flows from Operating Activities – Adjustment for
“Distributions received from Joint Venture”
A positive adjustment is made to net income under the operating activities
section of the Statement of Cash Flows for distributions received from the joint
venture. The positive adjustment for dividend distributions is made, because
Wendy’s does not recognize the dividend distributions as net income under the
equity method. However, distributions from its share of TimWen’s income in the
form of dividends do constitute operating activities. Therefore, in order to adjust
from the accrual base of income from operating activities to the cash basis,
dividends received must be added to income. The amount of “Distributions
received from joint venture” in the statement of cash flows (Figure 9-4) is equal to
the amount of “distributions received” as presented in note 8 (Figure 9-2). Tim
Horton’s Inc. was Wendy’s only source of dividend distributions in 2012, as
Japan JV Wendy’s other equity investment) did not issue any dividends.
Conclusion
This case study unpacked Wendy’s equity-method investment in a joint venture
with Tim Horton’s. Analysis of Wendy’s carrying amount of the Tim Horton’s
investment versus Wendy’s share of Tim Horton’s book value found that Wendy’s had an
unamortized Accounting Acquisition Premium (AAP) of over $50 million related to its
Tim Horton’s investment. Wendy’s Company’s total Wendy’s Company’s investment in
TimWen increased its bottom line by over $10 million for 2011 and 2012. However,
Wendy’s investment in a Japanese joint venture cost its bottom line nearly $2 million in
Page 104
96
2012. Wendy’s Company’s equity method investment in TimWen accounted for $89.37
million of its total assets at the end of 2012 – recorded under “investments” on the
balance sheet.
Although the TimWen investment requires a negative adjustment to net income to
arrive at cash flows from operating activities in the statement of cash flows, this does not
mean that the investment is eating cash and is therefore not a cause for concern. The
adjustment simply reflects that the income realized in the investment has not yet turned to
cash. Due to TimWen’s positive impact on Wendy’s Company’s net income, assets, and
its premium value, the investment in the joint venture with Tim Horton’s was viable for
Wendy’s Company as of 2012.
Page 105
97
Case Ten
Pension Plan Accounting
18 April 2019
Page 106
98
Introduction
While many companies are slowly moving from using pension plans to 401(k)s as
their retirement benefits for employees, pension plans still do exists and due to their
complex nature are worth studying. Pension plans also present an intriguing case study on
the nature of liabilities and how they arise. This case study examines pensions through
the example the Johnson & Johnson company, which used a pension plan as of 2007.
This case will study defined-benefit pension plans specifically, investigating how and
when liabilities arise in defined-benefit pension plans, how different events impact the
benefit obligation and plan assets, as well as how assets are used to satisfy pension
obligations. An enhanced understanding of pensions will arm me with a greater
understanding of accounting for retirement benefits, as well as a better understanding for
liabilities, as pensions are a rather unique liability that requires a greater deeper
understanding of liabilities.
Page 107
99
A. Differences Between the Defined Benefit and Defined Contribution
Retirement (Pension) Plans
Defined benefit plans prescribe what the participants of the plan will be
entitled to receive once they retire. The employee’s retirement entitlement is the
responsibility of the employer. The employer will contribute to an independent
pension fund that will go toward meeting the retirement obligation. The pension
liability, called the projected benefit obligation, is based on an actuarial
assumption that determines the vested and non-vested benefits based on future
salaries. The difference between the projected benefit obligation and fair value of
the pension assets (the amount that the employer has contributed to the plan) is
reported on the employer’s books as an asset if the fair value of the employer’s
contributions exceeds the projected benefit obligation, and a liability if the
projected benefit obligation exceeds the fair value of the contributions.
Defined contribution plans prescribe the contributions that the employer
must make to the pension plan. The only obligation that the employer has under
the defined contribution plan is the obligated contribution, so accounting for
defined contribution plans is much simpler than accounting for defined benefit
pension plans.
B. Why Retirement Plan Obligations are Liabilities
The below flowchart (Figure 10-1) demonstrates the accounting for
pension plans from the conception of the obligation as the employee works for the
company, to when the employee retires and receives benefits from the pension
Page 108
100
plan. The flowchart demonstrates where and how the liability arises, as well as
how it decreases. As the employee works, the company becomes liable to pay the
employee’s future retirement benefits, which is why the projected benefit
obligation is a liability to the company.
Figure 10-1: Pension Plan Flowchart
Employee Works
Record
Difference on
Employer’s
Books as Asset
(Overfunded) or
Liability
(Underfunded)
Employer Contributes to Plan
Assets
Pension Fund
Plan Assets
Employee Retires
Projected
Benefit
Obligation
(PBO)
Employee
Employee Receives
Benefits From
Pension Fund
Liability Arises
PBO Decreases
Page 109
101
C. Assumptions Necessary to Account for Retirement Plan Obligations
The necessary assumptions in accounting for retirement plans are related
to the projected benefit obligation and the pension assets. Assumptions needed for
the projected benefit obligation are calculated by actuaries. Actuarial assumptions
include assumptions about employees’ lifespans, health, life choices, salaries, and
futures with company. These actuarial assumptions determine the projected
benefit obligation and can change to either increase or decrease the projected
benefit obligation. The contributions to the plan assets are invested into very safe
market securities that offer returns over the life of the plan assets. The expected
return on plan assets is related to market data. The expected return on plan assets
will increase the plan assets.
D. Activities that Influence Companies’ Pension Obligations
In general, companies’ pension obligations are influenced each year by
four main types of activities: service cost, interest cost, actuarial gains or losses,
and benefits paid to retirees.
Service cost – service cost is the accrued benefit that the employee is entitled to
for his or her work during the current period.
Service Cost JE
Pension Expense XX
Projected Benefit Obligation XX
Page 110
102
Interest cost – this is the interest expense that the employer accrues on the
projected benefit obligation. The interest rate is known as the settlement rate.
Interest Cost JE
Pension Expense XX
Projected Benefit Obligation XX
Actuarial gains or losses – these are gains or losses that occur as a result of
changes in the actuarial assumptions that go into determining the projected benefit
obligation. If the change in actuarial assumptions increases the projected benefit
obligation, then the employer recognizes an actuarial loss.
Actuarial Loss JE
If the change in actuarial assumptions decreases the projected benefit obligation,
then the employer recognizes and actuarial gain.
Actuarial Gain JE
Benefits paid to retirees – these are the benefits payed to retirees out of the
pension fund. This decreases the benefit obligation and plan assets but does not
affect Johnson & Johnson’s cash, as Johnson & Johnson does not control the Plan
Assets.
Pension Expense XX
Projected Benefit Obligation XX
Projected Benefit Obligation XX
Pension Expense XX
Retirement Benefits Paid JE
Projected Benefit
Obligation
XX
Plan Assets XX
Page 111
103
E. Activities that Influence Companies’ Pension Assets
Actual return on pension investments – The actual return on pension investments
is the change in the fair value of the investments, independent of contributions
made by the employer and benefits paid by the investment fund.
Company contributions to the plan – These are the contributions paid by the
employer to the pension investment fund.
Benefits paid to retirees – These are the benefits paid to the retiree by the pension
investment fund. These benefits are owed to the retiree for his or her service provided to
the company.
F. Return on Plan Assets
The return on plan assets included in pension expense is the return that
was expected to be accrued. The return included in pension plan assets is the
return that was accrued by the plan assets over the course of the period. The
expected return is used in pension expense in order to smooth earnings. The
FASB feared that recognizing the actual return in earnings would make pension
expense too volatile. The company will recognize differences between the actual
and expected return in other comprehensive income as a gain or a loss. The
company will then amortize the balance in other comprehensive income over the
average service life of employees if the beginning balance exceeds 10 percent of
the larger of the beginning projected benefit obligation and plan assets. This
Page 112
104
arbitrary 10 percent amount is known as the amortization corridor. The general
entries to record returns on plan assts are as follows:
To record actual return
Plan Assets XX
Pension Expense XX
To adjust pension expense to expected return and record gain
Pension Expense XX
Other Comprehensive Income – G/L XX
*reverse entry for loss
To record amortization of OCI-G/L
Other Comprehensive Income – G/L XX
Pension Expense XX
G. Johnson & Johnson Pension Expense Analysis
Johnson & Johnson reported $646 million in net periodic benefit cost for
2007 (Figure 10-2) – this is Johnson & Johnson’s pension expense. The entries to
record the service cost and interest expense portions of the pension expense are
included in Figure 10-2.
Page 113
105
Figure 10-2: Johnson & Johnson 2007 Pension Expense Detail and Related Journal
Entries
Pension Expense Detail
(Dollars in Millions) 2007 2006 2005
Service cost 597$ 552 462
Interest cost 565 570 488
Expected return on plan assets (809) (701) (579)
Amortization of prior service cost 10 10 12
Amortization of net transition asset 1 (1) (2)
Recgnized actuarial losses 186 251 219
Curtailments and settlements 5 4 2
Net periodic benefit cost 646$ 685 602
Retirement Plans
*The above detail was obtained from Johnson & Johnson’s 2007 Annual Report (Johnson &
Johnson 61)
Related Pension Expense Journal Entries (numbers in millions)
H. Johnson & Johnson Retirement Plan Obligations (Pension Liability) Analysis
i. Analysis of Johnson & Johnson Retirement Plan Obligation as of
December 31, 20017
The value of the retirement plan obligation is $12 billion at December 31,
2007 (Figure 10-3). The retirement plan obligation represents the benefits that are
To record the service cost
Pension Expense 597
Projected Benefit Obligation 597
To record interest expense
Pension Expense 565
Projected Benefit Obligation 565
Page 114
106
projected to be owed to employees in the pension plan. The retirement plan
obligation number is based on actuarial assumptions, which could change.
Figure 10-3: Johnson & Johnson 2007 Benefit Obligation and Plan Assets
Detail
(Dollars in Millions) 2007 2006
Change in Benefit Obligation
Projected benefit obligation - beginning of year 11,660$ 10,171
Service cost 597 552
Interest cost 656 570
Plan participant contributions 62 47
Amendments 14 7
Actuarial (gains) losses (876) (99)
Divestitures & acquisitions 79 443
Curtailments & settlements (46) (7)
Benefits paid from plan (481) (402)
Effect of exchange rates 337 378
Projected benefit obligation - end of year 12,002$ 11,660
Change in Plan Assets
Plan assets at fair value - beginning of year 9,538$ 8,108
Actual return on plan assets 743 966
Company contributions 317 259
Plan participant contributions 62 47
Settlements (38) (7)
Divestitures & acquisitions 55 300
Benefits paid from plan assets (481) (402)
Effect of exchange rates 273 267
Plan assets at fair value - end of year 10,469$ 9,538
Funded status at - end of year (1,533)$ (2,122)
Retirement Plans
*The above detail was obtained from Johnson & Johnson’s 2007 Annual Report (Johnson &
Johnson 62)
ii. Analysis of Johnson & Johnson 2007 Pension-Related Interest Cost
The pension related interest cost for 2007 is $656 million (Figure 10-3).
Given the projected benefit obligation at the beginning of 2007 of $11.66 billion
(Figure 10-3), the interest rate used by Johnson & Johnson is 5.6 percent, as
computed below (figures in millions):
(656
11,660 ) * 100 = 5.6%
Page 115
107
The calculated rate of 5.6 percent is realistic, since the discount rate for
international plans is 5.5 percent and the rate for U.S. benefit plans is 6.5 percent
(Figure 10-4). The presumed discount rate used by Johnson and Johnson of 5.6
percent falls between the U.S. Benefit Plans and International Benefit Plans
discount rates (Figure 10-4). This makes sense as Johnson & Johnson has
operations and employees both in the U.S. and in international countries.
Figure 10-4: Discount Rates Used to Develop Actuarial Present Value of
Projected Benefit Obligation
Retirement Plans
(Dollars in Millions) 2007
U.S. Benefit Plans
Discount rate 6.50%
International Benefit Plans
Discount rate 5.50%
*The above percentages were obtained from Johnson & Johnson’s 2007
Annual Report (Johnson & Johnson 61)
iii. Pension Benefits Paid to Johnson & Johnson Retirees in 2007
Johnson and Johnson’s pension plan payed $481 million to retirees in
2007 (Figure 10-3). Johnson and Johnson did not directly pay the retirees.
Johnson & Johnson made cash contributions to the pension plan which was held
and controlled by a trustee, and the trustee then payed the benefits to the retirees
out of the pension plan’s assets. The pension plan is an independent entity from
Johnson and Johnson. The benefits payed reduce the retirement plan obligation
and retirement plan assets by equal amounts.
To record benefits paid to retirees (in millions)
Projected Benefit Obligation 481
Plan Assets 481
Page 116
108
I. Johnson & Johnson Retirement Plan Assets at December 31, 2007
The value of Johnson & Johnson’s plan assets at fair value at December
31, 20017 is $10,469 million (Figure 10-3). This is the fair value of Johnson and
Johnson’s accumulated contributions to the pension plan, net of disbursements, at
the end of 2007. Johnson & Johnson does not hold this amount in any of it
accounts, but rather an independent trustee holds the retirement plan assets.
Therefore, this amount does not appear on Johnson & Johnson’s Balance Sheet
and can only be found in the notes to the financial statements. Rather, the
difference between the plan assets and Johnson & Johnson’s projected benefit
obligation appear on the Balance Sheet.
i. Expected versus Actual Return on Plan Assets
The expected returns on plan assets for 2006 and 2007 as stated under
pension expense were $701 million and $809 million respectively (Figure 10-2).
The actual returns for the same years were $966 million and $743 million
respectively (Figure 10-3). In 2006, there was a gain of $265 million that arose
from the excess of actual returns over expected. In 2007, there was a loss of $66
million that arose from the excess of expected returns over actual returns. The
difference in 2006 was very significant, while the difference in 2007 was
relatively less significant. The shift from a $265 million gain one year to a $66
million loss the very next year illustrates the volatile nature of returns on plan
assets and pension expense. Actual returns more accurately illustrate the
economics of the company’s pension expense in the short-run, but the shifts likely
Page 117
109
offset in the long-run, so the company records pension expense based on expected
returns to smooth the volatility of pension expense.
ii. 2007 Retirement Plan Contributions
Johnson & Johnson contributed $259 million and $317 million in 2006
and 2007 respectively (Figure 10-3). Johnson & Johnson employees contributed
$47 million and $62 million in 2006 and 2007 respectively (Figure 10-3). Johnson
& Johnson contributed 22 percent more to the plan in 2007 than in 2006, while its
employees contributed 32 percent more in 2007 compared to 2006. Since Johnson
& Johnson’s obligation for the pension plans is tied to the retirement distributions,
its contributions to the plan can vary year to year. If it was a defined contribution
plan, Johnson & Johnson would likely have more consistent year-to-year pension
plan contributions. Due to the existence of an employee contribution, Johnson &
Johnson likely has a combined contribution plan, where the employer and
employee both contribute to the employee’s retirement plan.
iii. Retirement Plan Assets Portfolio
Johnson & Johnson’s retirement plan assets include both debt and equity
securities. The company’s international plan includes real estate and other
investments. Most retirement plans (US and International) consist of equity
securities.
iv. Over(under)funded Status of Johnson & Johnson’s Retirement Plan
In 2006, the pension plan was underfunded by $2.122 billion and
underfunded by $1.533 billion in 2007 (Figure 10-3). The funded status appears
under “employee related obligations” on the company’s balance sheet. Since the
Page 118
110
fund is underfunded, Johnson & Johnson will record a liability on its balance
sheet for the value of the pension plan’s underfunded amount.
Conclusion
In pension plans, companies incur a liability to pay employees during retirement
while the employees provide services to the company. The company does not wait until
the employee retires to recognize the liability, because the employer with a pension plan
is liable to pay out retirement benefits as soon as the employee works for the employer.
Think of it this way – the employee works in exchange for (1) salaries and wages, and (2)
the company’s promise to pay the employee during retirement. The promise to pay
retirement benefits is a part of the employee’s current bargain for their provided services
to the company.
The pension obligation does not go away until the employee retires and receives
benefits from the pension fund – not when the employer contributes to the pension plan.
Accounting for pension plans reinforces the idea that liabilities arise as soon as a
company has an obligation to provide a future benefit to a party, and the liability is not
liquidated until the promised future benefit is transferred to the party.
Due to the large size of Johnson & Johnson, and the sheer length of time the
pension liabilities stay on the books (from the first day of work until retiree benefits are
paid out), it is no surprise that Johnson & Johnson has a $12 billion obligation related to
its pension (Figure 10-3). Johnson & Johnson will not liquidate this obligation until it
does away with its pension plan and the rest of the retirees’ benefits are paid out. Luckily
for Johnson & Johnson, this large liability does not directly appear on its balance sheet
Page 119
111
but rather its plan assets are netted against the liability and the over/underfunded status
appears on its books. The staying nature of pension plans is another good reason to study
how pensions operate, since companies that are transitioning to 401(k)s from pension
plans may have pensions lingering on their books even after pension plans are
abandoned.
Page 120
112
Case Eleven
New Perspectives on the Balance Sheet Model of Financial Reporting
25 April 2019
Page 121
113
Introduction
This case study reviews a paper published by the Center for Excellence in
Accounting and Security Analysis at Columbia University, which critiques the balance
sheet model of financial reporting. This paper favors the income statement model of
reporting over the US Generally Accepted Accounting Principles (GAAP) approved
balance sheet model of reporting. The paper provides four critiques regarding the
balances sheet approach. These critiques are: (1) reporting should reflect the business
model, (2) income is a better measure for the health of a company than assets, (3)
earnings are volatile, while the balance sheet is more stable than company operations
would often reflect. The income that flows through the assets is what gives most assets
their value, and (4) balance sheets include an increasing amount of valuation estimates
that calls to question the credibility of the statement (Ilia D. Dichev 2). The paper
suggests that financial reporting includes a distinction between operating and financing
activities on the balance sheet and income statement. Additionally, it suggests that
financial reporting demonstrates a renewed emphasis on the matching principle (Ilia D.
Dichev 2). This case study will reflect on ways in which this paper can shift one’s
perspective, and how this information could be used in a future career in accounting.
A. Shifts in Perspective
Fundamentally, this paper caused me to think more critically about
accounting standards. FASB guidelines certainly should always be followed, but
discourse surrounding their effectiveness in financial reporting is important for
the continual improvement of financial accounting standards. This paper pointed
Page 122
114
out that the governing body prior to FASB, the Accounting Principles Board
(APB), reacted to existing principles accepted by the accounting profession.
Conversely, FASB takes a more proactive approach to standard setting (Ilia D.
Dichev 5). Although this proactive approach allows FASB to anticipate and
prepare for evolving accounting issues, it can also cause the board to set standards
that are inconsistent with what many accounting professionals and financial
statement users (outside investors, for example) believe to be the most effective
and useful. Formal education in accounting principles, as obtained in school and
professional workshops, often presents accounting standards as bona-fide law.
This is the first time that I have ever encountered such an in-depth critique of
FASB standards. Although FASB standards are “law,” this paper inspired the
realization that they should be subject to critique and analysis.
Additionally, the paper presented an intriguing distinction between “value-
in-use” assets and “value-in-exchange” assets. This distinction caused me to
change the way I understand assets and their role in companies. The paper argues
that, “for most firms the value of their resources from value-in-use and not from
value-in-exchange” (Ilia D. Dichev 12). Under the current balance sheet approach
adopted by the FASB, undue emphasis is placed on assets in their value-in-
exchange. For a lot of companies, the value of most of their assets comes from the
assets’ uses in generating income and not from their exchange value. According
to a study conducted by the authors of the paper, “the use of PPE for internal
purposes exceeds the use of PPE for external purposes on a magnitude of 5 to 10
times” and the amount of sales of PPE is only 1 to 2.5 percent of total PPE (Ilia D.
Page 123
115
Dichev 13). Prior to reading this article, I understood assets as stores of values,
but this paper challenged this belief.
Although the use of fair value estimates in valuing assets has always
appeared much more relevant to me than the use of historical cost, Dichev’s paper
challenges this belief. The balance sheet approach does not allow for a distinction
between value-in-use and value-in-exchange assets in financial statements,
because income is based on changes in net assets. The income statement
approach, rather, bases the value of assets on their use in generating income. To
best project earnings, the income statement approach calls for companies to value
their operating assets at historical cost (depreciated over the life of the asset),
since the historical cost the cost that the company consumed in the attempt to
generate revenues. The paper points out that valuing operating assets at fair value
inaccurately influences income, creating a feedback loop that dangerously creates
a market bubble, as illustrated below (Ilia D. Dichev 19).
Figure 11-1: Fair Value Feedback Loop
Firms Have Earnings
Markets Go Up
Asset Values Go Up
Page 124
116
The feedback loop demonstrates the danger of overzealous application of fair-
value reporting. For assets that are independent of a company’s operations, this
feedback loop does not apply. For assets that are tied to the internal operations of
a company, this feedback loop could spiral in the opposite direction and have
adverse effects on not only the company but also the entire market. This feedback
loop interferes with the accurate portrayal of a company’s performance on the
income statement and therefore challenges my understanding of fair value
valuation of assets.
B. Scenarios
The three career scenarios below: consulting, risk-analysis, and audit are
presented to offer up context as to how consideration of the argument made
against the current balance sheet model of financial reporting by Dichev in “On
the Balance Sheet-Based Model of Financial Reporting” could impact a role
different careers that interact with corporate reporting.
i. Consulting
Although I plan to enter the audit profession, if I were to one day make the
move to consulting, this article would cause me to look beyond the income
statement figures when analyzing the health of a company. I could divide the
income statement and balance sheet figures into operating and financing activities
to gain a new perspective into the health of the company. By understanding the
critiques of the current model of reporting as presented in this article, I would be
Page 125
117
better equipped to evaluate earnings in a consultant role to provide valuable
insights.
i. Risk analysis
This article will elicit more cautious skepticism when approaching an
audit engagement. I will be required to adhere to FASB standards when auditing a
company, but I will be more skeptical of overzealous application of fair value
reporting. The feedback loop as presented in figure 1 effectively conveys the
dangers that fair value reporting conveys. Although the practice may be
acceptable under GAAP, I would be more aware of the risks of fair value
reporting for operating assets. This awareness could allow me to offer unique
insights to the company regarding their fair value reporting and add value to the
overall audit.
ii. Auditing
Although Columbia University’s paper provides an argument against a
balance sheet approach, the critique educated me on the balance sheet approach
that will drive many current and future FASB standards. The added context
surrounding FASB standards provided by this paper allows me to better
understand the motivation of FASB behind standard-setting and better-equip me
to apply the standards. If I am tasked with evaluating the GAAP-compliance of a
company’s earnings, I will more effectively do so if I understand how FASB
believes that earnings should be reported under the balance sheet approach. By
Page 126
118
understanding FASB’s position that changes in net assets are the basis for
evaluating earnings, I will better audit a company’s financials.
Conclusion
This case study forced me to consider why certain accounting concepts are the
way that they are. So much of what we learn in school we just take as fact but do not stop
to consider why that fact exists. I easily forget when learning accounting principles that
they are not laws of nature. Rather, accounting concepts and standards have been
established over time by people. It is worth considering alternatives to certain accounting
concepts, such as the balance sheet model of reporting, to understand why standard-
writers created the standards the ways that they did.
Page 127
119
Case Twelve
Earnings Announcements
3 May 2019
Page 128
120
Introduction
This case study examines non-GAAP earnings as well as general press releases by
corporations. The company used to facilitate this learning is Google. Google’s non-
GAAP earnings and their reconciliation to GAAP earnings are analyzed for
appropriateness and enhanced information reporting. The correlation between earning
announcements and stock prices is also analyzed. This case study elicits an increased
understanding of non-GAAP reporting as well as the importance of effective corporate
communication via press releases. Additionally, thorough analyzation of movements in
stock prices and their causes creates an enhanced understanding of the stock market. This
case demonstrates the ripples of a company as large as Google’s financial reporting on
the stock market and through the news. This ripple effect of financial reporting
emphasizes the importance of accurate financial information, since inaccurately reported
positive financial results can artificially inflate the stock market in cases only for the
bottom to fall out and cost unknowing investors.
A. Analysis of Google’s Press Release: “Google Announces Fourth Quarter and
Fiscal Year 2013 Results”
i. How Google Arrived at non-GAAP Financial Measures as Mentioned
in the Press Release
Google cites in its press release GAAP net income of $3.38 billion
and non-GAAP earnings of $4.10 billion (Duncan 3). To arrive at non-
GAAP net income, Google makes adjustments to GAAP net income to
eliminate expenses related to stock-based compensation (SBC) and other
Page 129
121
special items that are infrequent in nature, such as a restructuring charge,
and to eliminate the net loss from discontinued operations net of tax . The
company believes that these adjustments provide metrics regarding
Google’s core operations that are useful to both management and investors
in decision-making.
The removal of infrequent special items and the net loss from
discontinued operations indeed provides a useful metric on the company’s
current and future income and cash flows, since the charges to GAAP net
income are unlikely to persist on an annual basis. However, the
elimination of SBC does not accurately portray future income and cash
flows, since the charges will persist on an annual basis. Google does
acknowledge this weakness in its non-GAAP net income. However,
Google states that the rationale behind removing SBC is to eliminate
expenses that are not indicative of its “recurring core business operating
results” (Duncan 5). The argument that SBC is not indicative of Google’s
recurring core business operations is fair to an extent, but the SBC could
be viewed as an ancillary investment in Google’s human capital, which
drives its operations. Since SBC is a recurring expense and it is incurred to
drive its operations, it is a useful metric to consider. Google likely
excludes SBC, because it is not a direct cost of its operations.
Page 130
122
B. Stock Market Reaction to Google’s 2013 Earnings Announcement on the
Stock Market
i. Google Stock Price Movement in 2013 within the Context of 2013
Earnings Performance
Google reported fiscal earnings of $12.9 billion in 2013, up from
$10.7 billion in 2012. Google’s stock price movement over the course of
2013 reflects this improved performance by Google, as it grows from a
little over $700 in January 2013 to $1,200 by February 2014 (Figure 12-1).
There is a spike in Google’s stock price that corresponds with Google’s
fourth quarter earnings from around $1,100 to $1,200. Along with the
bottom line, Google’s top line also grew over the course of 2013. This is a
good signal to investors that Google is growing its sales and core business.
Figure 12-1: Google Stock Performance Jan. 2013 through Feb. 2014
*The above graph and the markings on it were provided by the case study and is
included in the thesis to provide a reference for analysis (Drake 14).
Page 131
123
ii. Comparing Google’s 2013 Stock Price Performance to the NASDAQ
index
Google’s stock price rises at a much steeper rate than the broader
set of firms trading on the NASDAQ exchange. Over the course of 2013,
Google’s share price grew by over twice the rate that NASDAQ grew
(Figure 12-2). The market was therefore more confident in Google’s
future ability to sustainably grow its revenues and net income than it is for
the average company.
Figure 12-2: Google Stock Performance Jan. 2013 through Feb. 2014
versus NASDAQ Index
*The above graph and the markings on it were provided by the case study and is
included in the thesis to provide a reference for analysis (Drake 14).
iii. Stock Market Reaction to Google’s Press Release Announcing 2013
Earnings
The market perceived the earnings news in Google’s press release
as very good news. Before the press release and at the beginning of 2014,
Google’s share price was beginning to dip. However, after the press
Page 132
124
release was made available at the end of January 2014, Google’s stock
price rebounded significantly in February 2014. This is due to Google’s
2013 net income outperforming its 2012 net income and its 2013 fourth
quarter income outperforming its 2012 fourth quarter net income.
C. Google’s 2013 Earnings Announcement in the News
Whenever a company as large as Google reports their annual earnings,
major business reporting publications such as the Wall Street Journal are quick to
report on the earnings. This is because as demonstrated in Part B(i) on this case
study, the announcements mightily impact the company’s stock price. Significant
moves in the stock of a large and influential company such as Google Inc.
constitutes a newsworthy story. On the same day that Google released its
earnings, Rolfe Winkler wrote an article in the Wall Street Journal breaking down
Google’s earnings.
i. Google’s Fourth Quarter Revenue and Earnings Performance Against
Consensus Analyst Forecasts
According to Winkler’s article, Google’s revenues exceeded consensus
analyst forecasts by $1 million (Winkler). However, Google’s non-GAAP EPS
fell around $0.20 below consensus analyst projections. Regardless, Google’s
shares still rose by more than four percent after-hours. Since Google’s non-GAAP
performance compared to projections contradicts with the positive stock market
reaction, investors likely put much less stock in Google’s non-GAAP earnings
Page 133
125
than its GAAP earnings. Google’s GAAP performance compared to analyst
projections does coincide with the positive stock market reaction.
ii. Reported Other Factors Contributing to Market’s Reaction to
Google’s Earnings Press Release
Rolfe Winkler’s WSJ article points to a 31 percent growth in
advertisement clicks in 2013 as a major source of optimism for Google (Winkler).
Additionally, revenues related Google’s app sales on the Google Play store
doubled in 2013. Google’s sale of its failing Motorola division to Lenovo was
well-received by the market. Google’s increased investment in computing
resources and human capital encourages investors that Google is focused on
growth. Google’s cash balance grew which indicates that Google is currently
solvent.
Concerns noted by the article include an 11 percent dip in Google’s
revenue per click compared to 2012. The cause of this dip is the shift to mobile
device advertisements which yield a lower return. The decreased margins on
mobile advertisements is likely offset by the ad click growth that is provided by
the increased accessibility of mobile advertisements. If the company continues to
grow its ad-clicks, the decreased margins should not materially affect the
company. Although net income increased from 2012, the article reports that its
bottom-line results were disappointing (Winkler). Winkler’s article demonstrates
that perspectives on a companies’ earnings can vary. Although the market reacted
positively to the earnings announcement, some may see reason for concern or
disappointment in the earnings figure. This demonstrates that although reading
Page 134
126
articles on earnings announcements or watching stock movements is good for
gaining perspectives on a company’s earnings announcement, an astute investor
would look at the earnings announcement and annual report themselves in order
to form an original opinion on the earnings announcement, while taking various
perspectives (such as market movement and media commentary) into account.
Conclusion
This case study illustrated the wide-reaching impact of financial reporting of
publicly traded companies such as Google. The adherence to uniform accounting
standards, such as GAAP, is a necessity for a fair and transparent market. This case
demonstrated how a company can still legally manipulate its numbers to present
favorable results via non-GAAP earnings in Part A. However, non-GAAP reporting is
made possible only by clear disclosure of the non-GAAP nature of the manipulated
figures, as well as an accurate reconciliation of the non-GAAP figures to GAAP.
The case also demonstrated the large impact that earnings announcements have on
stock prices. In Figures 12-1 and 12-2, it was striking to me that looking at a graph of a
stock’s price over an entire year, you can visually see where the stock moved in response
a company’s released earnings. This fact emphasizes the need for sound adherence to
accounting standards. People who bought Google stock as a result of its earnings would
have unjustly suffered severe losses if Google’s earnings later were discovered to be
inaccurate.
Page 135
127
Works Cited
Case One
Baker, Pam. “Domo.” PCMAG, PCMAG.COM, 31 May 2018,
“Domo APIs.” Customize & Manage Domo | Domo, developer.domo.com/ manage-
domo.
“Domo.” Crunchbase, 2018, www.crunchbase.com/organization/domo#section-ipo-
stock-price.
“IT Self-Service & Governance Tools | Domo.” Connecting Your Data, Systems &
People, www.domo.com/solution/it-enterprise.
“Product Overview | Domo.” Connecting Your Data, Systems & People,
www.domo.com/product.
Target, Inc. Form 10-K 2017. Web. 4 September 2018.
Weinberger, Matt. “The CEO of $2 Billion Startup Domo: 'We've Been Lying to People'
so We Could Surprise Them with Our Master Plan.” Business Insider, Business
Insider, 22 Mar. 2016, www.businessinsider.com/domo-ceo-josh-james-interview-
2016-3.
Case Two
Drake, Michael, Ellen E. Engel, D E. Hirst, and Mary L. McAnally. Cases in Financial
Reporting. Preparing Financial Statements – Rocky Mountain Chocolate, Inc.,
2015. Print.
Page 136
128
Case Four
“Accounting for Certain Investments in Debt and Equity Securities.” FASB Statement of
Financial Accounting Standards No. 115. Financial Accounting Standards Board
(FASB). 1993. Norwalk, CT: FASB.
“Accounting News: Other-Than-Temporary Impairment of Investment Securities.”
Supervisory Insights. Federal Deposit Insurance Corporation (FDIC). 2005. Web.
https://www.fdic.gov/regulations/examinations/supervisory/insights/sisum05/
accounting_news.html. Accessed 2 October 2018.
Cantrell, Brett. Generic Bank: Accounting for Debt Securities Sales and Impairments.
2018. Oxford, Mississippi
“Codification of Staff Accounting Bulletins.” Topic 5: Miscellaneous Accounting. Part
CC. Impairments. U.S. Securities and Exchange Commission. Web. 2 October
2018.
“Financial Instruments – Credit Losses (Topic 326).” FASB Accounting Standards
Update No. 2016-13. Financial Accounting Standards Board (FASB). Norwalk,
CT: FASB.
Hurden, Martin, et al. “Preparing for the New Credit Loss Model.” PwC,
PricewaterhouseCoopers, 15 May 2017,
www.pwc.com/us/en/cfodirect/publications/in-the-loop/cecl-new-credit-loss-
model.html.
Page 137
129
“Recognition and Presentation of Other-Than-Temporary Impairments.” FSP FAS 115-2
and FAS 124-2. Financial Accounting Standards Board (FASB). 2009. FASB
Staff Position
“Risk Management Manual of Examination Policies.” Federal Deposit Insurance
Company [FDIC]. 2015. Section 2.1 – Capital. 2 October 2018.
https://www.fdic.gov/ regulations/safety/manual/
“Rules, Regulations, Related Acts.” Federal Deposit Insurance Company [FDIC]. 2000.
Part 325 – Capital Maintenance. https://www.fdic.gov/regulations/laws
/rules/2000-4400.html. Web. 2 October 2018.
Case Five
“2014 Honda CR-V LX 2.4L 4-Cyl. 5-Speed Automatic MPG.” Edmunds,
www.edmunds.com/honda/cr-v/2014/mpg/. Used to est monthly fuel cost
“2017 Census Data.” Census.gov, US Census Bureau, 5 Oct. 2018,
www.census.gov/data.html. used for population of cities
“Best Places to Live | Compare Cost of Living, Crime, Cities, Schools and More.
Sperling's BestPlaces.” Best Places to Live | Compare Cost of Living, Crime,
Cities, Schools and More. Sperling's BestPlaces, www.bestplaces.net/. used for
climate statistics
“Bridge Communities - Who We Are.” Bridge Communities,
www.bridgecommunities.org/Who-we-are/index.html.
Page 138
130
“Chicago: Economy.” Chicago: Economy - Major Industries and Commercial Activity,
Incentive ProgramsNew and Existing Companies, www.city-data.com/us-
cities/The-Midwest/Chicago-Economy.html.
“Climate for Chicago, IL.” Rssweather: Your Local Weather Feed,
www.rssweather.com/climate/Illinois/Chicago/. used for Chicago-specific climate
statistics
“Compare Auto Insurance Quotes Online.” QuoteWizard, quotewizard.com/auto-
insurance/.
Dietsche, Erin. “Chicago's $69.7 Billion Healthcare Industry Makes It a Hub for
Innovation.” MedCity News, MedCity News, 10 Sept. 2017,
medcitynews.com/2017/09/chicago-healthcare/.
“Getting Around Chicago | Trains, Parking, Taxis & Bike Sharing.” English,
www.choosechicago.com/plan-your-trip/transportation/getting-around-chicago/.
“Inspiration Corporation - About.” About Inspiration Corporation | Inspiration
Corporation, www.inspirationcorp.org/about-pages-15.php.
KPMG LLP. Building Your Retirement Savings as You Build Your Career. Building
Your Retirement Savings as You Build Your Career, KPMG, 2014.
Littman, Margaret. “The Climate and Geography of Nashville.” Moon Travel Guides, 14
June 2018, moon.com/2014/04/the-climate-and-geography-of-nashville/.
Nashville topography
“NeighborhoodScout.” NeighborhoodScout, www.neighborhoodscout.com/. In-depth
crime statistics
“RENTCafe.” RENTCafe - We Make Renting Easy, www.www.rentcafe.com/.
Page 139
131
SmartAsset, smartasset.com/.
“Statistics and Demographics.” Nashville Statistics and Demographics | Visit Nashville,
TN - Music City, www.visitmusiccity.com/plan/presskit/kitstatisticsdemographics.
Willman, H. B. Summary of the Geology of the Chicago Area. 1971.
Wu, Jonathan. “Average Cost Of Health Insurance (2018).” ValuePenguin,
ValuePenguin, 30 July 2018, www.valuepenguin.com/average-cost-of-health-
insurance#nogo. Determined monthly health insurance payment
Zillow, Inc. “Real Estate - 64,365 Homes For Sale.” Zillow, www.zillow.com/
homes/for_sale/.
Case Six
Drake, Michael, Ellen E. Engel, D E. Hirst, and Mary L. McAnally. “WorldCom, Inc. –
Capitalized Costs and Earnings Quality.” Cases in Financial Reporting, 2015.
Print
“FASB, Financial Accounting Standards Board.” CON 2 (as Issued), www.fasb.org/
Jsp/FASB/Page/PreCodSectionPage&cid=1176156317989.
Sandberg, Jared, and Rebecca Blumenstein, Staff Reporters of The Wall Street Journal.
“Accounting Spot-Check Unearthed A Scandal in WorldCom's Books.” The Wall
Street Journal, Dow Jones & Company, 27 June 2002,
www.wsj.com/articles/SB102512901721030520.
WorldCom, Inc.. 2001 Annual Report, 2001. Web. 12 November 2018.
https://www.sec.gov/Archives/edgar/data/723527/000100547702001226/
d02-36461.txt
Page 140
132
Case Seven
Drake, Michael, Ellen E. Engel, D E. Hirst, and Mary L. McAnally. “Starbucks
Corporation – Understanding Financial Statements.” Cases in Financial
Reporting, 2015. Print
Kieso, D. E., PhD, CPA, Weygandt, J. J., CPA, & Warfield, T. D., PhD. (2016).
Intermediate Accounting (16th ed.). Hoboken, NJ: John Wiley & Sons.
Starbucks Corporation. 2013 Annual Report, 2013. Web. 1 March 2019.
Case Eight
"BP Oil Spill Information." The Downs Law Group, bpclaimoilspill.com/
types-of-bp-class-action-lawsuits/property-damage/. Accessed 3 Apr. 2019.
BP p.I.c. 2011 Annual Report, 2011. Web. 2 April 2019.
Drake, Michael, Ellen E. Engel, D E. Hirst, and Mary L. McAnally. “BP p.I.c –
Contingencies.” Cases in Financial Reporting, 2015. Print
General Electric Company. 2017 Annual Report, 2017. Web. 2 April 2019.
Kieso, D. E., PhD, CPA, Weygandt, J. J., CPA, & Warfield, T. D., PhD. (2016).
Intermediate Accounting (16th ed.). Hoboken, NJ: John Wiley & Sons.
Gyo Lee, Y. , Garza‐Gomez, X. and Lee, R. M. (2018), Ultimate Costs of the Disaster:
Seven Years After the Deepwater Horizon Oil Spill. J. Corp. Acct. Fin, 29: 69-
79. doi:10.1002/jcaf.22306
Page 141
133
Case Nine
Drake, Michael, Ellen E. Engel, D E. Hirst, and Mary L. McAnally. “The Wendy’s
Company – Equity Method Investments.” Cases in Financial Reporting, 2015.
Print
"Guide Joint ventures and business partnerships." NIBusinessInfo.co.uk, Northern Ireland
Business Info, www.nibusinessinfo.co.uk/content/joint-venture-benefits-and-
risks. Accessed 10 Apr. 2019.
The Wendy’s Company. Form 10-K, 28 February 2013. U.S. Securities and Exchange
Commission EDGAR System. Web. 10 April 2019
Case Ten
Drake, Michael, Ellen E. Engel, D E. Hirst, and Mary L. McAnally. “Johnson & Johnson
– Retirement Obligations.” Cases in Financial Reporting, 2015. Print
Johnson & Johnson. 2007 Annual Report, 21 February 2008. Web. https://johnson
andjohnson.gcs-web.com/financialinformation/secfilings?field_nir_sec_form_
group_target_id%5B471%5D=471&field_nir_sec_date_filed_value=&items_per_
page=10&page=518. April 2019
Case Eleven
Ilia D. Dichev (2008) On the Balance Sheet-Based Model of Financial Reporting.
Accounting Horizons: December 2008, Vol. 22, No. 4, pp. 453-470.
Page 142
134
Case Twelve
Drake, Michael, Ellen E. Engel, D E. Hirst, and Mary L. McAnally. Cases in Financial
Reporting. Google Inc. – Earnings Announcements and Information Environment,
2015. Print.
Duncan, Julia. Google Inc. “Announces Fourth Quarter and Fiscal Year 2013 Results.”
Press Release. Google Inc. Web. https://abc.xyz/investor/
static/pdf/2013Q4_google_earnings_release.pdf. 30 January 2014.
Google Inc. 2013 Annual Report, 2013. Web. 3 May 2019.
Winkler, Rolfe. "Google Reports Higher Profit: Advertising Revenue Rose About 17% as
Users Continue to Click on More Ads." The Wall Street Journal. The Wall Street
Journal, WSJ.com. Accessed 3 May 2019. Originally published in The Wall
Street Journal [New York City], 30 Jan. 2014.