Accounting Transparency and the Term Structure of Credit Spreads Fan Yu ∗ University of California, Irvine First Draft: November 9, 2002 This Version: July 29, 2003 ∗ I thank Brian Bushee for sharing the AIMR corporate disclosure rankings data, Gaiyan Zhang for excellent research assistance, and the Cornell Johnson School for providing continued access to the Lehman Brothers Fixed Income Database. I am also indebted to seminar participants at McGill, Toronto, UC Irvine, USC, and the 2003 Western Finance Association Meetings for their valuable comments. Address correspondence to Fan Yu, UCI-GSM, Irvine, CA 92697-3125, E-mail: [email protected].
Transcript
Accounting Transparency and the Term Structure of Credit
Spreads
Fan Yu∗
University of California, Irvine
First Draft: November 9, 2002
This Version: July 29, 2003
∗I thank Brian Bushee for sharing the AIMR corporate disclosure rankings data, Gaiyan Zhang for excellentresearch assistance, and the Cornell Johnson School for providing continued access to the Lehman Brothers FixedIncome Database. I am also indebted to seminar participants at McGill, Toronto, UC Irvine, USC, and the 2003Western Finance Association Meetings for their valuable comments. Address correspondence to Fan Yu, UCI-GSM,Irvine, CA 92697-3125, E-mail: [email protected].
Accounting Transparency and the Term Structure of Credit
Spreads
Abstract
Theory predicts that the quality of a firm’s information disclosure can affect the term structure
of its corporate bond yield spreads. Using cross-sectional regression and Nelson-Siegel yield curve
estimation, I find that firms with higher AIMR disclosure rankings tend to have lower credit spreads.
Moreover, this “transparency spread” is especially large among short-term bonds. These findings
are consistent with the theory of discretionary disclosure as well as the incomplete accounting
information model of Duffie and Lando (2001). The presence of a sizable short-term transparency
spread can attenuate some of the empirical problems associated with structural credit risk models.
One of the most important questions in credit risk research is what constitute the corporate
bond yield spread. Ever since the seminal work of Merton (1974) that pioneered the structural
paradigm in credit risk modeling, researchers have attempted to justify the size of the credit spread,
apparently without much success. For example, the early study by Jones, Mason and Rosenfeld
(1984) shows that the Merton model severely underpredicts spreads across a large sample of bonds.
While the latest variants of the Merton model have managed to raise the level of the predicted
spread, systematic pricing errors remain. Eom, Helwege and Huang (2001), for instance, note that
many of the structural models still underpredict the spreads on short-term and safer bonds.
Researchers have also come to the realization that a substantial part of the credit spread is, in
fact, due to factors other than the default risk of the bond issuer. Direct and indirect evidences
abound, with a number of recent studies highlighting the role of state taxes and liquidity premium.
For example, for investment-grade corporate bonds, Elton et al. (2001) estimate a state tax premium
on the order of 40 bp, and Perraudin and Taylor (2002) and Houweling, Mentink and Vorst (2002)
estimate a liquidity premium on the order of 20 bp. Huang and Huang (2002) calibrate several
structural models to historical default probabilities. Applying standard estimates of the equity
risk premium, they conclude that less than 25% of the credit spread is actually due to credit risk,
with the percentage higher for junk bonds and less for short-term bonds. Alternatively, using a
reduced-form model with standard credit risk premium adjustments, Jarrow, Lando and Yu (2001)
find that bond-implied conditional default probabilities are in line with historical estimates at
long maturities, but are too high at short maturities. If anything, these studies indicate that our
understanding of the credit spread is far from complete. In particular, the behavior of the credit
spread at short maturities should be a focal point of future research.
This paper contributes to the extant literature by empirically identifying and analyzing a hereto-
fore ignored component of the default spread–in this case due to the imperfect observation of firm
value. It is well-known that reported total assets, as reflected through mandatory or voluntary
corporate disclosures, are at best an imprecise measure of the true firm value.1 Yet virtually all
of the existing structural credit risk models continue to define default as the first passage of a
1Recent corporate accounting scandals, such as those involving Enron, Authur Andersen, Worldcom, Adelphia,Global Crossing, Tyco, and Xerox, only serve to perpetuate this belief. Perhaps as further evidence of shoddy auditwork, the Wall Street Journal recently publicized a study that shows of the 228 publicly traded companies that filedfor Chapter 11 bankruptcy protection between 2001 and 2002, 42 percent were given a clean bill of health by auditorswithin a year of the filing.
1
perfectly measured firm value to a default boundary. Duffie and Lando (2001, DL) is a notable
exception–they show that the lack of precise knowledge of a firm’s value process can lead to a
different prediction on the shape of the term structure of credit spreads.2 The most dramatic im-
plication is that firms with perfect asset reports have zero credit spreads as maturity approaches
zero, while firms with noisy asset reports have positive credit spreads under the same limit. With
conventional parameters, this gap becomes substantial only when maturity is less than approxi-
mately 3 years. Therefore, a “transparency spread” could conceivably help to resolve the short-end
credit spread puzzle in structural models.3
Following an extensive accounting literature on corporate disclosure quality, I use the annual
AIMR corporate disclosure rankings to proxy for the perceived precision of the reported firm value.
This ranking represents financial analysts’ assessments of the completeness, clarity, and timeliness
of firms’ disclosure policies. It is the most extensive measure of disclosure quality that one can find,
spanning the period from 1979 to 1996 and covering hundreds of firms and more than 40 industries
each year.
Two methods are used to estimate the effect of perceived accounting transparency on the term
structure of credit spreads. In the first approach, I adopt a cross-sectional regression framework,
where the dependent variable, the credit spread, is defined as the difference between the yield to
maturity on a corporate bond and the interpolated constant maturity Treasury yields. This is
regressed on disclosure ranking, controlling for structural variables such as equity volatility and
debt to equity ratio, and liquidity proxies such as issue size and bond age. Term structure effects
of disclosure quality are specified by a piecewise linear function of bond maturity, allowing for
differential impact at short, medium, and long horizons. Although panel data are available, a
cross-sectional regression approach is preferred because disclosure quality does not vary much in
the time-series. More importantly, credit spread changes in the time-series are mostly driven by
market factors that tend to overwhelm the effect of firm-level characteristics.4
2DL assume the reported assets as the true firm value plus a normal noise term. However, imprecisely observedfirm value can be modeled in other ways. For example, Cetin et al. (2002) assume that investors can only access acoarsened version of the manager’s information set. Giesecke (2001) models an imperfectly observed default boundary.Collin-Dufresne, Goldstein and Helwege (2002) assume that firm values are observed with a lag. In CreditGrades(2002), an industry implementation of the Merton model, short-term spreads are almost entirely generated by thedefault barrier uncertainty.
3Unlike liquidity and tax spreads, the transparency component is a part of the default spread. It therefore doesnot help to boost spreads in a reduced-form model that takes the physically observed default rate as a given input.
4Collin-Dufresne, Goldstein and Martin (2001) suggest, and King and Khang (2002) confirm, that the time-series
2
While the regression framework offers flexible specifications and efficient use of the data, its
scope for estimating potentially nonlinear term structure effects is limited, and neither is its use
of yield to maturity a clean way to measure the true bond risk for a given horizon. On the other
hand, the Nelson and Siegel (1987) yield curve estimation procedure is particularly suitable for
this purpose. Hence, in the second approach, I sort bonds into groups by their issuers’ leverage
ratio, equity volatility, and disclosure ranking, and then estimate Nelson-Siegel yield curves for
each group. A comparison of the yield curves across, say, the high and low disclosure groups with
the same leverage ratio and equity volatility groupings, allows one to see the impact of perceived
accounting transparency on the entire credit spread term structure in a graphical way.
I do not use credit rating to control for the cross-sectional determinants of credit spreads other
than disclosure quality. This is because the major rating agencies claim to have incorporated the
quality of information disclosure in their credit ratings. It is possible, however, to investigate the
validity of this claim. While the two are certainly related, I show that credit rating does not fully
absorb the effect of information disclosure–among issuers with the same credit rating, those with
higher disclosure rankings have lower credit spreads.
Despite the availability of analytic formulas for zero-coupon bond prices, I do not attempt to
conduct any structural estimation of the DL model. Instead, only qualitative predictions of the
model are taken to the data. This is because the DL model is based on many stylized assumptions
that abstract away from realistic features of credit spreads.5 However, the intuition that a firm is
close to instantaneously default-free if one is reasonably sure that its value is above some type of
default boundary should survive even in more complex settings.6 Ultimately, how strongly the term
structure of credit spreads relates to perceived accounting transparency is an empirical question.
variation in credit spreads is determined primarily by bond market factors. On the other hand, King and Khang showthat the cross-sectional variation in credit spreads is mostly explained by leverage ratio, equity volatility, issue size,and bond age. The first two play an important role in structural credit risk models, while the last two are thoughtto be proxying for a liquidity component.
5For example, the term structures of credit spreads in DL are downward-sloping for all but short maturities whileestimations show that they are typically upward-sloping [see Helwege and Turner (1999)]. This can be rectified if weassume stationary leverage ratios so that the default boundary migrates upward over time along with firm value [seeCollin-Dufresne and Goldstein (2001)]. The DL model also ignores stochastic interest rate and other determinants ofbond spreads, such as liquidity, taxes, and variables proxying for general market conditions.
6An exception occurs if firm value contains a jump component [see Zhou (2001)]. However, it is conceivablethat there could be a negative association between the AIMR disclosure score and the likelihood and magnitude ofdownward jumps in firm value. In this case, a similar relationship between disclosure quality and the credit spreadterm structure remains. This question is addressed in a companion paper by linking disclosure quality with theoption-implied volatility smile.
3
This paper is closely related to a large body of accounting literature employing the same AIMR
disclosure rankings data. Motivated by the theoretical work on discretionary disclosure, accounting
researchers have focused on the effect of corporate disclosure quality on the cost of capital. The
theory of discretionary disclosure, starting with Verrecchia (1983), Darrough and Stoughton (1990),
and Feltham and Xie (1994), predicts that firms will withhold private information when disclosure
is costly. More recently, Shin (2003) shows that a “sanitization” policy, in which only good news is
disseminated, can be supported in equilibrium.7 This theory suggests that the reported firm value
is upward-biased, with the extent of the bias negatively related to disclosure quality. As a result,
investors will penalize a lower disclosure quality by charging a higher spread on the firm’s debt. In
contrast, in the DL incomplete accounting information model where a similar conclusion is reached
for only the short-end of the term structure, accounting reports are an unbiased version of firm
value.
While studies such as Sengupta (1998) and Mazumdar, Sarin and Sengupta (2002) have identi-
fied a negative relation with the cost of debt, they differ from this paper in several key aspects. First,
by ignoring the maturity dimension of bonds and bank loans, these studies are silent on potential
term structure effects that can be quite dramatic according to DL. Second, the focus on the cost of
capital leads to the use of offering yields in these studies, while this paper uses secondary market
yields due to its focus on bond pricing. To the extent that security issuances, often accompanied
by self-interested disclosures, are plagued by adverse selection and the lemons problem, offering
yields will be much more sensitive than secondary yields to the perceived accounting transparency.
Therefore, in some sense, this paper provides a lower bound on the effect of disclosure quality on
the term structure of credit spreads.
The main part of this paper is organized as follows. Section 1 presents a brief description of the
DL model and uses comparative statics to illustrate the term structure effects of perceived account-
ing transparency. Section 2 documents the major variables used in later analysis and explains the
construction of the data sample. Section 3 discusses regression and yield curve estimation results.
Section 4 concludes.7Consistent with theory, Lang and Lundholm (1993) find that the AIMR disclosure score is increasing in firm size
and performance, and higher for firms issuing securities.
4
1 Testable Hypotheses
Duffie and Lando (2001, DL) are the first to investigate the role of incomplete accounting infor-
mation in structural credit risk models. Their intuition is a strikingly simple one. In traditional
structural models, the firm value is a perfectly observable diffusion process. Conditional on the
firm value being a finite distance above a suitably defined default boundary, the probability that
it will cross this boundary in the next ∆t is o (∆t), implying that credit spreads will disappear as
bond maturity shrinks to zero.
In contrast, if firm value is periodically reported with noise, investors can compute a distribution
of total assets conditional on the noisy reports plus whether the firm is currently in default. The
distinguishing feature is that now there is a small probability that the true firm value actually lies
close to the default boundary and can cross over easily within a short period of time. According to
DL, this is enough to produce a default probability within the next ∆t that is O (∆t), giving rise
to a positive credit spread at zero maturity.
[Insert Figure 1 here]
These insights are borne out in Figure 1, which reproduces the base case of DL.8 The first panel
presents the term structure of credit spreads, and the second panel the distribution of firm value
conditional on the reported assets and survival, for various accounting precisions (the parameter a
measures the standard deviation of the normal noise added to the true firm value). When a = 0.01,
firm value is reported with an almost perfect precision. We see that the credit spread approaches
zero as maturity shortens to zero. With almost perfectly observed firm value above the default
threshold, the probability that the firm value is in fact near the boundary and can cross it in
a short period of time is minuscule. As a assumes larger values, this probability becomes more
substantial, resulting in positive limits instead.
[Insert Figure 2 here]
Additional implications are illustrated in Figure 2. The first panel is the DL base case, the
second assumes a lower asset volatility, and the third assumes higher lagged and current reported8To generate Figures 1 and 2, I use a slighted modified DL model with a recovery of Treasury assumption. This
avoids their double integral and preserves all essential results. Specific formulas and numerical values used in thesefigures are available upon request.
5
assets, capturing the effect of lower firm leverage. Since credit spreads always have to reach zero
at the short-end under prefect transparency, Panels 2 and 3 are a “compressed” version of Panel 1,
which indicates that the absolute magnitude of the effect of transparency is lower for higher quality
debt.
Realistic credit spread term structures may depart from those of the DL model in several ways.
First, they are usually upward-sloping. As mentioned earlier, this can be justified by changing
the flat default barrier in the DL model into one that grows at the same rate as the firm value,
maintaining a stationary leverage ratio. Second, since the credit spread may contain liquidity and
tax premiums, even in the case of perfect transparency one still may not have zero credit spread
in the short-end. Assuming that liquidity and tax premiums are relatively insensitive to the cross-
sectional variation in credit quality, this would suggest that transparency premium is proportionally
more important for lower quality debt. Third, the theory of discretionary disclosure may produce
different results from the DL model, which assumes an exogenous level of transparency.
Panel 4 of Figure 2 presents a scenario which illustrates the difference between the DL model
and one that considers discretionary disclosure. In this scenario, the current report is substantially
lower than the lagged report, which leads to the counterintuitive result that a higher transparency
is associated with higher spreads for most of the term structure. To understand this result, I note
that in the first three cases, the conditional distribution of firm value is more or less centered around
the current report (see the conditional density panel in Figure 1). One can therefore consider the
true firm value as an approximately “unbiased version” of the current report. Since bond price is a
concave function of firm value under complete information, Jensen’s inequality implies that bond
price (credit spread) would decrease (increase) when accounting reports become less precise. In
the last case, firm value starts relatively high and is subsequently reported to be low. With a high
accounting precision of a = 0.01, the starting firm value is irrelevant.9 However, as a increases,
the current report becomes more of an aberration due to accounting noise than a measure of true
firm value. The mass of the conditional distribution would then shift to higher firm values, causing
credit spreads to decrease. With discretionary disclosure, this case would not arise because firms will
optimally choose not to reveal the bad news in the first place. In other words, this case highlights
the importance of an extension of the DL model where the quality and timing of disclosures become
9Note that the term structures in Panel 1 and Panel 4 corresponding to a = 0.01 are almost identical.
6
an endogenous choice on the part of the firm.
The complexities of the issue, as illustrated in the preceding discussion, suggest that fitting the
pricing formulas of the DL model may not be the most suitable approach here. To avoid potential
misspecifications of the model, it seems appropriate to follow a more flexible approach such as linear
regression or yield curve estimation. To this end, one first needs to formulate testable hypotheses
that bring out the qualitative predictions of the various theories on disclosure. The main hypotheses
considered in this paper are:
H1 Firms with higher perceived accounting transparency have lower levels of credit spreads.
H2 This “transparency spread” is more pronounced at short maturities.
Of the above hypotheses, H2 is unique to the DL analysis. It is an untested hypothesis that can
potentially be a step toward the resolution of a bigger puzzle in credit risk research. Hypothesis
H1, attributed to the theory of discretionary disclosure, has found some empirical support from
the accounting literature on the cost of debt. The term structure effect of discretionary disclosure,
however, is less obvious. One can imagine that it would very much depend on the nature of
information that a firm tries to conceal. A temporary shock to firm value, such as a one-time
charge due to legal settlement or trading loss, affects the spreads on short-term debt more than
those on long-term debt. A more permanent shock to firm value, such as a negative outlook on
the firm’s earnings growth rate, hardly affects its short-term debt spreads, but causes its long-term
debt spreads to increase. The positive networth requirement, effectively part of the short-term
debt covenant, suggests that firms have little incentive to conceal information that they may soon
be forced to disclose.10 This seems to indicate that discretionary disclosure would mostly affect
long-term credit spreads.
One must note that these hypotheses should be understood with the qualification “other things
equal,” meaning that one ought to control for other cross-sectional determinants of credit spreads
such as asset volatility, distance to default, bond liquidity, etc. Asset volatility and distance to de-
fault are crucial ingredients of any structural credit risk models, including DL. The term structure
of liquidity spreads may be downward-sloping according to Ericsson and Renault (2001), and thus
10For discussions on short-term debt and positive networth requirements, see Leland (1994) and Toft and Prucyk(1997).
7
could partly be responsible for the short-end credit spread puzzle. These control variables are espe-
cially important as corporate disclosure quality has been shown to depend on firm characteristics
such as size and stock return performance.
I do not use credit ratings as a control variable because rating agencies specifically list the
quality of information disclosure as a determinant of ratings. One can, of course, examine whether
credit rating and disclosure quality are related and whether the former is a sufficient statistic for
the latter in explaining credit spreads.
2 Data
To test the effect of accounting transparency on credit spreads, three separate data sources are
required. First, an extensive dataset of corporate and Treasury bond prices is needed to compute
credit spreads. Second, there must be a way to reliably measure the accuracy of accounting infor-
mation. Last but not least, one needs to control for issuer and issue characteristics that can affect
credit spreads in the cross-section. In this section, I document the major variables used in later
analysis and present some useful summary statistics of the sample.
1. Credit spreads (CS).
I compute CS as the difference in yield to maturity between a corporate bond and a U.S.Treasury
bond with the same maturity. Corporate bond yields are obtained from the Lehman Brothers
Fixed Income Database described in Warga (1998). This database contains month-end bid
quotes and other characteristics of individual bonds, spanning the period 1973-1998. The
associated Treasury yields are obtained by linearly interpolating Benchmark Treasury yields
from Datastream for maturities of 1, 3, 5, 7, 10, and 30 years. These are available at the
beginning of each month from 1986 onward.
2. Accounting transparency (DISC).
Following an extensive accounting literature,11 I use the annual ranking of corporate disclosure
practices published by the Association for Investment and Management Research (AIMR) to
11For more detailed accounts of this data, see Lang and Lundholm (1993, 1996), Welker (1995), Sengupta (1998),and Bushee and Noe (2000).
8
measure the transparency of accounting information. The complete dataset covers the period
1979-1996, with 8,735 firm-year observations.
Each year, the AIMR selects leading analysts to serve on industry subcommittees. These
committees first meet to decide on the set of firms to be evaluated and the criteria for the as-
sessment. Then, each member scores a firm on the basis of the adequacy, timeliness and clarity
of its information disclosure on a scale of 0 to 100 in three categories: annual reports, quar-
terly reports, and investor relations. These scores are averaged across committee members
and aggregated into a total disclosure score. To ensure a somewhat uniform standard, AIMR
provides each committee with a comprehensive checklist of scoring criteria and guidelines on
the weights for each disclosure category. The use of industry specialists and the consensus
scoring process reduces the idiosyncratic element of the rankings. Furthermore, individual
analyst scores are never made public, diminishing the incentive to manipulate rankings for
personal gain.
Since bond investors are likely to be interested in all types of disclosures, I use total disclosure
scores in subsequent analyses. I follow Bushee and Noe (2000) and others in converting the
raw total scores into percentile ranks using
DISC =100× (number of firms in industry− rank of score)
number of firms in industry − 1 . (1)
As the scores given by different industry subcommittees may not be directly comparable, this
is one way to “align” the scores across different industries.12 For the purpose of matching
with other data, including month-end credit spreads, I assume that the ranking for year t
applies to the period from July 1 in year t− 1 to June 30 in year t.
3. Maturity (MAT).
I include the maturity of a bond in order to describe the shape of the credit spread term
structure. On average, the term structure of credit spreads is upward-sloping [see Helwege
and Turner (1999)]. Therefore, longer maturity should be associated with higher yield spreads.
However, in subsequent analyses I will mostly use modifications of the maturity variable in
12Another approach is to take the industry differences in the disclosure scores as actually meaningful. Appealingto the care that AIMR exercises in ensuring the uniformity of the scoring process across industries, Sengupta (1998)and Welker (1995) use raw total scores in their analyses.
9
order to define a piecewise linear term structure.
4. Leverage (LEV).
Structural credit risk models predict that the distance between current firm value and the
default boundary is positively related to credit spreads. This “distance to default” can be
proxied by the firm’s leverage ratio. In this paper I define firm leverage as
LEV =book value of debt
market value of equity+ book value of debt. (2)
For each month in the sample period, the market value of equity is obtained by multiplying
the month-end stock price and the number of shares outstanding, both available from CRSP.
The book value of debt is taken to be total debt from COMPUSTAT, reported annually prior
to 1992 and quarterly since then. Because debt levels are fairly stable over time, I linearly
interpolate monthly figures.
5. Equity volatility (VOL).
Structural models also predict that the volatility of firm value is positively related to credit
spreads. In the absence of a market-based measure of firm value, I choose equity volatility
instead. This would be a function of both asset volatility and leverage, but the link to asset
volatility is monotonic. Specifically, for each month in the sample period I compute the
annualized standard deviation of daily stock returns over the preceding 12 months. The daily
stock returns from CRSP are used to compute this historical measure of volatility.
6. Bond age and amount outstanding (AGE and LSIZE).
As liquidity proxies, I obtain bond age and issue size from the Lehman database. AGE is
defined as the difference (in years) between the settlement date and the issuing date. LSIZE
is defined as the logarithm of the dollar amount outstanding of the bond issue (in million
dollars). Bond age has been shown to relate positively, and issue size negatively, to credit
spreads [see Warga (1992) and Perraudin and Taylor (2002)]. Generally speaking, the older a
bond becomes, the less often it will transact, implying a lower price and a higher spread. On
the other hand, a larger issue size is associated with more investor interest, more secondary
market trading, and consequently, lower spreads. A larger issue size may also benefit from
the economy of scale in underwriting costs.
10
7. Credit rating (RTNG).
For each month-end observation in the Lehman database, credit rating information is pro-
vided. This is given in numerical grades: 1-Aaa+, 2-Aaa, 3-Aa1, 4-Aa2, 5-Aa3, 6-A1, 7-A2,
8-A3, 9-Baa1, 10-Baa2, 11-Baa3, etc. I use Moody’s rating unless it is not available, in which
case S&P’s rating is substituted. In Section 3 I test whether credit rating subsumes the
explanatory power of disclosure for credit spreads.
These major variables can be classified as follows:
Dependent variable–CS
Issuer characteristics–DISC, LEV, VOL
Issue characteristics–MAT, AGE, LSIZE, RTNG
To construct the sample, I first select a subset of corporate bonds from the Lehman database.
Following common practice, for each month in the database I choose industrial corporates, excluding
callable, putable, and sinkable bonds as well as those with matrix quotes, or with maturities less
than 1 year or greater than 30 years.13 I then merge the subset of corporate bond yields and issue
characteristics with the data on disclosure, leverage ratio, equity volatility, and Treasury yields. To
ensure sufficient dispersion in disclosure quality in the survived sample of firms, those industries
(AIMR classification) with a zero dispersion in disclosure quality are eliminated. I also find that
prior to 1991 the data do not provide enough complete observations on all major variables (fewer
than 100 bonds remaining). Therefore, I focus on January 1991 to June 1996, a period of 66
months.
[Insert Table 1 here.]
Table 1 presents the total sample size over time as well as the breakdown into credit rating
and maturity subsamples. These figures are noted because subsequent regression and yield curve
analyses are often performed for these subgroups. We see that the sample size generally increases
13Financial bonds are typically treated separately from industrial bonds due to substantial differences in the capitalstructures of financial and industrial firms. However, there are not enough financial bonds after merging with thedisclosure data. I exclude bonds with less than one year in maturity because their prices are less reliable. For example,bonds are automatically dropped from Lehman bond indices when their maturities are less than one year. See Duffee(1999) and Elton, Gruber, Agrawal and Mann (2001) for more details on the selection criteria.
11
over time, starting with just over 100 bonds at the beginning of 1991 and ending with about 250
bonds in 1996. These bonds are more or less evenly distributed among short-term (maturity less
than 5 years), medium-term (between 5 and 10 years), and long-term (between 10 and 30 years)
subgroups. In addition, close to half of the bonds are rated A, and the rest are evenly split between
Aa or above and Baa bonds. Very few are rated below investment-grade.
[Insert Table 2 here.]
[Insert Table 3 here.]
Summary statistics of the major variables are presented below. As shown in Table 2, the average
bond issue in the entire sample period is associated with a credit spread of 90 bps, a maturity of 10.7
years, a total disclosure score of 65.4, a leverage ratio of 32.5%, an annualized stock return volatility
of 25.8%, an age of 2.7 years, an amount outstanding of $210 million, and a Moody’s credit rating of
A2 (numerical grade of 7 in the Lehman dataset). Table 3 presents the average monthly correlations
among the major variables in the entire sample period. Notably, the correlations between credit
spread and the explanatory variables are mostly in agreement with theory. Furthermore, disclosure
quality is negatively related to both leverage and asset volatility.
3 Empirical Tests
In this section I test the main hypotheses H1 and H2 using cross-sectional regressions and Nelson-
Siegel yield curve estimations.
3.1 Cross-Sectional Regressions
3.1.1 The Level Effect
An important difference between this study and Sengupta (1998) is the use of secondary market
yields versus the use of offering yields. The theory of discretionary disclosure suggests that ac-
counting transparency would make a larger impact on offering yields due to a greater degree of
information asymmetry around security issuances. Using a smaller sample from 1987 to 1991, Sen-
gupta (1998) estimates that a 100 point increase in the raw AIMR disclosure score is accompanied
by a 120 bp reduction in the offering yield. For secondary market yields one would expect the
12
impact to be much less. After all, firms tend to disclose information prior to security offerings,
while the Lehman bond database provides regular monthly quotes that are not anchored to any
particular corporate event. To highlight this difference, I replicate Sengupta’s study by estimating
the following cross-sectional regression for each month in the sample period:
Apart from the disclosure and term structure related variables, I have included a set of regressors
with the most explanatory power for credit spreads in the cross-section [see King and Khang (2002)].
The predicted relation between credit spreads and the independent variables is listed in Table 5.
[Insert Table 6 here.]
Table 6 summarizes the results of the cross-sectional regression (8). Similar to the results
reported in Table 4, the effect of disclosure is absent during the first half of the sample, but becomes
much stronger in the second half. Focusing on the third column of the table, the estimated term
structure parameters imply that the difference between low and high disclosure term structures is
31 bp at maturity zero, 11 bp at 5 years, 14 bp at 10 years, and 34 bp at 30 years.14 The 31 bp
spread at zero maturity represents a significant increase over the 19 bp overall level effect estimated
in Table 4. Its size is substantial considering that the average credit spread in the sample period
is only 90 bp. Certainly, the magnitude indicates that this is a source of investment-grade credit
spread perhaps no less important than those identified by other researchers, such as liquidity and
tax components. It is also noted that the positive estimate for DM0 (implying a higher short-end
slope for the high disclosure term structure) causes the transparency spread to narrow significantly
in the medium-term, consistent with the predictions of the DL model. However, a negative estimate
for DM10 causes the transparency gap to widen in the long-term. This is a pattern not predicted
by the DL analysis, but is consistent with firms hiding information that would adversely affect their
long-term outlook.
To the extent that there is a term structure of liquidity spreads, the estimated term structures
may be sensitive to the inclusion/exclusion of liquidity proxies. In principle this should affect the14For the entire sample, the transparency spread is a weaker 11 bp at maturity zero, 3 bp at 5 years, 9 bp at 10
years, and 9 bp at 30 years. For the first half of the sample, the effect is ambiguous, at -12 bp at maturity zero, -6bp at 5 years, 4 bp at 10 years, and 11 bp at 30 years.
15
short-end more since with a smaller maturity the sample should mostly consist of older bonds
approaching the end of their lives (hence homogeneous in having higher liquidity risk). Yet Table
6 shows no significant change in the term structure estimates when excluding AGE and LSIZE.
Combined with the fact that these liquidity proxies are significant when included, I conclude that
the term structure of liquidity spreads is flat and unlikely to affect the main inference.
A related complication for short-term bonds is that their greater age potentially allows investors
more time to learn about the quality of their issuers, in turn leading to higher sensitivity to
disclosure quality. To address this concern, I note that short-term bonds (with maturity less than 5
years) in the sample have an average age of 3.3 years compared to 2.7 years for all bonds. It seems
unlikely that this small difference is responsible for the substantially larger short-term transparency
spread. Furthermore, this explanation is inconsistent with offering yields being even more sensitive
to disclosure quality, as it implies that investors would have had no time to learn the relevant
parameters.
3.1.3 Nonlinear Effects
There are several reasons to believe that the relationship between disclosure and credit spreads
should be conditioned on the credit quality of the issuer. Take firm leverage and volatility for
example. Figure 2 shows that disclosure quality has a smaller effect on credit spreads for low
leverage and volatility firms simply because the overall level of the spread is lower. Furthermore,
structural models tend to impart a nonlinear relation between key inputs, such as leverage and
volatility, and credit spread. Therefore, for each month in the sample period, I separate the firms
into high and low leverage and volatility groups by the respective medians, and then perform the
regression in equation (8) for each group.15
[Insert Table 7 here.]
An obvious conclusion from Table 7 is that disclosure quality has no effect on higher quality
issuers. For example, for the low leverage group the estimates imply a transparency spread of -5
bp at zero maturity, 6 bp at 5 years, 6 bp at 10 years, and 2 bp at 30 years. For the low volatility
group the numbers are, respectively, 1, 3, 4, and 15 bp. The average credit spread for these groups
15Since the effect of disclosure is stronger in the second half of the sample period, the remaining analyses focus onthe period from July 1993 to June 1996.
16
is about 60 bp, between the typical level of spreads on Aa- and A-rated bonds. It seems that very
little of this average spread is caused by differences in disclosure quality.
In contrast, for the high leverage and volatility groups the effect of disclosure quality is dramatic.
For the high leverage group, the transparency spread is 102 bp at zero maturity, 28 bp at 5 years, 25
bp at 10 years, and 63 bp at 30 years. For the high volatility group the numbers are, respectively,
60, 9, 19, and 39 bp. The average credit spread for these groups is about 110 bp, between the
typical level of spreads on A- and Baa-rated bonds. Therefore, transparency spread is a major
component of short-term credit spreads for a significant portion of investment-grade bonds.
It is possible that the lack of significance of DISC and DISC_MAT in low leverage and volatility
groups is due to less variation in the disclosure variable among these groups. In an extreme case,
firms with below-median leverage or volatility all have perfect disclosure scores, and a regression
would not be able to identify any relation between disclosure and credit spread. I check summary
statistics each month and look for differences in the dispersion of disclosure scores between the low
and the high groups. As expected from the small correlation between DISC and VOL (see Table 3),
there is virtually no difference when sorting by volatility. There is a large difference when sorting
by leverage, but the low leverage group still exhibits substantial variations in disclosure scores with
a typical mean of 80 and standard deviation of 20, in contrast with 60 and 30 for the low group.
3.1.4 Credit Rating
In the previous regressions I do not use credit rating in any way. This is because rating agencies
claim that credit rating already contains information regarding perceived accounting transparency.
The validity of this claim can be tested in two ways. First, one can conduct a cross-sectional
regression with credit rating (RTNG) as the dependent variable. Since it is conceivable that firms
with bad accounting quality and zero leverage will probably have a high credit rating and never go
bankrupt, I condition the estimation on firm leverage and equity volatility as in Table 7. Second, one
can replicate the cross-sectional credit spread regressions with RTNG as an additional independent
variable. This allows one to check whether disclosure quality continues to have the same impact
on credit spreads when credit rating is included.
[Insert Table 8 here.]
17
Table 8 presents the estimation of the following regression equation:
In comparison to the results in Table 7, I note that the adjusted R2 has increased substantially,
while the explanatory power of leverage and volatility has been reduced. This is consistent with
credit rating being determined from traditional structural variables plus information not captured
by the major variables included in this study. I also note that the inclusion of credit rating has
not rendered the disclosure measure irrelevant for the low quality issuers. In fact, for the high
leverage group the transparency spread is 51 bp at zero maturity, 12 bp at 5 years, 16 bp at 10
years, and 46 bp at 30 years. For the high volatility group, these figures are, respectively, 52, 2,
8, and 32 bp. The effect appears to be only marginally smaller than those identified in Table 7.
In summary, credit rating is indeed correlated with the disclosure quality of the issuer. However,
the term structure effect of disclosure quality on credit spreads remains even after considering the
information contained in credit ratings.
18
3.2 Nelson-Siegel Yield Curve Estimation
As a further robustness check of the regression results, in this subsection I extract Nelson-Siegel
yield curves from the monthly subsamples. Although I have adapted the linear regression framework
to the estimation of an inherently nonlinear object and uncovered some serious evidence supporting
the major hypotheses H1 and H2, there are more appropriate tools to address the same problem.
The main advantages of the Nelson and Siegel (1987) approach are: 1) an entire yield curve is
estimated instead of the piecewise linear approximation obtained with regressions; 2) the discount
function is used in the estimation instead of yield to maturity, which can complicate regression
results due to coupon effects. The disadvantage of yield curve fitting is that one must have a large
number of bonds with relatively homogeneous characteristics.
To estimate the effect of transparency, one must have yield curves from two groups of bonds
that differ only in their quality of disclosure. If one simply sorts bonds according to their disclosure
scores, the resulting low disclosure group may have higher yields not because of lower disclosure, but
higher credit risk due to the negative association between disclosure and the structural variables.
To avoid this pitfall, one can sort bonds into bins by other determinants of the credit spread, split
each bin into high and low disclosure groups, and then estimate a yield curve for each disclosure
group in each bin.
If the sorting is too fine and the resulting bins too small, one risks not having enough dispersion
of disclosure quality in the bins. This problem can be serious since the disclosure dummies are
defined at the industry level, further reducing the sample size and dispersion that one can work
with. As a compromise I use only two variables in the initial sort and only two subgroups each (low
and high) are formed, resulting in a total of 4 bins. I use leverage and volatility as the two sorting
variables since they consistently have high predictive power in all of the cross-sectional regressions.
A typical application of the Nelson-Siegel procedure is to extract yield curves for bonds with the
same credit rating [see Elton et al. (2001)]. Since ratings may contain information about disclosure
quality, this is not a good way to study the effect of transparency on credit spreads. However, this
application can provide an economic measure of accounting transparency that is not fully captured
by agency ratings, thus may be of some practical value.
19
3.2.1 Methodology
In addition to the major variables summarized in Section 2, I obtain bond coupon, first coupon
date, bid price and accrued interest from the Lehman database. With a discount function, one can
then compute the theoretical price of the bond. Nelson and Siegel (1987) assume that the discount
function takes the form
R (t) = a+ b
µ1− e−dtdt
¶− ce−dt, (11)
where a, b, c and d are constants. Each month, I fit this four-parameter discount function by
minimizing the sum of squared pricing errors. Each group of bonds, by disclosure or by credit
rating, thus provides its own fitted discount function and yield curve.
3.2.2 Results by Leverage and Volatility Groups
In order to ensure the stability of the estimation, I first sort the monthly sample by either leverage
or volatility (but not both) into two bins. In each bin there are more than 120 bonds, which would
be further split into groups of about 80 bonds for each disclosure group. This is a reasonable size
for yield curve estimations.16
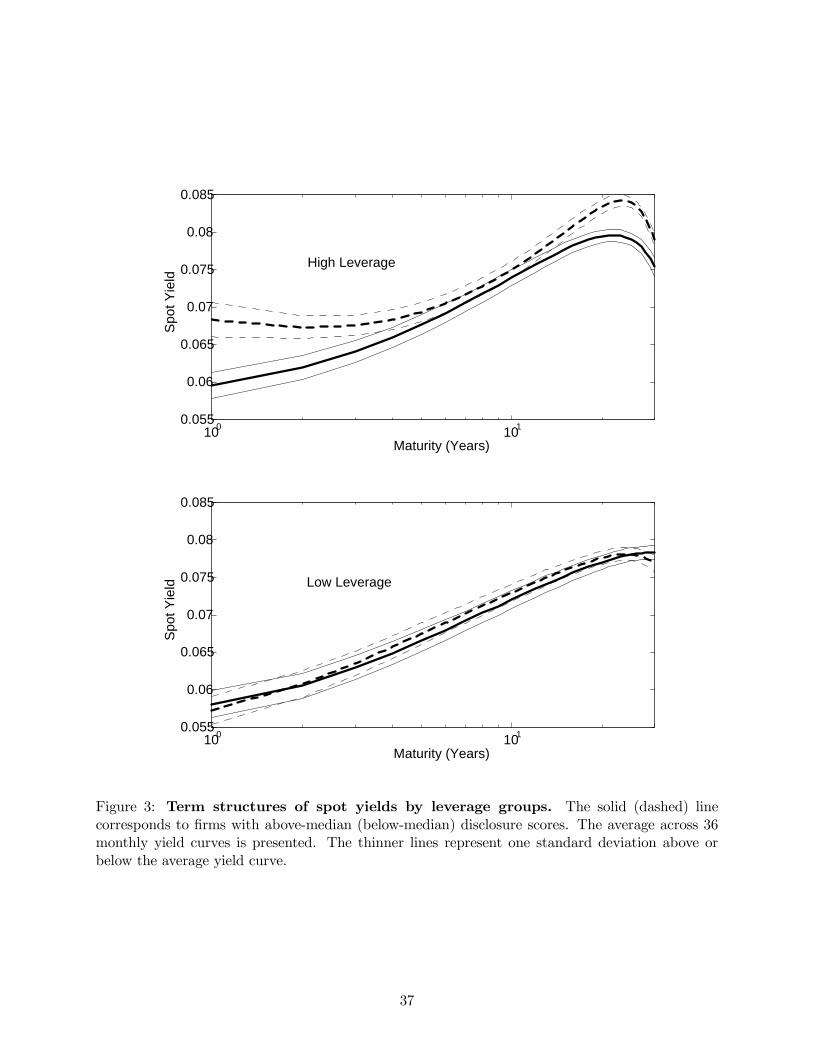
[Insert Figure 3 here.]
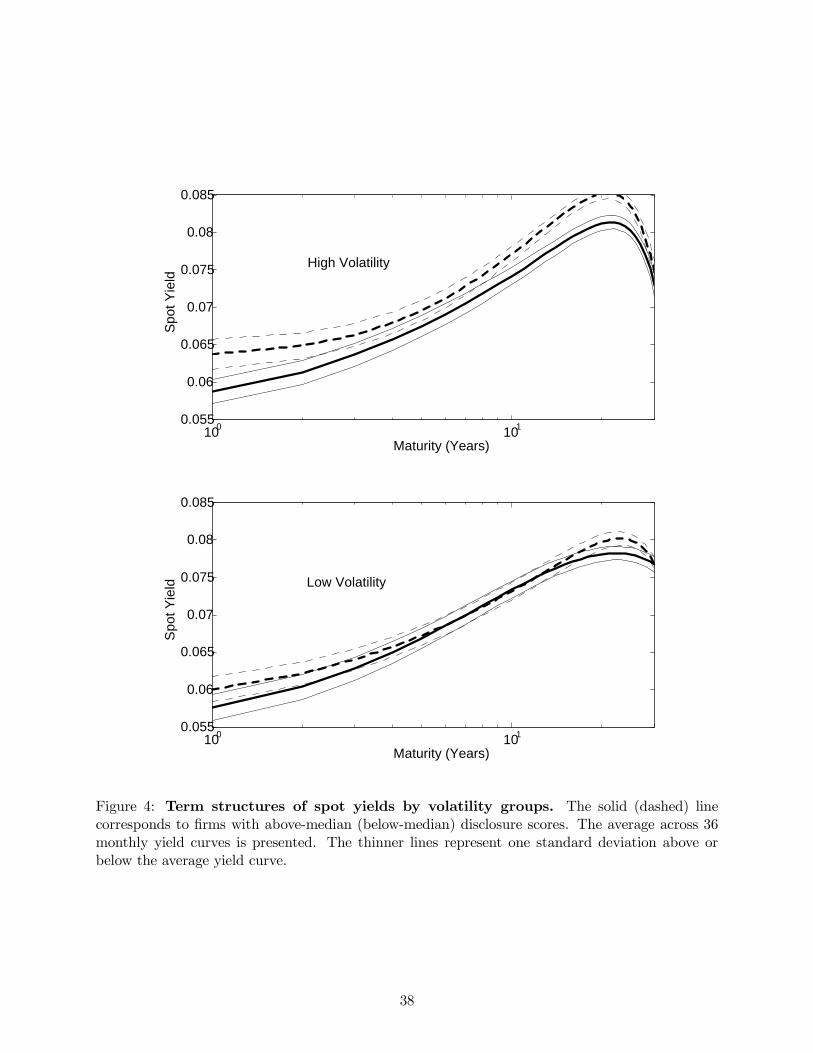
[Insert Figure 4 here.]
Figure 3 and 4 present the yield curves for leverage and volatility groups, respectively. To
facilitate comparison between the high and low disclosure yield curves, these figures include error
bands that are one standard deviation above or below the average term structure. For the low
volatility and the low leverage groups, the yield curves for high and low disclosure firms are not
very different. On the other hand, for the high groups we can see differences in the level of the
yield curves and a noticeable widening of the gap at the short-end. In particular, one can infer
a gap at zero maturity of about 100 bp when sorting the high leverage group, and more than 50
16The high and low disclosure groups overlap for firms with median disclosure scores. Due to the small sample, Ido so to ensure that the two groups are balanced in size. The downside is that the difference between the two yieldcurves would not be as great as when the two groups are mutually exclusive. Generally speaking, the yield curveestimations involve groups of 25 to 100 bonds, depending on the specific definition and monthly period of the group(see Table 1).
20
bp when sorting the high volatility group, both of which appear to be significant judging from the
error bands.
[Insert Figure 5 here.]
I also estimate yield curves for HH (high leverage, high volatility) and LL (low leverage, low
volatility) groups, with qualitatively the same findings (see Figure 5). In this case, the short-end
gap is close to 100 bp. One might notice in Figures 3-5 that the transparency spread also widens
at the long-end of the term structure. While the shape of the estimated yield curve may appear
peculiar, it is consistent with the findings of the cross-sectional regressions. Recall, for example,
that in Table 7 the transparency spread starts at 102 bp, drops to 28 bp at 5-year maturity and 25
bp at 10-year maturity, and finally reaches 63 bp at 30-year maturity. This pattern is very similar
to that of Figure 3.
3.2.3 Results by Credit Ratings
Instead of controlling for the degree of credit risk using firm leverage and equity volatility, one can
also sort the bonds using their credit rating. In this paper, the size of the monthly subsample is
sufficient to allow the distinction among Aa-, A-, and Baa-rated bonds. The estimation of yield
curves for these bonds shows that the average RMSE is consistent with those estimated by Elton
et al. (2001). For example, for the high disclosure group the RMSE is 40/c for Aa-rated bonds, 88/c
for A-rated bonds, and $1.34 for Baa-rated bonds. For the low disclosure group these figures are
43/c, $1.01, and $1.41, respectively.17
[Insert Figure 6 here]
Figure 6 presents the results for the three rating categories. The differences between the two
disclosure groups are much smaller than when one uses structural control variables. This is to
be expected as rating agencies claim to have incorporated disclosure quality in their credit rating
designations. For Aa- and A-rated bonds, those with higher disclosure still enjoy a lower yield
(though not by much). For Baa-rated bonds, those with higher disclosure may or may not have a
lower yield depending on the maturity of the bond. Since A-rated bonds constitute roughly half
17The RMSE for the leverage and volatility groups can be as low as $0.85 (LL group with high disclosure) and ashigh as over $4 (HH group with low disclosure).
21
of the sample, these findings are consistent with the results presented in Table 9, which show a
weaker but qualitatively similar term structure effect of disclosure. Taken together, these results
suggest that rating agencies do take corporate disclosure quality into account when assigning credit
ratings, but they may also have missed some of its effect on credit spreads.
4 Conclusion
In this paper I examine the relationship between the term structure of credit spreads and the
perceived quality of accounting information.
To the extent that the perceived lack of transparency may signal hidden bad news about a
company, the quality of accounting information may have an impact on its cost of debt or offering
yields. This paper extends the existing accounting literature to secondary market bond price data,
and identifies a weaker effect, consistent with the secondary market being less affected than the
primary market by adverse selection and the lemons problem.
More importantly, this paper notes the recent work by Duffie and Lando (2001), who study
the effect of incomplete but unbiased accounting information on credit spreads. In addition to
the “level effect” implied by firms’ policy of discretionary disclosure, I empirically test the term
structure effect, which holds that firms with more accurate information disclosure have lower short-
term credit spreads.
The results, based on monthly cross-sectional regressions of credit spreads on a measure of dis-
closure derived from the annual AIMR corporate disclosure quality rankings, confirm the presence
of both effects. These results are robust when controlling for other determinants of credit spreads,
and when using alternative specifications that take into account potentially nonlinear dependen-
cies. An explicit construction of the yield curves also supports the findings. The presence of a
short-end transparency spread, which can reach as much as 100 bp for investment-grade issuers
with above-average leverage or volatility, underscores the importance of incomplete information in
structural credit risk models.
22
References
Bushee, B. J., and C. F.Noe, 2000, “Corporate Disclosure Practices, Institutional Investors, and
Stock Return Volatility,” Journal of Accounting Research, 38, 171-202.
Table 1: Sample size. The sample period is monthly between January 1991 and June 1996.Figures are for January in the given year. Short-term bonds have maturity shorter than 5 years,medium-term bonds between 5 and 10 years, and long-term bonds between 10 and 30 years. Thesubgroups do not add up to the total because industries in each subgroup with no dispersion indisclosure quality are deleted.
Table 3: Average correlations among major variables. For each month in the sample periodof January 1991 to June 1996, correlations among the major variables are computed. The averagecorrelations across the 66 months are presented.
28
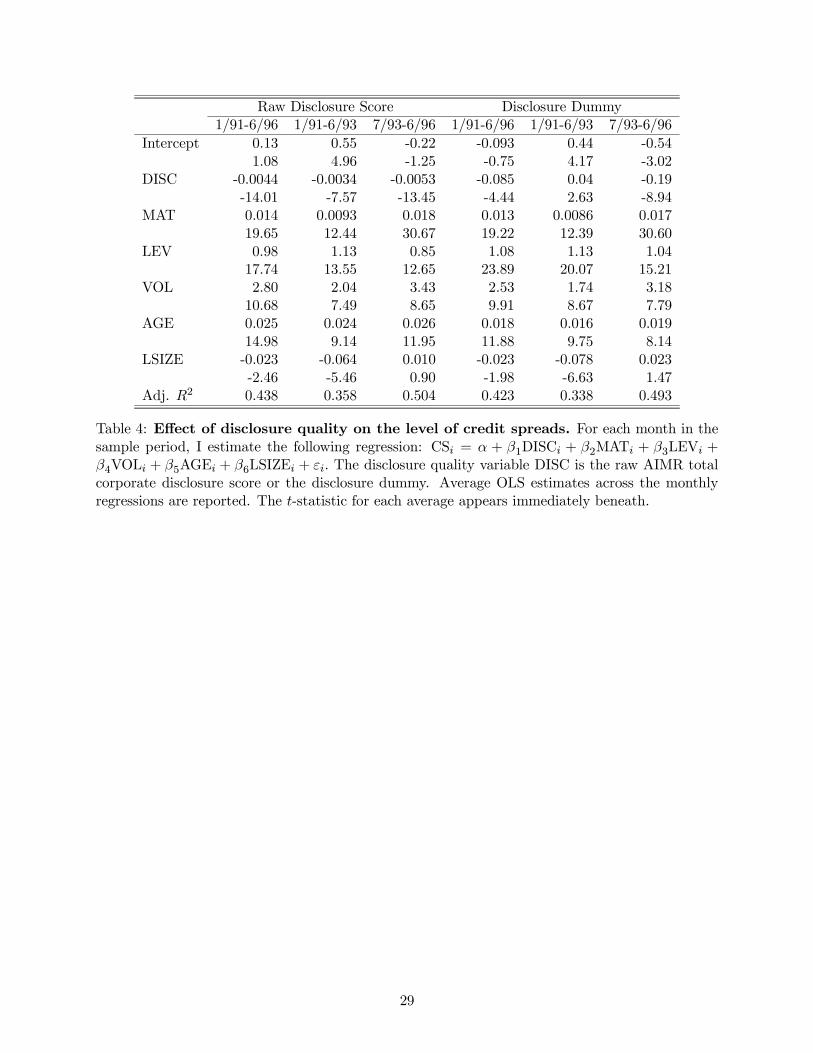
Raw Disclosure Score Disclosure Dummy1/91-6/96 1/91-6/93 7/93-6/96 1/91-6/96 1/91-6/93 7/93-6/96
Table 4: Effect of disclosure quality on the level of credit spreads. For each month in thesample period, I estimate the following regression: CSi = α + β1DISCi + β2MATi + β3LEVi +β4VOLi + β5AGEi + β6LSIZEi + εi. The disclosure quality variable DISC is the raw AIMR totalcorporate disclosure score or the disclosure dummy. Average OLS estimates across the monthlyregressions are reported. The t-statistic for each average appears immediately beneath.
29
Variables Description Relation with spreadCS Credit spread dependent variableDISC Disclosure dummy −DM0 Term structure slope difference between high +
and low disclosure firms at short maturitiesLEV Firm leverage ratio +VOL Equity volatility +AGE Bond age +LSIZE Log of amount outstanding −
Table 5: Predicted effects of disclosure quality on the term structure of credit spreads.The cross-sectional regression equation is CSi = α+β1M0i+β2M5i+β3M10i+β4DISCi+β5DM0i+β6DM5i + β7DM10i + β8LEVi + β9VOLi + β10AGEi + β11LSIZEi + εi.
30
With liquidity adjustments Without liquidity adjustments1/91-6/96 1/91-6/93 7/93-6/96 1/91-6/96 1/91-6/93 7/93-6/96
Table 6: Effect of disclosure quality on the term structure of credit spreads. For eachmonth in the sample period, I estimate the following regression: CSi = α+β1M0i+β2M5i+β3M10i+β4DISCi + β5DM0i + β6DM5i+ β7DM10i+ β8LEVi+ β9VOLi+ β10AGEi + β11LSIZEi + εi, withand without the liquidity proxies AGE and LSIZE. Average OLS estimates across the monthlyregressions are reported. The t-statistic for each average appears immediately beneath.
Table 7: Nonlinear effect of disclosure quality on the term structure of credit spreads.For each month in July 1993 to June 1996, I estimate the following regression: CSi = α+β1M0i+β2M5i + β3M10i + β4DISCi + β5DM0i + β6DM5i + β7DM10i + β8LEVi + β9VOLi + β10AGEi +β11LSIZEi+εi. Average OLS estimates across the monthly regressions are reported. The t-statisticfor each average appears immediately beneath.
Table 8: Effect of disclosure quality on credit rating. For each month in July 1993 to June1996, I estimate the following regression: RTNGi = α+β1DISCi+β2MATi+β3LEVi+β4VOLi+β5AGEi+β6LSIZEi+εi. Average OLS estimates across the monthly regressions are reported. Thet-statistic for each average appears immediately beneath.
Table 9: Does credit rating subsume the effect of disclosure quality on the term struc-ture of credit spreads? For each month in July 1993 to June 1996, I estimate the followingregression: CSi = α + β1M0i + β2M5i + β3M10i + β4DISCi + β5DM0i + β6DM5i + β7DM10i +β8LEVi + β9VOLi + β10AGEi + β11LSIZEi + β12RTNGi + εi. Average OLS estimates across themonthly regressions are reported. The t-statistic for each average appears immediately beneath.
34
10-1
100
101
102
0
0.005
0.01
0.015
0.02
0.025
0.03
0.035
0.04
0.045
Maturity (years)
Cre
dit s
prea
da=0.01a=0.05a=0.10a=0.25
75 80 85 90 95 1000
0.05
0.1
0.15
0.2
0.25
0.3
0.35
0.4
0.45
0.5
Actual firm value
Con
ditio
nal d
ensi
ty
a=0.01a=0.05a=0.10a=0.25
reported asset value is 86.3
default bound is 78
Figure 1: Term structures of credit spreads and conditional distributions of firm valuewith different accounting precisions.
35
10-1
100
101
102
0
0.005
0.01
0.015
0.02
0.025
0.03
0.035
0.04
0.045
Maturity (years)
Cre
dit s
prea
da=0.01a=0.05a=0.10a=0.25
10-1
100
101
102
0
0.005
0.01
0.015
0.02
0.025
0.03
0.035
0.04
0.045
Maturity (years)
Cre
dit s
prea
d
a=0.01a=0.05a=0.10a=0.25
10-1
100
101
102
0
0.005
0.01
0.015
0.02
0.025
0.03
0.035
0.04
0.045
Maturity (years)
Cre
dit s
prea
d
a=0.01a=0.05a=0.10a=0.25
10-1
100
101
102
0
0.005
0.01
0.015
0.02
0.025
0.03
0.035
0.04
0.045
Maturity (years)
Cre
dit s
prea
d
a=0.01a=0.05a=0.10a=0.25
Panel 1: base case
Panel 2: lower volatility
Panel 3: higher distance to default
Panel 4: higher initial firm value
Figure 2: Term structures of credit spreads with varying accounting precision, assetvolatility, and initial and reported firm value.
36
100 1010.055
0.06
0.065
0.07
0.075
0.08
0.085
Maturity (Years)
Spo
t Yie
ld
100 1010.055
0.06
0.065
0.07
0.075
0.08
0.085
Maturity (Years)
Spo
t Yie
ld
High Leverage
Low Leverage
Figure 3: Term structures of spot yields by leverage groups. The solid (dashed) linecorresponds to firms with above-median (below-median) disclosure scores. The average across 36monthly yield curves is presented. The thinner lines represent one standard deviation above orbelow the average yield curve.
37
100 1010.055
0.06
0.065
0.07
0.075
0.08
0.085
Maturity (Years)
Spo
t Yie
ld
100 1010.055
0.06
0.065
0.07
0.075
0.08
0.085
Maturity (Years)
Spo
t Yie
ld
High Volatility
Low Volatility
Figure 4: Term structures of spot yields by volatility groups. The solid (dashed) linecorresponds to firms with above-median (below-median) disclosure scores. The average across 36monthly yield curves is presented. The thinner lines represent one standard deviation above orbelow the average yield curve.
38
100 1010.055
0.06
0.065
0.07
0.075
0.08
0.085
0.09
Maturity (Years)
Spo
t Yie
ld
100 1010.055
0.06
0.065
0.07
0.075
0.08
0.085
0.09
Maturity (Years)
Spo
t Yie
ld
High LeverageHigh Volatility
Low LeverageLow Volatility
Figure 5: Term structures of spot yields by volatility and leverage groups. The solid(dashed) line corresponds to firms with above-median (below-median) disclosure scores. The aver-age across 36 monthly yield curves is presented. The thinner lines represent one standard deviationabove or below the average yield curve.
39
100 101
0.06
0.07
0.08
0.09
Maturity (Years)
Spo
t Yie
ld
100 101
0.06
0.07
0.08
0.09
Maturity (Years)
Spo
t Yie
ld
100 101
0.06
0.07
0.08
0.09
Maturity (Years)
Spo
t Yie
ld
Aa-rated or above
A-rated
Baa-rated
Figure 6: Term structures of spot yields by credit rating. The solid (dashed) line correspondsto firms with above-median (below-median) disclosure scores. The average across 36 monthly yieldcurves is presented. The thinner lines represent one standard deviation above or below the averageyield curve.