Page 1
LUT School of Business and Management
Master’s Thesis, Accounting
ACCURACY OF REVENUE FORECASTING AS A DEVELOPER OF FINANCIAL MANAGEMENT IN THE CONSTRUCTION INDUSTRY – CASE SKANSKA
20/06/2019
Author: Miikka Mäkiaho
Supervisor: Professor Satu Pätäri
2ND Supervisor: Associate Professor Heli Arminen
Page 2
ABSTRACT
Author: Miikka Mäkiaho
Title: Accuracy of Revenue Forecasting as a Developer of Financial Management in the Construction Industry – Case Skanska
Year: 2019
Faculty: LUT School of Business and Management Degree Programme: Master’s in Accounting Master’s Thesis: 100 pages, 7 figures, 4 tables and 8 appendices
Examiners: Professor Satu Pätäri & Associate Professor Heli Arminen
Keywords: revenue forecasting, financial management, rolling forecasting, predictive analytics, secured revenue, forecasting error, demand management
The purpose of this research is to examine the diverse influences of accurate and inaccurate revenue forecasting on the performance of financial management and related business functions. The research examines the construction stream of Skanska Finland and is grounded on triangulation, combining the quantitative financial data and the qualitative material from ten interviews.
Given the current financial forecasting ability and the challenges and future visions of forecasting in the case study company, the research aims to compare the findings with the tendencies found in theoretical framework. The research focuses on the benefits of accurate forecasting as an enabler of better vision and judgement for managerial decision-making at all organizational levels. On the basis of the results, the aim is to identify key elements of revenue forecasting and the possible trends for further development of forecasting in the case study company.
The findings of this study stated that future-oriented market review, better system support, automation, sharing of the best practices, more profound focus on the forecasting of target works, communication, training and process follow-up have most potential to improve the accuracy of financial forecasting. The results of the empirical research clearly highlight the importance of the link between strategic management, organisational steering and a well-functioning forecasting process.
Page 3
TIIVISTELMÄ
Tekijä: Miikka Mäkiaho
Tutkielman nimi: Liikevaihdon ennustetarkkuus talousjohtamisen kehittäjänä rakennusalalla – Case Skanska
Vuosi: 2019
Tiedekunta: LUT School of Business and Management Koulutusohjelma: Laskentatoimen maisteriohjelma Pro gradu - tutkielma: 100 sivua, 7 kuviota, 4 taulukkoa ja 8 liitettä.
Tarkastajat: Professori Satu Pätäri & Apulaisprofessori Heli Arminen
Hakusanat: liikevaihdon ennustaminen, talousjohtaminen, rullaava ennustaminen, ennakoiva analytiikka, varmistettu liikevaihto, ennustevirhe, kysynnän hallinta
Tutkimuksen tarkoituksena on tutkia tarkkojen ja epätarkkojen liikevaihto-ennusteiden erilaisia vaikutuksia talousjohtamiseen ja siitä riippuvaisiin liiketoimintoihin. Skanska Suomen rakentamispalvelut -liiketoimintoa tutkitaan triangulaation avulla, joka hyödyntää kvantitatiivista talousdataa ja laadullista aineistoa yhteensä kymmenestä haastattelusta.
Ottaen huomioon tapaustutkimusyrityksen taloudellisen ennustamisen nykytilan, ennustamisen haasteet ja tulevaisuudennäkymät, tutkimuksen tavoitteena on verrata tutkimushavaintoja teoreettisessa viitekehyksessä havaittuihin suuntauksiin. Tutkimuksessa keskitytään tarkan ennustamisen hyötyihin, jotka mahdollistavat paremman näkemyksen ja arviointikyvyn johdon päätöksenteon tueksi kaikilla organisaatiotasoilla. Tutkimustulosten perusteella tavoitteena on yksilöidä liikevaihdon ennustaminen avaintekijät ja mahdolliset kehityssuunnat ennustamisen jatkokehitystä ajatellen tapaustutkimusyhtiössä.
Tämän tutkimuksen tulokset osoittivat, että tulevaisuuteen suuntautuva markkinakatsaus, parempi järjestelmätuki, automaatio, parhaiden käytäntöjen jakaminen, syvempi keskittyminen tavoitetöiden ennustamiseen, viestintä, koulutus ja prosessin seuranta ovat potentiaalisimpia tapoja parantaa talousennustamisen tarkkuutta. Empiirisen tutkimuksen tulokset korostavat selvästi strategisen johtamisen, organisaation ohjauksen ja toimivan ennustamisprosessin välisen yhteyden merkitystä.
Page 4
ACKNOWLEDGEMENTS
Accuracy of revenue forecasting was chosen as a research topic because I wanted to
develop my knowledge and understanding of the subject by searching for the
synergy between business practices and academic research. Now, at the end of the
process, it can be said that this study has given me much more than I expected at
the beginning of the thesis project.
I’d like to thank my supervisors Satu Pätäri and Heli Arminen for the opportunity to
carry out master’s thesis under their professional and encouraging guidance. I’d like
to thank my colleagues for the support and their enthusiastic participation in the
research as well as my fellow students from whom I got both the peer support and
the right pressure to push the research process forward.
Finally and the most importantly, I’d like to express my gratitude to my home team:
Satu and Helmi alongside all of my family and friends who have been there for me
during the research process.
Espoossa 20.6.2019
Miikka Mäkiaho
Page 5
TABLE OF CONTENTS
1. INTRODUCTION ..................................................................................................... 1
1.1 Background ........................................................................................................ 2
1.2 Research Objectives and Delimitations ............................................................. 4
1.3 Research Methods and Data ............................................................................. 6
1.4 Theoretical Basis ............................................................................................... 7
1.5 Structure of the Thesis ....................................................................................... 8
2. FROM BUDGETS TO DYNAMIC FORECASTS ..................................................... 9
2.1 Budgeting Process ........................................................................................... 12
2.2 Life Cycle of Traditional Budgeting .................................................................. 15
2.3 Beyond Budgeting ............................................................................................ 18
2.4 Rolling Forecasting .......................................................................................... 20
3. FORECASTING & BUSINESS ANALYTICS ......................................................... 25
3.1 Intelligent Business Through Big Data ............................................................. 27
3.2 Predictive & Advanced Analytics ..................................................................... 29
3.3 Exploitation Process of Analytics ..................................................................... 31
3.4 Demand Management ..................................................................................... 34
3.5 The Role of Demand Forecasting in Business Planning .................................. 37
3.6 Characteristics of Demand Forecasting ........................................................... 41
3.7 Analytics in Construction Industry .................................................................... 46
3.8 Theoretical Reflection to Case Study ............................................................... 47
4. EMPIRICAL ANALYSIS - FORECASTING IN SKANSKA ..................................... 50
4.1 Case Study Company and Its Operating Environment .................................... 51
4.2 Triangulation: Qualitative Research ................................................................. 54
4.3 Triangulation: Quantitative Research ............................................................... 57
4.4 Analysis ............................................................................................................ 59
4.4.1 Secured Revenue Dictates Financial Forecasting .................................... 60
4.4.2 Current Status of Revenue Forecasting .................................................... 63
4.4.3 Characteristics of Target Work Forecasting and Time Horizons ............... 69
4.4.4 Challenges of Financial Forecasting ......................................................... 73
4.4.5 Rolling Financial Forecasting .................................................................... 81
4.4.6 Future Visions and Needs of Financial Forecasting .................................. 87
5. SUMMARY AND CONCLUSIONS ........................................................................ 93
5.1 Synthesis of the Results .................................................................................. 94
Page 6
5.2 Discussion, Limitations and Approach for Future Research ............................ 97
LIST OF REFERENCES ......................................................................................... 101
APPENDICES
LIST OF FIGURES AND TABLES
Figure 1. The Structure of Theoretical Framework and Empirical Research .…………7
Figure 2. The Traditional Budgeting Process ……………………………………………14
Figure 3. The Framework of Rolling Forecasting – Skanska Group ...…..…………… 21
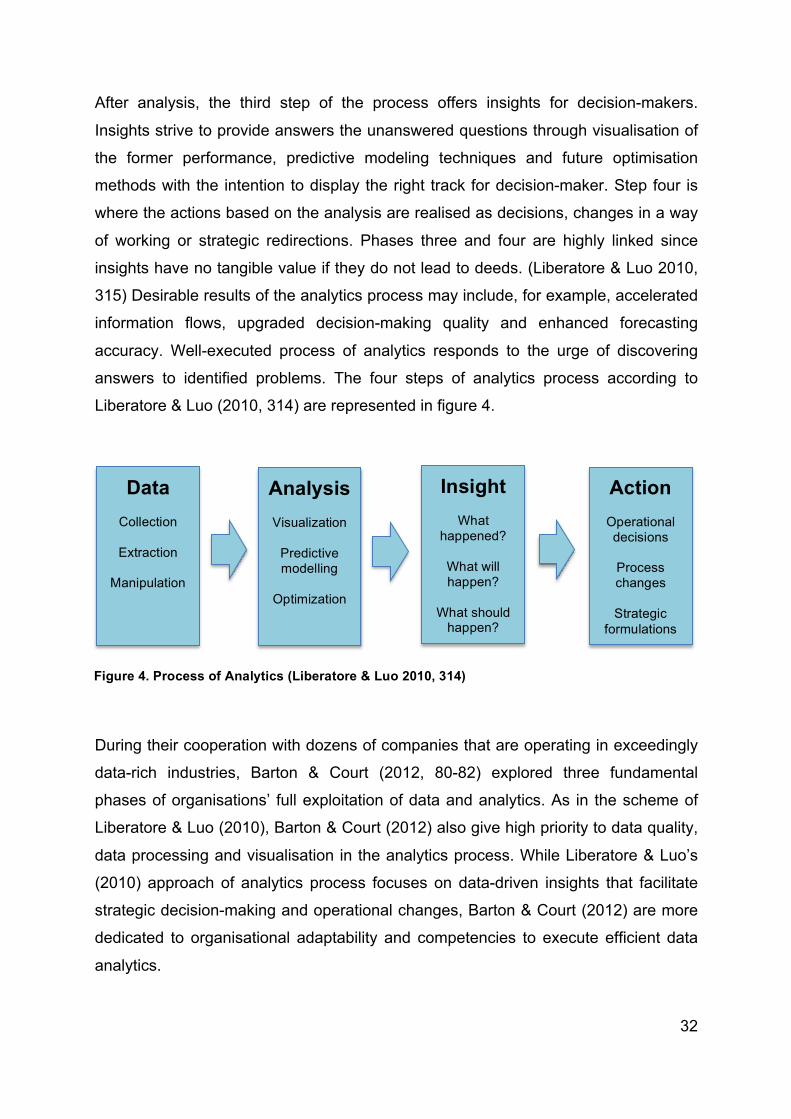
Figure 4. Process of Analytics …………………….………….………………………….. 32
Figure 5. Demand Management Process ………………………………………………. 35
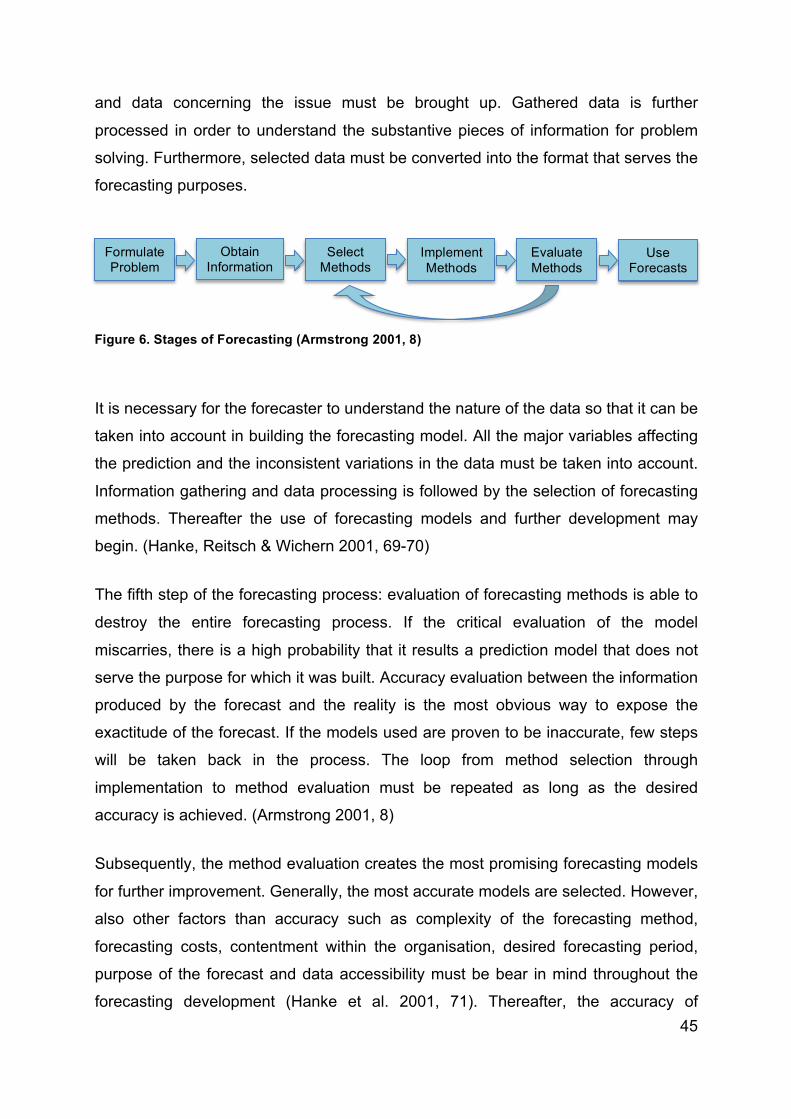
Figure 6. Stages of Forecasting .………………..….……………………………………. 45
Figure 7. Revenue Forecasting Funnel by Quarterly Reviews .……..…………………61
Table 1. Previous Studies on the Subject .…………………………………………...10-11
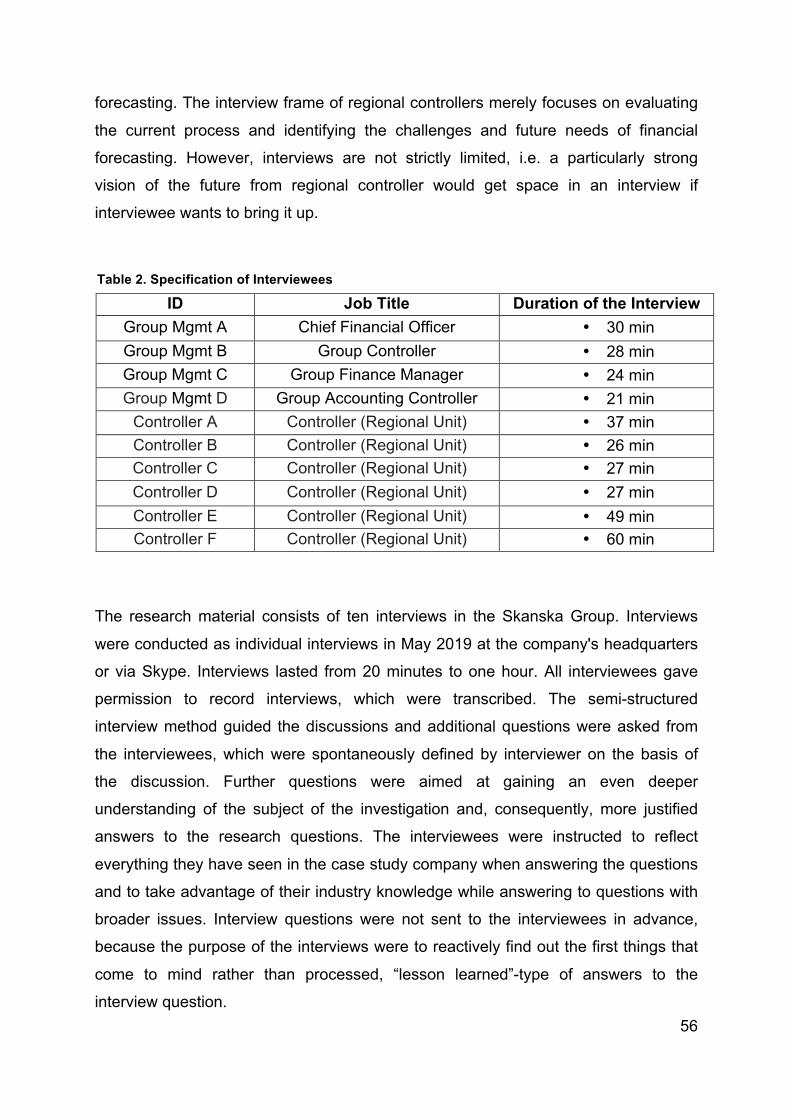
Table 2. Specification of Interviewees ...……………………….. .……………………… 56
Table 3. Attributes of Revenue Forecasting Accuracy………………………………….62
Table 4. The Core Challenges of Financial Forecasting ……………………………….76
Page 7
SYMBOLS AND ABBREVIATIONS
e Error
n Number of Observations / Sample Size
t Time
X Y Actual Value
Ŷ Forecast Value
BB Beyond Budgeting
BBRT Beyond Budgeting Round Table
BI Business Intelligence
BI & A Business Intelligence & Analytics
BIM Building Information Modelling
BU Business Unit
CODP Customer Order Decoupling Point
EBIT Earnings Before Interests and Taxes
EBIT % EBIT’s Relative Share of Revenue
EVA Economic Value Added
MAPE Mean Absolut Percentage Error
MPE Mean Percentage Error
PE Percentage Error
POC Percentage of Completion
S & A Sales and Administrative Costs
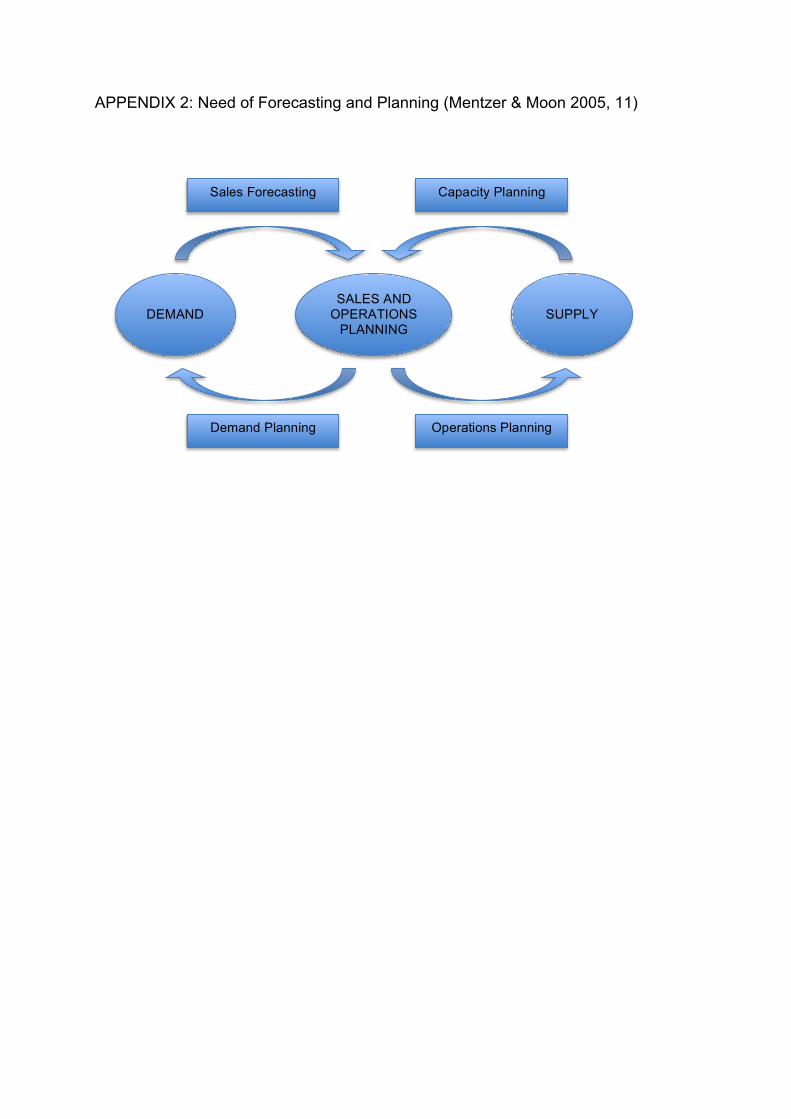
S & OP Sales and Operations Planning
Page 8
1
1. INTRODUCTION
The purpose of forecasting in general is to provide a reasonable assurance of what
might happen next (Lawless 2014, 44). In the modern business environment, the role
of forecasting is more important than ever. The cycle of business has accelerated
exponentially during the past decades forcing the information needs and flows to be
constantly more versatile and rapid. Furthermore, stakeholders are increasingly
demanding more accurate forecasts and supplementary analysis of key business
information at an even faster pace. (Moon & Mentzer 2005; Waller & Fawcett 2013)
The role of data in today's organizations is enormous. Phenomenon has been
simultaneously facilitated by the rapid development of technology and the reduced
cost of data storage (Elbashir et al. 2013, 87). Business analytics is all about creating
value out of the data (Acito & Khatri 2014, 566). Advanced data analytics allows
companies to erect a complete “360 degrees” understanding of their business and
operations. Better vision enables more effective steering, optimizing, process
development and even partial automation of decision-making. (Bose 2009, 155)
Forecasting is a fundamental company management process. Market awareness,
strategy reviews, customer knowledge and financial forecasting provide the
necessary information for management decision-making and goal setting. Despite
the fact that forecasting is a broadly handled and familiar topic, it may easily be
overlooked in the business world. (Lawless 2014; Wilder & Ozgur 2015) For many
companies forecasting is also a process that includes a lot of untapped potential.
The primary task of management accounting is to enable managerial decision-
making through measuring, analysing and reporting business-related financial
information. Therefore is it quite obvious to draw a line between management
accounting, business intelligence, analytics and forecasting. (Rikhardsson &
Yigitbasioglu 2018, 37) The fundamental analysis of the company facilitates the
predictability of its operations (Lee 1999, 415). Fundamental analysis may be
understood as a study of historical data, which aims to improve the accuracy of
forecasting. Accurate forecasts are in place to discover trends in advance, to
Page 9
2
understand and map the threats and opportunities of business, to question existing
assumptions and to guide towards alternative approaches. The key notion is to
foresee the upcoming turns in business and to intervene before a turn occurs and
risks materialise (Järvenpää et al. 2001, 165).
Efficient data access and processing empowered by new technologies have changed
the way of business forecasting. The data, of which availability used to be utopia, is
now helping companies to plan their future. Organisations are ready to resource
considerably in an attempt to forecast the market movements. (Frizzo-Barker, Chow-
White, Mozafari & Ha 2016, 403) Therefore, it is fundamental to understand the
current way of forecasting in the company, what are the related challenges and
limitations and to perceive the future development paths of forecasting.
1.1 Background
The only way to gain comprehensive knowledge of the future is firstly to understand
what has happened in the past and secondly to create a review horizon from this
moment forward, which take into account both the organizational tendencies and the
issues identified in the surrounding business environment. The use of economic
indicators as performance metrics offers first and foremost static past review and
answers the question ‘what has already happened’. However, the fast-paced modern
business world requires constant renewal from companies and becoming fixated on
the rear-view mirror may be fatal for business. (Bose 2009; Jain 2006) On the other
hand, carefully thought out forecasting processes enable the company to clarify its
own operations, to know what to expect in the future and to gain more competitive
advantage (Armstrong 2001, 60).
In addition to the internal needs of the company, disclosure obligations create a basic
need for forecasting and analytics. Compelling needs vary from listed companies to
more liberal reporting obligations of unlisted companies. Furthermore, forms of
voluntary disclosure have become more widespread, including corporate
responsibility reporting. (Eng & Mak 2003, 325) The disclosure obligation of listed
companies applies not only to the financial statement information, but also to all the
Page 10
3
information that is relevant to the valuation of a listed company. The relevant
information refers to any substantial change that the listed company must inform
investors about. Thus, change management and forecasting can be considered an
important area from the perspective of the company's credibility, image and
profitability. Furthermore, reliable and systematic forecast may be the key facilitator
in communication with stakeholders.
“The paradigm shift towards more data-intensive business landscape is inevitable.”
(Ylijoki 2019, 103)
Today’s sophisticated predictive models are data driven, real-time platforms that are
able to adjust seamlessly based on the need of the user case (McAfee et al. 2012,
64). In the construction business, this could mean better communication and faster
response to change at all organizational levels in case of an altered situation that
forces the original plans to change on the fly. In the best case, the use of better
forecast models could benefit the whole business model and lead to better bid
calculations, increased productivity, improved safety, reduced costs and completion
time, better quality of the end product and more accurate financial forecasts
(Kärkkäinen, Lavikka, Seppänen & Peltokorpi 2019, 155). From the financial point of
view, it does not matter if we consider the construction site management or the group
leadership team; the objectives have the same core. Projects and operations are
wanted to be as predictable as possible.
During the 1980s, business forecasting began to emphasis demand-driven
forecasting and this has increased in significance ever since (Lapide 2009, 18-19).
Revenue related financial ratios, such as EBIT’s (Earnings Before Interests and
Taxes) relative share of revenue (henceforth abbreviated as ‘EBIT %’), have always
played an important role in measuring and steering the performance of the company.
Case study company of this research is Skanska that operates in a highly
competitive construction industry known for its modest profit margins. Since Skanska
have globally had a few setbacks in the construction business, focus has been
increasingly centred on relative profitability. In this regard, the accuracy of revenue
forecasting has a key role in strategic guidance of Skanska.
Page 11
4
1.2 Research Objectives and Delimitations
Forecasting is widely recognized as an essential capability for business management
(Cox 1987, 515). As a planning facilitator, the importance of forecasting is
undeniable. Financial forecasting, as its best, comprises the core of management
decision-making and gives the people in charge a telescope to capture moments in
the future to analyse, plan and more importantly, take action. Data obtained in the
forecasting process nourishes the business intelligence and data analytics, which are
first and foremost designed to enhance the efficiency of decision-making
(Rikhardsson & Yigitbasioglu 2018, 43). The data needed for effective forecasting
and predictive analytics is widely available in the majority of organizations. However,
its utilization as part of financial forecasting is still not very common. Therefore,
organizations need to reflect on how much information can be accessed and hence
utilized in a way that benefits the organization. Waller & Fawcett (2013, 79-80)
considered forecasting as one of the most fertile areas of predictive analytics to
further research.
The purpose of empirical research is to identify the status of financial forecasting in
the case study company. Given the current financial forecasting ability and the way of
forecasting in the case study company, research aims to compare it with the
examples found in theoretical framework. Research focuses on the use and the
benefits of the accurate forecasting as an enabler of better vision and judgement for
management in all organisation levels. On the basis of these results, aim is to identify
possible trends for the development of forecasting in the case study company. The
primary research question to be answered is:
How can we improve the accuracy of financial forecasting in general?
The first sub-objective is related to the explanatory impact of secured revenue in
construction business. The purpose of the first sub-objective is to discover
regularities on how financial forecasting accuracy improves over time. The primary
dependent variable is the accuracy of revenue forecast, whereas the explanatory
factor is the amount of secured revenue. Secured revenue is based on the share of
Page 12
5
the forecasted revenue to be recognized during certain year, which is already in the
order backlog. The second sub-objective takes a position on the role of rolling
forecasting as part of the financial forecasting process and its accuracy in the case
study company. The secondary research questions are:
How the amount of secured revenue affects forecast accuracy
in different time horizons?
What is the role of rolling forecasting related to forecasting accuracy?
The empirical part of the research is delimited to study the construction company
Skanska, more specifically its operational business unit Finland (henceforth
abbreviated as ‘BU’) and its regional and district units. Research is limited in time to
cover the years 2015 - 2018. The empirical evidence of the research is
geographically cropped to Finland. Skanska's business in Finland is divided into
regional and district units, which are studied as individuals, sub-entities and as a
whole in this thesis. The results of this study may be used for decision-making on
how to improve the company's ability to forecast, as well as to deepen the
understanding of the nature of financial forecasting in construction business.
The research does not consider the theories of activity-based budgeting, zero-based
budgeting due to the fact that study aims to focus on the underlying theories of
budgeting only to the extent that is essential to chosen setting of the research
problem. The criticism of budgeting is presented selectively and appropriately. This
approach is justified under the guise of maintaining the focus of the thesis. In
addition, the literature review excludes a more detailed exploration of the themes of
strategic management, which is a really broad theoretical field. However, elements of
strategic management are tied in to the themes of forecasting and analytics since
they act as enabling factors of strategic decision-making and business planning.
Budgeting and financial forecasting are extremely widely researched and published
topics, which justifies this thesis to focus on studying the phenomenon of forecasting
through the empirical data in a multi-level business environment. However, when
interpreting the findings of this study, its limitations due to the method of research
should also be considered.
Page 13
6
1.3 Research Methods and Data
This research is grounded on triangulation, combining elements from quantitative and
qualitative research. This research consists of two sections of which concurrent
objective is to define comprehensive answers to research questions through earlier
academic research, known theories and empirical case study (see figure 1, 7). The
purpose of the literature review is to form a theoretical basis of the research. Chapter
1.4 briefly presents the most relevant theories of this research, which constitute the
theoretical framework of the study.
The empirical part of the thesis has been implemented as a case study, which is
particularly well-suited research method when investigating emerging phenomena
(Lillis & Mundy 2005, 119). The empirical case study analyses the mixture of
quantitative data and qualitative material. Secondary, quantitative data is collected
from financial management systems of the case study company. Qualitative data is
based on the interviews with ten professionals from the case study company. In
addition, the self-acquired business and industry experience of the author may be
heard in the thesis. Thus, background knowledge for example on the current state
and challenges of forecasting in the case study company has arisen from discussions
with colleagues during the past 6 years. This has considerably helped in the
rewarding formation of the research problem and set-up of the interview questions.
Examining the forecasting process as a case study is carefully considered approach
angle. Case study as a research strategy helps researcher to obtain abundant
comprehension of the research context (Saunders 2011, 146). Research method
leaves room for diversity and complexity of the phenomenon while increasing the
understanding of the research problem. Based on reflection and observation of the
obtained qualitative and quantitative results, the objective of this thesis is to answers
thoroughly to the research questions.
The research is conducted in a close co-operation with construction company
Skanska in Finland. First, study aims to demonstrate the forecasting ability and
characteristics of construction stream of Skanska Finland through quantitative data.
Page 14
7
Thereafter, qualitative data is engaged to thoroughly investigate the current status,
challenges and development visions of the future revenue forecasting in the
company. How the accuracy of financial forecasting can be further improved to be an
increasingly robust and significant part of strategic decision-making?
1.4 Theoretical Basis
The theoretical basis of the thesis is built on the earlier studies of the themes of this
thesis. Academic framework of the thesis is formed around the key words of financial
forecasting, business analytics, budgeting, rolling forecasting and demand
management. Characteristics and processes behind these topics as well as their
contribution for business planning and management decision-making are regarded.
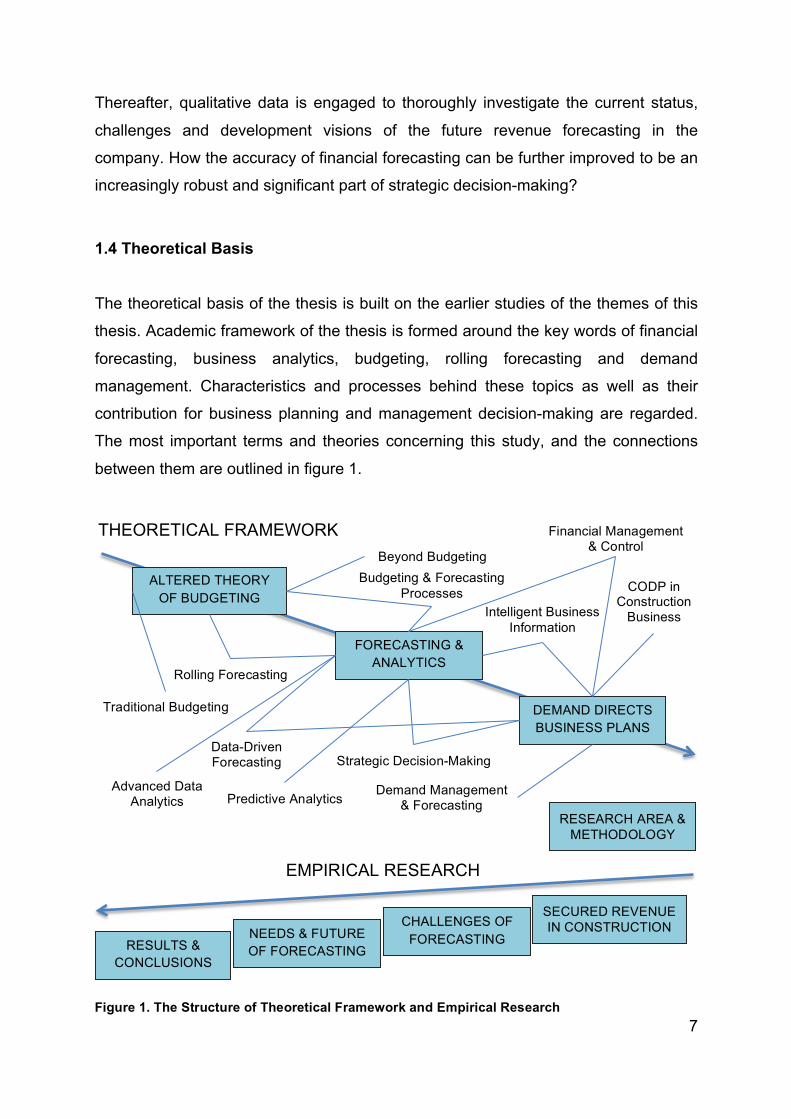
The most important terms and theories concerning this study, and the connections
between them are outlined in figure 1.
Figure 1. The Structure of Theoretical Framework and Empirical Research
THEORETICAL FRAMEWORK
EMPIRICAL RESEARCH
CHALLENGES OF FORECASTING NEEDS & FUTURE
OF FORECASTING
SECURED REVENUE IN CONSTRUCTION
Rolling Forecasting
RESULTS & CONCLUSIONS
RESEARCH AREA & METHODOLOGY
DEMAND DIRECTS BUSINESS PLANS
FORECASTING & ANALYTICS
ALTERED THEORY OF BUDGETING
Budgeting & Forecasting Processes
Beyond Budgeting
Predictive Analytics
Intelligent Business Information
Traditional Budgeting
Strategic Decision-Making
Financial Management & Control
Advanced Data Analytics
Data-Driven Forecasting
Demand Management & Forecasting
CODP in Construction
Business
Page 15
8
Alongside the peer-reviewed journal articles and books from the fields of manage-
ment accounting, strategy management, operations management and economics,
are used to endorse the theoretical basis of the thesis. The purpose of the literature
review is to disclose the most relevant subjects related to the topic of this thesis.
1.5 Structure of the Thesis
Thesis consists of five main chapters. Figure 1 (see page 7) presents overview of the
thesis split into the theoretical and the empirical part. The introduction chapter
presents background, objectives and delimitations of the research. Furthermore, the
research methods and data are introduced together with the summary of the most
important theoretical sources that are affected by this research. Chapters two and
three present the theoretical basis of the research starting from traditional budgeting
through various perspectives of forecasting and financial business analytics.
Theoretical framework of the research proceeds with the reflections related to the
dominant role of demand forecasting in business planning particularly in construction
industry. At the end of the chapter three, theoretical reflection to case study takes
place creating fundamentals for the empirical research and presenting the
hypotheses of the study.
The empirical part of the study starts with the presentation of the research area,
methodology and data used in the case study. Empirical analysis in chapter 4.4 is
divided in six subchapters, all of which aim to gain an in-depth grasp of the studied
phenomenon and to provide instruments to answer research questions. First
subchapter analyses the effects of secured revenue in construction industry from the
financial forecasting point of view. The second, third and fourth subchapters disclose
the current status, characteristics of target work forecasting and time horizons and
the dares related to financial forecasting in the case study company. Fifth subchapter
focuses on features and existent utilization of rolling forecasting. Final subchapter
outlines the future visions and needs of financial forecasting which were brought up
during the research. The last main chapter presents the summary and conclusions of
the thesis, the synthesis of the results, answers to research questions alongside the
criticism of the results and approach for further study.
Page 16
9
2. FROM BUDGETS TO DYNAMIC FORECASTS
”Budgets are formalized plans of management’s objectives” (Raghunandan et al. (2012, 111).
Budgeting is a widely used and essential financial management tool that enables
companies to set financial goals, implement related measures, and monitor their
achievement. The role of budgeting in decision-making is academically widely
emphasized. Budgeting is one of the most important tools that influence the
organization's management and steering (Malmi et al. 2001, 487). Budgets also allow
you to compare the financial outcomes of different options and play with the
scenarios before final decision-making (Shim & Siegel & Shim 2012, 20). Horngren et
al. (2010, 789) describe budget as a quantitative action plan for a specific time
period, which is utilized in coordination, planning and decision-making by the all
management layers of the organisation
Although the budget reflects the development of the past, its ultimate purpose is to
determine and predict the future events as accurately as possible and to allocate the
available resources to achieve the goals of the organisation (Wildavsky 2002, 7-8).
Aforementioned interpretation, where the definitions of forecasting and budgeting are
very close to each other, differs from mainstream. Generally, traditional budgeting
literature separates budgeting from forecasting and strategic planning. The role of
budgeting is often described as an operational management tool, which includes
binding and restrictive factors. The culture of fear if cost budget is exceeded,
government and management approvals and using the budget as a tool for
managerial commitment are characteristic features or traditional budgeting culture.
(Becker 2014; Hope & Fraser 2003; Morlidge & Player 2010) At its best, budget is
used simultaneously for all of its macro functions: operational planning, resource
allocation and performance evaluation (Becker, Mahlendorf, Schaffer & Thaten 2016,
1493). When budget works optimal for business support, it covers all of its purposes.
Micro functions of budgeting may be divided to six tasks. Budgeting is a control tool,
which helps management to perceive the actual and previously forecasted costs of
Page 17
10
different activities. Budgeting allows organisation to match its short-term targets and
day-to-day operations with a long-term strategic plans. Budget as a performance
measurement tool meters the achievements of the managers and combined with the
performance bonuses encourages to both better performance and more accurate
budgeting. Achievable, realistic budget is designed to increase commitment of the
employees to work towards the goals. Coordination enables the different functions of
the company to foster a common goal and thus harmonises the overall operations of
the company. The communicative role of budgeting is to improve both strategic and
target communication through the organization and help employees to understand
their role in the company. (Ikäheimo et al. 2011, 106-107)
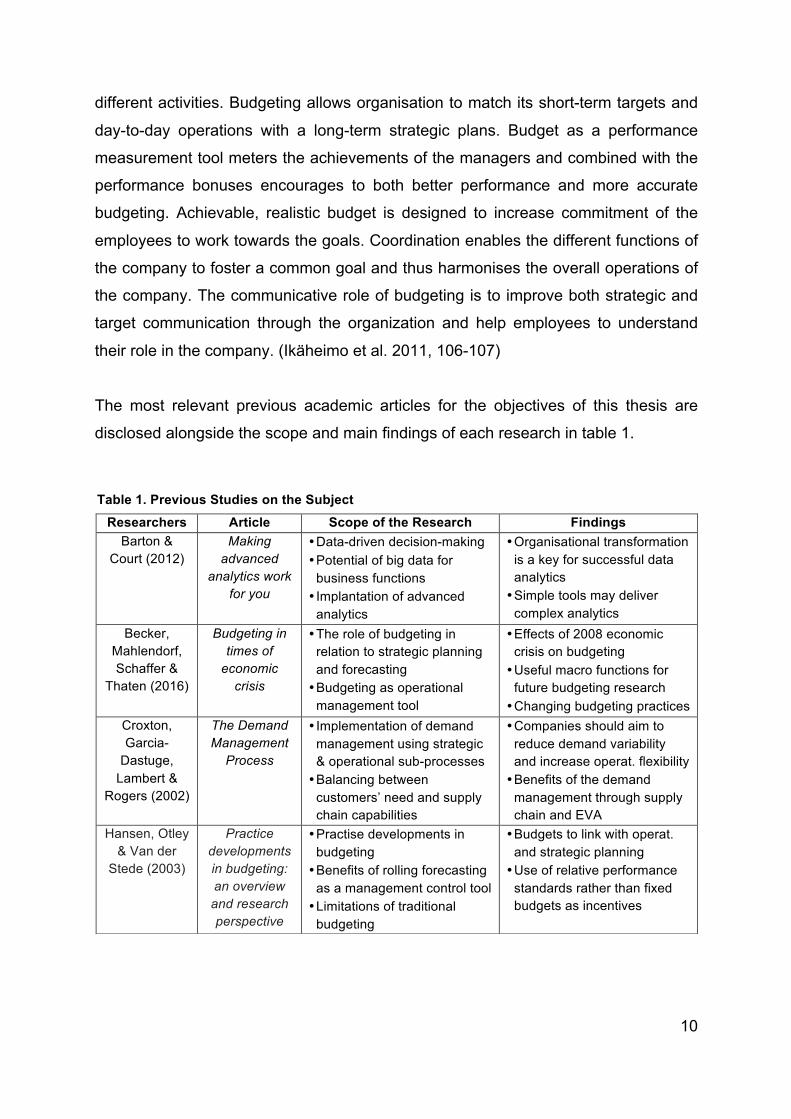
The most relevant previous academic articles for the objectives of this thesis are
disclosed alongside the scope and main findings of each research in table 1.
Table 1. Previous Studies on the Subject Researchers Article Scope of the Research Findings
Barton & Court (2012)
Making advanced
analytics work for you
• Data-driven decision-making • Potential of big data for
business functions • Implantation of advanced
analytics
• Organisational transformation is a key for successful data analytics • Simple tools may deliver
complex analytics Becker,
Mahlendorf, Schaffer &
Thaten (2016)
Budgeting in times of
economic crisis
• The role of budgeting in relation to strategic planning and forecasting • Budgeting as operational
management tool
• Effects of 2008 economic crisis on budgeting • Useful macro functions for
future budgeting research • Changing budgeting practices
Croxton, Garcia-
Dastuge, Lambert &
Rogers (2002)
The Demand Management
Process
• Implementation of demand management using strategic & operational sub-processes • Balancing between
customers’ need and supply chain capabilities
• Companies should aim to reduce demand variability and increase operat. flexibility • Benefits of the demand
management through supply chain and EVA
Hansen, Otley & Van der
Stede (2003)
Practice developments in budgeting: an overview and research perspective
• Practise developments in budgeting • Benefits of rolling forecasting
as a management control tool • Limitations of traditional
budgeting
• Budgets to link with operat. and strategic planning • Use of relative performance
standards rather than fixed budgets as incentives
Page 18
11
Hope & Fraser (2003)
Beyond budgeting:
how managers can break free
from the annual
performance trap
• Beyond Budgeting Round Table • Abandoning traditional
budgeting and embracing new adaptive processes • Target setting: actions and
lessons learned
• Rolling and advanced approaches for future forecasting and goal-setting • Use of effective governance
and management model • Key performance indicators
provide two levers of control Liberatore & Luo (2010)
The analytics movement: Implications
for operations research
• Analytics movement drivers • Science of logical analysis • Broad influences and
prospects of predictive analytics
• Process of analytics – data-driven insights enable action & strategic redirections • Operations research behind
new analytical models Moon & Mentzer (2005)
Sales forecasting
management – A Demand
management approach
• Need of sales and operations planning • Managing the sales
forecasting process • Sales forecasting
performance measurement
• Extent benefits of accurate demand forecasting in organisation • Forecasting techniques are
outdates and companies lack of forecasting evaluation
Player (2009) Managing through
change: The power of
rolling forecasts
• Rolling forecasting as strategic compass • Forecasting frequency vs.
forecasting variables • Control performance
• Rolling forecasting beats “forecasting to the wall” • 4 pitfalls to avoid and 5
improvement levers of rolling forecasting to organisations
Raghunandan,Ramgulam, & Raghunandan-Mohammed
(2012)
Examining the behavioural aspects of
budgeting with particular..
• Budgets as part of management control • Budgeting and human
behaviour • Nature & need of budgets
• Alternative budgeting processes in the 21st century • Accounting techniques and
human relations are bound with each other
Rikhardsson & Yigitbasioglu
(2018)
Business Intelligence & analytics in
management accounting research:
Status and future focus
• Implementation on business intelligence & analytics (BI & A) • Literature review of 60 papers
- relationship between BI & A and management accounting • Highlight research gaps and
future research opportunities
• Technology, data and analytics are transforming forces in business • Relatively low number of
papers focus on applications of BI & A in management accounting and minor anchoring to existing theory
Waller & Fawcett (2013)
Data science, predictive
analytics, and big data: a
revolution that will transform supply chain design and
management
• Popularity of big data, predictive analytics and data science in business model design • Possible applications of
predictive analytics, big data and data science • Research skills needed by
data scientists
• Predictive analytics & data science drives forecasting and profitability • Power of big data behind
strategic decisions and improved profitability • Opportunities for research
where SCR meets DPB
Page 19
12
Malmi et al. (2001, 482) conducted a survey for 1000 members of Finnish
Association for University Business Graduates with accounting- and controller-related
job including financial manager, chief financial officer, financial executive, accounting
manager, accounting director, business analyst, business controller and controller.
According to Malmi et al. (2001, 487) the work activities that were considered most
important among the respondents are: financial reporting (at company or business
unit level), budgeting and annual planning. Despite the fact that the research is 18
years old, budgeting, forecasting, and reporting have retained their place as favourite
discussion topics among the experts and academic researchers. For example Becker
et al. (2016, 1499) highlighted in their recent research the multiple functions of
budgeting as part of both strategic and operational decision-making in extreme
economic crises.
2.1 Budgeting Process
The budgeting process is a system that leads to the creation of a budget, its approval
and finally its implementation based on the underlying decision-making (Ehrhart et al.
2007, 279). With a well-functioning budgeting process, management is easier and
potential issues can be detected in time. Typically, the budgeting process begins with
an evaluation of the past. After the critical review of last year's actual figures, process
is followed by a realistic estimate of the future operating environment and factors
affecting it, not forgetting to take into account the company's strategic plan. Hence,
budgeting should be based on the company's strategy, which defines the direction
and objectives of the future budget (Blumentritt 2006, 73). Thus, the budget can also
be seen as a series of numbers reflecting the company's strategy; transforming
strategy into data.
In order to maintain a close link between budgeting and strategy, organisation should
be able to produce information on strategic uncertainties based on the budget follow-
up. In addition, budget should stimulate a debate related to the current activities and
way of working amongst the management of the company (Blumentritt 2006, 78). At
the best case, the budget highlights the grievances and the achievements that would
otherwise be unnoticed.
Page 20
13
Raghunandan et al. (2012, 112) recognize three different ways to generate data for
budgeting: imposed (top-down) budget, participative (bottom-up budget) and
negotiated budget. Imposed (top-down) budget supports an autocratic way of
leadership. In top-down budgeting process, which was established in 1990s, the
senior management makes all the decisions related to budget and the rest of the
organisation responds to these plans with their performance (John & Park 2006, 88).
Approach is straightforward and as far from participative as it gets. Even if the
autocratic, imposed method might produce results, it is easily seen as a source of
frustration within the staff and obstacle for employee development. However, time
saving in the budgeting process is seen as the biggest benefit of the top-down
approach (Boon et al 2007; Boxall and Purcell 2011).
Participative (bottom-up budget) is a democratic approach for budgeting. In bottom-
up budgeting each member of the lower management prepares the budgets of their
own and the total budget for the sum of its parts (Raghunandan et al. 2012, 112).
Bottom-up budgeting takes more time, but the level of commitment is increased due
to an inclusive model in which everyone's contribution is considered important. Third
approach: negotiated budgeting is a model of common responsibility where elements
from both top-down and bottom-up budgeting are exploited in budget preparation
(Raghunandan et al. 2012, 112). The negotiated budgeting process, which is the
most commonly used approach in large companies, might consist of several review
phases at different layers of the organisation (Albrecht et al. 2008, 878). The
selection of the budgeting model is highly influenced by the company culture and the
leadership features of the organisation.
Traditional budgeting process starts well beforehand, typically up to six months prior
the budgeting due date i.e the start of the year it relates. A mission statement and
strategic plan are build on company’s vision and should illustrate strategic plans of
the company and outline the top-level targets of a group. Next step is budgeting itself
as represented in figure 2 (see page 14). Budgeting process is made within the
framework that was specified in the first and the second step. Budgeting tends to
include multiple rounds of iteration and negotiations between the corporate centre
and operating units before the final budget is ready. After approval budget is
controlled through the periods budget concerns. (Hope & Fraser 2003, 4-6)
Page 21
14
The budgeting process may take up to half a year to complete, taking into account
the time required for planning, setting objectives and negotiating, which is why the
sufficient amount of time must be reserved (Jensen 2003, 380). One of the ultimate
goals in budgeting is to have a budgeting process based on the real-time data.
Simple approach is to add frequency to budgeting process (Player 2003, 4). By
reviewing budgets every six months or once a quarter, budgeting becomes a more
follow-up method than a one-off operation. On the other hand, it increases the time
spent for budgeting even more, which has been identified to be one of the biggest
problems with traditional budgeting. Budgeting simply consumes too much time from
the management (Hope & Fraser 2003, 6).
The global operating environment, which requires flexibility and agility, requires
yielding forecasting processes that are not covered by the traditional, rigid budgeting
process. However, also many modern approaches on budgeting and forecasting
suffer from the fact that even more time than before is spent in order to create more
real-time data based budgets. Hence, these forecasts are created precisely with
good grace and the results are most likely more accurate than the ones achieved
Figure 2. The Traditional Budgeting Process (Hope & Fraser 2003, 5)
Page 22
15
with traditional budgeting. However, it is accomplished with increased workload and
costs. (Albrecht et al. 2008; Ehrhart et al. 2007; Hope & Fraser 2003)
2.2 Life Cycle of Traditional Budgeting
When measuring the subject hits of academic databases, it can be seen that
budgeting is constantly blistering topic making it one of the most widely studied topics
in the history of management accounting (Luft & Shields, 2003, 177). The theme of
budgeting has been addressed from many theoretical perspectives including
sociology, psychology and obviously economics (Covaleski et al., 2003, 3). Hambrick
(2007, 193) underlines the multidisciplinary approach while operating in human
linkages between individuals, organisations and their competitive environments.
Despite the prevalence of budgeting, studies have shown that companies are often
very dissatisfied with budgeting and the value it adds to the organization. The
operating environment of companies has changed in a more competitive and
uncertain direction, which in turn undermines the conditions for using traditional
budgeting methods (Neely et al. 2003, 22). Businesses need to be more agile in
fulfilling their ultimate goal: value creation for stakeholders.
The budgeting process was created in the early 1900s by large industrial
organizations to meet the emerged need of cost and cash flow management.
Changed budgeting needs have led to the situation where traditional annual budget
is being challenged for its inability to give a sufficiently broad picture of the future and
to act flexibly in uncertain situations. (Ekholm & Wallin 2000, 519) It has been widely
represented that the use of traditional annual budgeting leads mostly to a mediocre
result (Zeller & Metzger 2013, 299). The most radical budgeting critics have also
suggested that budgeting should be abandoned, which in most cases would require
reforming the management philosophy of the entire company.
Naturally, the first loud opponents of traditional budgeting were consultants who
wanted to sell their own services. In the 1970s and 1980s, new approached like the
zero base budgeting (ZBB) became popular. The underlying idea of zero base
Page 23
16
budgeting is first and foremost to evaluate and prioritize the needs of all businesses
before carrying out the actual budgeting (Drury 2004, 305). In zero base budgeting,
forecaster begins to think about the discretionary expenses from zero with the blank
paper. Approach has turned out to be particularly applicable when reviewing
overhead costs (Player 2003, 4). For example in Sweden, a number of large
companies decided to terminate traditional budgeting completely already in the
1990s (Ekholm & Wallin 2000, 519).
However, given the fact that academic researchers had shown very little interest in
this phenomenon until the early 2000s, todays’ forerunner companies have come a
long way from traditional budgeting culture at short notice. Drivers for development
may be found on changes in world economy, regulation, technology but the key
factor behind the evolution is upgraded need of information and quite different
frequency of information flows than 20 years ago. For many people, both from
academic and business environment, budgeting has been an endless source of
criticism for a long time. Criticism may be found in several academic sources and
literature (Anthony et al. 1998, Becker 2014, Covaleski et al. 2003, Ekholm & Wallin
2000, Morlidge & Player 2010).
In a relatively short period of time, traditional budgeting has changed from one of the
most important organizational control tools to a controversial instrument and a topic
of comparatively significant criticism. Budgeting has been criticized for being rigid
and restrictive, time-consuming, irrelevant, history-focused, not strategy-oriented, not
taking external factors into account and causing questionable activity such as budget
manipulation (Clarke 2007; Hope & Fraser 2003; Libby & Lindsay 2010; Neely et al.
2003).
Growing criticism of traditional budgeting has aroused interest in developing and
deploying alternative budgeting models such as rolling forecasting and beyond
budgeting. While both business processes and organizational structures are
changing due to transformations of business environment, the development of
management control systems have broadened the concept of traditional budgeting
(Kanthi Herath 2007, 895). Thus, the new era of management control systems forces
Page 24
17
the old practices to change. Although a heavy organization emphasizes the negative
effects of an inefficient budgeting process, the change does not only concern large
multinational companies, but also smaller organizations.
The most of the new appellations in budgeting include the same idea of breaking the
traditional, unambiguous framework of budgeting and shake the old stubborn way of
budgeting. However, interpretation of new changes and way of thinking in budgeting
does not mean that all the ideology characterized by traditional budget has been
abandoned. Preferably, traditional budgeting has been enriched and supported by
new advanced control tools (Neely et al. 2003, 23). The transition from traditional
budgeting to more modern forecasting methods is a challenging process. According
to studies, organisations have very rarely been able to implement this change of
culture as a whole (Libby & Lindsay 2010, 67). According to Henttu-Aho & Järvinen
(2013, 765) even though, there is a clear change towards the new tools of
management accounting, which replace parts of the traditional budgeting system, the
core functions of budgeting system: planning, controlling and evaluation will remain,
despite the shift.
Many researchers emphasize that traditional budgets should be replaced or
supplemented by rolling forecasts (Hansen et al. 2003, Jensen 2003). Fortunately
studies have introduced a number of new appellations and trends for budgeting.
Advanced budgeting and beyond budgeting are examples of these developments
(Bunce et al. 1995, Hope & Fraser 2003). Particularly forced attack against budgeting
was represented by Hope & Fraser (2003) in the Beyond Budgeting Round Table
(henceforth abbreviated as ‘BBRT’) claiming budgeting process is fundamentally
flawed and that it presents the result of dysfunctional behaviour. Several studies
support this sort of claims against traditional budgeting, as more and more
organizations have introduced rolling forecasting models as part of the organisation's
control tools to support or replace traditional budgeting (Hansen et al. 2003, Libby &
Lindsay 2010). In order to understand that there is not just one right way to do
budgeting and forecasting, next chapter 2.3 takes a closer look to fierce approach
demonstrated in BBRT by Hope and Frase (2003).
Page 25
18
2.3 Beyond Budgeting
Historically budget has been in the centre of management control system for all kind
of organisations (Otley 1994, 367). In recent years, companies have implemented
more sophisticated and more streamlined forecasting tools and budgeting processes
(Player 2003, 4). Beyond budgeting, has been a key word for consultants and
practitioners of management accounting in 2000s (Sandalgaard & Nikolaj Bukh 2014,
409). Beyond Budgeting, which is founded in 1998 by the Beyond Budgeting Round
Table, provides an alternative for traditional budgeting. Effectively, beyond budgeting
may be considered as an extreme implementation of modern forecasting.
Ideology behind beyond budgeting is to manage company's performance without
traditional budgeting by replacing the old processes budgeting with more appropriate
options for each situation (Hope & Fraser 2003, 212). Traditional budgeting may be
replaced with a more efficient performance management system by implementing
practices that have been proved to respond to customers' demand and needs more
effectively. If implemented at its heaviest, beyond budgeting means the complete
abandonment of the traditional budgeting. (Hope & Fraser 2000, 33-34)
The supporters of modern forecasting and beyond budgeting criticize yearly-based
traditional budgeting for being fixed performance contracts that offer neither
adaptivity nor tools to add value by forecasting in a changing business environment
(Sandalgaard & Nikolaj Bukh 2014, 409-411). Beyond budgeting gives freedom to the
implementer, whilst it is not precisely defined mode of operation. As a whole, beyond
budgeting offers an alternative approach for strategic management of the
organisation and the ability to lead the performance of the company without
traditional budgeting. The goal is to replace traditional budgeting processes with
more appropriate options for each situation. (Hope & Fraser 2003, 19-20, 212)
For organizations where budgeting has a long tradition, beyond budgeting may
sound like a scary, radical alternative. Beyond budgeting encourages the transition
from traditional fixed goals towards a more open and interactive culture that gives
leaders more freedom to lead their activities in the optimal way at each situation
Page 26
19
(Pilkington & Crowther 2007, 29). However, it must be bear in mind that beyond
budgeting does not mean arbitrary use of financial resources in the organisation. In
order to function, financial governance system must support the management of non-
budgeting organisation.
Beyond Budgeting method encapsulates the differentiation between goal setting and
performance evaluation in order to get rid of traditional budget control, and move
towards a more strategic, non-cost-oriented and forward-looking goal setting
(Bourmistrov & Kaarbøe 2013, 196). The future aspect is also highlighted in the key
principles of BB, which recommends to set ambitious goals for the medium term, not
short-term fixed goals. Beyond Budgeting aims to share responsibilities within the
organisation, highlight the decentralized decision-making and by doing so, reform the
corporate governance to a more self-governing direction (Hope & Fraser 2000, 35).
Performance measurement does not have to rely solely on the financial gauges.
Many researchers have emphasized the use of relative metrics, for example
benchmarking and also non-financial metrics such as balanced scorecard for
performance management rather than solely budget-based guidance (Bourmistrov &
Kaarbøe 2013; Hansen et al. 2003; Hope & Fraser 2000; Østergren & Stensaker
2011).
The need for a detailed budget varies by organization and in some cases replacing
fixed budgeting may be difficult. For example an ultra-goal-oriented organization
where solid, measurable goals are seen as the best practice to ensure the
predictability of the expected result, the budget-neutral option must be able to cover
organisation’s need for financial goals in other ways. Hence, budget neutrality is not
suitable for all organizations. (Sandalgaard & Nikolaj Bukh 2014, 421) Beyond
budgeting may help companies get rid of the philosophy that traditional budgeting
encourages to spend the entire budget within the year in order to avoid downward
pressure on next year's budget (Østergren & Stensaker 2011, 163).
Page 27
20
2.4 Rolling Forecasting
The change in the business environment is continuous. Changes related to
organisational structures, business processes, management systems and patterns of
management control are inevitable if company urge to survive in a changing business
environment (Kanthi Herath 2007, 895). As a result of the changes, the entire culture
of management of the organizations had to adapt and evolve to meet the changed
requirements. Traditional budgeting has undergone significant changes as a result of
its gradual fragmentation since many companies have replaced traditional budgeting
with new budgeting tools (Østergren & Stensaker 2011, 153). The traditional
operating budget covers planned income and costs for one year at a time (Anthony et
al. 1998, 370). Player (2009, 6) describes the phenomenon as “forecasting to the
wall”. Quarterly, monthly or even weekly basis rolling forecasts offer a more dynamic
and flexible support to disadvantages of traditional budgeting (Sandalgaard & Nikolaj
Bukh 2014, 410).
Rolling forecasting in practice means forecasting certain occurrences over a period of
time that extends to fixed-period for the future. While the first forecasting horizon
decreases; the second forecasting horizon increases by the same amount, i.e.
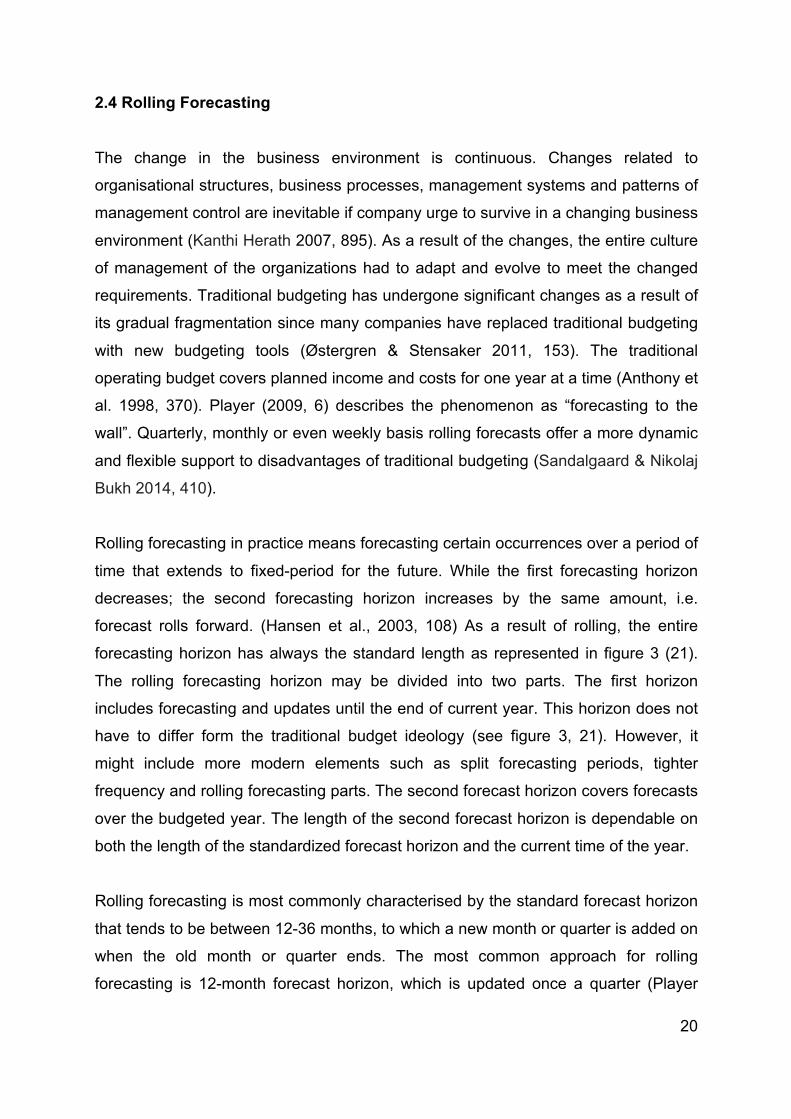
forecast rolls forward. (Hansen et al., 2003, 108) As a result of rolling, the entire
forecasting horizon has always the standard length as represented in figure 3 (21).
The rolling forecasting horizon may be divided into two parts. The first horizon
includes forecasting and updates until the end of current year. This horizon does not
have to differ form the traditional budget ideology (see figure 3, 21). However, it
might include more modern elements such as split forecasting periods, tighter
frequency and rolling forecasting parts. The second forecast horizon covers forecasts
over the budgeted year. The length of the second forecast horizon is dependable on
both the length of the standardized forecast horizon and the current time of the year.
Rolling forecasting is most commonly characterised by the standard forecast horizon
that tends to be between 12-36 months, to which a new month or quarter is added on
when the old month or quarter ends. The most common approach for rolling
forecasting is 12-month forecast horizon, which is updated once a quarter (Player
Page 28
21
2003, 4). Actual outcomes are more often than not updated monthly, but depending
on the industry even weekly or daily frequencies are possible.
The early adaptions of the model of rolling forecasting have been used in
organizations for decades. For example, in terms of business strategy planning,
rolling forecasting has a long tradition and it has been in use for a long time, partly
unconscious (Montgomery 2002, 42). Reflecting the history of rolling forecasting, its
role as a solder of strategy and budget is actually pretty obvious. Although, rolling
forecasting has already a long history, deeper interest in its use as a short-term tool
has only increased dramatically during the last decades (Clark & McCracken 2009,
365). Rolling forecasting has the potential to quicker response time when smoother
anticipation and reaction to changes in the business environment are needed
(Åkerberg 2006, 59). Besides, shifting from traditional annual planning to continuous
planning has the tendency to tone up the operational control and efficiency.
Rolling forecasting embraces a lack of performance of the original budgets, which
may evaporate due to successive revisions, which are rarely in line with the original
expectations of the revised budgets (Hansen et al. 2003, 108). Hence, due to
business uncertainty, fixed budget figures do not necessarily provide reliable
information because they could become obsolete in the early phases of the budget
period. Hence, the ultimate essence of rolling forecasting is to act as a tool for
Figure 3. The Framework of Rolling Forecasting – Skanska Group
4QROLLINGFORECASTACTUAL
Q1F1-REVIEW
Q3F3-REVIEW
Q2F2-REVIEW
Q4F4-REVIEW
ANNUALFORECAST
YEARX YEARX+1 YEARX+2
Q1 Q2 Q3 Q4 Q1 Q2 Q3 Q4 Q1 Q2 Q3 Q4
Page 29
22
updating plans (Åkerberg 2006, 76). However, rolling forecasting should not be
merely an updated version of the traditional budgeting process. Therefore, the
underlying reason for the implementation of the rolling forecasting must be a strategic
urge to genuinely eliminate the ineffective practices of traditional budgeting
(Montgomery 2002, 44). In practise, rolling forecasting can be implemented to
support the traditional budgeting as financial steering tool, or it may replace the
traditional budget entirely (Zellerin & Metzgerin 2013, 299). However, many studies
show that traditional budgeting is still considered as an important part of the
company's financial management and therefore should not be completely disabled
(Becker et al. 2016; Ekholm & Vallin 2011; Raghunandan et al. 2012).
The rolling forecast always reflects the latest changes in the company's operations
and financial situation. These changes may be caused by internal or external factors
of the company. For example, problems in the company's production or supply chain,
sudden fluctuations in demand and overhead cost pressures may change the future
prospects quickly. Hence, forecasting cannot be based solely on past developments,
but should rather compel continuous assessment of the situation to which rolling
forecasting encourages. Thus, two key factors drive companies towards the rolling
forecast: measurability of the impact of actions taken on business development and
its utility to identify future risks and opportunities of the future. (Clarke 2007, 22)
Rolling forecasting, like any other planning, should indicate the strategic direction of
the company at a high frequency (Player 2009, 6). Montgomery (2002, 44) highlights
the connective role of rolling forecasting between strategic planning and cost centre
specific operational budgeting. Rolling forecasting may be used in order to test the
effects of business decisions in advance and monitor their implementation in order to
respond quickly and flexibly to market changes and non-achievement of goals. After
all, the fundamental idea behind rolling forecasting is to continuously monitor the
success of an enterprise's operations and to anticipate the result and financial
position by regularly updating forecast data (Partanen 2007, 176). All in all the most
characteristic features of the rolling forecast are continuous planning and forecasting
throughout the year, focus on future, a coarser level of precision, and a more
accurate response to changes. Rolling forecasting makes performance comparison
Page 30
23
between the actual outcomes and forecasts easier and more accurate since
comparisons are always made with updated forecasts (Drury 2004, 286).
From the controlling point of view, relevant forecasts are necessary, for example, in
order to execute the critical review of controller’s ability to generate reliable forecasts
that adapt to reality. Transparent and updated information produced in rolling
forecasting process enables management to challenge the accuracy of information
generated, which enhances the effectiveness of management control (Byrne &
Pierce 2007, 471). From the group management point of view, rolling forecasting has
the tendency to improve the predictability of the annual result (Åkerberg 2006, 60). If
the company is heading in the distinct direction on the basis of the changed
actualities, changes for rolling forecast can be made immediately despite the figures
in the annual budget. More frequent, rolling forecasts give managers more
confidence in the budget figures used in operational planning and increase
organizational learning (Sivabalan et al. 2009, 856).
Rolling forecasting has been found to improve organizational guidance by enabling
continuous, fast-updated planning and forecasting throughout the year, thanks to
sharpened focus and frequently less detailed content. Organizational guidance
comprises dynamic resource allocation, of which rolling forecasting may open the
eyes of management to look at their resources and take action more frequently than
once a year over budgeting period (Hansen et al. 2003; Hope & Fraser 2003;
(Østergren & Stensaker 2011). In the practical implementation of rolling forecasting,
the company must consider their key business drivers that need to be monitored
continuously and systematically. Forecasting of additional, ”nice-to-know” variables is
not desirable and takes the concentration away from the essential variables (Player
2009, 15). Overly accurate and multivariate rolling forecasting has a tendency to be
just heavily implemented add-on of traditional budgeting (Hope 2009, 10). In addition,
when rolling budgets are used alongside the traditional budgets, rolling budgets tend
to be more numerical calculations than genuine goal-oriented budgets, which reduce
the potential steering effect of the forecast (Montgomery 2002, 43). Rolling approach
may be easily overshadowed by the traditional budgeting and thus organisation does
not take full advantage of it.
Page 31
24
As its best, dynamic resource allocation directs managements’ attention towards both
the constant discovery the profitable projects and seamlessly trains financial
resources to the best projects within the organization as a whole, not within a single
business stream or organisational unit (Bourmistrov & Kaarbøe 2013, 204). In the
worst case rolling forecasting is just poorly implemented add-on for budgeting, which
requires even more resources than traditional budgeting solely without additional
benefits. Nonetheless, the results of the studies have resulted in contradictory results
on the time-consuming effects of rolling forecasting process (Hope & Fraser 2003;
Player 2009). Providing that rolling forecasting replaces traditional budgeting at least
partially and is done on a coarser level, also time-consuming benefits are achievable.
Rolling key figures offer management a sharp vision for longer-term trends of the
company. Long-term rolling ratios are principally convenient for examine the long-
term trends and development of the company. However, the recent major changes
for example in the balance sheet structure, may go unnoticed because it takes time
for changes to appear in rolling figures due to the long time horizon of the ratios.
Short-term rolling ratios offer more dynamic view for company’s financial figures by
bringing recent trends to the figures faster than long-term ratios. When selecting the
rolling key ratios, like any other ratios, attention must be paid not only to the
operational and financial structure of the company, but also to the industry, as all sets
of key figures do not work for every occasion. (Clark & McCracken 2009; Player
2003; Zellerin & Metzgerin 2013)
In order to succeed, the introduction of rolling forecasting requires cultural change
and precise concentration on implementation in the organization. If organisation does
not focus on both identifying the opportunities related to rolling forecasting and the
critical factors that have the most impact on the implementation process, rolling
forecasting does not add value to the company. (Partanen 2007, 176-177) The
expectations related to rolling forecasting must be made clear at all organizational
levels (Åkerberg 2006, 75).
Page 32
25
3. FORECASTING & BUSINESS ANALYTICS
In the short history in mankind, the Renaissance has been identified for the time
when people systematically begin to realise that certain occurrence may have
different probability than other. World was realised as a place with an endless
number of uncertainties that lead to the variable probability of events. (Lapide 2009,
18-19) Comparison of probabilities led to the formation of forecasts.
Forecasting verily entered the business world under the guise of game theory in
1940s. Game theory shaped people's way of thinking. Organisations started to
consider their business as a series of actions all of which have different outcome and
probability depending on which option is chosen. Time series analysis became
everyday tools for companies at the latest when Journal of Time Series Analysis was
published its first release in 1980. The importance of forecasting accumulated in the
business management and culture of looking at the future instead of the reverse
mirror, created a strong foothold among business leaders. The progress of business
forecasting has been accelerating during the past few decades and the concept of
forecasting in relation to probabilities and uncertainties has come a long way since
Galileo Galilei’s time (Hald 2003, 41).
All forecasts are images of the future. Forecasts try to describe the status of an
object at a certain future time. Forecasts are made because people want to have
some sort of assurance about the visions of the future. Human desire to anticipate
and desire to manage and keep the situation under control emphasizes the popularity
of any kind of forecasting. DuBrin (2000, 3) defines management as the process that
uses organizational resources to achieve organizational objectives through the
functions of planning, organizing and staffing, leading, and controlling.
Control as a term means different things for different people. Merchant (1985, 1)
defines control as “keeping things on track”. The right track may be found either with
strict surveillance or more liberate approach or most likely with a stance between the
extremes. Thus, control may be perceived from as many alternative points of views
as there are reviewers. Nonetheless, anticipation and forecasting contributes to the
Page 33
26
formation of control in business environment. Anthony, Dearden and Bedford (1989,
5) define control as follows:
”Control is the process of guiding a set of variables to attain a
preconceived goal or objective. It is a broad concept applicable to
people, things, situations and organisations. In organizations, it includes
various planning and controlling processes.”
This definition highlights the omnipresent nature of the control. All parties in the
organization, together with the defined control process are responsible for the
formation or non-formation of the control within the organisation. In the academic
management literature, the word ”control” may be understood as difference between
the forecasted and actual performance (Kanthi Herath 2007, 897). The same
interpretation is general in financial management systems, where the existence of
controls with countless purposes is inevitable. Increased control needs are often the
reason for introducing modern forecasting methods in addition to traditional
budgeting (Neely et al. 2003, 23). The significance of built-in controls will be
highlighted at the latest if controls are able to identify possible corrective actions,
which eventually lead towards the planned performance. It is likely that control might
be the most import element of the successful management in the long run.
An alternative standpoint for forecasting was presented by Sterling in 1975.
According to Sterling (1975, 31) for example the value of the final depreciation is
unknown until the asset is sold. The same ideology applies to the actual profit of the
company, which according to Sterling (1975, 31) becomes fully realised only when
the company stops its business not during the active years. Nowadays, the elements
of Sterling’s ideology may be found in life cycle thinking (LCT). Most commonly,
processes of forecasting and analytics begin with the measurement of the current
state. Measurement is a process in order to find the present status of the company.
On the other hand, prediction is the allocation of historical data to the time series,
based on the predicted future values. Thus, it can be assumed that the determination
of the current state of the company is strongly based on the determination of how
company sees its future. (Sterling 1975, 32)
Page 34
27
3.1 Intelligent Business Through Big Data
“Data-driven decisions are better decisions – it’s as simple as that”
(McAfee, Brynjolfsson, Davenport, Patil & Barton 2012, 64).
In general, big data means loads of data that can be gathered from abundant
sources and utilized through computing power. Big data as a term refers not only to a
large amount of data, but also to the complexity, diversity and speed of data
collection and processing (Sakr, S. & Zomaya, A. Y. 2017, 102). The volume, variety
and velocity of the data, which has become exceedingly accessible during the past
decade, make big data a unique source of analytics (McAfee et al. 2012, 63-64).
According to Frizzo-Barker et al. (2016, 403) big data is still fragmented area of
research in academic literature due to rather challenging theoretical framework and
shortage of empirical research. Mello et al. (2014, 1844) encourages researchers
and companies to further investigate the connection between big data and
performance measurement to the end that results new performance metrics, analytic
instruments and data visualization.
One of the biggest challenges of big data is to understand its immense potential and
value in different business functions. Barton & Court (2012, 81) stated in the early
2010s that the wave of big data is mounting with the speed that cannot be despised
by senior leaders, if they fancy seeing their companies to flourish in the future.
Building information modelling (henceforth abbreviated as ‘BIM’) is a prodigious
example of using big data to smoothen the gap between planning and operations in
the construction industry (Zhang et al. 2015, 31). In the framework of this study, big
data will not be dealt with in greater detail, rather raise it up as a factor that plays a
key role when finding attributes of forecasting, modelling and analysing business.
Business intelligence is a key data analytics term that dates back to the late 1950s.
At that time, Luhn (1958, 314) defined business intelligence as a process based on
statistical procedures that can be performed mechanically and with which
organizational problems may be solved. After Luhn’s time, business intelligence as a
term has been defined countless times again. Irrespective of the interpretation and
Page 35
28
the era in which the definition of business intelligence is made, the connective factors
of the definitions have been its use as a decision-making tool and data exploitation
for business with the help of information management.
Term ‘intelligent delivery’ refers to the fact that business intelligence information
should be available for efficient decisions at the time when it is needed (Bose 2009,
159). Generally speaking, business intelligence and analytics may be considered as
an exercise where data is systematically excavated and analysed, which supports
company’s management to make data-driven decisions (Acito & Khatri 2014; Wang
2015). Based on the surveys of business practitioners and the recently pronounced
role of BI and analytics in education, academic researchers are quite unanimous of
the mounting need of BI and analytics professionals in the business environment
(Davis & Woratschek 2015; Wilder & Ozgur 2015; Wixon et al. 2014).
Business intelligence is a complete process where the right information reaches the
right people at the right time, which enables effective decision-making and enhances
the performance of the company (Bose 2009, 156). Business intelligence may be
described as the processing and use of information to support business. Intelligent
business information is crucial for performance measurement through the
organisation. The goal of performance measurement is to evaluate how well the
company is managed and how the company manages to generate value for
shareholders. Measuring performance plays an indispensable role in setting goals
and making better business decisions. (Mello, Leite & Martins, 2014, 1838).
Wilder & Ozgur (2015, 186) identify three levels of professionals needed in the
organisation to implement a workable business intelligence and analytics. In the first
instance, organisation needs data scientists with a quantitative and mathematical
proficiency in computer science. Hereafter, data specialists who understand how
data is managed and business analysts to frame business problems, to identify
prospects and to exploit results with a data-savvy state of mind. It is noteworthy that
the communication between the parties has to be strong. (Wilder & Ozgur 2015, 186)
Page 36
29
Most business intelligence systems are based on the three-phase process. The first
step is data collection from different sources. The original data can be widespread
information in the organization layers, found in different formats, and very large in
quantity. In the second stage, the data is converted to standardized and measurable
format in order to meet the objectives and interests of the organization. In the final
step, the findings that can be made of the data are presented in patterns. When
making findings and conclusions, it is important to note that they are clear and
straightforward for the organisation's management in terms of the further
communication and usability of information. (Chiriac et al. 2007, 3)
Large-scale academic researches affirm that data is generally considered to be the
driving force behind better managerial decision-making and improved profitability
(Waller & Fawcett 2013, 77). Data mining, whether it is text, pictures, numbers or
web mining, creates the base for advanced analytics (Bose 2009, 156). The greatest
benefit of data mining is obtained when the technology and discoveries from mined
data is used to develop analytical models, for example forecasting patterns (Wang &
Wang 2008, 624). Data science as a term refers to the application of quantitative and
qualitative methods, of which purpose is to unravel discovered problems and forecast
possible future outcomes (Waller & Fawcett 2013, 77). From aforementioned point of
view, the concepts of data science and data analytics are very close to each other.
3.2 Predictive & Advanced Analytics
Early adaptations of data analytics have been used to support business for a long
time, but since the emergence of big data in the 2010s, the popularity of data
analytics has grown strongly. Even if the amount of research on the subject is
emerging, there are still many interpretations of what big data and analytics will mean
for organizations in the future. (Frizzo-Barker, Chow-White, Mozafari & Ha 2016,
403)
”As a general term, analytics refers to the science of logical analysis”
(Liberatore & Luo 2010, 314)
Page 37
30
Development has taken analytics from the traditional rear-view mirror set-up towards
predictive analysis, which may also provide guidelines and future visions for
organizations to support their decision-making (Bose 2009, 155). The time window
when the information is available and whether the information concerns the future or
the past can make all the difference for the consumer of the data. Driver to execute
data analysis according to Tien (2013, 128) is the volition “to obtain or derive
information from data, knowledge from information, and wisdom from knowledge”. In
other words data analytics is characterized by the desire to shape the data in order to
learn from it.
Predictive analytics is considered as a subcategory of data science (Waller &
Fawcett 2013, 79). Predictive data analytics means converting data into the
predictions of the future events (Lawless 2014, 44). Predictive analytics offers a way
to transform risks and uncertainties into opportunities. Prevalence of advanced and
predictive analytics has been emerging exponentially since the terrible occurrence of
September 11, 2001. Advanced and predictive analytics were employed first in the
fight against terrorism and crime, and subsequently in improving the efficiency and
predictability of everyday business operations of the companies. (Jonas & Harper,
2006, 5-6) Advanced information and data analyses are the fundamentals of the fast-
paced modern business environment in order to comprehensively understand
business dynamics and systematically manage the performance of the company
(Schläfke, Silvi & Möller 2012, 110). Nevertheless, large amounts of data also pose
challenges for analytics, whereas the application of data in business is not
unambiguous. Sophisticated predictive analytics may be a powerful tool in financial
performance forecasting in the construction industry.
Advanced analytics as a concept is moderately challenging to define. Generally,
advanced analytics may be understood as a way of implementing altered advanced
analytics techniques to data in order to crack problems (Bose 2009, 156). Therefore,
it may be difficult for an organization to identify possible applications for advanced
analytics because the concept of advanced analytics can be built together from
dozens of small sources and tools. Generally increased urge towards the use of
analytics has raised a lot of discussion among academics and professionals about
the influences and prospects of predictive analytics (Liberatore & Luo 2010, 313).
Page 38
31
Predictive analytics is used in business environment in different ways. Businesses
use historical data and real-time data to gain a deeper understanding of their
operations, customers, and commodities. However, no matter how sophisticated
model, no predictive analytics offers exact certainty of the future. Thus, the purpose
of the predictions and predictive data analytics, corresponding the purpose of
forecasting in general, is to provide a reasonable assurance of what might happen
next (Lawless 2014, 44).
3.3 Exploitation Process of Analytics
The concept of data analytics as a whole covers the collection, analysis and use of
data as business support. Process of analytics starts with the data phase where
information is collected both from external and internal sources. More often than not,
collected data needs extraction and manipulation since analytics has not been the
primary reason why data has been created and stored in the first place. The rapid
growth of large data flows poses challenges for both data collection and decision-
making. However, at the same time new opportunities for analytics are created.
(Liberatore & Luo 2010, 314) Thus, it is highly beneficial if the quality of the original
data is decent and requires only marginal adjustments. Otherwise, data phase may
require a lot of resources. The saying “you get what you measure” applies particularly
well in analytics: bad data leads to incomplete analyses and false conclusions
(Hummel, Huitt, Michael & Walters 1994, 10).
The second step of the process is analysis, which is divided into three phases:
visualization, predictive modeling, and optimization. Initially, the data is presented
visually using different dashboards and diagrams, which facilitates data analysis and
makes it easier for analyst to focus on the essentials. Hereafter, predictive modeling
techniques, such as statistical methods and artificial intelligence practices, are used
to discover fluctuations, correlations and classifications from the selected data.
Optimization wraps up the analysis and given the postulations and delimitations
leads to the selection of the best models with whom to proceed. (Liberatore & Luo
2010, 314-315) Functional data analytics are essential capabilities for organisation to
edit data into the decision-making format (McAfee et al. 2012, 64).
Page 39
32
After analysis, the third step of the process offers insights for decision-makers.
Insights strive to provide answers the unanswered questions through visualisation of
the former performance, predictive modeling techniques and future optimisation
methods with the intention to display the right track for decision-maker. Step four is
where the actions based on the analysis are realised as decisions, changes in a way
of working or strategic redirections. Phases three and four are highly linked since
insights have no tangible value if they do not lead to deeds. (Liberatore & Luo 2010,
315) Desirable results of the analytics process may include, for example, accelerated
information flows, upgraded decision-making quality and enhanced forecasting
accuracy. Well-executed process of analytics responds to the urge of discovering
answers to identified problems. The four steps of analytics process according to
Liberatore & Luo (2010, 314) are represented in figure 4.
During their cooperation with dozens of companies that are operating in exceedingly
data-rich industries, Barton & Court (2012, 80-82) explored three fundamental
phases of organisations’ full exploitation of data and analytics. As in the scheme of
Liberatore & Luo (2010), Barton & Court (2012) also give high priority to data quality,
data processing and visualisation in the analytics process. While Liberatore & Luo’s
(2010) approach of analytics process focuses on data-driven insights that facilitate
strategic decision-making and operational changes, Barton & Court (2012) are more
dedicated to organisational adaptability and competencies to execute efficient data
analytics.
Figure 4. Process of Analytics (Liberatore & Luo 2010, 314)
Data
Collection
Extraction
Manipulation
Analysis
Visualization
Predictive modelling
Optimization
Insight
What happened?
What will happen?
What should
happen?
Action
Operational decisions
Process changes
Strategic
formulations
Page 40
33
First and foremost the important sources of external and internal data, which seems
to affect the performance of the company must be found from the infinite data jungle
and taken advance of. More often than not, this requires updating of company’s
information technology architecture in order to allow extensive access to data.
Furthermore, the editing and merging capabilities of data must be in condition. Next,
accessible data is structured into an understandable form from which the prevalent
drivers of performance could be picked up. Selected drivers may be used as
explanatory factors of forecasting models. A general dilemma in model-creation is the
balance between complexity and expediency, and therefore user-friendliness. Built
models enable optimization by presenting alternative business outcomes and
scenarios. (Barton & Court 2012, 80-81)
The third focus area of data and analytics is organisational transformation. Common
concern within organisations is the lack of trust in big data models. Hence, created
tools must understandable and easy to use for professionals who should benefit from
them. A clear border between managers using the data-driven insights and data
scientists and developers is vital to the success of the model. Furthermore, big data
exploiting and analytical capabilities must be continuously developed as well as the
advent of an analytical culture, which is a long, demanding process. (Barton & Court
2012, 82)
When it comes to the culture of forecasting and analytics within the organisation, it is
possible to distinguish between two options. Either it is declaratory or influencing. If
the forecaster wants to know the future and just prepare for it, he will try to find out
what is the most likely future. Any influence in future development will not take place
and the forecaster accepts the most likely status of the future as it is. If we assume
that future development can be influenced, we talk about guiding forecast. In this
case, the forecaster already has an idea of his goals, but he is not aware of how they
can be achieved. Guiding forecast includes two phases: declaring review, which is
done in order to understand the future development and planning, which aims to
identify the measures that will lead to the achievement of the desired results.
(Schläfke et al. 2012; Morlidge & Player 2010)
Page 41
34
3.4 Demand Management
During the 1980s, business forecasting began to emphasis demand-driven
forecasting (Lapide 2009, 18-19). The role of demand management has been gaining
ground among the business forecasting ever since. Two core elements have been
pushing this evolution forward. Firstly, the compulsion and thirst of information from
the stakeholders, media and customers have forced companies to produce and
share business information, such as more detailed future prospects. Secondly, as a
result of companies' built-in curiosity about their own activities and operations, the
efficiency in supply chain management and demand forecasting has improved.
(Crum & Palmatier 2003, 2)
While new technologies have enabled efficient data access and processing, business
forecasting as a whole has become more diverse and eye-opening process for
modern companies (Frizzo-Barker, Chow-White, Mozafari & Ha 2016, 403). Data that
was once inaccessible is now helping companies to plan their future. Therefore,
organisations are willing consume a great number of resources in an attempt to
forecast the market movements. The information technology development has
enabled new dimensions such as the utilization of data created by individuals
containing partly questionable information such as geographic information, personal
preferences, browsing history, search trend and social media behaviour (Li, Pan, Law
& Huang 2017, 59-60). Precise demand management is an inevitable
encouragement for companies in order to success in global business environment.
Hurtling trends create huge shifts of the market and volumes of the world trade are
bigger and more global than ever (Lapide 2009, 19). Thus, it is increasingly
problematic to succeed in managing demand in a modern lively market.
Demand forecasting plays a crucial role in the strategic and operational demand
management. Demand management consist of three fundamentals: demand control,
demand planning and development. Furthermore, demand forecasting aims to
foresee customers’ buying behaviour and consequently, the turnover of the company.
However, demand management, as a complete process is much more than solely
forecasting. Demand management consists of interconnected strategic and
Page 42
35
operational processes (see figure 5, 35). Collaborative sub-processes form an overall
process that serves a common goal: effective and in time demand management
where supply meets the demand. (Croxton, Garcia-Dastuge, Lambert & Rogers
2002, 53)
Strategic sub-processes begin with the specification of the demand management
goals that should be linked with the corporation's strategy (Croxton et al. 2002, 54).
Successful demand management requires a lot from people implementing executing
the process. The general justification for forecasting is the better understanding of
the business operations it produces. During the forecasting process, people will
become more aware of the long-term consequences of their own decisions, which
helps them to make better decisions in the future. Customer knowledge, operational
business flows, market awareness and industry knowledge are vital aspects to
dominate. (Lawless 2014; Wilder & Ozgur 2015) Furthermore, the focus of the
forecasting process must be well targeted to avoid getting the wrong things in the
forecast.
Figure 5. Demand Management Process (Croxton 2001, 19)
Page 43
36
After the strategic guidelines of the demand management process are set, the
second strategic sub-process focuses on procedures used for forecasting. The
appropriate selection of researchable variables, forecasting methods and essential
control and review levels of the forecast form the core of procedures. After a
thorough review and identification of these strategic sub processes, the walkthrough
of operational sub processes begins. (Croxton et al. 2002, 53-55)
The operational demand management process starts by reviewing available
information, both external and internal. Right information is assembled when the data
collection procedure follows the parameters determined in the strategic sub-
processes. (Croxton et al. 2002, 61) Extensive data collection from different sources
and combining all the gathered information is essential for the forecasting process.
Data collection is the single most sensitive part of any analytics work. Bad data leads
to lamentable analysis and incorrect conclusions and actions. The validation of data
refers to organisations ability to separate good data from bad data. In the best case,
the identified, poor quality data can be edited to a usable form. Occasionally
corrupted data is better to reject thoroughly. (Braunstein, Bretas, Rossoni, & Bretas
2015, 1) After data is collected, selected and validated, analysing and forecasting
process shadows.
Forecasting consists of repeatable four phases: data analyse, forecast development,
tracing miscalculations or data faults and providing accurate feedback (Croxton et al.
2002, 61). Forecasting is often only executed without thinking more precisely of its
goodness, badness or development. Continuous learning loop where forecasting
errors are tracked and forecasting methods adjusted for better results is prerequisite
for the development of company’s forecasting ability (Croxton et al. 2002, 61).
The operational demand management process ends with the measurement of the
performance with the metrics defined in the management strategy. Performance
measurement metrics must be linked to company’s economic value added
(henceforth abbreviated as ‘EVA’). Developed asset management, better product
availability, improved investment deployment and in-time resource planning are
examples of benefits gained through successful demand management. (Croxton et
Page 44
37
al. 2002, 59, 63-64) The desired top-level consequence of performance measuring is
overall process development. Through identifying the grievances and sweet spots of
the company, optimization gets more sophisticated and performance improves.
(Croxton et al. 2002, 64) It must to be bear in mind that functional operating process
as a whole, always follows the defined strategy.
3.5 The Role of Demand Forecasting in Business Planning
Today’s business procedures are chains of operations. Every component of the chain
has its own occupation in a series of actions that aim to add value for the end
commodity and to shareholder. Even if the operations in the chain are independent,
they are also interdependent. Demand is a factor that has an indisputable tendency
to dictate boundary conditions to the business operations. A value chain encloses the
entire range of activities that are prerequisite from the early conception of the
commodity to the after-use disposal (Kaplinsky & Morris 2001, 4).
Depending on the nature and the breeding value of the commodity, the value chain
varies from long and complex to short and straightforward. If the value adding
performance of the company is at high level, the company achieves a competitive
advantage compared to its rivals. As customer dictates the supremacy between
commodities and companies behind them, business decisions should be made as
customer-oriented as possible (Woodruff 1997, 141). Continuous and successful
market making without customer-oriented mind-set is genuinely impossible.
Customer order decoupling point (henceforth abbreviated as ‘CODP’) is the phase in
the chain of operations where a commodity links to a specific customer order. Hence,
CODP dictates the point where company start to use forecast to adjust its operational
activities instead of actual orders. The position of CODP is highly dependable on the
characteristics of the industry such as the quantity and volatility of demand and the
elasticity of production and planning. CODP is located in the beginning of the value
chain in the industries with volatile demand and long delivery times and vice versa.
(Olhager 2003, 320-322)
Page 45
38
Based on the location of CODP in the value chain, companies and their operations
may be roughly split between order-driven and forecast-driven (Olhager 2003, 320).
Construction industry represents the ultimate end of order-driven business.
Fundamentally, each project is ordered and built to the identified customer. When
commercial and residential buildings or civil engineering projects are custom-built for
private or public customer using for example hard bid or negotiation contract form, it
is clearly order-driven business. However, the construction company may also make
an order to itself. In this case, company starts to build a development project to the
land it owns and searches the buyer, for example institutional investor or the buyers,
for example private home buyers, later in the process.
Development projects contain more risk than external contracts because they are
built into company’s own balance sheet. Nonetheless, the return potential of the
investment goes hand in hand with risk. When it comes to the split between order-
driven and forecast-driven, development projects contain elements from both. Order
is made by company itself, because organisation believes that it is a healthy
business case with profit potential. Therefore, it is forecasted to be sold at the right
price within a reasonable time. If the forecast of the business case seems too risky
for example due to market forecast, location, project model or lack of potential buyers
it will probably not start. Unsold, completed projects bind large amounts of capital
and the value of empty premises tends to fall as time passes. Thus, companies are
not willing to take unnecessary amount of risks in their own development projects,
despite the attractive return potential.
Undoubtedly one of the most important operators of demand forecasting is the supply
chain management. Companies’ strong focus on their core competencies and the
need of flexibility both in production and fixed cost items has led to the spread of
subcontracting. Competition that used to be between companies is now held
amongst the entire supply chains (Hazen, Boone, Ezell & Jones-Farmer 2014, 73).
The most proficient supply chain management creates significant competitive gains
for each member of the chain. Increasing intricacy of supply chains directs
companies to steer resources to procurement and supply chain management.
Demand forecasting plays a key role when trimming the proficiency of supply chain
Page 46
39
operations. (Christopher 2012, 3-5) Nevertheless, subcontracting and sophisticated
supply chains construct negative impacts on demand management. Complex supply
chain network has a tendency to interfere the accuracy demand management with
phenomena such as the bullwhip effect.
Today’s mavens of supply chain management are overwhelmed with big data that
offers wide range of possibilities for decision-making, production optimization and
process improvement (Hazen et al. 2014, 73). However, there are opposing opinions.
Waller and Fawcett (2013, 84) did not see the direct link between big data and supply
chain management as important but emphasized the character of data science and
predictive analytics as part of supply chain management.
Supply chain management has encountered critic because it concentrates primarily
on costs and on process development that ignores the customer and the market.
Demand chain management offers complementary approach to this issue by
analysing the overall demand of the market in contrast to the current commodities
company offers to its customer. Many researchers accuse term demand chain
management should replace supply chain management based on the fact the chain
of operations should be driven by market and demand, not driven by suppliers.
Christopher (2012, 33)
Demand chain management focuses on finding the elements where company
creates value to the customer. Process starts with the definition of micro- and macro-
market characteristics. Value profiling and value proposition leads to the definition of
commodity features, where the solutions are customer-oriented and based on the
market conditions. Product and category management of a commodity, which is
based on the customer needs, provides a good foundation for successful customer
relationship management. (Rainbird 2004, 238) The contradictory approaches of
supply chain management processes and demand chain management processes are
detailed in appendix 1.
The demand forecasting is particularly important part of the business planning. Thus,
regardless of the characteristics of the company, it should be applied in the decision
Page 47
40
making process (Szozda & Werbińska-Wojciechowska 2013, 77). Companies’
strategic and operative plans are often made to reflect the expected level of revenue.
When the amount of resources is based on the assumption of a certain level of
turnover, it highlights the important of demand forecasting (Stevenson & Sum 2014,
12). In the case where approximation of the revenue level is imprecise, it may cause
idle in the processes that are crucial to business. Hence, idle results the wastage of
both resources and efficiency evidencing the importance of the accurate revenue
forecasts.
Business planning should start with an appraisal of future sales. Business plans
related to each compartment of the company must be utilized and proportionate to
the assumption of future business volume (Stevenson & Sum 2009, 12). Conceivable
applications are numerous since business units, processes, and functions require
resources to work. Furthermore, resources must be proportional to the volume of the
company. Particularly important is to utilize forecasts of future volumes in
departments that are in direct contact with sales and manufacturing processes such
as procurement and production management (Makridakis & Wheelwright 1989, 20-
21).
Based on the location of CODP, for forecast-driven companies demand estimates
are exceptionally well suited to avoid either underproduction or overproduction
(Olhager 2003, 322). If company’s business model is exclusively driven by orders,
one might say that company does not anxiously need revenue forecasts. However,
heavily order-driven companies may take advantage of revenue forecast for example
in resource planning and while determining the levels of fixed costs. Furthermore,
demand forecasts are highly applicable for occurrences such as analysis concerning
company’s financial and market position, industry trends and cost structure.
(Makridakis & Wheelwright 1989, 19-22) All things considered, demand forecast is a
great tool of business controlling, planning and scheduling for management through
all levels of the organisation.
Sales and operations planning is the beating heart of the company maintaining a
process that aims to balance both supply and demand of the company while making
Page 48
41
a profitable business. To some extent, sales forecasting affects on all the levels of
operational and strategic planning. When studying the business operations of any
company, it is not difficult to find the decision-making moments in which a functioning
crystal ball would be useful. Particularly, production-intensive companies and heavily
subcontracted business operations benefit from accurate forecasts when managing
demand and supply chains through sales and operations planning (see appendix 2).
(Mentzer & Moon 2005, 10-14) Altogether, a forecast that company may count on
produces better decisions at all the levels of the organisation. Business operations as
a whole are hard enough to manage without great uncertainty concerning the
potential range of future demand.
3.6 Characteristics of Demand Forecasting
Demand forecast is an approximation of the level of demand for a commodity at a
specified period in the future. Accurate demand forecast creates stability and
predictability in the organization. The objectives of the forecast, what organisation
wants to achieve with the forecast, dictates all the choices that are made in its
development. Time dimension of the forecast is one of the fundamental decisions to
be made in the early phases of the process. (Buffa & Sarin 1987, 54) Demand
management consists of various process interfaces, which is why users often have
different expectations about the forecast. Consequently, forecasts with different
characteristics and time dimensions are essential to meet the needs of each user
group of the forecast. (Croxton 2001, 19) The longer the time dimension of the
forecast is, the more strategic level decisions should be able to be made based on
the forecast. In turn, forecasts with short time horizon are particularly useful for
detection of rapidly changing trends, and thereby enable dynamic operational
response of the organisation.
Makridakis & Wheelwright (1989, 20) have identified four separate time dimensions
of forecasting. The shortest time dimension, which is called an immediate period,
stands from one day to one month, and a short period settles from 30-days up to
three months. Due to their tendency of detecting the seasonal fluctuations particularly
well, immediate and short period forecasts are valuable for quick, operational fine-
Page 49
42
tuning related production levels, resource allocation and pricing. In addition,
characteristics of the short-term forecasts are more precise, easier to tailor, more
cost-efficient and more detailed than long-term forecasts (Lapide 2001, 18-19).
Medium forecasting period stands between three months and two years. Forecasts
with medium-length periods are particularly well suited for fundamental decisions
related to production levels, resource allocation and cost-structure as well as for
profit optimisation, balance sheet and cash flow calculations and budgeting. Attention
to trends, seasonality and cyclical fluctuations is crucial in medium and long period
forecasting. (Makridakis & Wheelwright 1989, 378-385) More often than not,
forecasts with immediate, short and medium length are used for time series analysis
purposes. Time series may go a long way in history, but towards the future,
extrapolative power of time series may weaken due to increased uncertainties (Box,
Jenkins, Reinsel & Ljung 2015, 2).
Forecasting period is titled a long period if it reached over two years to the present.
Frequently, forecasts over two years from present are always comparable to strategy
work and long term business planning related to long-lasting decisions such as
investments, divestments, sales and ensuring healthy financial position. (Makridakis
& Wheelwright 1989, 20-21) In order to improve the accuracy of long-term forecasts,
which have a lot of built-in uncertainties, also qualitative and macro-level input must
be taken into consideration (Buffa & Sarin 1987, 55). Since each forecasting situation
is unique, the barriers between the time dimensions of the forecasts are fading and it
is not even necessary to make a precise universal alignment (Granger 2014, 6).
Extensive time horizon boosts inaccuracy of the forecast. Therefore, making too
detailed forecasts far into the future is not desirable.
Chopra & Meindl (2010, 199) have introduced the four main principles of demand
forecasting, all if which are more or less related to the impreciseness of forecasts.
First principle states that forecasts are always inaccurate and that must be accepted.
There is no method or model advanced enough in the world that is able to forecast
exactly right repeatedly. Inaccuracy encourages forecaster to create a forecast range
(high case – most likely – low case) or forecast with fuzzy numbers. Approach takes
Page 50
43
forecast error into consideration when assessing the reliability of the forecast.
Forecasting error must be measured and monitored and forecast should include
information about its presumptive forecast error. (Chopra & Meindl 2010, 199) The
more uncertainties the forecast contains, for example related to the length of the
forecasted period or external factors, the more inaccurate the forecast is.
According to third principle total demand forecasts tend to be more accurate than
sub-demand forecasts. Phenomenon is due to the law of large numbers, where
excessive dividing of datasets and urge to reach the level of detail leads to a loss of
accuracy. Bullwhip effect is the last demand forecasting principle of Chopra & Meindl
(2010, 199). Bullwhip effect has the tendency weaken the precision of demand
forecasts. Even if inaccuracy is one of the attributes of forecasting, they should not
be fated. After all, focusing on forecasting accuracy is likely to improve it in the long
run, and the purpose of forecasting is to give prospects for the future, not the
absolute truth.
Bullwhip effect is an inherent part of demand management. In a nutshell, bullwhip
effect generates errors to the demand levels and forecasts (Grabara & Starostka-
Patyk 2009, 132). Errors happen due to multi-layer supply chain where each actor in
the supply chain places greater orders than their actual demand estimation suggests.
This safety factor piles up in the chain and increases the inconsistency of orders and
demand as illustrated in appendix 3. As a result of the increasingly distorted demand
information, more complex the chain is and the greater the gap is between the end
customer and the company, broader is the gap between the actual demand and the
up front achieved demand information. (Chopra & Meindl 2010, 199)
Bullwhip effect originates from four different sources: order batching, pricing,
shortage gaming and demand forecast updates. Order batching problem is a
consequence of order delays and deplorable predictability of orders, which lead to
under-, and overestimation of demands. This happens due to practical reasons:
when order arrives, it rarely takes place instantly upon request. Lack of real-time
order status and weekly or monthly basis order cycle leads to order assembly, which
creates operational inefficiency. (Lee, Padmanabhan and Whang 2004, 1877)
Page 51
44
Reductions in commodity prices have a negative effect to exchange in a supply chain
because actual needs of the company and bought quantities do not meet.
Consequently, stocks are piling up and capital is committed. Swollen stock and
varying prices lead to a problem where the supply does not meet the demand.
Domino effect of shortage gaming begins when companies regulate their products to
the customers in a situation where demand exceeds supply. Customers are returning
the favor by placing oversized orders and if necessary cancelling orders when
demand is falling. Insufficient update frequency weakens the quality of demand
information. While demand information goes through numerous stages of the supply
chain, the cognition changes as it passes adding the variance and reducing the
reliability of the information (Lee et al. 2004, 1877). All the reasons together behind
the Bullwhip effect disturbs coherent decision-making and causes inefficiency and
additional costs for the organisation. (Lee et al. 1997, 97-99)
Bullwhip effect may be reduced with active and open discussion and information
sharing amongst the organisations in a supply chain. Information sharing reduces
issues related to all the major reasons behind bullwhip effect: order batching, pricing,
shortage gaming and demand forecast updates. Small batch sizes helps to control
order-batching problem. Furthermore, non-discount strategy and a common desire in
a chain not to unnecessarily wave prices damper price fluctuations. Customer
allocation based on the past sales is one way to moderate the shortage gaming.
Various actions may be made in order to restrain the bullwhip effect in a supply
chain. If Bullwhip effect is powerful and cannot be curbed, the entire chain may be
cut off. Nevertheless, it is not probable to wipe out the phenomenon as a whole if
company has a tendency to it. (Lee et al. 1997, 99-102) In the context of this
research the Bullwhip effect appears first and foremost in the causal relationship
between order bookings, order backlog and revenue.
Careful definition of demand forecasting process and finding the right prediction
method are crucial elements behind the successful demand management. According
to Armstrong (2001, 8) the forecasting process starts when the problem emerges in
the organization (see figure 6, 45). At first, grievance needs to be accurately
described. After the problem to be resolved is formulated, all the relevant information
Page 52
45
and data concerning the issue must be brought up. Gathered data is further
processed in order to understand the substantive pieces of information for problem
solving. Furthermore, selected data must be converted into the format that serves the
forecasting purposes.
It is necessary for the forecaster to understand the nature of the data so that it can be
taken into account in building the forecasting model. All the major variables affecting
the prediction and the inconsistent variations in the data must be taken into account.
Information gathering and data processing is followed by the selection of forecasting
methods. Thereafter the use of forecasting models and further development may
begin. (Hanke, Reitsch & Wichern 2001, 69-70)
The fifth step of the forecasting process: evaluation of forecasting methods is able to
destroy the entire forecasting process. If the critical evaluation of the model
miscarries, there is a high probability that it results a prediction model that does not
serve the purpose for which it was built. Accuracy evaluation between the information
produced by the forecast and the reality is the most obvious way to expose the
exactitude of the forecast. If the models used are proven to be inaccurate, few steps
will be taken back in the process. The loop from method selection through
implementation to method evaluation must be repeated as long as the desired
accuracy is achieved. (Armstrong 2001, 8)
Subsequently, the method evaluation creates the most promising forecasting models
for further improvement. Generally, the most accurate models are selected. However,
also other factors than accuracy such as complexity of the forecasting method,
forecasting costs, contentment within the organisation, desired forecasting period,
purpose of the forecast and data accessibility must be bear in mind throughout the
forecasting development (Hanke et al. 2001, 71). Thereafter, the accuracy of
Formulate Problem
Obtain Information
Select Methods
Evaluate Methods
Use Forecasts
Implement Methods
Figure 6. Stages of Forecasting (Armstrong 2001, 8)
Page 53
46
forecasting and all aforementioned factors should be frequently estimated in the
event of errors made throughout the forecasting development process.
There are multiple elements affecting the sales forecast. Macro level factors such as
market and business environment are more or less given, uncontrollable features to
company. Market shares and demand balance are either primarily or secondarily
influenced by the actions of other players in the market and in the supply chain, regu-
lation form government, company’s own actions. All factors together impact on the
structure of sales and profits. Hence, time and reflection should be used in to develop
forecasting model that takes all the affecting elements in to account. Thus, by
comparing forecasting methods and combinations of factors, model becomes more
and more accurate. (Armstrong 2001, 6) Even if the forecasting process starts from
the problem nativity and ends to the usage of well functioning forecasting model, it is
fundamental to realise the important of continuous development and revaluation of
the model when there are constant, minor changes in the operating environment.
3.7 Analytics in Construction Industry
The construction industry is accountable for executing the most expensive projects in
the world. Construction projects are filled with complex processes from excavation till
the finishing works in order to build a skyscraper, bridge or underground metro line.
While abundance resources are needed to accomplish the projects, construction
process generates huge amounts of data for analysts to crunch.
Analytics have always been part of the construction business. However, construction
industry does not have a reputation to implement modern tools among the first. Big
data, advanced analytics and machine learning are good examples of the modern
tools that have shone in their absence in the construction industry, while other
sectors have taken great steps forward in exploiting them. (Bilal, Oyedele, Qadir,
Munir, Ajayi, Akinade & Pasha 2016, 500)
The importance of big data analytics has been emphasized in both academic and
business environment over the last two decades (Li et al. 2017, 62). Construction
Page 54
47
industry creates massive amounts of complex data every day. Projects generate a lot
of data, which has been stacked away to companies’ hard drives without greater
exploittation. Thus, it seems that in most cases due to data inactivity, the quality of
the stored data does not meet the expectations of modern needs such as predictive
analytics, machine learning or artificial intelligence. Incomplete and unstructured
datasets make the progress of the company extremely hard to track. Siloed data
makes it more difficult to utilize information to achieve greater benefit through
analytics. (Soibelman et al. 2008, 15) Conclusions that are made based on these
datasets are highly unreliable, less transparent and prone to miscarriage.
Analytics are converting the construction industry and possible applications are
countless, from architect drawings, design control and building information modelling
to construction work flows, procurement planning, financial management home
buying with augmented reality applications. Industry volumes are huge, projects are
expensive and characterised with tight time schedule. Even tighter than the
schedules are margin levels of the construction industry. Applicability of big data and
analytics in construction industry is further improved with the emergence of BIM,
augmented reality technologies and smart buildings (Bilal et al. 2016, 516). All
industry and universal trends combined, these changes ought encourage to the use
of big data and more sophisticated analysis of the operations in the future.
3.8 Theoretical Reflection to Case Study
Strategic and operational demand management create the foundation of this thesis
as defined in Croxton’s (2001) process chart of demand management (see figure 2,
14). Demand management is a cohesive scheme that guides management to
evaluate, control and track their business units (Crum & Palmatier 2003, 4). In 2007,
Davis and Mentzer discovered that in most organisations, there is a gap between the
theory and practice of sales forecasting. Thus, study aims detect the practical
applications of forecasting and reflect them to theoretical framework.
Generally, two types of material are used behind the forecasting: on the other hand,
updated current state of the phenomenon based on the recent data, and on the other
Page 55
48
hand, information on the long-term evolution of the examined phenomenon. This
research utilizes data series and interviews to understand the past, the current state
and the desired future of the phenomenon. Long-term evolution may be verified on
the ground of the theoretical model and the development history of the predictable
phenomenon using for example data time series. Hence, theoretical model describes
the normal development of phenomena to which the deviations can be reflected.
The purpose of the quantitative part of the research is to answer to research question
related to the first sub-objective by discovering regularities on how revenue forecast
accuracy improves over time. Quantitative analysis is executed by measuring the
accuracy of the revenue forecasts made in different time periods. Hundreds of
forecast series and actuals from different levels of the organization are used to form
a forecasting funnel. Forecasting funnel should work as a bell curve of revenue
forecasting. Hence, research hypothesis of the first sub-objective is that the accuracy
of revenue forecasting improves when moving forward in time from the previous
forecast cycle to the next. This is due to the fact that the amount of construction
contracts that company seeks to sign for forecasted year, target works, is reduced.
(Chopra & Meindl 2010, 199) As a result, the relative share of secured revenue
increases and the confidence in the construction starts of booked orders is improved.
In terms of financial steering of the company, data analytics particularly often focused
on management and finance accounting, cost management and strategic financial
management functions. The findings of this research would make it possible to
construct preliminary scenarios of revenue forecast statistically. Preliminary revenue
forecast would be the baseline estimate from where the forecaster starts with
hers/his own vision to shape forecast forward. Bell curve of revenue forecasting
would also allow for an objective scenario approach. Therefore, the level of
uncertainty in an overall forecast of a multi-level organization would be taken into
account at the group level in strategic decision-making. Throughout the year, for
example profit recognition planning, tax planning and resource planning could benefit
from the knowledge of how certain is this forecast we are looking at.
Page 56
49
In January 20, 2018 George Benaroya, the VP of Finance and Global Controller of
P&G, posted a topic called “CFOs are overconfident in their ability to forecast results”
to Business Control -community in Linkedin. Sensational headline was based on the
Duke University’s survey that consists of 11,600 forecasts from S&P 500
corporations made by company CFOs. It was proved that CFOs were heavily
overconfident of their ability to forecast the market for the next year. Research was
executed using bell curve theory with the 80 % confidence interval. In practise, CFOs
were asked a level of revenue, which they felt 90 % sure to be too high, and a level
of revenue they felt 90 % sure to be too low for next year. The actual error rate was
three times higher than CFOs expected. Topic raised a vivid conversation in the
community and many controllers identified the benefits of a broader scenario thinking
compared to the single forecast approach in their organisations. (Benarova 2018)
Thus, one of the main areas of research in this case study is to recognize the
thoughts related to conservative forecasting, over-optimism and scenario thinking in
forecasting. Furthermore, this research aims, through interviews, to seek the balance
between healthy conservatism and harmful prudence and techniques to overcome
the identified challenges of revenue forecasting. The purpose of the qualitative part of
the research is first and foremost to answer to them main research question and the
second sub-objective of the thesis. The second sub-objective takes a position on the
role of rolling forecasting as part of the financial forecasting process. Hypothesis for
the second sub-objective is that the role of rolling forecasting is to act as supporting
forecast and additional information for annual forecasting. When it comes to
reporting, it is assumed that rolling forecasting is merely done on controller’s desk
based on the project data and it would be used to detect internal trends over the
year. (Bourmistrov & Kaarbøe 2013; Hansen et al. 2003) Hypothesis for the main
research question is most challenging to form in advance: Improvement of
forecasting accuracy is considered as challenging, but possible task for an
organization. Hypothetically, the suggestions for improvement would relate to more
detailed project control, training of the people, system support and better distribution
of best practices within the organization. It is assumed that different sentiments within
an organization occur.
Page 57
50
4. EMPIRICAL ANALYSIS - FORECASTING IN SKANSKA
Business never stands still. Empirical research has a crucial role as a verifier and
recorder of the changes that are happening in management development (Kanthi
Herath 2007, 895). The purpose of the empirical part of the study is to define
answers to research questions introduced in chapter 1.2. The main objective of this
study is to examine the forecasting ability of construction stream of Skanska Finland
and how the accuracy of financial forecasting can be further improved to be an
increasingly robust and significant part of strategic decision-making. The secondary
research questions are created to support the main objective of this study.
The research focuses on the accuracy of financial forecasting in construction, the
challenges related to forecasting and the problems caused by inaccurate forecasting.
Predominantly, the research focuses on the importance of revenue forecasting and
how organisation may utilize accurate forecasting in strategic decisions. This study
focuses on revenue forecasting, as many of the forecasted items under revenue in
the income statement include a lot of emotions and adjustments, for example
reserves that effect on the profit accumulation. A case study can be defined as a
research of an active event. Empirical case study uses a variety of acquired
information in order to study the current event in a particular environment. In the case
study, the aim of the case study is to collect information in a variety of ways and to
gain more profound comprehension of the phenomenon. (Metsämuuronen 2001, 16-
17) The case study is grounded on triangulation, combining elements from
quantitative and qualitative research.
The research focuses on looking at forecasting from the executive management point
of view. In addition, the roles of operative middle management and financial
management are wielded in order to provide a comprehensive view of the processes
that affect the generation of forecast information. The study focuses neither on
evaluating the professional forecasting performance of individuals, nor on seeking
superiority. On the contrary, the target of this thesis is to objectively analyse the
various levels of the organisational information within the constraints of triangulation
that uses both qualitative and quantitative data sources.
Page 58
51
The empirical part of the study is divided into five chapters. The research area and
general information of the case company Skanska and construction industry are
presented in the chapter 4.1. Alongside the research methods, data is presented in
chapters 4.2 and 4.3. Chapter 4.4 includes the analysis of the research divided in five
subtopics. Chapter 4.5 introduces synthesis of the results and encloses answers to
all research questions alongside the criticism of the results and approach for further
study. Finally, the conclusive main chapter 5 presents the summary and the
conclusions of this study. In conclusion, the focus is on the interpretation of causal
relationships and comprehensive but sharp summary of the thesis.
4.1 Case Study Company and Its Operating Environment
Skanska is one of the world's leading construction and project development
companies founded in 1887 by Rudolf Fredrik Berg in southern Sweden. It operates
in selected home markets in the Nordic countries, Europe and the United States.
Skanska operates based on its strong value base and builds for a better society in
cooperation with the customers and the communities around. Skanska’s aim is to be
the leader in corporate responsibility in the construction industry by offering
innovative, sustainable solutions for both simple and complex projects. Skanska
employs circa 38,000 people and the Group's net sales in 2018 amounted to
approximately EUR 16.6 billion. Skanska Finland started its operations in 1994.
Skanska's operations in Finland may be categorized to three business streams:
construction services, residential development and commercial development.
Construction services include building construction, civil engineering and
maintenance and engineering. In 2018, Skanska Oy Group generated revenue circa
EUR 1 billion and employed 2,152 people in Finland. This case study focuses solely
on the construction stream that is by far the largest stream of Skanska in terms of
revenue and obvious choice of scrutiny due to the research layout. (Skanska 2019a)
In order to understand the requirement of this empirical case study it is important to
disclose the dynamics of industry. Construction industry is highly affected by its post-
cyclicality, economic situation, consumer confidence, environmental responsibility
and governmental decisions. During the periods there is uncertainty in the economy,
Page 59
52
it reflects to construction industry due to tail away of construction investments. When
the resources are limited and there is a certain amount of uncertainty in the market,
fewer investments are made by the public and the private sector. The lack of
investments can be seen in the construction industry characteristically about a year
after the market situation has weakened. (Forecon 2019a) Naturally, individuals are
more agile to withdraw their investment decisions than companies, of which hands
might be already tied and budgets locked.
In addition, the post-cyclical nature of the construction industry is due to the fact that
already started works will naturally completed. Thus, order backlog is usually
sufficient for at least a year ahead enabling revenue recognition and continuation of
the business despite the beginning of the economic downturn. Nonetheless, as this
research will show, the post cycle will only continue for a limited period of time.
Ordinarily, the same post-cyclicality applies to the market behaviours pattern in the
upward market. However, the latest economic upturn in Finland was exceptional in
the sense that the construction sector, instead of post-cyclicality, was a clear
economic driver of the country. (Forecon 2019b)
In a highly competitive market area, such as construction industry, knowing your
customers and competitors is everything. Construction industry is both driven by
private and public customers. Private customer may be further divided into
institutional private customers and individual homebuyers. The battle for market
shares in Finnish market has been quite active, since many companies strive to grow
in the wake of the recent construction market pick-up. In addition, it must be
remembered that the construction industry is one of the easiest sectors to enter as a
one-person entrepreneur and start growing your business. When it comes to the size
and mode of operations, the main competitors of Skanska in the Finnish market are
YIT, NCC and SRV. After the merger with Lemminkäinen, YIT (2018 revenue EUR
3.8 billion) is by far the largest company on the market followed by Skanska and SRV
(2018 revenue EUR 1 billion each). Thereafter, next biggest players in the domestic
market are NCC, Lujatalo and Lehto Group (2018 revenue EUR 0.5 – 0.7 billion
each) with altered business models. (Balance Benchmarking 2019)
Page 60
53
All three aspects of corporate responsibility: ecological, social and economic, are
strongly present in the construction industry. Responsible business is driven by
tightening regulations, customer needs and awareness, as well as stakeholders and
investors. Thus, the environmental responsibility is a solid part of modern
construction industry. Construction business in general necessitates profusion of
natural resources. The challenge of modern construction business is to build green
homes, offices and infrastructure with a slightest ecological footprint possible. (Saieg,
Sotelino, Nascimento & Caiado 2018, 791) The demand of houses built in an
environmentally responsible manner continues its progress, while construction
companies are trying to develop more cost-effective and environmentally friendly
ways of working. In 2017, Skanska AB started using global UN Sustainable
Development Goals to assess its responsibility work. (Skanska 2019b)
Despite the macro factors, the volumes of construction industry are fairly steady. This
is due to constantly aging building stock. Balance between new construction and
renovation has been developing recently to the direction where renovation has
increased to a greater extent than new construction. In the civil stream, the civil
construction is both unremitting and vital in order to maintain the form of roads,
bridges, tunnels and other infrastructure, whose obsolescence is necessary and the
need for repair continuous. Governmental decisions have a fundamental effect of civil
business, since the public sector practically owns the entire infrastructure in Finland.
(Forecon 2019a)
When it comes to macroeconomics, factors like GDP growth, consumer confidence,
geographical differences and the growth of construction investments could imagine to
correlate with both the volumes and the profits of construction companies. However,
as seen in recent years, the construction market has been vigorous, but not every
enterprise has been able to maintain their market share. The same rule of
inconsistency applies to operating margin. Despite the construction boom of recent
years, for example year 2018 was profit-wise very disappointing for large and
medium sized construction companies in Finland. (Balance Benchmarking 2019)
Dejection may be said to be consequence for the increase of raw material and labor
prices caused by the overheated market. Many companies accused the good market
Page 61
54
for bad results in the year-end 2018 press releases. One might say that the business
that characteristically has low margins should do better when the market pulls.
“Due to the market situation, it is great to see that we are able to think
really far into the future, which proves how systematic construction
business can be at its best. However, this is entirely geographically
dependent. In Helsinki metropolitan area, the situation is completely
different than for example in Kuopio.” (Group Mgmt A)
4.2 Triangulation: Qualitative Research
Qualitative methods are highly subjective as they are based on the individual
competence, intuition and judgement of the experts. Qualitative data is based on the
interviews that were chosen as the primary data collection method of triangulation
case study due to its immerse potential to get deeper information about the
phenomenon, for example by asking additional questions and clarifications from the
interviewees. Furthermore, interview as a data collection method is flexible and
leaves room for a more informal answer, which the interviewer did not initially plan or
even ask. (Hirsjärvi, Remes & Sajavaara 2001,192)
Data is collected with a semi-structured interview, which is characterised by pre-
defined framework of the interview that is both flexible and gives room for deviations
(Hirsjärvi & Hurme 2001, 47). The theme interview, which is used in this study as a
data collection method, is the most common method of semi-structured interviews
(Ruusuvuori & Tiittula 2005, 11). The theme interviews are characterised by pre-set
themes, not precisely delimited with specific questions. Thus, it is possible to collect
information in a way that leaves room for the interviewees' own thoughts and
interpretations. In order to ensure that each interviewee's voice is heard without
being influenced by the opinions or thoughts of other individuals, each interview is
conducted as an individual interview.
The interviews are themed in four parts: current status of financial forecasting,
challenges of financial forecasting, rolling financial forecasting and future visions and
Page 62
55
needs of financial forecasting. The first theme covers the state of forecasting in the
case company aiming to understand how financial forecasting is used to guide the
organization at the moment and how the forecasting process works. Thereafter the
main focus of the interview shifts towards the encounters and future visions of
forecasting. The second theme explores the challenges of forecasting that
organization has encountered. The third theme aims to outline the status, challenges
and more efficient use of rolling forecasting in the organization. The fourth and final
theme is a free-form mapping of development ideas and ideas.
The themes aim to stimulate an honest debate about the current state of forecasting,
the challenges related to forecasting and what measures could be taken to meet the
future expectations for forecasting. Thus, some of the interview questions are fairly
open in order to enable the natural formation of the answer. The purpose of the
interview is neither to direct the interviewee in a particular direction by interviewer nor
by the setting of the question.
Interviewees include four individuals from group management: Chief Financial
Officer, Group Controller, Group Finance Manager and Group Accounting Controller.
The group management perspective is important in order to understand how the
information generated by forecasting influences in managing the people and steering
the organization. In addition, interviewees include six individuals from regional
management, focusing on regional unit controllers who act as financial managers for
their own unit and are an important part of the unit's management team. Part of their
job is to participate in strategic decision-making and executive teamwork of the unit.
Controllers' point of view is particularly applicable since they have the best
knowledge and understanding of the current state of financial forecasting and
potential challenges in the organization. Specification of all interviewees is listed in
table 2 (see page 56).
The themes are based on the key points raised in the literature framework. Two
different types of interview frames were built according to these themes (see
appendices 4 & 5). The interview frame of group management and group
administration focuses more on strategic decision-making and future goals of
Page 63
56
forecasting. The interview frame of regional controllers merely focuses on evaluating
the current process and identifying the challenges and future needs of financial
forecasting. However, interviews are not strictly limited, i.e. a particularly strong
vision of the future from regional controller would get space in an interview if
interviewee wants to bring it up.
The research material consists of ten interviews in the Skanska Group. Interviews
were conducted as individual interviews in May 2019 at the company's headquarters
or via Skype. Interviews lasted from 20 minutes to one hour. All interviewees gave
permission to record interviews, which were transcribed. The semi-structured
interview method guided the discussions and additional questions were asked from
the interviewees, which were spontaneously defined by interviewer on the basis of
the discussion. Further questions were aimed at gaining an even deeper
understanding of the subject of the investigation and, consequently, more justified
answers to the research questions. The interviewees were instructed to reflect
everything they have seen in the case study company when answering the questions
and to take advantage of their industry knowledge while answering to questions with
broader issues. Interview questions were not sent to the interviewees in advance,
because the purpose of the interviews were to reactively find out the first things that
come to mind rather than processed, “lesson learned”-type of answers to the
interview question.
Table 2. Specification of Interviewees
ID Job Title Duration of the Interview Group Mgmt A Chief Financial Officer • 30 min Group Mgmt B Group Controller • 28 min Group Mgmt C Group Finance Manager • 24 min Group Mgmt D Group Accounting Controller • 21 min
Controller A Controller (Regional Unit) • 37 min Controller B Controller (Regional Unit) • 26 min Controller C Controller (Regional Unit) • 27 min Controller D Controller (Regional Unit) • 27 min Controller E Controller (Regional Unit) • 49 min Controller F Controller (Regional Unit) • 60 min
Page 64
57
The collected material was structured under research questions and different topics
according to the answers. Firstly, frequently recurring issues were raised, followed by
the most essential, one-time entries of the interviews. When the material was
structured according to the four topics, it was further divided into themes under the
following headings: Skanska’s way of forecasting, forecasting frequency and
horizons, project forecasting, regional unit forecasting, group level forecasting, target
works, conservative forecasting, Bell curve –thinking, forecasting horizons, risks in
revenue forecasting, secured vs target revenue, consequences of inaccurate
forecasting, resource planning, management’s point of view, current role of rolling
forecasting, future of rolling forecasting, external requirements for forecasting,
success factors of forecasting, importance of communication, system support,
strategic decision-making and future visions and actions.
On the basis of the analysis, the desire was to find interesting similarities and
differences both within the regional units and between the regional units and the
group management. The objective of these discoveries was to provide an analytical
description of the current state of financial forecasting and structured development
suggestions for the case organization. Conclusively, the results were reflected in the
synthesis of the results paragraph.
4.3 Triangulation: Quantitative Research
Lee (1999, 414) identified one of the top concerns of management accounting to be
the enabler of comparison between financial forecasts and financial actuals. Even if
the evaluation of forecasting is much more than calculation of forecasting error, it is
an appropriate place to start. It is important to know the history data and the current
situation after which the definition of the future direction is easier. Mentzer & Moon
(2005, 145) separate two different directions of forecasting: qualitative and
quantitative. Similarly, statistical quantitative methods and judgment-based
qualitative methods are the main groups identified in the field of forecasting methods
(Armstrong 2001, 9). Situations that suffer the absence of historical data, qualitative
methods are frequently used (Mentzer & Moon 2005, 145). In addition, the deficiency
of data may preclude the possibility of quantitative analysis and research.
Page 65
58
Forecasting error is the difference between forecast and actual outcome. Actual
outcome is combination of two factors as presented by Chase (1995, 2) in formula 1:
Actual Outcome = Pattern+ Randomness (1)
The accuracy of the forecast can be measured in various ways. A widely accepted
common practice is to trace the errors of the forecast by comparing the actual value
with the forecasted value (Mentzer & Moon 2005, 44). Frequently used tools for the
accuracy identification and measurement are demonstrated briefly as follows. The
simplest way to calculate the errors of the forecast is to use following formula by
Hanke et al. (2001, 75):
e! = Y! − Y! (2)
Where et is the error of the forecast, Yt is the actual value and Ŷt is the forecasted
value of time period t. Ordinarily, the accuracy is measured with the mean error tools
(Mentzer & Moon 2005, 46). The main idea behind these tools is to calculate the
mean error, either the absolute error or the actual error, and present it as a bare
number or as a percentage.
Mean absolute percentage error (henceforth abbreviated as ‘MAPE’) is a derivative
of mean error, mean absolute error and deviation formulas. MAPE indicates the
average of the absolute percentage errors. ‘PE’ stands for percentage error between
the actual and forecasted value, whereas ‘n’ stands for number of observations in the
sample. Percentage errors are particularly useful tools when the magnitude of the
forecasted variable is essential part of the accuracy measurement since average
formulas remove the issue of mean error that result is frequently close to zero. This
study uses the mean average percentage error (MAPE) value as well as non-
absolute value version of the calculation formula: MPE (mean percentage error), as
forecasting error instruments. The calculation formula of the MAPE is represented as
follows by Mentzer & Moon (2005, 53):
MAPE =1n PE!
!
!!!
(3)
Page 66
59
The quantitative measurement of the forecasting accuracy is the most common way
to evaluate the forecasting performance. Other natural ways to measure forecasting
is either through customer satisfaction or costs of forecasting. Nevertheless, both the
forecasting costs and the customer satisfaction are exceedingly problematic to
measure. (Davis & Mentzer 2007, 478) In the case study company, the customer
satisfaction related to forecasting results have not been quantitatively measured and
separation of forecasting costs from all project and overhead costs would be highly
theoretical. Hence, in the context of this study, the quantitative measurement of
current forecasting accuracy using the forecasting error is particularly applicable
approach to answer the first sub-objective of the thesis. Although the MAPE has its
frailty, it is a comprehensible accuracy indicator for the data presented in this study.
The quantitative, secondary data, more specifically financial forecasts and actuals of
multiple layers of the organisation, originates from financial management systems of
Skanska. Project management software Aino is key forecasting tool for site
personnel. The quantitative research data is collected from Skanska’s financial
consolidation and reporting software Hyperion Financial Management in May 2019.
The quantitative study is implemented using Oracle Hyperion Financial Management,
Hyperion Smartview and Microsoft Excel software. Clear outliers were removed and
data was sorted quarterly to serve the purpose of the analysis. Because of the data
protection, this study uses relative values and indexed data instead of the actual
values. The revenue index uses the base period (2015). Research data consists of
numerous datasets based of the entity hierarchy of construction stream of Skanska
Finland. In compliance with the delimitations of the research, financial data
geographically cropped to Finland and limited in time from year 2015 to 2018.
4.4 Analysis
The first subchapter “Secured revenue dictates financial forecasting” is merely based
on the quantitative analysis performed with the examined dataset. Data analyses are
performed on both the entire material and the sub-materials that focus on exploration
the selected variables. Other five subchapters are merely based on the qualitative
data from the interviews. Analysis is done according to the knowledge of the
Page 67
60
researcher based of the review of the entire research material. Study is carried out in
a close collaboration with the construction company Skanska.
4.4.1 Secured Revenue Dictates Financial Forecasting
A careful analysis of data is a crucial part of well-functioning forecasting process
(Jain 2006, 18). Consequently, this case study analyses the dominant dataset behind
the revenue forecast: the amount of secured revenue. First, dataset will be analysed
with statistical and graphical tools in order to see what kind of correlation is between
the accuracy of revenue forecast and the amount of secured revenue in different
forecast rounds. Thus, the main objective of the quantitative analysis is to provide the
answer to the first sub-question.
Skanska's business is project business. Each project is its own entity and specified
individuals are responsible for carrying out the project and creating the forecasts
during the lifecycle of the project. Controller, together with the management of the
region, is responsible for making a summary of project forecasts of the districts and
the entire region and forms the regional unit forecast. Group accounting combines
regional unit forecasts first to the form of business stream forecasts. Business stream
forecasts together with the elimination entity will eventually form the Skanska Finland
Group forecast as a whole. Skanska Finland is part of the global Skanska Group
where all the Skanska countries together form the forecast of global Skanska Group.
The idea of shaping a way of forecasting or building a forecasting model infrequently
starts with the data. Frequently it originates from operational uncertainties and
awakening to the situation that there would be a chance to improve predictability and
performance through analysis. (Barton & Court 2012, 81) This is also the case in this
research. The organization has always calculated the amount of secured revenue out
of the revenue forecast. However, the systematic review of the financial indicator and
its impact on forecasting accuracy has remained unexplored. Quantitative part of this
research uses the amount of secured revenue and the time-based distance of
forecasted moment as explanatory factors. Dependent factor is the accuracy of
revenue forecast.
Page 68
61
Figure 7 presents the revenue forecasting funnel of construction stream divided by
quarters. Time series starts at the beginning of 2015 and ends at year-end 2018.
Each line in the graph is time series representing the percentage of target revenue
related total revenue forecast. Variable colours represent different units and forecast
years. For each of the seven variables listed in table 3 (page 62), raw data includes
590 observations; one per entity and per quarter when forecast is made. Statistics of
both raw data and monthly-based index data are represented in appendix 6.
Data analysis discloses that starting from nine quarters afore the annually forecasted
year-end, the linear trend line of the mean absolute percentage error of revenue
forecasting has the slope value of -0.0194. In other words when moving from
quarterly forecasting review period to the next one, the accuracy of revenue forecast
increases by 1.9 percentage points each quarter. The risk of the forecast error is at
its maximum (MAPE 17 %) nine quarters before (-9Q) the realization and at its
minimum (MAPE 4 %) one quarter before (-1Q) the actuals. Additionally, the time
series of mean absolute percentage error of revenue forecasting comprises
noticeable change over time: when the forecasted period is less than 4 quarters (-
4Q) away from the forecasting time, the error begins to decrease faster with slope
value of -0.0340 i.e. on average the value decreases linearly with aforementioned
amount every quarter. Whereas, between nine (-9Q) and four quarters (-4Q) interval
Figure 7. Revenue Forecasting Funnel by Quarterly Reviews
Page 69
62
from the forecasted period, forecasting accuracy only increases nominally and the
variance is significantly reduced, as can be seen in the Box and Whisker diagram in
appendix 7. Furthermore, it seems that considering the outliers, six quarters before (-
6Q) the actuals the variance is smaller than in -5Q and in -4Q.
As presented in the revenue forecasting funnel by quarterly reviews in figure 7 (see
page 61), when the relative share of target work decreases, the mean absolute
percentage error of revenue forecasting decreases as well. The phenomenon has
been further studied using Box and Whisker diagram. As presented in appendices 7
& 8 the variance of both explanatory and explainable factor decreases when moving
closer to the forecasted period.
On the basis of the data analysis, correlation between the secured revenue and the
accuracy of financial forecasting is undisputed. However, it must be borne in mind
that there might be a lag between the moment when project is booked to order
backlog and the moment when construction and revenue generation starts. This
creates uncertainty between the secured revenue and forecasting error and thus
weakens the correlation between the variables. Nevertheless, lag should be taken
into consideration when forecasting secured revenue. The research focuses on the
factors that improve forecasting accuracy. Correlation between the secured revenue
and the accuracy of financial forecasting creates an urge for a closer research of
target work forecasting, which is highly emphasized in the interviews. Hence,
research propositions may be formed and utilized in interviews and interpretation of
results as follows. Based on the observation it is default that the earlier the number of
target work will be diminished, and the relative amount of secure revenue is high, the
better the forecasting accuracy of the unit is. Thus, besides the forecasting manners
of on-going work, study focuses on the dilemma of accurate target work forecasting.
Table 3. Attributes of Revenue Forecasting Accuracy
-9Q -8Q -7Q -6Q -5Q -4Q -3Q -2Q -1Q 0QMeanTargetRevenue% 81% 77% 68% 63% 50% 39% 23% 10% 3% 0%MeanSecuredRevenue% 19% 23% 32% 37% 50% 61% 77% 90% 97% 100%MPE -7% -7% -7% -9% -6% -7% -5% -1% 2% 0%MAPE 17% 15% 14% 14% 14% 13% 10% 6% 4% 0%MeanForecastingAccuracyRate% 83% 85% 86% 86% 86% 87% 90% 94% 96% 100%MeanForecastingError(MEUR) -1.5 -2.2 -3.2 -4.6 -1.5 -1.8 -1.2 0.3 2.3 0.0MeanAbsolutForecastingError(MEUR) 13.2 11.6 10.6 10.0 8.3 8.2 6.7 4.7 3.4 0.0
Page 70
63
4.4.2 Current Status of Revenue Forecasting
The review of current status of revenue forecasting started with the open description
of the way of forecasting in Skanska. The interviewees raised both realistic and
diverse perspectives related to forecasting structure and characteristics.
“We are forecasting and reporting cost-based using a partial recognition of
revenue in project business.” (Group Mgmt B)
Revenue is generated through the cost and profit recognition. Standard construction
contract includes production schedule according to which costs accrue and revenue
is recognized. Bell curve –thinking, that originates from probabilities and risk
awareness, was descriptive feature of observed forecasting ideology. Many inter-
viewees believe that there are a lot of in-house differences in the way of forecasting.
Still, the in-house expertise in forecasting is strongly trusted through the organisation.
“Forecasting is unit-specific, project-dependent and person-centred. It is
steered and scheduled, but ultimately intensified with the forecaster’s
personal qualities and the way to do it.” (Controller F)
“There is no common defined way of forecasting on a regional level.
Everyone does it the way she/he sees fit. However, we have learned to do
forecasting well, because the process is often repeated.” (Controller D)
The process of forecasting was described as a long, bottom-up information flow
where the detail orientation is noteworthy particularly in project level. The life cycle of
revenue originally starts from the bid where project is tendered with a specific tender
margin. The target setting for individual project originates from bid calculations. When
the target estimate transforms to a cost estimate, cost reserves are added by site
manager or production engineer. Financial reporting is done conservatively, and
profit forecasts are raised as project progresses and uncertainties diminish. Cost
forecasts, and subsequently revenue forecasts, for a specific point of time are
generated through project transcripts, which are detailed breakdowns of costs.
Furthermore, Skanska's way of forecasting was described to be accurate.
Page 71
64
“Forecasting process goes bottom-up, starting from projects after which
they are summed up and questioned by unit management and controller.”
(Group Mgmt B)
“Occasionally, there is a risk of losing the whole picture if we focus too
much detail." (Controller E)
Although the forecasting was theoretically seen as a straightforward process where
the top-level forecast is the sum of its parts, other influential factors were identified.
Depending on the situation of the forecasted project or business unit, both over
optimism and over conservatism are seen to occur.
“To some extent, forecasting may also be directed top-down if the project
manager or regional unit has a need to achieve a particular goal. Regional
managers are strongly guiding the level of revenue by directing project
managers to seek potential contracts or to take a closer look on POC
(percentage of completion) of the current projects.” (Controller E)
“Adjustments may be made on each of the forecasting levels. In addition,
profit pressure increases the risks for forecasting." (Controller F)
“Financial forecasts are generally conservative and signs of old budget
thinking can be seen in the organization. Forecasting is a process that
needs to be carefully focused.” (Group Mgmt D)
For the project, the most important thing to follow should be the entire project life-
cycle forecast, not any part of the project. Partial optimization within a project can
lead to unnecessarily hefty revenue and profit recognition. Behaviour may be due the
performance and bonus agreements that that creates pressure and obscures rational
thinking. Furthermore, forecasting confronts appear inversely at various project
models, different levels of the organization and the impact of macro factors on
operational activities was considered significant.
Page 72
65
“In principle, revenue forecasting of on-going project should be fairly easy.
This applies particularly to ordinary construction work contracts. When
talking about more complex target- and roof-priced projects and alliance
agreements, the challenge factor of forecasting increases. In addition,
when we go bottom-up from the project forecast and talk about the
regional unit and group revenue forecast, the challenge is growing. This is
due to pipeline and market management and how to make pre-selection of
which projects are must-win for us. After all, it’s a huge puzzle. We need to
see when situations change, plan our resources right, find the potential
customers and deal with the market competition around.” (Group Mgmt A)
When it comes to the conservative safety margins when forecasting revenue,
evaluation is done case-by-case based on the project portfolio. Regional manager
together with the project manager most commonly determine how secure each
project on the short-term pipeline is, which creates the base for financial forecasting
of target jobs. Moreover, conservative safety margins are dependable on calendar
year. For example, if it is assumed certain job should be signed to the order book in
the last quarter of the year, there is a risk that it will flip into the next year. Constant
shift of the construction starts makes forecasting more challenging.
“If contract is signed during the last months of the year, project has neither
the ability nor the time to generate lots of revenue instantly.” (Controller E)
Conservative and realistic might be the best pair of words to describe the way of
forecasting in Skanska. Principle is particularly suitable considering the risk of
excessive income recognition.
“At least let’s not promise too much. It’s essential to think about where we
really have a chance.“ (Controller D)
Conservatism in forecasting is particularly focused on the project margins. On the
other hand, over-conservatism in forecasting has its drawbacks such as profit
recognition that does not reliably reflect operational activities of the company.
Page 73
66
Particularly target works are brought into the forecasts rather conservatively,
depending on the certainty of getting the job. For example, alliance projects that are
in the development phase can be brought into the forecast a little more briskly when
the possibility of getting the contract is at higher level than in the standard
competition. The loss of target work can greatly affect the unit's forecasting accuracy
if the job has been overestimated in forecasts. In the best case, regional unit has
fast-start backup projects. In that case losing a tender does not automatically mean a
significant decrease in the forecast. In the worst case, over confident forecasting of
target work scraps the profit of the year. In difficult situations, the potential of
cooperation beyond the regional unit boundaries was widely emphasized.
"What if the job is not won? In the worst case, if there is no contingency
plan, we have nothing. Help could be available from other regional units,
which I would rather see to happen more often.” (Controller E)
“We have a target job, but we should also have plan b and plan c, all of
which must be taken into account when forecasting. The biggest risk is in
units that are financially weaker and slightly forced to win projects in order
to generate the profit needed. If the unit has APGI, it's easier to keep calm
and not to take projects in at any cost.” (Group Mgmt B)
Both project level and regional unit level forecasters are in danger to be too caught in
the present moment. Consequently, they do not have enough time to focus on the
future. This may be due to a lack of resources or that a small unit puts all its
resources into a large project. According to the interviews the units that are
generating good profit are able to make plans averagely further to the future than
those with a worse financial position. Uncertain situation of the unit is seen increase
the focus on the current year, while a stable unit can afford to focus on the future.
"There should be more resources for planning and managing operations. If
organisation has organic pressure to grow, there should be courage to
over resource momentarily and take young people in to develop their
skills. Too rarely we think thoroughly what projects we will be doing two
years from now. I think we should.” (Controller E)
Page 74
67
Revenue scenarios are based on project scenario forecasts since projects assess
their own risks and opportunities. The high scenario of revenue lean on imagination
that practically no risks or only minor risks are realized. In the low scenario of
revenue, the most of the identified risks for forecasting period occur. According to
interviews there are different ways to estimate scenarios depending on the
organization and the characteristics of the projects.
“The current order backlog forms a low case, high scenario takes into
account the possible target works optimistically.” (Controller C)
“First, it is considered how much revenue is certain, after which the
potential forecast errors in on-going projects will be evaluated. On top of
that, target work in the best case and the worst case scenario will be
added to create scenarios.” (Group Mgmt B)
There is a clear link between the risk concentration of the projects and the forecast
accuracy. Theoretically, from the forecasting point of view, target work includes more
risk than on-going production. Furthermore, interviewees were unanimous that the
high and low scenarios of revenue are merely based on pipeline and target work
management than volatility in the forecasts of current production. One major pitfalls
to avoid in scenario forecasting is the over-optimism with target works.
“In theory, winning a tender is never certain. Over-optimism in winning the
tender competitions often leads to negative surprises.” (Group Mgmt B)
“Particularly large projects are conservative forecasted as target works
until they are 100 % certain.” (Controller D)
“When creating revenue scenarios, it is important to understand what is
the share of target work in the revenue forecast and what is the most likely
construction start of the target works. In addition, jobs of which
construction start are likely to be delayed must be identified.” (Controller E)
Page 75
68
According to interviews there are several ways to use bell curve of forecasting in the
organization. In some instances, high and low cases are based on the theory of 10 %
probability to exceed high case and 10 % probability to go below low case. On the
other hand, some estimate the scenarios more as absolute revenue thresholds
where high presents the ultimate high scenario and low scenario is the lowest
imaginable outcome for the forecasted period. Different approaches on the
estimation of high and low scenarios may be seen as a risk when interpreting
scenarios in order to make strategic decisions for the future. The procedure behind
scenarios might also differentiate based on the project size the general availability of
the detail information.
“In the largest projects, forecast is based on regularly updated bell curve
analysis, whereas in smaller projects scenario forecasting is lighten up. In
small projects, the scenario ranges are rather small and the estimate is
merely based on the experience of the project organization.” (Controller F)
“The unit's management must understand how the market behaves and
preferably build scenarios based on projects. If a project-specific review is
not possible, a rough overall estimate of the project portfolio will be made”.
(Controller E)
Furthermore, criticism and development ideas concerning the current accuracy and
way of forecasting revenue arise. All in all, the answers exposed that forecasting is a
project-oriented process that goes through risk concentration and uncertainty
creating different scenarios.
"Frankly, revenue scenarios are poorly forecasted. The forecasting goes
more through the result. For example, a low scenario is sketched out by
removing some of the target work from the forecast.” (Controller D)
"Maybe we should start to think about quadruple analyses through
efficiency and probability, so that we could also mathematically approach
forecast scenarios, whether it is through Monte Carlo analysis or
something else". (Group Mgmt A)
Page 76
69
4.4.3 Characteristics of Target Work Forecasting and Time Horizons
Interviewees described the frequency of financial forecasting in different levels of
their business units. In general, quarterly reviews are considered more closely than
monthly review on regional unit level.
“Project can update its forecasts with small changes even daily. Unit's
management reviews the forecasts on a monthly basis.” (Controller E)
“Each project updates the forecasts at least once a month and forecasts
are reviewed in detail at least once a quarter. BU level review runs
quarterly. Depending on the unit, for example if the regional unit is a
geographically wide, it may not go through the forecast monthly as
accurately as a geographically compact unit. The general time guideline
for unit-level forecasting is at least once a quarter.” (Group Mgmt B)
Widely, project forecasting is done on a monthly basis, but more accurate forecasts
are done quarterly at regional unit level and above. However, regional unit-specific
differences exist and processes of each quarter are not necessarily identical. Some
interviewees thought that on a group level, one month is a rather short period in
construction industry for massive changes to occur. In addition, special features
within construction stream were highlighted.
"Once a year, the process goes down to the roots. This is happening on
the F4 forecast round." (Controller F)
“The biggest focus is on the next 12 months. In civil engineering the
quantity of jobs to be done depends largely on government decisions,
which is why too far-reaching plans are difficult to do.” (Controller B)
All the interviewees were asked what are the most important time horizons for which
forecasts are made in their opinion. The interviewee was then guided to compare
long and short term forecasting in addition to their views on the annual, quarterly and
monthly forecasts. Furthermore, interviewees were asked how they see four different
Page 77
70
forecast times (F1, F2, F3 and F4) and their characteristics. The reviews of F1, F3
and F4 are seen as the most important of the year from the controllers' point of view.
“F4 closes the year. F1 takes the first decent view of the year and F3
already outlines the financial statements of the full-year. F2 is the most
superfluous forecasting round because it does not include a hard close
and it does not introduce any new forecasting horizon.” (Controller A)
Common opinion among the interviewees was that the primary focus shifts towards
next year in the F3 forecasting round at the latest. Nevertheless, controllers used the
most time for forecasting the current year regardless of the stage of the year since
the most accurate calculations can be made for the current year. Even if the biggest
concentration during the F2 is still in the current year, focus already moves strongly
towards the next year at the strategic level.
“In F1 we forecast seven quarters forward, in F2 only six quarters, then in
F3 forecasting round it increases to nine quarters. Thus, the focus in Q3 is
clearly moving towards the next year.” (Group Mgmt A)
”The chain from bidding to construction start can be very long.
Conceptually, concentration moves towards next year at a time when the
ability to influence this year's business is slim. In the last quarter, there is
not much to be done with revenue for the current year.“ (Controller C)
Strategic key figures related to order backlog and volume were seen to help outline
the revenue forecast. When forecasting a unit that has a tradition to generate steady
revenue, revenue of rolling 12 months were seen as a good starting point for
forecasting. However, not forgetting to review carefully the amount of secure revenue
for the forecast period. Secured revenue were considered as the most important key
figure on which an accurate revenue forecast can be built. In addition, book-to-build
is considered important in order to identify the trend of future revenues.
“Knowledge of the timely spread of long projects is important in order
forecast the future.” (Controller E)
Page 78
71
“Secured turnover creates the foundation for everything, then depending
on the volatility, unit’s revenue history can be either informative or
completely irrelevant. Information about the capacity of the unit may be
drawn from history. In addition, you need to understand your own pipeline,
market situation and the position of your competitors.“ (Group Mgmt B)
Discussion related to forecasting of on-going projects and secured revenue was
followed by vivid conversations on target work forecasting. Interviewees were asked
how do they estimate the amount of target revenue per year in their business units.
At the beginning of the year, the amount of target works is largely determined by the
unit's will and mirrored in historical performance and current state of the unit.
Targeted work should be evaluated on the basis of how the market looks and the
probabilities of clinching individual contracts. Towards the end of the year, reality
increasingly steers the reporting of target works.
“Sometimes forecasts are influenced by target setting and revenue levels
from previous years. It is easy see the revenue level as standard, that
distorts the realistic forecast.” (Controller F)
"If the work has not been booked by June, it will have only minor impact on
the revenue for that particular year. There must be a good reason for
forecasting significant amounts of revenue to current year from the order
that is booked during Q3 and Q4." (Controller E)
General observation lead to two approach angles of target revenue forecasting:
balancing between set goals and realities. First, project managers have personal
revenue targets in a regional unit that reflect the current resources. The difference
between the revenue target and the secured revenue forms the objective for each
year. Standpoint emphasizes the correctness and justification of the revenue targets
since the target works consist of hypothetical works on pipeline and purely scratch
work that have not been identified yet. If organization gets caught up in a specific
revenue target without reasonable grounds, the consequences may be bad.
Particularly when estimating target contracts, smooth information flow and active
communication is widely seen as the driver behind successful forecasting.
Page 79
72
“Forecasting target revenue is all about discussion with regional and
project managers who have a view of the target work for each time horizon
in the future.” (Controller D)
“For example, regional leadership and project managers may have a
different view on target works when one wants to keep the goals high and
the other's view is more conservative.” (Controller C)
On the other hand, the objective of target jobs is to challenge the business. However,
realistic view must be preserved: it is not a good thing if the goal is too easy to
achieve. Interviewees highlighted the diverse set of target works must be noted.
“Target works are not a homogeneous group. Sometimes a single goal
work can be very sure, for example if the development phase is already
underway.” (Controller F)
Therefore, target works should be handled differently depending on the contract
model and the uncertainty of getting the contract. On a group level as well as within
regional units, differences between regions were observed and the idea behind target
work forecasting was crystallized as follows. In addition, more theoretical approaches
were presented.
“In theory, the forecasting of target work should focus on what is going to
be offered and what is the area's hit rate normally.” (Controller C)
“Target works are harder to forecast because hit rate in some units is
lower than others, which leads to the fact that one way to predict target
works is not suitable for every unit. Forecasting of the target work must
begin with the review of the current resources and the stage of the year.
The competitors must also be monitored, as the position of competitors
contributes to the probability of winning the tender competition.
Forecasting is complex process that takes time master. Forecast is always
a compromise.” (Group Mgmt B)
Page 80
73
4.4.4 Challenges of Financial Forecasting
Over 20 years ago, engrossing challenge was given to the business world by
Woodruff (1997, 139) to think company actions through customer value. He thought
that every organisation should consider customers as a driver behind business.
Interviewees strongly share the aforementioned view.
“First of all, we have to have a customer and how well we can convince
our clientele with our expertise and reliability. In this sense, successes and
challenges come largely from branding and marketing, and above all from
our business knowledge. If it does not work, the future road becomes
short.” (Group Mgmt A)
When it comes to the forecasting of regional units, the group management sees the
challenge of forecasting clearly growing. Forecasting new jobs may be challenging
because in construction industry, business needs to be recreated again and again.
New opportunities have to be found in business, which also creates uncertainty for
forecasts. Units must be aware of their own project pipelines. Interviewees thought
that the units where personnel are pipeline-oriented and able to look further and
further to the future are most likely to succeed.
“The fact that we have selected the right projects to offer and to built in
order to generate turnover. Risk management during the project selection
is the most difficult phase. After successful selection, everything is in our
own hands and caught up in the forecasting and cost-tracking accuracy.”
(Controller E)
The risks of revenue forecasting are seen in both on-going projects and future targets
jobs. However, clearly higher risk is seen in uncertain target work. Timing
emphasizes uncertainty; it is not easy to predict the time when new contract will be
won, signed and notably when construction starts to generate revenue. Furthermore,
target works include lots of moving parts, such as zoning, which may delay the start
of construction. One internal factor that disturbs the forecasting accuracy is over-
Page 81
74
optimism related to both contract winning and quick construction starts. Interviewees
also highlighted the importance of planning if important bids are not won. The
aggressive pursuit of revenue at any price was also considered to be strongly against
corporate principles.
“It is good to have a backup plan in terms of targeted level of revenue. If a
big contract is not won, let's get start with multiple small jobs preferably
with a quick schedule in order to slightly fill the voids" (Controller C)
"In principle, the revenue target is not the hardest target to reach. More
often the revenue which the unit pursues is doable, the real question is at
what price the volume is reached." (Group Mgmt A)
Even if the target works are widely considered as more challenging to forecast, also
on-going production creates a risk within the forecast. Particularly high-quality POC
forecasting of the on-going projects is seen as a critical factor behind the accurate
revenue forecast among interviewees. Furthermore, depending on the sub-
organization, it seems that the comprehension of overall picture of the business is
sometimes in danger to be blurred. Long and multiplex forecasting process is seen to
include risks: the time from the project planning moment to the point where group
reporting is complete is fairly long. Furthermore, shortcomings in system architecture
and different modes of operation between regional units pose risks for forecasting.
Too cautious forecasting causes problems in consolidation both at regional unit level
and group level. Often, the early part of the year tends to be weak, particularly in
terms of profit recognition, but also in terms of revenue. Hence, the expectations for
the rest of the year tend to grow.
“Conservatism is present in forecasting in Skanska, but there are also
exceptions.” (Group Mgmt C)
“Hockey stick” -forecasting, where revenue and profit recognition clearly increases
during Q4 after a quieter start of the year, is seen as a conscious culture within a
company. Actions to change that state of mind have been done the complete change
of culture requires more time to change. The challenges of forecasting are also seen
Page 82
75
in human judgment and competence not forgetting proper orientation and guidance,
for example when a new person comes to the organization. Also attitudes towards
forecasting are seen as a challenge.
“The challenges of forecasting may be related to competence. The
personal characteristics and experience of the forecaster affect the risks.
For example, in scenario calculations, there may be challenges in getting
the figures done. Sometimes this is related to uncertainty of the
forecaster.” (Controller F)
Since controller have a numerous on-going project in their region, it is not possible to
monitor each project accurately. Inaccurate forecasting is seen as a result of lack of
knowledge and communication problems. The same information does not reach all
levels of the organisation. Here, trust and information flow play an important role.
Project knowledge and awareness of the remaining risks is key to a successful
forecast. The lack of strategic business information is seen as a major risk to the
success of forecasting. The core challenges of forecasting identified are summarized
in the table 4 (see page 76).
“The order backlog can spread over a long period of time, which forces
the controller to be aware of individual projects and their schedules.
Communication between controller and business is very important.”
(Controller C)
"If controller is not aware of the current status of the projects, "stupid"
questions are not asked and thereby not taken to financial forecasts.”
(Controller E)
Page 83
76
Table 4. The Core Challenges of Financial Forecasting
Challenge Quote Dependence on pipeline, individual orders and customers
“Due to the project business, volatility can be high compared to, for example, the trade sector. Adapting to volatility is a major challenge.” (Group Mgmt B)
Project selection “The biggest challenges of revenue forecasting originate to project selection and project portfolio.“ (Controller E)
Ongoing project control and forecasting
“There will always be surprises in the project business and these surprises change the project forecast immediately. Altered project forecast, in turn, has a direct impact on the forecast for the entire region and thus on the company's forecast.” (Group Mgmt D)
Target work forecasting “Target works include numerous moving parts. Consequently the forecasting of the time when new contract will be won, signed and notably when construction starts to generate revenue is not simple.” (Group Mgmt A)
Human judgment, competence, proper orientation, guidance and negative attitude towards forecasting
“It may not be understood what is the objective of scenario forecasting in general. For some people, forecasting is not at the top of the priority list. In these cases, the forecasts are not updated on time and they are not prepared properly. It is important to make people understand the importance of forecasting.” (Controller F)
Communication and information flow
“The limited knowledge of the projects makes it difficult to forecast and critically examine its forecast. If project management is lost, regional projections are also wrong.” (Controller B)
Inefficient system support “Abundant use Excel of combined with formula errors increases risk. All in all, unstable, non-enclosed systems and reporting environments increase the risk of human risk” (Controller F)
Over optimism in forecasting
“People tend believe in higher volumes and better margins than the reality demonstrates.” (Controller E)
Excessive conservatism in forecasting
“Volatility naturally involves the risk that deferred expectations are never met. The big challenge is to make a sensible, at the same time sufficiently conservative but realistic revenue recognition plan.” (Group Mgmt D)
Long and detail-oriented forecasting process
“A long process creates a challenge since there are so many levels and information gets out-dated during the forecasting process. This can lead to last minute significant changes.” (Controller F)
Varying forecasting practices
“If the operating modes of the units differ, temporary replacement and assistance become more difficult and thus unnecessary risks escalate.” (Controller F)
Page 84
77
All the interviewees were asked how does the inaccurate revenue forecast effect on
the entire financial forecasting from their point of view. The responses highlighted the
comprehensive level of business awareness of the interviewees and various impacts
were analysed comprehensive at the strategic level not forgetting the detailed effects,
for example on the income statement.
“All the work and set goals are based on the assumption of a certain level
of revenue. Everything starts with resource allocation. If there is not
enough revenue, we do not have enough results.” (Group Mgmt A)
If revenue drops, the questions start to arise. How we adjust our operations? What
action should be taken? What the situation is and whether it is temporary? What
could not have been predicted? Is the poor accuracy due to internal factors or
external factors such as the market or competitors?
"Inaccurate revenue forecast affects everything" (Controller C)
“If the first line of the income statement cannot be trusted, the costs and
thus on the result is compromised. The impact on key figures is significant,
particularly the S & A rate becomes vulnerable.” (Group Mgmt C)
“If the revenue is very uncertain, the relative key figures will become
challenging. Of course, provisions that are not necessarily directly related
to revenue may influence the profit.” (Controller B)
Particularly lively was the discussion of the S & A costs in the case where revenue
suddenly drops from forecasted value. Consequently, if costs became too high in
relation to generated revenue and planned recognitions of reserves do not succeed.
In seven interviews out of ten, overhead costs topic was followed by the discussion
related to the need of reservations to align the result if forecast errors occur.
“Due to unexpectedly low revenue, there is not enough margin to go
through the income statement, and subsequently you cannot afford the S
& A (sales and administrative) costs.” (Group Mgmt B)
Page 85
78
"Already the loss of 10 % of forecasted revenue, which is realised during
the last months of the year, has a tremendous impact and the region's
result is likely to collapse." (Controller E)
“New reserves don’t accumulate if revenue is not generated. Thus, the
amount of existing reserves shrinks.” (Controller A)
From this point of view, it is very important that revenue forecasting is on an accurate
level continuously. The criticality of the revenue forecasting accuracy is even further
emphasized if the unit that does not have any reserves in balance sheet to
compensate the possible last minute surprises. However, even a financially well-
positioned unit will not stand up to surprises year after year. The accuracy of the
forecasts for the early part of the year is very important because then it is still time to
react to possible problems with the current year.
“Although there is no official revenue target in the organization, the EBIT
target exists through the resources of organisation. In order to make the
result naturally through projects, not through reserves, the EBIT target
guides units to target certain revenue.” (Controller A)
When it comes to the resources, the thumb rule of bidding: "no team - no bid" is seen
as a very important rule in the organization. Although subcontracting is very popular
in the construction industry, key people should always found in unit’s own
organization.
“It is important to know what turnover can be achieved with the
organization's existing resources. This also contributes to the forecasting.
There are cases that the unit's order book is already full in terms of current
resources.” (Controller C)
In the case where unit runs out of resources, it may think about replacing resources
from other regional units, additional external recruitments or opting out of the tender.
For the management of regional unit revenue forecasting is above all a resourcing
exercise. Hence, among the interviewees the after-effects of the uncertainty of
Page 86
79
revenue forecasting were seen in particular from the perspective of resource
planning and exceeded overhead costs.
“Too optimistic or pessimistic forecasts can both lead to hasty decisions in
resource planning.” (Controller D)
Problems are seen particularly if the net sales forecast is higher than the actual. On
the other hand, too conservative revenue forecasts can make it difficult to plan your
earnings.
"If the actual revenue is unexpectedly higher than forecasted, the alarm
clocks have to ring. What haven’t we noticed? Are the profit recognition
percentages precise and the POC levels correct?" (Controller F)
Of course, there are challenges in a Skanska’s current way of forecasting. Some of
those are particularly characteristic from the group management point of view. If the
desired level of revenue is not reached at the group level, the pressure starts with
overhead costs. This is due to the fact that organization is build to certain form and it
requires a specific level of revenue to cover its overhead costs. At worst, incorrect
information leads to wrong actions.
“From the management's point of view, the concerns are partly different.
The wrong forecast can give a wrong indication of the geographic market
situation for the management. On the other hand, you are not able to do
strategic resource planning correctly.” (Controller F)
"Everything is about adjusting in strategy and support services that are
highly revenue-related. It is important to constantly think about whether the
support services of our business are properly designed.” (Group Mgmt B)
Wrong information tends to escalate as it proceeds in the organization. Inaccurate
revenue forecast may be clearly seen on a group level when everything is
consolidated together. This underlines the fact that even in a large organization small
things can have a big impact.
Page 87
80
“The group suffers when there is less revenue. Consequently, there is less
group contribution, which leads to the situation where also group has more
uncovered expenses because the revenue is used as a key to allocate the
group's overhead costs to the operating units.” (Group Mgmt B)
“If the revenue forecast is incorrect, the uncertainty will be transferred to
group eliminations, including the elimination of internal revenue.
Uncertainty at regional level is multiplied at group level, as many group
entries are based on forecasts made by regional units.” (Group Mgmt C)
Reacting time for changes is seen as crucial element form the management’s
perspective. The earlier you have accurate information concerning the future, the
more time you have for decisions and actions. Furthermore, the bottom line in
precise forecasting is to give a realistic picture of where company is today and to
which direction is it going. Forecasts must reflect the stories told. A reliable forecast
is also generally seen as a credibility issue.
“You must tell the business story through numbers and the story and the
numbers must speak the same language.” (Controller E)
“In terms of strategic adaptation and resource planning, it is critical to think
about how long you can wait and when the decisions must be made.”
(Group Mgmt B)
“Future projects cause great uncertainty for group management. It is
crucial to realise how quickly changes occur. Have we made the right
strategic choices in the past in order to be in the right places to get the
desired volume? In the Helsinki metropolitan area, the mind is calm
because the market offers opportunities. However, even the best people
do not guarantee the winning of the projects in areas where work is simply
not available to a large extent and competition is brutal. In line with the
company's strategy, we let our competitors rather take the less potential
projects by force. Profit before growth.” (Group Mgmt A)
Page 88
81
4.4.5 Rolling Financial Forecasting
Based on the previous studies, complementing traditional annual forecasting with
rolling forecasting is one of the most used techniques to enhance the company's
financial management (Ekholm & Wallin 2000; Sivabalan et al. 2009). Thus, rolling
forecasting does not need to replace traditional budgeting; two methods may be used
in parallel to support each other. This is also the Skanska’s way of working. Skanska
Group has been using rolling forecasting in some form since early 2000s. The rolling
forecasting model has been implemented through all levels of the organization; the
use of the rolling model is well established and quite unanimous regardless of the
unit. Additionally, the general feeling for rolling forecasting is positive.
“Rolling forecasting has directed people away from budget thinking. The
changes in the culture of rolling forecasting are smaller, more controlled,
and more justified than before.” (Group Mgmt B)
"In the annual forecast, the problem is caused by discontinuity. Rolling
forecast slips forward more smoothly and takes future into account more
efficiently." (Controller C)
“I like the fact that rolling forecasts are done quarterly for the next four
quarters and yearly two to three years ahead.” (Controller E)
Nevertheless, incentives within the organisation are built based on calendar year,
which drives the interest towards the annual forecast. Forecasting involves year-
based profit planning in this sense. Thus, annual forecasts are prioritized and the
quarterly forecasts are considered as guiding forecasts.
“Particularly the production people are primarily interested in the current
year because the performance bonuses are attached to it” (Controller D)
General interpretation among the interviewees is that the organization does not take
full advantage of rolling forecasting. Furthermore, the current ways in which the
rolling forecast is utilized around the organization are somewhat unclear. In addition,
Page 89
82
more than one interviewee expressed the view that rolling forecasting is done
because the parent company in Sweden requires all the business units to do so.
“From my point of view, rolling forecasting is not actively monitored at any
level. Each month, even every quarter includes so many changes that
direct the organization to look at annual forecasts rather than a shorter
time frame, such as quarterly or monthly forecasts.” (Controller A)
Nevertheless, the benefits of rolling forecasting are seen in the construction
business, as cyclical fluctuations are commonplace in the industry and rolling
forecasting is capable of sensing the seasonal variation. Additionally, 4Q rolling
forecasting is believed to be more accurate compared to the artificially created
quarterly forecast where annual forecast would be split in four parts.
“In our unit, rolling forecast is seen to supporting annual forecast. When
we know that something happens every year in a given month, we can
manage the whole and provide information about seasonal variations.”
(Controller B)
“Summer is a good example: quarters may be calmer. Thus, the greatest
benefit of rolling forecasting is trend tracking within a year.” (Controller A)
Overlooking fluctuations is also seen as a problem at different organizational levels.
In quarterly rolling forecasting, both project and regional unit levels often overlook the
seasonal variations, such as a quiet beginning of the year or a summer holiday
season. This poses a challenge for quarterly cost and revenue forecasting.
"The cost accumulation in the beginning of the project seems to be the
most difficult to predict. It is often heard to say from project people:
distribute them evenly over the quarters, even though in practice the
revenue is never steady.” (Controller F)
Annual cycle of reporting and forecasting is seen to trigger problems in the situations
where partial optimization leads to over recognition of revenue and profit.
Page 90
83
Furthermore, controllers see some risks of inaccuracy in the current way of project
forecasting, particularly in quarterly allocation of the forecast.
“Slightly overstretched revenue for the previous year effects negatively on
the volume of the first quarter of the next year. If we’d exploit rolling
forecasting more than at the moment, it could make the yearend less
painful.” (Controller C)
“Rolling forecasting is not widely used; it is rather created on the
controller’s desktop. Quarterly degree of readiness is an estimate, not
computational, and systems are not automated to support forecasting in
that sense. At present, each project forecasts the percentage of
completion of its own based on cost accrual. In the worst case, the
controller guesses the degree of readiness of individual quarters based on
the annual forecast.” (Controller E)
Altogether, individual quarters are not considered very deeply in Skanska. Here,
could be potential scarify and look more at the future through the rolling quarters at
both the unit and the group level, in order to better manage profitability.
“Even if the focus has to be kept in the future, maybe we should monitor
the accuracy of the forecasts more profoundly. What went wrong, what
can we learn from this? In this task, rolling quarterly forecasts could be
really useful. Performing a post-analysis in a reasonably simple and
effective way could lead to improve forecasting accuracy in the long run.”
(Group Mgmt A)
As the interviewees emphasized, the levels of rolling forecasting should be simple
enough. Vision is completely in line with Åkerberg (2006, 60) who stated that it is
crucial to identify critical business success factors, which rolling forecasting should
focus on. Controllers, who are balancing between the individual project forecasts and
regional unit forecasts, raised diligently both the challenges of rolling forecasting and
the suggestions for improvement.
Page 91
84
“Projects consider project forecast as a whole, not on an annual basis. In
this sense, the project world and the financial management environment
are very different. On the other hand, the challenge is to combine these
perspectives. As project size increases, the importance of individual
projects increases. In this case, the forecasting error for a single project
becomes really significant for business unit. It is also customary to delay
the start of the own development projects, which increases the difficulty of
forecasting.” (Controller F)
"I don't think that people in the production use rolling forecasting in any
way, they are fully focused on the project performance as a whole. In my
opinion, rolling forecasting could be utilized more in production.”
(Controller D)
There are differences between the regional units in the monitoring of the quarterly
forecast and actuals. Some units do not take an advantage of observing the accuracy
of individual quarter forecasts in organisation. Consequently, there are some best
practices within the organisation on how to make most out of the rolling forecasting.
"It is good that individual quarters are forecasted on a project level. When
the actual data of the quarter becomes available, we follow up how
accurately project managers have forecasted their projects. In this sense,
we follow a rolling forecast at a fairly accurate level. I am paying close
attention to the inaccurate forecasting of POC, which is directly reflected in
revenue. The overall forecast has improved significantly and people have
learned to forecast when the accuracy of forecasting is being tracked and
best practices are discussed with them.” (Controller D)
Furthermore, the scrutiny of rolling forecasting is seen as a great early warning sign
for the organisation to notice that something is going sideways in the project.
“If the forecast has not been realized as expected either the costs are
undercut or the site schedule is overdue because the POC does not
proceed as expected.” (Controller D)
Page 92
85
The earlier such signs are detected, the better strategic decisions will be made to get
over the issue. When it comes to the project control, it is important to be able to look
at smaller sub-assemblies than one year or the whole project. Rolling approach is
seen to offer great tool for this prerequisite.
"We definitely need those mid-term reviews. Forecasts change so much
during the year, so even a monthly-based forecast review is warranted to
be in use. In addition, project quarterly forecasts are analysed afterwards,
which develops our organisation.” (Controller F)
As the interviews revealed, reviewing the success or failure of rolling forecasting
depends on much more than just the accuracy of forecasts. Rolling forecasting
should above all provide information that can be utilized in strategic decision-making
and organisational development. Thus, rolling forecasting offers added value and a
new perspective to organisation alongside traditional forecasting and budgeting.
“Hopefully, it would create even more long-term vision for the unit's
management and helps them to consider continuity. Culture of rolling
forecasting is all about being able to smooth out things and not just
optimize for the current year. It is particularly important to be aware of the
multi-annual projects and their impact.” (Controller F)
Generally interviewees’ thoughts were positive related to the forecasting culture of
Skanska where company does not only forecast whole years, but always introduce at
least one new quarter to forecast when time passes from one forecasting period to
the next one. Based on the gained information, it can be said that the full potential of
rolling forecasting has not been exempt in Skanska and forecasting may be further
developed in this respect.
“The unit and the group level review could develop to be more focused on
future through the rolling quarters. This could lead to better manageability
and more effective steering in profit planning. A greater focus on corporate
management could lead to a better control effect and encourage the rolling
Page 93
86
forecasters to focus on forecasting when objectives and effects of the
rolling forecasting are commonly known.” (Group Mgmt B)
“The idea of rolling forecasting is at the right level, but we could make
even more out of it. There should be even clearer audit trail behind
forecasting figures, which would allow drill-down from group-level figures
to the detailed project level plans and forecasts.” (Group Mgmt A)
At end of the forecasting hierarchy, 4Q-rolling forecasts are utilized in management
reporting and performance reporting at the group level. Rolling key figures and
financial ratios are seen as an integral part of presenting the rolling forecasting mind-
set of the company to a larger audience. The use of rolling forecasting enables the
use of these rolling economic indicators also to the future, not just as the key figures
of historical performance. Typical horizons of rolling figures in Skanska is 12-months.
Rolling ratios related to income statement may be for example 12-months rolling
revenue, earnings before interests and taxes or sales and administrative costs.
Particularly interesting balance sheet –related rolling key figures used in Skanska are
for example rolling level of working capital or capital employed and long term working
capital ratio %. When it comes to the order bookings of a company, peculiarly
trustworthy idea of the future operative volumes of the company may be found by
studying the rolling book-to-bill ratio. This generally used ratio turns in the dictionary
of construction industry from book-to-bill to book-to-build ratio, which will be further
discussed later in this study. The basic idea of book-to-build –ratio is to divide order
bookings of a certain time period by generated revenue of a certain time period.
Depending on the industry, this provides a good estimate of future revenue levels,
particularly if the industry has rather long production times.
“The ratio of rolling order backlog and net sales should also be more
focused on the quarterly level. Furthermore, better communicated and
accurate rolling forecasts increases credibility.” (Controller E)
All in all, the use of a rolling forecast in Skanska is highly focused on supporting the
full year financial forecast. For further research, there is a clear need within the
Page 94
87
company to study the model of rolling forecasting, its special features and its role as
a part of the entire framework of forecasting in more detail.
4.4.6 Future Visions and Needs of Financial Forecasting
In the final stage of the interview, respondents were asked what would be the
benefits of more accurate revenue forecasts from their perspective and how
organisation would achieve better forecasting accuracy. Main objective was to find
substantial actions to develop forecasting process and to reach future visions and
needs of financial forecasting. Prerequisites begin with the owner's expectations.
"We have clear targets from the owner. Forecasting and reporting must be
transparent, reliable and stable. If the revenue forecast fails, the reliability
and the credibility are immediately tested by the owner.” (Group Mgmt A)
Forecasting is seen to facilitate the communication both within the business unit and
towards the parent company by giving greater room for future planning, instead of
concentrating on the present. Transparency was desired to have even higher position
to solve forecasting problems and to adjust company’s resource requirements in the
long term. Moreover, controls are aimed be based on the fast and frequent feedback.
“People may be afraid to tell bad news, such as weakening forecasts.
Communication is not always easy. However, bad news communicated in
the right way is often seen as a positive way of working rather than telling
in the last minute or not telling at all.” (Controller E)
“Accuracy brings confidence to the regional unit both externally and
internally. The fact that things are progressing as planned makes people
feel positive.” (Controller A)
The traditional approach on forecasting is somewhat conservative and the desire is
to avoid excesses in the future. The fact that things do not happen unexpectedly is
considered as the cornerstone of forecasting. Good relationships, trust, and
Page 95
88
functional communication within an organization are seen as very important features
that enable effective forecasting. Furthermore, forecasting is widely seen as a matter
of credibility. The fact that the controller can rely on project forecasts provides
assurance for managing a diverse project portfolio. Hence, partly because of
successful past years, it can be heard that the trust within the organization has
increased and has led to positive consequences.
"You trust what we do and you trust people around you. Trust must run
down through the organization. If we would come to a situation where we
could no longer rely on revenue forecasts, it would begin to chip away the
trust we have built together. Everyone must deliver the news, even if the
news are bad. Afterwards analyse what happened and learn from it, the
main thing is that communication is transparent." (Group Mgmt A)
The accuracy of the revenue forecast is seen to have a great impact in strategic
decision-making. Strategic decisions are simply better if they are based on more
accurate information. Thus, interviewees recommended the importance of
forecasting at all organizational levels should be more highlighted by the
management. The user perspective was widely emphasized; forecasting should be
made easier, more illustrative through visualization and less risky. This applies to all
of the holy trinity of forecasting: processes, systems and people.
“We know with better certainty where we are and where we are going,
making all the operations easier to control. We should be sure not to be in
a situation where the measures taken based on the F1 forecast are not
relevant half a year later, and the ship has to be reversed due to poor
forecasting accuracy.” (Group Mgmt D)
“We should make the forecasting as easy as possible for the person who
makes the forecast. All computational items should be automated so that
the person making the forecast can focus on the essentials.” (Controller C)
Some interviewees thought that from the strategic management point of view, the
current focus is not far enough in the future. Altogether, all activities in the
Page 96
89
organisation are based on the assumption of a certain level of business. The
response capacity is weak and the movements are very slow if focus is solely on the
current year. More market-oriented business focus and management reporting was
proposed as solution.
"It would be good to talk more about the market outlook and market
making of Skanska in the future. The long-term forecast should also be
constantly visible. One should be able to react to the future, for example,
the decline in housing production in the market should be enough time to
adapt and change the focus and look for new markets in business. It
would be a good idea to have a long-term market view of our forecast. If
you are going to make strategic guidance, you should look actively two or
three years into the future; not focus on the near future" (Controller E)
History can help predict the future, but it is not a guarantee of the future, expressly in
the construction industry. However, historical data is seen to support forecasting,
particularly in the detection of trends and seasonality. Market-oriented approaches
for future and close follow-up on revenue structure are both recommended trends.
“Furthermore, it is equally important to consider the structure of revenue.
What kind of project portfolio we have behind the revenue and whether the
structure of our revenue is in line with the strategy.” (Group Mgmt A)
Existing projects are considered rather easy to forecast from the controller's point of
view, because the project organization has the best knowledge about the project and
they create project forecast. Improving the accuracy of target job forecasting is seen
as more challenging task because it always involves high degree of uncertainty.
Obviously, there is operational uncertainty also related to the on-going projects.
However, target works are always uncertain and that must be seen in forecasted
figures. All in all, the predictability of target work is seen to be lower than on-going
production, which is why it should be underlined. Detailed categorization and more
structured way of evaluating target jobs from the financial forecasting point of view
was suggested action for accuracy development.
Page 97
90
"Let’s define the boundaries where target works with different status will be
handled with different weights. We may qualify projects that are very
uncertain and projects that are fairly certain and roughly set own
forecasting rules for these categories." (Controller A)
Large projects are considered more likely to be forecasting-oriented than small
projects. Furthermore, interviewees have often heard complaints that small sites
have little resources, many other things to do and too little time for forecasting. Thus,
the right resource allocation alongside the expertise is seen as a subject to be
developed. Interviewees recognise that Skanska’s way of working improves
forecasting quality due to the fact that forecasting is made at a precise level –
project-by-project and cost-by-cost.
“Controller is not able to be on the site daily basis. Thus, it is extremely
important to get information about the projects through reliable project
forecasts and detailed discussion. Otherwise, we can't support the
business.” (Controller F)
As noted above, the role of project organisations in forecasting is considered to be
the most important for forecasting success. Thus guidance, training, cooperation and
communication are seen as important tools to improve forecast accuracy. In
particular, the role of follow-up and discussion of measures to improve accuracy are
considered important. Forecasting skills may be improved with sparring by
colleagues and management. When you predict inaccurately and understand the
reasons for this, the skill of forecasting develops. Forecasting is highly dependable
on the people of the forecasting organization, their skills and priorities. Successes
are seen to feed even better performance. Trust and general attitudes towards
forecasts are more positive if it is commonly known that unit’s forecasting accuracy is
at good level. The quality of the forecast is caught by both expertise and attitude.
Changing the attitude requires a lot from superiors.
“Both training and follow-up of the forecasting process and accuracy on
the site level are crucial. When challenges arise, detours can be found.
Page 98
91
When resources are scarce for example production engineer can play a
greater role in the forecasting process. We have to intervene when
needed and be able to ask if another site or person can help and support
another site with forecasting. When every participant of the forecasting
process understands the importance of it, significant improvements to the
forecasts can be achieved.” (Controller F)
“It might be helpful if people in production would understand better the
importance of long-term forecasting and not just focus on this year”.
(Controller D)
The key tools for project forecasting in the organisation are project management
software Aino and Excel. The strong position of Excel is seen as a risk and a clear
development target for the company. Furthermore, there is no comprehensive
controller’s tool for regional level forecasting. Controllers believe in the active sharing
of the best practises within the organisation. The challenge of launching collective
tools is seen in the different needs of the regional units. However, it is believed that
congruent way of working would be possible and could have a great potential.
“In order to develop project summary forecasting, I’d like to see the
uniform controller tools to be improved instead of the current individual
ways of working. Everybody says that I have a unit that differs form others.
It's important to find a common way to technically do forecasting among
controllers and develop the practises together, using the best know-how
we have available in Skanska." (Controller F)
Reduction of manual work phases in forecasting is seen as an important
development target. Excessive share of interviewees working hours was considered
to be taken by technical execution whereas the time should be spent on analysis.
Interviewees dreamed about more accelerated process where changes would be
taken to only one system. Proposals for broader deployment of automation, robotics
and analytics were heard from almost all the interviewees. Even more advanced
development suggestions considered the use of Monte Carlo -simulation as a
background of revenue forecasting and the potential of artificial intelligence and
Page 99
92
machine learning to support forecasting process. Furthermore, very detailed practical
development suggestions were provided, which would be implemented to develop
the forecasting process.
"Forecasting process should get more automated. From project pipeline
certain projects could be named directly as target works. Hence, the
project forecast of target work would be handled quarterly in the same way
as on-going projects. It would be easier to handle the forecast on the
controller’s desktop through concrete target projects with information that
goes seamlessly from one system to another.“ (Controller D)
“If 3D models, resource plans, work plans, and schedules were linked to
forecasts, forecasting would be more accurate, scientifically calculated and
would make target setting easier. If information systems were integrated,
time would be left to monitoring rather than manual forecasting and
technical reporting. Automation of the near future and better system
support would also leave time for longer-term strategic planning. However,
current forecasts are surprisingly close to the actuals; we have learned to
forecast by trial and error.” (Controller E)
Altogether, organisation is seen to be able to provide support in order to find better
ways to forecast the future business. Organization has a lot of know-how to refine
and share best practises. Jointly further developed processes and systems are seen
to provide good base for user-oriented, well-focused forecasting in the future.
“There is no shortcut to happiness in forecasting. Forecasting consists of
many different pieces and projects and experience helps to question and
eliminate risks.” (Group Mgmt B)
“Processes has to be in good condition and systems need to support the
processes. Thus, forecasts could be easily consolidated upwards and
effective down-drilled. An adequate level of review should be determined,
while being careful not to go too detailed. Systems should enable analytics
and even artificial intelligence in the future.” (Group Mgmt A)
Page 100
93
5. SUMMARY AND CONCLUSIONS
The journey towards data-driven business is underway. Utilization of accessible data
for forecasting purposes is one of the key functions for diverse businesses to focus
on in the near future. Modern forecasting practices challenge the traditional target
setting state of mind. The synergy between practice and research will create superior
forecasting practices compared to those developed by each group independently.
This study disclosed the versatile theoretical framework;the importance of the future
market-orientation in business through the positive effects of secured revenue and
the bridge between the current ability and the future visions of revenue forecasting in
Skanska Finland.
Transparent, reliable and stable forecasting and reporting are the paramount
requirements from the owners of Skanska. The importance of the accuracy of the
revenue forecast as a prognostic and directive factor for both operative and strategic
decisions such as resource planning, performance planning, target setting, risk
management, overhead structure, reserve management and revenue recognition
cannot be overemphasised. This justifies the dominant position of revenue
forecasting at the core of robust financial management decision-making.
Forecasting as a process is a challenging task that should be continuous and
consistent. If successful, it will create significant added value at all levels of the
company through better strategic planning and control. Furthermore, an organisation
with a shrewd forecasting ability exudes credibility, punctuality and trust. From the
perspective of continuity, the most important task of forecasting and analyses is
learning. Via learning organisations are able to improve their operations, heal from
negative strands and promote their performance by re-steering the direction of the
company. All in all, while operating in a market, which is dependable on the decisions
of both public and institutional customers and even private homebuyers, forecasting
increasingly becomes the principal approach to manage operations and resources of
the company. Accurate and efficient financial forecasting equips an organisation with
enhanced competence to foresee the changes in its operative environment, to give
more time to react and take action.
Page 101
94
5.1 Synthesis of the Results
As in many other order-driven businesses, in the construction industry the order book
determines the future volume of the company. The order backlog that is large enough
in relation to company volume and secured early enough is a factor of paramount
importance for business predictability and financial forecasting. Profit margins in the
construction industry are relatively low. Hence, the level of revenue gives
management a fairly good picture of what the expected profit of the business unit is if
everything goes as planned. Throughout the year, the key functions such as resource
and profit recognition planning may benefit from the knowledge of the probable error
margin in the forecast.
The higher the price of a forecasting error is, the fewer mistakes an organisation can
afford. The faster a company can adjust to changed requirements, the higher error is
acceptable. (Jain 2006, 18) The purpose of the quantitative part of the research was
to discover regularities on the amount of secured revenue affects forecast accuracy
in different time horizons. Quantitative analysis was executed by measuring the
accuracy of the revenue forecasts made at different times in advance of the actual
outcome. Forecast series and actuals from various levels of the organization were
used to form a forecasting funnel to work as a bell curve of revenue forecasting. The
research hypothesis of the first sub-objective was proved to be correct:
As a result of the increasing share of secured revenue and the reduction of
more uncertain target work, the accuracy of revenue forecasting improves
when moving closer to the forecasted period.
The findings of this research would make statistically assisted bell curve and
preliminary scenarios of revenue forecasting possible for various levels of the
organisation. Furthermore, the bell curve of revenue forecasting would also allow for
more objective scenario approach. Based on the studied data, the individual
characteristics and forecasting tendencies of the units could be objectively
considered, for example, if someone systematically forecasts revenue more
conservatively. In terms of financial steering of the company, the level of
Page 102
95
uncertainties within a multi-level organization would be taken into account in strategic
decision-making.
Organizations’ ability to renew their operative culture in a more dynamic direction is
seen as a prerequisite for success in the modern business world. For organisations
and researchers, rolling forecasting is one way to fight against the limitations and
challenges of traditional annual budgeting and forecasting. The purpose of the
second sub-objective was to clarify the role of rolling forecasting as part of the
financial forecasting process and its connection to forecast accuracy in the case
study company.
Rolling forecasting supports the annual forecast and directs the
organisation to focus on continuity rather than fixed periods. However, the
incentives force the organisation to prioritize annual perspective. Rolling
forecasting improves the forecasting accuracy by offering shorter review
period for the organisation to focus on and to intervene in time. The
organisation would like rolling forecasting to be a more cohesive part of a
strategy process to increasingly support annual forecasting in the
integrated planning cycle. Advantages of the rolling approach are
commonly known and the case study company has untapped potential
related to rolling forecasting, which it can further develop.
In order to support strategic decision-making, singular quarter forecasts were not
seen as important as annual forecasts. However, among the interviewees some sort
of rolling approach was considered as a modern forecasting method that should be
further emphasized. In addition, the hypothesis related to the ability of rolling
forecasting to detect fluctuations within a year was raised several times during
interviews. Rolling forecasting combined with data analytics was reckoned to provide
new beneficial outlooks for organization’s financial forecasting. Skanska needs to
refine the purpose of rolling forecasting from the strategic perspective and its role as
a part of the entire framework of forecasting. A proper drill-down from group-level
figures all the way to the detailed project level plans and forecasts was a highlighted
objective where rolling forecasting could play a big role. All in all, the idea of rolling
forecasting is well rooted in the organization but the work towards better
Page 103
96
manageability and more effective steering through rolling forecasting is still in the
early stages.
Because of the fact that revenue has an effect on an infinite number of external and
internal factors of the company, it is essential to achieve a high degree of certainty in
revenue forecasting. One of the core areas of the research was to recognize the
organization’s concerns related to scenario thinking in forecasting, the legitimate
balance between healthy conservatism and harmful prudence and the substantial
actions to overcome the challenges of revenue forecasting. The purpose of
qualitative and quantitative researches was to provide an answer to the main
research question:
It is essential to recognise micro- and macro –level factors that affect
forecasting and process the data that enables the decision-making to be
better informed. Multiple ways to improve forecasting performance were
elevated: long-term market-orientation that allows earlier accumulation of
secured revenue, better system support, automation and sharing of the
best practices, and more profound focus on forecasting of target works,
communication, training and process follow-up alongside the bolder
experimental culture of new forecasting tools. The results of the empirical
research clearly highlight the important link between strategic
management and well-functioning forecasting process.
Regardless of the business volume, bringing together the goals and forecasts of the
multiple operating units helps in understanding the direction of the entire company.
Coordination and communication of the strategic plans is easier when everyone
knows what is being pursued and in what respects the actuals and forecasts are for
these targets. Objectives should be set in a way that pushes towards the desired
action. Thus, interviewees endorsed the management to highlight the importance of
forecasting and to emphasize future market-making at all organizational levels. After
all, Skanska’s operations are dependable on the project pipeline and customer's
schedule and will. When it comes to market making and early contractor involvement,
more accurate forecasting could aim to adjust the cycle and timing of construction to
smoothen the operations.
Page 104
97
Financial information originates from projects bottom-up; foster focus on the source
and the chain of the information was recommended. Most often, carefully
implemented project management is behind the accurate forecasts, which give
confident that the accuracy level is also good if the problems occur. Thereafter,
everything crystallizes for communication. Further development of the culture of
transparency and even better communication in order to optimize resource
requirements are seen fundamental to decision-making. Attitudes towards the use of
new technologies, process development and automation were highly welcomed
among interviewees. Above all, there was a clear desire to make forecasting easier
for everyone and to remove manual work phases. Furthermore, hunger to allocate
time for more productive work such as analysis and strategic planning was obvious.
Thus, there is a clear potential seen in concerted forecasting development. Gained
results enhance the comprehension of the ability of forecasting in the case study
company. The achieved information may be used to help the development planning
related to financial forecasting.
5.2 Discussion, Limitations and Approach for Future Research
During the past decade business intelligence and data analytics have secured their
position in the agenda of corporate management. (Elbashir et al. 2013, 87)
Executives’ wish lists include better and better forecasting and data analyses, which
are seen as vital tools for decision-making and a part of value creation. As stated by
Frizzo-Barker et al. (2016, 403) organisations are willing to resource in order to
anticipate market movements. The urge towards more modern way of forecasting
and controlling business is clearly visible in the case study organisation, which was
much more pronounced than expected in the research hypothesis. People in the
organisation want to develop processes and systems and, above all, develop
themselves as professionals. This creates a fertile soil for company management to
give people the opportunity to export organization and expertise in it to a new
eminent level.
One of the basic ideas of modern approaches to forecasting, disclosed in the
theoretical framework of this study, is to lead transparently through common values
Page 105
98
and sensible judgment, not using strict rules or regulations (Becker et al. 2016;
Player 2009). In the case company, the organization’s internal trust, responsibility
and planning are emphasized. Good relationships, trust, and functional
communication within an organization are important qualities to maintain and further
develop in order to enable effective and accurate forecasting. Through accurate
forecasting, things do not happen unexpectedly, both internal and external credibility
increases and strategic decisions are made with better confidence. Once and for all,
company's management is able to react in the right way and accurate forecasts make
the management's response time longer.
Quantitative analysis revealed that a higher amount of secured revenue improves
forecasting accuracy as expected in the research hypothesis. Thus, it was justifiable
to raise the dilemma of target work forecasting as one of the key focus areas in the
qualitative part of the study. Interviews confirmed that future projects cause great
uncertainty for construction business. Market knowledge is particularly essential for
improving the predictability of target work as disclosure obligations create a basic
need for forecasting alongside the additional anticipation needs from the owner (Eng
& Mak 2003, 325). The overall results give strong evidence of the need of more
market-oriented business focus and close follow-up on revenue structure to meet the
requirements.
The results showed further that it is essential to realize and anticipate how quickly
changes occur. However, it is equally important to be able to change when the
operating environment requires by reflecting existing operations to company’s
strategic choices and business environment. On the basis of the study, the case the
company has all the capabilities to develop its operations of forecasting by making it
easier, high priority task within the organisation for people to execute with well-
founded processes and systems. Demand-driven business forecasting has been
increasingly emphasized for decades. (Lapide 2009, 18). Accurate revenue
forecasting is one of the fundamentals to enhance company’s relative profitability
through the strategic guidance. The overall results of this thesis showed the
indisputable links between accurate revenue forecasting and legitimate strategic
decision-making, profound organizational steering and effective financial
management.
Page 106
99
When interpreting the findings of this study, its limitations should be considered. The
generalizability of the study is limited as the research data is only based on the
financial forecasting data and interviews executed in one company. However,
identified causal relationships and development trends within the research topic may
be discretionary generalized outside of the company. Particularly, if the organization
to be compared is operating in the project business or in the same industry, the
results may be better widespread. However, the results showed that the findings did
not even concern all the sub-organizations of the case company, and are dependable
on the organizational characteristics, business model and personal attributes.
The reliability of the quantitative data is good, because researcher is familiar both
with the case company and the empirical data used in the research. Thus, the
possibility of error due to the misinterpretation of the qualitative material or the
functionality and reliability of the data source system is limited. However, the
reliability of research is strongly influenced by the number of interviews conducted in
the case organization. A total of four interviews were collected from group
management and a total of six interviews were collected from regional controllers.
The interviews revealed a lot of similarities but also clear differences in the
responses were found. The fact that two groups can be clearly distinguished from the
research reduces the subjectivity of the study and improves the reliability of the
results. On the other hand, additional perspectives from other levels and functions of
the organization could have been added to increase coverage and reliability of the
research. However, research results can generally be considered reliable.
Study raises a number of potential topics for further research. Further research could
be carried out later on how and to which direction the organization has started to
develop its operations and whether the organisation's ability to forecast has changed
due to the influence of technology or other external factors. In addition, the impact of
forecasting accuracy on the strategic steering and response rate of the organization
would be interesting to explore. Data could be expanded for deeper quantitative
analyses of data and subsets of it. In addition, the real impact of forecasting
inaccuracies in the organization and more accurate verification of effects in the
income statement would be very interesting topics for future research. Corresponding
Page 107
100
research from other Skanska-countries and business units with wider sample in order
to share the best practises globally would be fascinating idea for extensive further
study. Furthermore, the development of the forecasting process, models and
techniques would offer interesting topics for the further research.
Page 108
101
LIST OF REFERENCES
Acito, F., & Khatri, V. 2014. Business analytics: Why now and what next? Business
Horizons. Vol. 57, No. 5, pp. 565-570.
Åkerberg, P. 2006. Budjetoinnin mielettömyys. Gummerus kirjapaino Oy. Helsinki.
Albrecht, W & Stice, E & Stice, J & Swain, M. 2008. Accounting: Concepts and
Applications. 10th Edition. Thomson South-Western, USA.
Anthony, R. N., Govindarajan, V., & Dearden, J. 1998. Management control
systems. Vol. 9. MA: Irwin McGraw-Hill, Boston.
Anthony, R.N., Dearden, J. and Bedford, N.M. 1989, Management Control Systems,
Irwin, Homewood, IL.
Armstrong, J.S. (ed) 2001. Principles of forecasting: a handbook for researches and
practitioners, II edition, Springer Science+Business Media Inc., New York.
Balance Benchmarking 2019. Suuret rakennusliikkeet. Available:
[tietopalvelut.kauppalehti.fi]
Barton, D., & Court, D. 2012. Making advanced analytics work for you. Harvard
business review, Vol. 90, No. 10, pp. 78-83.
Becker, S. D. 2014. ”When organisations deinstitutionalise control practices: A
multiple-case study of budget abandonment.” European Accounting Review Vol. 23
No. 4, pp. 593–623.
Becker, S. D., Mahlendorf, M., Schaffer, U., & Thaten, M. 2016. Budgeting in times of
economic crisis. Contemporary Accounting Research, Vol. 33, No. 4, pp. 1489-1517
Benaroya, G. 2018. CFOs are overconfident in their ability to forecast results.
Available: [https://www.linkedin.com/feed/update/urn:li:groupPost:1818149-
6358692332459618304]
Bilal, Oyedele, Qadir, Munir, Ajayi, Akinade & Pasha 2016. Big Data in the
construction industry: A review of present status, opportunities, and future
trends. Advanced engineering informatics, Vol. 30, No. 3, pp. 500-521.
Page 109
102
Blumentritt, T. 2006. Integrating strategic management and budgeting. Journal of
Business Strategy, Vol. 27, No. 6, pp. 73 – 79.
Bose, R. 2009. Advanced analytics: opportunities and challenges. Industrial
Management & Data Systems, Vol. 109, No. 2, pp. 155-172.
Bourmistrov, A., & Kaarbøe, K. 2013. From comfort to stretch zones: A field study of
two multinational companies applying “beyond budgeting” ideas. Management
accounting research, Vol. 24, No. 3, pp. 196-211.
Box, G. E., Jenkins, G. M., Reinsel, G. C., & Ljung, G. M. 2015. Time series analysis:
forecasting and control. John Wiley & Sons.
Boxall, P., & Purcell, J. 2011. Strategy and human resource management. Macmillan
International Higher Education.
Braunstein, S. H., Bretas, N. G., Rossoni, A., & Bretas, A. 2015. Bad data analysis in
distribution state estimation considering load models. In 2015 IEEE Power & Energy
Society General Meeting (pp. 1-5). IEEE.
Buffa, E.S. & Sarin, R.K. 1987. Modern Production – Operations Management, VIII
edition, John Wiley & Sons, Inc., New Jersey.
Bunce, P., Fraser, R., & Woodcock, L. 1995. Advanced budgeting: a journey to
advanced management systems. Management accounting research, Vol. 6, No.3,
pp. 253-265.
Byrne, S., & Pierce, B. 2007. Towards a more comprehensive understanding of the
roles of management accountants. European Accounting Review, Vol. 16, No. 3, pp.
469-498.
Chase, C.W. 1995. “Measuring Forecast Accuracy”, Journal of Business Forecasting
Methods & Systems, Vol. 14, No. 3, pp. 2-24.
Chiriac, C., Michalewicz, M., Michalewicz, Z. & Schmidt, M. 2007. Adaptive Business
Intelligence. Springer.
Chopra, S. & Meindl, P. 2010. Supply Chain Management – Strategy, Planning and
Operation, IV edition, Pearson Education, Inc., Upper Saddle River, New Jersey.
Christopher, M. 2012. Logistics and supply chain management, IV edition, Prentice
Hall, Pearson UK, London.
Page 110
103
Clark, T. E., & McCracken, M. W. 2009. Improving forecast accuracy by combining
recursive and rolling forecasts. International Economic Review, Vol. 50, No. 2, pp.
363-395.
Clarke, P. 2007. The Rolling Forecast: As a Catalyst for Change. Accountancy
Ireland. Vol. 39, No. 5, pp. 22–24.
Covaleski, M. A., Evans III, J. H., Luft, J. L., & Shields, M. D. 2003. ”Budgeting
research: three theoretical perspectives and criteria for selective integration”. Journal
of Management Accounting Research, Vol.15, No. 1, pp. 3-49.
Cox, J.E. 1987. “An assessment of books relevant to forecasting in marketing”,
International Journal of Forecasting. Vol. 3, No. 3/4, pp. 515-527.
Croxton, K.L. 2001. “The Supply Chain Management Processes”, International
Journal of Logistics Management, Vol. 12, No. 2, pp. 13-36.
Croxton, K.L., Garcia-Dastuge, S.J., Lambert, D.M. & Rogers, D.S. 2002. “The
Demand Management Process”, International Journal of Logistics Management. Vol.
13, No. 2, pp. 51-65.
Crum, C. & Palmatier, G. 2003. Demand Management Best Practices: Process,
Principles and Collaboration, Integrated Business Management Series, J. Ross
Publishing, Fort Lauderdale.
Davila, T., Epstein, M., & Shelton, R. 2012. Making innovation work: How to manage
it, measure it, and profit from it. FT press.
Davis, D.F & Mentzer, J.T. 2007. “Organizational factors in sales forecasting
management”, International Journal of Forecasting, Vol. 23, No. 3, pp. 475-495.
Davis, G. A., Woratschek, C. R. 2015. “Evaluating Business Intelligence/Business
Analytics Software for Use in the Information Systems Curriculum,” Information
Systems Education Journal Vol. 13, No. 1, pp. 23-29.
Drury, C. 2004. Management Accounting for Business Decisions. 2nd Edition,
Thomson Learning, London.
DuBrin, A.J. 2000, Essentials of Management, South-Western College Publishing,
New York, NY.
Page 111
104
Ehrhart, K & Gardner, R & von Hagen, J & Keser, C. 2007. Budget processes:
Theory and experimental evidence. Games and Economic Behavior, Vol. 59, No. 2,
pp. 279–295.
Ekholm, B.-G. & J. Wallin, 2000. ‘Is the Annual Budget Really Dead?’, Euro- pean
Accounting Review, Vol. 9, No. 4, pp. 519–539.
Ekholm, B.-G. and J. Wallin 2011. ‘The Impact of Uncertainty and Strategy on the
Perceived Usefulness of Fixed and Flexible Budgets. Journal of Business Finance &
Accounting, Vol. 38, No. 1 & 2, pp. 145–164
Elbashir, M.Z., Collier, P.A., Sutton, S.G., Davern, M.J., Leech, S.A., 2013.
Enhancing the business value of business intelligence: the role of shared knowledge
and assimilation. J. Inf. Syst. No. 27, Vol. 2, pp. 87–105.
Eng & Mak 2003. Corporate governance and voluntary disclosure. Journal of
accounting and public policy, Vol. 22, No. 4, pp. 325-345.
Forecon 2019a. Rakentamisen näkymät Suomessa ja alueilla vuoteen 2023.
Available: https://one.skanska.com/496404/contentassets/a77700c781fb4b509bf681
0b3120e032/rakentaminen-alueilla-vuoteen-2023-forecon.pdf
Forecon 2019b. Economic and construction outlook for Finland 2019-2020. Available:
https://one.skanska.com/fi-fi/tiedon-jakaminen/skanska-knowledge/countries/finland/
markkinatieto/makrotalous-ja-rakentamisen-suhdanteet/economic_and_construction_
outlook_for_finland_forecon.pdf
Frizzo-Barker, J., Chow-White, P. A., Mozafari M. & Ha, D. 2016. An empirical study
of the rise of big data in business scholarship. International Journal of Information
Management. Vol. 36, No. 3, pp. 403-413.
Grabara, J. & Starostka-Patyk, M. 2009. “The Bullwhip Effect In Supply Chain”,
Advanced Logistic systems, Vol. 3, pp. 127-133.
Granger, C.W.J. 2014. Forecasting in Business and Economics, III edition, Academic
Press, Inc., New York.
Hald, A. 2003. A history of probability and statistics and their applications before
1750. Vol. 501. John Wiley & Sons.
Hambrick, D. C. 2007. Upper echelons theory: An update.
Page 112
105
Hanke, J.E., Reitsch, A.G. & Wichern, D.W. 2001. Business Forecasting. VII edition,
Prentice-Hall, Inc., Upper Saddle River, New Jersey.
Hansen, S. C., & Van der Stede, W. A. 2004. Multiple facets of budgeting: an
exploratory analysis. Management accounting research, Vol. 15, No. 4, pp. 415-439.
Hansen, S. C., Otley, D. T., & Van der Stede, W. A. 2003. Practice developments in
budgeting: an overview and research perspective. Journal of management
accounting research, Vol. 15, No. 1, pp. 95-116.
Hazen, B. T., Boone, C. A., Ezell, J. D., & Jones-Farmer, L. A. 2014. Data quality for
data science, predictive analytics, and big data in supply chain management: An
introduction to the problem and suggestions for research and
applications. International Journal of Production Economics Vol. 154, pp. 72-80.
Henttu-Aho, T., & Järvinen, J. 2013. A field study of the emerging practice of beyond
budgeting in industrial companies: an institutional perspective. European Accounting
Review, Vol. 22 No. 4, pp. 765-785.
Hirsjärvi, S. & Hurme, H. 2001. Tutkimushaastattelu. Teemahaastattelun teoria ja
käytäntö. Yliopistopaino. Helsinki.
Hirsjärvi, S., Remes, P. & Sajavaara, P. 2001. Tutki ja kirjoita. 7. painos. Tammi.
Helsinki.
Hope, J. & Fraser, R. 2000. Beyond budgeting. Strategic Finance, Vol. 82, No. 4, pp.
30-35.
Hope, J., & Fraser, R. 2003. Beyond budgeting: how managers can break free from
the annual performance trap. Harvard Business Press.
Horngren, C. T., Foster, G., Datar, S. M., Rajan, M., Ittner, C., & Baldwin, A. A. 2010.
Cost accounting: a managerial emphasis. Issues in Accounting Education, Vol. 25,
No. 4, pp. 789-790.
Hummel, Huitt, Michael & Walters 1994. What you measure is what you
get. GaASCD Newsletter: The Reporter, pp. 10-11.
Ikäheimo, S., Laitinen, E. K., Laitinen, T., Puttonen, V. 2011. Laskentatoimi ja
rahoitus. Vaasan Yritysinformaatio Oy.
Page 113
106
Jain, C.L. 2006. “Benchmarking Forecasting Errors”, Journal of Business
Forecasting, Vol. 25, No. 4, pp. 18-21.
Järvenpää, M., Partanen, V., & Tuomela, T. S. 2001. Moderni taloushallinto -
Haasteet ja mahdollisuudet. Edita, Helsinki.
Jensen, M. C. 2003. Paying people to lie: The truth about the budgeting
process. European Financial Management, Vol 9, No. 3, pp. 379-406.
John, K & Park, C-K. 2006. Top-down Budgeting as a Tool for Central Resource
Management. OECD Journal on Budgeting, Vol. 6, No. 1, pp. 87-125.
Jonas, J. and Harper, J. 2006, “Effective counterterrorism and the limited role of
predictive data mining”, Policy Analysis, No. 584, CATO Institute, Washington, DC,
pp. 1-11.
Kanthi Herath, S. (2007). A framework for management control research. Journal of
management development, Vol. 26, No. 9, pp. 895-915.
Kaplinsky, R. & Morris, M. 2001. A Handbook for Value Chain Reseach, Vol. 113,
IDRC, Canada.
Kärkkäinen, R., Lavikka, R., Seppänen, O., & Peltokorpi, A. 2019. Situation Picture
Through Construction Information Management. In 10th Nordic Conference on
Construction Economics and Organization, pp. 155-161. Emerald Publishing Limited.
Keng Boon, O., Arumugam, V., Samaun Safa, M., & Abu Bakar, N. 2007. HRM and
TQM: association with job involvement. Personnel Review, Vol. 36, No. 6, pp. 939-
962.
Lapide, L. 2009. “History to Demand Driven Forecasting”, The Journal of Business
Forecasting, Vol. 28, No. 2, pp. 18-19.
Lawless, M. 2014. Predictive analytics: An opportunity for better demand planning
and forecasting. The Journal of Business Forecasting, Vol. 33, No. 4, pp. 44.
Lee, C.H.C. 1999. “Accounting-based valuation: Impact on business practices and
research”, Accounting Horizons, Vol. 13, No. 4, pp. 413-425.
Lee, H.L., Padmanabhan, V. & Whang, S. 1997. “The Bullwhip Effect in Supply
Chains”, Sloan Management Review, Vol. 38, No. 3, pp. 93-102.
Page 114
107
Lee, H.L., Padmanabhan, V. & Whang, S. 2004. “Information Distortion in a Supply
Chain: The Bullwhip Effect”, Management Science, Vol. 50, No. 12, pp. 1875-1886.
Li, X., Pan, B., Law, R., & Huang, X. 2017. Forecasting tourism demand with
composite search index. Tourism management, Vol. 59, pp. 57-66.
Libby, T., & Lindsay, R. M. 2010. Beyond budgeting or budgeting reconsidered? A
survey of North-American budgeting practice. Management accounting research, Vol.
21, No. 1, pp. 56-75.
Liberatore, M. J., & Luo, W. 2010. The analytics movement: Implications for
operations research. Interfaces, VOL. 40, No. 4, pp. 313-324.
Lillis, A. and Mundy, J. 2005. Cross-sectional field studies in management
accounting research – closing the gaps between surveys and case studies. Journal
of Management Accounting Research Vol. 17, No. 1, pp. 119–141.
Luft, J. & Shields, M.D. 2003. ”Mapping management accounting: Graphics and
guidelines for theory-consistent empirical research”, Accounting, Organizations and
Society Vol. 28, No. 2/3, pp. 169–249.
Luhn, H. P. 1958. A Business Intelligence System. IBM Journal of Research and
Development. Vol. 2, no 4, pp. 314-319.
Makridakis, S. & Wheelwright, S. C. 1989. Forecasting methods for management, V
edition, John Wiley & Sons, Inc., New Jersey.
Malmi, T., Seppälä, T. & Rantanen, M. 2001. The practice of management
accounting in Finland – a change? The Finnish Journal of Business Economics Vol.
50, No. 4, pp. 480–501
McAfee, A., Brynjolfsson, E., Davenport, T. H., Patil, D. J., & Barton, D. 2012. Big
data: the management revolution. Harvard business review, Vol. 90, No 10, pp. 60-
68.
Mello, R., Leite, L. R. & Martins, R. A. 2014. Is Big Data The Next Big Thing in
Performance Measurement Systems. Proceedings of the 2014 Industrial and System
Engineering Research Confrence. Institute of Industrial and Systems Engineers
(IISE) pp. 1837-1846.
Page 115
108
Mentzer, J.T. & Moon, M.A. 2005. Sales forecasting management – A Demand
management approach, II edition, Sage Publication, Thousand Oaks, California.
Merchant, K. A., & Van der Stede, W. A. 2007. Management control systems:
performance measurement, evaluation and incentives. Pearson Education.
Merchant, K.A. 1982, “The control function of management”, Sloan Management
Review, Vol. 23 No. 40, pp. 43-55.
Merchant, K.A. 1985, Control in Business Organizations, Pitman, Boston, MA.
Metsämuuronen, J. 2001. Laadullisen tutkimuksen perusteet. International Methelp
Ky. Viro.
Montgomery, P. 2002. Effective Rolling Forecasts. Strategic Finance, Vol. 83, Iss. 8,
pp. 41–44.
Morlidge, S. & Player, S. 2010, Future Ready: How to Master Business Forecasting,
John Wiley & Sons, Chichester.
Neely, A., Bourne, M., and Adams, C. 2003. Better budgeting or beyond budgeting?
Measuring Business Excellence Vol. 7 No.3, pp. 22–28.
Neilimo, K. & Uusi-Rauva, E. 1999. Johdon laskentatoimi. Edita, Helsinki.
Olhager, J. 2003. “Strategic positioning of the order penetration point”, International
Journal of Production Economics, Vol. 85, No. 3, pp. 319-329.
Østergren, K., & Stensaker, I. 2011. Management control without budgets: a field
study of ‘beyond budgeting’in practice. European Accounting Review, Vol. 20, No. 1,
pp. 149-181.
Otley, D. 1999. Performance management: a framework for management control
systems research. Management accounting research, Vol. 10, No.4, pp. 363-382.
Partanen, V. 2007. Talousviestintä johtamisen tukena. Gummerus kirjapaino Oy.
Jyväskylä.
Pilkington, M & Crowther, D. 2007. Budgeting and control. Financial Management,
March, pp. 29–30.
Player, S. 2003. “Why some organizations Go ‘Beyond Budgeting’”, The Journal of
Corporate Accounting and Finance, Vol. 14 No. 3, pp. 3-9.
Page 116
109
Player, S. 2009. Managing through change: The power of rolling forecasts. IBM
Cognos Innovation Center for Performance Management, pp. 1-23.
Raghunandan, M., Ramgulam, N., & Raghunandan-Mohammed, K. 2012. Examining
the behavioural aspects of budgeting with particular emphasis on public
sector/service budgets. International Journal of Business and Social Science, Vol. 3,
No. 14.
Rainbird, M. 2004. “Demand and Supply Chains: the Value Catalyst”, International
Journal of Physical Disrtibution & Logistics Management, Vol. 34, No. 3/4, pp. 230-
250.
Rikhardsson, P. & Yigitbasioglu, O. 2018. Business Intelligence & analytics in
management accounting research: Status and future focus. International Journal of
Accounting Information Systems. Vol 29, pp. 37-58.
Ruusuvuori, J. & Tiittula, L. 2005. Haastattelu: Tutkimus, tilanteet ja vuorovaikutus.
Vastapaino. Tampere.
Saieg, P., Sotelino, E. D., Nascimento, D., & Caiado, R. G. G. 2018. Interactions of
building information modeling, lean and sustainability on the architectural,
engineering and construction industry: a systematic review. Journal of cleaner
production, Vol. 174, pp. 788-806.
Sakr, S. & Zomaya, A. Y. 2017. Handbook of Big Data Technologies. Springer.
Sandalgaard, N., & Nikolaj Bukh, P. 2014. Beyond Budgeting and change: a case
study. Journal of Accounting & Organizational Change, Vol. 10, No. 3, pp. 409-423.
Saunders, M. N. 2011. Research methods for business students, 5th edition.
Pearson Education India.
Schläfke, M., Silvi, R., & Möller, K. 2012. A framework for business analytics in
performance management. International Journal of Productivity and Performance
Management, Vol. 62, No. 1, pp. 110-122
Shim, J & Siegel, J & Shim, A. 2012. Budgeting Basics and Beyond. 4. p. New
Jersey, John Wiley & Sons Inc.
Sivabalan, P., Booth, P., Malmi, T., & Brown, D. A. 2009. An exploratory study of
operational reasons to budget. Accounting & Finance, Vol. 49, No. 4, pp. 849-871.
Page 117
110
Skanska 2019a. Me olemme Skanska Suomi. Available: [https://one.skanska.com/fi-
fi/my-unit/organizational-units/skanska-suomi/Me-olemme-Skanska-Suomi/]
Skanska 2019b. UN Global Goals and local business in Skanska. Available:
[https://group.skanska.com/sustainability/sustainability-focus-areas/sustainability-
goals/]
Soibelman, Wu, Caldas, Brilakis & Lin 2008. Management and analysis of
unstructured construction data types. Advanced Engineering Informatics, Vol. 22, No.
1, pp. 15-27.
Sterling, R.R. 1975. Toward a science of accounting. Financial Analysts Journal, Vol.
31, No. 5, pp. 28-36 .
Stevenson, W.J & Sum, C.C. 2014. Operations Management, Vol. 8, McGraw-
Hill/Irwin, Boston, MA.
Szozda, N. & Werbińska-Wojciechowska, S. 2013. Influence of the demand
information quality on planning process accuracy in supply chain. Case studies.
Scientific Journal of Logistics. Vol. 9. No. 2. pp. 73-90
Tien, J. M., 2013, "Big Data: Unleashing information," Journal of Systems Science
and Systems Engineering, Vol. 22, No. 2, pp. 127-151
Update for the first publishment: Hambrick, D. C., & Mason, P. A. 1984. Upper
echelons: The organization as a reflection of its top managers. Academy of
management review, Vol. 9, No. 2, 193-206.
Van der Stede, W. A. 2000. The relationship between two consequences of
budgetary controls: budgetary slack creation and managerial short-term
orientation. Accounting, Organizations and Society, Vol. 25, No. 6, pp. 609-622.
Waller, M. A., & Fawcett, S. E. 2013. Data science, predictive analytics, and big data:
a revolution that will transform supply chain design and management. Journal of
Business Logistics, Vol. 34, No. 2, pp. 77-84.
Wang, H. and Wang, S. 2008, “A knowledge management approach to data mining
process for business intelligence”, Industrial Management & Data Systems, Vol. 108
No. 5, pp. 622-634.
Page 118
111
Wang, Y. (2015). Business intelligence and analytics education: Hermeneutic
literature review and future directions in is education. In Proceeding of Twenty-First
Americas Conference on Information Systems (AMCIS), Puerto Rico. Vol. 5, pp. 1-10
Wildavsky, A. 2002. Budgeting: A Comparative Theory of the Budgeting Process. 4.
p. New Jersey, Transaction Publishers.
Wilder, C. R., & Ozgur, C. O. 2015. “Business Analytics Curriculum for
Undergraduate Majors,” INFORMS Transactions on Education Vol. 15, No. 2, pp.
180-187.
Wixom, B., Ariyachandra, T., Douglas, D., Goul, M., Gupta, B., Lyer, L., Kulkarni, U.,
Mooney, J. G., Phillips-Wren, G., and Turetken, O. 2014. “The Current State of
Business Intelligence in Academia: The Arrival of Big Data,” Communications of the
Association for information Systems 34, pp. 1-13.
Woodruff, R.B. 1997. “Customer value: the next source of competitive advantage”,
Journal of the academy of marketing science, Vol 25, No. 2, pp. 139-155.
Ylijoki, O. 2019. Big Data–Towards Data-driven Business.
Zeller, T & Metzger, L. 2013. “Good Bye Traditional Budgeting, Hello Rolling
Forecast: Has The Time Come?” American Journal Of Business Education, Vol. 6,
No. 3, pp. 299–310 .
Zhang, S., Sulankivi, K., Kiviniemi, M., Romo, I., Eastman, C. M., & Teizer, J. 2015.
BIM-based fall hazard identification and prevention in construction safety
planning. Safety science, Vol. 72, pp. 31-45.
Page 119
APPENDICES
APPENDIX 1: Supply and Demand Chain Management Process (Rainbird 2004,
238)
Page 120
APPENDIX 2: Need of Forecasting and Planning (Mentzer & Moon 2005, 11)
Operations Planning
Capacity Planning
Demand Planning
Sales Forecasting
SUPPLY
SALES AND OPERATIONS
PLANNING
DEMAND
Page 121
APPENDIX 3: The Bullwhip Effect (Lee, Padmanabhan & Whang 1997, 94)
Page 122
APPENDIX 4: The structure of the interview for controllers
Current Status of Revenue Forecasting
- How would you describe the way of forecasting in Skanska?
- When forecasting revenue, how the process flows in your business unit?
- How do you estimate the amount of target jobs/revenue per year?
- Do you use conservative safety margin when forecasting revenue?
- How do you estimate low and high scenarios of revenue forecast?
- In your opinion, what are the most important time horizons for which forecasts
are made?
- What is the frequency of financial forecasting in different levels in your
business unit? (project level, project manager level, regional level)
- You execute F2 forecasting round; prioritize the following forecasts based on
their importance for strategic decision-making:
- Forecast of the next quarter
- Forecast of the current year
- Next year’s forecast
- Does order of priority change for F3 forecasting round, and if it does, why?
Challenges of Financial Forecasting
- What are the most characteristic problems related to forecasting in general?
- How does the inaccurate revenue forecast effect on the entire financial
forecasting?
- Identify the potential problems of forecasting from the group management’s
point of view?
Rolling Financial Forecasting
- How 4Q-rolling forecasting is utilized in Skanska and in your business unit?
Page 123
- How 4Q-rolling forecasting should be utilized for example in order to improve
the steering effect of the rolling forecast?
Future Visions and Needs of Financial Forecasting
- What would be the benefits of more accurate revenue forecasts from your
perspective?
- From your point of view, what should happen in order to improve the revenue
forecast accuracy and how that could be achieved?
Page 124
APPENDIX 5: The structure of the interview for group management and group
administration
Current Status of Revenue Forecasting
- How would you describe the way of forecasting in Skanska?
- How would you estimate low and high scenarios of revenue forecast?
- In your opinion, what are the most important time horizons for which forecasts
are made?
- You execute F2 forecasting round; prioritize the following forecasts based on
their importance for strategic decision-making:
- Forecast of the next quarter
- Forecast of the current year
- Next year’s forecast
- Does order of priority change for F3 forecasting round, and if it does, why?
Challenges of Finanacial Forecasting
- What are the most characteristic problems related to forecasting in general?
- How does the inaccurate revenue forecast effect on the entire financial
forecasting?
- Identify the potential problems of forecasting from the group management’s
point of view?
Rolling Financial Forecasting
- How 4Q-rolling forecasting is utilized in Skanska and in your business unit?
- How 4Q-rolling forecasting should be utilized for example in order to improve
the steering effect of the rolling forecast?
Page 125
Future Visions and Needs of Financial Forecasting
- What would be the benefits of more accurate revenue forecasts from your
perspective?
- From your point of view, what should happen in order to improve the revenue
forecast accuracy and how that could be achieved?
Page 126
APPENDIX 6: Summary Statistics
Variable Mean Std Dev Minimum Maximum N
Target Revenue %
Secured Revenue %
Percentage Error
Absolut Percentage Error
Forecasting Accuracy Rate %
Forecasting Error (MEUR)
Absolut Forecasting Error (MEUR)
0.585
0.415
-0.046
0.109
0.891
-1.346
7.673
0.320
0.320
0.157
0.123
0.123
12.410
9.841
0.000
0.000
-0.599
0.000
0.401
-73.351
0.000
1.000
1.000
0.357
0.599
1.000
56.053
73.351
590
590
590
590
590
590
590
Page 127
APPENDIX 7: Box and Whisker - Absolut Percentage Error of Revenue Forecasting
Page 128
APPENDIX 8: Box and Whisker – Secured Revenue