Accurate Insights into the Runtime Topology of Application Landscapes 1 Preface In 2010, I was implementing a registry of web service interconnections by using the free version of the product CentraSite. Being quite SOA-minded and, under the influence of “Views and Beyond…” [1], wishing to approach the matter from the component-and-connector (C&C) perspective, I was in a way disappointed with the product. Incidentally, at that time, I was impressed with multiagent-based simulations and spatial visualizations of agent interactions. The combination of all this led me to start thinking of a better tool. Branimir Cace, my nephew and good friend, produced a prototype which we successfully fed with real-life data (see https://www.youtube.com/watch?v=2UdF2iqEYfw). Encouraged by that success, we embarked on building the product SoaScape (https://en- en.soascape.org/), a tool intended to provide for the administration of application interconnections and 3D visualizations of application landscapes. A year later, with Bastiaan Verhoef, we added the ability to process, for the most part automatically, the information about web service interconnections retrieved from Layer7 Gateways. Since then, enterprise computing has progressed, and SOA has become mainstream. The hype over service registries is over, the delusional trust in enterprise service bus (ESB)-solutions has vanished, and enterprise application integration is moving toward a cleaner architecture based on standardized interconnections. In addition, the need to have accurate insights into the runtime topology of enterprise application components is more apparent today than it was when I started with the SoaScape project. This has all motivated me to write an article about the ideas used as foundations for SoaScape. While I felt the need to inform the reader about the background of the ideas brought forward in the article, I also wanted to avoid creating the impression of covert advertising of the product. Therefore, I have used the preface to explain why I have written on this subject, and I have kept the rest of the article outside of the context of SoaScape. A note about the use of the terms “IT operations” and “application” in this article: These two terms have no rigorous definitions, and their use throughout the text may cause misunderstanding. The following is what they are intended to mean: IT operations In classic definitions, the term encompasses processes and services administered by an organization’s IT department. However, with the popularity of cloud services and DevOps, the same processes may neither be under the control of an internal department nor centrally managed at all. Lacking a more appropriate term, with “IT operations,” I am referring to all (relevant in a given context) IT operational processes and services carried out by one or more internal or external teams. Application This term is used to denote “application components” in the same sense as it is defined in the ArchiMate standard: “An application component is a self-contained unit. As such, it is independently deployable, reusable, and replaceable. An application component performs one or more application functions. It encapsulates its behavior and data, exposes services, and makes them available through interfaces” [2]. In essence, it is a software component that provides a business functionality, as contrasted to infrastructure components.
Transcript
Accurate Insights into the Runtime Topology of Application Landscapes
1 Preface In 2010, I was implementing a registry of web service interconnections by using the free version of the product CentraSite. Being quite SOA-minded and, under the influence of “Views and Beyond…” [1], wishing to approach the matter from the component-and-connector (C&C) perspective, I was in a way disappointed with the product. Incidentally, at that time, I was impressed with multiagent-based simulations and spatial visualizations of agent interactions. The combination of all this led me to start thinking of a better tool. Branimir Cace, my nephew and good friend, produced a prototype which we successfully fed with real-life data (see https://www.youtube.com/watch?v=2UdF2iqEYfw). Encouraged by that success, we embarked on building the product SoaScape (https://en-en.soascape.org/), a tool intended to provide for the administration of application interconnections and 3D visualizations of application landscapes. A year later, with Bastiaan Verhoef, we added the ability to process, for the most part automatically, the information about web service interconnections retrieved from Layer7 Gateways.
Since then, enterprise computing has progressed, and SOA has become mainstream. The hype over service registries is over, the delusional trust in enterprise service bus (ESB)-solutions has vanished, and enterprise application integration is moving toward a cleaner architecture based on standardized interconnections. In addition, the need to have accurate insights into the runtime topology of enterprise application components is more apparent today than it was when I started with the SoaScape project. This has all motivated me to write an article about the ideas used as foundations for SoaScape.
While I felt the need to inform the reader about the background of the ideas brought forward in the article, I also wanted to avoid creating the impression of covert advertising of the product. Therefore, I have used the preface to explain why I have written on this subject, and I have kept the rest of the article outside of the context of SoaScape.
A note about the use of the terms “IT operations” and “application” in this article: These two terms have no rigorous definitions, and their use throughout the text may cause misunderstanding. The following is what they are intended to mean:
IT operations In classic definitions, the term encompasses processes and services administered by an organization’s IT department. However, with the popularity of cloud services and DevOps, the same processes may neither be under the control of an internal department nor centrally managed at all. Lacking a more appropriate term, with “IT operations,” I am referring to all (relevant in a given context) IT operational processes and services carried out by one or more internal or external teams.
Application This term is used to denote “application components” in the same sense as it is defined in the ArchiMate standard: “An application component is a self-contained unit. As such, it is independently deployable, reusable, and replaceable. An application component performs one or more application functions. It encapsulates its behavior and data, exposes services, and makes them available through interfaces” [2]. In essence, it is a software component that provides a business functionality, as contrasted to infrastructure components.
B. Cace: Accurate Insights into the Runtime Topology of Application Landscapes
2 / 24
2 Introduction Information systems increasingly interact with each other. Technology has enabled one to easily integrate separately developed application components, and interactions between applications have become ubiquitous in most modern business solutions. Business processes are supported by multiple components that interact without human interposition.
This has led to the necessity of having insight into the integral whole, the “enterprise application landscape.” A critical part of this insight is knowing all existing application-to-application interconnections, especially when dealing with the proliferation of API interactions. However, many organizations do not keep a record of these interconnections, and if they do, it is most commonly created through surveys and periodic inventorying. In other words, many large organizations lack overall knowledge about how applications interact [3].
It could be argued that organizations do not really need to be concerned with centrally maintaining information about application interconnections. Individual business departments or cloud vendors take care of whatever is needed regarding application integration, and thus, having integral insights is of no significant value. Explicitly discussing this point of view would go beyond the scope of this article. In brief, the issues associated with dependencies between applications can be dealt with only from an integral viewpoint, which is not distracted by infrastructure boundaries, business domains, solution vendors, and other matters.
A more likely reason for not keeping accurate information about interconnections is the complexity associated with it. Enterprise application landscapes, with their numerous applications and interconnections, evolve from individual business solutions, rather than being centrally architected and planned in some rigorous manner. Consequently, it is not possible to maintain the knowledge of actual application landscapes in a top-down process; the knowledge has to come from looking at the actual “as is” situation rather than from design documents.
This article addresses this issue by proposing deriving information about application interconnections from IT operations data and creating architecture views from that information.
The premise is that it should be possible to collect basic but accurate information about existing interconnections. Presumably, applications are functioning, and the IT is adequately managed (there is no point discussing dysfunctional organizations). Therefore, information about interconnections should be retrievable somehow or somewhere, as those interactions are being managed and also most often configured in standardized integration components. This information would need to be for the most part collected programmatically, thus without requiring significant human input and correction.
Indeed, there are obstacles here: we cannot just straightforwardly collect what is needed because application integration is not supported by a homogeneous integration layer, let alone the security and confidentiality implications of collecting such data. Similarly, it is not a common practice for IT operations to maintain a central registry of application interconnections. However, practical approaches do exist, and some organizations have implemented such registries without significant costs. The need to build enterprise architecture models through automated data collection from IT infrastructure is recognized among researchers [4].
B. Cace: Accurate Insights into the Runtime Topology of Application Landscapes
3 / 24
Nonetheless, for the sake of argument, let us assume that the data concerning interconnections are available and can be maintained in a registry. What is discussed here is the following:
a) How does one represent the diversity of application interconnections while one is limited to information obtainable from IT operations only? In other words, how can one structure information in a model that adequately provides for creating expressive architecture views?
b) What is the value of that information for the organization?
The model being proposed is based on the following:
• Integration styles—top-level enterprise application integration (EAI) patterns—that guide the categorization of interconnections.
• The C&C approach in describing system architectures. The aim is the ability to programmatically create architecture views from data retrieved from IT operations.
To reiterate, the goal is to produce, by using information from IT operations, accurate and useful architecture views depicting “as is” application interconnections. How to collect that information is not within the scope of this article. However, the idea is not to collect data through full automation and to rely exclusively on IT operations. I believe that full automation is not possible. Furthermore, the information may need to be augmented with information drawn from other sources when it is advantageous to do so. This last statement will be elaborated when discussing integration styles.
Figure 1. Approach to creating application landscape views
3 Categorization of application interconnections: Enterprise application integration patterns
A prerequisite for producing a usable model is categorizing interconnections. “Interconnection” is a generalized concept that includes different integration mechanisms which may have nothing in common; therefore, we need more specific elements for our model.
The field of EAI is a natural choice to look for an established categorization of integration mechanisms. Although EAI is still advancing and new products providing advanced features continue to emerge, the underlying integration approaches that enable applications to interact have been stable for many years. Accordingly, the integration technology that supports application interconnections has been stabilized and is, in essence, an infrastructural commodity. This includes many technical standards (WSDL/SOAP, Open API, JMS, AMQP, etc.), application platform integration features (API frameworks in Java and .NET, etc.), established integration product categories (API gateway, Message Bus, etc.), and some prominent open source products (NGINX, Apache Kafka, etc.).
B. Cace: Accurate Insights into the Runtime Topology of Application Landscapes
4 / 24
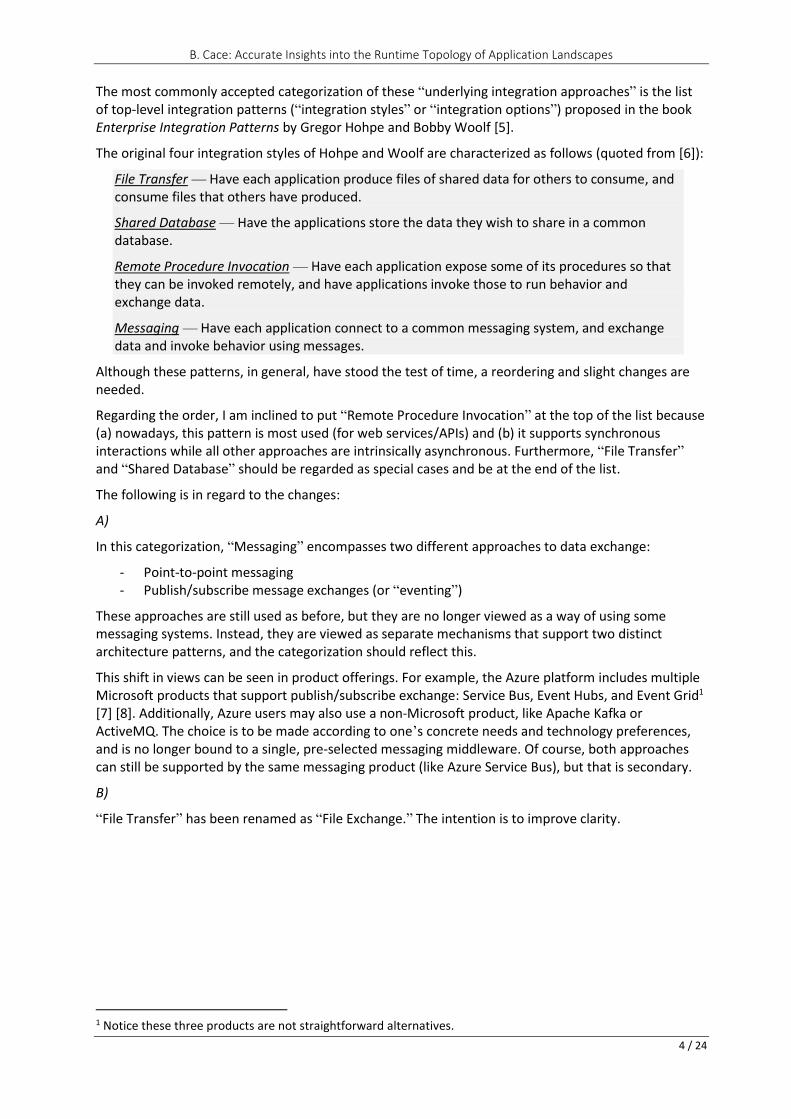
The most commonly accepted categorization of these “underlying integration approaches” is the list of top-level integration patterns (“integration styles” or “integration options”) proposed in the book Enterprise Integration Patterns by Gregor Hohpe and Bobby Woolf [5].
The original four integration styles of Hohpe and Woolf are characterized as follows (quoted from [6]):
File Transfer — Have each application produce files of shared data for others to consume, and consume files that others have produced.
Shared Database — Have the applications store the data they wish to share in a common database.
Remote Procedure Invocation — Have each application expose some of its procedures so that they can be invoked remotely, and have applications invoke those to run behavior and exchange data.
Messaging — Have each application connect to a common messaging system, and exchange data and invoke behavior using messages.
Although these patterns, in general, have stood the test of time, a reordering and slight changes are needed.
Regarding the order, I am inclined to put “Remote Procedure Invocation” at the top of the list because (a) nowadays, this pattern is most used (for web services/APIs) and (b) it supports synchronous interactions while all other approaches are intrinsically asynchronous. Furthermore, “File Transfer” and “Shared Database” should be regarded as special cases and be at the end of the list.
The following is in regard to the changes:
A)
In this categorization, “Messaging” encompasses two different approaches to data exchange:
These approaches are still used as before, but they are no longer viewed as a way of using some messaging systems. Instead, they are viewed as separate mechanisms that support two distinct architecture patterns, and the categorization should reflect this.
This shift in views can be seen in product offerings. For example, the Azure platform includes multiple Microsoft products that support publish/subscribe exchange: Service Bus, Event Hubs, and Event Grid1 [7] [8]. Additionally, Azure users may also use a non-Microsoft product, like Apache Kafka or ActiveMQ. The choice is to be made according to one’s concrete needs and technology preferences, and is no longer bound to a single, pre-selected messaging middleware. Of course, both approaches can still be supported by the same messaging product (like Azure Service Bus), but that is secondary.
B)
“File Transfer” has been renamed as “File Exchange.” The intention is to improve clarity.
1 Notice these three products are not straightforward alternatives.
B. Cace: Accurate Insights into the Runtime Topology of Application Landscapes
5 / 24
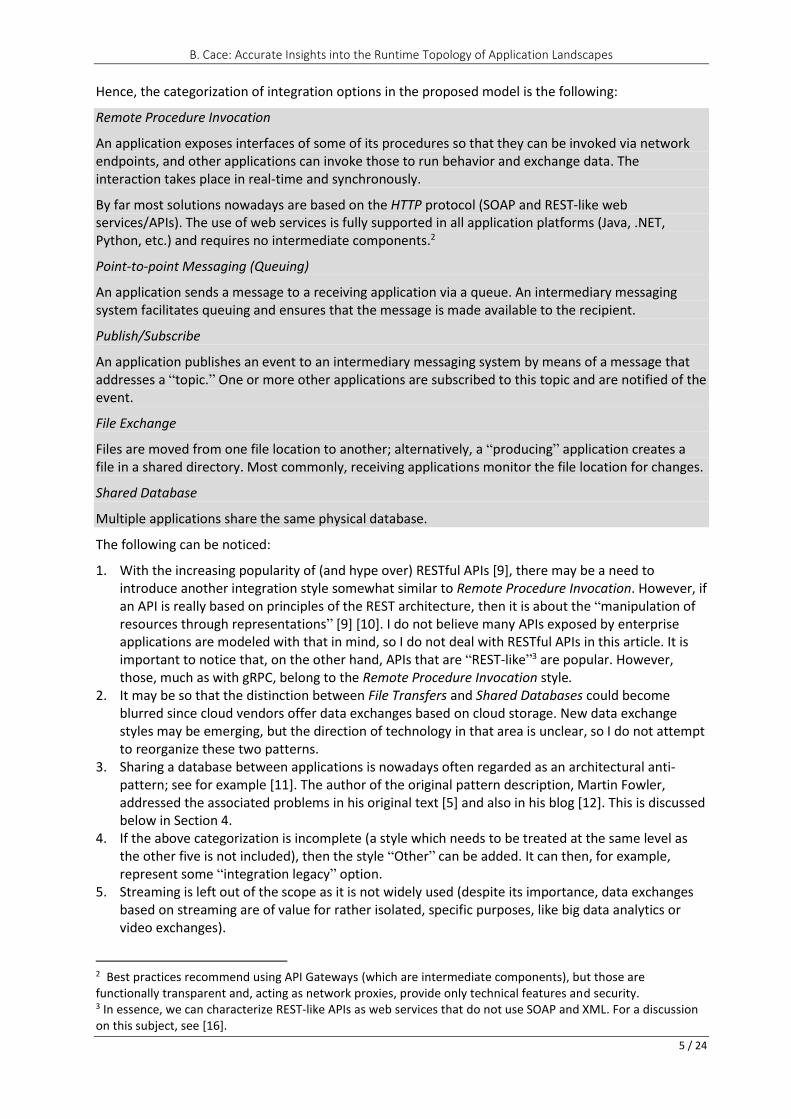
Hence, the categorization of integration options in the proposed model is the following:
Remote Procedure Invocation
An application exposes interfaces of some of its procedures so that they can be invoked via network endpoints, and other applications can invoke those to run behavior and exchange data. The interaction takes place in real-time and synchronously.
By far most solutions nowadays are based on the HTTP protocol (SOAP and REST-like web services/APIs). The use of web services is fully supported in all application platforms (Java, .NET, Python, etc.) and requires no intermediate components.2
Point-to-point Messaging (Queuing)
An application sends a message to a receiving application via a queue. An intermediary messaging system facilitates queuing and ensures that the message is made available to the recipient.
Publish/Subscribe
An application publishes an event to an intermediary messaging system by means of a message that addresses a “topic.” One or more other applications are subscribed to this topic and are notified of the event.
File Exchange
Files are moved from one file location to another; alternatively, a “producing” application creates a file in a shared directory. Most commonly, receiving applications monitor the file location for changes.
Shared Database
Multiple applications share the same physical database.
The following can be noticed:
1. With the increasing popularity of (and hype over) RESTful APIs [9], there may be a need to introduce another integration style somewhat similar to Remote Procedure Invocation. However, if an API is really based on principles of the REST architecture, then it is about the “manipulation of resources through representations” [9] [10]. I do not believe many APIs exposed by enterprise applications are modeled with that in mind, so I do not deal with RESTful APIs in this article. It is important to notice that, on the other hand, APIs that are “REST-like”3 are popular. However, those, much as with gRPC, belong to the Remote Procedure Invocation style.
2. It may be so that the distinction between File Transfers and Shared Databases could become blurred since cloud vendors offer data exchanges based on cloud storage. New data exchange styles may be emerging, but the direction of technology in that area is unclear, so I do not attempt to reorganize these two patterns.
3. Sharing a database between applications is nowadays often regarded as an architectural anti-pattern; see for example [11]. The author of the original pattern description, Martin Fowler, addressed the associated problems in his original text [5] and also in his blog [12]. This is discussed below in Section 4.
4. If the above categorization is incomplete (a style which needs to be treated at the same level as the other five is not included), then the style “Other” can be added. It can then, for example, represent some “integration legacy” option.
5. Streaming is left out of the scope as it is not widely used (despite its importance, data exchanges based on streaming are of value for rather isolated, specific purposes, like big data analytics or video exchanges).
2 Best practices recommend using API Gateways (which are intermediate components), but those are functionally transparent and, acting as network proxies, provide only technical features and security. 3 In essence, we can characterize REST-like APIs as web services that do not use SOAP and XML. For a discussion on this subject, see [16].
B. Cace: Accurate Insights into the Runtime Topology of Application Landscapes
6 / 24
4 Component-and-connector approach The C&C viewpoint4 [13] [1] [14] for describing the architecture of a system is focused on the architectural structure. The representation of a system consists of two types of elements: runtime components (units of computation) and connectors of various distinct types that enable and mediate interactions between components. Components interact with each other only via connectors which define how communication between components can take place. The C&C paradigm can be used to describe any system or software architecture. In the context of this article, I deal with the enterprise architecture level only.
Connectors are characterized by their type and a number of properties,5 depending on the type. In our model, the connector types are “integration styles,” as proposed in the previous paragraph. Each connector type also has a set of “roles” associated with it. A component interacting via a connector with another component must then take a specific role in that interaction. For example, in the case of publish/subscribe interconnections, a component can be attached to a “topic” connector by taking the role of either a “publisher” or a “subscriber.”
Components are also characterized by their type and properties. In the context of our subject, the type is used to denote a different level of composition or aggregation. For example, we could view an information system (a logical cluster of application components) as a single component and show how that system is connected to the rest of the application landscape and the external environment of the organization. As one more example, we can model the entire organization as a single component and thus show the external interconnections in a view (see further below). Connectors are attached to components via components’ “ports.” Thus, a component interface connection point is called a port, and a connector interface connection point is called a role.
A C&C view consists of instances of component types and instances of connector types. Relations that associate components with connectors thus form a graph that represents a runtime topology of a concrete system.
Figure 2. Example C&C view with ports and roles
It can be noted that the C&C views, in general, allow either roles or ports to be left out; it is a modeling decision what semantics is assigned where. For example, if a certain component type can have only one port, specifying that port on component instances is superfluous. The semantics of that port can therefore be assigned to the component, and by omitting these ports altogether we can improve the clarity and the expressiveness of the view.
A C&C view may include components at different composition levels, which allows for hierarchical decomposition. This is to say, in our context, we may specify information systems, their subsystems, and individual application components, all intermixed and/or shown as composition. In terms of C&C views, applications from our model are represented as primitive components (as opposed to
4 The C&C paradigm has been developed by the Software Engineering Institute (https://www.sei.cmu.edu/) of Carnegie Mellon University. 5 “Property” is additional information that is not an element itself.
B. Cace: Accurate Insights into the Runtime Topology of Application Landscapes
7 / 24
composite components that consist of multiple applications). This does not hold for connectors – in the proposed C&C views, all connectors are primitive.
Figure 3. Composition of components
Component-and-connector architecture views [1] are exactly the sort of views we are aiming for. Therefore, in modeling the information obtained from IT operations, we need to accommodate for this approach and represent applications and their interconnections in a way that is suitable for creating C&C views.
5 The proposed model
5.1 Introduction
The views we intend to produce should describe the enterprise application landscape in terms of two kinds of elements: components and connectors. Generally speaking, components will represent applications, and connectors will represent interconnections. As our aim is to create insights into application interconnections, and the input data we are building the model on primarily concerns interconnections, the model is focused on connectors. Therefore, I define the model by first elaborating on interconnections, and subsequently, I proceed with applications by viewing them as components that are attached to connectors.
It can be noticed that, by using the integration styles as connector types, we are also introducing a strict demarcation between the business functionality and the technique. Application components provide the business functionality, and the connectors enable interactions by providing technical capabilities of a specific type. The only functional aspect of the interaction associated directly with the connector is an identifier defining the concrete instance of the connector. In other words, the model does not allow business logic to be a part of a connector. By saying this, we implicitly impose restrictions on modeling integration products – semantics such as content-based message routing or service orchestration, for example, may not be assigned to connectors. Consequently, integration brokers (also known as ESBs) would often have to be modeled as components. This is not a shortcoming, but rather a welcome characteristic reflecting the best practices of EAI; if an ESB uses business logic in processing messages, it has to be regarded as an application component.
The model needs to include representations of real-life entities that are essential for constructing C&C elements. For example, the model must represent queues, topics, and web services. However, for coherence and completeness, it is of use to include representations of other real-life entities. Therefore, the model also contains the following elements:
B. Cace: Accurate Insights into the Runtime Topology of Application Landscapes
8 / 24
Integration components – Free-standing intermediaries execute a system software to facilitate interactions, such as API gateways, message brokers, FTP servers, and database servers (not all interconnections need to use such facilities).
Server units – IT operations may also maintain information about the physical allocation6 of components and system software products (such as API gateway).
Business units – IT operations maintain information about the ownership of applications.
It can be noticed that these elements of the model may not be represented as such in C&C views. Instead, the needed information can be conveyed through property values.
It should be pointed out that not all elements of the proposed model are one-on-one representations of real-life entities. Although such a representation is a preference, it is not always possible, as in the case of file exchange interconnections (discussed further below).
5.2 Representing interconnections
Interconnections will be represented by C&C elements. These elements are subdivided into types in accordance with integration styles: each connector type represents an integration style.
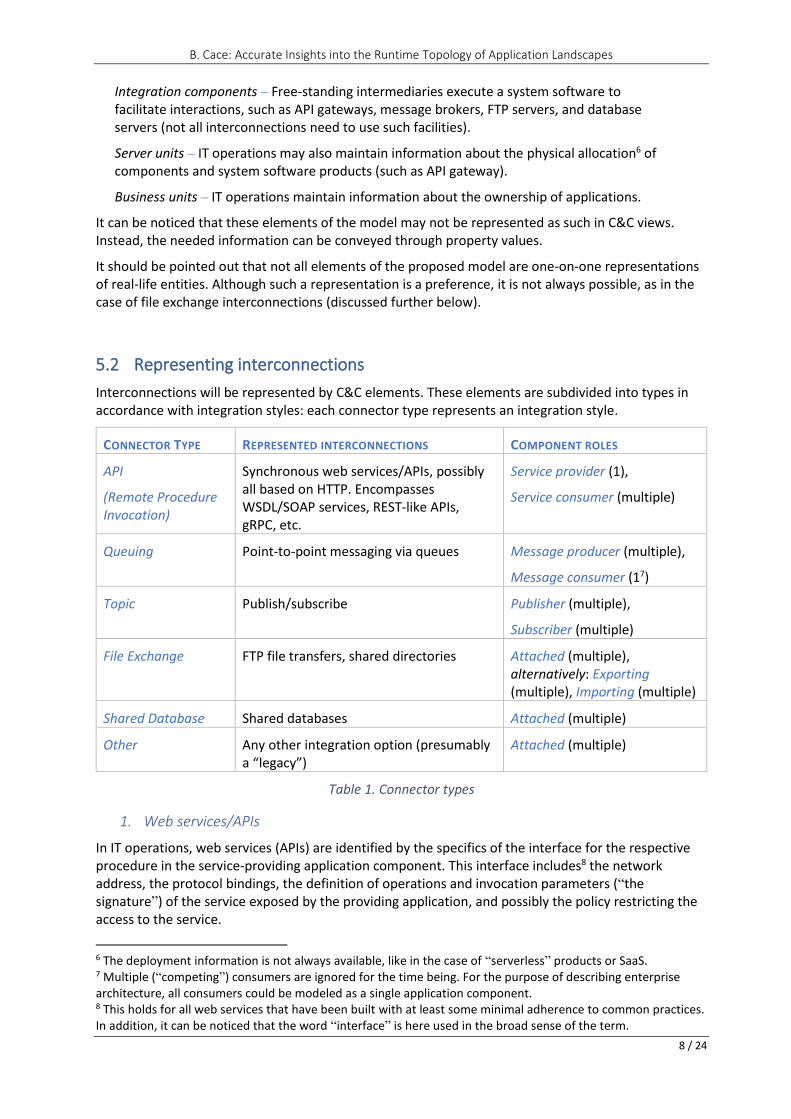
CONNECTOR TYPE REPRESENTED INTERCONNECTIONS COMPONENT ROLES
API
(Remote Procedure Invocation)
Synchronous web services/APIs, possibly all based on HTTP. Encompasses WSDL/SOAP services, REST-like APIs, gRPC, etc.
Service provider (1),
Service consumer (multiple)
Queuing Point-to-point messaging via queues Message producer (multiple),
Other Any other integration option (presumably a “legacy”)
Attached (multiple)
Table 1. Connector types
1. Web services/APIs
In IT operations, web services (APIs) are identified by the specifics of the interface for the respective procedure in the service-providing application component. This interface includes8 the network address, the protocol bindings, the definition of operations and invocation parameters (“the signature”) of the service exposed by the providing application, and possibly the policy restricting the access to the service.
6 The deployment information is not always available, like in the case of “serverless” products or SaaS. 7 Multiple (“competing”) consumers are ignored for the time being. For the purpose of describing enterprise architecture, all consumers could be modeled as a single application component. 8 This holds for all web services that have been built with at least some minimal adherence to common practices. In addition, it can be noticed that the word “interface” is here used in the broad sense of the term.
B. Cace: Accurate Insights into the Runtime Topology of Application Landscapes
9 / 24
A web service can be exposed on multiple addresses (points of access). At least one point of access (or “endpoint”) is always exposed by the providing component; additional endpoints can be made available via API gateways that provide supplementary technical capabilities and specific access policies.
In each web service interaction, we always have one service-providing application (in C&C terms, attached component acting in the role of service provider) and one consuming application (attached component acting in the role of service consumer). Multiple consuming applications can connect to the same endpoint.
In summary, all API interconnections can be modeled as follows:
Figure 4. Model representing API interconnections
In essence, API connectors represent the endpoints of this model. However, the existence of multiple endpoints exposing the same service commonly goes beyond architecture concerns. Therefore, in most cases, it would be of advantage to omit endpoints from the view and use connector elements to represent services. In other words, the view is reduced to the functionally relevant elements only.
In case we need to show endpoints, they would be represented as connectors, and the semantics of services would need to be assigned to ports. It can be noticed that this does not impose restrictions on visualizing applications and interconnections in a graph: Ports may be visualized as free-standing nodes, thus not necessarily “glued” to components as in Figure 2.
Figure 5 shows both options for visualizing web service interconnections between three application components. In this example case, Application0 exposes web service SRV via two endpoints; Application1 consumes this service via EP1 and Application2 via EP2. Attachment through the role of “Service provider” is shown in orange (thick line), and the “Service consumer” role is shown in blue (thin line).
Some may remark that showing connectors as nodes is not common in graph visualizations of C&C views. This is discussed in Section 6.
B. Cace: Accurate Insights into the Runtime Topology of Application Landscapes
10 / 24
Figure 5. Two C&C views visualizing the same components and API interconnections
2. Point-to-point messaging (queues) and publish-subscribe (topics)
Unlike in the case of API interconnections, where there is a reference to the provided functionality (a service), point-to-point messaging and publish-subscribe interconnections are purely data-oriented so far as IT operation is concerned. A queue or a topic is an entity (pre-configured or dynamically created) that provides the pathway for data exchange and is represented by a connector with the same name.
Point-to-point messaging and publish-subscribe are modeled as follows:
Figure 6. Model representing point-to-point messaging and publish/subscribe
In a C&C view, components attached to a queue connector have the role of a message producer or a message consumer. Similarly, components attached to a topic connector have the role of a publisher (generating events) or a consumer (receiving events).
3. File exchange
Integration through exchange or sharing of files is a popular choice for so-called offline interactions. It can be realized in different ways and also with or without using a specific supporting product (an FTP
B. Cace: Accurate Insights into the Runtime Topology of Application Landscapes
11 / 24
server or an enterprise file synchronization and sharing product,9 for example). The proposed model will not attempt to structure the variety of technical mechanisms, because it is not of architectural concern.
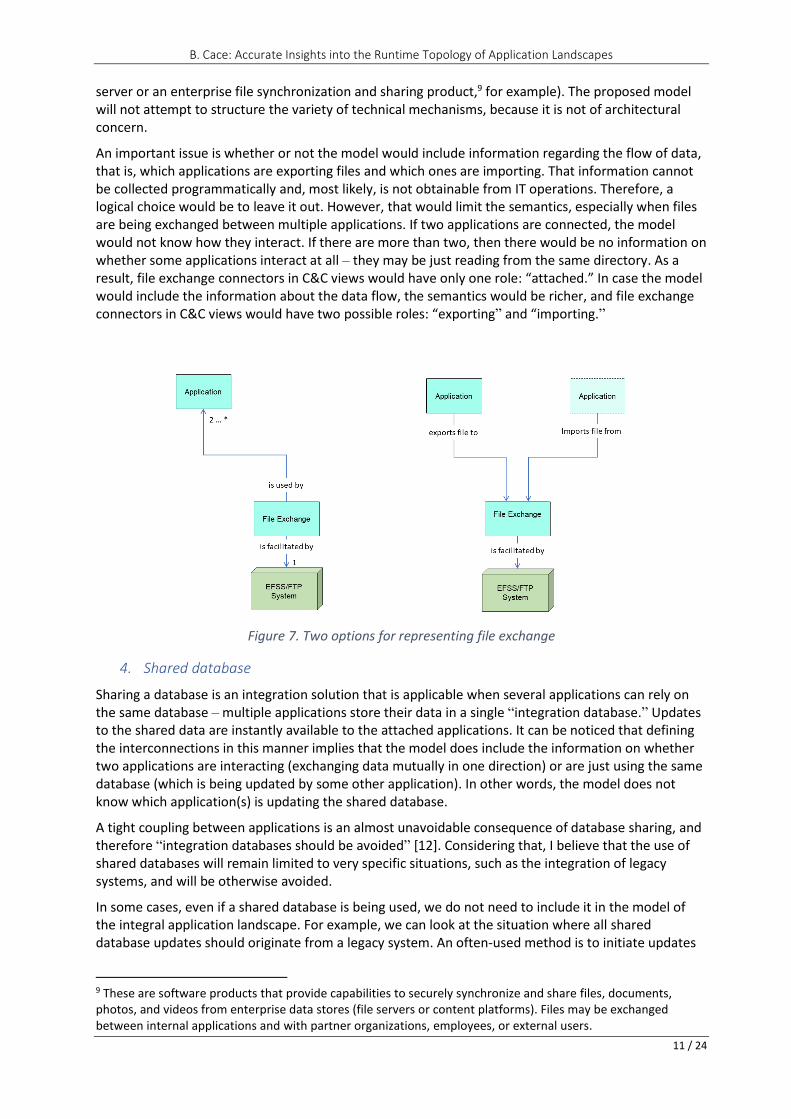
An important issue is whether or not the model would include information regarding the flow of data, that is, which applications are exporting files and which ones are importing. That information cannot be collected programmatically and, most likely, is not obtainable from IT operations. Therefore, a logical choice would be to leave it out. However, that would limit the semantics, especially when files are being exchanged between multiple applications. If two applications are connected, the model would not know how they interact. If there are more than two, then there would be no information on whether some applications interact at all – they may be just reading from the same directory. As a result, file exchange connectors in C&C views would have only one role: “attached.” In case the model would include the information about the data flow, the semantics would be richer, and file exchange connectors in C&C views would have two possible roles: “exporting” and “importing.”
Figure 7. Two options for representing file exchange
4. Shared database
Sharing a database is an integration solution that is applicable when several applications can rely on the same database – multiple applications store their data in a single “integration database.” Updates to the shared data are instantly available to the attached applications. It can be noticed that defining the interconnections in this manner implies that the model does include the information on whether two applications are interacting (exchanging data mutually in one direction) or are just using the same database (which is being updated by some other application). In other words, the model does not know which application(s) is updating the shared database.
A tight coupling between applications is an almost unavoidable consequence of database sharing, and therefore “integration databases should be avoided” [12]. Considering that, I believe that the use of shared databases will remain limited to very specific situations, such as the integration of legacy systems, and will be otherwise avoided.
In some cases, even if a shared database is being used, we do not need to include it in the model of the integral application landscape. For example, we can look at the situation where all shared database updates should originate from a legacy system. An often-used method is to initiate updates
9 These are software products that provide capabilities to securely synchronize and share files, documents, photos, and videos from enterprise data stores (file servers or content platforms). Files may be exchanged between internal applications and with partner organizations, employees, or external users.
B. Cace: Accurate Insights into the Runtime Topology of Application Landscapes
12 / 24
via database triggers in a “master” database.10 Alternatively, a Master Data Management (MDM) product can be used. Other applications can then use the shared database and expose its contents through APIs. In this case, at least from the perspective of examining interconnections in the integral application landscape, we would be better off to model the legacy system and all its “satellite” applications as a single application.
Shared database connectors in C&C views will have only one role (“attached”).
Figure 8. Model representing shared database
5.3 Representing applications
It is straightforward that we have to represent applications as C&C components. However, it needs to be emphasized what an application is.
The term “application” is used to mean a component (which provides business functionality) as identified from the perspective of IT operations when dealing with interconnections. In other words, the managed interconnections demarcate application components. This approach is needed to ensure that the model reflects the real-life topology of the application landscape.
A somewhat adverse consequence of the choice to model application components in this way is that the C&C view produced from this model would intermix components that are otherwise perceived as being at different a composition level. For example, a complete SaaS solution may be a component on the same level as a custom-developed “microservice,” and those two can be interconnected as such. However, this reflects the factual situation that, although we know that the SaaS solution in question is not a monolith, the inner structure of it is beyond the knowledge and concern of the organization using it. All that is available are interfaces; in other words, we cannot “drill down” in the model below the level of registered interconnections.
10 This solution is also known as the operational data store (ODS) pattern.
B. Cace: Accurate Insights into the Runtime Topology of Application Landscapes
13 / 24
The model additionally includes entities showing the “business ownership” of applications. Those entities (business units) represent departments or teams (or, in the case of an external application, a partner organization) that are responsible for the functionality of application components. The model allows for the representation of organizational hierarchies: Business units may be a part of a larger entity.
It can be noticed that it is not the intention to show business units as such in C&C views. Instead, an owning business unit can be (if needed) viewed as a container encompassing multiple applications. If included in a C&C view, components corresponding to business units would be seen as clusters of applications. The aim is then to provide insights into how the owned applications (as a group) interconnect with other applications (see Figure 17 further below).
Figure 9. Model representing (application) components
The intention is to provide C&C views that can be used at all levels in the organization; therefore, we need to consider that applications are being dealt with on different levels of abstraction, depending on the concerns one has. For example, if some views are aimed toward the strategic level in the organization, then there is a need to group some applications as parts of some more abstract components. In other words, the model must also be flexible enough to allow for possible discrepancies between different viewpoints.
Applications, as defined from the perspective of interconnections and prevalently from the data retrieved from IT operations, are the “primary” component elements of C&C views. Additionally, the model also provides for higher level, container-like entities that would be composed of applications (which is a “part-of” relationship). Such containers, or “application clusters,” can then also be nested so we can have multiple levels of composition if needed.
The “part-of” relationship between applications and the application clusters must belong to the same composition hierarchy as the business-ownership relationship (also a “part-of” relationship). This is to say that the business owner of the application also owns the clusters that include the application. The following figure depicts this.
Figure 10. Added definition of application clusters
B. Cace: Accurate Insights into the Runtime Topology of Application Landscapes
14 / 24
To reiterate, these model entities (applications, application clusters, and business units) are all depicted in C&C views as components.
It is important to notice that IT operations cannot be the source of information about how applications should be clustered into entities of a higher level of abstraction. This means that the information obtained from IT operations should be merged with information retrieved from elsewhere, such as an enterprise architecture tool or an application portfolio management tool.11
5.4 Dealing with limited information
One of the underlying ideas of the proposed approach is to use IT operations as the primary source of information while limiting the use of other sources. The rationale is that a more intensive use of other sources would either undercut the accuracy of or significantly increase the efforts for collecting data. Consequently, only limited information about the functional aspects of interconnections is available; (business) functionality is simply not a responsibility of IT operations. The available information has only to do with making interconnections work and little more than that. In other words, we can deduce the structure, but we cannot conclude much about its purpose.
However, this limitation can be minimized and should not be seen as a shortcoming that would invalidate the approach. The main purpose of maintaining an accurate record of all application interconnections is to create a basis for viewing the application landscape as an integrated whole. That is to say, it is to have the ability to navigate through interconnections in any way needed and without being hampered by not knowing for sure what is there and what is not. Once we have such information in a registry, we can improve the usability of views created from that registry in two ways.
First, if additional (structured) information concerning either applications or interconnections is available elsewhere, it can be merged into the registry. For example, if there is a well-maintained application portfolio registry, it can provide additional information about applications.
Second, the user interface of architecture views may allow for drill-down navigation into other sources of information. Application and interconnection elements can include a property that provides a link to other sources, such as a document store with design documents, an enterprise architecture repository, or an API registry. The user would then switch to another source and possibly to another tool, but this cannot be of major concern.
6 Interactive 3D visualizations Using C&C views implies representing application landscapes as a graph structure (as stated in [1], “The relations of a C&C view associate components with connectors to form a graph that represents a runtime system configuration”).
Before proceeding with the subject of this section, I want to emphasize that the graph structure of the proposed model does not need to be explicitly presented as a graph. The graph structure from the model can be pragmatically transformed into a table or a hierarchical display that is familiar to users. Thus, we may use a tabular or a tree format to convey the information, and this is likely to be sufficient for many purposes.
11 Discussing merging is beyond the scope of this article.
B. Cace: Accurate Insights into the Runtime Topology of Application Landscapes
15 / 24
For example, we may present information in a table where a number of columns would show roles per connector type, and the field values would be lists of connectors.
Component name
Service provider
Service consumer
Message producer
Message consumer
Publisher Subscriber, exporting files, etc.
applA service1, service2 …
applX:serv5, applZ:serv1, …
queueX queueY topic1, topic2 …
Figure 11. Showing components and connectors in a table
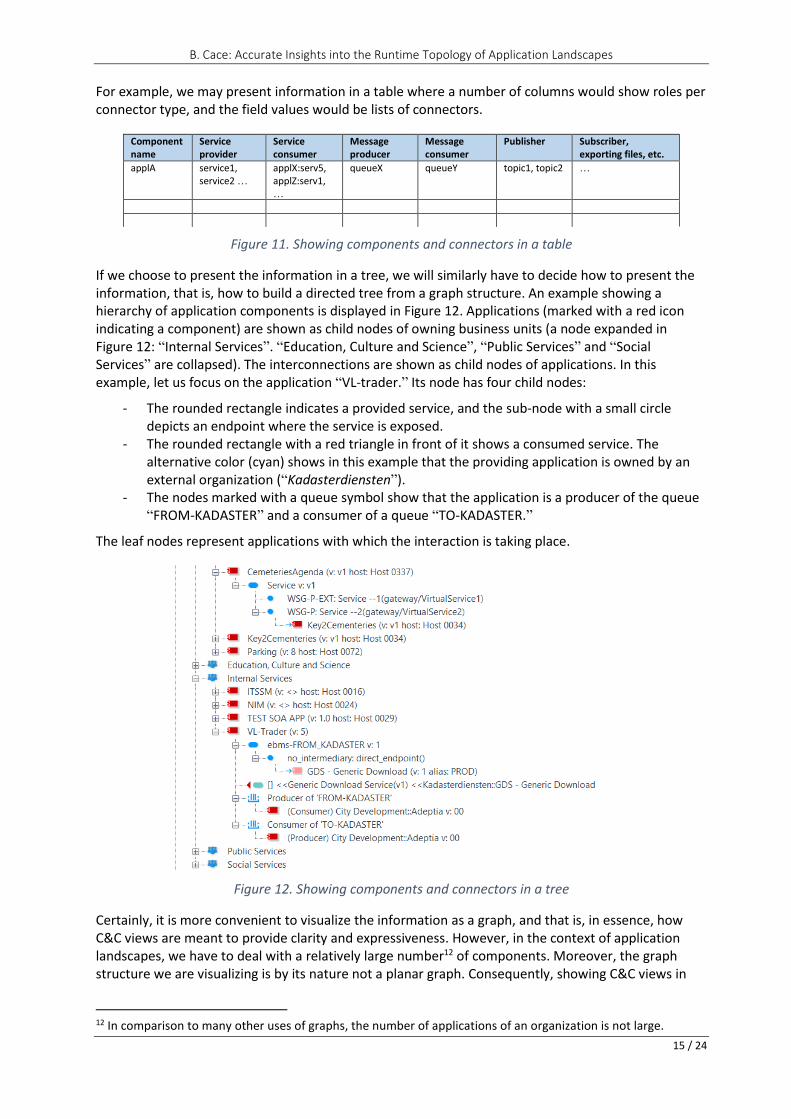
If we choose to present the information in a tree, we will similarly have to decide how to present the information, that is, how to build a directed tree from a graph structure. An example showing a hierarchy of application components is displayed in Figure 12. Applications (marked with a red icon indicating a component) are shown as child nodes of owning business units (a node expanded in Figure 12: “Internal Services”. “Education, Culture and Science”, “Public Services” and “Social Services” are collapsed). The interconnections are shown as child nodes of applications. In this example, let us focus on the application “VL-trader.” Its node has four child nodes:
- The rounded rectangle indicates a provided service, and the sub-node with a small circle depicts an endpoint where the service is exposed.
- The rounded rectangle with a red triangle in front of it shows a consumed service. The alternative color (cyan) shows in this example that the providing application is owned by an external organization (“Kadasterdiensten”).
- The nodes marked with a queue symbol show that the application is a producer of the queue “FROM-KADASTER” and a consumer of a queue “TO-KADASTER.”
The leaf nodes represent applications with which the interaction is taking place.
Figure 12. Showing components and connectors in a tree
Certainly, it is more convenient to visualize the information as a graph, and that is, in essence, how C&C views are meant to provide clarity and expressiveness. However, in the context of application landscapes, we have to deal with a relatively large number12 of components. Moreover, the graph structure we are visualizing is by its nature not a planar graph. Consequently, showing C&C views in
12 In comparison to many other uses of graphs, the number of applications of an organization is not large.
B. Cace: Accurate Insights into the Runtime Topology of Application Landscapes
16 / 24
two-dimensional drawings (which is a common practice) is inadequate if we want to deal with application landscapes in an integral manner.
Considering the present-day trends of reducing the use of paper documents, I believe that C&C graphs should be primarily used on screen and visualized in 3D.
This section has summarized some explorations in that direction. One must keep in mind that the approach has been entirely domain specific13 and pragmatically aimed to experiment and produce results, rather than to investigate the matter from a theoretical perspective.
1. Differentiating between API-based interconnections and other interconnection types
API interconnections facilitate remote procedure invocations, while other interconnections provide for data exchanges, which is a different interaction paradigm. Additionally, API interconnections are by far the most numerous and, in most organizations, are used more than are all other types combined.
For these two reasons, API connectors are shown differently. Further, endpoints are not shown; connectors are associated with services (see Section 5.2 and Figure 5).
2. Visualizing components and connectors
The choice is to represent connectors with nodes and not with edges, because visualizing different types of edges (and labeling them to indicate their semantics) would lead to messy visualizations.
The element types are indicated by different icons and are color-coded; in examples shown, connectors are always displayed in blue, and the primitive components are always displayed in red (or, if externally owned, in pink). Elements may be displayed as 3D objects of different shapes or as “billboards,” always facing the user but resized according to their spatial position.
The roles are indicated in different ways:
a) In the case of queues and topic connectors, roles are indicated by the place where the connecting line (edge) attaches to the connector-icon.
b) API connectors have a fixed distance to the providing application, and the consuming applications are farther away. The link to the providing application (edge) is shown in a different color.
c) File exchange and database connectors do not differentiate roles.
It can be noticed that the graph is always implicitly directed. There are two sorts of nodes – components and connector components – and the nodes of the same sort are never directly connected.
13 That is, it concerns only the topology of application landscapes.
B. Cace: Accurate Insights into the Runtime Topology of Application Landscapes
17 / 24
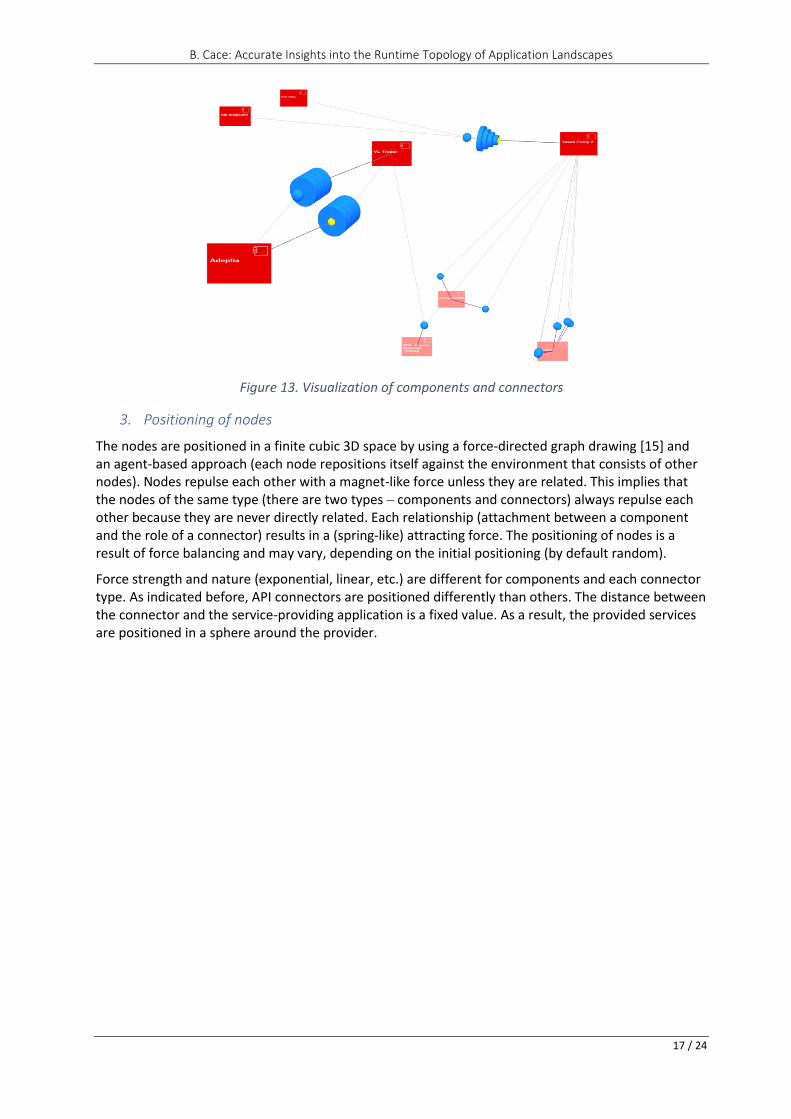
Figure 13. Visualization of components and connectors
3. Positioning of nodes
The nodes are positioned in a finite cubic 3D space by using a force-directed graph drawing [15] and an agent-based approach (each node repositions itself against the environment that consists of other nodes). Nodes repulse each other with a magnet-like force unless they are related. This implies that the nodes of the same type (there are two types – components and connectors) always repulse each other because they are never directly related. Each relationship (attachment between a component and the role of a connector) results in a (spring-like) attracting force. The positioning of nodes is a result of force balancing and may vary, depending on the initial positioning (by default random).
Force strength and nature (exponential, linear, etc.) are different for components and each connector type. As indicated before, API connectors are positioned differently than others. The distance between the connector and the service-providing application is a fixed value. As a result, the provided services are positioned in a sphere around the provider.
B. Cace: Accurate Insights into the Runtime Topology of Application Landscapes
18 / 24
Figure 14. A CRM system and its API interconnections
4. Showing composite components
Composite components are either logical clusters (systems) of applications or organizational entities. Each type of composition is depicted with a different icon. In the example shown in Figure 15, a building icon indicates an external organization, a group icon indicates a business unit, and a red cube indicates a system.
Figure 15. Icons indicating composite components
B. Cace: Accurate Insights into the Runtime Topology of Application Landscapes
19 / 24
5. Use of dominant architecture patterns to improve visualization
Established architecture patterns significantly determine the architecture of systems and how functionality is assigned to components and the composition of these components into systems. Visualizations of systems would become far more effective if those visualizations would reflect the patterns being used, that is, if they would resemble the intrinsic structure of the enterprise. In other words, we can use more spatial metaphors to improve the visualization.
Three examples (the first two are shown):
- One can show layers of enterprise architectures by separating the users facing applications from the back-office. This would reflect the separation of the backend business logic, independent of the nature of the requester, from the requester-specific, frontend logic, a commonly used SOA pattern supporting “multi-channeling.”
- One can show the interdependencies of internal departments and externally owned applications (Figure 17).
- One can visualize system clusters in accordance with the business processes that are being supported or in accordance with organizational boundaries.
The two graphs in Figure 16 illustrate the first example by showing applications of a large public organization and interconnected applications of external partners (depicted in cyan). Only the API interconnections are displayed. The graph on the left shows a straightforward 3D visualization. The graph on the right distinguishes between three sorts of applications: Applications shown on the upper plane only consume services, applications on the lower plane only provide services to other applications, and applications in between are doing both. This is a somewhat coarse differentiation which probably does not quite correctly position some components, but it greatly improves the clarity and expressiveness.
Figure 16. Visualization differentiating between frontend and backend applications
B. Cace: Accurate Insights into the Runtime Topology of Application Landscapes
20 / 24
Figure 17. Dependencies of internal departments
6. Interactivity aspect
Structures visualized on a computer screen are usually interactive, that is, the user can interact with the structure and its individual elements. The user may choose how to display the information, filter it, drill down into inner-structures, view properties, invoke links, and most importantly in this context, navigate through the structure.
This is all achievable with tabular, tree, or 2D graph representations, but 3D viewing opens new possibilities, especially when it comes to navigating across the entire application landscape. The user can follow paths of their own reasoning and traverse interconnected entities more naturally and intuitively than in other presentations. Elaborating on the potential of 3D views of application landscapes would go beyond the scope of this article. However, it is important to mention that nowadays tooling support is impressive due to a strong interest in examining graph structures in many different areas of IT development (gaming, networks, big data, etc.). Accordingly, there are plenty of high-level programing libraries14 suitable for implementing interactive 3D visualizations of the graph structure of application landscapes.
7 Summary and conclusions This article has set out to introduce an approach to creating accurate insights into the runtime topology of application interconnections in modern, connected application landscapes. The importance of this has not been discussed as it is assumed to be evident.
Interconnections in application landscapes form a graph structure. In representing that structure, I have made use of the established component and connector paradigm. I have argued that the most appropriate way of defining the set of connectors is to use “integration styles,” the high-level
14 Examples shown in this section (except in Figure 16) are facilitated by the HTML5 gaming engine BABYLON.JS.
B. Cace: Accurate Insights into the Runtime Topology of Application Landscapes
21 / 24
integration patterns originally systematized by Hohpe and Woolf [5]. I have demonstrated the value of the approach by presenting several real-life examples in Section 6.
I have also argued that the use of on-screen, interactive 3D visualizations should become a common practice in exploring the interconnections of application landscapes. Looking at other fields that deal with graph structures leads to the conclusion that 3D visualization tools have matured. My own use of freely available software for visualizing partitions of application landscapes (demonstrated in Section 6) attests to this maturity.
I have outlined that the needed data have to be collected from IT operations, with disregard for the trend toward decentralized and possibly outsourced management of IT services and infrastructures. Retrieving and maintaining information about application interconnections will become simpler due to the standardization of integration techniques, driven primarily by the advancements of cloud technology.
Can we create and maintain enterprise architecture models (that describe application interconnections) through automated data collection from IT infrastructure? Could it be done routinely so that the model would be accurate at any given time? Although I have not elaborated on automated data collection, the whole discussion implies affirmative answers to the above questions. I believe that automated data collection from IT infrastructure is possible and even necessary if we want to have accurate models. Moreover, it is not enough; organizations would need some operational procedure to complement the automation and to ensure flexible dealings with exception cases.
I have not addressed representing information about interconnections in an enterprise architecture modeling language. Regarding ArchiMate, the goal would be to define conventions for representing components and connectors proposed in this article in the so-called application layer. The intention is to explore options for ArchiMate representation in a subsequent article.
B. Cace: Accurate Insights into the Runtime Topology of Application Landscapes
22 / 24
Figures
Figure 1. Approach to creating application landscape views ................................................................. 3
Figure 2. Example C&C view with ports and roles .................................................................................. 6
Figure 3. Composition of components .................................................................................................... 7
Figure 4. Model representing API interconnections ............................................................................... 9
Figure 5. Two C&C views visualizing the same components and API interconnections ....................... 10
Figure 6. Model representing point-to-point messaging and publish/subscribe ................................. 10
Figure 7. Two options for representing file exchange .......................................................................... 11
Figure 8. Model representing shared database .................................................................................... 12
Figure 9. Model representing (application) components ..................................................................... 13
Figure 10. Added definition of application clusters .............................................................................. 13
Figure 11. Showing components and connectors in a table ................................................................. 15
Figure 12. Showing components and connectors in a tree .................................................................. 15
Figure 13. Visualization of components and connectors ...................................................................... 17
Figure 14. A CRM system and its API interconnections ........................................................................ 18
B. Cace: Accurate Insights into the Runtime Topology of Application Landscapes
23 / 24
8 References
[1] Clements, Bachmann, Bass, Garlan, Ivers, Little, Merson, Nord and Stafford, Documenting Software Architectures: Views and Beyond (2nd Edition), 2010.
[2] The Open Group, "ArchiMate® 3.1 Specification, Application Layer," [Online]. Available: https://pubs.opengroup.org/architecture/archimate3-doc/chap09.html. [Accessed 10 10 2020].
[3] B. Cace, "Application Landscape Views and SOA," 16 December 2017. [Online]. Available: https://eapj.org/application-landscape-views-and-soa/. [Accessed 22 10 2020].
[4] H. B. M. L. R. e. a. Holm, "Automatic data collection for enterprise architecture models," Software and Systems Modeling, no. May 2014, p. 825–841, 2014.
[5] G. Hohpe and B. Woolf, Enterprise Integration Patterns, Addison-Wesley, 2003.
[6] G. Hohpe, "Introduction to Integration Styles," [Online]. Available: https://www.enterpriseintegrationpatterns.com/patterns/messaging/IntegrationStylesIntro.html. [Accessed 09 09 2020].
[7] S. Venkatasubramania, "Azure Event Hubs vs Service Bus," [Online]. Available: https://www.serverless360.com/blog/azure-event-hubs-vs-service-bus#:~:text=Azure%20Event%20Hubs%20focuses%20more,should%20use%20Azure%20Service%20Bus..
[8] Microsoft, "Choose between Azure messaging services - Event Grid, Event Hubs, and Service Bus," [Online]. Available: https://docs.microsoft.com/en-us/azure/event-grid/compare-messaging-services. [Accessed 05 09 2020].
[13] S. Sarkar, "A Study of Existing Architecture Description Approaches from Enterprise System Development Perspective," 2004 (updated April 2016).
[14] M. Show and others, "Abstractions for Software Architecture and Tools to Support Them," IEEE TRANSACTIONS ON SOFTWARE ENGINEERING, VOL 21, pp. 314-335, 1995.


![The Road to Runtime - Pierssen · mycontent.geodatabase [Runtime GDB] Tile cache and Runtime GDB must be same projection. 2:42:03 PM Creating Runtime Content [ArcMap] [Or use Create](https://static.documents.pub/doc/80x56/600f367a9d295d443c624274/the-road-to-runtime-mycontentgeodatabase-runtime-gdb-tile-cache-and-runtime.jpg)


