Sheila DawlingVanderbilt University Medical Center, Nashville, Tennessee
INTRODUCTION
Ethanol is currently the most expensive and prevalentaddiction, affecting an estimated 140 million peopleworldwide in 2003 [1,2]. The European Union currentlyhas the highest rates of illness and premature death fromalcohol-related problems. The European InformationSystem on Alcohol and Health [3] and the NationalInstitute on Alcohol Abuse and Alcoholism [4] and theCenters for Disease Control and Prevention [5] in theUnited States provide a wide range of health statisticsfocused on production and availability, levels of consump-tion, patterns of consumption, harms and consequences,economic aspects, alcohol control policies, prevention andtreatment, and comparative risk assessment.
In the United States, the annual cost of ethanoladdiction is estimated at a staggering $166 billion, withsmoking second at $157 billion and drugs third at $110billion [1]. In 2011, approximately $18 billion wasspent on the direct costs of alcohol and drug treat-ment—1.3% of all health care spending [4]. There isincreasing concern regarding binge drinking, classifiedas five or more drinks (or 50 g of alcohol) at least oncea week for men and four for women [6,7]. More thanone-fifth of the European population aged 15 years orolder report binge drinking, which is widespreadacross all demographics and geographical areas.
There is a paucity of recent data on the incidence ofethanol in the emergency setting, but uncomplicatedethanol intoxication is estimated to account for approxi-mately 600,000 emergency department (ED) visits annu-ally in the United States [8]. Some studies suggestalmost half of all trauma beds are occupied by patients
who were self-injured (or injured by someone else)while under the influence of alcohol [9,10]. It is impor-tant to have accurate knowledge of the patient’s alcoholstatus because of its potential to interact with co-ingested substances, increasing their potency and/orconfounding or masking their symptoms. Substanceabuse (including ethanol) is more prevalent in health-related professionals than in the general population: Anestimated 8�12% of physicians develop a substance-use problem during their lifetime, with anesthesiolo-gists having the highest risk, [11] and 32% of nursesreport some type of substance-use problem, with thosein the ED having the highest rates recorded in 1998 [12].
Hospital patients who use ethanol chronically incura two to four times higher morbidity and mortality dur-ing anesthesia and during their postoperative coursehave a heightened susceptibility to infection, cardiopul-monary insufficiency, and bleeding disorders. Manypatients do not readily admit to alcohol dependence,and withdrawal becomes evident approximately6�24 hr after their last drink. This development canchange a normal postoperative course into a life-threatening situation, and it escalates the severity tier ofcare and the concomitant expense of treatment [13].
Because of its extensive availability, ethanol is themost frequently encountered toxic substance in bothclinical and forensic analytical settings. Ethanol analy-sis is often requested in life-threatening settings toevaluate neurological status, for monitoring patientsundergoing ethanol therapy for methanol or ethyleneglycol toxicity, monitoring those enrolled in alcoholand other drug treatment programs, and when evalu-ating patients’ suitability for organ transplant. Clinical
laboratories therefore need rapid and reliable methodsfor detection and quantitation of ethanol in biologicalfluids, usually plasma or serum and urine.Unfortunately, the convenience of having ethanol test-ing available on automated chemistry analyzers hasbeen traded for specificity, and interferences do occur,some of which can have significant clinical and legalimplications if not fully appreciated. Laboratorypersonnel and those served by the laboratory need tohave a clear understanding of the limitations of thesetests and have protocols in place for determiningwhich results might be suspect.
Laboratory practice guidelines for use of drug tests inpatients treated in the ED have been prepared by expertpanels of clinical toxicologists and ED physicians. Thethree most recent are those of the U.S. NationalAcademy of Clinical Biochemistry [14], the UK NationalPoisons Information Service and Association of ClinicalBiochemists [15], and the Alberta Medical Association inCanada [16]. Although for the most part they are inagreement that the use of emergency drug screens is notwarranted, all endorse the provision of STAT (within1 hr) quantitative ethanol tests.
Because there is no concentration that defines clinicalintoxication, as opposed to the legal setting, the labora-tory or ED has choices regarding specimens and testingmethods that best satisfy its needs. As such, many hos-pitals have implemented alternative sample testing,such as urine, saliva, or breath, which are easier or saferto obtain and more reliable to process and interpret.Any difference in ethanol content between blood andthese matrices is without clinical significance. Breathanalyzers as routinely used in law enforcement areaccurate, precise, legally defensible, inexpensive, andperhaps, equally important, are perceived to be so bythe general public. Testing methodology is not flawedin the way that enzymatic tests are flawed. However,there is clearly inadequate supervision of qualitybecause breath testing is not performed under the guid-ance of the laboratory personnel nor are tests regulatedby the Clinical Laboratory Improvement Act (CLIA) orthe College of American Pathologists (CAP) or similaragencies in other countries.
DEVELOPMENT OF LABORATORYMETHODS FOR ETHANOL
MEASUREMENT
Because of the widespread availability and toxicityof ethanol, and its relatively large concentration inbody fluids, it naturally became a target for early ana-lytical toxicologists. Just as today, their methods werebased on the reducing properties of ethanol: Additionof a strong oxidizing agent (potassium dichromate in
concentrated sulfuric acid) induced a color change(from yellow/orange to blue/green chromic sulfate)that was easily monitored. Widmark [17] introduced adistillation step to vaporize the ethanol from the bio-logical fluid prior to the reaction, and the ethanolvapor captured by reagent impregnated into filterpaper placed above the boiling solution. Later, amicrodiffusion well was used for the same purpose.These methods are now considered obsolete because oftheir lack of specificity (methanol and isopropanol areboth strong enough reducing agents to produce apositive reaction), their tediousness, and their inappli-cability to automation.
Volatile alcohols are extremely well suited to analy-sis by gas chromatography (GC); mixtures could beseparated by molecular weight and volatility on acolumn packed with nothing more than activatedcharcoal. The relatively high concentrations ensuredadequate sensitivity with even the most basic flameionization detector introduced in the 1960s [18]. Withthe advent of capillary columns and programmableovens, quantitative analysis of alcohols by GC becameone of the easiest and most robust tests available in theclinical laboratory, and it was soon established as thegold standard for both alcohols and glycols [19].Despite its obvious advantages in specificity, and theability to identify and quantitate several toxic alcoholssimultaneously, GC is not widely employed in clinicallaboratories, especially those that do not serve a majortrauma or poison treatment center. The equipment isrelatively expensive (approximately $30,000�$40,000),and its use requires specialized training. The need totest large numbers of samples for ethanol necessarilyrequires a method that can be adapted to an auto-mated chemistry platform.
To this end, enzymatic assays were investigatedbased either on alcohol dehydrogenase (ADH) or onalcohol oxidase (AOD). Again, both these tests arebased on the ability of ethanol to act as a reducingagent and produce acetaldehyde plus a reduced prod-uct. Of these enzymatic methods, ADH proved to bemore easily automated because of its good stability insolution, and methods for the most part use spectro-photometric detection of the NADH (nicotinamideadenine dinucleotide reduced form) product as thedetection mechanism. Point-of-care methods for etha-nol, however, mostly use AOD because although theenzyme is highly unstable in solution; it has goodstability when formulated onto a dry dipstick pad orsolid support. A wide variety of test kits are availablefor use with urine, saliva, and breast milk, but theseare discrete single-use tests and not suitable for auto-mated analyzers. AOD methods are currently of inter-est because their oxygen consumption and peroxideformation make them more amenable to conversion to
248 16. ALCOHOL DETERMINATION USING AUTOMATED ANALYZERS
ACCURATE RESULTS IN THE CLINICAL LABORATORY
electrical signals that can be measured with an elec-trode sensor. Alternatively, the hydrogen peroxideproduct can be used to make a visible color reactionusing added peroxidase. The reaction mechanisms forboth AOD and ADH assays are discussed in moredetail as the different methods are evaluated later inthis chapter.
CURRENTAUTOMATEDMETHODOLOGIES
Figure 16.1 summarizes the many different strate-gies for measurement of ethanol by enzymatic assays.All the major clinical chemistry automated instrumentmanufacturers currently market alcohol test kits.Several diagnostic reagent manufacturers sell kitssuitable for use on a number of different automatedchemistry platforms. All are based on the enzymaticoxidization of ethanol to acetaldehyde, using theenzyme ADH (EC 1.1.1.1., ethanol:NAD1 oxidoreduc-tase). However, the specific application of the test maydiffer between manufacturers, and it is naive toassume that all ADH-based ethanol tests are createdequal, will have the same performance characteristics,
and will be subject to the same limitations and interfer-ences. Variability between the different tests arisesfrom differences in the following:
• Species source of ADH• Reagent concentration of substrate, co-factors, and
enzyme• Source contamination of NAD1
• Use of NAD1 or an NAD1 analog• Use of a trapping reagent to drive the reaction to
completion• Sample and reagent addition volumes, incubation
timings, and blanking (preincubation)• Nature of any coupled indicator reaction and its
reagent formulation• Detection and blanking spectrophotometer
wavelength• Measurement timings and mode (end point or
kinetic).
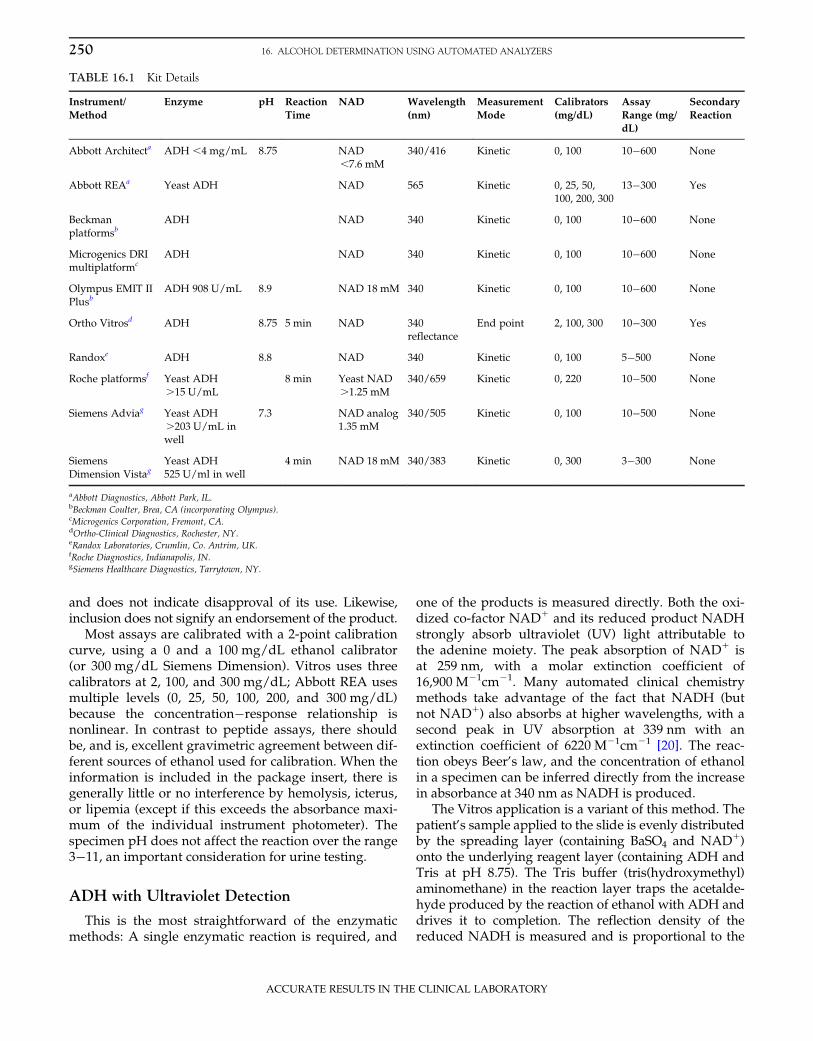
Table 16.1 shows the specifics for each of the mostcommonly used kits currently available, as extractedfrom manufacturer-provided package inserts.Manufacturers’ addresses are included in the footnote tothis table. The list is intended to be fairly comprehensive,but the exclusion of a particular product is not deliberate
EthanolADH
Adduct
AcetaldehydeO2
TRIS
Vitros®
Electron DonorNADHNAD+
NAD+
AOD
Acetaldehyde+ H2O2
Leuco Dye
Colored DyePOD
Chromogen pair
Coupled Chromophore
DAP
Excitation
Thiazoyl Blue
Fluorescein
Emission
Reduced Donor
REA®
Formazan-MT
FIGURE 16.1 Enzymatic ethanol assays. Ethanol, the substrate and starting point of the assays, is shown in the top left of the figure.Alcohol oxidase (AOD) assays are shown down the left-hand side, and alcohol dehydrogenase (ADH) assays are shown horizontally anddown the right-hand side. Both of these reactions produce acetaldehyde, but this product is not tracked or utilized further. Although bothreactions are reversible, the direction required for ethanol quantitation is shown with the longer arrow. Compounds in gray boxes are pro-ducts that can be measured to follow the reaction rate, and with the exception of molecular oxygen, these are all reaction products. Oxygenconsumption in AOD assays can be measured with a standard oxygen-sensing electrode. The secondary coupled enzymatic reaction for ADHassays with diaphorase (DAP; EC 1.6.99.1 NADPH:(acceptor) oxidoreductase) using NADH as a substrate is shown with a generic electrondonor substrate (e.g., compounds such as tetrazolium salts that form colored formazan dyes when reduced). The secondary coupled enzy-matic reaction for AOD assays with peroxidase (POD) using hydrogen peroxide as substrate is shown with two generic chromogens:Common chromogen pairs are 4-aminopyrine with either chromotropic acid (4,5-dihydroxynaphthalene-2,7-disulfonic acid) or DHBS (3,5-dichloro-2-hydroxybenzenesulfonic acid), which form blue and red chromophores, respectively. A common leuco dye is TMB (tetramethylben-zidine), which forms blue TMB diimine. Reactions that are unique to a specific manufacturer (Vitros and Abbott’s REA) are sequestered intoboxes for illustrative purposes.
249CURRENT AUTOMATED METHODOLOGIES
ACCURATE RESULTS IN THE CLINICAL LABORATORY
and does not indicate disapproval of its use. Likewise,inclusion does not signify an endorsement of the product.
Most assays are calibrated with a 2-point calibrationcurve, using a 0 and a 100 mg/dL ethanol calibrator(or 300 mg/dL Siemens Dimension). Vitros uses threecalibrators at 2, 100, and 300 mg/dL; Abbott REA usesmultiple levels (0, 25, 50, 100, 200, and 300 mg/dL)because the concentration�response relationship isnonlinear. In contrast to peptide assays, there shouldbe, and is, excellent gravimetric agreement between dif-ferent sources of ethanol used for calibration. When theinformation is included in the package insert, there isgenerally little or no interference by hemolysis, icterus,or lipemia (except if this exceeds the absorbance maxi-mum of the individual instrument photometer). Thespecimen pH does not affect the reaction over the range3�11, an important consideration for urine testing.
ADH with Ultraviolet Detection
This is the most straightforward of the enzymaticmethods: A single enzymatic reaction is required, and
one of the products is measured directly. Both the oxi-dized co-factor NAD1 and its reduced product NADHstrongly absorb ultraviolet (UV) light attributable tothe adenine moiety. The peak absorption of NAD1 isat 259 nm, with a molar extinction coefficient of16,900 M21cm21. Many automated clinical chemistrymethods take advantage of the fact that NADH (butnot NAD1) also absorbs at higher wavelengths, with asecond peak in UV absorption at 339 nm with anextinction coefficient of 6220 M21cm21 [20]. The reac-tion obeys Beer’s law, and the concentration of ethanolin a specimen can be inferred directly from the increasein absorbance at 340 nm as NADH is produced.
The Vitros application is a variant of this method. Thepatient’s sample applied to the slide is evenly distributedby the spreading layer (containing BaSO4 and NAD1)onto the underlying reagent layer (containing ADH andTris at pH 8.75). The Tris buffer (tris(hydroxymethyl)aminomethane) in the reaction layer traps the acetalde-hyde produced by the reaction of ethanol with ADH anddrives it to completion. The reflection density of thereduced NADH is measured and is proportional to the
250 16. ALCOHOL DETERMINATION USING AUTOMATED ANALYZERS
ACCURATE RESULTS IN THE CLINICAL LABORATORY
concentration of ethanol in the sample. The filtering ofthe specimen through the spreading layer reduces poten-tial interference in many assays from myeloma proteins,and it also reduces the interference from elevatedconcentrations of lactate dehydrogenase. Other trappingreagents for acetaldehyde have been used in other appli-cations, such as semicarbazide.
ADH with Radiative Energy Attenuation
In this assay, ethanol substrate is used in a coupledcatalytic reaction with ADH and a second enzyme,diaphorase, to generate a color change in a dye. Themethod was originally designed for the AbbottTDx/FLx platforms, and it is currently available on theAbbott AxSYM. radiative energy attenuation (REA)measures the degree of inhibition of the fluorescenceof fluorescein dye resulting from the production of acolored product. In the original version of the assay,[21,22] the ADH reaction with ethanol and NAD1 wascoupled to a second reaction between the NADH pro-duced and the chromogen iodonitrotetrazolium violetdye (INT). This diaphorase-catalyzed reaction resultsin reoxidation of NADH to NAD1, along with the gen-eration of a red chromophore formazan-INT. Thisproduct has an absorbance peak at 492 nm, whichoverlaps the excitation and emission spectral profile ofthe fluorescein included in the reaction mixture.Subsequent reformulation of the kit eliminated theneed for a time-consuming probe wash by replacingthe INT with thiazoyl blue (monotetrazolium ormethylthiotetrazolium (MTT)). The detection strategyis unchanged with the reduced MTT (formazan-MT)yielding a purple color with an absorbance maximumat 565 nm. The logarithm of the fluorescent light emit-ted is inversely proportional to the chromophorepresent, the production of which is directly linked tothe ethanol concentration in the sample.
Alcohol Oxidase Methods
Although currently no automated methods useAOD, a brief description is appropriate because tech-nological advances may soon result in the successfulautomation of AOD methods. The left portion ofFigure 16.1 shows generic AOD methods. These areamenable to electrochemical detection methods andare available on the Analox GM series of benchtopinstruments (Analox Instruments, London). They offerthe potential for adaptation onto handheld devicessuch as iSTAT (Abbott Diagnostics, Abbott Park, IL) orblood gas analyzers. The main drawback of AODmethods is that the enzyme is not very specific forethanol: All the common toxic alcohols are substrates
for this enzyme, producing a signal that cannot be dis-tinguished from that produced by ethanol. However,substrate preferences (as indicated by different Km
values) very much depend on the biological origin ofthe AOD.
PERFORMANCE OF AUTOMATEDETHANOL ASSAYS
Most vendors of assay kits include calibration mate-rials in their kits or as separately purchased items.These are often matrix matched to give optimal perfor-mance on the specific platform. Calibration materialscan also be obtained from independent vendors suchas Cerilliant Corporation (Round Rock, TX) and UTAKLaboratories (Valencia, CA). These can also be used forchromatographic methods, although many laboratoriesperforming ethanol analysis by GC prefer to maketheir own multicomponent calibrators and verify themwith independent controls. All vendors of commercialtest kits provide quality control materials for assessingmethod performance prior to testing of patient speci-mens. Automated test methods are usually designatedas applicable to more than one body fluid, typicallyincluding both serum/plasma and urine. To fulfill reg-ulatory requirements for using matrix-matched controlmaterials, commercially available controls in blood,serum, saliva, and urine are widely available (UTAK,Bio-Rad Laboratories (Hercules, CA), and Microgenics(Freemont, CA)). In addition to these internal controls,a laboratory’s performance of all clinically importantanalytes is monitored by their participation in an exter-nal proficiency testing program, such as that offeredby CAP. In the United States, CAP is required to sub-mit proficiency test results to Centers for Medicare andMedicaid Services for all laboratories that have pro-vided a CLIA identification number.
CAP interprets the CLIA ’88 regulations (42 CFRPart 493, Section 493.937) for acceptable performanceas obtaining a value within 6 25% of the all-methodsmean for ethanol and as a value between 0 and 9 mg/dL for alcohol-free samples. Results are issued for eachsample provided at least 80% of participating laborato-ries have returned results. If the result is in doubt,there is concern regarding the quality of the specimen,or there is no clear consensus, it is ungraded. Returnsare evaluated by each of the four major analyticalmethod groups: GC, ADH with UV-visible (UV-Vis)detection, ADH with REA, and the Vitros method.
During 2010 and 2011, six survey sets of five chal-lenges each were distributed by CAP. Almost 3200 lab-oratories participated in the CAP alcohol survey (AL2),and the vast majority of these (approximately 98%)used automated methods for measurement. Of the
251PERFORMANCE OF AUTOMATED ETHANOL ASSAYS
ACCURATE RESULTS IN THE CLINICAL LABORATORY
participants, 80% used ADH UV-Vis methods, 16%Vitros, 2.6% GC (84 labs), and 1.3% Abbott ADH withREA.
Of the 30 survey samples circulated during 2010and 2011, 3 were negative for ethanol (,10 mg/dL).Fifteen challenges contained one or more additionalvolatile compounds (4 each methanol, acetone, and iso-propanol; and 6 ethylene glycol). Twelve challengescontained only ethanol, with concentrations between24 and 240 mg/dL as determined by GC. The CAPperformance goal is 8% error or 2 mg/dL (whicheveris the larger), with a total error of 16%.
Method imprecision (as defined by the coefficient ofvariation) for all four method groups was similar, usu-ally ranging from 4 to 6% across the full range of etha-nol concentrations tested. Both GC and the enzymaticmethods performed equally in this regard. Accuracywas assessed by comparison of the returned result tothe gold standard GC results.
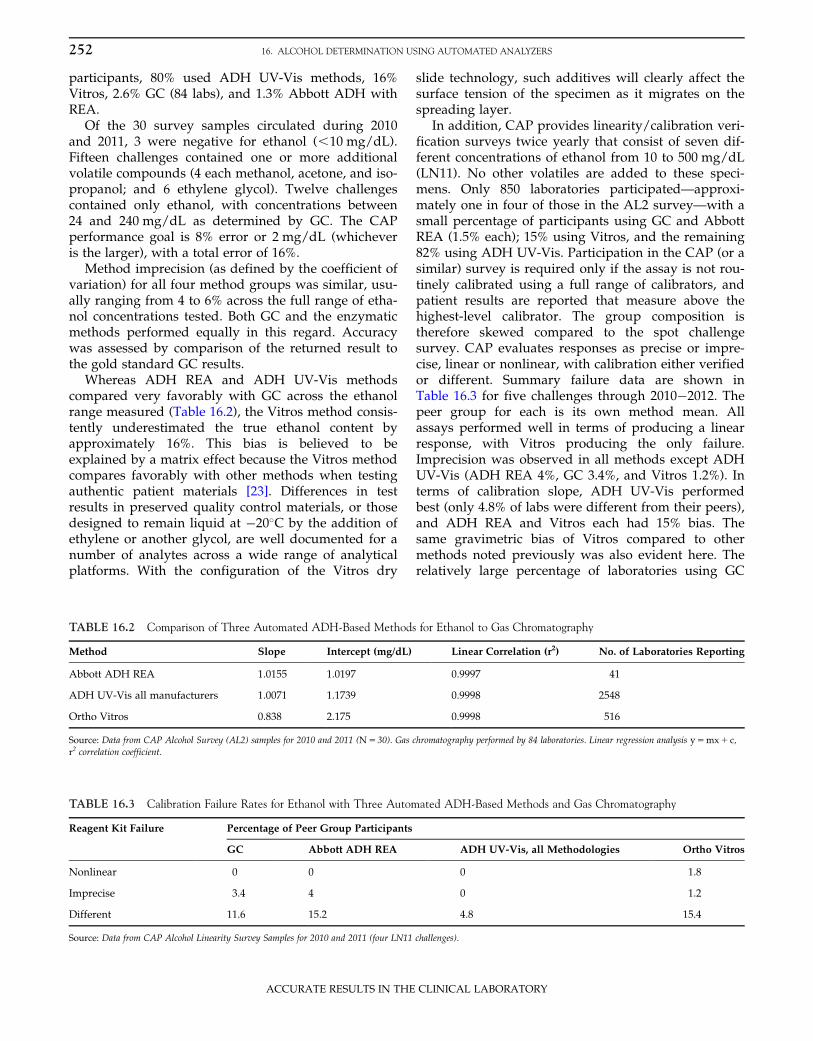
Whereas ADH REA and ADH UV-Vis methodscompared very favorably with GC across the ethanolrange measured (Table 16.2), the Vitros method consis-tently underestimated the true ethanol content byapproximately 16%. This bias is believed to beexplained by a matrix effect because the Vitros methodcompares favorably with other methods when testingauthentic patient materials [23]. Differences in testresults in preserved quality control materials, or thosedesigned to remain liquid at �20�C by the addition ofethylene or another glycol, are well documented for anumber of analytes across a wide range of analyticalplatforms. With the configuration of the Vitros dry
slide technology, such additives will clearly affect thesurface tension of the specimen as it migrates on thespreading layer.
In addition, CAP provides linearity/calibration veri-fication surveys twice yearly that consist of seven dif-ferent concentrations of ethanol from 10 to 500 mg/dL(LN11). No other volatiles are added to these speci-mens. Only 850 laboratories participated—approxi-mately one in four of those in the AL2 survey—with asmall percentage of participants using GC and AbbottREA (1.5% each); 15% using Vitros, and the remaining82% using ADH UV-Vis. Participation in the CAP (or asimilar) survey is required only if the assay is not rou-tinely calibrated using a full range of calibrators, andpatient results are reported that measure above thehighest-level calibrator. The group composition istherefore skewed compared to the spot challengesurvey. CAP evaluates responses as precise or impre-cise, linear or nonlinear, with calibration either verifiedor different. Summary failure data are shown inTable 16.3 for five challenges through 2010�2012. Thepeer group for each is its own method mean. Allassays performed well in terms of producing a linearresponse, with Vitros producing the only failure.Imprecision was observed in all methods except ADHUV-Vis (ADH REA 4%, GC 3.4%, and Vitros 1.2%). Interms of calibration slope, ADH UV-Vis performedbest (only 4.8% of labs were different from their peers),and ADH REA and Vitros each had 15% bias. Thesame gravimetric bias of Vitros compared to othermethods noted previously was also evident here. Therelatively large percentage of laboratories using GC
TABLE 16.2 Comparison of Three Automated ADH-Based Methods for Ethanol to Gas Chromatography
Method Slope Intercept (mg/dL) Linear Correlation (r2) No. of Laboratories Reporting
Abbott ADH REA 1.0155 1.0197 0.9997 41
ADH UV-Vis all manufacturers 1.0071 1.1739 0.9998 2548
Ortho Vitros 0.838 2.175 0.9998 516
Source: Data from CAP Alcohol Survey (AL2) samples for 2010 and 2011 (N5 30). Gas chromatography performed by 84 laboratories. Linear regression analysis y5mx1 c,r2 correlation coefficient.
TABLE 16.3 Calibration Failure Rates for Ethanol with Three Automated ADH-Based Methods and Gas Chromatography
Reagent Kit Failure Percentage of Peer Group Participants
GC Abbott ADH REA ADH UV-Vis, all Methodologies Ortho Vitros
Nonlinear 0 0 0 1.8
Imprecise 3.4 4 0 1.2
Different 11.6 15.2 4.8 15.4
Source: Data from CAP Alcohol Linearity Survey Samples for 2010 and 2011 (four LN11 challenges).
252 16. ALCOHOL DETERMINATION USING AUTOMATED ANALYZERS
ACCURATE RESULTS IN THE CLINICAL LABORATORY
that had a different calibration from their peers (11.6%)may be a reflection of the high incidence of home-brew calibration materials used.
PROBLEMS WITH CURRENTMETHODOLOGIES
Assays based on the measurement of enzyme activ-ity offer many advantages over GC methods becauseof their amenability to automation and consequentspeed and widespread use, and they have undoubt-edly contributed to saving many lives. However, thesemethods are prone to inaccuracy due to (1) cross-reactivity of the enzyme with alternate substrates suchas toxic alcohols other than ethanol and (2) interferencefrom elevated plasma concentrations of substratesand/or enzymes that could also generate NADH, theindicator compound used to monitor the reaction.Although industrial propriety often prevents the enduser from knowing the precise ingredients of the kit,appreciation of enzyme reaction principles at leastgives the operator some clues regarding the appropri-ate starting point in troubleshooting wayward results.
At the outset of this discussion, it is important thatthe reader appreciate that the ADH present in humanliver and other tissues has quite different characteristicsfrom the Saccharomyces cerevisiae (yeast) enzyme presentin all of the ADH-based ethanol kits [24]. Active yeastADH is a homotetramer with a molecular mass ofapproximately 145 kDa. The active site of each subunitcontains a zinc atom, two reactive sulfhydryl groups,and a histidine residue. Its pH optimum is alkaline,8.6�9.0. Inhibitors are compounds that react with freesulfhydryl, chelate zinc, or are alternate substrates suchas NAD analogs, purine and pyrimidine derivatives,and halogenated alcohols [25]. Yeast ADH is most reac-tive with ethanol, its preferred substrate, and less sowith methanol, and then its activity decreases withincreasing size of the alcohol substrate molecule.Branch-chain and secondary alcohols (e.g., isopropanol)have very low reactivity [24,26].
Enzyme reactions are characterized in terms of twoparameters: the velocity (rate of change of substrateconcentration with time) and the Michaelis constant,Km (the substrate concentration that produces half themaximum velocity). A typical enzyme rate curve isshown in Figure 16.2. Velocity is typically expressed inamount (moles or milligrams) of substrate turned overto product in a given time, and it is sometimes fac-tored to the amount of enzyme present. The maximumreaction velocity possible, Vmax, is a function of thereactivity of the enzyme, including any polymorphicforms, as well as the prevailing reaction conditions(amount of enzyme in the reaction mixture,
temperature, co-factor concentration, pH, etc.). First-order reaction kinetics is followed when the exclusivedeterminant of the enzyme rate is the substrate con-centration available (see notation in Figure 16.2).Therefore, during this time, the reaction rate can beused to calculate the substrate concentration, and thisis the basis for a large number of clinical enzymaticassays for substrates (glucose, urea, creatinine, etc.; seeChapter 8). At higher substrate concentrations, thereaction kinetics might conform more closely to zero-order (see notation in Figure 16.2). Here, the enzyme issubstrate saturated (all available substrate bindingsites on the enzyme are occupied), and the reactionproceeds at a fixed rate (Vmax), which cannot beexceeded regardless of any increase in substrate con-centration that might occur. Whereas ADH kinetics iszero order at relatively low ethanol concentrations inhumans, yeast ADH has a much higher Km, and first-order kinetics prevails under the operating conditionsof most test methods.
All enzyme reactions are reversible, and ADH is noexception. The reaction is as follows, with ethanolbeing oxidized to acetaldehyde and the reaction moni-tored spectrophotometrically at 340 nm by the produc-tion of NADH:
ADHEthanol1NAD1 1H1"acetaldehyde1NADH
The position of the equilibrium of an enzymaticreaction cannot be changed by altering the amount ofenzyme present in the reaction mixture. For this reac-tion, the equilibrium position lies far to the left, andthe time required for the assay to reach equilibriummay be from 10 to 60 min depending on prevailingconditions of temperature, substrate or co-factor
Vmax
Vmax
Velocity V
2
First Order
Zero Order
kmSubstrate Concentration [S]
V =Vmax [S]Km + [S]
FIGURE 16.2 Typical Michaelis�Menten enzyme plot of reac-tion velocity against substrate concentration. The equation is shownin the gray box, and regions corresponding to first-order and zero-order kinetics are indicated. Velocity5 rate of change in substrateconcentration with time; Vmax, maximum velocity. Km is theMichaelis constant, the substrate concentration at half maximumvelocity.
253PROBLEMS WITH CURRENT METHODOLOGIES
ACCURATE RESULTS IN THE CLINICAL LABORATORY
concentration, etc. Because equilibrium (or end point)methods are relatively insensitive to small changes inthe reaction conditions, this approach was initiallypreferred, but it lost favor once technological advancesmade it possible to finely control instrument conditions.However, the reaction can be driven toward the right,primarily by increasing the reaction pH or by adding atrapping reagent to remove the acetaldehyde product,such as semicarbazide or tris(hydroxymethyl)amino-methane. Coupling one of the ADH reaction productsto a second enzymatic reaction also accomplishes thesame end, but this strategy is usually employed for thepurpose of modifying the measurement wavelength toavoid potential interferences and is a more expensiveoption because other substrates/co-factors and enzymemust be added to the reagent kit.
The analysis time can also be shortened by using akinetic measurement to monitor the reaction ratherthan the equilibrium end point. However, this requiresthat the substrate concentration ([S]) be kept suffi-ciently low ([S] ,, , Michaelis constant, Km) toensure that first-order reaction conditions prevail sothat the amount of product formed is dependent onlyon the amount of substrate present. This originallynecessitated pre-dilution of the sample because ethanolconcentrations are relatively large, but modern auto-mated pipetters can now dispense specimen volumesof 2�5 μL with excellent precision (,2%). Addition ofextra ADH enzyme could also be used to increase theamount of substrate consumed, but this can be expen-sive, so an alternative strategy is to add a competitiveenzyme inhibitor such as pyrazole [27]. Once the Km isincreased by the competitive inhibitor, the assayresponse is linear over the required range of ethanolconcentration to cover most clinical eventualities.
Automated ADH assays are liable to two potentialsources of interference that can lead to inaccuracy insome clinical settings. The first is having a degree ofcross-reactivity with other toxic alcohols, and thesecond is being subject to positive bias introduced byelevated concentrations of lactate and/or lactatedehydrogenase (LDH). Interestingly, toxic alcoholinterference is better known but occurs lessfrequently, whereas the lactate/LDH interference isless predictable and may be more prevalent but isless well recognized.
Cross-Reactivity with other Alcohols
Most enzymes can use a number of different sub-strates, albeit with different preferences. Substratesthat are metabolized most quickly or selectively havelow values for Km, the substrate concentration at whichthe reaction proceeds at half its maximum velocity
(see Figure 16.2). ADH is no exception, and a numberof different alcohols can be converted into their respec-tive aldehydes with the concomitant use of NAD1 andproduction of NADH. Thus, NADH production, whichis usually monitored to specifically determine the etha-nol concentration, is not specific and gives no indica-tion of which substrate has been utilized. A largeconcentration of an alcohol such as methanol with ahigh Km value produces NADH at a relatively lowrate, and this might lead the technologist to believethere is a small amount of ethanol present in thesample.
However, when ethanol is present in addition toanother alcohol, the situation is more complicatedbecause both alcohols can be metabolized by ADH.The term competitive inhibitor refers to a compound thatdirectly competes with ethanol for substrate bindingsite on the enzyme and occupies it, thus reducing theamount of ethanol that can bind and be converted toacetaldehyde. The magnitude of the effect is deter-mined by the relative proportions of ethanol to inhibi-tor that are present, and once the inhibitor has beenmetabolized or excreted, the effect is dissipated. Somecompetitive inhibitors are also alternate substrates forthe enzyme, and their binding to the active site resultsin their metabolism into products (and thus NADHproduction). Most toxic alcohols are alternatesubstrates for ADH and can therefore inhibit themetabolism of other alcohols that have higher Km
values. Indeed, this very principle—preventing themetabolism of methanol or ethylene glycol by additionof ethanol—was taken advantage of for many years inthe treatment of poisoning from toxic alcohols withintravenous or oral ethanol until it was replaced by4-methyl pyrazole (fomepizole, Antizol), another com-petitive inhibitor of ADH. However, for the yeastADH used in these automated assays, the Km for etha-nol, the preferred substrate, is only 2.1 mM, whereasthat for methanol is very much larger at 130 mM, andthat for isopropanol is 140 mM [28]. The potential forinterference is therefore more theoretical than practicalbecause a serum methanol of 130 mg/dL gives anapparent ethanol of only 2 mg/dL. Likewise, to obtaina positive ethanol result (10 mg/dL), the methanolconcentration must be 650 mg/dL, which requires amassive ingestion.
CAP endeavors to assess and monitor toxic alcoholinterference in ethanol tests by incorporating a numberof other alcohols into some of its proficiency survey chal-lenges. Reviewing the data from the 30 2010 and 2011CAP alcohol challenges shows there were 15 ethanol-only samples and 15 “mixed” samples. However, toxicalcohol concentrations were relatively low—methanol,48�61 mg/dL; acetone, 30�44 mg/dL; isopropanol,38�72 mg/dL; and ethylene glycol, 46�152 mg/dL—but
254 16. ALCOHOL DETERMINATION USING AUTOMATED ANALYZERS
ACCURATE RESULTS IN THE CLINICAL LABORATORY
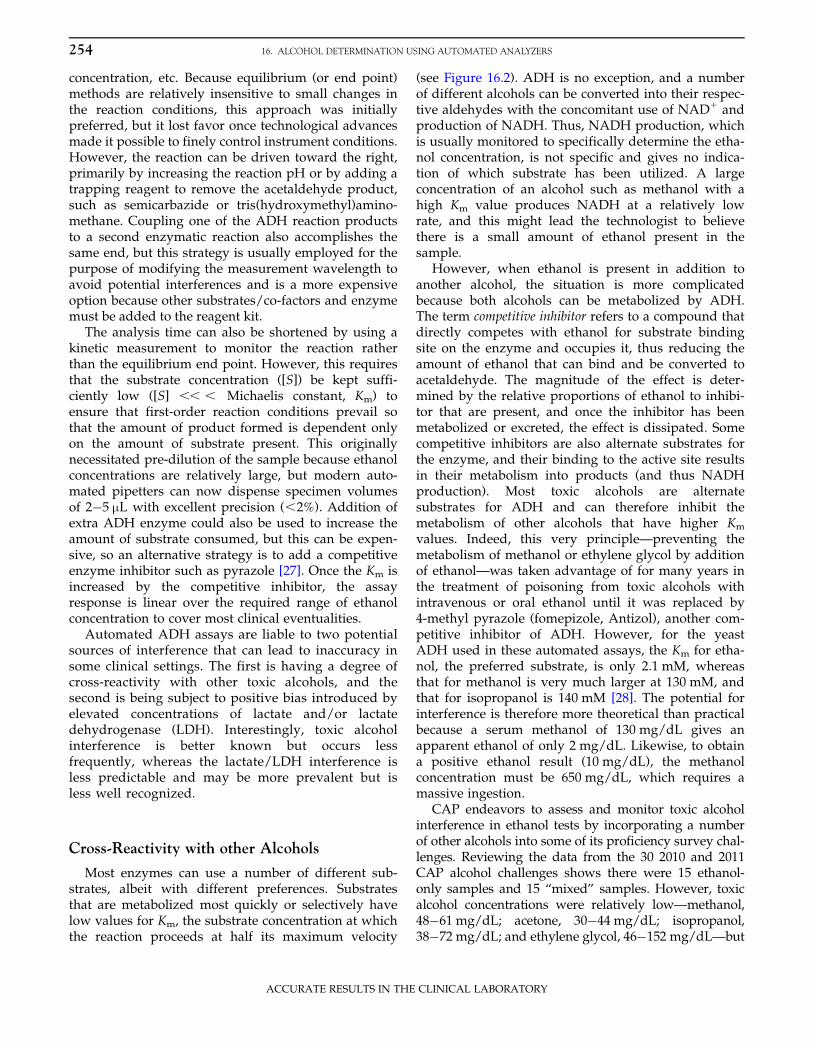
three samples were included containing only a toxic alco-hol in the absence of ethanol. These data (summarized inTable 16.4) clearly show that there is no interference inethanol measurements at these values. It is interesting tonote that CAP also appears satisfied because these wereall in the 2010 challenges, and none of the 2011challenges were formulated in this way. Comparing per-formance of automated ADH alcohol methods for themixed alcohol challenges again shows very little interfer-ence compared to the gold standard GC values (data notshown). Propylene glycol (70 mg/dL) was added for thefirst time to one of the challenges in the 2012 AL2-A set.This sample also contained 130 mg/dL ethanol, andalthough there was no added inaccuracy in the measuredethanol concentrations for this sample, 14% of respon-dents reporting a quantitative result incorrectly identi-fied the compound as ethylene glycol. Failures resultedfrom both GC and enzymatic methods, which is ratherdisturbing, and this proves that although GC may be thegold standard analytical technique, inattention to detailcan negate any added advantage offered. Furthermore,10% of labs reporting a qualitative result also misidenti-fied ethylene glycol.
These studies show that the presence of a toxic alco-hol, even at large concentrations, is unlikely to producea false-positive ethanol result by any of the automatedADH methods in current usage. The downside of this,however, is that toxic alcohol ingestions are not goingto be detected by automated ADH ethanol tests, andother strategies must be employed to avoid misseddiagnoses and missed treatment opportunities.
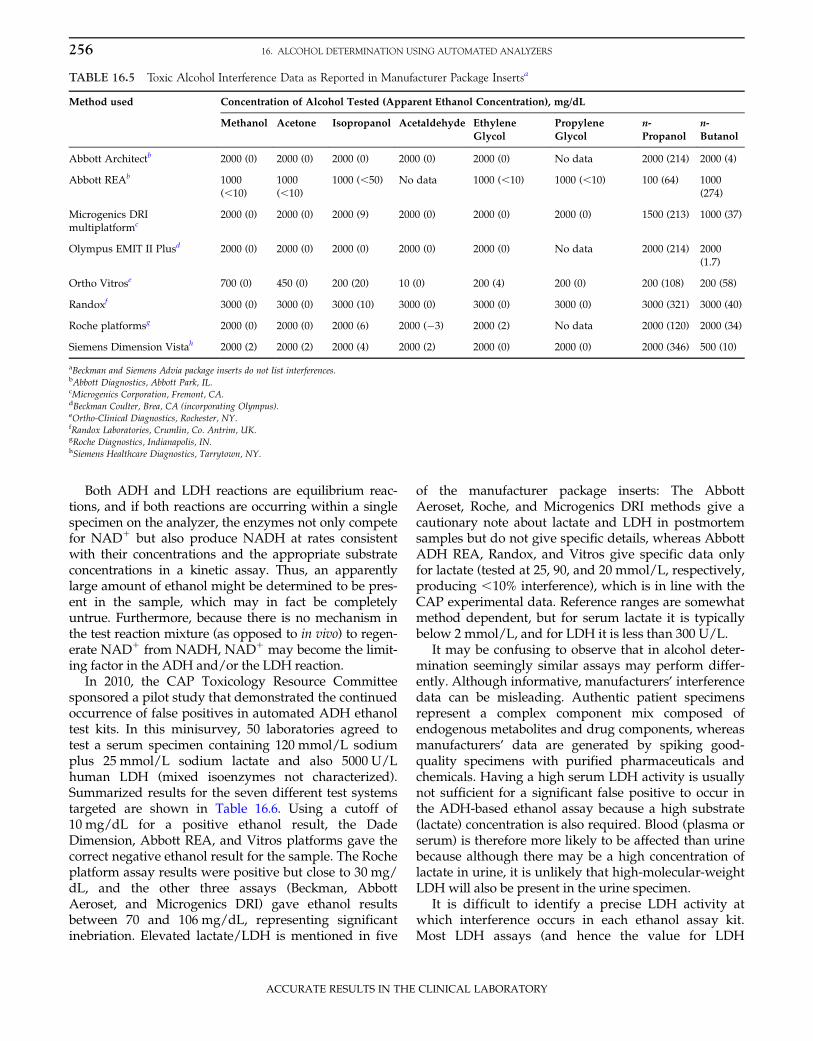
Nearly all kit manufacturers include interferenceinformation for methanol, acetone, isopropanol, andethylene glycol in their package inserts, and these dataare compared in Table 16.5. Manufacturers’ interfer-ence data can sometimes be misleading and induce afalse sense of security (see Case Reports). However,authentic patient specimens represent a complex mixof endogenous and drug-related metabolites that canproduce a quite different pattern of interference thanwhen alcohols are spiked into clean samples in vitro.
Data on interfering substances other than toxic alco-hols are not always available and sometimes onlycome to light in case reports. Alcohol oxidase ethanolmethods are much more susceptible to false-positiveinterference in samples containing other toxic alcohols.This, coupled with the instability of AOD in solution,led to the overwhelming preference for the use ofADH in automated ethanol test kits.
Interference by Elevated Lactate and LDHConcentrations
As outlined previously, the production of NADH byADH is not specific for the presence of ethanol, but themere presence of large concentrations of toxic alcoholsis unlikely to produce a false-positive ethanol result.However, there may be other enzymes and/or sub-strates in the patient specimen that could result in thegeneration of NADH from the reduction of NAD1. Ithas been known for more than 20 years that high con-centrations of LDH and/or lactate interfere with ADH-based ethanol assays, giving false-positive results,[29,30] and this has also been observed in the glyceroldehydrogenase-based ethylene glycol assays [31�33].This appears in some quarters to have been forgottenwith the passage of time or sidelined in the belief thatthis will only be applicable to postmortem tests and notrelevant to clinical testing [34,35]. CAP attempted toaddress this knowledge gap by incorporating a dry casestudy into the 2011 AL-2C proficiency set.
The ADH and LDH (E.C. 1.1.1.27 L-lactate: NAD1
oxidoreductase) reactions are outlined here. Whenboth enzymes and their substrates are present in aspecimen, there are clearly two sources of NADHproduction:
ADHEthanol1NAD1 1H1"acetaldehyde1NADH
LDHLactate1NAD1 1H1"pyruvate1NADH
TABLE 16.4 Comparison of Measured Ethanol Concentrations in Three Samples Containing Only a Nonethanol Toxic Alcohol
Sample Mean Measured Ethanol (mg/dL) Toxic Alcohol by GC (mg/dL)
GC Abbott ADH
REA
ADH UV Vis, all
Methodologies
Ortho
Vitros
Methanol Acetone Isopropanol Ethylene
Glycol
2010 AL2-10 0.75 0.19 0.57 0.37 48.4
2010 AL2-01 0 0.33 0.18 0.14 30.4 71.6
2010 AL2-11 0 0.18 0.17 0.04 152.5
No. of labsreporting
84 41 2548 516
Source: Data from CAP Alcohol Survey (AL2) Samples for 2010 and 2011.
255PROBLEMS WITH CURRENT METHODOLOGIES
ACCURATE RESULTS IN THE CLINICAL LABORATORY
Both ADH and LDH reactions are equilibrium reac-tions, and if both reactions are occurring within a singlespecimen on the analyzer, the enzymes not only competefor NAD1 but also produce NADH at rates consistentwith their concentrations and the appropriate substrateconcentrations in a kinetic assay. Thus, an apparentlylarge amount of ethanol might be determined to be pres-ent in the sample, which may in fact be completelyuntrue. Furthermore, because there is no mechanism inthe test reaction mixture (as opposed to in vivo) to regen-erate NAD1 from NADH, NAD1 may become the limit-ing factor in the ADH and/or the LDH reaction.
In 2010, the CAP Toxicology Resource Committeesponsored a pilot study that demonstrated the continuedoccurrence of false positives in automated ADH ethanoltest kits. In this minisurvey, 50 laboratories agreed totest a serum specimen containing 120 mmol/L sodiumplus 25 mmol/L sodium lactate and also 5000 U/Lhuman LDH (mixed isoenzymes not characterized).Summarized results for the seven different test systemstargeted are shown in Table 16.6. Using a cutoff of10 mg/dL for a positive ethanol result, the DadeDimension, Abbott REA, and Vitros platforms gave thecorrect negative ethanol result for the sample. The Rocheplatform assay results were positive but close to 30 mg/dL, and the other three assays (Beckman, AbbottAeroset, and Microgenics DRI) gave ethanol resultsbetween 70 and 106 mg/dL, representing significantinebriation. Elevated lactate/LDH is mentioned in five
of the manufacturer package inserts: The AbbottAeroset, Roche, and Microgenics DRI methods give acautionary note about lactate and LDH in postmortemsamples but do not give specific details, whereas AbbottADH REA, Randox, and Vitros give specific data onlyfor lactate (tested at 25, 90, and 20 mmol/L, respectively,producing ,10% interference), which is in line with theCAP experimental data. Reference ranges are somewhatmethod dependent, but for serum lactate it is typicallybelow 2 mmol/L, and for LDH it is less than 300 U/L.
It may be confusing to observe that in alcohol deter-mination seemingly similar assays may perform differ-ently. Although informative, manufacturers’ interferencedata can be misleading. Authentic patient specimensrepresent a complex component mix composed ofendogenous metabolites and drug components, whereasmanufacturers’ data are generated by spiking good-quality specimens with purified pharmaceuticals andchemicals. Having a high serum LDH activity is usuallynot sufficient for a significant false positive to occur inthe ADH-based ethanol assay because a high substrate(lactate) concentration is also required. Blood (plasma orserum) is therefore more likely to be affected than urinebecause although there may be a high concentration oflactate in urine, it is unlikely that high-molecular-weightLDHwill also be present in the urine specimen.
It is difficult to identify a precise LDH activity atwhich interference occurs in each ethanol assay kit.Most LDH assays (and hence the value for LDH
TABLE 16.5 Toxic Alcohol Interference Data as Reported in Manufacturer Package Insertsa
Method used Concentration of Alcohol Tested (Apparent Ethanol Concentration), mg/dL
aBeckman and Siemens Advia package inserts do not list interferences.bAbbott Diagnostics, Abbott Park, IL.cMicrogenics Corporation, Fremont, CA.dBeckman Coulter, Brea, CA (incorporating Olympus).eOrtho-Clinical Diagnostics, Rochester, NY.fRandox Laboratories, Crumlin, Co. Antrim, UK.gRoche Diagnostics, Indianapolis, IN.hSiemens Healthcare Diagnostics, Tarrytown, NY.
256 16. ALCOHOL DETERMINATION USING AUTOMATED ANALYZERS
ACCURATE RESULTS IN THE CLINICAL LABORATORY
attributed to the offending sample) employ theInternational Federation of Clinical Chemistry recom-mended lactate-to-pyruvate (L-P) reaction directionbecause it is less dependent on the NAD1 and lactateconcentrations, and there is less contamination ofNAD1 with inhibiting products during manufacture.The reference range is up to 225 U/L for L-P assays,but P-L methods give rather higher results (normal,,450 U/L). More important, the LDH present inhuman serum comprises five isoenzymes (LD1�LD5),composed of heterotetramers of H- and M-type sub-units (4H5LD1 through to 4M5LD5). The typicalpercentage composition in a healthy person’s serum isapproximately 22% LD1, 35% LD2, 23% LD3, and 10%each of LD4 and LD5. The conditions favorable for theP-L reaction direction are a more acidic pH (7.0 opti-mum), a high concentration of pyruvate, a high ratioof NADH to NAD1, and a preponderance of LD5 andLD4. Converse conditions are favorable for the L-Ptogether with a preponderance of LD1 and LD2.
LDH is highly specific for the L(1)-isomer of lactatethat is produced metabolically in humans. Althoughβ-hydroxybutyrate (produced in excess in ketosis) isconsidered a poor substrate for LDH, the isomers donot behave equally in this regard. β-Hydroxybutyrateis in fact the preferred substrate for LD1 (resulting inLD1 being known as hydroxybutyrate dehydrogenase(HBD)), the serum activity of which can be measured,and the ratio of HBD to LDH is used to indicate thetissue-specific source of LDH in a more efficient man-ner than electrophoretic separation of LDH isomers.
It would be tempting to think that by contrast, thedetermination of serum lactate would be straightfor-ward. Most assays for lactate use the enzyme L-lactateoxidase (EC 1.13.12.4; (S)-lactate:oxygen oxidoreductase)to oxidize L-lactate to pyruvate with the concomitant
production of hydrogen peroxide. Whole blood analy-zers (e.g., blood gas analyzers) measure the hydrogenperoxide amperometrically. These methods show signifi-cant interference from glycolic acid, the toxic metaboliteof ethylene glycol [36], and may give values falselyelevated by up to 60 mM [37]. In most plasma lactatemethods on chemistry analyzers, the hydrogen peroxideis consumed in a second enzymatic reaction with peroxi-dase and a chromogenic substrate to form a coloredproduct that is measured spectrophotometrically.Typically, these are less subject to glycolate interference[38] but may return an apparent lactate at approximatelytwice the glycolate concentration. This can sometimesresult in a high absorbance flag and a suppressed lactateresult. The Roche methods do not use lactate oxidasebut, rather, LDH to measure lactate concentration, andthey are subject to less (20%) glycolate interference [39].Therefore, these are more reliable in ethylene glycolintoxication.
CASE REPORT Gharapetian et al. [40] presented threepatients with virtually identical apparent serum ethanolvalues (33, 33, and 34 mmol/L (152�156 mg/dL)) mea-sured using the Siemens ADH-based ethanol assay on aAdvia 1650 analyzer. Following calculation of veryabnormal negative osmolal gaps (�23, �42, and �44),the samples were retested for ethanol on the Siemens(Dade Behring) Dimension RXL Flex reagent and also byGC and found to be negative (,2 mmol/L or ,9.2 mg/dL). Interestingly, all three patients had marked eleva-tions in serum LDH (between 5000 and 10,000 U/L),caused by acetaminophen hepatotoxicity, but only cases1 and 3 had elevated serum lactate concentrations(method of measurement not given) at 22.5 and5.1 mmol/L, respectively; patient 2 had a lactate of only1.2 mmol/L. However, Siemens reported to the authorsthat the LDH would need to be greater than 100,000 U/L(by L-P assay), with a concomitantly elevated lactate,to produce an apparent ethanol concentration of17.4 mmol/L. The patients’ damaged hepatocytes willundoubtedly have spilled a number of substrates andother enzymes besides LDH into their serum, resultingin very high circulating levels of transaminases, otherDHs, amino acids, ammonia, etc. This highlights theimportance of disassociating manufacturer’s spikedinterference data from clinical samples because clearlyadditional factors are at play here in producing the erro-neous ethanol results. The Siemens Advia assay uses aNAD1 analog with high oxidizing potential rather thanNAD1 as the enzyme co-factor.
In most instances, the amount of either lactate or LDHpresent is not sufficient to make a significant contribu-tion to the measured ethanol result. This is partlybecause compared to other toxic substances, serum etha-nol concentrations are relatively large (10�100 mg/dL
TABLE 16.6 Lactate and LDH Interference in Ethanol Assays
Test Method No. of Labs Mean Measured
Ethanol (mg/dL)
Abbott Aeroset 6 102.5
Abbott AxSYM REA 2 9
Beckman (LX & DX) 14 73.2
Microgenics DRI 2 106
Ortho Vitros 7 9.8
Roche Platforms 7 29.3
Siemens Dade Dimension 10 4.2
Source: Data from CAP Toxicology Resource Committee 2010 Pilot Survey, reportedwith 2011 AL2-C.
257PROBLEMS WITH CURRENT METHODOLOGIES
ACCURATE RESULTS IN THE CLINICAL LABORATORY
corresponds to 2.17�21.7 mmol/L). In contrast, lactatehas a reference interval of approximately 0.5�2.2 mmol/L in venous blood.
STRATEGIES FOR REMOVINGINTERFERENCES
When endogenous interference in an enzymaticassay is problematic, blanking and preincubation canhelp reduce interference. This additional step increasesboth cost and analytical time. Unless a large number ofsamples are affected, this modification is not justified.Instrument parameters for U.S. Food and DrugAdministration (FDA)-approved reagent kits are pre-defined within the instrument application and notadjustable by the end user. However, these can some-times be altered if the analyzer has “open-channel” or“user-defined” applications. It is hoped that the re-awareness of this problem and the legal ramificationsof an unreliable result will prompt the manufacturersto reformulate the poorly performing kits. Furtherresearch is required to pursue NAD1 analogs thatreact almost exclusively with ADH and not LDH or doso at vastly differing speeds so that the two reactionscan be isolated from each other. Alternate strategiescould focus on side reactions that make colorless ornon-interfering products. Coupling of the acetaldehydeproduct to another reaction (peroxidase to hydrogenperoxide) with judicious choice of chromogen offerspromise of a visible color reaction that might be distin-guished from the LDH assay.
LDH can be removed from serum with PEG (poly-ethylene glycol) 3000, which osmotically sequesterswater from the sample so the proteins precipitate out.After centrifugation, the clear supernatant is analyzed.This technique is used extensively in clinical chemistryto remove interference from immunoglobulin-bound“macroproteins” such as prolactin, creatine kinase, andamylase [41,42]. Care should be taken to establish thatadded chemicals do not interfere with subsequentreactions, and that any specimen dilution is accountedfor in the final result calculation. Alternatively, aprotein-free filtrate of the sample can be prepared bycentrifugation in a centrifugal filter device to obtain aprotein-free ultrafiltrate [43]; a 30 kDa cutoff is appro-priate for LDH. Such specimen manipulation must becarefully controlled by the processing of quality con-trol samples in parallel to the patient sample. Clearly,it is not practical to process all samples by thisextended assay, and identification of problem sampleswould require simultaneous testing for LDH, whichagain is not practical. Specimen filtration also does notremove excess lactate from the sample, but once the
LDH is removed, lactate is probably no longer a signif-icant problem.
Determining Whether a Problem Exists:Checking for Concordance among Data
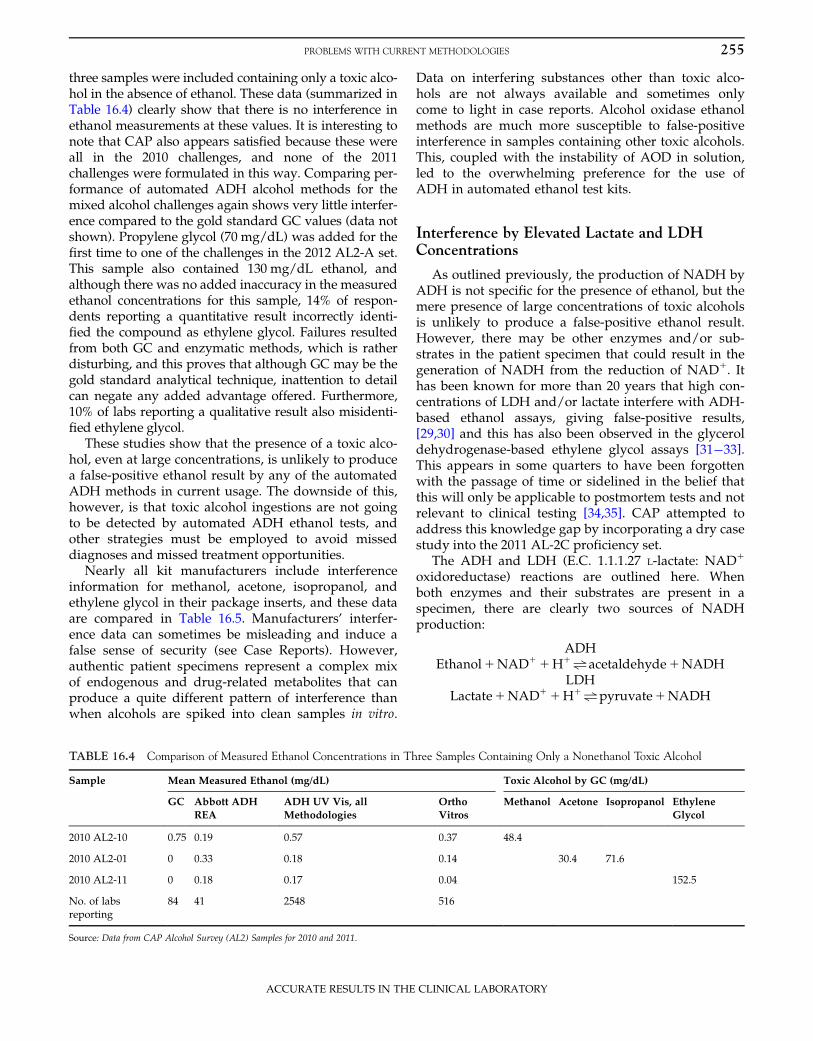
When presented with many hundreds or thousandsof test results in a day, it is difficult for the clinicalchemist to detect those few that might be in error.Modern laboratory information systems (LIS) may beable to run algorithms combining a number of differ-ent results for one patient and then flag or withholdfor checking those identified as outliers. However,when ethanol is the only test requested, identifyingpotential errors becomes even more challenging. Someadditional checks are presented here, which can bedivided into two broad strategies. First, is the ethanolresult accurate or could there have been some interfer-ence due to the patient’s clinical condition? Second, ifthe ethanol result is accurate, did the patient actuallyingest ethanol, or are there other co-ingestants, particu-larly other toxic alcohol metabolites, that complicatethe clinical picture?
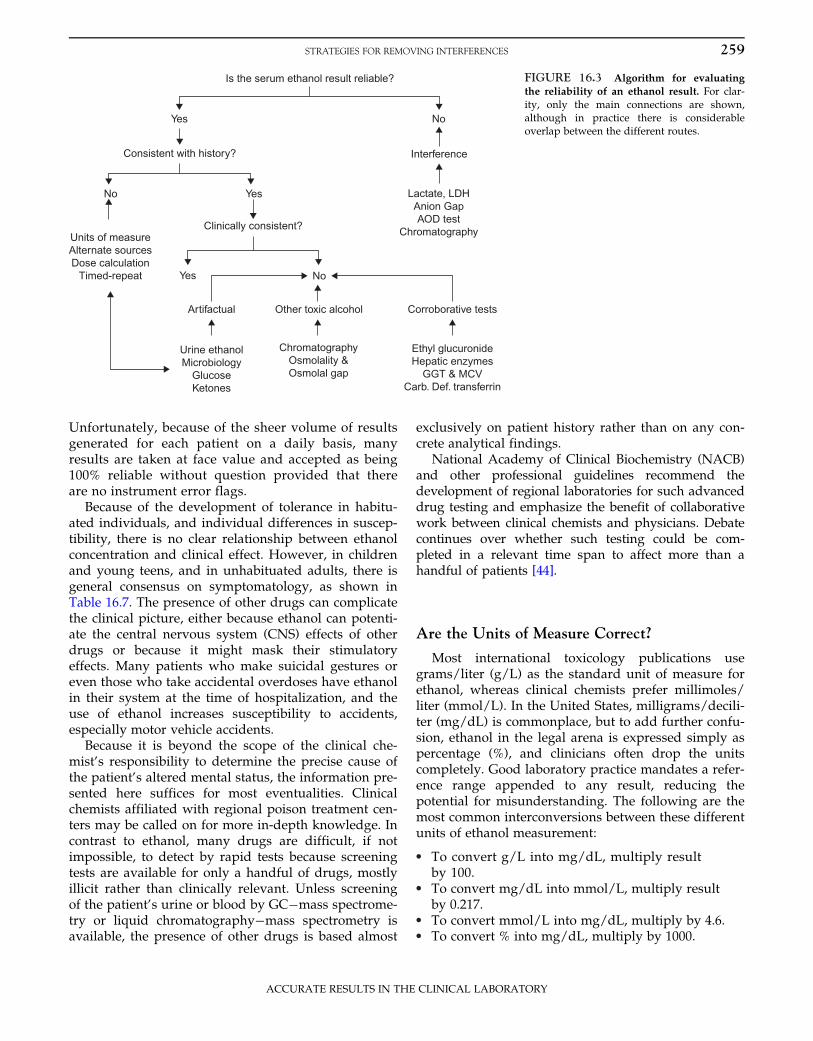
Figure 16.3 sketches an algorithm for evaluating anethanol result for possible error. For the sake of clarity,only the main connections are shown, although inpractice there is considerable overlap between thedifferent routes. One must, however, be cognizant ofthe legal ramifications of reporting results from (orcharging for) tests not requested by the physician butrun by the laboratory solely for the purpose of validat-ing the result of the requested test. Running serumindices for potassium is an obvious and well-acceptedexample, and many instrument manufacturers providethese reagents at no additional cost.
Is the Ethanol Result Consistent with thePatient’s Presentation?
Many labs performing testing for their ownpatients have access to a regularly updated electronicmedical record through their hospital informationsystem. Laboratories in smaller hospitals may not beso fortunate, but their LIS or their automated instru-ment middleware should be able to capture results ofall tests performed on the patients. However, theinterpretation is more difficult if the testing is notbeing done at the site of the patient’s admissionbecause not all records of tests done may even beavailable. In these latter situations, it is even moreimportant that testing personnel or those designatedto interpret the tests have a firm understanding of thelimitations and are able to explain them concisely topersonnel at the site where the patient is located.
258 16. ALCOHOL DETERMINATION USING AUTOMATED ANALYZERS
ACCURATE RESULTS IN THE CLINICAL LABORATORY
Unfortunately, because of the sheer volume of resultsgenerated for each patient on a daily basis, manyresults are taken at face value and accepted as being100% reliable without question provided that thereare no instrument error flags.
Because of the development of tolerance in habitu-ated individuals, and individual differences in suscep-tibility, there is no clear relationship between ethanolconcentration and clinical effect. However, in childrenand young teens, and in unhabituated adults, there isgeneral consensus on symptomatology, as shown inTable 16.7. The presence of other drugs can complicatethe clinical picture, either because ethanol can potenti-ate the central nervous system (CNS) effects of otherdrugs or because it might mask their stimulatoryeffects. Many patients who make suicidal gestures oreven those who take accidental overdoses have ethanolin their system at the time of hospitalization, and theuse of ethanol increases susceptibility to accidents,especially motor vehicle accidents.
Because it is beyond the scope of the clinical che-mist’s responsibility to determine the precise cause ofthe patient’s altered mental status, the information pre-sented here suffices for most eventualities. Clinicalchemists affiliated with regional poison treatment cen-ters may be called on for more in-depth knowledge. Incontrast to ethanol, many drugs are difficult, if notimpossible, to detect by rapid tests because screeningtests are available for only a handful of drugs, mostlyillicit rather than clinically relevant. Unless screeningof the patient’s urine or blood by GC�mass spectrome-try or liquid chromatography�mass spectrometry isavailable, the presence of other drugs is based almost
exclusively on patient history rather than on any con-crete analytical findings.
National Academy of Clinical Biochemistry (NACB)and other professional guidelines recommend thedevelopment of regional laboratories for such advanceddrug testing and emphasize the benefit of collaborativework between clinical chemists and physicians. Debatecontinues over whether such testing could be com-pleted in a relevant time span to affect more than ahandful of patients [44].
Are the Units of Measure Correct?
Most international toxicology publications usegrams/liter (g/L) as the standard unit of measure forethanol, whereas clinical chemists prefer millimoles/liter (mmol/L). In the United States, milligrams/decili-ter (mg/dL) is commonplace, but to add further confu-sion, ethanol in the legal arena is expressed simply aspercentage (%), and clinicians often drop the unitscompletely. Good laboratory practice mandates a refer-ence range appended to any result, reducing thepotential for misunderstanding. The following are themost common interconversions between these differentunits of ethanol measurement:
• To convert g/L into mg/dL, multiply resultby 100.
• To convert mg/dL into mmol/L, multiply resultby 0.217.
• To convert mmol/L into mg/dL, multiply by 4.6.• To convert % into mg/dL, multiply by 1000.
Is the serum ethanol result reliable?
Yes
Yes
Yes
No
No
No
Interference
Lactate, LDHAnion GapAOD test
Chromatography
Consistent with history?
Units of measureAlternate sourcesDose calculation
Timed-repeat
Clinically consistent?
Artifactual Other toxic alcohol Corroborative tests
Urine ethanolMicrobiology
GlucoseKetones
ChromatographyOsmolality &Osmolal gap
Ethyl glucuronideHepatic enzymes
GGT & MCVCarb. Def. transferrin
FIGURE 16.3 Algorithm for evaluating
the reliability of an ethanol result. For clar-ity, only the main connections are shown,although in practice there is considerableoverlap between the different routes.
259STRATEGIES FOR REMOVING INTERFERENCES
ACCURATE RESULTS IN THE CLINICAL LABORATORY
Is the Measured Ethanol ConcentrationAppropriate for the Ethanol Dose Ingested ifKnown?
Estimating dosages for exposures is notoriously dif-ficult. It is tempting to envisage the worst possible sce-nario, in children especially, and surmise that if thebottle is now half full, then the patient must haveingested the other half. Small children do not ofteningest a sufficient amount to seriously harm them-selves, and because they have no better aim withtablets or alcohol than they have with food, the sceneoften looks far more dramatic than its reality.
The following is a relatively simple calculation(Widmark’s formula):
Dose5Vd3BW 3Cp or Cp5Dose
Vd3BWð16:1Þ
where the dose of pure ethanol is estimated in grams;Vd, the distribution volume of ethanol, is 0.55 L/kg infemales and 0.68 L/kg in males; BW is the body
weight in kilograms; and Cp is the blood ethanol con-centration in grams/liter.
It is then only a short step to calculate the volumeof beverage consumed by multiplying by the ethanolcontent of the formulation, remembering that “proof”is twice the percentage composition (approximatevalues are as follows: beer, 3 g/100 mL; wine, 8 g/100 mL; and spirits, 35 g/100 mL). As a rule, one“unit” of ethanol is approximately 12 g.
If the ethanol concentration is not appropriate forthe ingested dose, the patient history is in error, theethanol result may not be correct, or there may havebeen an alternate source of ethanol, such as thosedescribed in the next section.
Occasionally, a falsely low serum ethanol concentra-tion is discovered. This most often occurs when aseverely traumatized patient has been resuscitated emer-gently with large amounts of transfused (ethanol-nega-tive) blood, red blood cells, or colloid at the time thesamples are being drawn for analysis. Dilution of thesample directly from the line fluid by poor phlebotomytechnique is also possible, and this is usually discoveredbecause the hematocrit is very low, glucose is exception-ally high, or the electrolytes are out of balance [45].
Can the Presence of Ethanol in a Specimen beExplained by Something other Than Ingestionby the Donor?
If the serum or urine ethanol result is valid, thereare a number of alternative explanations for itspresence other than ingestion of beverage alcohol.These include, but are not limited to, direct or indirectcontamination. “Auto-brewery syndrome” has beeninvoked as a legal defense against DUI, but this in vivogeneration of ethanol by the gastrointestinal tract hasrarely been proven, and then not outside of Japan. It isbelieved to be the result of a combination of low muco-sal and hepatic ADH activity, high intake of rice, andconcomitant yeast infection [46].
Non-beverage ethanol is present in many commonhousehold items: Perfumes and aftershaves are 60�95%ethanol, hand sanitizer 65%, food essences 35%, mouth-wash 15�35%, and NyQuil 10% ethanol. There is atrend for young teens to abuse ethanol in products suchas beverages with caffeine and in canned whippedcream, ethanol-laced Jell-O and gummy bears, andeven ethanol-soaked tampons [47�49].
Dermal absorption of alcohols is generally insignifi-cant, [50] but once the epidermis is damaged, absorp-tion may be increased 1000-fold. Bandages soakedwith ethanol and applied for preoperative preparationfor plastic surgery in a 2-year-old girl resulted in sig-nificant toxicity: 12 hr later, the child was comatose,
TABLE 16.7 Relationship of Serum Ethanol Concentration andClinical Effect in Children and Nonhabituated Adults
Serum Ethanol(mg/dL)
Typical Clinical Picture
,25 Feeling of warmth and well-being
Talkativeness and mild disinhibition
25�50 Euphoria
Poor judgment
Diminished fine motor coordination
50�100 Decreased sensorium
Impaired coordination, balance, and gait
Slowed reflexes and increased reaction time
Emotional lability
100�250 CNS dysfunction—ataxia, diplopia, slurredspeech, visual impairment, and nystagmus
260 16. ALCOHOL DETERMINATION USING AUTOMATED ANALYZERS
ACCURATE RESULTS IN THE CLINICAL LABORATORY
with serum ethanol 80 mg/dL and glucose 15 mg/dL[51]. Immature skin is also highly alcohol-permeable,and there are case reports of premature infants withsystemic toxicity following application of surgical spiritto cleanse skin prior to surgical procedures. For exam-ple, a serum ethanol of 259 mg/dL was reported 18 hrpostprocedure in a 27-week-old neonate, with methanolof 26 mg/dL [52]. Surgical spirit (95% ethanol and 5%methanol) is the equivalent of rubbing alcohol, which inthe United States contains isopropanol.
Adulteration of urine samples submitted for drugtesting has been a problem since testing first began. Anumber of adulterant tests are used in legal testing,but these are not commonly applied in the clinical set-ting. Because testing proceeds to confirmation only ifthe primary screen is positive, adulteration aims tomake the screen test negative by denaturing the anti-body or preventing it from binding to its target drug.Ethanol or other alcohols are sometimes used for thispurpose, but adulterers are often rather generous withthe amount of additive, and the contamination is oftenobvious as soon as the top is taken off the tube.
CASE REPORT A 46-year-old patient with a longpsychiatric history was receiving treatment for overuseof prescription pain medications. On her first visit, herurine screened positive for opiates, oxycodone, andacetaminophen; acetone was detected by GC at greaterthan 400 mg/dL, but with no trace of isopropanol(,10 mg/dL) or evidence of ketone bodies. Theunusual alcohol result was noted in the patient’s chartas suggestive of contamination rather than ingestion.Two weeks later, her urine screened positive foroxycodone, benzodiazepines, and salicylates, and itwas found to contain isopropanol at 6500 mg/dL;again a comment on suspected contamination wasentered in the chart. On the third visit, the drugs ofabuse panel was negative, but the urine appeared verydilute with a measured ethanol of 98,050 mg/dL(creatinine , 0.02 mg/dL and blood urea nitrogen(BUN) , 1 mg/dL). After the physician was alerted,the patient was challenged and elected to seek medicalcare elsewhere.
Any specimen with an ethanol content greater than15,000 mg/dL is almost certainly contaminated regard-less of the symptomatology. In the case presented byFoley [53], a specimen submitted for drug testing froma heroin abuser was determined to have an ethanolcontent of 125 g/L (12,500 mg/dL) by headspace GC.A concomitant blood ethanol was negative, and it wasdetermined that the ethanol had been added to theurine by a laboratory technician who misread the etha-nol order for an instruction to add ethanol as a fixativefor cytology testing. In addition to these less commonsources of ethanol exposure, generation of ethanol
in vitro is a real cause for concern, and its prevention isaddressed next.
Has the Specimen Been Preserved Correctly?
Ideally, specimens for ethanol testing (and lactate)should be collected into fluoride oxalate to inhibit gly-colysis and prevent generation of ethanol by certainbacteria or yeasts within the specimen. The desire toprevent therapeutic anemia results in specimen consol-idation, and because fluoride oxalate is unsuitable formany clinical tests (the salt adds approximately150 mOsm/kg to the osmolality) and preservation isconsidered unnecessary when samples are to be pro-cessed emergently, ethanol tests are usually performedon serum, heparinized plasma, or unpreserved urine.Microbial contamination could be endogenous if thepatient is septic or has a urinary tract infection (UTI),or it might have been introduced by aseptic collectiontechniques. The amount of required substrates in urinefrom healthy donors is usually too low to be of impor-tance, but if the patient has ketosis—whether diabetic(hyperglycemic) or alcoholic (hypoglycemic)—ethanolproduction may be sufficient, if the correct microbesare present, to suggest severe toxicity [54]. Indeed, asmall amount of fermentation may actually take placewithin the bladder if there is urinary stasis with a UTIsuch as Candida albicans.
When dealing with nonbiological specimens submit-ted for ethanol analysis, the same contamination con-siderations apply, as highlighted by the following case.
CASE REPORT A 2-year-old child was admittedrepeatedly with unexplained ethanol intoxication(serum ethanol 95�148 mg/dL) and hypoglycemia(glucose 30�42 mg/dL). Because of the allegations ofabuse and/or neglect, the parents were interviewed.Several items were confiscated from the patient’sroom, including a part-full bottle of orange juice. Thejuice tested positive for ethanol (2530 mg/dL), and thecause of the poisoning was believed to have beenfound. However, the finding that “still” orange juicewas submitted for analysis disproved this theorybecause the juice contained not only ethanol but alsoconsiderable gas by the time it was tested.Fermentation had obviously occurred.
Does the Ethanol Concentration Decline at theExpected Rate? The Twenty-Per-Hour Rule
In suspected intoxication, the differential diagnosisis broad, and additional tests, including imaging, arewarranted if:
• the reported presence of ethanol was completelyunexpected
261STRATEGIES FOR REMOVING INTERFERENCES
ACCURATE RESULTS IN THE CLINICAL LABORATORY
• the concentration is of extremely high proportion• the concentration does not decline at a rate of
approximately 20 mg/dL per hour• the patient has not woken up in the expected time
or• the patient is a child or young adolescent.
Ethanol “dosing” typically occurs over an extendedtime span compared to conventional oral medications.Its bioavailability ranges from less than 10% at 10 mg/dL to 90% at 100 mg/dL due to saturable first-passmetabolism of ADH in the duodenal/gastric mucosaand liver [55], with peak blood concentrations approxi-mately 60 min after ingestion; the effect of delayedgastric emptying is less pronounced than with soliddrug formulations.
The majority of postabsorptive ethanol metabolismoccurs in the liver at a rate dependent on the activityof hepatic ADH, which converts approximately 95% ofthe dose to acetaldehyde. CYP2E1 also oxidizes etha-nol to acetaldehyde once the blood concentrationexceeds 30 mg/dL (its Km5 60�80 mg/dL). In contrastto ADH, this enzyme is inducible by ethanol, andalcoholics may route up to 30% of the dose via thispathway [56]. Regardless of the route of formation,acetaldehyde is toxic both to the liver and systemicallyas it forms adducts with cellular components—DNA,proteins, enzymes, and lipids. Acetaldehyde degrada-tion is rapid through mitochondrial aldehyde dehydro-genase (ALDH) to produce acetate [57]. Thereoxidation of NADH determines the redox potentialof the cell and thus determines many aspects of hepa-tocyte homeostasis.
Ethanol kinetics differs between males and females:Distribution volume (total body water) is lower infemales (0.55 vs. 0.68 L/kg) due to their higher per-centage of fat, and gastric ADH is expressed at loweractivity [58]. Human ADH (in contrast to the yeastenzyme) is substrate saturated at low ethanol concen-trations (Km is only 5�10 mg/dL), and metabolismproceeds by zero-order kinetics when serum ethanol isgreater than 25 mg/dL. The rate is usually expressedin terms of a decline in serum ethanol, and a rangebetween 13 and 25 mg/dL/hr is often quoted—hencethe mean “twenty per hour” rule, although this issometimes wider in ED patients [59,60]. Althoughhepatic function is severely compromised in cirrhosis,there is no compelling evidence that the rate of ethanolmetabolism is altered [61,62].
Both ADH and ALDH in humans have importantisoenzymes and polymorphisms. Human ADH is a het-erodimeric protein, encoded by at least seven genes,producing more than 20 dimers with different rates ofethanol metabolism [63,64]. ALDH2 is the most impor-tant of the nine different subtypes for ethanol
metabolism. The polymorphism 487Glu-Lys, associatedwith almost complete loss of function, is carried byapproximately 40% of Asians, and the accumulation ofacetaldehyde is responsible for the flushing, hypotonia,and tachycardia seen in these individuals after onlyminute doses of ethanol [65].
Are the Osmolality and Osmolal GapAppropriate?
Osmolality is a colligative property of solutions: Alldissolved compounds contribute equally based ontheir number of particles present. Serum osmolalitycan be measured directly by osmometry (true osmolal-ity; OSM), or it can be calculated (OSMc) by measuringthe major osmotically active substances present. In ahealthy person, these are sodium, glucose, and urea(BUN). Once these values are substituted into a for-mula, OSMc is obtained (Eqs. 16.2a�16.2d). Becausethe presence of ethanol is so common, a number of for-mulae have been derived based on studies of healthyindividuals or patients with known exposure to etha-nol alone. The one most commonly used in medicine isthat of Smithline and Gardner [66] modified to includeethanol by Purssell et al. [67], noting that all measure-ments are made in mmol/L:
ð16:2dÞUsing the 1.25 molar multiplier (3.7 traditional unit
divisors) as opposed to the theoretical 1.0 and 4.6 inpart accounts for the body’s response to the osmoticeffect of ethanol by releasing cellular osmolyte andmetabolic derangements such as elevated serum aminoacids that result from the effects of ethanol on metabo-lism [68]. In addition, ethanol alters the dissociationbehavior of other analytes within the serum, thus dis-torting the osmolality [69].
The difference between the measured and thecalculated osmolality is termed the osmole gap(OG5OSM�OSMc). The practical value of the OGfrom the laboratory’s perspective is to ensure that a
262 16. ALCOHOL DETERMINATION USING AUTOMATED ANALYZERS
ACCURATE RESULTS IN THE CLINICAL LABORATORY
measured ethanol value is consistent with the mea-sured osmolality. From the physician’s perspective, theclinical value of the OG is to determine whether otherpathological substances are in the patient’s serum con-tributing to OSM that are not accounted for in theOSMc value. Specifically, in practical terms, the OG ishelpful in deducing the presence of other toxic alco-hols, such as methanol, isopropanol, or ethylene andpropylene glycols, especially in situations in whichdirect measurements of these are not available in atime-sensitive manner. Therefore, if the ethanol mea-surement is inaccurate, then an OG may be attributederroneously to the presence of a toxic alcohol, or con-versely one may be assumed not to be present when infact it is, thus missing potential treatment options.Also note that normal gap values can vary considerablywith instrumentation, so what constitutes normal mustbe taken in the context of each laboratory or patientgroup. For example, in one study, [70] OGs in healthypatients increased by approximately 12 mOsm/kg dur-ing the period 1996 to 2004.
There is considerable interest in using the rear-ranged form of the OG equation to calculate the etha-nol concentration present [71]:
Ethanol conc: mg=dL5OG3 3:7 ð16:3Þ
However, actual ethanol concentrations could not bepredicted with sufficient accuracy when testing patientspecimens [72]. This is partly because the wide range fora normal OG makes it difficult to decide how much of theOG to attribute to the ethanol; at higher ethanol concen-trations, investigators consistently report overestimationof the ethanol concentration by the OG, sometimes by asmuch as 30% [73]. Taking this notion one step further,even in the presence of ethanol, the concentration ofanother toxic alcohol could theoretically be estimatedfrom its molecular weight. The osmotic activity attributedto 1 mg/dL of each is as follows: methanol,0.34 mOsm/kg; isopropanol, 0.17 mOsm/kg; ethyleneglycol, 0.16 mOsm/kg; and propylene glycol,0.13 mOsm/kg. OGs in children are even more problem-atic to interpret because a normal OG may reach22 mOsm/kg, which is unfortunate because young chil-dren are one of the patient populations most at risk of anunknown ingestion who would benefit from an earlydiagnosis [74].
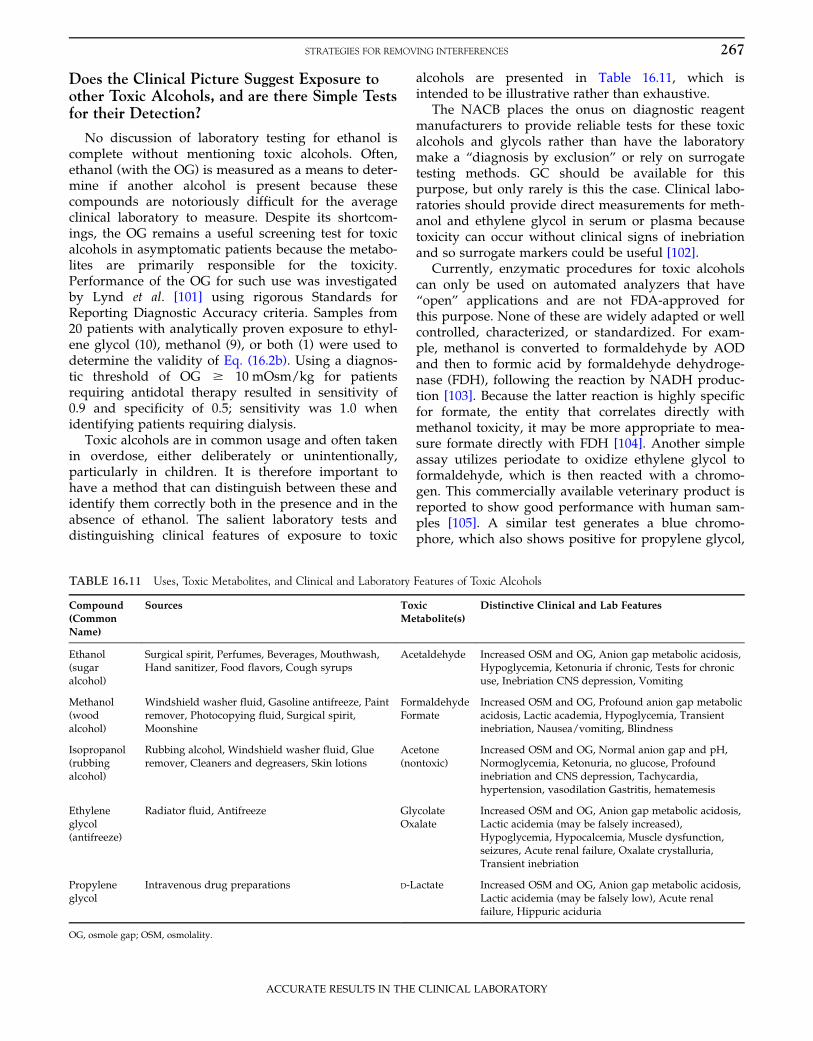
Despite these caveats, the OG remains a particularlyuseful screening test for toxic alcohols in asymptomaticpatients due to the fact that the latency period to symp-toms can be long because it is the production of metabo-lites that is responsible for the majority of the toxicity.
In the three cases reported by Gharapetian et al. [40]described earlier in this chapter, the OSMs were 306,286, and 278 mOsm/kg, respectively. The calculated
OGs if ethanol was absent were relatively normal forsuch sick patients at 18, �1, and �1 mOsm/kg, respec-tively, but if ethanol was indeed positive at the concen-trations measured, the OGs recalculated to �23, �42,and �44 mOsm/kg, respectively. Such grossly abnor-mal results should immediately raise suspicion thatone of the parameters measured is in error.
The method by which serum osmolality is measuredsignificantly affects the reliability of the result in thepresence of volatile components. Because of the fre-quency with which ethanol is responsible for hyperos-molar samples, osmolality must be measured byfreezing point depression (FDP) rather than by vaporpressure dew point depression (VPD). Because there isa linear relationship between the ethanol concentrationand ΔOSM (the difference between FPD and VPDosmometry results), this has been used as a tool forestimating serum ethanol [75]. In clinical practice, itwould be unusual to have both types of osmometryavailable because FPD is increasingly becoming thetechnique of choice.
CASE REPORT Walker et al. [76] described a patientin whom methanol toxicity was strongly suspectedbased on history, visual impairment, and severe AGmetabolic acidosis. No OG was present, but the patientwas dialyzed and treated with ethanol infusion withgood result. Later, the serum methanol was reportedto be greater than 100 mg/dL. Investigation revealedthat osmolality had been measured using VPD, andsubsequent in vitro testing confirmed the insensitivityof VPD to toxic values of both methanol and ethanol.Thus, it is important to be cognizant of the techniqueused by the laboratory to avoid missing a potentiallylife-threatening but treatable intoxication.
Are the Ethanol Ratios Appropriate in DifferentFluids?
Table 16.8 shows the average values for blood etha-nol compared to other fluids. There is considerablevariation between individuals and with time sinceingestion. The presence of certain bacteria, eitherendogenous or exogenously introduced, adds furthervariability. Postmortem considerations for obtainingaseptic samples are not applicable to clinical testing,and vitreous humor is included only for illustrativepurposes.
With the exception of the first 90 min after inges-tion, urine ethanol always exceeds that of the serum,with a ratio typically of 1.2�1.3 urine:serum in theearly postabsorptive phase, increasing to 1.4�1.5 later.In the terminal stages after exposure, the ratioincreases appreciably because ethanol is present in
263STRATEGIES FOR REMOVING INTERFERENCES
ACCURATE RESULTS IN THE CLINICAL LABORATORY
bladder urine hours after the serum alcohol is no lon-ger detectable [77]. However, during the absorptionphase, the plasma is higher than the urine, although ittakes only 10 min for ingested ethanol to appear in“primary” (i.e., ureter) urine [78]. Thus, the ratio of theethanol content of the two fluids might be used notjust to determine the historical time course of eventsbut also to check the validity of results. For example, aserum ethanol measured at 350 mg/dL with a simulta-neous urine ethanol of only 20 mg/dL must indicatethat the patient ingested a large amount of ethanol inthe minutes prior to sampling, that the serum ethanolwas grossly overestimated due to an interfering sub-stance, or that the blood was contaminated duringphlebotomy. Although the urine may have been mea-sured using the same assay as the serum, active LDHwill not be present in the urine and so will notproduce a false-positive ethanol result in the way thatthe serum might.
When attempting to reconcile results between differ-ent fluids, the following caveats should be noted:
• The effect of shock on metabolism and excretion ofethanol
• How blood loss affects the dynamics of distribution• Administration of blood product, fluids, or colloid.
The validity of measuring ethanol in breath is basedon the relationship of ethanol in end-expired (alveolar)air and that in the alveolar blood supply described byHenry’s law. Thus, 1 mL of blood contains the sameamount of ethanol as 2100 mL of breath at 34�C, thetemperature of end-exhaled air. Currently, a numberof breath ethanol analyzers are approved for use bythe FDA [79] for workplace testing and ED use. Theseuse infrared spectrometry; the primary wavelengthsused for ethanol are 3.4 and 9.5 μm, corresponding to
the C�H and C�O bond vibrational stretching, respec-tively. Loss in infrared energy across the sample repre-sents the amount of ethanol present. Currentinstruments use five different wavelengths to enhanceselectivity and abolish interference from acetone [80].Many devices are calibrated to display in blood etha-nol equivalent rather than the absolute breath ethanolconcentration. The 15 min delay in sampling eliminatescontamination from residual beverage in the mouth.
Saliva or, more correctly, oral fluid is becomingincreasingly popular for all types of drug testing becauseof its noninvasive nature and relative immunity fromadulteration [81]. This fluid can be tested by any of theautomated ADH-based tests described in this chapter.However, for point-of-care testing, AOD methods pre-dominate because these are most easily converted tovisual signals (see Figure 16.1). Semiquantitative teststrips are available that show good correlation betweensaliva and serum ethanol concentrations [82,83].(Example products include DrugCheck Alcohol RapidTest and DrugCheck SalivaScan, Express DiagnosticsInternational, Blue Earth, MN; Alco-Screen, CraigMedical Distribution, Vista, CA; Saliva Alcohol TestStrip, Dipromed, Weigelsdorf, Austria; OratectPlus,Branan Medical, Irvine, CA; and Q.E.D. Saliva AlcoholTest, OraSure Technologies, Bethlehem, PA.)
Could there be Interference from LactateDehydrogenase?
The properties of LDH and the reaction by which itcauses interference in ADH-based assays that rely onNADH production were described previously.Although LDH assays are widely available and inex-pensive on automated chemistry platforms, the test isnot routinely ordered because it is not tissue specific.Its main clinical use is to monitor hemolysis or celllysis following chemotherapy or progression of skele-tal muscle disorders. LDH is found in high concentra-tions in all cells that utilize glucose for energy. Becauseerythrocytes contain more than 500 times the LDH ofserum, even a small amount of hemolysis can substan-tially elevate the serum LDH. LDH is elevated inmany disorders, as shown in Table 16.9; however, thislist is by no means exhaustive, and the amount of ele-vation is quite variable, although the hemolytic causesoften give higher results.
Common sense dictates that an isolated elevation inserum LDH, although necessary, is not sufficient toproduce interference; an abnormally large substrateconcentration (i.e., elevated serum lactate) should alsobe a prerequisite. The Km of hepatic LDH for lactate is14 mM [84], whereas physiologic concentrations areless than 2 mM. However, case studies highlight that
TABLE 16.8 Comparison of Ethanol Content of Different FluidsRelative to Whole Blood
Fluid Fluid:Whole Blood Ratio
Whole blood 1.00
Serum or plasma 1.16
Urine 1.3 at equilibrium
Vitreous humor 1.2
Bile 1.0
Cerebrospinal fluid 1.1
Kidney 0.7
Liver 0.6
Brain 0.8
Breath 1/21005 0.000476
264 16. ALCOHOL DETERMINATION USING AUTOMATED ANALYZERS
ACCURATE RESULTS IN THE CLINICAL LABORATORY
additional unidentified chemical reactions are contribu-tory because interference can occur at normal lactate con-centrations [40]. A concentration of 1000 U/L of hepaticLDH uses 1 mmol lactate/min, furnishing 1 mmolNADH/min. The same NADH production rate fromADH corresponds to approximately 5 mg/dL ethanol.
If the result of an ADH-based ethanol result is indoubt, it is quick and inexpensive to test the urine speci-men with a point-of-care testing semiquantitative alcoholdipstick based on AOD detection. Because the two meth-odologies have different common interferents, it isunlikely that the results will be concordant unless etha-nol is indeed present.
Does the Patient have an Anion Gap Acidosis orKetosis?
Metabolic acidosis results from increased productionof metabolic acids or lack of metabolic base (bicarbon-ate). Those with a normal anion gap typically result fromgastrointestinal or renal disorders of electrolyte balance.An elevated anion gap acidosis, particularly in the inten-sive care unit setting, is commonly caused by the pres-ence of lactic acid. The differential diagnosis of lacticacidosis is long (Table 16.10) and beyond the scope ofthis chapter. In hypoxic states, or where there is mito-chondrial dysfunction inhibiting the tricarboxylic acidcycle, the end product of glycolysis must be convertedinto lactate, which subsequently accumulates.
Ketosis occurs when cells contain insufficientglucose to sustain ATP demand. Counterregulatoryhormones ensure lipolysis, and fatty acids are oxidizedfor energy. Accumulated hepatic acetyl CoA isconverted to acetoacetate and then to acetone orβ-hydroxybutyrate. Ketonemia arises when hepaticketone production outstrips the capacity of extrahepatictissues to oxidize them. The organic anions acetoacetateand β-hydroxybutyrate result in anion gap acidosis.The two main causes of ketoacidosis are diabetic keto-acidosis (DKA) and alcoholic ketoacidosis (AKA); star-vation ketosis is similar to AKA. The urine screenspositive for ketones in both presentations, and theserum hydroxybutyrate is elevated (more so in DKAthan in AKA or starvation), but the two can easily bedistinguished by simple and inexpensive tests: hyper-glycemia (.500 mg/dL) and positive urine glucose inDKA, and hypo- or normoglycemia and an absence ofglucose in the urine in AKA. DKA was discussed previ-ously as a potential cause of factitious urine ethanol.
Determination of the anion gap(AG5 ½Na1K�2 ½Cl1HCO3�) usually involves no addi-tional cost to the laboratory because electrolyte measure-ments are standard of care. The anion gap calculation canbe performed automatically for all electrolyte orders inthe lab’s middleware or LIS. Lactate is also commonlymeasured in the emergency or critical care setting, and itis available on most blood gas analyzers and confirms theAG calculation. It was previously noted that L-lactateassays, especially those using electrochemistry, may beunreliable in the presence of the ethylene glycol metabo-lite glycolate. As with any laboratory test, it is importantto understand the performance characteristics of the assayused to measure lactate.
Are there other Indicators or Markers ofEthanol Ingestion?
Markers of ingestion may be aimed at detectingeither acute (ethyl glucuronide) or chronic exposure
TABLE 16.9 Causes of Elevated Lactate Dehydrogenase
(hepatic enzymes, hematological markers, andcarbohydrate-deficient transferrin). Although chronicmarkers are not essential for verification of ethanolingestion, they can help identify alcohol abusersbecause physicians may otherwise recognize only20�50% of patients with alcoholism [85]. For example,chronic alcoholics may have an unusually mild intoxi-cation for the amount of ethanol measured, and theyare also more likely to use other toxic alcohols forheightened effects or for economic reasons. No singlelaboratory test is reliable enough on its own to supporta diagnosis of alcoholism [86,87].
Ethyl Glucuronide
Ethyl glucuronide is a minor metabolite of ethanol,accounting for less than 0.1% of the dose, produced byenzymatic conjugation of ethanol with glucuronic acid.In contrast to ethanol, ethyl glucuronide is nonvolatile,water-soluble, and stable to storage—properties thatgive it significant advantages as a routine test for etha-nol use. Its presence is highly specific for ethanol, andit can be found in urine, serum, and oral fluid for 3�5days after a single 50 g dose of ethanol. This is a favor-able detection span compared to that of ethanol, whichis typically 10�24 hr in body fluids. Currently, the testis not widely used clinically, although enzyme
immunoassay kits are available for some automatedplatforms [88]. This screening test has the potential toprovide a rapid cross-check on a serum ethanol that isinconsistent with the history or symptoms, and it maybe performed in the routine chemistry lab on the sameautomated analyzer as that used for the original etha-nol test [89].
Hepatic Transaminases
Assays for the transaminases AST and ALT are uni-versally available on automated chemistry analyzersand are inexpensive to perform. Both enzymes areelevated in chronic liver disease but usually less than1000 U/L; higher values reflect acute hepatic distur-bance. The De Rittis ratio (AST:ALT) is a reliablemarker to distinguish between alcoholic (.2) andnon-alcoholic (,1) liver disease (see Chapter 9) [90].
γ-Glutamyl Transferase and Mean CorpuscularVolume
The activity of γ-glutamyl transferase (GGT) and thered blood cell mean corpuscular volume (MCV) havebeen the traditional markers of chronic ethanol use:Serum GGT greater than 500 U/L with an MCVgreater than 100 fL in the absence of another conditionshould raise suspicion of ethanol abuse [91,92]. Bothtests are readily available in most laboratories. Careshould be taken to rule out megaloblastic anemia fromB12 and/or folate deficiency as the cause of anincreased MCV. GGT lacks specificity because numer-ous disorders and drugs can elevate GGT, includingdiabetes, hyperthyroidism, cardiac and renal disease,smoking, barbiturates, phenytoin, carbamazepine, andrifampicin [93,94].
Carbohydrate-Deficient Transferrin
In habitual drinkers, the proportion of transferrinwith none, one, or two sialic acid chains (collectivelytermed carbohydrate deficient transferrins (CDT)) isgreater than 6%, whereas healthy individuals with noor low alcohol consumption will have a CDT less than2%. CDT analysis is somewhat specialized (high-per-formance liquid chromatography, capillary electropho-resis, and isoelectric focusing) [95�97], but animmunoassay has become available on automatedchemistry platforms [98]. However, genetic transferrinvariants, and some non-alcoholic hepatic diseases suchas hepatocellular carcinoma, chronic hepatitis C, andprimary biliary cirrhosis, give false positives, and themain strength of the test lies in detection of relapse inchronic alcoholics [99,100].
TABLE 16.10 Causes of Elevated Lactate Concentration
266 16. ALCOHOL DETERMINATION USING AUTOMATED ANALYZERS
ACCURATE RESULTS IN THE CLINICAL LABORATORY
Does the Clinical Picture Suggest Exposure toother Toxic Alcohols, and are there Simple Testsfor their Detection?
No discussion of laboratory testing for ethanol iscomplete without mentioning toxic alcohols. Often,ethanol (with the OG) is measured as a means to deter-mine if another alcohol is present because thesecompounds are notoriously difficult for the averageclinical laboratory to measure. Despite its shortcom-ings, the OG remains a useful screening test for toxicalcohols in asymptomatic patients because the metabo-lites are primarily responsible for the toxicity.Performance of the OG for such use was investigatedby Lynd et al. [101] using rigorous Standards forReporting Diagnostic Accuracy criteria. Samples from20 patients with analytically proven exposure to ethyl-ene glycol (10), methanol (9), or both (1) were used todetermine the validity of Eq. (16.2b). Using a diagnos-tic threshold of OG $ 10 mOsm/kg for patientsrequiring antidotal therapy resulted in sensitivity of0.9 and specificity of 0.5; sensitivity was 1.0 whenidentifying patients requiring dialysis.
Toxic alcohols are in common usage and often takenin overdose, either deliberately or unintentionally,particularly in children. It is therefore important tohave a method that can distinguish between these andidentify them correctly both in the presence and in theabsence of ethanol. The salient laboratory tests anddistinguishing clinical features of exposure to toxic
alcohols are presented in Table 16.11, which isintended to be illustrative rather than exhaustive.
The NACB places the onus on diagnostic reagentmanufacturers to provide reliable tests for these toxicalcohols and glycols rather than have the laboratorymake a “diagnosis by exclusion” or rely on surrogatetesting methods. GC should be available for thispurpose, but only rarely is this the case. Clinical labo-ratories should provide direct measurements for meth-anol and ethylene glycol in serum or plasma becausetoxicity can occur without clinical signs of inebriationand so surrogate markers could be useful [102].
Currently, enzymatic procedures for toxic alcoholscan only be used on automated analyzers that have“open” applications and are not FDA-approved forthis purpose. None of these are widely adapted or wellcontrolled, characterized, or standardized. For exam-ple, methanol is converted to formaldehyde by AODand then to formic acid by formaldehyde dehydroge-nase (FDH), following the reaction by NADH produc-tion [103]. Because the latter reaction is highly specificfor formate, the entity that correlates directly withmethanol toxicity, it may be more appropriate to mea-sure formate directly with FDH [104]. Another simpleassay utilizes periodate to oxidize ethylene glycol toformaldehyde, which is then reacted with a chromo-gen. This commercially available veterinary product isreported to show good performance with human sam-ples [105]. A similar test generates a blue chromo-phore, which also shows positive for propylene glycol,
TABLE 16.11 Uses, Toxic Metabolites, and Clinical and Laboratory Features of Toxic Alcohols
Acetaldehyde Increased OSM and OG, Anion gap metabolic acidosis,Hypoglycemia, Ketonuria if chronic, Tests for chronicuse, Inebriation CNS depression, Vomiting
Increased OSM and OG, Normal anion gap and pH,Normoglycemia, Ketonuria, no glucose, Profoundinebriation and CNS depression, Tachycardia,hypertension, vasodilation Gastritis, hematemesis
Ethyleneglycol(antifreeze)
Radiator fluid, Antifreeze GlycolateOxalate
Increased OSM and OG, Anion gap metabolic acidosis,Lactic acidemia (may be falsely increased),Hypoglycemia, Hypocalcemia, Muscle dysfunction,seizures, Acute renal failure, Oxalate crystalluria,Transient inebriation
Propyleneglycol
Intravenous drug preparations D-Lactate Increased OSM and OG, Anion gap metabolic acidosis,Lactic acidemia (may be falsely low), Acute renalfailure, Hippuric aciduria
OG, osmole gap; OSM, osmolality.
267STRATEGIES FOR REMOVING INTERFERENCES
ACCURATE RESULTS IN THE CLINICAL LABORATORY
but has some cross-reactivity with ethanol (.50 mg/dL) [106]. Serum oxalate may also be measured byconverting it to formate with oxalate decarboxylaseand then analyzing the formate as described previ-ously [107].
Failing the provision of such tests, an alternatestrategy is to use the “gap” between the results of twonon-ideal tests in the hope of providing a good result.Several examples illustrate this notion.
When added to serum at relevant concentrations,acetone, ethanol, isopropanol, and methanol producethe expected linear increase in FPD osmolality,whereas VPD osmolality is unaffected: Only ethyleneglycol produces a linear increase in both VPD and FPDosmolality [108]. Therefore, the relationship betweenthe difference in FPD and VPD osmometry measure-ments (ΔOSM) might be used to infer the isopropanolor methanol concentration. In clinical practice, how-ever, it would be unusual to have both types ofosmometry available because FPD is increasinglyreplacing VPD as the technique of choice.
The presence of a significant difference between theosmometry-calculated alcohol value and ADH-basedethanol result has been used to validate the presenceof other toxic alcohols [109]. A similar strategycomparing the sample response between a semiquanti-tative AOD dipstick and an ADH-based “specific” eth-anol assay could be used to gauge the presence ofmethanol, which reacts strongly with AOD but notADH [110].
As described previously, the lactate gap (ampero-metric value minus a glycolate-unaffected assay value)can be used as a surrogate to identify ethylene glycolexposure and thus to estimate the glycolate concentra-tion [111].
Ethylene glycol might be inferred from the “triglycer-ide gap” between the results of two different automatedanalyzer kits, one containing ethylene glycol-reactiveglycerol dehydrogenase and the other nonreactive glyc-erol dehydrogenase. This again showed some cross-reactivity with propylene glycol (,15%) [112].
FURTHER CASE STUDIES
The cases presented in this section highlight theimportance of assessing all the available informationand not focusing exclusively on the result of one testin preference to another. The use of ethanol concentra-tion and osmolal and anion gaps is vital to arriving atthe correct diagnosis and treatment.
CASE REPORT A 4-year-old male was hospitalizedfor 6 weeks following a viral illness during which timeattempts to control status epilepticus required
numerous medications. He became profoundly hypo-tensive (75/35 mmHg) despite extensive pressorsupport, and there was some concern that morphinemight have been administered, so a point-of-care drugscreen was performed, which showed a positive AODethanol test. He was transferred to our institutionunresponsive. He had a partially compensated meta-bolic acidosis on ventilatory support (pH 7.26) andelevated anion gap (36 mmol/L). Most remarkably, hisOSM was 611 mOsm/kg. Volatile analysis by GCrevealed a propylene glycol concentration of 1548 mg/dL. Lactate was measured at 7.1 mmol/L, whichalthough elevated was probably a 90% underestimateof the true lactate because propylene glycol is metabo-lized to both L- and D-lactate, and the body has verylimited capacity to metabolize the latter, whereas onlythe L-isomer is detected by laboratory tests. Only afterall these entities were taken into account could theOSM be reconciled.
The patient had five plasmapheresis treatments andrecovered after an episode of hypotensive/gentamicin-induced acute renal failure. Propylene glycol is presentin large concentrations as a solubilizing agent in anumber of intravenous medications, [113,114] and hisestimated dose was greater than 16 g/day once hismedications were reconciled (lorazepam 85%, pheno-barbital 75%, and phenytoin 40%).
CASE REPORT Vasiliades et al. [115] reported a 45-year-old male admitted after having fallen from a lad-der. He had a sweet odor on his breath but noevidence of head trauma. He was hypotensive (bloodpressure 80/60 mmHg), his pulse was 90 beats/min,and he had shallow respirations at 14 min. Arterialblood gas showed respiratory acidosis (pH 7.25, pO2
70 mmHg, and pCO2 60 mmHg) and was ventilated.Serum ethanol by ADH assay was 186 mg/dL, but hisOG (65 mOsm/kg) was too large for the amount ofethanol present. Subsequent GC analysis showed theethanol to be only 90 mg/dL, with isopropanol at186 mg/dL and acetone metabolite 18 mg/dL. Asexpected, urine ketones were negative (because thisreacts with β-hydroxybutyrate and only poorly withacetone). The nonspecific ADH assay is dangerouslymisleading when more than one alcohol is present,and the fact that isopropanol is a profound respiratorydepressant complicates the differential with a knownhead trauma.
CASE REPORT Platteborze et al. [116] presented anequally confusing case of a 32-year-old female with a72 hr history of abdominal pain and nausea who hadingested only ginger ale and homemade liquor duringthis time. She had a partially compensated metabolicacidosis; an elevated anion gap (27 mmol/L) explained
268 16. ALCOHOL DETERMINATION USING AUTOMATED ANALYZERS
ACCURATE RESULTS IN THE CLINICAL LABORATORY
by an elevated β-hydroxybutyrate and lactate; and anOG of 56 mOsm/kg, which could only be fullyaccounted for once the ethanol (128 mg/dL), isopropa-nol (14 mg/dL), and acetone metabolite (37 mg/dL)were taken into account.
CASE REPORT A previously healthy obese 13-year-old male awoke with visual loss. He was somnolentand mildly confused, and he had been vomiting sincethe previous afternoon.
On presentation to the ED, he was found to havetachycardia (121 min) and tachypnea (38 min); pulseoximetry showed 98% saturation. Initial labs showedsevere metabolic acidosis: pH 7.18, pCO2 10 mmHg,and HCO3 3.7 mmol/L. He was dehydrated (protein,creatinine, and BUN elevated). Urinalysis showedprotein 21 and ketones 11 with occasional red bloodcells; plasma glucose was 196 mg/dL. Serum acetamin-ophen and salicylate were negative, and urine ethanolby dipstick (AOD) was approximately 100 mg/dL. Byhistory, the previous day he drank half a bottle ofGatorade after playing outside, and soon afterward hedeveloped nausea and emesis that persisted overnight.There was concern for methanol ingestion, but becausethe ethanol was already positive, and the hospital wasin a “dry” county, he was transferred to a tertiary carehospital for treatment without any further intervention.
Toxicological analysis on transfer 40 min latershowed a negative ethanol in serum and urine by GC,but methanol was detected in urine, and the serumconcentration was 31 mg/dL approximately 22 hr post-ingestion. Ethylene glycol was negative by GC, and theserum calcium was normal. OSM was measured at302 mOsm/kg, and OSMc was 253 mOsm/kg, givingan OG of 48 mOsm/kg. His AG was elevated at25 mmol/L, and lactate was 11 mmol/L. The patientwas treated with Fomepizole and remarkably recov-ered full eyesight.
This case highlights the potential danger of metha-nol cross-reactivity in the ethanol test, leading to theerroneous belief that the patient is already protectedby antidote, but attention to the size of the OG showsit to be too large to be explained solely by the ethanol.
FUTURE DIRECTIONS
A number of lines of development offer promise inimproving automated ethanol assays. Novel fluoro-phores are under development as potential reaction indi-cators with high sensitivity. Advances in carbonnanotube technology have enabled the construction ofhighly stable ADH-based electrodes that are being inves-tigated for use as biosensors. The same nanotechnologyhas enabled AOD incorporation into electrodes with
vastly improved stability, including co-bonding intopolymers with dyes for visual reaction detection [117].Despite this, electrodes are still only reliable for a fewhundred assays each [118], they become saturated at lowethanol concentrations, and the requirement for repeateddilutions negates the advantages of automation. Thebrewing industry has instigated many importantadvances in laboratory medicine throughout the years,including Kjeldahl’s contribution to protein assays. Theindustry’s scientists have manufactured point-mutatedAODs with reduced activity to methanol (wild-type Km
0.62 mM, and mutant up to 2.48 mM) but without loss ofvelocity, and they have successfully incorporated theminto amperometric detectors and biosensors withimproved linear response to ethanol [119].
CONCLUSIONS
There are a number of possibilities to be exploredfor improving automated tests for ethanol to increasetheir specificity. Manufacturers need to focus on thefollowing five points:
1. Eliminate interference in ethanol assays fromNADH generated by non-ADH reactions.
2. Eliminate toxic alcohol interference in AOD assays.3. Find mechanisms to stabilize AOD in solution.4. Provide rapid and reliable automated assays for:
a. ethyl glucuronideb. methanol/formatec. isopropanol/acetoned. ethylene glycol/glycolate/oxalate ande. propylene glycol/L-lactate.
5. Continue to “open up” analyzers to permitcustomer modifications or use of non-brandedreagents, and offer support to customers in theseendeavors.
Automated ethanol assays were a remarkableadvance when they were introduced three decadesago. They doubtless improved treatment outcomes andlikely saved many lives, but there are many reasonswhy their performance should be improved.Laboratories and clinical chemists must collaboratewith manufacturers by providing clinically relevantsamples for method development and providing edu-cation on what is clinically desirable. Only when thishappens will the current problems be resolved.
References
[1] Van Riper T. The most expensive addictions. Forbes Business10/3/2006. Available at ,http://www.forbes.com/2006/10/02/addictions-most-expensive-biz-cx_tvr_1003addictions.html.[accessed March 2012].
[2] Lieber CS. Medical disorders of alcoholism. N Engl J Med1995;333:1058�65.
[3] European Information System on Alcohol and Health.Available at ,http://www.euro.who.int/en/what-we-do/health-topics/disease-prevention/alcohol-use/facts-and-fig-ures. [accessed March 2012].
[4] National Institute on Alcohol Abuse and Alcoholism. ,http://www.niaaa.nih.gov/publications. [accessed March 2012].
[5] Centers for Disease Control and Prevention. Alcohol-RelatedDisease Impact (ARDI). Atlanta, GA: CDC. ,http://www.cdc.gov/alcohol/about.htm. [accessed March 2012].
[6] National Survey on Drug use and Health. SAMHSA publicationAvailable at 2010 ,http://www.oas.samhsa.gov/nhsda.htm..
[7] Tenore PL. Advanced urine toxicology testing. J Addictive Dis2010;29:436�48.
[8] Pletcher MJ, Maselli J, Gonzales R. Uncomplicated alcohol intoxica-tion in the emergency department: an analysis of the National hos-pital ambulatory medical care survey. Am J Med 2004;117:863�7.
[9] Gentilello LM, Donovan DM, Dunn CW, Rivara FP. Alcoholinterventions in trauma centers. JAMA 1995;274:1043�8.
[10] Spies C, Neuner B, Newmann T, et al. Intercurrent complica-tions in patients admitted to the intensive care unit followingtrauma. Intensive Care Med 1996;22:286�93.
[11] Cicala RS. Substance abuse among physicians: what you needto know. Hosp Physician 2003;39:39�46.
[12] Trinkoff AM, Storr CL. Substance use among nurses: differ-ences between specialties. Am J Public Health 1998;88:581�5.
[13] Spies C, Rommelspacher H. Alcohol withdrawal in the surgicalpatient: prevention and treatment. Anesth Analg 1999;88:946�54.
[14] Wu AH, McKay C, Broussard LA, Hoffman RS, Kwong TC,Moyer TP, et al. National academy of clinical biochemistry lab-oratory medicine practice guidelines: recommendations for theuse of laboratory tests to support poisoned patients who pres-ent to the emergency department. Clin Chem 2003;49:357�79.
[15] Watson I. Laboratory analyses for poisoned patients: joint posi-tion paper. National poisons information service, association ofclinical biochemists. Ann Clin Biochem 2002;39:328�39.
[16] Toxicology Working Group of the Alberta Clinical PracticeGuideline Program. Laboratory guideline for the investigationof the poisoned patient. 2006. Available at ,http://www.topal-bertadoctors.org/download/316/poisoned_patient_guideline.pdf. [accessed May 2012].
[17] Widmark EMP. Eine Mikromethode zur Bestimmung vonAthylalkohol im Blut. Biochem Z 1922;181:473�5.
[18] Tangerman AT. Highly sensitive gas chromatographic analysisof ethanol in whole blood, serum, urine, and fecal supernatantsby the direct injection method. Clin Chem 1997;43:1003�9.
[19] Penton Z. Gas-chromatographic determination of ethanol inblood with 0.53 mm fused-silica open tubular columns. ClinChem 1987;33:2094�5.
[20] Dawson RB. Data for biochemical research. 3rd ed. Oxford:Clarendon; 1985. p. 122
[21] Yost DA, Boehnlein L, Shaffer M. A novel assay to determineethanol in whole blood on the abbott TDx. Clin Chem1984;30:1029A.
[22] Schaffar M, Stroupe SD. A general method for routine clinicalchemistry in the abbott TDx analyzer. Clin Chem 1883;29:1251A.
[23] Ortho-Vitros Ethanol package insert. Available at ,http://www.cmmc.org/cmmclab/IFU/ETOH_060.PDF. [accessedMay 2012].
[24] Pietruszko R, Crawford K, Lester D. Comparison of substratespecificity of alcohol dehydrogenases from human liver, horseliver, and yeast towards saturated and 2-enoic alcohols andaldehydes. Arch Biochem Biophys 1973;159:50�60.
[25] Heitz JR, Anderson CD, Anderson BM. Inactivation of yeastalcohol dehydrogenase by N-alkylmaleimides. Arch BiochemBiophys 1968;127:627�36.
[26] Green DW, Sun HW, Plapp BV. Inversion of the substrate specific-ity of yeast alcohol dehydrogenase. J Biol Chem 1993;268:7792�8.
[27] Young E, Rafter-Tadgell.. Use of a competitive inhibitor in akinetic enzymatic method for measuring ethanol in serum. ClinChem 1987;33:2296�8.
[28] Green DW, Sun HW, Plapp BV. Inversion of the substrate speci-ficity of yeast alcohol dehydrogenase. J Biol Chem 1993;268:7792�8.
[29] Nine JS, Moraca M, Virji M, Rao K. Serum-ethanol determina-tion: comparison of lactate and lactate dehydrogenase interfer-ence in three enzymatic assays. J Anal Tox 1995;19:192�6.
[30] Winek CL, Wahba WW. A response to “Serum-ethanol determi-nation: comparison of lactate and lactate dehydrogenase inter-ference in three enzymatic assays”. J Anal Tox 1996;20:211�12.
[31] Eder AF, McGrath CM, Dowdy YG, Tomaszewski JE,Rosenberg FM, Wilson RB, et al. Ethylene glycol poisoning: tox-icokinetic and analytical factors affecting laboratory diagnosis.Clin Chem 1998;44:168�77.
[32] Wax P, Branton T, Cobaugh D, Kwong T. False positive ethyl-ene glycol determination by enzyme assay in patients withchronic acetaminophen hepatotoxicity [Abstract]. J Toxicol ClinToxicol 1999;37:604.
[33] Eder AF, Dowdy YG, Gardiner JA, Wolf BA, Shaw LM. Serum lac-tate and lactate dehydrogenase in high concentrations interfere inenzymatic assay of ethylene glycol. Clin Chem 1996;42:1489�91.
[34] Badcock NR, O’Reilly DA. False-positive EMIT-st ethanolscreen with post-mortem infant plasma. Clin Chem 1992;38:434.
[35] Powers R, Dean D. Evaluation of potential lactate/lactate dehy-drogenase interference with an enzymatic alcohol analysis.J Anal Tox 2009;33:561�3.
[36] Morgan TJ, Vlark C, Clague A. Artifactual elevation of mea-sured plasma L-lactate concentration in the presence of glyco-late. Crit Care Med 1999;27:2177�9.
[37] Castanares-Zapatero D, Filee C, Philippe M, Hantson P.Survival with extreme lactic acidosis following ethylene glycolpoisoning. Can J Anaesth 2008;55:318�19.
[38] Meng QH, Adeli K, Zello GA, Porter WH, Krahn J. Elevatedlactate in ethylene glycol poisoning: true or false? Clin ChimActa 2010;411:601�4.
[39] Manini AF, Hoffmann RS, Martin KE, Nelson LS. Relationshipbetween serum glycolate and falsely elevated lactate in severeethylene glycol poisoning. J Anal Toxicol 2009;33:174�6.
[40] Gharapetian A, Holmes DT, Urquhart N, Rosenberg F.Dehydrogenase interference with enzymatic ethanol assays: for-gotten but not gone. Clin Chem 2008;54:1251�2.
[41] Kavanagh L, McKenna TJ, Fahie-Wilson MN, Gibney J, SmithTP. Specificity and clinical utility of methods for the detectionof macroprolactin. Clin Chem 2006;52:1366�72.
[42] Wyness SP, Hunsaker JJ, La’ulu SL, Rao LV, Roberts WL.Detection of macro-creatine kinase and macro-amylase by poly-ethylene glycol precipitation and ultrafiltration methods. ClinChim Acta 2011;412:2052�7.
[43] Thompson WC, Malhotra D, Schammel DP, Blackwell W, WardME, Dasgupta A. False positive ethanol by enzymatic assay:elimination of interference by measuring alcohol in protein-freeultra-filtrate. Clin Chem 1994;40:1594�5.
[44] Wu AH, McKay C, Broussard LA, Hoffman RS, Kwong TC,Moyer TP, et al. National academy of clinical biochemistry lab-oratory medicine practice guidelines: recommendations for theuse of laboratory tests to support poisoned patients who pres-ent to the emergency department. Clin Chem 2003;49:357�79.
270 16. ALCOHOL DETERMINATION USING AUTOMATED ANALYZERS
[45] Riley D, Wigmore JG, Yen B. Dilution of blood collected formedicolegal alcohol analysis by intravenous fluids. J AnalytToxicol 1996;20:330�1.
[46] Logan BJ, Jones AW. Endogenous ethanol “auto-brewery” syn-drome. Med Sci Law 2000;40:206�15.
[47] Binakonsky J, Giga N, Ross C, Siegel M. Jello shot consumptionamong older adolescents: a pilot study of a newly identifiedpublic health problem. Subst Use Misuse 2011;46:828�35.
[48] PRWeb. Spiked gummy candy offers teens a hiding place foralcohol. Available at ,http://www.prweb.com/releases/2012/1/prweb9120244.htm..
[49] Teen Alcohol Abuse. Vodka soaked tampons? Hoax? Availableat ,http://www.teenalcoholabuse.us/content/vodka-soaked-tampons.html..
[50] Jones AW, Rajs J. Appreciable blood-ethanol concentration afterwashing abraised and lacerated shin with surgical spirit. J AnalToxicol 1997;21:587�8.
[51] Puschel K. Percutaneous alcohol intoxication. Eur J Pediatr1981;136:317�18.
[52] Harpin V, Rutter N. Percutaneous alcohol absorption andskin necrosis in a preterm infant. Arch Dis Child1982;57:477�9.
[53] Foley KF. A 25-proof urine. Clin Chem 2011;57:142�3.[54] Alexander WD, Wills PD, Eldred N. Urinary ethanol and diabe-
tes mellitus. Diabet Med 1988;5:463�4.[55] Norberg A, Jones AW, Hahn RG, Gabrielsson JL. Role of vari-
ability in explaining ethanol pharmacokinetics: research andforensic applications. Clin Pharmacokinet 2003;42:1�31.
[56] Caro AA, Cederbaum AI. Oxidative stress, toxicology, andpharmacology of CYP2E1. Annu Rev Pharmacol Toxicol.2004;44:22�42.
[58] Freeza M, Di Padova C, Pozzato G, Terpin M, Baraona E,Lieber CS. High blood alcohol levels in women: the role ofdecreased gastric alcohol dehydrogenase activity and first-passmetabolism. N Engl J Med 1990;32:95�9.
[59] Brennan DF, Betzelos S, Reed R. Ethanol elimination rates in anED population. Am J Emerg Med 1995;13:276�80.
[60] Gershman H, Steeper J. Rate of clearance of ethanol from theblood of intoxicated patients in the emergency department.J Emerg Med 1991;9:307�11.
[61] Jones AW. Ethanol metabolism in patients with liver cirrhosis.J Clin Forens Med 2000;7:48�51.
[62] Pitzele HZ, Tolia VM. Twenty per hour: altered mental statedue to ethanol abuse and withdrawal. Emerg Med Clin N Am2010;28:683�705.
[64] Sultatos LG, Pastino GM, Rosenfeld CA, Flynn EJ.Incorporation of the genetic control of alcohol dehydrogenaseinto a physiologically based pharmacokinetic model for ethanolin humans. Toxicological Sci 2004;78:20�31.
[65] Eriksson CJP, Fukunaga T, Sarkola T, Chen WJ, Chen CC, JuJM, et al. Functional relevance of human ADH polymorphism.Alcohol Clin Exp Res 2001;25:157S�63S.
[66] Smithline N, Gardner Jr. KD. Gaps—Anionic and osmolal.JAMA 1976;236:1594�7.
[67] Purssell RA, Pudek M, Brubacher J, Abu-Laban RB. Derivationand validation of a formula to calculate the contribution ofethanol to the osmolal gap. Ann Emerg Med 2001;38:653�9.
[68] Griveas I, Gompou A, Kyristis I, Papatheodorou G, Agroyannis I,Tsakoniatis M, et al. Osmolal gap in hemodialyzed uremicpatients. Artificial Organs 2011;36:16�20.
[69] Lund ME, Banner Jr W, Finley PR, Burnham L, Dye JA. Effectof alcohols and selected solvents on serum osmolality measure-ments. J Toxicol Clin Toxicol 1983;20:115�32.
[71] Purssell RA, Pudek M, Brubacher J, Abu-Laban RB. Derivationand validation of a formula to calculate the contribution ofethanol to the osmolal gap. Ann Emerg Med 2001;38:653�9.
[72] Lund ME, Banner Jr W, Finley PR, Burnham L, Dye JA. Effectof alcohols and selected solvents on serum osmolality measure-ments. J Toxicol Clin Toxicol 1983;20:115�32.
[73] Bhagat CI, Beilby JP, Garcia-Webb P, Dusci LJ. Errors in esti-mating ethanol concentration in plasma using the “osmolalgap”. Clin Chem 1985;31:647�8.
[74] McQuillen KK, Anderson AC. Osmol gaps in the pediatric pop-ulation. Acad Emerg Med 1999;6:27�30.
[75] Draviam EJ, Custer EM, Schoen I. Vapor pressure and freezingpoint osmolality measurements applied to a volatile screen.Am J Clin Pathol 1984;82:706�9.
[76] Walker JA, Schwartzbard A, Krauss EA, Sherman RA, EisingerRP. The missing gap: a pitfall in the diagnosis of alcohol intoxi-cation by osmometry. Arch Intern Med 1986;146:1843�4.
[77] Jones AW. Ethanol distribution ratios between urine and capil-lary blood in controlled experiments and in apprehendeddrinking drivers. J Forens Sci 1992;37:2�34.
[78] Jones AW. Urine as a biological specimen for forensic analysisof alcohol and variability in the urine-to-blood relationship.Toxicol Rev 2006;25:15�35.
[79] Federal Register Vol. 72, No. 241/Monday, December 17, 2007/Notices.
[81] Huestis MA, Verstraete A, Kwong TC, Morland J, Vincent MJ,de la Torre R. Oral fluid testing: promises and pitfalls. ClinChem 2011;57:805�10.
[82] Schwartz RH, O’Donnell RM, Thorne MM, Getson PR, HicksJM. Evaluation of colorimetric dipstick test to detect alcohol insaliva: a pilot study. Ann Emerg Med 1989;18:1001�3.
[83] Christopher TA, Zaccardi JA. Evaluation of the QED salivaalcohol test: a new, rapid, accurate device for measuring etha-nol in saliva. Ann Emerg Med 1992;21:1135�7.
[84] Nakae Y, Stoward PJ. The initial reaction velocities of lactatedehydrogenase in various cell types. Histochem J1994;26:283�91.
[85] Solomon J, Vanga N, Morgan JP, Joseph P. Emergency roomphysicians: recognition of alcohol misuse. J Stud Alcohol1980;41:583�6.
[86] Sharpe PC. Biochemical detection and monitoring of alcoholabuse and abstinence. Ann Clin Biochem 2001;38:652�64.
[88] Bottcher M, Beck O, Heelander A. Evaluation of a new immu-noassay for urinary ethyl glucuronide testing. Alcohol Alcohol2008;43:46�8.
[89] Neumann T, Helander A, Dahl H, et al. Value of ethyl glucuro-nide in plasma as a biomarker of recent alcohol consumption inthe emergency room. Alcohol Alcohol 2008;43:431�5.
[92] Bernadt MW, Mumford J, Taylor C, Smith B, Murray RM.Comparison of questionnaire and laboratory tests in the detec-tion of excessive drinking and alcoholism. Lancet 1982;1(8267):325�8.
[93] Rosalki SB, Rau D. Serum gamma-glutamyl transpeptidaseactivity in alcoholism. Clin Chim Acta 1972;39:41�7.
[94] Rosman AS, Lieber CS. Biochemical markers of alcohol con-sumption. Alcohol Health Res World 1990;14:210�18.
[96] Schellenberg F, Wielders JP. Evaluation of capillary electro-phoresis for CDT on SEBIA’s capillarys system: intra andinterlaboratory precision, reference interval and cut-off. ClinChim Acta 2010;411:1888�93.
[97] Hacker R, Torsten A, Helwig-Rolig A, Kropf J, Steinmetz A,Schaefer JR. Investigation by isoelectric focusing of the initialcarbohydrate-deficient transferrin (CDT) and non-CDT trans-ferrin isoform fractionation step involved in determination ofCDT by the ChronAlcoI.D. assay. Clin Chem 2000;46:483�92.
[98] Schwarz MJ, Domke I, Helander A, Janssens PMW, van Pelt J,Springer B, et al. Multicenter evaluation of a new assay for thedetermination of carbohydrate deficient transferrin. AlcoholAlcohol 2003;38:270�5.
[99] Huseby NE, Bjordal E, Nilssen O, Barth T. Utility of biologicalmarkers during outpatient treatment of alcohol-dependent sub-jects: carbohydrate-deficient transferrin responds to moderatechanges in alcohol consumption. Alcohol Clin Res1997;21:1343�6.
[100] Reynaud M, Hourcade F, Planche F, Albuisson E, MeunierMN, Planche R. Usefulness of carbohydrate-deficient transfer-rin in alcoholic patients with normal γ-glutamyltransferase.Alcohol Clin Exp Res 1998;22:615�18.
[101] Lynd DL, Richardson KJ, Pursse RA, Abu-Laban RB,Brubacher JR, Lepik KJ, et al. An evaluation of the osmole gapas a screening test for toxic alcohol poisoning. BMC EmergMed 2008;8:5�14.
[102] Wu AH, McKay C, Broussard LA, Hoffman RS, Kwong TC,Moyer TP, et al. National academy of clinical biochemistry lab-oratory medicine practice guidelines: recommendations for theuse of laboratory tests to support poisoned patients who pres-ent to the emergency department. Clin Chem 2003;49:357�79.
[103] Vinet B. An enzymic assay for the specific determination ofmethanol in serum. Clin Chem 1987;33:2204�8.
[104] Hovda KE, Urdal P, Jacobsen D. Case report: increased serumformate in the diagnosis of methanol poisoning. J AnalytToxicol 2005;29:586�8.
[105] Long H, Nelson LS, Hoffman RS. A rapid qualitative test forsuspected ethylene glycol poisoning. Acad Emerg Med2008;15:688�90.
[106] Shin JM, Sachs G, Kraut JA. Simple diagnostic tests to detecttoxic alcohol intoxications. Transl Res 2008;152:194�201.
[107] Urdal P. Enzymatic assay for oxalate in unprocessed urine, asadapted for a centrifugal analyzer. Clin Chem 1984;30:911�13.
[108] Lund ME, Banner Jr W, Finley PR, Burnham L, Dye JA. Effectof alcohols and selected solvents on serum osmolality mea-surements. J Toxicol Clin Toxicol 1983;20:115�32.
[109] Draviam EJ, Custer EM, Schoen I. Vapor pressure and freezingpoint osmolality measurements applied to a volatile screen.Am J Clin Pathol 1984;82:706�9.
[110] Hack JB, Chiang WK, Howland MA, Patel H, Goldfrank L. Theutility of an alcohol oxidase reaction test to expedite the detec-tion of toxic alcohol exposures. Acad Emerg Med 2000;7:294�7.
[111] Shirey T, Silvetti M. Reaction of lactate electrodes to glycolate.Crit Care Med 1999;27:2305�7.
[112] Blandford SE, Desjardins RP. A rapid method for measure-ment of ethylene glycol. Clin Biochem 1994;27:25�30.
[113] Yaucher NE, Fish JT, Smith HL, Wells JA. Propylene glycol-associated renal toxicity from lorazepam infusion.Pharmacother 2003;23:1094�9.
[114] Hayman M, Seidl EC, Ali M, Malik K. Acute tubular necrosisassociated with propylene glycol from concomitant adminis-tration of intravenous lorazepam and trimethoprim-sulfamethoxazole. Pharmacotherapy 2003;23(9):1190�4.
[115] Vasiliades J, Pollock J, Robinson CA. Pitfalls of the alcoholdehydrogenase procedure for the emergency detection of alco-hol: a case study of isopropanol overdose. Clin Chem1978;24:383�5.
[116] Platteborze PL, Rainey PM, Baird GS. Ketoacidosis with unex-pected serum isopropyl alcohol. Clin Chem 2011;57:1361�5.
[117] Ho Y-H, Periasamy AP, Shen-Ming Chen S-M. Amperometricethanol biosensor based on alcohol dehydrogenase immobilizedat poly-L-lysine coated carminic acid functionalized multiwalledcarbon nanotube film. Int J Electrochem Sci 2011;6:3922�37.
[118] Guilbault GG, Danielsson B, Mandenius CF, Mosback K.Enzyme electrode and thermistor probes for the determinationof alcohols with alcohol oxidase. Anal Chem 1983;55:1582�5.
[119] Dmytruk KV, Smutok OV, Ryabova OB, Gayda GZ, SibirnyVA, Schuhmann W, et al. Isolation and characterization ofmutated alcohol oxidases from the yeast Hansenula polymorphawith decreased activity toward substrates and their use asselective elements in an amperometric biosensor. BMCBiotechnol 2007;7:33�9.
272 16. ALCOHOL DETERMINATION USING AUTOMATED ANALYZERS