34
03 November 2021

Q3 2021 Results Presentation
03 November 2021
1

Q3 2021 Results Presentation
This document may contain forward-looking information and statements about ACERINOX, S.A., its subsidiaries and/or its management.
These forward-looking statements include financial projections and estimates and their underlying assumptions, and statements regarding the intent, belief or current expectations or
forecasts of ACERINOX, S.A. and/or its management, as well as statements regarding future performance, plans, objectives, operations, business, strategy, capital expenditures, results
of operations, markets and products. These forward-looking statements or forecasts may also include assumptions regarding future economic and other conditions, such as future
nickel or chrome prices and, in general, are subject to risks, uncertainties and variables beyond ACERINOX’s control that can adversely affect them.
These forward-looking statements and information do not constitute historical facts and can generally be identified by the use of terms such as “expects”, “anticipates”, “believes”,
“plans”, “estimates” and similar expressions. ACERINOX, S.A. believes they all are reasonable but are not a guarantee of future performance, prices, results of operations, benefits or
dividend payout policies. ACERINOX, S.A. future financial condition, financial ratios, business, results of operations and dividends could differ materially from those expressed or implied
in or projected by such forward-looking statements, information and forecasts.
All forward-looking statements included herein are based on information available on the date hereof. Except as required by applicable law, ACERINOX, S.A. does not undertake any
obligation to publicly update or revise any forward-looking statements and information, even in the event of new information being published or new events occurring.
Investors, holders of ACERINOX, S.A. securities and shareholders in ACERINOX, S.A. are cautioned not to place undue reliance on the forward-looking statements and information,
which speak only as of the date they were made. All subsequent oral or written forward-looking statements or information attributable to ACERINOX, S.A. or any of its members,
directors, officers, employees or any persons acting on its behalf are expressly qualified in their entirety by this cautionary statement.
No representation or warranty, express or implied, is made as to, and no reliance should be placed on, the fairness, accuracy, completeness or correctness of the information or
opinions contained herein. None of the Company or any of its affiliates, advisors or representatives shall have any liability whatsoever for any loss arising from any use of this document,
or its contents, or otherwise arising in connection with this document. Moreover, this document nor any part of it constitutes a contract, nor may it be used for incorporation into or
interpretation of any contract or other type or agreement.
The points contained in this disclaimer must be taken fully into account by all persons or entities obliged to take decisions or to draw up or to publish opinions on securities issued by
ACERINOX, S.A., in particular, by the analysts and investors reading this document. All the aforesaid persons are invited to consult the public documentation and information that
ACERINOX, S.A. reports to or files with the bodies responsible for supervising the main securities market and, in particular, with the Spanish National Securities Market Commission
(CNMV in its Spanish initials).
2

Q3 2021 Results Presentation
3
1.11
1.07
9M 2020 9M 2021
Scope 1+2 Emissions
intensity
-4% 8.588.40
9M 2020 9M 2021
Energy intensity
-2%
Specific water
withdrawal intensity
3.65
3.19
9M 2020 9M 2021
-13%
Accident Frequency
Index
7.5
5.7
9M 2020 9M 2021
-24%
Metric tons of CO2e/Tons produced
GJ/tons produced
m3/ tons produced (Number of LTIFR incidents/Number of
hours)*1000k
We are progressing well with our sustainability goals

Q3 2021 Results Presentation
Million EUR
Very strong operating
cash flow of 184
million EUR despiste
387 million EUR of
investment in NWC
EBITDA of 671 million
EUR, 166% higher
year on year and the
best 9 months since
2007
Solid Balance Sheet
with net debt at 764
million EUR, down 9%
year on year despite
the NWC cash outflow,
dividend payment of
135 million EUR and
VDM acquisition in
March 2020 of
313 million EUR
Net Sales 4,769 3,451 38%
Adjusted EBITDA 671 267 152%
Adjusted EBITDA margin 14% 8%
EBITDA 671 252 166%
EBITDA margin 14% 7%
EBIT 537 77 598%
EBIT margin 11% 2%
Results before Taxes
and Minorities504 62 (1) 711%
Results after Taxes
and Minorities373 31 1,124%
Operating cash flow
(before investments)184 167 11%
Net Financial Debt 764 841 -9%
4
(1) 9M 2020 Includes 42 million EUR of impairment of assets in Bahru Stainless
(2) The purchase of VDM took place on 17 March 2020. The nine month figures of 2020 include
the period from March-September

Q3 2021 Results Presentation
Market Highlights
Conditions remain very strong in all markets
Cost inflation impacting right through the value chain
Freight costs and availability contributing to more
regionalized markets
Strong activity in High Performance Alloys (HPA)
Solid stainless demand:
Acerinox Highlights
Flat products apparent demand increased +20% Jan-Sep
Inventories remain below average
Prices continue to increase
Imports remain at reasonable levels
Flat products apparent demand increased 15% Jan-Sep
Imports remain at reasonable levels
Bases prices improved QoQ
Energy prices rocketing
Healthy demand
Removal of 13% of export rebates in China
Production cuts in China
Q3 Production:
• -4% melting production QoQ
• +20% melting production YoY
Q3 EBITDA, 293 million EUR, the strongest since Q2 2007
• +35% QoQ
• +235% YoY
The Stainless Steel division posted EBITDA of 272 million EUR,
up 36% QoQ and 217% YoY
HPA returned to precovid levels and posted an EBITDA of 21
million EUR, up 27% QoQ and 1,251% YoY
Operating CF of 77 million EUR despite a further 134 million
EUR rise in NWC in Q3
Net debt fell by 74 million EUR QoQ to 764 million EUR
Bahru Stainless resumed operations in mid-August following a
two-and-a-half-month Covid-19 induced shutdown
The strength of the Group Strategy is now becoming clear in
the overall results
5
-

Q3 2021 Results Presentation
6
90 97 10374 85 80 87
131161
217
293
Q1 2019 Q2 2019 Q3 2019 Q4 2019 Q1 2020 Q2 2020 Q3 2020 Q4 2020 Q1 2021 Q2 2021 Q3 2021
Million EUR
Q3 showed a further
acceleration in EBITDA
growth
Q3 EBITDA was the best
quarter in 14 years
A strong contribution from
both divisions has
structurally improved the
Group performance
20202019 2021

Q3 2021 Results Presentation
Million EUR
Net debt of 764 million
EUR down 9% QoQ
and 9% YoY despite
investment in NWC
Net Sales 1,703 1,625 1,120 5% 52%
Adjusted EBITDA 293 217 87 35% 235%
Adjusted EBITDA margin 17% 13% 8%
EBITDA 293 217 87 35% 235%
EBITDA margin 17% 13% 8%
EBIT 247 173 43 43% 471%
EBIT margin 15% 11% 4%
Results before Taxes
and Minorities235 163 40 44% 493%
Results after Taxes
and Minorities171 125 28 37% 502%
Operating cash flow
(before investments)77 84 91 -9% -16%
Net Financial Debt 764 838 841 -9% -9%
7(1) Q2 2020 Includes 42 million EUR of impairment of assets in Bahru Stainless
Q3 EBITDA of 293
million EUR up 35%
QoQ, and 235% YoY
Operating FCF of 77
million EUR despite
134 million EUR NWC
build in the quarter

Q3 2021 Results Presentation
Melting production
(thousand Mt)629 654 524 -4% 20%
Net sales 1,493 1,425 935 5% 60%
Adjusted EBITDA 272 201 86 36% 217%
Adjusted EBITDA
margin18% 14% 9%
EBITDA 272 201 86 36% 217%
EBITDA margin 18% 14% 9%
Amortization and
Depreciation-38 -37 -37 1% 1%
EBIT 234 163 49 43% 372%
EBIT margin 16% 11% 5%
Operating cash flow
(before investments)65 98 27 -34% 140%
8
Very strong EBITDA margin
of 18%
Operating FCF of 65
million EUR, despite the
increase in NWC of 131
million EUR
Million EUR
Q3 EBITDA of 272 million
EUR, +36% QoQ and
+217% YoY

Q3 2021 Results Presentation
9
The expected recovery is now
evident in the P&L and FCF
HPA has returned to pre-covid
levels with 21 million EUR EBITDA
in Q3
Million EUR
Contribution of HPA is not only in
the P&L but also in operating
cash flow
Melting production
(thousand Mt)19 22 14 -11% 35%
Net sales 211 201 185 5% 14%
Adjusted EBITDA 21 16 2 27% 1,251%
Adjusted EBITDA
margin10% 8% 1%
EBITDA 21 16 2 27% 1,251%
EBITDA margin 10% 8% 1%
Amortization and
Depreciation-6 -6 -7 0% -13%
EBIT 15 11 -5 41% ---
EBIT margin 7% 5% -3%
Operating cash flow
(before investments)12 -14 64 --- -82%

Q3 2021 Results Presentation
Operating CF of 184 million EUR
in 9 months and 77 million EUR
in Q3 despite the headwind of
NWC investment
10
• Capital allocation focused on
NWC, shareholder returns and
debt reduction
• Net debt 74 million EUR lower
in Q3 and will fall further at year
end
Million EUR
293
671

ACERINOX 2020 RESULTS PRESENTATION
Q3 2021 Results Presentation
11

Q3 2021 Results Presentation
03 November 2021
12

Q3 2021 Results Presentation
13

ACERINOX 2020 RESULTS PRESENTATION
Value creation for all stakeholders
14
ACERINOX 2020 RESULTS PRESENTATION
Value creation for all stakeholders
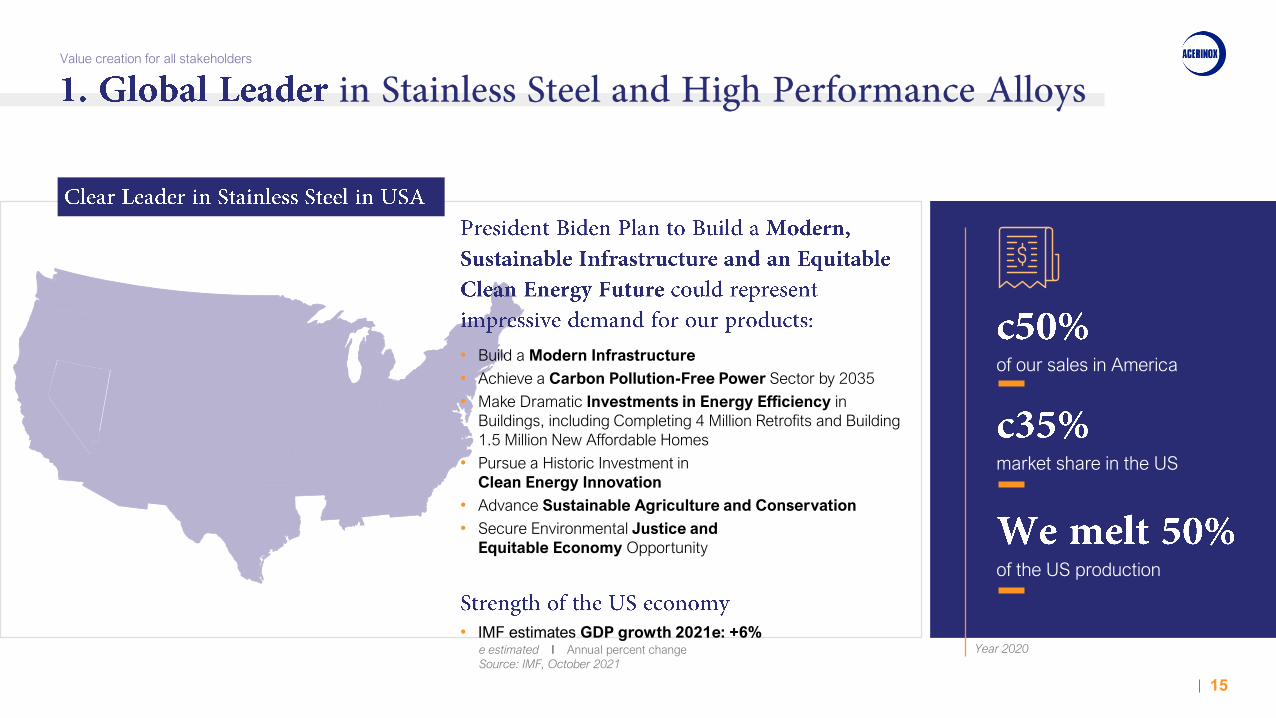
• Build a Modern Infrastructure
• Achieve a Carbon Pollution-Free Power Sector by 2035
• Make Dramatic Investments in Energy Efficiency in
Buildings, including Completing 4 Million Retrofits and Building
1.5 Million New Affordable Homes
• Pursue a Historic Investment in
Clean Energy Innovation
• Advance Sustainable Agriculture and Conservation
• Secure Environmental Justice and
Equitable Economy Opportunity
• IMF estimates GDP growth 2021e: +6%
of our sales in America
market share in the US
of the US production
15
Year 2020e estimated I Annual percent change
Source: IMF, October 2021

ACERINOX 2020 RESULTS PRESENTATION
Value creation for all stakeholders
16
Market share in the EU
Market share worldwide
GDP growth 2021e
Market share: Year 2020
e estimated I GDP growth: annual percent change
Source: IMF, October 2021

ACERINOX 2020 RESULTS PRESENTATION
Value creation for all stakeholders
Profitable Aesthetic Corrosion resistant
17
Reusable Hygienic 100% recyclable
Long lasting Efficient & Versatile (mechanical qualities)

ACERINOX 2020 RESULTS PRESENTATION
Value creation for all stakeholders
Stainless Steel: High Performance Alloys
18
Sources: ISSF; SMR; 1 Calculated for Market
Demand of Stainless Steel2 Calculated for Market
Demand for Specialty Alloys
(excl. Seamless Tube)
Metal
products
Mechanical
Engineering
Construction
Motor Vehicles
Electrical Machinery
CAGR 2000 – 2019(1):
Other Transport
Aerospace
Chemical
Process
IndustryOil / Gas
Electrics /
Electronics
Automotive
Others
World Demand (2019): CAGR 2010 – 2018 (2): World Demand (2018):

ACERINOX 2020 RESULTS PRESENTATION
Value creation for all stakeholders
Sources: ISSF; SMR 19
• Containers, tanks and trailer
• Aviation. Aerospace. Nautical
• Exhaust systems of hybrid and
plug-in hybrid vehicles
• Vehicles
High Resistance to
Corrosion, Withstand High
Temperatures and
Pressures and High
Mechanical Performance
• Washing machines
• Refrigerators
• Pots and pans
• Industrial kitchens
• Cutlery
• HD Disc and electronics
Resistance to Rust, ease
with which it can be
Cleaned, Becoming
Essential in Modern
Design (cutlery)
• Containers, tanks
• Fishing boats
• Conservation
• Manufacturing
• Handling and
transportation
Hygienic and Clean
Material, Ideal for the
Production, Handling and
Transport of Food
• Medical equipment and
furniture
• Medical components
• Implants, prostheses
• Surgical instruments
Stops the spread of bacteria
on its surface. Highly
hygienic. To be meticulously
disinfected in hospitals and
health centers

ACERINOX 2020 RESULTS PRESENTATION
Value creation for all stakeholders
• Industrial furnaces
• 18-metre cupola of the Louvre
in Abu Dhabi
• Ventilation equipment
• Structural elements
• Bridges and structures in
contact with water
Chosen as structural steel to
prevent rusting and corrosion
from carbonation. Nickel
alloys resistant to high
temperatures and corrosion• Atomium in Brussels
• Cloud Gate sculpture,
Chicago
• Access to the Bilbao Metro
(design by Norman Foster)
Refurbish historic works,
turned to this material on
many occasions,
especially in sculpture
• Welding additives and
consumables for chemical and
petrochemical plants
• Photovoltaic panels
• Thermal power plant salt tanks
Present in the Obtaining and
Distribution of
Hydrocarbons and Biofuels.
Essential in Ethanol
Production
20
• Urban furniture
• Building facades
• Interior decoration
• Facade and the roof of the
new Santiago Bernabéu
Stadium
Important in the
construction of buildings
and large works.
Resistance to corrosion
and excellent mechanical
properties. Low
maintenance. Clean
Sources: ISSF; SMR
ACERINOX 2020 RESULTS PRESENTATION
Value creation for all stakeholders
21Sources: ISSF; SMR
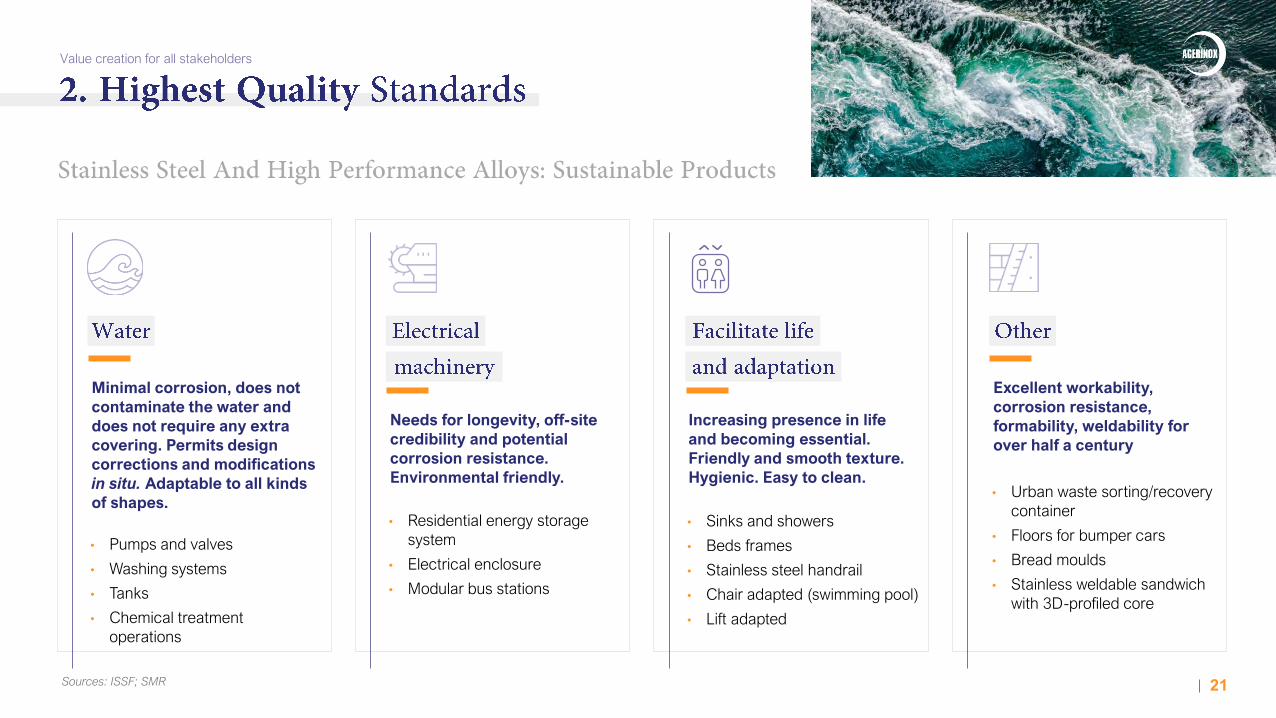
• Pumps and valves
• Washing systems
• Tanks
• Chemical treatment
operations
Minimal corrosion, does not
contaminate the water and
does not require any extra
covering. Permits design
corrections and modifications
in situ. Adaptable to all kinds
of shapes. • Urban waste sorting/recovery
container
• Floors for bumper cars
• Bread moulds
• Stainless weldable sandwich
with 3D-profiled core
Excellent workability,
corrosion resistance,
formability, weldability for
over half a century
• Sinks and showers
• Beds frames
• Stainless steel handrail
• Chair adapted (swimming pool)
• Lift adapted
• Residential energy storage
system
• Electrical enclosure
• Modular bus stations
Needs for longevity, off-site
credibility and potential
corrosion resistance.
Environmental friendly.
Increasing presence in life
and becoming essential.
Friendly and smooth texture.
Hygienic. Easy to clean.

ACERINOX 2020 RESULTS PRESENTATION
Value creation for all stakeholders
22
Core of our business model
Acerinox is committed to the
Circular Economy Improving due to digitalization and 360º
planning, cost reduction programs and
optimizing the commercial network
Efficient capital allocation
Enhanced by VDM Metals (HPA)
and constant review of all the
assets of the Group

ACERINOX 2020 RESULTS PRESENTATION
Value creation for all stakeholders
23
Create high
performance materials
for a sustainable society
Become a global customer
centric supplier through
innovation in sustainable Stainless
Steel and High Performance
Alloys solutions
Safety
Integrity
Excellence
Sustainability
Commitment
Innovation
Employer
of choice
Long-term
focus
Quality

ACERINOX 2020 RESULTS PRESENTATION
Value creation for all stakeholders
• Net Financial Debt of €772m
• Weighted Cost of Term Debt
of 1.5%
• ND / LTM EBITDA of 2.0x
• Gross Debt of €1.7b
• 97% of it free of covenants
on results
• Immediate liquidity
corresponding to cash of
€917m
2021 2022 2023 2024 2025 2026-2029
LONG TERM MATURITIES: 1,578 MILLION EUR
Liquidity
Ca
sh
on
ha
nd
sA
va
ila
ble
lin
es
Liquidity Position (€m)
Liquidity remains best in class, fully covering all maturities
Net Debt
Robust balance sheet
24
Year 2020
Year 2020

ACERINOX 2020 RESULTS PRESENTATION
Value creation for all stakeholders
25
Production: Quality, melting shop yields and efficiency in production materials
Supply chain: Delivery on time
Excellence 360º
• Digitalization and 360º planning
• Cost reduction programs
• Prioritize quick return investments
• Optimize the commercial network
• Exchange of best practices2019 2020 2021 2022 2023
Target Actual

ACERINOX 2020 RESULTS PRESENTATION
Value creation for all stakeholders
26
Safety and
prevention measures
Our management
team took Acerinox
through 2008/2009
successfully and
efficiently
Fixed costs reduction
and variabilisation
Massive liquidity,
1.8 billion euros,
covering maturities
until 2029
Refinancing to anticipate
future renewals and
extend maturities
Operating
performance,
cost control,
capital allocation
and FCF focus
Secured the
supply chain
Strong track record on consistent
financial performance,
over-performing our main European
peers in 12M 2020:
• +37% adjusted EBITDA than peer 1
• +26% adjusted EBITDA than peer 2

ACERINOX 2020 RESULTS PRESENTATION
Value creation for all stakeholders
27
per share
2 0 1 5 ( * ) 2 0 1 6 ( * ) 2 0 1 7 2 0 1 8 2 0 1 9 2 0 2 0
( * ) S c r i p d i v i d e n d
€ / share
Return to shareholders
in shareholder
remuneration
Year 2020

ACERINOX 2020 RESULTS PRESENTATION
Value creation for all stakeholders
Corporación Financiera Alba, S.A . 18.96% 2001
Bravo Andreu, Daniel 5.00% 2020
Industrial Development Corp. (I.D.C.) 3.04% 2002
Millennium Group Management LLC 1.96% 2021
Source: CNMV (02/Nov/2021)
Incorporation of
ACERINOX, S.A.
(Spain)
28
Incorporation of
NORTH AMERICAN
STAINLESS (USA)
Acerinox S.A. 100%
Incorporation of
COLUMBUS
STAINLESS
(South Africa)
Acerinox S.A. 76%
I.D.C. 24%
Incorporation of
BAHRU STAINLESS
(Malaysia)
Acerinox S.A. 98%
Hanwa 2%
Incorporation of
VDM Metals
(Germany)
Acerinox S.A. 100%
Main Acerinox Shareholders % Since

ACERINOX 2020 RESULTS PRESENTATION
Value creation for all stakeholders
Long product
• Hot Rolling
• Finished Product
Flat product
• Melting Shop
• Hot Rolling Shop
• Cold Rolling Shop
Flat product
• Melting Shop
• Hot Rolling Shop
• Cold Rolling Shop
Long product
• Hot Rolling
• Finished Product
Kentucky
Flat product
• Melting Shop
• Hot Rolling Shop
• Cold Rolling Shop
Campo de
Gibraltar
29
Long product
• Hot Rolling
• Finished Product
Ponferrada
& Igualada
Flat product
• Melting Shop
• Hot Rolling Shop
• Cold Rolling Shop
Middelburg
Flat product
• Cold Rolling Shop
Johor

ACERINOX 2020 RESULTS PRESENTATION
Value creation for all stakeholders
30
America
Asia12M
2019
Europe
Africa
Others
America
Asia12M
2020
Europe
Africa
Others
Acerinox Sales Agents
Acerinox Sales & Services
Acerinox Plants (6)
VDM Metals Agents
VDM Metals Sales & Services
VDM Metal Plants (7)
12M 2019
12M 2020(1)
Source: 1 Acerinox including VDM Metals

ACERINOX 2020 RESULTS PRESENTATION
Value creation for all stakeholders
31
Acerinox
Global leader in
stainless steel
VDM
World’s largest
producer in high
performance alloys
Creating value through
• Enhancement of product mix
• Projects and tailor-made solutions
• Exceptional R&D capabilities
• Diversification of geographical earnings
• Less cyclical earnings stream
• Immediate synergy opportunities
• Significant new pathways for earnings growth

ACERINOX 2020 RESULTS PRESENTATION
Value creation for all stakeholders
2017 2018 2019 2020 2017 2018 2019 2020 2017 2018 2019 2020
Sales
32
EBITDA Net Financial Debt
2019: 38 million EUR for the lay offs in Spain
2020: 14 million EUR for the expenses of the
purchase of VDM
2020: 398 million EUR of debt related to
VDM acquisition
Million EUR

ACERINOX 2020 RESULTS PRESENTATION
Value creation for all stakeholders
33
EBITDA 85 80 87 131 384 364
Changes in working capital -97 63 74 183 223 96
Changes in operating working capital -65 50 65 186 236 44
Inventories 9 95 92 27 223 2
Trade debtors -47 93 -1 38 83 41
Trade creditors -27 -139 -26 122 -70 0
Other adjustments to working capital -32 13 9 -3 -13 52
Acerinox Europa lay-offs -26 0 0 0 -26 ---
Others -6 13 9 -3 13 52
Income tax -23 -3 -49 -24 -99 -116
Financial expenses -3 -9 -13 -11 -36 -15
Other adjustments to the result 3 -20 -8 -26 -51 29
OPERATING CASH FLOW -36 111 91 254 421 359
Payments for VDM acquisition -313 0 0 0 -313 ---
Payments for investments on fixed assets -23 -27 -29 -19 -99 -128
FREE CASH FLOW -373 84 62 235 8 231
Dividends and treasury shares 0 0 0 -135 -135 -184
0 0 0 4 4 0
CASH FLOW AFTER DIVIDENDS -373 84 62 103 -123 47
Conversion differences 13 -16 -31 -35 -70 10
Net financial debt acquired from VDM 0 -85 0 0 -85 ---
Variation in net financial debt -360 -17 31 68 -278 57
(*) These figures do not coincide with the balance sheet items due to the purchase of VDM
Million EUR

Q3 2021 Results Presentation
34


