CONTENTS Summary 1 1. Introduction 5 2. Megatrends in the energy sector 10 3. A framework for understanding urban energy transitions 15 4. City transition pathways 19 5. Key considerations for policy-makers 31 6. Looking forward 38 Annex 1: Key statistics for 10 cities 39 References 41 URBAN ENERGY AND THE CLIMATE EMERGENCY: ACHIEVING DECARBONISATION VIA DECENTRALISATION AND DIGITALISATION Molly Webb, Andrew Scott, Ipek Gençsü and Derik Broekhoff Summary Cities provide national governments with an opportunity to accelerate the low-carbon energy transition. Urban areas account for more than two thirds of the world’s final energy consumption. A rapid expansion of electricity supply is needed to meet the aspirations of current and future urban residents, particularly with electrification of cooking, heating and transport. Urban residents, firms and governments are oſten the first to experiment with new technologies, transforming the production, distribution and consumption of energy. This paper explores how two megatrends – decentralisation and digitisation – are already restructuring energy markets, and could be harnessed to support decarbonisation (together known as the three Ds). Cities are at the forefront of this effort. Through ten case studies – Adelaide, Austin, Cape Town, Dar es Salaam, Hamburg, Kampala, Kitakyushu, London, New Delhi and Shenzhen – this paper considers the diversity of potential energy transition pathways that are available in cities. It then highlights key considerations for national governments looking to craſt cost-effective, low-carbon energy policies, including the importance of building in flexibility, the scale of the potential value shiſt, the opportunity for new business and regulatory models to emerge, and the importance of collaboration across sectors and levels of government.
Transcript
CONTENTS
Summary 1
1. Introduction 5
2. Megatrends in the energy sector 10
3. A framework for understanding urban energy transitions 15
4. City transition pathways 19
5. Key considerations for policy-makers 31
6. Looking forward 38
Annex 1: Key statistics for 10 cities 39
References 41
URBAN ENERGY AND THE CLIMATE EMERGENCY:ACHIEVING DECARBONISATION VIA DECENTRALISATION AND DIGITALISATION
Molly Webb, Andrew Scott, Ipek Gençsü and Derik Broekhoff
SummaryCities provide national governments with an opportunity to accelerate the low-carbon energy transition. Urban areas account for more than two thirds of the world’s final energy consumption. A rapid expansion of electricity supply is needed to meet the aspirations of current and future urban residents, particularly with electrification of cooking, heating and transport. Urban residents, firms and governments are often the first to experiment with new technologies, transforming the production, distribution and consumption of energy.
This paper explores how two megatrends – decentralisation and digitisation – are already restructuring energy markets, and could be harnessed to support decarbonisation (together known as the three Ds). Cities are at the forefront of this effort. Through ten case studies – Adelaide, Austin, Cape Town, Dar es Salaam, Hamburg, Kampala, Kitakyushu, London, New Delhi and Shenzhen – this paper considers the diversity of potential energy transition pathways that are available in cities. It then highlights key considerations for national governments looking to craft cost-effective, low-carbon energy policies, including the importance of building in flexibility, the scale of the potential value shift, the opportunity for new business and regulatory models to emerge, and the importance of collaboration across sectors and levels of government.
This material has been funded by the UK government; however, the views expressed do not necessarily reflect the UK government’s official policies.
ABOUT THIS WORKING PAPERThis paper was prepared by Energy Unlocked, the Overseas Development Institute and the Stockholm Environment Institute. It was supported by the Coalition for Urban Transitions, the leading global initiative helping national governments unlock the power of inclusive, zero-carbon cities. The opinions expressed and arguments employed are those of the authors.
CITATIONWebb, M., Scott, A., Gençsü, I. and Broekhoff, D. 2020. Urban energy and the climate emergency: Achieving decarbonisation via decentralisation and digitalization. Coalition for Urban Transitions, London and Washington, DC. Available at: https://urbantransitions.global/publications
Coalition for Urban Transitions c/o World Resources Institute 10 G St NESuite 800Washington, DC 20002, USA
C40 Cities Climate Leadership Group3 Queen Victoria Street London EC4N 4TQ United Kingdom
WRI Ross Center for Sustainable Cities 10 G St NESuite 800Washington, DC 20002, USA
Capacity The maximum output of electric power that a generating unit or plant can supply.
Demand-side response The rapid adjustment of electricity demand to help match electricity supply. Incentives are often used to encourage customers to reduce their demand at certain times. Demand may be reduced by the system operators or customers.
Distributed renewable energy A renewable energy generation or storage unit located near to the load that it is intended to serve.
Load The amount of electric power required by devices connected to the electricity system.
Microgrid A combination of localised electricity generation sources, energy storage devices and multiple loads that acts as a small electric grid. A microgrid can be isolated or connected to the main grid.
Peak load The maximum load during a specified period.
Variability The fluctuating nature of solar and wind resources, which translates to possibly rapid changes in electricity generation.
Variable renewable energy A renewable energy source that is characterised by variability and uncertainty, such as wind power and solar power. Less common VRE includes run-of-river hydropower and wave power.
URBANTRANSITIONS.GLOBAL | 5
Introduction
Across the world, droughts, floods, wildfires, heatwaves and hurricanes are intensifying, causing loss of life and economic damage. The science behind these signs of a global climate crisis is set out in the Intergovernmental Panel on Climate Change’s (IPCC) special report, which concluded that global greenhouse gas emissions in 2030 would need to be half the level of 2010, and reach net-zero by 2050 if the world is to prevent catastrophic climate change.1 The urgency of climate action could not be clearer. Although global emissions growth flattened in 2019, greenhouse gas emissions are continuing to increase, particularly in
fast-growing economies such as those in Asia.2 Limiting global heating to 1.5°C will require “rapid and far-reaching” transitions in land, energy, industry, building, transport and cities.3 It will require action by governments, local authorities, businesses and citizens, both collectively and individually.
This paper focuses on the decarbonisation of electricity systems in cities, where most of the world’s energy is consumed. Urban settlements are currently home to 54% of the world’s population4 and are responsible for more than 80% of global gross domestic product (GDP).5 Urban areas account for more than two thirds of the world’s final energy consumption6 and
the 100 largest cities account for 18% of global greenhouse gas emissions.7 The share of the world’s population in urban settlements is expected to grow to 68% by 2050,8 with the biggest growth in urban populations projected in Asia and Africa, where much of the urban infrastructure that will exist in 2050 has yet to be built.
A rapid expansion of electricity supply is needed to meet the aspirations of these growing urban populations. It is also needed for the electrification of services previously provided by fossil fuels, such as heating and mobility. At the same time, to keep global heating from rising more than 1.5°C, existing thermal generation using fossil fuels needs to be phased out. This will require a massive investment into renewable electricity generation infrastructure in and around cities in order to meet their growing demand for electricity in a sustainable way. However, investment alone is not enough to address the challenges of transition – electricity systems and their evolving governance are also firmly in the spotlight.
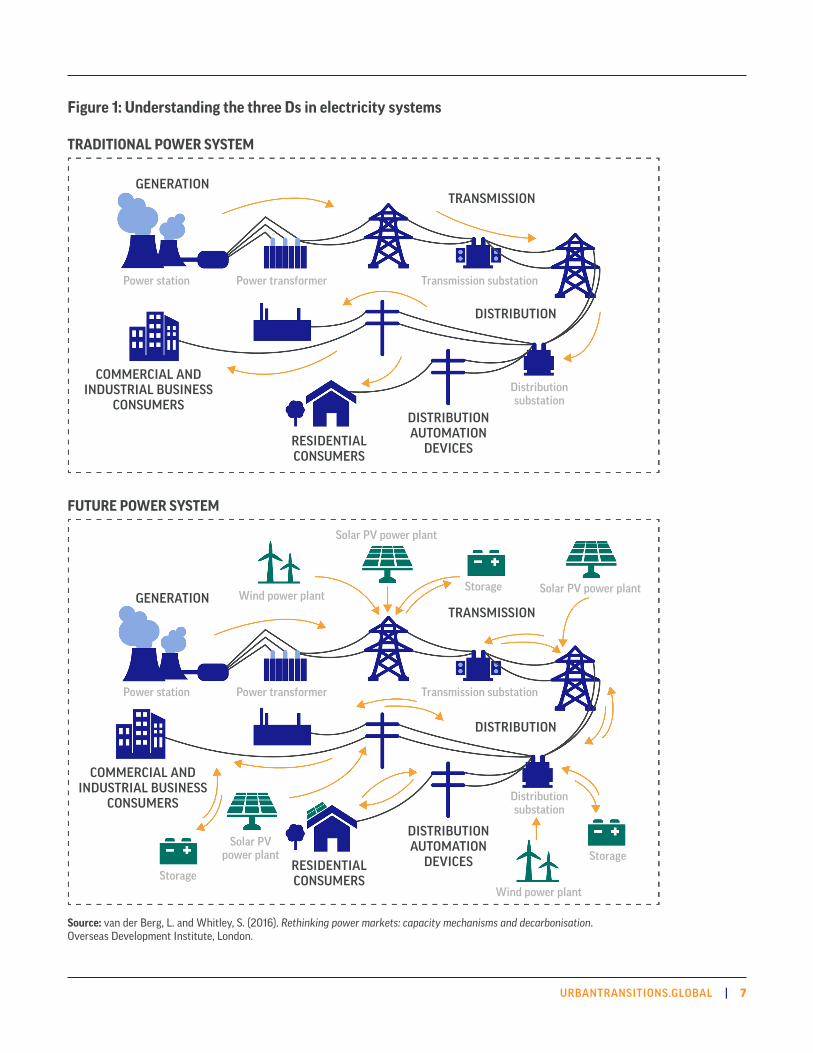
THE THREE DS: DECARBONISATION, DECENTRALISATION AND DIGITALISATION
The transition to renewable electricity is taking place in the context of several trends that are driving the restructuring of electricity markets, known as the three Ds9 (see Figure 1).
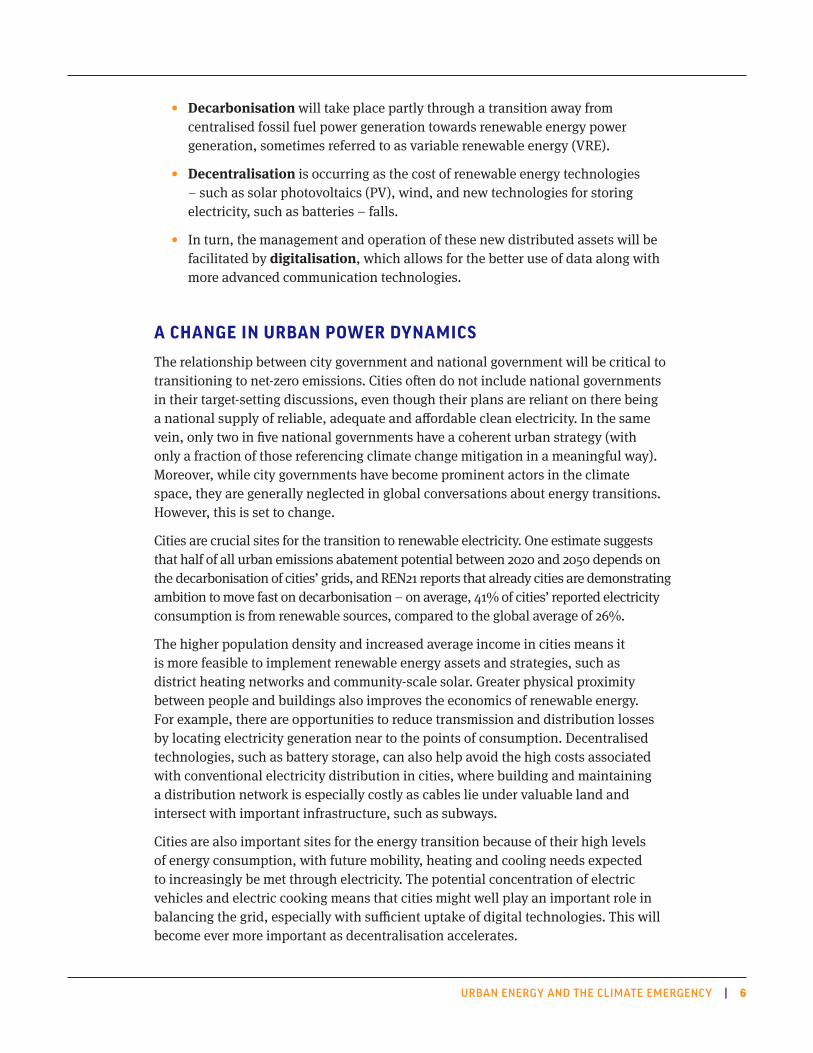
• Decarbonisation will take place partly through a transition away from centralised fossil fuel power generation towards renewable energy power generation, sometimes referred to as variable renewable energy (VRE).
• Decentralisation is occurring as the cost of renewable energy technologies – such as solar photovoltaics (PV), wind, and new technologies for storing electricity, such as batteries – falls.
• In turn, the management and operation of these new distributed assets will be facilitated by digitalisation, which allows for the better use of data along with more advanced communication technologies.
A CHANGE IN URBAN POWER DYNAMICS
The relationship between city government and national government will be critical to transitioning to net-zero emissions. Cities often do not include national governments in their target-setting discussions, even though their plans are reliant on there being a national supply of reliable, adequate and affordable clean electricity. In the same vein, only two in five national governments have a coherent urban strategy (with only a fraction of those referencing climate change mitigation in a meaningful way). Moreover, while city governments have become prominent actors in the climate space, they are generally neglected in global conversations about energy transitions. However, this is set to change.
Cities are crucial sites for the transition to renewable electricity. One estimate suggests that half of all urban emissions abatement potential between 2020 and 2050 depends on the decarbonisation of cities’ grids, and REN21 reports that already cities are demonstrating ambition to move fast on decarbonisation – on average, 41% of cities’ reported electricity consumption is from renewable sources, compared to the global average of 26%.
The higher population density and increased average income in cities means it is more feasible to implement renewable energy assets and strategies, such as district heating networks and community-scale solar. Greater physical proximity between people and buildings also improves the economics of renewable energy. For example, there are opportunities to reduce transmission and distribution losses by locating electricity generation near to the points of consumption. Decentralised technologies, such as battery storage, can also help avoid the high costs associated with conventional electricity distribution in cities, where building and maintaining a distribution network is especially costly as cables lie under valuable land and intersect with important infrastructure, such as subways.
Cities are also important sites for the energy transition because of their high levels of energy consumption, with future mobility, heating and cooling needs expected to increasingly be met through electricity. The potential concentration of electric vehicles and electric cooking means that cities might well play an important role in balancing the grid, especially with sufficient uptake of digital technologies. This will become ever more important as decentralisation accelerates.
URBANTRANSITIONS.GLOBAL | 7
Figure 1: Understanding the three Ds in electricity systems
Source: van der Berg, L. and Whitley, S. (2016). Rethinking power markets: capacity mechanisms and decarbonisation. Overseas Development Institute, London.
Although cities are often the main consumers of electricity supplied by national utilities, city governments are unlikely to have a say in energy strategy, investment or operations at a national level. The influence of city governments is determined by multiple factors including population size, the share of energy consumption, market structures and energy regulation. Figure 2, for example, shows the absence of the demand-side, or cities’ role in energy transitions as they are currently characterised.
Despite the current structures, there are various reasons why city governments might in fact be better placed to ease the energy transition than national governments. For example, cities often have distinct political identities and local governments often have more engagement with citizens than their national counterparts.14 This could create more opportunities as well as the motivation for the kind of profound, rapid changes in processes and practices necessary to reach zero-carbon urban electricity, which could be driven by citizens, firms and governments working together within cities.15
Many city governments are seeking a leadership role in climate change, including through commitments to decarbonise urban electricity. Over 250 cities, for example, have set targets to achieve 100% renewable energy in electricity, heat or transport (or a combination).16 City governments are pursuing different strategies to realise this goal. Some have the ability to directly purchase or invest in renewable energy (though many cannot), others can provide and facilitate finance, and most can engage in advocacy and knowledge-sharing.17 Many municipal authorities are directly involved in the experimentation and piloting of new electricity service models,18 be it through municipal utilities (as in Germany) or bulk-buying electricity for redistribution within cities (as in South Africa). City governments can also work together to use their joint buying power to influence a state or national utility.19
Figure 2: Characteristics and key transition challenges in different phases of renewable integration
Source: International Energy Agency, 2018. World Energy Outlook 2018. International Energy Agency, Paris.13
Phase 6. Monthly or seasonal surplus or deficit of VRE supply
Phase 5. Growing amounts of VRE surplus (days to weeks)
Phase 4. The system experiences periods where VRE makes up almost all generation
Phase 3. VRE generation determines the operation pattern of the system
Phase 2. VRE has a minor to moderate impact on system operation
Phase 1. VRE has no noticeable impact on the system
6
5
4
3
2
1
KEY TRANSITION CHALLENGES
Need for seasonal storage
Longer periods of energy surplus or deficit
Power supply robustness under high VRE generation
Greater variability of net load and new power flow patterns
Minor changes to operating patterns
URBANTRANSITIONS.GLOBAL | 9
Urban planning decisions can also accelerate the urban electricity transition. For example, the introduction of low-emission or clean-air zones can accelerate the electrification of transport as well as promote a modal shift to public transit, cycling and walking. However, it should be noted that these types of ambitious schemes might only be within the reach of larger, wealthier cities. Smaller urban areas should not be neglected by national governments20 as they are where a large share of the urban population – and thus the opportunity to reduce environmental footprints – resides.
THE DIVERGENT CONDITIONS FOR TRANSITION BASED ON THE THREE DS
There is no single recipe or blueprint for urban electricity transition. Transition entails changes in multiple elements of the energy system, including the physical infrastructure (technology, production equipment and distribution chains), the behaviour of actors in the electricity sector (investors, system operators, consumers), and the set of regulations, policies and institutions that govern the system.21 The form and speed of transition in urban electricity systems will depend on local and national circumstances. There is great diversity among cities in terms of size, geography, economic and energy resources, and electricity system structure and performance.
In addition, the differences between cities in terms of the speed of decentralising generation and proliferating digitalisation will mean that the cost of decarbonising electricity systems will vary greatly. Thus the transition in a megacity such as London, United Kingdom (UK), where the reliable electricity system is a competitive market and experimentation with decentralised and digital technologies is advanced, is likely to take a different path to the transition in Accra, Ghana, where 45% of its 1.6 million inhabitants live in low-income housing with limited access to essential services and are subject to regular power outages.
As the science tells us we need to reach net-zero emission energy systems by the middle of the century, two urgent questions must be answered:
1. How can national governments harness the density and dynamism of cities to accelerate the urban electricity transition?
2. What are the emerging opportunities offered by decentralisation and digitalisation?
This paper seeks to answer these questions for national decision-makers. First, it examines the three D megatrends of decarbonisation, decentralisation and digitalisation (Section 2). It then presents a framework to help national and urban decision-makers understand the interactions and interdependencies of the three Ds in an urban context and how they influence the development of electricity systems (Section 3). This framework is then applied to 10 city case studies from around the world (Section 4). Finally, the paper offers key considerations and principles for national policy-makers seeking to drive an electricity transition that provides low-cost, low-carbon energy for all (Section 5) before concluding remarks (Section 6).
As set out in the introduction, a global electricity sector transition is under way based on the three D megatrends of decarbonisation, decentralisation and digitalisation. Further change is expected with the acceleration of the penetration of renewable power and its corresponding electrification. Complete decarbonisation of the power sector, followed by the electrification of industrial processes and sectors such as heat and transport, will put electricity at the core of a fully net-zero society. More open to debate is the pace of the transition, which is dependent on policy decisions and institutions, along with the costs of the different options (and who will ultimately bear those costs).
Achieving the energy transition via the three Ds presents many challenges to our current approaches to electricity infrastructure, policy and practices. For instance, renewable electricity generation does not have the same economies of scale challenges as fossil fuel power generation. Smaller generation units are economically viable, particularly when the costs of transmission (including transmission losses) are included;22 they are faster to install and commission than large-scale plants;23 and they can be sited close to electricity consumers, which reduces the cost of electricity transmission and distribution. These are just some of the reasons why small generation units, including very small rooftop solar PV units, are increasing in number.
Similarly, consumers in some countries can now buy electric vehicles or smart home systems. This changes their demand from the grid and also allows them to flexibly absorb variability in electricity supply. The promise of digitalisation is that it enables small decentralised generation units to be integrated into the grid, and energy supply will no longer be exclusively provided by utility companies. Moreover, it creates opportunities to manage systems with variable renewable power generation at numerous sites by instantly matching electricity supply to demand.
DECARBONISATION
Climate change is one of the defining global challenges of our time. Almost every nation has committed to reducing greenhouse gas emissions to achieve the global heating goal of 2°C and, if possible, limit global heating to 1.5°C.
The power sector is a major focus for achieving these emission reductions and it will need to be a net-zero emitter by 2050. This will require the phasing out of electricity generation from fossil fuels in tandem with investment in renewable generation capacity. While solar and wind combined currently make up around 8% of global electricity production – within an overall share of renewables of 26% – renewables accounted for 64% of new net electricity capacity in 2018, with more than nine countries generating more than 20% of their electricity via wind and solar.24
2.
URBANTRANSITIONS.GLOBAL | 11
At the same time, demand for electricity will continue to grow globally,25 due largely to population and income growth in many emerging economies, combined with the inclusion in electricity services of the 840 million people currently without access. Decarbonisation means electricity should provide a much larger share of final energy consumption, which would be achieved through the electrification of energy services such as heating and mobility. The share of electricity in final energy consumption is set to grow from 19% in 2017 to 20.3% in 2025 and 23.7% in 2040, according to the International Energy Agency (IEA).26
Currently, energy production and use is already the source of three-quarters of the world’s total greenhouse gas emissions.27 While progress on decarbonisation is gathering momentum, it must accelerate massively in order to meet targets. This presents us with daunting challenges, not least that supply will need to almost double between 2020 and 205028 (by which time most of the world’s electricity should be produced from renewables)29 and some US$2.4 trillion will need to be invested in renewables every year until 2035 to achieve this.30
DECENTRALISATION
In the context of the energy sector, decentralisation usually refers to distributed electricity assets and management as a contrast to centralised generation in large-scale power plants. However, the term goes beyond power generation and includes the decentralised management of distribution services, as well as the ability to be flexible in the balancing of a variable supply and demand. While there are many distributed technologies – including micro-hydro, wind, biogas digestors, or technologies installed in buildings such as heat pumps – the most common form of decentralised renewable electricity currently comes from solar PV panels and more recently, local battery storage. All these new technologies may be used to generate power for a site’s use (solar home systems in many countries are not grid connected) or be fed back to a mini, micro, local or national grid, requiring bidirectional flows of power at scale.
In recent years, the cost of these technologies has rapidly declined: the price of solar and batteries has decreased by 85% and wind by 49% since 2010.31 These trends, which are expected to continue,32 have made the cost of decentralised generation using renewables competitive with that of large power plants. About 5% of urban electricity demand in 2050 could be met cost-effectively by rooftop solar PV, which has the technical potential to supply 32% of urban electricity.33 When larger-scale PV systems (that can power hundreds or thousands of homes and offices) and small wind power plants are taken into consideration, distributed renewable energy generation is likely to contribute a significant share of urban electricity in the future.
These changes are likely to provoke enormous disruption to the existing power balance in the energy sector as customers become “prosumers” (producer-consumers), managing their own small-scale distributed renewables, which are often connected behind-the-meter at a customer’s home or premises. These prosumers will thus be able to produce, store and consume electricity they have generated, deciding to
purchase from the grid if their supply is not enough and, where regulations allow, sell to the grid when they have a surplus (in the same way diesel back-up generators have been used in some countries to supply the grid). Alternatively, decentralisation might provide the basis for more modular systems, particularly where there is a lower population density with high energy demand, such as around the urban periphery. In these areas, small-scale grids can be faster to construct and more economic for meeting business needs than large-scale grid infrastructure. By 2027, the microgrid market will be worth US$25–30 billion, with much of the growth (30%) in off-grid areas adjacent to, or outside of, cities.34
As decentralised solutions reach cost parity with grid-supplied electricity and market penetration of new technologies at the grid edge increases, decentralisation trends are expected to profoundly impact the industry. New business models and technologies will be needed to fund connective infrastructure, store power and balance the grid. Tipping points will be reached first in Australia, where it is expected that 38% of solar will be behind-the-meter in 2050, closely followed by Japan, Europe and California, United States of America (US).35
Box 1. Decentralisation does not equal decarbonisation
Historically, decentralised or distributed generation has been used only where grid electricity is unavailable or unreliable. Interruptions to urban electricity supplies – due to technical faults, natural disasters or load shedding to balance supply and demand – vary in frequency and duration between countries and cities. For example, the average electricity consumer in the US experienced 1.3 outages and was without power for 250 minutes in 2016.36 In South Asia, businesses reported on average 25 power outages a month.37
One way that businesses, public services and some households have traditionally combatted this is by using medium-sized and small-scale diesel generators to provide emergency back-up when the power grid fails. This often provides a huge amount of power. For example, the northeastern states of the US were reported to have 10 gigawatts (GW) of back-up generation capacity, equivalent to approximately 12% of the capacity connected to the grid in these states.38 In Nigeria, the total capacity of diesel generators (estimated between 8 GW and 14 GW) exceeds the capacity available to the grid39 and in sub-Saharan Africa, privately-owned generators account for 6% of installed capacity.40
In developing countries, where 600,000 diesel generators were sold in 2015, about half the market is for units under 300 kW (the average was 48 kW). The commercial sector accounts for one-third of this market, which totals about US$20 million a year and is growing at a rate of 6–7% a year.41 This growth is being driven by a lack of grid infrastructure, unreliable power supplies and increasing industrialisation. Thus, decarbonising the world’s electricity systems by 2050 will require replacing the services currently provided by diesel back-up generators.
URBANTRANSITIONS.GLOBAL | 13
DIGITALISATION
Advances in digital technologies, including telecommunications and the internet, are crucial to the transition to renewable energy in two main ways:
• In terms of buildings and electricity grids, digitalisation is providing cost-effective ways to optimise existing energy infrastructure and operations through the utilisation of data and control technologies.
• Digitalisation has paved the way for the creation of new business models that provide better access for consumers and other market participants to fundamentally alter how electricity markets will work.
One of the most visible innovations brought about by energy sector digitalisation has been the introduction of smart grids (usually defined by the ability to shift from a one-way energy system described above to a two-way exchange between consumers and electricity grids, facilitated by sensors and control systems along transmission lines) and smart meters. Smart metering is just one part of the shift under way at the grid edge where homes, industrial and commercial activities
are increasingly digitally enabled. Digital capabilities include hardware for asset coordination and control – such as meter, sensors and software – and can extend into building management and operations. The combined communication capabilities of sensors, digital devices and appliances portends the mass adoption of the “internet of things,” where devices communicate with each other and machine learning allows self-optimisation without the need for direct human intervention.
Technology is similarly a key enabler of energy-efficient buildings. For instance, expanding the automation and control of buildings is often the largest opportunity for improved efficiency, providing
estimated savings of 2–5% in up to 40% of cities’ building stock.42 Prior to current advances in digital technologies, the only way to optimise buildings to make them more energy efficient was via envelope retrofits and improvement to heating and cooling systems. Nowadays there are multiple ways buildings can be digitalised in order to make them more energy efficient.
Smart meters, sensors and control systems will become more useful to decarbonisation if and when data are used effectively. Improved data may be used first to account for greenhouse gas emissions, using the location-based method recommended by the GHG Protocol,43 to show how buildings, companies and organisations are decarbonising the grid in their city over time. The data may also be used by third parties who can support network operators or retailers with digital expertise to better manage load forecasting and usage patterns, and optimise for decarbonisation. However, this has thrown up questions around data ownership and access in terms of consent and customer privacy. Thus national approaches to managing energy data will need to be a key feature of future energy transitions planning.
Another consequence of digitalisation will be disruption to the sector’s current business models. With investment in digital energy infrastructure and software growing at 20% per year,44 the electricity sector is likely to experience a shake-up akin to those experienced in the transportation, telecommunication and hospitality sectors, which have been quicker to adopt digital technology. Companies such as Uber, Mobike, Skype, WeChat and Airbnb have thoroughly changed both the business models and energy use of their sectors. However in contrast to these more fluid sectors, the energy sector is highly regulated, so technological shifts will have to be tightly coupled with policy and regulatory change. While digital energy businesses are already managing and controlling electricity on some levels – devices, homes, offices, schools, buildings, microgrids, neighbourhoods and cities – what is yet to play out is a market-wide operating model for decentralised systems.
URBANTRANSITIONS.GLOBAL | 15
A framework for understanding urban energy transitions
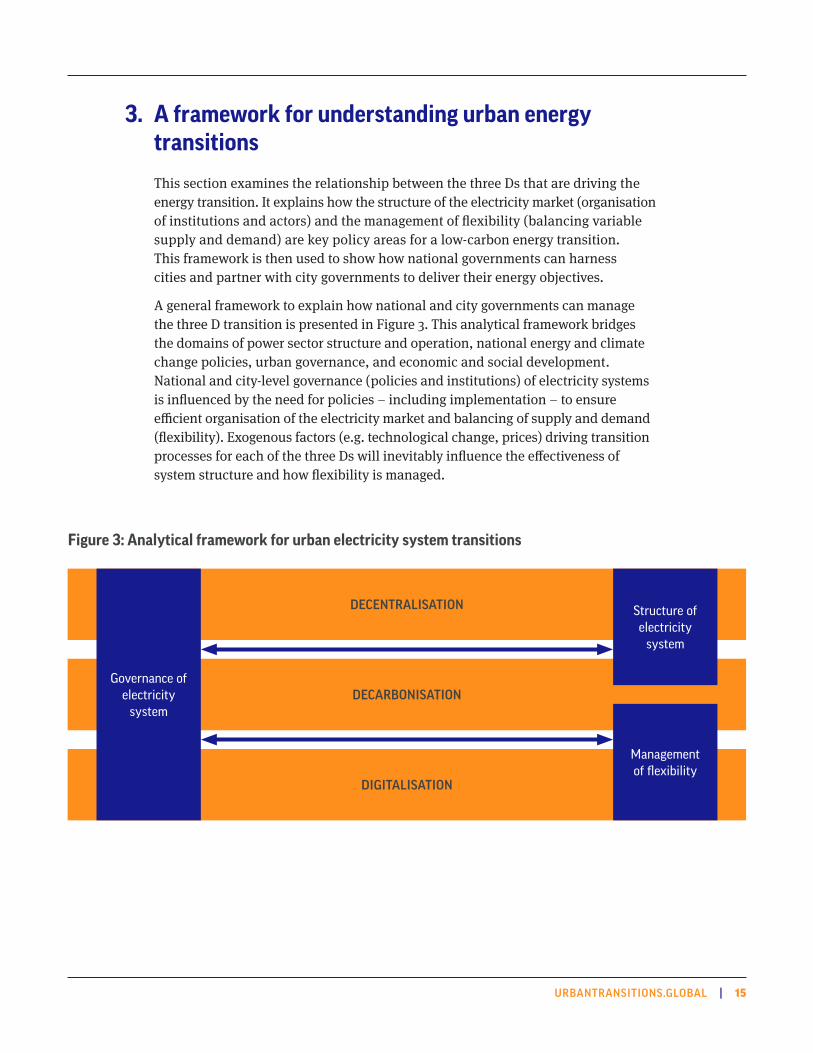
This section examines the relationship between the three Ds that are driving the energy transition. It explains how the structure of the electricity market (organisation of institutions and actors) and the management of flexibility (balancing variable supply and demand) are key policy areas for a low-carbon energy transition. This framework is then used to show how national governments can harness cities and partner with city governments to deliver their energy objectives.
A general framework to explain how national and city governments can manage the three D transition is presented in Figure 3. This analytical framework bridges the domains of power sector structure and operation, national energy and climate change policies, urban governance, and economic and social development. National and city-level governance (policies and institutions) of electricity systems is influenced by the need for policies – including implementation – to ensure efficient organisation of the electricity market and balancing of supply and demand (flexibility). Exogenous factors (e.g. technological change, prices) driving transition processes for each of the three Ds will inevitably influence the effectiveness of system structure and how flexibility is managed.
3.
DECENTRALISATION
DECARBONISATION
DIGITALISATION
Figure 3: Analytical framework for urban electricity system transitions
The structure of a country's electricity sector has two interdependent dimensions:
• The level of integration in the electricity value chain (generation, transmission, distribution, consumption).
• The degree of competition at each stage. This is reflected in Figure 4, which broadly shows the range of possible structures.
The traditional structure of vertically integrated monopolies – common in the second half of the last century – is now found in only a few countries.45 Although monopolistic entities do remain – particularly for network operations – the generation, transmission and distribution of electricity have been unbundled to varying degrees in most countries. In 2015, more than two-thirds of the countries that comprise the Organisation for Economic Co-operation and Development (OECD) and about a third of other countries had completely unbundled systems, with different companies operating at each stage in the value chain.46
In countries with unbundled or partially unbundled structures, there can be multiple power producers, distribution system operators and retail suppliers. The rationale for unbundling is to facilitate competition – opening space for new businesses at different stages of the value chain – and to improve efficiency in the supply of electricity. However, in reality the scope for competition is affected by the size of the power sector and its technical characteristics, as well as political economy factors. For instance, there might be a single buyer of electricity generated by independent power producers or regulations restricting the buying and selling of electricity by different market actors at each stage in the value chain. Legal frameworks for the power sector and electricity market codes determine roles, responsibilities and who – including city governments – can participate in the wholesale and retail electricity markets.47
Figure 4: Alternative structures for the electricity sector
Source: Adapted from International Energy Agency, 2017. Status of Power System Transformation 2017: System integration and local grids. International Energy Agency, Paris.
VERTICAL INTEGRATION
SINGLE-BUYER UNBUNDLINGWHOLESALE
MARKETRETAIL
COMPETITION
Ownership of all electricity
market segments
Vertically integrated utility with non-utility
participation in generation
Utility partially broken up and/or partially divested
Increased generation
competition through market
Introduction of competition for retail customers among suppliers
URBANTRANSITIONS.GLOBAL | 17
Structural change may be necessary in some contexts to take advantage of the potential of decentralisation and digitalisation to achieve the imperative of decarbonisation. This may, in turn, require changes to national legal frameworks for electricity systems, as well as market rules and regulations. For example, electricity storage is often limited by regulations to specific market segments; the aggregation of services from distributed renewable energy systems is not allowed in many markets. Electricity storage, VRE, distributed electricity assets and tools such as demand response – key resources for managing flexibility in modern systems – have new cost structures, services and organisational arrangements that call for changes in electricity system regulations.
MANAGEMENT OF FLEXIBILITY
The concept of flexibility is key to future electricity systems.50 It is defined as “the ability of a power system to reliably and cost-effectively manage the variability and uncertainty of demand and supply across all relevant timescales, from ensuring instantaneous stability of the power system to supporting long-term security of supply.”51 In centralised and vertically integrated systems, the security of supply has historically meant building enough generation capacity to meet demand peaks and balancing electricity supply with demand simultaneously, in real time. Optimisation occurred through the management of the supply, with supply from generators being ramped up quickly to meet peaks in demand (peaks are the specific daily and seasonal periods over summer and winter when the most electricity is consumed).
However, renewables have their own challenges when it comes to flexibility that will need to be addressed. For example, VRE such as solar and wind involves rapid changes in voltage and power quality, seasonal changes in capacity due to weather and timescale management that ranges from second-by-second to annual. In some cases, such as in the UK and Germany, wind generation is curtailed if it is too plentiful, and increasingly competitive markets experience negative wholesale energy prices.52 Where there is not enough VRE to meet peak demand, generators or large-scale gas or coal plants are kept as back-up to provide additional electricity. However, keeping fossil fuel plants on the grid for a diminishing number of hours is costly and misaligned with the decarbonisation targets of countries and cities.53
Advances in electricity storage offer part of the answer. Until recently, electricity storage has been impractical and uneconomic other than in the form of pumped storage on hydropower schemes, which currently accounts for approximately 96% of global electricity storage capacity.54
However, as demand for electricity storage increases as the share of renewables and the number of distributed assets grows – this demand is expected to be 155–227% higher in 2030 than in 201755 – batteries and other new storage technologies, such as hydrogen, will be used to meet much of this demand. This will include large-scale storage, such as South Australia’s 100 MW battery attached to a wind farm. It will also include small-scale battery storage either in buildings connected to distributed energy resources (in Germany, for instance, 40% of small-scale solar PV systems have been installed with batteries)56 or inside electric vehicles that plug into electricity grids to charge (the total installed capacity of battery storage in 2019 – 3 GW – included 260 million two-wheeler vehicles, or half of the total electric vehicle stock).57
Storage occurs at both the generation and consumption stages of the value chain. In some systems, when stored electricity (e.g. in batteries, hydrogen or fuel cells) is transported between the generation plant and consumers, there is a distribution stage.
Storage may be sited at transmission level and serve to support ancillary services of the national grid operator, or it may be behind-the-meter on a premises, acting as a back-up power supply.
Increasingly, mobile storage in the form of electric vehicles will also be able to provide the ability to interact with local distribution networks if they are able to be controlled at the charging station. This “smart charging” allows a vehicle to plug in but not actually begin charging until price or grid conditions are right.
The combination of decentralised renewable energy and digitalisation further increases the options for system operators. Demand-side response (i.e. the management of energy consumption by buildings, electric vehicles and other assets) is as reliable as supply-side or storage technologies and a more cost-effective flexibility solution.58 Common examples of demand-side response include dimming lighting, avoiding air conditioning or altering industrial production in response to a market signal to turn down demand. Better insulated buildings increase this thermal storage capability as cooling or heating systems can be switched off for longer without loss of comfort in the building. Even smart-home systems can be used to turn up demand in response to energy generation, for example by operating washing machines and dishwashers at off-peak hours. With digital capabilities, the sophisticated optimisation of assets in a building (or coordination across multiple buildings) is possible without any noticeable change in performance. Demand-side response is even starting to be valued at distribution level. In the UK for instance, distribution system operators are beginning to procure demand-side response to avoid investment in the costly substation replacements that they would have turned to in the past.59
How electricity systems manage variability in electricity demand and supply is thus critical for the transition to renewable systems. In systems with a high share of electricity from renewable energy sources – either centrally or locally – optimisation can be achieved by managing both supply and demand in ways that are increasingly easy to access through digital technologies. Potentially, these technological improvements in storage and demand-side management taking place in cities can also help national electricity system operators to achieve other objectives, such as service reliability, system flexibility, affordability and accountability.
URBANTRANSITIONS.GLOBAL | 19
City transition pathways
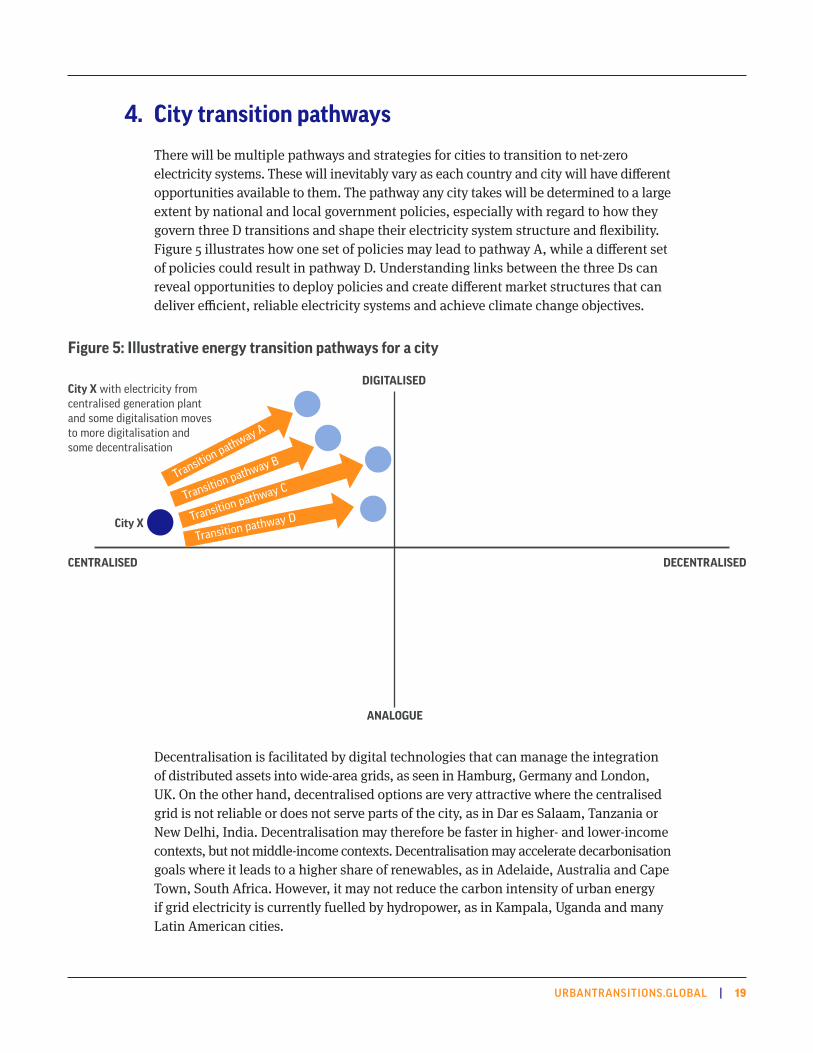
There will be multiple pathways and strategies for cities to transition to net-zero electricity systems. These will inevitably vary as each country and city will have different opportunities available to them. The pathway any city takes will be determined to a large extent by national and local government policies, especially with regard to how they govern three D transitions and shape their electricity system structure and flexibility. Figure 5 illustrates how one set of policies may lead to pathway A, while a different set of policies could result in pathway D. Understanding links between the three Ds can reveal opportunities to deploy policies and create different market structures that can deliver efficient, reliable electricity systems and achieve climate change objectives.
4.
Figure 5: Illustrative energy transition pathways for a city
City X with electricity from centralised generation plant and some digitalisation moves to more digitalisation and some decentralisation
CENTRALISED
ANALOGUE
DIGITALISED
DECENTRALISED
City X
Transition pathway A
Transition pathway B
Transition pathway C
Transition pathway D
Decentralisation is facilitated by digital technologies that can manage the integration of distributed assets into wide-area grids, as seen in Hamburg, Germany and London, UK. On the other hand, decentralised options are very attractive where the centralised grid is not reliable or does not serve parts of the city, as in Dar es Salaam, Tanzania or New Delhi, India. Decentralisation may therefore be faster in higher- and lower-income contexts, but not middle-income contexts. Decentralisation may accelerate decarbonisation goals where it leads to a higher share of renewables, as in Adelaide, Australia and Cape Town, South Africa. However, it may not reduce the carbon intensity of urban energy if grid electricity is currently fuelled by hydropower, as in Kampala, Uganda and many Latin American cities.
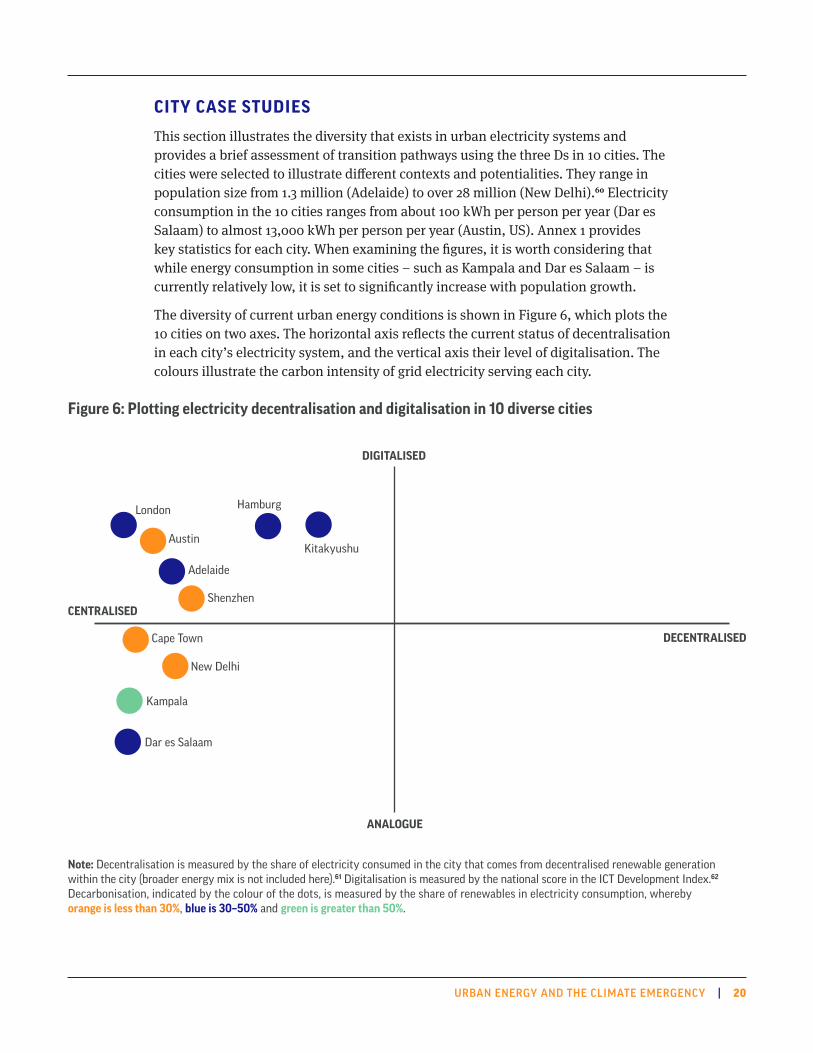
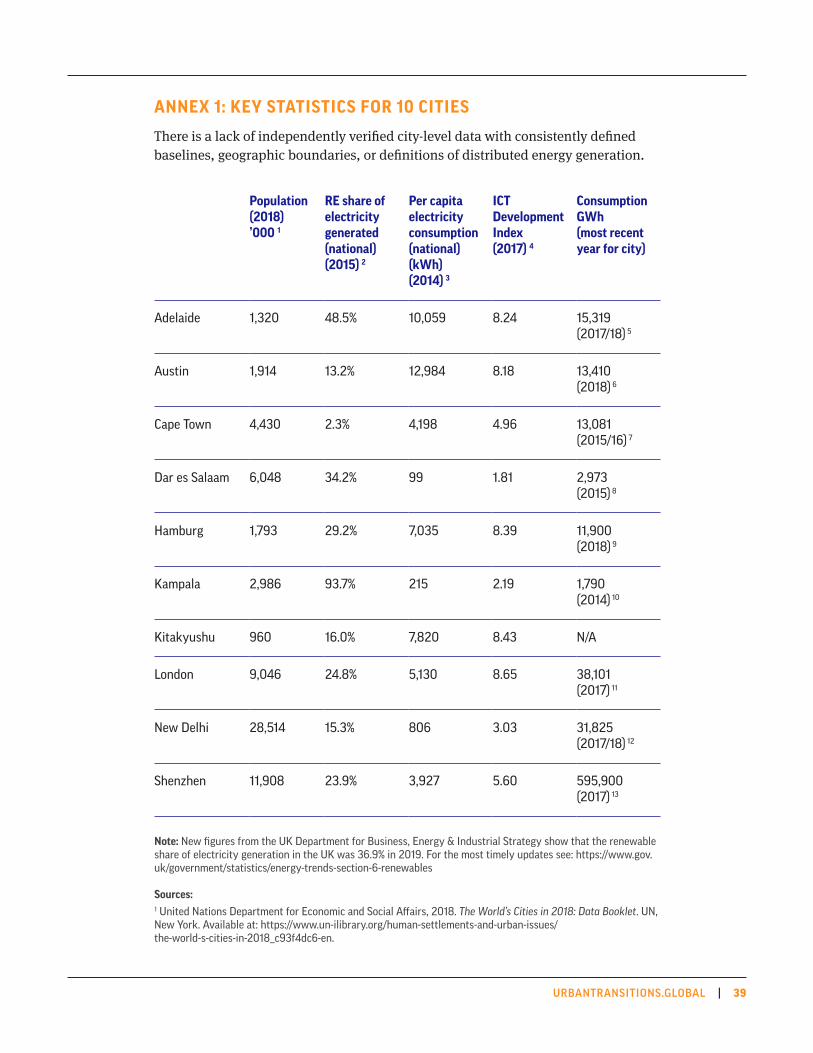
This section illustrates the diversity that exists in urban electricity systems and provides a brief assessment of transition pathways using the three Ds in 10 cities. The cities were selected to illustrate different contexts and potentialities. They range in population size from 1.3 million (Adelaide) to over 28 million (New Delhi).60 Electricity consumption in the 10 cities ranges from about 100 kWh per person per year (Dar es Salaam) to almost 13,000 kWh per person per year (Austin, US). Annex 1 provides key statistics for each city. When examining the figures, it is worth considering that while energy consumption in some cities – such as Kampala and Dar es Salaam – is currently relatively low, it is set to significantly increase with population growth.
The diversity of current urban energy conditions is shown in Figure 6, which plots the 10 cities on two axes. The horizontal axis reflects the current status of decentralisation in each city’s electricity system, and the vertical axis their level of digitalisation. The colours illustrate the carbon intensity of grid electricity serving each city.
Figure 6: Plotting electricity decentralisation and digitalisation in 10 diverse cities
CENTRALISED
ANALOGUE
DIGITALISED
DECENTRALISED
London Hamburg
KitakyushuAustin
Adelaide
Shenzhen
Cape Town
New Delhi
Kampala
Dar es Salaam
Note: Decentralisation is measured by the share of electricity consumed in the city that comes from decentralised renewable generation within the city (broader energy mix is not included here).61 Digitalisation is measured by the national score in the ICT Development Index.62 Decarbonisation, indicated by the colour of the dots, is measured by the share of renewables in electricity consumption, whereby orange is less than 30%, blue is 30–50% and green is greater than 50%.
URBANTRANSITIONS.GLOBAL | 21
The six cities in the upper-left quadrant reflect a relatively high level of digitalisation and limited-to-moderate decentralisation.63 Five of those cities are in countries with high incomes and high per capita electricity consumption. In the lower-left quadrant are four cities in non-OECD countries with limited decentralisation and moderate digitalisation.64 All cities are on the left-hand side of the figure because less than 30% of their electricity is generated from decentralised sources. The cities vary greatly in the carbon intensity of their electricity consumption. In Kampala, almost all the electricity consumed is generated from renewable energy sources – mainly large-scale hydro – while Cape Town is the opposite, with almost all electricity from (mainly coal-fired) thermal power stations.
There is no correlation between the current share of renewables in a city’s electricity consumption and its levels of decentralisation and digitalisation. However, the pathway to decarbonisation for cities with a significant share of electricity generated from fossil fuels will be influenced by how they pursue decentralisation and digitalisation. This, in turn, will be affected by existing power sector structures along with how flexibility is managed.
In order to understand which pathway the city might take, each of the case studies examines various factors (where information is available):
• The city’s own decarbonisation or energy targets;
• The city’s current electricity consumption at peak and average times;
• The share of renewables in the city’s electricity mix;
• The share of locally-sited renewable energy generation;
• The city’s level of digital adoption (e.g. smart meters);
• Geographic considerations; and
• Market structure.
This assessment allows some general conclusions to be drawn about the implications of the transition for the structure of the electricity system and the management of flexibility to ensure efficient and reliable supplies.
Adelaide
Adelaide’s grid electricity is supplied by the state’s distribution service operator, South Australia Power Networks, and rooftop solar PV. In 2017/18, over half (51%) of the electricity generated in the state of South Australia was from gas, 39% from wind, 8% rooftop PV and just over 1% diesel and non-scheduled generation.65 Although rooftop solar PV capacity is expected to increase, this will continue to supply a small proportion of total demand. The promotion of household and large-scale battery storage will improve the efficiency of this renewable generation capacity,66 but decarbonisation objectives will depend on replacement of the state’s gas-fired plants.
Decentralisation within the city’s electricity system is reflected in the distributed generation capacity of rooftop solar PV, complemented by battery storage. There is scope to increase the proportion of homes with solar PV and batteries with subsidies provided by the state government. The state government is supporting the installation of 40,000 residential batteries and has plans for a virtual power plant that would link 50,000 home systems across the state.67
Australia is highly digitalised, ranking 14th globally in the 2017 ICT Development Index. Adelaide and South Australia have recognised the potential of digitalisation. They have rolled out smart metering and there are plans to credit users for giving surplus energy back to the grid, as well as virtual power plants. The spot market for electricity, enabled by digital technologies, provides financial incentives for energy efficiency and demand-side flexibility. Digitalisation will also enable demand-side response for the management of system flexibility. The high number of air conditioning units and (expected) electric vehicles, could provide the distributed assets to facilitate demand-side response for flexibility. The Australian Energy Market Operator and the Australian Renewable Energy Agency have a pilot programme that hopes to enable up to 160 MW of demand response nationally.
Austin
In 2018, around 38% of Austin’s electric power came from wind, solar and other renewable resources.68 Austin had a population of 1.9 million in 2018, which is expected to increase to 2.5 million by 2030.69 The US ranks 16th in the 2017 ICT Development Index.70 Austin’s retail energy market is run by a single operator, Austin Energy. It is a publicly owned utility, the 8th largest in the US, providing electrical power to the city of Austin and surrounding areas and serving more than 485,000 customers in 2018.71 Austin owns its electric utility and the grid is managed by the Electric Reliability Council of Texas.
Austin Energy’s Resource, Generation and Climate Protection Plan72 includes a comprehensive set of goals for decarbonisation, energy efficiency, demand-side response, technology and storage. It includes increasing the share of renewables in the electricity mix from 38% in 2018 to at least 55% by 2025 and 65% by the end of 2027, and increasing installed solar capacity from 529 MW in 2018 to at least 950 MW by 2025 (including an increase in rooftop solar capacity from 63 MW in 2018 to 100 MW). The plan also aims to achieve 800 MW of energy efficiency and demand response by 2020 and an incremental 100 MW of demand response to achieve a total of at least 900 MW of demand-side management by 2025. Further, it aims to achieve 30 MW of local thermal storage by 2027 and a minimum of 10 MW of electric storage by 2025. While Austin Energy has plans to reduce some thermal capacity and increase energy efficiency, the total renewable capacity proposed for 2027 is equivalent to about 36% of current peak demand. Further decarbonisation of generation capacity will be required to achieve 100% renewables.
URBANTRANSITIONS.GLOBAL | 23
Cape Town
Cape Town’s population is expected to grow from 4.4 million in 2018 to 5.5 million in 2030.73 The city accounts for 9% of South Africa’s total GDP. The current overall energy mix is dominated by diesel (35%), electricity (27%) and petrol (26%).74 The high use of diesel may be due to problems that the national utility company, Eskom, has had with load shedding (meaning customers are not getting the power they need) in recent years. Because Cape Town’s own municipal utility – which supplies three quarters of the city’s power – must buy from Eskom, the city does not have many options to avoid local diesel being used by consumers in response to load shedding, or to improve the national electricity mix, currently 89% coal-based.75
The city does have three small generation units of its own, which are used primarily for flexibility (load balancing). The city is also now buying electricity from South
Africa’s first commercial wind farm at Darling, 70 km north of the city, although accessing the power from the wind farm still technically remains dependent on Eskom.76 The city has a target to have 120 MW installed capacity of rooftop solar PV by 2020 – up from 3 MW in 2014 – mostly operated by commercial and industrial users, as well as 100 MW of wind power by the same date. Together, these would provide approximately 10% of the total capacity to meet current demand. Since 2016, a feed-in tariff has been in place for households and industrial generators.77
Cape Town has three routes to decarbonise its electricity: an increased share of renewables in the power supplied by the national grid (which it has no direct control over); an increase in direct purchases of renewable electricity by the city-owned
distribution system; and an increased adoption of rooftop solar PV. All three decarbonisation routes will be needed in order to achieve the city’s goal of net-zero emissions by 2050, complemented by improved energy efficiency in buildings, appliances and vehicles (roughly 50% of emissions).
As the number of renewable power producers grows, opportunities for the city-owned distribution system to purchase from renewable energy independent power producers may increase. However, the city will likely be constrained by national regulations that limit such purchases to Eskom unless the outcome of a current case being reviewed by the constitutional court falls in the city’s favour (ruling expected May 2020). The city is seeking to increase its direct purchase of renewables from independent power producers, arguing that it is critical to ensure it can meet its targets.78 Regardless of the progress that can be made through independent power producers, a large share of the city’s electricity will likely still be supplied from Eskom. Full decarbonisation of the city’s electricity system will therefore depend on decarbonisation of Eskom’s generation. The Department of Energy’s 2019 Integrated Resource Plan indicates South Africa’s 2030 goal is to move to 44% coal, 15% wind, 10% solar and 16% gas and diesel.79
All three decarbonisation
routes will be needed in order to achieve the city’s
Despite its reliance on Eskom, the city’s own distribution service company does represent a degree of decentralisation, with distributed solar PV generation. On a larger scale, wind power could be incentivised by the city through small-scale embedded generation (generation of less than 1MW located on residential, commercial or industrial sites where electricity is also consumed). Digitalisation to manage the system, including managing flexibility at the distribution system level, could make this more efficient and cost-effective. It could also help address a key concern that the city be able to continue to provide electricity to poor households, when it could be possible for larger generators to invest more in on-site generation (and therefore pay less for grid-supplied electricity which could increase the price of electricity for the remaining customers who cannot self-supply).
Digitalisation is a focus for both local and national government. South Africa ranks 92nd globally on the 2017 ICT Development Index, even though rates of mobile phone ownership and household connection to the internet are relatively high, at around 75%. Cape Town specifically is investing in digital infrastructure – emphasising digital inclusion – and aiming to make the city the preferred location in South Africa for technology start-ups80 – for example, in 2018 the city significantly increased fibre-optic cable infrastructure installation.
Dar es Salaam
Renewables make up 34% of the electricity supply in Tanzania. The country has a low level of digitalisation, ranking 165th in the world in the 2017 ICT Development Index.81 While only 13% of individuals are internet users, 74% have a mobile phone subscription.82 However, this is set to change as Tanzania invests in fibre (1,500 km linking the major cities including Dar es Salaam, which also has recently constructed 400 km of metro fibre) and boasts one of the most advanced mobile money markets in sub-Saharan Africa.83 Dar es Salaam has a growing tech and ICT community. The city’s population is expected to nearly double from 6 million in 2018 to 11 million in 2030.84
Electricity in Dar es Salaam is supplied by the vertically-integrated national utility, the Tanzania Electric Supply Company Limited (TANESCO). Independent power producers generate electricity and sell to TANESCO, which owns and controls transmission and distribution in most of the country. Apart from back-up generators, decentralised power generation in Tanzania, which comprises over 100 mini-grids and self-generation using petrol, diesel or solar, is all outside of Dar es Salaam. Similarly, only a very small proportion of electricity consumers in the city are served by off-grid solar systems. Across Tanzania, independent power producers account for 2% of total generation capacity (below 10 MW capacity in total). Distributed generation is mostly diesel and is used by large-scale consumers remote from the grid (e.g. mining companies) and back-up generators.
URBANTRANSITIONS.GLOBAL | 25
Due to limited levels of distributed energy generation, decarbonisation of electricity in Dar es Salaam is mainly dependent on increasing the share of grid electricity supplied from renewable sources. Tanzania has only begun to explore potential geothermal energy resources. This means the country’s immediate prospects for renewable electricity are investment in more large-scale solar and wind power and awaiting completion of the Rufiji hydropower project, which will increase capacity by 2,000 MW. There are also opportunities for distributed generation – rooftop solar PV or wind power – to be promoted within the city, but there are currently regulatory barriers to achieving this, such as taxes on home solar systems.85
Digitalisation could improve operational efficiency in the existing system, for instance through mobile payment systems for varying electricity levels. However, the regulatory framework will determine to what extent digitalisation is an enabler of decarbonisation and decentralisation. In 2012, TANESCO introduced smart meters for medium and large scale electricity users – over 100,000 smart meters have been installed so far86 – and the further roll-out of smart meters, along with the introduction of net-metering (compensation for customers who generate their own power) could help promote solar rooftop systems within the city.
Hamburg
In 2018, 48% of electricity in Germany was generated by fossil fuels (lignite, coal and natural gas) and 35% from renewable sources. Nuclear power provided about 12% of electricity.87 The country has very high rates of digitalisation, ranking 12th in the world in the 2017 ICT Development Index.88 The population of Hamburg is expected to remain stable between now and 2030.
The electricity system in Hamburg is centred on a locally managed and owned distribution network, connected to the national unbundled system.89 Electricity is supplied to the distribution company by the regional transmission operator (one of four transmission system operators in Germany), which supplied 77% of the power consumed in 2018, with decentralised generators providing the remaining 23% (2.8 TWh).90
A 2013 public referendum resulted in the municipalisation of the utility, which was completed in 2015.91 Hamburg adopted its own climate change action plan in 2015 with an aim to halve CO2 emissions by 2030 and reduce them by at least 80% by 2050. Increasing the share of electricity from renewable generation in Hamburg has two routes – decentralised generation within the city network and supplies from the national grid. Because the city will continue to rely on power from the latter, decarbonisation of Hamburg’s electricity will depend on the share of renewables in grid-supplied electricity. The federal government has a target of 65% renewables by 2030 and 100% by 2050.
The continuing transition towards decarbonisation is unlikely to be affected by the power sector’s structure, though the city may be called upon to play a bigger role in managing flexibility. Load (peak) management takes place at the interface
between the city’s distribution network and the national grid. This will continue, but more decentralised renewable generation within the city and a larger share of renewables in the grid supply, combined with digitalisation of system management, may lead to changes in how and where flexibility is managed.
The law on the digitalisation of the Energiewende (energy transition plan), approved by the German parliament in 2015, requires the installation of smart meters throughout the country by 2032. The law covers technical specifications and aims to ensure secure data exchange. Hamburg has its own Digital City Strategy, which includes “smart energy” and digitalisation in energy-consuming sectors such as transport and buildings. The city is already at the forefront of digitalisation and is the location of many experiments and innovations. The NEW 4.0 initiative, involving 60 partners in Hamburg and Schleswig-Holstein, aims to show how the whole of north east Germany, including Hamburg, can be supplied with 100% renewable energy by 2035. Greater digitalisation will facilitate decarbonisation and create potential for new actors and services (e.g. aggregators or neighbourhood distribution services), which could challenge the city’s distribution company.
Kampala
Uganda’s electricity – which is supplied from the national grid – is almost entirely from hydro power. Other renewables, such as solar PV and wind power, are limited. The country has low rates of digitalisation, ranking 152nd in the world in the 2017 ICT Development Index.94 While only 9% of households had access to the internet and 22% of individuals were internet users in 2016, mobile phone use is common (with 55 subscriptions per 100 people nationally and 86% mobile phone ownership in cities). The government has an enabling policy environment for ICT development, evidenced by its five-year ICT Strategic and Investment Plan (2015/16–2019/20). Kampala’s population is expected to increase from 3 million in 2018 to 5.5 million by 2030.95
While Uganda’s power sector structure is unbundled, the government has retained stakes in generation and transmission. The main generator is the state-owned Uganda Electricity Generation Company, operated by Eskom Uganda. The transmission company, Uganda Electricity Transmission Company, is also state-owned. The largest distribution company, Umeme, is a public company. Residential consumers comprise 90% of the total number of customers, but consume 23% of the electricity sold by Umeme, while industrial consumers make up just 3% of customers, but consume 65% of the electricity.96A feed-in tariff – set by the national regulator – is in place for hydro power, biomass and waste, but not for wind or solar. Digitalisation prospects in Uganda are limited in the short-term. Own generation by households and businesses using diesel is significant in Uganda, and there are several mini-grids outside Kampala. Approximately 270,000 home solar systems have been sold in Uganda.97
URBANTRANSITIONS.GLOBAL | 27
Despite high levels of renewable electricity, there is scope for further improvement, in particular when it comes to decarbonising back-up power. Over half of businesses in Uganda’s formal sector own or share a back-up generator, which provided about 18% of the electricity consumed by those businesses (2013 figures showed that companies endured six power outages per month on average).98 Decentralised solar PV with battery storage could be promoted to replace diesel back-up generators.
The 2016 Kampala Climate Change Action Plan includes a target of 50 MW renewable energy generation in the city – which is several times greater than the total small-scale decentralised renewable generation capacity in the country – but it does not state when or how this will be achieved.99 The broader energy transition in Uganda could be advanced through electrification in the transport system.
Kitakyushu City
Kitakyushu City, located on the island of Kyushu in southern Japan, had a population of just under 1 million people in 2017.100 The population of the greater metropolitan area of Kitakyushu-Fukuoka is expected to decline from 5.6 million in 2018 to 5.4 million by 2030.101
Japan is one of the most digitised economies in the world, ranking 10th on the 2017 ICT Development Index. Japan has been in the process of unbundling its electricity sector since 2000, with full liberalisation as of April 2016, at which point 280 operators had registered as retail suppliers. Japan’s retailers have been given a deadline of 2025 to deploy 80 million smart meters.102
Kitakyushu was one of 29 local authorities selected for the Japanese government’s Future Cities Project, which supports cities to develop their own local sustainability initiatives in line with the national Basic Environment Plan (2018). A range of city-specific factors have sped up the urgency of the city’s three D transition – alongside the national power sector unbundling – including poor air quality and environmental pollution. These factors have driven the city to lead in the development of both environmental technologies and local approaches to improving the environment and it is now known as a leading city on sustainability.
In 2015, the city of Kitakyushu established its own retail electricity company, Kitakyushu Power Company,103 which supplies low-carbon electricity generated within the city to 372 public facilities and 115 businesses, with a generation capacity of 356 MW (78% solar, 13% biomass and 9% wind power).104 The city’s Next Generation Energy Park has 19 solar PV installations, nine wind power sites and three biomass-fired generators.105 Outside the Energy Park, there are five solar PV installations, ranging in size from 180 kW to 2,900 kW and five micro hydropower generators. Kitakyushu Power cites a number of reasons for setting up as a local retail business, including lowering costs for procurement and sales of electric power, monitoring and optimising supply and demand together, and providing additional IT-enabled services to citizens.
The city is implementing several innovation initiatives to facilitate the three Ds. A Community Energy Management System was trialled from 2010–2014.106 The system introduced dynamic pricing, which resulted in peak reduction of 18–22% through demand-side response for homes. The impact on decarbonisation was impressive: over the course of the trial, residential CO2 emissions were reduced by 28%, while business experienced a 50% reduction in emissions.107 Kitakyushu is also demonstrating and testing new innovative energy technologies across the energy value chain, such as hydrogen for homes and transport.
London
The UK is known for its climate change policies and it has already seen significant nationwide adoption of renewable energy generation. Approximately one-third of grid electricity is generated from renewable sources, predominantly wind.108 A shift from coal to thermal power stations using gas (40%) and nuclear (21%), which now generate most of the country’s electricity, has significantly reduced the country’s total emissions.
While London is the largest city in the UK– with a population expected to increase from nearly 9 million in 2018 to 10 million in 2030 – energy demand has in fact fallen in recent years due to the success of efficiency measures. The UK is highly digitalised, ranking 5th globally in the 2017 ICT Development Index, with 91% of households having access to the internet in 2016. Mobile phone use is widespread – in 2016 there were 122 subscriptions per 100 people in urban areas.110
Grid electricity in London is supplied by UK Power Networks – which covers roughly 8 million customers – while the National Grid is the system operator for electricity to which distribution networks connect. UK Power Networks has begun to procure flexibility, with the aim of using locally supplied demand response – including battery storage – to address issues of congestion at substation level. This demonstrates an evolution in the approach to managing electricity problems solely at the national system operator level to a more decentralised model.
London aims to generate 15% of its power from clean, local sources by 2030 and be a net-zero emission city by 2050. Both of these targets are being delivered through the Energy for Londoners Programme, which includes acceleration support for decentralised energy – with a focus on heat networks and community energy – the retrofitting of homes and publicly-owned buildings, and supporting Londoners in fuel poverty. It has recently set up its own retail energy supply company, London Power, to bring lowest cost renewable energy to Londoners with the aim of designing the right tariffs to support Energy for Londoners’ goals.
Although London’s main route to transition in the short-term (to 2030) will be, in part, via meeting distributed energy targets and more renewables in the grid, decarbonisation is not just a question of the share of renewables in the generation mix. Where the penetration of renewables is high, as it is in the UK, digital technologies will be required to operate the system efficiently. This will require the city to rapidly scale-up building efficiency (for example, “smart retrofits”)
URBANTRANSITIONS.GLOBAL | 29
and appropriate siting of chargers for the ever-increasing growth in the number of electric vehicles, in order to ensure the city can be flexible enough to handle the higher levels of VRE. Although the city is enabled for digitalisation, it needs capabilities for linking digital strategy to the planning and operation of low-carbon assets, including electric vehicles, in order to ensure decarbonisation continues.
The 2018 edition of the National Grid’s annual future energy scenarios document presented two scenarios that would meet 2050 climate targets. Both are reliant on increasing capacity of renewables to reflect the fact they have lower load factors than fossil fuel generators. Both scenarios showed renewables providing over 70% of electricity generation in 2050. However, these national plans rely heavily on extensive use of smart charging, alongside actions to manage peak demand (as well as a switch to hydrogen or other low-carbon heating).
New Delhi
New Delhi’s governance is unique in India. The city has an elected legislature as well as a state chief minister and it also has national territory status. New Delhi has a population of about 26.4 million (2018), which is expected to grow by around 10 million by 2030.112 The city’s per-capita electricity consumption is nearly double the average for India, at 2,171 kWh.113
India ranks 134th on the 2017 ICT Development Index, with 22% of households having internet access. However, when it comes to mobile phone access, the picture is much more democratic: there are 87 mobile phone subscriptions per 100 inhabitants and it is predicted that 60% of the population will be smartphone users by 2022. However, New Delhi is further along in digitalisation efforts than the national average and digital solutions are already playing a part in New Delhi’s decarbonisation story. For instance, New Delhi Municipal Council was the first municipal council in India to implement a 100% smart metering solution in its area, replacing 50,000 conventional meters with smart meters.114
National and state level entities are the main players in the Indian energy market. Local distribution network operator Tata Power Delhi has made significant efforts to reduce losses from 53% to 9% over the past 15 years, winning awards for its efficiency and innovation projects.115 But losses are not the only challenge: peak electricity demand has grown by over 200% since 2002, increasing faster than the population.116 A few hours of summer peak loads can increase costs significantly if capacity is overbuilt for those periods, so a 25 MW demand-response pilot is being developed in partnership with the US.117 Nationally, demand-side response is recognised as critical to meeting India’s goals for 175 GW of renewable capacity.118
Decarbonisation in New Delhi will be dependent on national programmes to replace coal imports with renewables, but being able to provide reliable, affordable power is critical. The national solar rooftop programme has had early success in New Delhi, where the state of Delhi offers additional generation-based incentives for domestic rooftop solar, with a target of 2 GW by 2025.119
Shenzhen is in China’s Guangdong province, which has a population of 12 million and expected to grow to almost 15 million by 2030. In contrast with the national picture in China – where energy generation is largely coal-based – Guangdong province has a more varied supply, with 2014 figures showing that generation capacity is based chiefly on thermal power from coal (48%) and hydropower (40%), with smaller amounts of energy coming from nuclear (2.6%), wind (2.8%) and solar (0.4%).120 China Southern Power Grid is responsible for investment, construction, transmission and distribution across China’s five southern
provinces, which includes Guangdong. Consumption in the grid is expected to increase from 932 TWh in 2014 to between 1,098 and 1,217 TWh in 2025, with peak demand also expected to increase. Peak demand for the grid in 2014 was 136 GW and is forecast to grow to 193 GW by 2025.121
In the short-term (to 2030), the main route to decarbonisation for Shenzhen will be through the inclusion of more renewables on the grid – investing more in large-scale solar and wind power – and via the promotion of distributed renewables – promoting solar rooftop generation. In 2013, two planning departments in Shenzhen agreed to stop new coal-fired power stations and currently there is one remaining coal-fired power plant.
The city has an industrial strategy to lead the country on sustainable development, and the focus on electrification of buses and taxis provides a good illustration of the city’s alignment between environment, economic growth and energy
decarbonisation strategies. Shenzhen became the world’s first city to replace its entire fleet of 16,000 diesel buses with electric vehicles, which included providing 40,000 charging stations, cutting CO2 emissions by an estimated 48%. The 22,000 taxis in the city were also required to switch to electric by the end of 2018. More than 30 Chinese cities have now made plans to achieve 100% electrified public transport by 2020.122
Guangdong is at the forefront of digitalisation in China, and Shenzhen’s level of development is more comparable to that of Hong Kong, which ranked 6th on the 2017 ICT Development Index.123 82% of households have access to the internet, 87% of individuals are internet users and mobile phone use is widespread, with 234 subscriptions per 100 people.124 While China is a market leader in smart meters, Shenzhen is excelling at an international level when it comes to its smart grid. The city’s local network and transmission operator investments have resulted in 93% smart meter coverage, over 97% utilisation of wind power, and sophisticated monitoring and maintenance across the network.125
In the short-term the main route to
decarbonisation for Shenzhen will be
through the inclusion of more renewables on the grid and via
the promotion of distributed renewables.
URBANTRANSITIONS.GLOBAL | 31
Key considerations for policy-makers
As the case studies have shown, both national and city governments have important roles to play in decarbonising urban energy systems, harnessing digitalisation and decentralisation as appropriate.
Certain elements will need to be carried out at national government level, such as establishing policy frameworks and incentive structures, providing or facilitating access to finance, building capacity, establishing governance structures, and ensuring policies (and their implementation) are coherent. Meanwhile, other aspects of energy transitions would be best managed by local governments, depending on the extent of devolution in the energy sector – such as setting a vision and plan, directly purchasing and controlling renewable energy assets, establishing norms and regulations, providing and facilitating finance, and undertaking advocacy and knowledge-sharing.126 Yet often the role of city governments in energy transitions is not fully recognised or understood.
Recognising the variations in the level of control of national, state and local governments (not to mention utilities) in different countries, this section highlights key considerations for energy decision-makers at a national level who are thinking about urban opportunities. It aims to shape global conversations on policy-making for energy transitions and guide decision-makers as they develop the most appropriate policies for their own contexts.
THE VALUE SHIFT
The scale of the transitions required to facilitate the three Ds means that there will inevitably be a tremendous economic shift as new participants are integrated. The total value of the electricity market is likely to increase as the electrification of transport and heating drives up demand, even in countries where demand has steadily been falling over decades. The new services stimulated by distributed electricity assets, demand aggregation and non-energy services will add to the economic importance of urban electricity markets. To understand the potential returns at stake consider London, which has a total electricity market worth over US$9 billion a year.127 If 20% of the city’s electricity is generated in the future by decentralised renewable systems, the potential shift in value to new market actors – be they individual households, companies or the state – would be US$1.8 billion. This is not infeasible: in Kitakyushu, 23% of total energy is already generated from decentralised sources.
On the one hand, this potential value shift could be seen as a threat, especially to the few entities that control large generation assets. But the market is increasingly comprised of a range of technologies and services that are diversified right to the end consumer.128 The value shift may result in stranded assets, such as large coal power plants, which are not economically viable in many countries without
subsidies. Distributed renewables and batteries could also allow the wealthiest consumers to abandon the grid, so that utilities have to share their fixed costs across fewer consumers, disproportionately impacting those who cannot afford to source their own power or technologies.
On the other hand, national governments may find that their options for managing electricity systems increase, providing benefits that were previously not understood, available or technically possible. One option may be to offer highly differentiated services that can be tailored to specific geographic locations or consumer groups. For example, rather than investing in costly infrastructure to extend the grid to low-density peri-urban areas, solar home systems may offer a lower-cost alternative to providing universal energy access. Another example of a beneficial outcome might be that a city with distributed local energy generation and some redundancy in the system may be more resilient in the face of extreme weather.129 Another possible
benefit of transition could be that modular renewable energy systems can reduce upfront capital costs, and lower transmission and distribution losses can reduce operating costs. For instance, a study of sub-Saharan Africa shows that if planned solar generation capacity to 2023 is sited where it can effectively meet demand – or provide system support to congested grids – a projected US$180 billion imbalance cost could be saved and the projects could more successfully meet energy access goals.
The value shift from national to local is still being explored by utilities, and new entrants to the energy sector are constantly emerging. Cities are at the forefront of this conversation, as the
places where most electricity is consumed, and huge opportunities are emerging in the energy markets. Proactive and coordinated governance will be needed to share the benefits equitably with citizens.
EMERGING BUSINESS AND REGULATORY MODELS
The value shift provoked by energy transitions will create opportunities for new business and regulatory models (see Box 3). The agglomeration effect of large cities, with potential for significant impact from electricity market experimentation and synergies with digitalisation in other sectors (“smart city” innovation), makes cities suitable places to try out innovative market arrangements.131 The companies developing new solutions will be both challenging and influencing market design. Trial commercial deployments can inform industry and government approaches to fundamental issues, such as length of settlement periods (and for which customers), retail tariff options, network code changes, the extent to which companies such as independent power producers are allowed to operate in the system, and data privacy questions.
Proactive and coordinated
governance will be needed to share the
benefits equitably with citizens.
URBANTRANSITIONS.GLOBAL | 33
Box 3. New models challenging current electricity market structures
In the development and deployment of renewable power, divergent models – such as power purchase agreements directly between cities and independent power producers or solar leasing for rooftops – are becoming common in some markets. Due in part to digitalisation and decentralisation trends, new capabilities are creating new business models that bridge electricity supply and demand.
Many of these emerging models involve providing energy as a service, rather than as a sale of a commodity (kWh), for instance selling the attribute of local or green electricity. Mobility-as-a-service similarly allows users to easily access transportation options through apps or ‘pay as you go’ solutions to meet their specific needs, and can enable rapid electrification of vehicle fleets, as noted in Shenzhen. With the increase in data from energy and transport systems follows a fast-growing analytics sub-sector focused on how utilities, energy consumers and businesses can make better informed financial or decarbonisation decisions. Finally, aggregators that have the ability to stack revenue streams from national or local systems in a simple service model to end consumers are becoming increasingly important players in managing demand-side flexibility.
It is worth noting three key points:
• These models are not static;
• Value chains behind the models are rapidly emerging and shifting, with standards yet to be set; and
• Revenues are highly market dependent.
Experimentation and demonstration at the city level can help both firms and energy market regulators shape the market structure and plan infrastructure investment. London, for example, has benefited from the regulatory sandbox set up by the Office of Gas and Electricity Markets, the UK’s national electricity regulatory body, which allows companies to operate trials with some derogation in place for limited periods. It has found that some new models will require regulatory change, such as peer-to-peer energy trading, but some are simply untested and will require a learning curve on the part of innovators and regulators.133
Opportunities for bridging the demonstration phase to deployment at scale will best be provided when national and city governments work effectively in concert. While national governments typically allocate public research and development budgets and set industrial strategies for a country as a whole, the role in bridging research and development to commercialisation is well-suited to cities’ strengths. Cities are home to innovative industries, where businesses employ staff and compete for talent. Cities may have the best digital technologies and access to finance
that may not be available universally in rural areas. And finally, cities often own and operate buildings or mobility infrastructure that can be utilised for demonstration programmes. However, the replication and scaling-up of successful models to other cities requires national government policy and support for investment.
BUILDING IN FLEXIBILITY
As the three D transition progresses and the distribution and storage of energy shifts away from traditional power plants to anywhere with electricity generation or storage, from large-scale wind farms to home solar PV, system flexibility will become as valuable as generation capacity, replacing capacity margins as the principal tool for flexibility. National governments will need to consider how decarbonisation, decentralisation and digitalisation can offer new ways to manage electricity systems flexibly, shifting from systems reliant on capacity margins to systems reliant on frequent, rapid adjustments to balance demand and supply.
New sources of flexibility, such as demand response,134 offer a transition pathway that is well-suited to city-scale power. Electric vehicles and buildings are concentrated in cities and will become more dynamic participants in energy balancing. In the UK, demand-side flexibility in buildings could allow the system to operate with 10% less fossil fuel capacity, 42% less battery storage and 5% lower system costs by 2040 than a base case scenario. In one scenario that assumes 80% of electric vehicles are smart charging, UK emissions are shown to be down 96% by 2040, and the electricity system requires no additional fossil fuel plants. However, the importance of the national context should be noted: this scenario might not be the best option in all countries. Germany would see less of an impact because of the high levels of interconnection that are already in place.135
Without a structural shift in the policy and regulatory framework governing the management of the electricity system, the expansion of variable renewables and the electrification of transport and heat will increase peak demands and volatility. This will be more costly to manage with traditional means than with new flexibility solutions. Adelaide, for example, benefits from a large-scale storage solution that can dispatch during the peaks of air conditioning that cause price spikes as solar power ebbs during the day. Inevitably, each city will need to have a strategy for how they manage the variability that comes with a high penetration of renewables for their particular electricity system conditions.
Building in demand-side flexibility is key to lowering the costs of energy transition. However, the question of who will pay for this flexibility has not yet been fully addressed in any country. Consumers will pay more for an energy system that decarbonises more slowly than is technically feasible if energy market structures and governance favour solutions that do not fully utilise electric vehicle smart charging or demand-side response. Early investments today in flexibility capacity and management will reap long-term savings, although each government will need to consider how to ensure that its citizens benefit from the cheapest decarbonisation options appropriate to their context.
URBANTRANSITIONS.GLOBAL | 35
THINKING ACROSS URBAN SYSTEMS
Ensuring a reliable, affordable, clean energy supply is no longer just the role of energy ministries and utilities. Buildings, land use and transport are now also sectors that must contribute through:
1. Maximising efficiency;
2. Decarbonising power; and
3. Increasing electrification of heating and transport.136
In terms of digitalisation and decentralisation, these three elements are more interdependent than at first they might seem. In a state like California, which benefits from sunny weather, efficiency is helpful for decarbonisation if timed to coincide with peak times of fossil fuel generation. However, timed during peak solar outputs, it could exacerbate the challenges for the system operator in balancing the system.137 The Public Utilities Commission in California has found that behind-the-meter batteries can increase emissions if they only optimise cost savings for the site, because retail tariffs have not been designed with flexibility capabilities in mind.138 It cannot, therefore, be assumed that simply deploying solar, storage and efficiency programmes will ultimately decarbonise, unless the right planning and operating signals are put in place to achieve those outcomes. On the other hand, with good coordination, the benefits of one system can support another.
In the planning stages, cross-sectoral synergies may be missed because they require coordination across different scales and disconnected responsible parties. For example, local governments might be responsible for spatial planning for electric vehicle charging, while national housing ministries might be responsible for building codes that determine whether electric charging infrastructure, solar panels and parking spaces are provided for residents. National or state utilities might be responsible for providing adequate capacity from a national perspective, but city governments might invest heavily in distributed energy generation that is not taken into account, creating challenges for local and national energy operators in managing these distributed renewable energy resources.
It is more important than ever for national governments to consider the broader energy system context in which power supply technologies are being built so that recovering initial costs and managing the system in real time is as cost-effective as possible. Appropriate, rapidly evolving data sharing and utilisation frameworks will be needed. As the electrification of transport and heat becomes more affordable, these will provide opportunities for more consumer-focused system analyses to improve the performance of energy systems.
OPPORTUNITIES FOR NATIONAL AND CITY GOVERNMENT COLLABORATION
Although decentralisation is under way, ensuring that the process delivers decarbonisation is not a given. Decentralised assets, particularly as heat and transport are further decarbonised, will not provide the flexibility value to the national system unless the incentives are set up to ensure that they can. This in
turn could have knock-on effects for balancing the system with higher carbon back-up generation, or transmission and distribution upgrades that could be avoided. For cities that have set net-zero targets, if utilities do not provide alternatives to high-carbon power, cities will seek out alternate ways to get it. For utility companies, system utilisation is the only way to recover costs; their role in reducing risk for consumers will be compromised if they cannot ensure this. Although private sector participation in providing electricity is already happening in many markets, coordination by national and city governments will be critical to ensure that citizens are not disadvantaged by the transitions.
If national and city governments work together, they can ensure there is more focus on decarbonisation at all stages of the deployment of technologies, from financing
through to operations. Without collaboration, there are a number of real risks in the transition – some of which are already being felt. Luckily, there are also benefits of collaboration in the development and operation of electricity systems between national and city governments, as explored below.
• Performance outcomes, such as lowering costs and carbon, will be enabled by digital technologies that sense, monitor and manage the electricity system from the planning stage through to system operation. The World Bank is already using a software platform to validate mini-grid connections to enable performance-based financing in Nigeria, where connections cannot realistically be validated in person. Cities can do this at scale, through timely location-based tracking of decentralised energy assets and buildings. Local electricity network operators can achieve better asset management; geographic information system (GIS) mapping helps identify sector-coupling opportunities and allows realistic planning, such as where to site electric vehicle charging to avoid grid congestion;140 and national and city governments can ensure that daily operations are meeting their climate goals (Hamburg already provides real-time emissions data which would enable such benefits).141
If national and city governments work
together, they can ensure there is more focus on decarbonisation at all
stages of the deployment of technologies, from financing through to
operations.
URBANTRANSITIONS.GLOBAL | 37
• Continuous innovation is more possible than ever given the data that can be shared and utilised to advance programmes. Cities need national frameworks to scale up and transfer successful initiatives. Information sharing is a first step to achieving this replication. But real-time learning opportunities are also possible. In Shenzhen, taxi drivers were using their batteries in inefficient ways, which reduced vehicle mileage. However, a way for drivers to discuss the issues was designed in order to investigate and improve the situation, and continue to rollout the taxis until full fleet electrification was achieved.142 Indeed, real-time access to data for innovation is a key priority for the energy industry in advanced markets such as the US and Australia.143 It should pave the way for governments and individual citizens in cities to become more active electricity market participants.
• Co-benefits will be accrued beyond energy system value, such as avoiding costly road works (if networks do not need to be reinforced), avoiding greenhouse gas emissions and making businesses resilient to outages. Citizens may also care about capturing local economic value, air quality improvements, avoiding price volatility and other concerns that their politicians at national and city levels will be keen to represent.
City planners and those living in cities should harness and embrace the three Ds as a potential way to increase liveability, health and prosperity. Decentralised electricity systems can be utilised to not only provide affordable, clean options for energy services, but increasingly multi-modal methods of transportation, better air quality, and positive knock-on effects for food, water and waste systems. National governments should provide overall policy frameworks and collaborate with city governments to facilitate this.
The consumption of electricity in cities is of vital national interest, enabling city dwellers to contribute 70% of the world’s GDP and live in dynamic urban societies. The centrality of electricity to urban economies will increase as heating and transport are electrified to advance the decarbonisation of energy systems. The populations and built infrastructure density in cities provides potential for the rapid spread of digital connectivity, as well as a concentration of distributed energy assets. Cities are, therefore, where synergies between the three Ds can best be exploited to accelerate the transition to renewable electricity systems. Thus national governments must recognise the potential role of their cities in guiding and responding to the three Ds to shape their country’s energy transition. Our subsequent paper explores how national governments can make the most of the opportunities cities create for accelerating energy transitions.
The frameworks set out in this paper should facilitate the national-urban discussion. The three D transition in each city will have a different starting point, depending on current exposure to the megatrends and the electricity market structure. How city governments can decarbonise, decentralise and digitalise their electricity systems will vary significantly. For example, the differences between those operating their own utilities and those that are wholly dependent on national governments, regulators and utilities are huge. The optimal electricity transition pathway for any city is thus highly context-dependent and relies on multiple factors, including the availability of financing, the pace of the transition needed, institutional norms and administrative capacity.144
Those managing electricity transitions and future electricity systems will need to consider the role of city governments and the nature of urban citizen participation in the electricity system, as prosumers and creators of valuable data for system management, not only as consumers. Thus appropriate, coherent policy and regulatory frameworks at national and city level will be needed to effectively facilitate the three Ds in cities, help meet their targets and prevent global warming.
6.
URBANTRANSITIONS.GLOBAL | 39
Population(2018)’000 1
RE share of electricity generated (national)(2015) 2
Per capita electricity consumption(national)(kWh)(2014) 3
New Delhi 28,514 15.3% 806 3.03 31,825(2017/18) 12
Shenzhen 11,908 23.9% 3,927 5.60 595,900(2017) 13
Note: New figures from the UK Department for Business, Energy & Industrial Strategy show that the renewable share of electricity generation in the UK was 36.9% in 2019. For the most timely updates see: https://www.gov.uk/government/statistics/energy-trends-section-6-renewables
Sources: 1 United Nations Department for Economic and Social Affairs, 2018. The World’s Cities in 2018: Data Booklet. UN, New York. Available at: https://www.un-ilibrary.org/human-settlements-and-urban-issues/the-world-s-cities-in-2018_c93f4dc6-en.
ANNEX 1: KEY STATISTICS FOR 10 CITIES
There is a lack of independently verified city-level data with consistently defined baselines, geographic boundaries, or definitions of distributed energy generation.
2 World Bank Data, 2019. Renewable electricity output (% of total electricity output). Available at: https://data.worldbank.org/indicator/EG.ELC.RNEW.ZS.
3 World Bank Data, 2019. Electric power consumption (kWh per capita). Available at: https://data.worldbank.org/indicator/EG.USE.ELEC.KH.PC.
4 ITU, 2017a. Measuring the Information Society Report: Volume 1. International Telecommunication Union, Geneva. Available at: https://www.itu.int/en/publications/ITU-D/pages/publications.aspx?parent=D-IND-ICTOI-2018&media=paper.
5 South Australia data: Department of the Environment and Energy, 2019. Australian Energy Statistics, Table L. Available at: https://www.energy.gov.au/government-priorities/energy-data/australian-energy-statistics.
6 Austin Energy, 2019. Performance Report. City of Austin, Austin. Available at: https://data.austintexas.gov/stories/s/82cz-8hvk.
7 Department of Environmental Affairs and Development Planning, 2018. Energy Consumption and CO2 Emission Database for the Western Cape. Western Cape Government, Cape Town. Available at: https://www.westerncape.gov.za/energy-security-game-changer/news/western-cape-energy-consumption-co2-emission-database.
8 Ministry of Energy and Minerals, 2016. Power System Master Plan: 2016 Update. Government of the United Republic of Tanzania, Dar es Salaam. Available at: http://www.tanesco.co.tz/index.php/investments/investment-report/22-power-system-master-plan-2012-update.
9 City of Hamburg, 2019. Energieportal Hamburg: Hamburg at a glance. Available at: http://www.energieportal-hamburg.de/distribution/energieportal/Index.action?locale=en.
10 Kampala Capital City Authority, 2015. Kampala Climate Change Action: Energy and Climate profile. Kampala Capital City Authority, Kampala. Available at: https://www.kcca.go.ug/?jsp=climate_change_strategy.
11 Department for Business, Energy & Industrial Strategy, 2019. Sub-National Electricity and Gas Consumption Summary Report 2018. United Kingdom Government, London. Available at: https://www.gov.uk/government/statistics/sub-national-electricity-and-gas-consumption-summary-report-2018.
12 Central Electricity Authority, 2018. Load Generation Balance Report 2018–19. Government of the Republic of India, New Delhi. Available at: http://cea.nic.in/annualreports.html.
13 Guangdong data: National Bureau of Statistics of China, 2019. China Statistical Yearbook 2018. Table 9–14: Electricity consumption by region. Government of the People’s Republic of China, Beijing. Available at: http://www.stats.gov.cn/tjsj/ndsj/2018/indexeh.htm.
This work is licensed under the Creative Commons Attribution 4.0 International License. To view a copy of the license, visit http://creativecommons.org/licenses/by/4.0/
ABOUT THE COALITION FOR URBAN TRANSITIONSThe Coalition for Urban Transitions is the foremost initiative supporting national governments to secure economic prosperity and reduce the risk of climate change by transforming cities. The Coalition equips national governments with the evidence and policy options they need to foster more compact, connected, clean and resilient urban development. The Coalition’s country programmes in China, Ghana, Mexico and Tanzania provide models for other countries on how to effectively develop national urban policies and infrastructure investment strategies.
A special initiative of the New Climate Economy (NCE), the Coalition for Urban Transitions is jointly managed by C40 Cities Climate Leadership Group and the World Resources Institute Ross Center for Sustainable Cities. A partnership of 35+ diverse stakeholders across five continents drives the Coalition, including leading urban-focused institutions and their practice leaders from major think-tanks, research institutions, city networks, international organisations, major investors, infrastructure providers, and strategic advisory companies.