1 How to make a run-proof bank Achieving maturity transformation without fractional reserves Abstract: Since the advent of fractional reserve banking (FRB), banking systems have been subject to runs. In extreme circumstances these runs have led to prolonged periods of economic dislocation such as the Great Depression, which have taken years – sometimes decades – to resolve. Yet despite these pitfalls, FRB is still considered to be the only way to organize the banking system. In this paper I explore the perceived advantages of FRB and suggest ways that these can be achieved without the pitfalls. Andrew D. Smith Department of Accounting Finance and Economics Griffith University Nathan QLD Australia [email protected]
Transcript
1
How to make a run-proof bank
Achieving maturity transformation without fractional reserves
Abstract: Since the advent of fractional reserve banking (FRB), banking systems have been subject
to runs. In extreme circumstances these runs have led to prolonged periods of economic dislocation
such as the Great Depression, which have taken years – sometimes decades – to resolve. Yet
despite these pitfalls, FRB is still considered to be the only way to organize the banking system. In
this paper I explore the perceived advantages of FRB and suggest ways that these can be achieved
In “narrow banking”, banks can participate in the payment system, that is the transfer of deposits
(entirely backed by cash) from bank to bank, but do not participate in making loans. Rather, the
credit-creation function (ie the making of loans) is relegated to non-bank entities, typically referred
to as investment trusts, which raise funds for lending by issuing securities. See Figures 5a and 5b.
Specific criticisms of narrow banking in the literature are relatively rare. Wallace (1996) reveals
narrow banking to be a form of autarky, but his broader argument against it is weakened by his
model not allowing any form of financial market other than a fractional reserve (FR) bank. Bossone
(2001) uses simple regressions to examine the relationship between measures of bank narrowness
and the price and availability of credit. He finds evidence that narrowness increases the price and
decreases the availability of credit. A nominal price increase would be expected, but may not exist
once the inflationary effects of money creation are considered.
Selgin and White (1996) argue against the implication that FRB is inherently fraudulent because it
implicitly offers a promise it cannot keep – that all depositors can withdraw all their savings at once
(see Rothbard (1995)). Selgin and White contend that the banknote is fundamentally different to a
gold deposit receipt, not least because the former does not involve warehousing fees; moreover, FR
banks offer depositors interest. Hence they conclude that depositors would not be deceived, but
rather be aware from the lack of warehousing fees and the offer of interest, that their funds were
being lent out and not simply being kept in the vault. This argument does not however address the
assertion that FRB is based on a false premise (as distinct from a false pretence) which depositors
from time to time attempt to exploit, with potentially significant perverse economic consequences.
6
Kashyap Rajan and Stein (2002) suggest that the co-existence of lending (or more specifically,
lending commitments) and deposit-taking allows for FR banks to exploit synergies between these
two activities, relating to the demand for cash, which narrow banking would destroy. This argument
is built on banks providing short term (eg for working capital) lending commitments to potential
borrowers, since both potential borrowers and depositors may require cash. The bank is a cash-
broker, collecting it from those who have no present need for it, and lending it to those who are
temporarily in need of it. However, there is no sense of why this transaction need occur without the
timing factor being explicitly recognized in the process: if the borrower needs the funds for 90 days,
why can’t the bank raises these funds from those who are prepared to lend it for 90 days?
However, although there are only a relatively small number of papers that explicitly criticize narrow
banking, nevertheless such criticism is implied in much of the literature on banking. This literature
starts from the (usually unacknowledged) premise that FRB is the natural state for banking to evolve
to, and aims to discover why this is, in spite of its inherent fragility. This literature follows several
important strands.
Diamond and Dybvig (1983) (hereafter “DD”) model FRB as a form of insurance against an
unexpected need for liquidity. In this model, the FR bank gives depositors the ability to achieve the
greater benefit of long-term investments without being locked into them. It operates as a special
form of insurer over three periods, where deposits are made at t=0, agents discover at t=1 if they
have a liquidity need and withdraw funds, and at t=2 returns from a long term (two period) project
are realized and paid out. However, the returns from the project are smoothed out over both
periods. Hence the early consumer, despite having the handicap of being unable to remain invested
in the project until maturity, nevertheless achieves some benefit from the project. But this insurer
has a weakness: the benefit is paid (by way of a higher return in period 1) before the premium is
due (by way of a lower return in period 2). Because of this feature, agents can size up the relative
cost of the premium against the benefit before the premium is paid. If some agents believe there
will be too few other agents who are prepared to stay in the scheme until t=2 and pay the premium,
they will themselves withdraw at t=1, even though they do not need to. If too many agents act this
way, the bank will be forced to liquidate the long term project, and will be unable to meet all its
commitments.
However, Jacklin (1984) showed that this model of FRB can operate only in the absence of financial
markets. When markets are present, depositors can game the bank: they can withdraw their
deposit at t=1 even though they don’t need to, pocket the benefit, and buy into the project directly
at parity. Then at t=2 they can claim the entire return from the long term project. Thus, where
financial markets exist, the DD bank’s capacity to improve welfare is constrained by the markets, and
is limited to the extent of welfare-enhancement achieved by the markets.
Moreover, the DD model is not greatly reflective the role of cash as the facilitator of trade. There is
no sense of the cyclical nature of cash, which will be exchanged by the early consumers for goods
and subsequently re-deposited. Even the money lent to the long term project will be recirculated
through the economy as the project is built. As Gorton and Winton (2002) comment, “there is no
notion of exchange in the model . . . no trade with other agents where ‘money’ buys goods. . .
Agents trade only with the bank.” (p.21). Further, the model is not reflective of how banks operate:
unlike in the DD model, banks do not collect deposits and lend them out for a long term project.
7
Rather, they create the money that is needed to fund the long term project, by creating deposit
liabilities which can be traded for goods or exchanged for cash (and then traded for goods). In this
context, the model does not provide an obvious motive for depositors to prefer cash over deposits,
or some other tradeable claim.
A second strand of the literature focuses on the agency control aspects of deposits in FRB. Calomiris
and Kahn (1991) posit that a demand deposit funding structure provides an incentive to the banker
to be disciplined. They state that “Without the ability to make early withdrawals, depositors would
have little incentive to monitor the bank.” (p.497). That may be true in the case of long-term
depositors, who are soley dependent on the bank and have no alternative but to wait for their
deposits to mature, but it is not true where there is a secondary market. For example, if the bank
were to be funded by listed bonds, in the event of undisciplined behaviour, a bondholder has the
capacity to sell, and hence has an incentive to monitor the bank.2 Pozdena (1991) denies that long-
term debt holders can act quickly enough to exert influence effectively, but he overlooks the
possibility of exchange-traded bonds: a sell-off of a bank’s bonds, where bonds are its only source of
funding, would be debilitating for it, as it could only raise new funds at a disadvantageous rate of
interest. Diamond and Rajan (2001) posit that a fragile funding structure provides a signal to
depositors that a relationship-banker will commit to a long-term project, since, were she to walk
from the project, depositors will run the bank and she will receive no rents. However, this
explanation abstracts from the possibility of the banker suspending conversion of deposits into cash
– an abstraction which is inconsistent with their broader argument, where everything is
renegotiable. Flannery (1994) argues that the bank’s short term liability structure enables debt to be
quickly repriced (without a loss to depositors) to reflect any change in the nature of the bank’s
portfolio. However, it is not clear that the benefits of this outweigh the costs of the fragility it
creates, and in any case is not the only way of mitigating against such a development. I return to
this later in the paper.
In summary, these strands of the literature appear to have trouble finding a satisfactory explanation
to justify their presumption that FRB is the “natural” state of banking.3 The “liquidity insurance”
motivation of DD could be rationalized if trading of financial claims was impossible – but the fact is,
it is possible. The “monitoring” motivation can be achieved by means other than demand deposits,
such as exchange-traded bank bonds.
A further strand explores banks’ role as creators of liquidity. Gorton and Pennacchi (1990) posit
banks as providers of a means of insuring small investors against better informed insiders. The
existence of a riskless asset, the bank deposit, enables uninformed investors to trade without the
possibility of being exploited by informed investors. However, this function could be readily provided
by an intermediary that does not make risky loans, but invests in riskless securities such as short-
term government debt. Holstrom and Tirole (1998) model a bank as a coalition of borrowers, any of
2 To be fair, the authors emphasize that their model aims to explain the historical importance of demandable
debt, and note that, in modern financial markets, trading of equities (and, by extension, bonds) could provide
a superior form of discipline.
3 Other strands of the literature focus on aspect of banks other than their fractional reserve characteristic. See
Appendix I for a summary.
8
whom may experience a sudden unexpected need for liquidity. Interestingly, in contrast to the DD
model of a bank, the Holstrom and Tirole bank has long-term liabilities and short-term assets, since
it is the borrowers who are needing the liquidity, rather than the depositors.
The fact that a system of “narrow banking” has not evolved comes down to two reasons: firstly, a
concern that the suggestion doesn’t really resolve the problem, as the investment trusts themselves
would begin to borrow short and lend long, so that their deposits would eventually be taken as near-
money, and there could be runs on these entities just as there are currently runs on banks, with
similar economic consequences. [Diamond and Dybvig (1986) state (p.57): “. . . new firms that
move in to fill the vacuum left by banks may inherit the problem of runs.”] Secondly, and more
practically, such a system could be easily and readily implemented, via money market mutual funds
with cheques for example, but the fact FRB continues to exist, despite its inherent fragility, suggests
there is something about it that outweighs the demand for a safer alternative.4 One of the key
benefits cited for FRB (and perhaps the reason why 100% reserve banking hasn’t proved to be
popular) is its ability to pay interest on current deposits funds. Under the alternative system,
deposits must be backed by cash or near-cash assets which, since they cannot be lent out other than
for very short periods, are unable to be charged interest. Hence the interest payable on current
deposits in the alternative system is zero.
But it is possible to arrange a bank that does enable investments to be retrievable at parity on
demand, and pay interest, without resorting to fractional reserves? I demonstrate how such a
system could be constructed below.
Section 3: Creating a run-proof bank with withdrawable deposits that earn interest
As previously mentioned, the salient feature about FRB – the feature that gives it both its strengths
and its weaknesses – is the maturity mismatch between the long term assets and the short term
liabilities. If a bank were to be created without this feature, it would need to match the maturity of
its assets and its liabilities. So long term loans would need to be funded by long term deposits, or
bonds. (This system of intermediation was suggested by Allais (1987), although he quarantined it to
non-bank investment trusts, with banks restricted to the payments function. I posit that no split is
necessary.) Usually such a bank is derided as being impractical, because there are far less people
who are prepared to deposit their money in the bank for say 3 years than there are those who would
deposit their money overnight: hence the interest rate on three year loans would be driven up
enormously, with significant economic costs.
But this assumes that such long term depositor funding can only be derived from a bilateral and non-
negotiable bank time deposit. If the bank rather derived its long term funding from the issue of
bonds, and the amount of bonds on issue was large enough to create a liquid market5, then our long
4 White (2003) cites the case, reported in Banker’s Magazine in 1858, of efforts to establish the “Bullion Bank
of New York”, whose deposits “are not to be used, any part of them, by the bank; but are to be retained
always in actual cash to the order of the several depositors; the deposits will consequently be always, to the
full amount, on hand in cash”. White can find no evidence of the bank actually opening its doors.
5 Total liabilities of Australia’s largest bank, Commonwealth Bank of Australia Limited (CBA) at 30
th June 2012
were A$677bn, about six times larger than the market capitalization of the largest listed Australian company.
9
term “depositor” (who, rather than depositing, would buy a small quantity of the bank’s bonds) is
not necessarily bound to hold onto his deposit until it matures, but could liquefy by selling it through
the bond market. Moreover, the depositor receives interest on the bond.
The benefit of this system is that the depositor has options regarding to whom he can sell his
deposit. The FRB deposit is essentially a bilateral put option – the depositor cannot sell his current
deposits at the bank to anyone other than the bank, as there is not a market for current deposits.
But this alternative system, which for convenience I will call the “bond-bank” system (since the
banks are largely funded by bonds), offers the depositor a secondary market for his deposit, and
thus alleviates the bank of the responsibility for accepting the deposit.
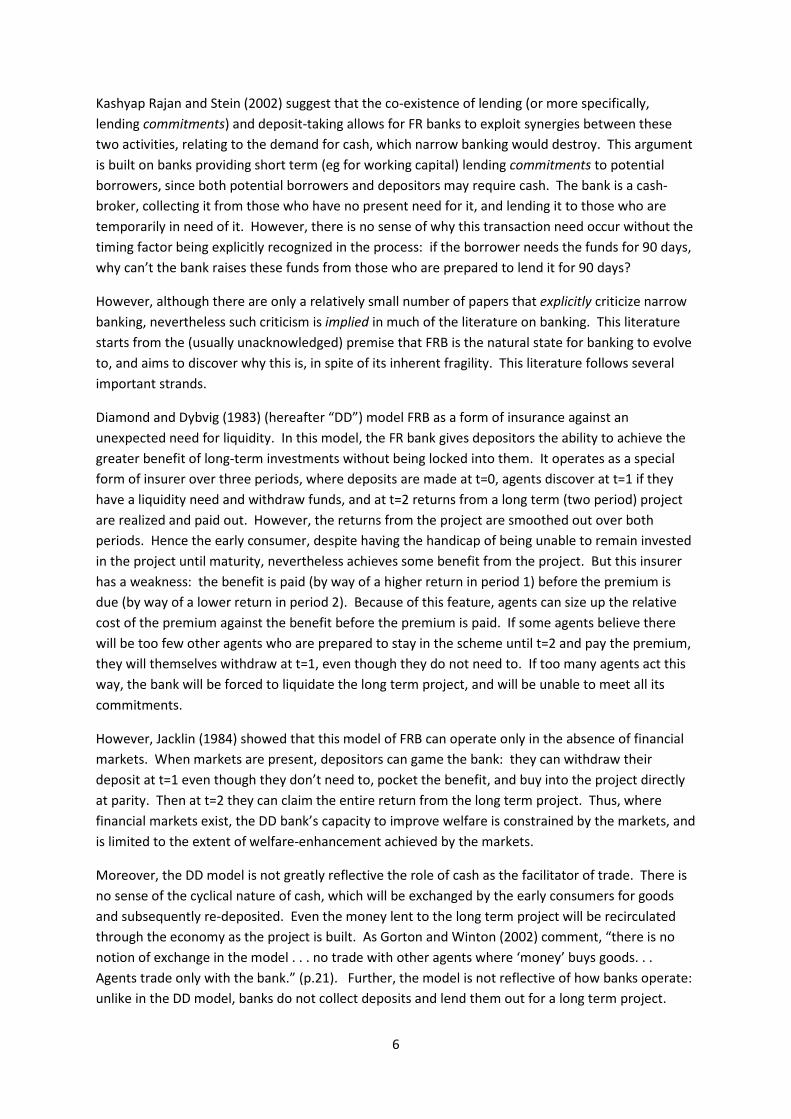
Figure 5 illustrates the differences between fractional reserve banking, narrow banking and the
bond-bank system. All banks are involved in the facilitation of payments, but the extent to which
the various forms of banks are involved in the facilitation of investment varies. FR banks facilitate
investment in two ways:
1. Credit transformation: the exchange of bespoke paper (eg a mortgage) for paper issued in
the bank’s name. The bank takes on the credit risk of the mortgagor defaulting.
2. Maturity transformation: The exchange of long term paper for immediately claimable
paper. The bank takes on the timing risk of being asked to redeem funds now which it has
on-lent for repayment in the future.
The dual nature of this process is not generally appreciated because banks do both things together –
they exchange a) bespoke and b) long term paper for a) paper issued in the bank’s name and b)
immediately claimable. A bond market facilitates investment by intermediating between borrowers
and savers, but FRB goes further by also creating the money to fund the loan – creating a short term
deposit which can be traded for goods or exchanged for cash.
The table below summarizes the faculties of the various forms of banks. All types of banks are
involved in the facilitation of payments. For Narrow banks, that’s as far as it goes: they play no role
in the investment process. Central banks create money but do not create credit: they take risk-free
long term government bonds and exchange these for its own circulating liabilities, which is legally
enforceable as cash in a fiat monetary system. The Bond-bank allocates credit to worthy borrowers,
but does so without the capacity to create its own money: it relies on others’ savings to provide the
funds. The FR Bank both allocates credit and creates its own money to fund this credit.
Narrow bank Central bank Bond Bank FR bank
Payments � � � �
Investment:
• Credit creation � � � �
• Money creation � � � �
The liabilities of Bank of Queensland, a small regional bank, were $38bn, around the size of Australia’s 10
th
largest company by market capitalization.
10
A bond-bank would issue bonds which are traded on the exchange. This implies a variability in the
price, which is something depositors are not used to, and which is also held up as one of the benefits
of FRB – a $1 deposit is always worth $1. 6 On this issue, there are several points worth mentioning:
• There is also value-uncertainty in the FRB system: while the nominal value of a FRB deposit is
held steady at $1, the interest rate that applies to it varies, so that the future value of a
current deposit including accumulated interest is also unknown.
• The price volatility can be minimized, essentially to zero, if both the borrower and the lender
are paid in variable interest rates
• As I will outline below, a bond bank can profitably sell bond-holders put options, thus
providing them a deposit-like predetermined exit price.
To explore the characteristics of bond-banking, I have modelled the behaviour of a hypothetical
bond-bank’s bond portfolio. To do this, I have assumed such a bank issued bonds of two different
maturities, 3 years and 5 years, every month from January 1970. I then calculated the value of each
bond over the course of its life, and derived histograms plotting the distribution of these values.
A key consideration in this process is modelling the prevailing yield curve, to determine the value of
the outstanding bonds each month. In a bond-bank system, the yield curve has a special feature: it
is always positive. This is because overnight deposits can only be backed by cash, which pays 0%
interest. Hence, in a bond-bank system, the yield curve always passes through the origin.
This feature gives one point on the yield curve. Another point can be derived from the Treasury
Constant Maturity Rate series published by the US Federal Reserve, which gives the interest rate
that was prevailing for bonds of various duration (eg 3 and 5 years). However, this information does
not say anything about the steepness of the yield curve that would be prevailing in a bond-bank
system. Accordingly I have modelled the bond values twice: once using a relatively steep
exponential yield curve, and again using a relatively gradual exponential yield curve.
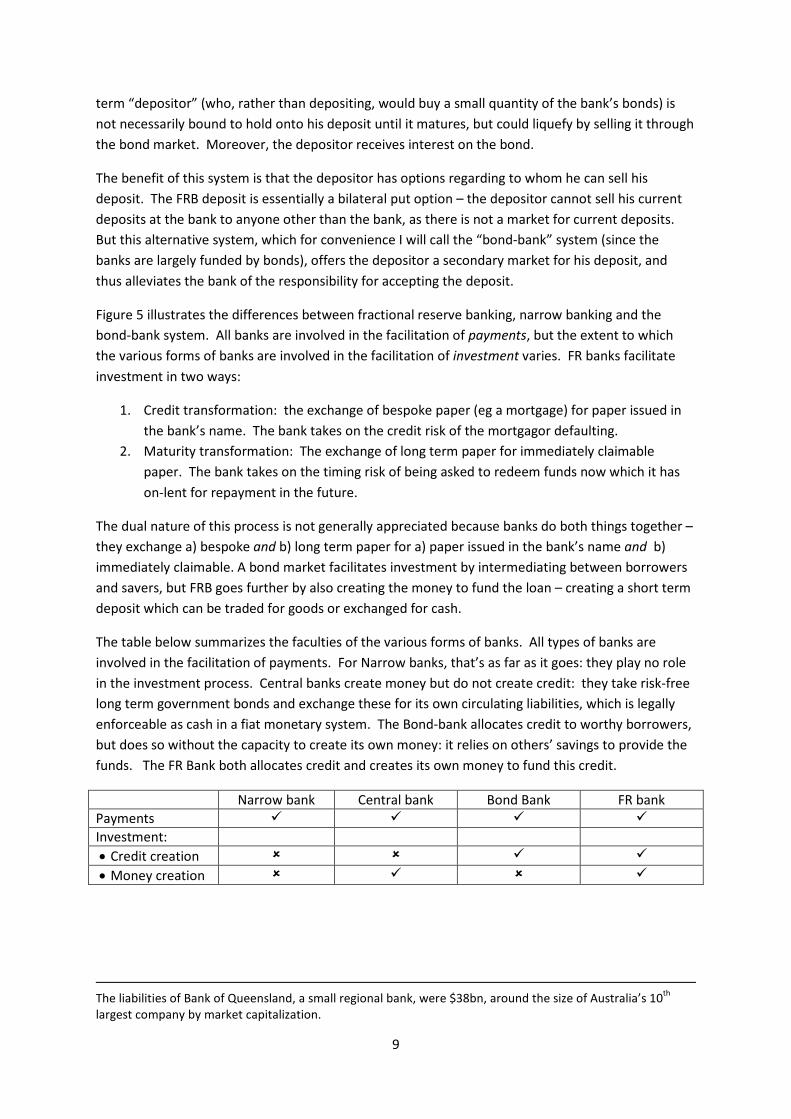
The graphs in Figure 6 summarize the results. Figure 6a gives US Treasury yield curve for 3 and 5
year constant maturity rates since 1970.
Figure 6b pertains to 3 year bonds assuming a gradual yield curve. The first graph gives three
examples of the yield curves used, with each point at the 3 year mark corresponding to 3 year
Treasury Constant Maturity rate prevailing at that time. Each curve asymptotes to a 10 year rate
that is 2.64% higher than the 3 year rate (2.64% being the greatest difference between the 3 years
rate and the 10 year rate observed over the 42 years since 1970). The second graph provides a
histogram of individual bond prices over the course of their life. In determining this, I have assumed
that a 3 year bond of $1 was issued at the beginning of each of the 518 months from January 1970 to
February 2013, with the coupon of each of these being set at the prevailing 3 year treasury constant
maturity rate. The value of each bond was then calculated for each month of its life, using a
discount rate as determined by the prevailing yield curve. The histograms summarize the
movements in bonds’ prices over that time. A skewness to the right is evident, meaning the bond is
typically valued at above $1. This is due to the positively sloping yield curve: the coupon payment of
6 Karaken (1986) recognised the trade-off between certainty of value and certainty of repayment: “It is
beyond me why having a contract for a known dollar sum, which, however, may not be honoured, is
necessarily better than having an account balance the future value of which is uncertain” (p.42)
11
the bonds increases in value as the appropriate discount rate falls towards zero. Bond prices of less
than $1 are associated with sharp spikes in the 3 year interest rate, since the coupon streams from
existing bonds are worth less when the prevailing discount rate rises sharply. Conversely, the higher
values are associated with prolonged falls in interest rates. Of the more than 18,000 observations,
the average is $1.0226, the mode is $1.0075 and 84.4% of values are above $1.
The last graph in this row shows the value of the bank’s total bond portfolio. It can be seen that the
bank’s bond portfolio is typically valued at above $1. The mean value is in fact $1.0226. The rare
occasions when the portfolio dips below $1 are associated with sharp spikes in the 3 year interest
rate. Conversely, higher values of the bond portfolio are associated with prolonged falls in interest
rates.
Figure 6c pertains to 3 year bonds assuming a steeper yield curve. This curve assumes that the 3
year Treasury Constant Maturity Rate is only 0.01% less than the 10-year rate. The histogram of
bond prices is also skewed to the right, but is generally worth less, as the prevailing discount rate is
generally higher. The mean value of this portfolio is still above $1, but only slightly at $1.0065. The
mode remains the same, but now 66.1% of values are above $1. The third graph, showing the bank’s
portfolio is also worth less, albeit still more likely to be over $1.
Hence, were a bond portfolio to be set up, there is a good likelihood that were a person wishing to
sell a bond, they would achieve more than $1 for it. In a bad case scenario, the bond is likely to be
only slightly less than $1.
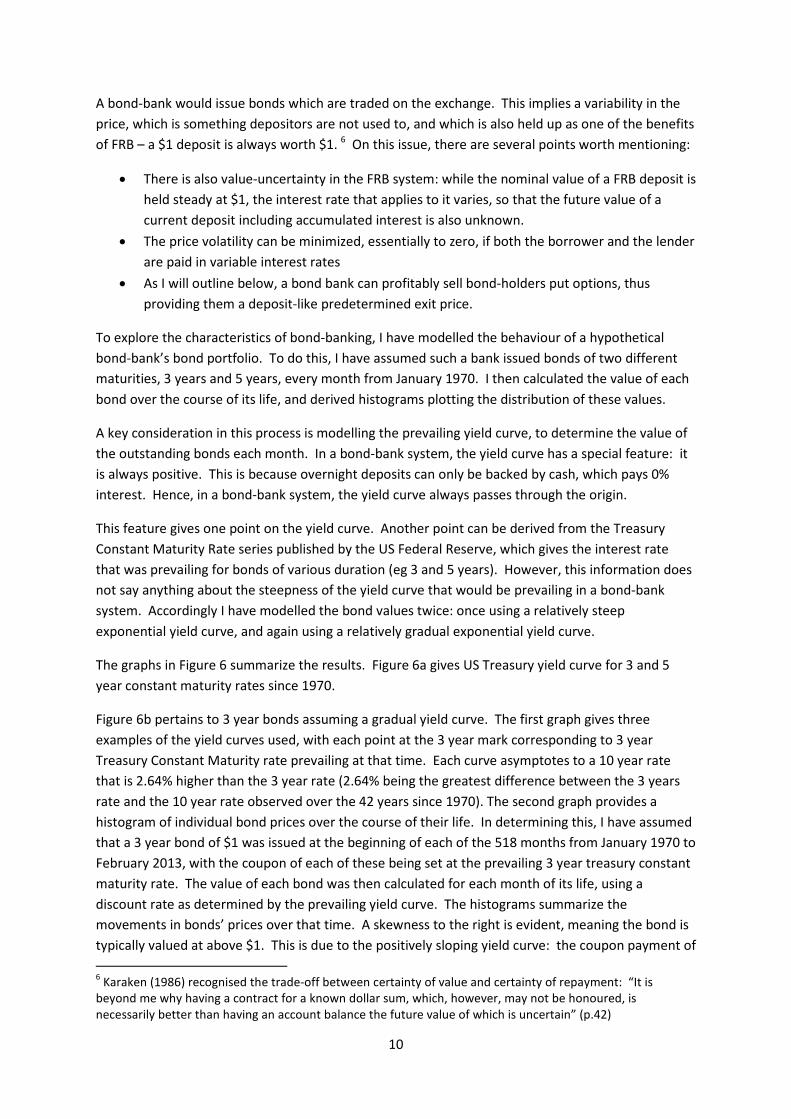
Figures 6d and 6e repeat the exercise for five year bonds. In this case the more gradual yield curves
asymptotes towards an interest rate that is 1.46% higher than the five year bond rate (1.46% being
the maximum difference between the 5 and 10 year rates since 1970, observed in July 2011).
The results remain broadly in line with those obtained for 3-year bonds, but have a) a slightly higher
mean, and b) a slightly greater variance.
The extreme bond values are associated with extreme volatility in interest rates. For example, the
highest value achieved (in both the 5 year steep and gradual yield curves) occurs for the bond issued
in June 1984 at a coupon of 13.27%, when 22 months later the 5 year constant maturity rate had
fallen to 7.05%. With the steep yield curve this bond rises to a value of $1.189, with the gradual
yield curve it rises to $1.227.
Likewise, the lowest value occurs (for both yield curves) with the bond issued in June 1980 at a
coupon of 9.21% when 15 months later the 5 year rate had risen to 15.93%. With the steep yield
curve this bond falls to $0.809, and with the gradual yield curve it falls to $0.838.
These graphs illustrate that a bond-bank, combined with a liquid market for the bank’s bonds, is a
viable alternative method of financing long term projects while still providing investors access to
their funds with little volatility in value.
Given these characteristics of bond pricing, it is eminently plausible for a bond-bank to be able to
offer its more risk-averse depositors a guaranteed buy-back price on their deposits (effectively a put
option) of $1. Hence we have achieved a withdrawable “deposit” that pays interest without
resorting to fractional reserves.
12
Alternatively, a bank could buy put options over its own bonds, thus making itself even more
invulnerable. Moreover, the price of the put options would give a market indicator of the bank’s
creditworthiness – the less creditworthy the bank, the more expensive the put options.
Various authors (eg Allais (1987) Fisher(1935)) have suggested that a banking system without the
fragility of fractional reserves would be less volatile. Reduced volatility in the interest rates would
also reduce the likelihood that bond values would be negative. In the extreme, assuming a never-
changing (and positively sloping) yield curve, bonds would never have a value less than one. (See
Figure 7.)
Section 4: Advantages of the bond-bank
A key advantage this form of banking has over the FR bank is that it allows management time to
resolve problem loans as they arise. When a FR bank gets into difficulties, it may have very little
time to resolve them before a run becomes a possibility. Whereas if a bond-bank were to get into
difficulties, there would be a sell-off of its bonds but no hasty withdrawal of funds; rather
management would have time to take remedial action, such as taking on more collateral or issuing
new equity. For example, if a problem arose in a loan maturing in two years’ time, since the loan is
funded by bank bonds that also mature in two years then management has this time to resolve the
problem. The improved manageability of problem loans would again lead to less volatility of bond
prices.
Flannery (1994) argues that demand deposit acts as a protection mechanism for depositors, since
they can be withdrawn at any time, thus giving bank managers a strong incentive to lend prudently.
Any increase in the riskiness of the bank’s loan portfolio can be quickly repriced. The bond-banking
system has a range of similar protection mechanisms in the event of a change in a bank’s credit
profile.
1. Assuming a bank makes loans of approximately equal tenor, existing bondholders in a bond-
bank are protected by the time-seniority of their claim. For example, assume a bank makes
only 5 years loans, and periodically issues 5 year bonds to fund these loans. If it decided to
raise the level of risk in its loan portfolio7, the new bonds would need to be costlier to reflect
the higher default risk, but the existing bonds are protected because they would be paid off
before any defaults from the riskier loans are realized.
2. A bank that gets into difficulties will see the market price of its bonds fall, and thus will not
be able to raise new funding without an increase in the interest rate it offers. It will thus be
at a significant competitive disadvantage. However, it will not face a run, and will have time
to repair its balance sheet, whereupon it will be able to again attract funds at competitive
interest rates: this provides stability to the bank’s risk profile, mitigating Flannery’s
underlying proposition.
3. Finally, in any case bondholders could be protected from capital losses if the bank sold them
put options over the bonds (which it could hedge by buying put options), or if interest rates
were variable.
7 Flannery assumes that bank creditors can estimate a bank’s riskiness at any point in time.
13
The bond bank also obviates the need for deposit insurance, and thus delegates back to the market,
rather than the regulator, oversight of the bank’s activities. The far reduced risks would result in
much lower capital requirements.
More broadly, the interest rate in a bond-banking system is self-adjusting to the prevailing economic
conditions: if investment opportunities abound, so that the demand for loanable funds increases,
then the interest rate will also increase, tending to reduce the value of bonds and cull consumer
demand. Conversely, if the investment outlook is pessimistic, the demand for loanable funds will
fall, thus lowering the interest rate, raising the value of bonds and stimulating consumer demand. In
this way, the bond banking system acts as a form of automatic stabilizer.
Readers would note that the short term interest rate is always zero. This begs the question of the
role of the central bank. Since short-term interest rates are predetermined as 0%, its role would be
limited to printing money, at a rate that allows for optimal economic growth.
In practice, it is likely that retail customers of the bank may never see much difference in their
banking operations, other than slight changes in their balance as interest rates vary (if they do not
buy put options). The bank would still settle intrabank transfers between its own customers
unilaterally, as happens now. For interbank transactions, it would act as an accumulator of
transactions, and manage the wholesale net interchange of funds between banks, as also happens
now. However, rather than that interchange occurring through a clearinghouse arrangement, it
would occur through the exchange. (See Figure 8.) And rather than transferring its own cash, it
would be merely acting as a wholesale broker on behalf of its customers, buying or selling bonds in
response to customer instructions, in much the same way as foreign exchange transactions are
managed today. Hence, unlike FRB, bond-bank customers are not dependent on one particular bank
to sell their financial assets, an alternative broker can be used if need be.
Section 5: Conclusion
The key advantages of fractional reserve banking are usually cited as: its ability to harness the quasi-
stable nature of short term deposits for long-term investments; depositors’ ability to liquefy their
deposit at parity at any time; and that it pays interest on even short term deposits. Its inherent
fragility is usually managed by deposit insurance and layers of regulatory oversight. This paper
shows that these positive features can be replicated by what I have termed a “bond-bank” system of
banking, which could operate without FRB’s inherent fragility. The essence of the difference is to
recognize that the FRB deposit is a put option in a bilateral relationship that is utterly dependent on
the issuing bank to honour, but an identical arrangement can be structured in a multilateral
exchange environment that breaks this dependency. The bond-banking system would: obviate the
need for deposit insurance with its attendant moral hazards; delegate the setting of interest rates
and monitoring of banks back to the market rather than government; and, by acting to stabilize both
the banking industry and the economy, significantly reduce the need for bank capital.
References
ALLAIS, M. 1987. The Credit Mechanism and its Implications. In: FEIWEL, G. R. (ed.) Arrow and the
Foundation of the Theory of Economic Policy. New York: New York University Press.
BOSSONE, B. 2001. Should Banks Be Narrowed? IMF Working Papers, 2001, 1-33.
14
BOYD, J. H., KWAK, S. & SMITH, B. 2005. The Real Output Losses Associated with Modern Banking
Crises. Journal of Money, Credit and Banking, 37, 977-999.
BOYD, J. H. & PRESCOTT, E. C. 1986. Financial intermediary coalitions. Journal of Economic Theory,
38, 211-232.
CALOMIRIS, C. W. & KAHN, C. M. 1991. The Role of Demandable Debt in Structuring Optimal Banking Arrangements. The American Economic Review, 81, 497-513.
CERRA, V. & SAXENA, S. C. 2008. Growth Dynamics: The Myth of Economic Recovery. The American
Economic Review, 98, 439-457.
DEMIRGÜÇ-KUNT, A. & DETRAGIACHE, E. 2002. Does deposit insurance increase banking system
stability? An empirical investigation. Journal of Monetary Economics, 49, 1373-1406.
DIAMOND, D. W. 1984. Financial Intermediation and Delegated Monitoring. The Review of Economic
Studies, 51, 393-414.
DIAMOND, D. W. & DYBVIG, P. H. 1983. Bank Runs, Deposit Insurance, and Liquidity. The Journal of
Political Economy, 91, 401-419.
DIAMOND, D. W. & DYBVIG, P. H. 1986. Banking theory, deposit insurance, and bank regulation. The
Journal of Business, 59, 55-68.
DIAMOND, D. W. & RAJAN, R. G. 2001. Banks and liquidity. The American Economic Review, 91, 422-
425.
FISHER, I. 1935. 100% money; designed to keep checking banks 100% liquid; to prevent inflation and
deflation; largely to cure or prevent depressions; and to wipe out much of the national debt,
New York,, Adelphi.
FLANNERY, M. J. 1994. Debt Maturity and the Deadweight Cost of Leverage: Optimally Financing
Banking Firms. The American Economic Review, 84, 320-331.
FRIEDMAN, M. 1960. A program for monetary stability, New York,, Fordham University Press.
GORTON, G. & PENNACCHI, G. 1990. Financial intermediaries and liquidity creation. The Journal of
Finance, 45, 49-71.
GORTON, G. & WINTON, A. 2002. Financial Intermediation. In: CONSTANTINIDES, G., HARRIS, M. &
STULZ, R. (eds.) Handbook of the Economics of Finance. Amsterdam: New Holland.
HOLMSTRÖM, B. & TIROLE, J. 1998. Private and Public Supply of Liquidity. Journal of Political
Economy, 1-40.
JACKLIN, C. 1984. Demand deposits, trading restrictions, and risk sharing, in ‘‘Contractual
Arrangements for Intertemporal Trade,’’. Minnesota Studies in Macroeconomics, 1, 26-47.
KARAKEN, J. 1986. Federal Bank Regulatory Policy: A Description and Some Observations. Journal of
Business, 59, 3-48.
KASHYAP, A. K., RAJAN, R. & STEIN, J. C. 2002. Banks as liquidity providers: An explanation for the coexistence of lending and deposit-taking. Journal of Finance, 57, 33-73.
LAEVEN, L. & VALENCIA, F. 2012. Systemic Banking Crises Database: An Update. IMF Working Paper
WP/12/163.
LELAND, H. E. & PYLE, D. H. 1977. Informational asymmetries, financial structure, and financial
intermediation. The Journal of Finance, 32, 371-387.
LITAN, R. 1987. What should banks do?, Washington, DC, Brookings Institution.
MERTON, R. C. & BODIE, Z. 1993. Deposit Insurance Reform: A Functional Approach. Carnegie-
Rochester Conference Series on Public Policy 38, 1-34.
PHILLIPS, R. J. 1995. The Chicago Plan & New Deal Banking Reform, New York, ME Sharpe Inc.
POZDENA, R. J. 1991. The false hope of the narrow bank. FRBSF Economic Letter. RICARDO, D. 1823. Plan for the Establishment of a National Bank.
ROTHBARD, M. 1995. Fractional reserve banking. The Freeman, 45, 624-627.
ROTHBARD, M. 2008. The Myster of Banking, 2nd ed., Auburn, AL, The Ludwig von Mises Institute.
SELGIN, G. & WHITE, L. H. 1996. In defense of fiduciary media—or, we are not devo (lutionists), we
are Misesians! The Review of Austrian Economics, 9, 83-107.
15
SPONG, K. 1993. Narrow Banks" An Alternative Approach to Banking Reform. The Jerome Levy
Economics Institue Working Paper No. 90.
SYKES, E. 1905. Banking and currency, London, Butterworth & Co.
TOBIN, J. 1987. The Case for Preserving Regulatory Distinctions. Challenge, 30, 167-183.
WALLACE, N. 1996. Narrow banking meets the Diamond-Dybvig model. Federal Reserve Bank of
Minneapolis Quarterly Review, 20, 3-13.
WHITE, L. H. 2003. Accounting for Fractional-Reserve Banknotes and Deposits-or, What's Twenty
Quid to the Bloody Midland Bank? Independent Review - Oakland, 7, 423-442.
16
Appendix
The literature on the nature of banks also includes at least two strands that do not entail fractional
reserves. The first of these postulates the existence of banks based on their greater ability,
compared to bond markets, to efficiently produce or elicit information. Key papers include Leland
and Pyle (1977) and Boyd and Prescott (1986). The essence of this strand is that it is expensive for
investors to collect information about investment opportunities, so there are economies of scale
advantages for individual investors to coalesce into a coalition, to avoid duplication of effort in
collecting information. In Boyd and Prescott, agents are entrepreneurs who may be endowed with
good or bad projects, but who do not reveal this information; the coalition induces both types of
agents to join it. The coalition pays out to all (albeit differing amounts), so that even bad project
entrepreneurs receive some benefit: hence they are motivated to join the coalition, rather than
beguiling others to invest in their dud. However, none of these papers address the fragility of banks’
capital structure. A bond-bank coalition could perform this role as efficiently as a FR bank coalition
(indeed the Boyd Prescott coalition mode is a bond-bank).
The second of these strands, attributable to Diamond (1984), likens banks to monitors of borrowers,
and compares the efficiency of a banking system with a bond-market system. It is more efficient for
a bank to monitor a portfolio of borrowers than it is for individual lenders to monitor all the
individual borrowers in their bond portfolios: in the first case, the bank will monitor all the
borrowers, and lenders (who deposit in the bank) need only monitor the bank. (See Figure 9.)
Moreover, as the bank grows and its portfolio of loans becomes more diverse, its earnings become
more stable, there is less probability it will be unable to meet its commitment to depositors, so the
cost of monitoring decreases. Note that this role is also independent of the bank’s funding
structure.
17
0
200
400
600
800
1000
1200
Assets Liabilities and Equity
DepositsLoans
Cash Equity
FR Bank Balance Sheet
$
t
Assets
Liabilities
Cash
Loans
Equity
FR Bank Assets and LiabilityMaturity Structure
Short term Deposits(usually rolled over or returned to bank)
Figure 1a. A typical FR bank balance
sheet. Note the level of cash
supporting the amount of deposits.
Typically, a bank might have been
required to hold 10% of its deposits
in cash reserves to meet depositor
withdrawals: hence the term
“fractional reserve banking.”
Figure 1b. Note, however, the
differing maturity structure of
assets and liabilities. Cash is
available now, but deposit
liabilities can become payable in a
very short time frame. However,
loan assets typically do not
mature for several years. This is
called a “negative maturity
mismatch”.
18
Banks meet to net
out payments and
settle net claims
deposits cash
Bank A
Customer
VendorBank B
Clearinghouse Central bank
The Cycle of Cash
Figure 2. Bank A provides cash to a depositor, but it will be
ultimately returned, either if the vendor deposits it directly, or
if it is lent by another bank, or lent by the central bank. The
ratio of cash to transactions is declining.
19
0
100
200
300
400
500
600
19
34
19
37
19
40
19
43
19
46
19
49
19
52
19
55
19
58
19
61
19
64
19
67
19
70
19
73
19
76
19
79
19
82
19
85
19
88
19
91
19
94
19
97
20
00
20
03
20
06
20
09
20
12
Source: FDIC
US bank failures
Figure 3.
20
424
3
38
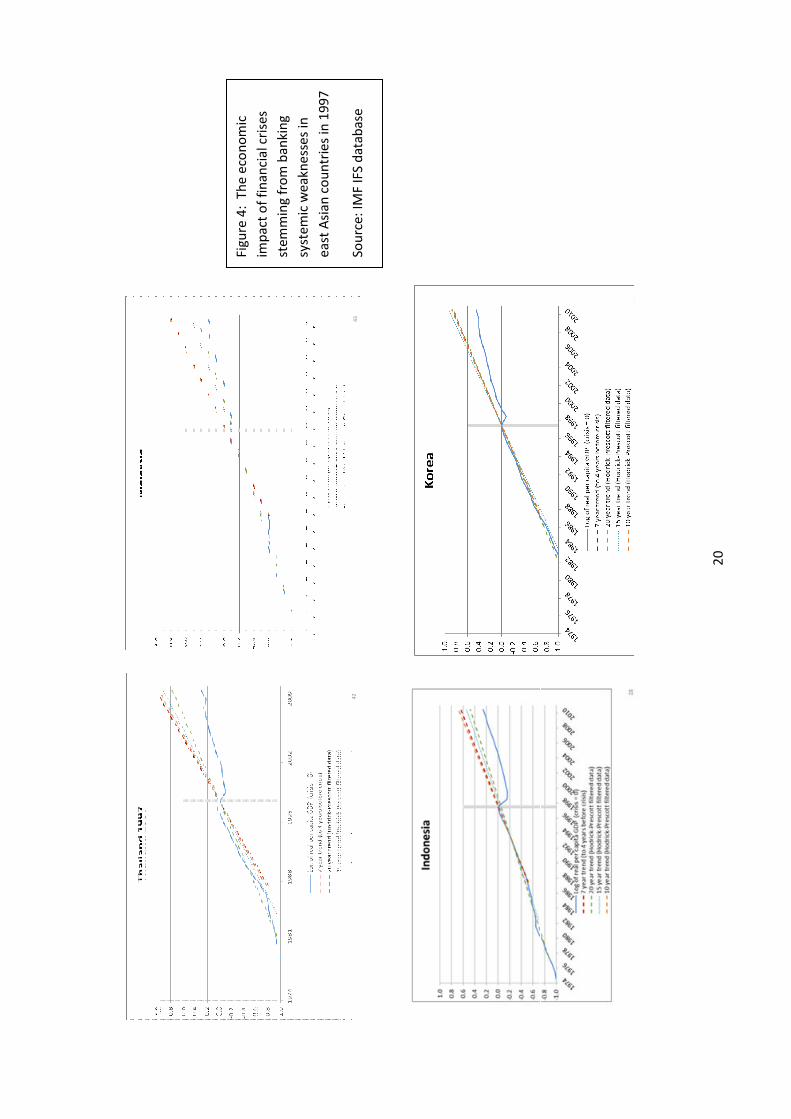
Figu
re 4
: T
he
eco
no
mic
imp
act
of
fin
anci
al c
rise
s
ste
mm
ing
fro
m b
anki
ng
syst
em
ic w
eak
ne
sse
s in
eas
t A
sian
co
un
trie
s in
19
97
Sou
rce
: IM
F IF
S d
atab
ase
21
$
t
Assets
Liabilities
Cash
Deposits
Loans
Equity
FR Bank Assets and LiabilityMaturity Structure
$
t
Assets
Liabilities
Cash
Debentures / Bonds
Loans
Equity
Narrow Banking and the Non-bank investment trust
Narrow
BankNon-bank investment trust
Current Deposits
$
t
Assets
Liabilities
Cash
Loans
Equity
Bond-Bank Assets and Liability Maturity Structure
Can be listed and traded on an exchange
Deposits Bonds
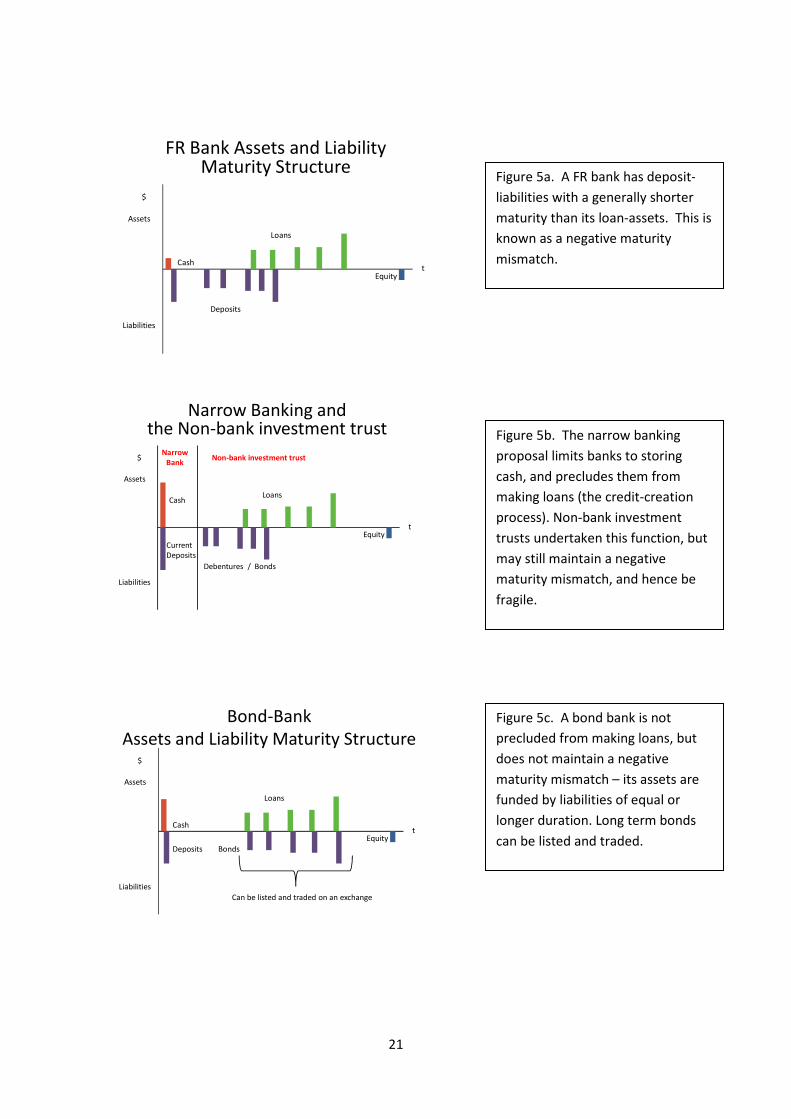
Figure 5a. A FR bank has deposit-
liabilities with a generally shorter
maturity than its loan-assets. This is
known as a negative maturity
mismatch.
Figure 5b. The narrow banking
proposal limits banks to storing
cash, and precludes them from
making loans (the credit-creation
process). Non-bank investment
trusts undertaken this function, but
may still maintain a negative
maturity mismatch, and hence be
fragile.
Figure 5c. A bond bank is not
precluded from making loans, but
does not maintain a negative
maturity mismatch – its assets are
funded by liabilities of equal or
longer duration. Long term bonds
can be listed and traded.
22
Individual 3 year bond prices - Summary data
Steep yield curve Gradual yield curve
Mean of bond prices $1.0065 $1.0226
Median of bond prices $1.0063 $1.0185
Percentage of values below $1 33.9% 15.5%
0%
2%
4%
6%
8%
10%
12%
14%
16%
18%
Jan
-70
Jul-
71
Jan
-73
Jul-
74
Jan
-76
Jul-
77
Jan
-79
Jul-
80
Jan
-82
Jul-
83
Jan
-85
Jul-
86
Jan
-88
Jul-
89
Jan
-91
Jul-
92
Jan
-94
Jul-
95
Jan
-97
Jul-
98
Jan
-00
Jul-
01
Jan
-03
Jul-
04
Jan
-06
Jul-
07
Jan
-09
Jul-
10
Jan
-12
US Treasury constant maturity interest rates
3 yr rate
5yr rate
0%
2%
4%
6%
8%
10%
12%
14%
16%
18%
363432302826242220181614121086420
Months to maturity
Examples of 3 year gradual yield curve
Jan-70
Sep-81
Dec-06
0
500
1000
1500
2000
2500
0.9
00
0.9
10
0.9
20
0.9
30
0.9
40
0.9
50
0.9
60
0.9
70
0.9
80
0.9
90
1.0
00
1.0
10
1.0
20
1.0
30
1.0
40
1.0
50
1.0
60
1.0
70
1.0
80
1.0
90
1.1
00
1.1
10
1.1
20
1.1
30
1.1
40
1.1
50
occu
rre
nce
s
bond value
3 year bond prices - gradual curve
0.8
0.85
0.9
0.95
1
1.05
1.1
1.15
1.2
Jan
-70
Jan
-72
Jan
-74
Jan
-76
Jan
-78
Jan
-80
Jan
-82
Jan
-84
Jan
-86
Jan
-88
Jan
-90
Jan
-92
Jan
-94
Jan
-96
Jan
-98
Jan
-00
Jan
-02
Jan
-04
Jan
-06
Jan
-08
Jan
-10
Jan
-12
Value of bank's bond portfolio
0%
2%
4%
6%
8%
10%
12%
14%
16%
18%
363432302826242220181614121086420
Months to maturity
Examples of 3 year steep yield curve
Jan-70
Sep-81
Dec-06
0
500
1000
1500
2000
2500
3000
0.9
00
0.9
10
0.9
20
0.9
30
0.9
40
0.9
50
0.9
60
0.9
70
0.9
80
0.9
90
1.0
00
1.0
10
1.0
20
1.0
30
1.0
40
1.0
50
1.0
60
1.0
70
1.0
80
1.0
90
1.1
00
1.1
10
1.1
20
1.1
30
1.1
40
1.1
50
occ
urr
en
ces
bond value
3 year bond prices - steep curve
0.8
0.85
0.9
0.95
1
1.05
1.1
1.15
1.2
Jan
-70
Jan
-72
Jan
-74
Jan
-76
Jan
-78
Jan
-80
Jan
-82
Jan
-84
Jan
-86
Jan
-88
Jan
-90
Jan
-92
Jan
-94
Jan
-96
Jan
-98
Jan
-00
Jan
-02
Jan
-04
Jan
-06
Jan
-08
Jan
-10
Jan
-12
Value of bank's bond portfolio
Figure 6a. US Treasury yield curve
for 3 and 5 year constant maturity
rates since 1970.
Figure 6b. Sample 3-year gradual yield curves, a histogram of resulting bond prices, and the value of a bond-bank’s portfolio. In the middle graph, bond prices are skewed to the right, indicating they are usually valued above their
face value. Bond-banks could therefore profitably sell put-options, to achieve a deposit-like stable price.
Figure 6c. Sample 3-year steep yield curves, a histogram of resulting bond prices, and the value of a bond-
bank’s portfolio. In the middle graph, bond prices are still skewed to the right, albeit not as strongly.
23
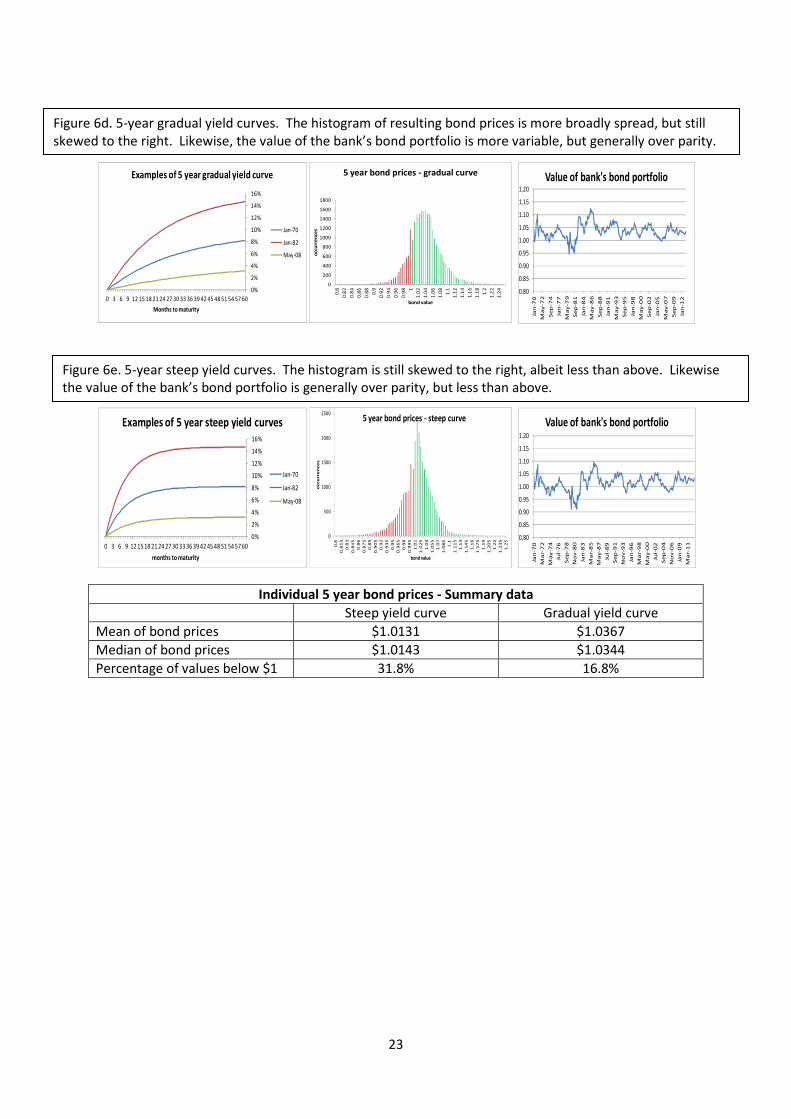
Individual 5 year bond prices - Summary data
Steep yield curve Gradual yield curve
Mean of bond prices $1.0131 $1.0367
Median of bond prices $1.0143 $1.0344
Percentage of values below $1 31.8% 16.8%
0%
2%
4%
6%
8%
10%
12%
14%
16%
60575451484542393633302724211815129630
Months to maturity
Examples of 5 year gradual yield curve
Jan-70
Jan-82
May-08
0
200
400
600
800
1000
1200
1400
1600
1800
0.8
0.8
2
0.8
4
0.8
6
0.8
8
0.9
0.9
2
0.9
4
0.9
6
0.9
8 1
1.0
2
1.0
4
1.0
6
1.0
8
1.1
1.1
2
1.1
4
1.1
6
1.1
8
1.2
1.2
2
1.2
4
occ
urr
en
ces
bond value
5 year bond prices - gradual curve
0.80
0.85
0.90
0.95
1.00
1.05
1.10
1.15
1.20
Jan
-70
Ma
y-7
2
Se
p-7
4
Jan
-77
Ma
y-7
9
Se
p-8
1
Jan
-84
Ma
y-8
6
Se
p-8
8
Jan
-91
Ma
y-9
3
Se
p-9
5
Jan
-98
Ma
y-0
0
Se
p-0
2
Jan
-05
Ma
y-0
7
Se
p-0
9
Jan
-12
Value of bank's bond portfolio
0%
2%
4%
6%
8%
10%
12%
14%
16%
60575451484542393633302724211815129630
months to maturity
Examples of 5 year steep yield curves
Jan-70
Jan-82
May-08
0
500
1000
1500
2000
2500
0.8
0.8
15
0.8
3
0.8
45
0.8
6
0.8
75
0.8
9
0.9
05
0.9
2
0.9
35
0.9
5
0.9
65
0.9
8
0.9
95
1.0
1
1.0
25
1.0
4
1.0
55
1.0
7
1.0
85
1.1
1.1
15
1.1
3
1.1
45
1.1
6
1.1
75
1.1
9
1.2
05
1.2
2
1.2
35
1.2
5
occu
rre
nce
s
bond value
5 year bond prices - steep curve
0.80
0.85
0.90
0.95
1.00
1.05
1.10
1.15
1.20
Jan
-70
Ma
r-7
2
Ma
y-7
4
Jul-
76
Se
p-7
8
No
v-8
0
Jan
-83
Ma
r-8
5
Ma
y-8
7
Jul-
89
Se
p-9
1
No
v-9
3
Jan
-96
Ma
r-9
8
Ma
y-0
0
Jul-
02
Se
p-0
4
No
v-0
6
Jan
-09
Ma
r-1
1
Value of bank's bond portfolio
Figure 6d. 5-year gradual yield curves. The histogram of resulting bond prices is more broadly spread, but still
skewed to the right. Likewise, the value of the bank’s bond portfolio is more variable, but generally over parity.
Figure 6e. 5-year steep yield curves. The histogram is still skewed to the right, albeit less than above. Likewise the value of the bank’s bond portfolio is generally over parity, but less than above.
Figure 7. Under conditions of total stability, with an invariant yield curve, the value of
bonds would never fall below parity. The chart below gives values of a 5 year 5% coupon bond over the course of its life, assuming a) a gradual and b) a steep, invariant
yield curve.
25
Comparison between FR and bond-banking
Clearinghouse
Bank Bank Bank
Net cash transfers
BankBank
Exchange
customers
The FR bank deposit is a bilateral contract – if the bank fails the deposit is worthless
The bond bank is a bond-broker –the bond always has a market value
customerscustomers
Bank
customers
Figure 8.
26
Comparison between the bond market and banking
The bond market Banking
Bank
With m investors and n borrowers, in a bond market there are m x n surveillance relationships
When a bank acts as a monitor of borrowers, only m+n surveillance relationships are needed


![Fractional Cascading Fractional Cascading I: A Data Structuring Technique Fractional Cascading II: Applications [Chazaelle & Guibas 1986] Dynamic Fractional.](https://static.documents.pub/doc/80x56/56649ea25503460f94ba64dd/fractional-cascading-fractional-cascading-i-a-data-structuring-technique-fractional.jpg)


