32
Achieving the Dream: Achieving the Dream: Assessing Implementation Assessing Implementation CCPRO CCPRO February 20, 2007 February 20, 2007
| Date post: | 31-Dec-2015 |
| Category: |
Documents |
| Upload: | scott-cobb |
| View: | 214 times |
| Download: | 0 times |

Achieving the Dream:Achieving the Dream:
Assessing ImplementationAssessing Implementation
CCPROCCPRO
February 20, 2007February 20, 2007

Focus on Student SuccessFocus on Student Success
The Learning College a RealityThe Learning College a Reality
Front Door ExperienceFront Door Experience
Culture of EvidenceCulture of Evidence
Themes of Achieving the Dream Themes of Achieving the Dream at GTCCat GTCC

Culture of EvidenceCulture of Evidence
Data collection, publication, Data collection, publication, analysis, and use to guide analysis, and use to guide change is part of the college’s change is part of the college’s culture.culture.

Culture of Evidence: ToolsCulture of Evidence: Tools Use what we haveUse what we have
– Colleague, State Data WarehouseColleague, State Data Warehouse– Annual surveysAnnual surveys– Performance Measures/Critical Success Performance Measures/Critical Success
FactorsFactors– Departmental data, Program Review dataDepartmental data, Program Review data– Existing Survey data (Faces of the Future)Existing Survey data (Faces of the Future)
Ability to survey, conduct qualitative Ability to survey, conduct qualitative research, research literatureresearch, research literature
Analytic capabilityAnalytic capability Create custom databaseCreate custom database

Plan for Assessment/Evaluation Plan for Assessment/Evaluation from the beginning.from the beginning.
Use data to prepare content of Use data to prepare content of interventions.interventions.
Determine how to define success.Determine how to define success. Define measures for that definition.Define measures for that definition. Inventory assessment resourcesInventory assessment resources Collect data to identify cohorts involved in Collect data to identify cohorts involved in
any intervention.any intervention. Anticipate the need for control or Anticipate the need for control or
comparison groups.comparison groups.

College GOALSCollege GOALS
Graduation Rate of 20%Graduation Rate of 20%Overall fall-to-fall retention rate Overall fall-to-fall retention rate
at or above 60%.at or above 60%.Developmental Education Developmental Education
retention rate 55%.retention rate 55%. Improvement in gateway course Improvement in gateway course
success of 4% and 4% for all success of 4% and 4% for all gender/ethnic groups.gender/ethnic groups.

Achieving the Dream Achieving the Dream supports:supports:
Front Door Front Door Experience Experience (Intake, Advising, (Intake, Advising, Initial Academic Initial Academic Experience)Experience)
Professional Professional DevelopmentDevelopment
Curriculum Curriculum developmentdevelopment
Orientation Orientation Learning Learning
CommunitiesCommunities Study Skills classesStudy Skills classes MentoringMentoring Transfer Advising Transfer Advising
CenterCenter Realignment of Realignment of
AdvisingAdvising

Preparing InterventionsPreparing Interventions
Literature reviewLiterature review Visit to other institutionsVisit to other institutions BenchmarkingBenchmarking ExperienceExperience Existing data sourcesExisting data sources

Preparing InterventionsPreparing Interventions Experience – What do we (faculty Experience – What do we (faculty
and staff) want them to know? What and staff) want them to know? What do we want to happen because they do we want to happen because they participated?participated?
Orientation: Eng 112 Class project Orientation: Eng 112 Class project “What do you wish you had known?” “What do you wish you had known?” What do other colleges do?What do other colleges do?
Should we have criteria for Should we have criteria for participation?participation?
How can we capture identifying How can we capture identifying information?information?

Cohort: OrientationCohort: Orientation
Student Identifier(s)Student Identifier(s)Characteristics for Comparison:Characteristics for Comparison:
– GenderGender– EthnicityEthnicity– AgeAge– New/Previous CollegeNew/Previous College– Motivation?Motivation?
Measures of successMeasures of success

Orientation Persistence RatesOrientation Persistence Rates
Persisted to Persisted to Spring 2006Spring 2006
TotalTotal
(N)(N)
Did NOT Did NOT Attend Attend OrientationOrientation
11481148
64.364.317841784
Attended Attended OrientationOrientation
705705
78.778.7896896
TotalTotal 18531853
69.169.126802680

Orientation Persistence RatesOrientation Persistence Rates
0102030405060708090
100
AfricanAmerican
Attended
Did NotAttend
0102030405060708090
100
White
Attended
Did NotAttend

OrientationOrientationAttendance/Success Rates in EnglishAttendance/Success Rates in English
0 20 40 60 80
ENG070
ENG080
ENG090
ENG111
Did not Attend
Attended

Orientation Evaluation ResultsOrientation Evaluation Results
Fall, 2005 Evaluation: SatisfactionFall, 2005 Evaluation: Satisfaction– Session I: 87.7%Session I: 87.7%– Session II: 91.1%Session II: 91.1%– Session III: 94.5%Session III: 94.5%
They: They: – Felt WelcomedFelt Welcomed– Thought staff were knowledgeableThought staff were knowledgeable– Understood the registration processUnderstood the registration process– Would encourage others to attendWould encourage others to attend– Wanted to Register at the Same TimeWanted to Register at the Same Time
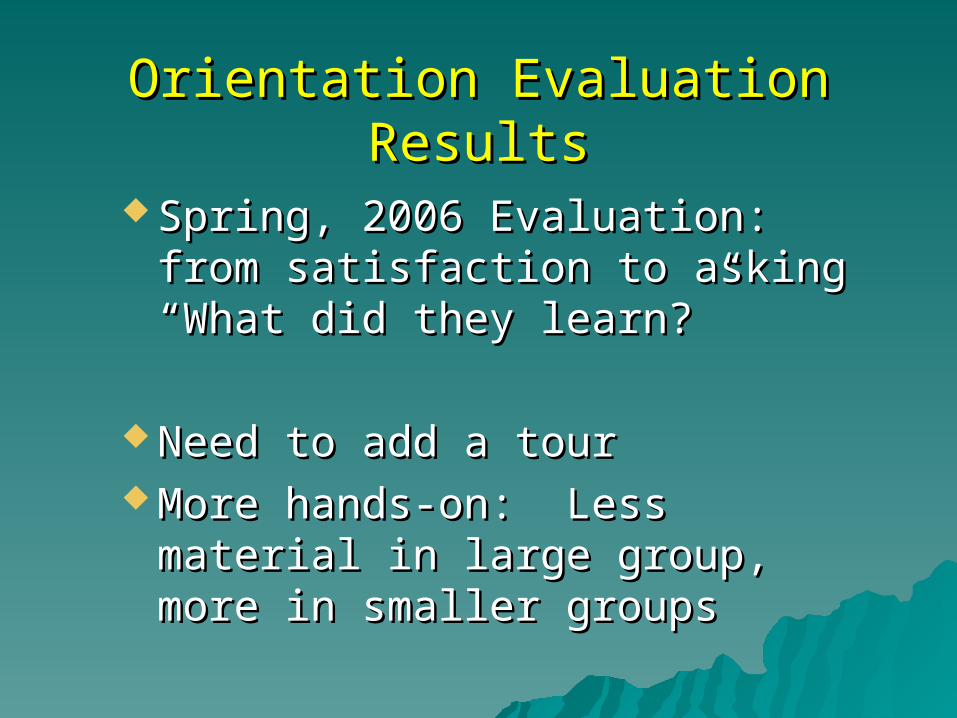
Orientation Evaluation ResultsOrientation Evaluation Results
Spring, 2006 Evaluation: from Spring, 2006 Evaluation: from satisfaction to asking “What did satisfaction to asking “What did they learn?”they learn?”
Need to add a tour Need to add a tour More hands-on: Less material in More hands-on: Less material in
large group, more in smaller large group, more in smaller groupsgroups

Study Skills Classes: ACA 111Study Skills Classes: ACA 111
Fall, 2006Fall, 2006– Requirement in Two Programs: Requirement in Two Programs:
Paralegal, Office Systems TechnologyParalegal, Office Systems Technology Fall, 2007Fall, 2007
– Three additional programs in Business Three additional programs in Business TechnologiesTechnologies
Innovative design: Innovative design: – Front-load Gateway CoursesFront-load Gateway Courses– Infuse program-specific contentInfuse program-specific content

Gateway Course Success Gateway Course Success Rates with ACA Linked ClassesRates with ACA Linked Classes Office Systems TechnologyOffice Systems Technology
• Fall 2005 87%Fall 2005 87%• Fall 2004 44% Fall 2004 44% (comparison group)(comparison group)
ParalegalParalegal• Fall 2005 94%Fall 2005 94%• Fall 2004 60%Fall 2004 60%
(comparison group)(comparison group)

72.5 72 72.7
82.3
86.9
77.5
50
60
70
80
90
%
No ACA ACA
Persistence - Fall 2006 to Spring 2007
AllNewReturn

65.7
72.8
85.283.1
50
60
70
80
90
%
No ACA ACA
Persistence - Fall 2006 to Spring 2007
African-AmerWhite
Male Students

72.374.7
79
83.2
50
60
70
80
90
%
No ACA ACA
Persistence - Fall 2006 to Spring 2007
African-AmerWhite
Female Students

Culture of EvidenceCulture of Evidence
What were the issues in What were the issues in “cleaning” these persistence “cleaning” these persistence data?data?
What are the issues inherent in What are the issues inherent in setting up a comparison or setting up a comparison or control group?control group?
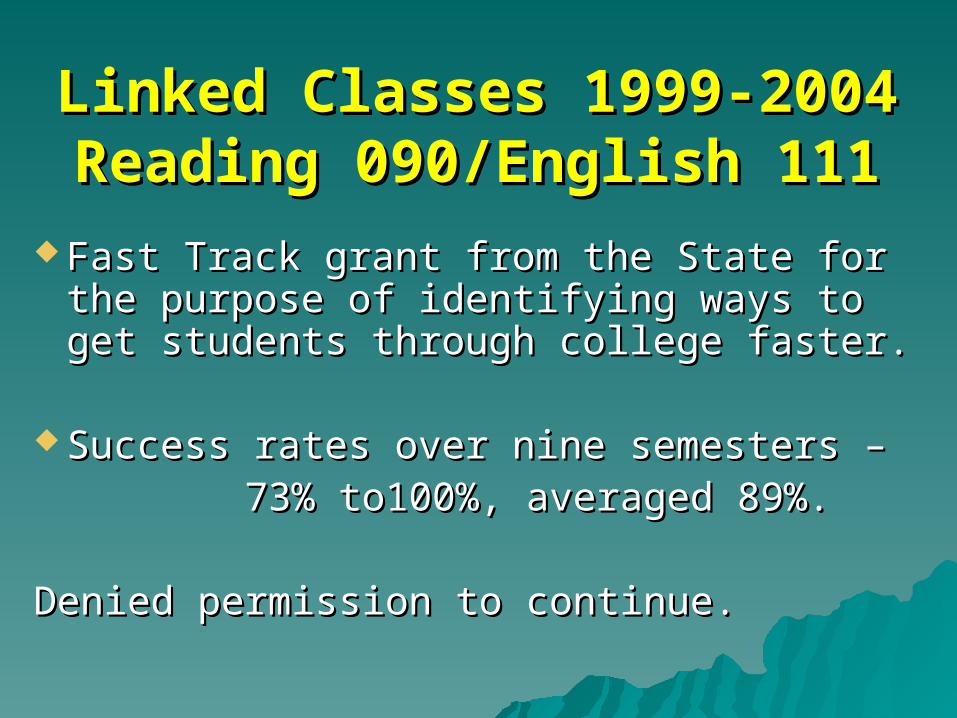
Linked Classes 1999-2004Linked Classes 1999-2004Reading 090/English 111Reading 090/English 111
Fast Track grant from the State for the Fast Track grant from the State for the purpose of identifying ways to get purpose of identifying ways to get students through college faster.students through college faster.
Success rates over nine semesters –Success rates over nine semesters – 73% to100%, averaged 89%.73% to100%, averaged 89%.
Denied permission to continue.Denied permission to continue.

Curriculum InnovationsCurriculum Innovations
Split Math ClassSplit Math Class– 94% success rate (traditional 94% success rate (traditional
success rate 60%)success rate 60%)– Now following through Now following through
subsequent coursessubsequent coursesAnecdotal dataAnecdotal data
Denied Permission to continueDenied Permission to continue

Spring 2006 Spring 2006 Transitions Learning CommunityTransitions Learning Community
English 111English 111 88.9% retention; control 82.2%88.9% retention; control 82.2% 83.3% success; control 60.7% success83.3% success; control 60.7% success
Psychology 150Psychology 150 88.9% completion; control 82.2% 88.9% completion; control 82.2% 72% success; control 52% success72% success; control 52% success
ACA 118 (College Success)ACA 118 (College Success) 88.9% completion; control 75.6% 88.9% completion; control 75.6% 66.7% success; control 44.4% success66.7% success; control 44.4% success

Fall 2006 Fall 2006 Transitions Learning CommunityTransitions Learning Community
0
10
20
30
40
50
60
70
80
90
Psychology English
TLC
Non TLCw/RED
Non TLC noRED

Linked Classes Fall 2006Linked Classes Fall 2006
72
73
78
63
0 20 40 60 80 100
LC RED080
All RED080
LC ENG080
All ENG080

MentoringMentoring
Male MentoringMale Mentoring– Spring 2006: 22 ParticipantsSpring 2006: 22 Participants– Fall 2006: 21 ParticipantsFall 2006: 21 Participants
Female Mentoring Female Mentoring – Fall 2006: 25 ParticipantsFall 2006: 25 Participants

MentoringMentoring
Spring 2006: Retention/SuccessSpring 2006: Retention/Success– Course Retention Rate: 81.4%Course Retention Rate: 81.4%– Overall Course Success Rate: 39.5%Overall Course Success Rate: 39.5%

Mentoring: Persistence & SuccessMentoring: Persistence & Success
53.8
56.3
41.5
20
40
56.380
0 20 40 60 80 100
Success/Completion
Persistence
Curriculum Control Curr AHS Control AHS

Mentoring &Mentoring &Learning CommunitiesLearning Communities
What happens when you measure small What happens when you measure small numbers? numbers?
What are some of the multiple factors What are some of the multiple factors that can cloud interpretation?that can cloud interpretation?
What else can we do to get a truer and What else can we do to get a truer and more useful interpretation of results?more useful interpretation of results?

PrinciplesPrinciples Start with the end in mind: gather the Start with the end in mind: gather the
data that will help with assessment.data that will help with assessment. Create the right cohort. Create the right cohort. Collect the data frequently, uniformly.Collect the data frequently, uniformly. Clean the data. Clean the data. Accumulate data over time to Accumulate data over time to
overcome small group bias.overcome small group bias. Need good picture of overall Need good picture of overall
intervention – ask questions about intervention – ask questions about conditions.conditions.

PrinciplesPrinciplesUse your experience – Does it look Use your experience – Does it look
right?right?Are there outliers? Why?Are there outliers? Why?Get others to react; let your ego go Get others to react; let your ego go
and consider what they say.and consider what they say.


