Page 1
Portland State University Portland State University
PDXScholar PDXScholar
Dissertations and Theses Dissertations and Theses
Winter 3-11-2016
Acid-Base Equilibria in Organic-Solvent/Water Acid-Base Equilibria in Organic-Solvent/Water
Mixtures and Their Relevance to Gas/Particle Mixtures and Their Relevance to Gas/Particle
Partitioning in the Atmosphere and in Tobacco Partitioning in the Atmosphere and in Tobacco
Smoke Smoke
Julia Lynn DeGagne Portland State University
Follow this and additional works at: https://pdxscholar.library.pdx.edu/open_access_etds
Part of the Chemicals and Drugs Commons, and the Civil and Environmental Engineering Commons
Let us know how access to this document benefits you.
Recommended Citation Recommended Citation DeGagne, Julia Lynn, "Acid-Base Equilibria in Organic-Solvent/Water Mixtures and Their Relevance to Gas/Particle Partitioning in the Atmosphere and in Tobacco Smoke" (2016). Dissertations and Theses. Paper 2733. https://doi.org/10.15760/etd.2729
This Thesis is brought to you for free and open access. It has been accepted for inclusion in Dissertations and Theses by an authorized administrator of PDXScholar. Please contact us if we can make this document more accessible: [email protected] .
Page 2
Acid-Base Equilibria in Organic-Solvent/Water Mixtures and Their Relevance to Gas/Particle
Partitioning in the Atmosphere and in Tobacco Smoke
by
Julia Lynn DeGagné
A thesis submitted in partial fulfillment of the requirements for the degree of
Master of Science in
Civil and Environmental Engineering
Thesis Committee: James F. Pankow, Chair
Scott Wells Dean Atkinson
Portland State University 2016
Page 3
i
Abstract
Acid-base equilibria in organic particulate matter (PM) are poorly understood, but have
important implications for air quality and public health. First, acid-base reactions in
organic particulate matter affect the gas/particle partitioning of organic compounds in the
atmosphere, and these processes are not currently represented in atmospheric and climate
change models. Second, the acid-base balance of tobacco smoke affects the amount of
nicotine absorbed by the smoker, and a greater understanding of this balance would help
to relate cigarette smoke composition to the addictive properties of cigarettes. This work
presents data related to both air quality and tobacco smoke modeling.
The gas/particle partitioning behavior of organic acids and bases is highly dependent on
acid-base equilibria and speciation between neutral and ionic forms, because ionic
compounds do not volatilize. Descriptions of acid dissociation behavior in atmospheric
PM have, to date, focused primarily on phases in which the solvent is water; however,
atmospheric PM may include up to 90% organic matter. Data is presented here describing
the acid dissociation behavior of organic acids and protonated amines in organic/aqueous
mixtures (chosen to approximate the characteristics of organic PM) with varying levels of
water content. In such mixtures, the preferential solvation of ions and neutral molecules
(by the aqueous portion or the organic portion, respectively) affects the acid-base
equilibria of the solutes. It is demonstrated that neutralization reactions between acids
and bases that create ions are likely to have non-negligible effects on gas/particle
partitioning under certain atmospheric conditions. Thus, including acid-base reactions in
organic gas/particle partitioning models could result in a greater proportion of acidic and
Page 4
ii
basic compounds partitioning to the particulate phase. In addition, the acid dissociation
constants (pKa values) of atmospherically-relevant acids and bases vary with water
content. Specifically, as water content increases, the pKa values of organic acids decrease
dramatically, while the pKa values of protonated amines changes only slightly. This
situation can result in drastically different speciations and partitioning behavior
depending on water content.
This second part of this work reports some of the data needed to develop an acid-base
balance for tobacco smoke PM using electroneutrality as a governing principle. Five
brands of cigarettes were sampled and the smoke PM extracted. Cations (sodium,
potassium, and ammonia) and anions (organic acids, nitrate, nitrite, and chloride) were
measured using ion chromatography. Ammonia and organic acids were also re-measured
after the acidification of the sample in order to determine whether “bound” forms of these
compounds exist in cigarette PM. Weak acids were determined by acid-base titration to
determine whether or not all of the weak acids (including organic acids) had been
accounted for by the ion chromatography. Weak bases were also determined by acid-base
titration, and the majority of weak base is expected to be accounted for by total nicotine
(to be measured in a separate analysis). In terms of total acidic species and total basic
species, two of the five cigarette brands measured were relatively basic, and three were
relatively acidic. Between 50% and 89% of the titrated acids were accounted for by the
anionic species measured in ion chromatography. Based on samples tested after sample
acidification, about half of the potential ammonia in tobacco smoke PM exists in “bound”
form. The speciation of weak acids and bases in tobacco smoke PM cannot be determined
Page 5
iii
from this data alone, because the equilibrium constants of acid-base reactions are not
understood in complex organic media. The data presented here, when combined with data
from free-base and total nicotine analyses, represent a first step toward a predictive model
of acid-base behavior in tobacco smoke PM.
Page 6
iv
“...solvents, in spite of appearing at first to be indifferent, are by no means inert; they can greatly influence the course of chemical reactions. This statement is full of consequences...”
- Nikolai Menschutkin, 1890
Page 7
v
Acknowledgements
I would like to vehemently thank everyone who supported me in my research over the
past two years. Much gratitude goes to my research advisor, James Pankow, for sending
me down this fascinating rabbit hole, and for his constant encouragement of my academic
and professional development. This project wouldn’t have been possible without my
friends and colleagues Amy Devita-McBride, Chris Motti, Ben Walker, and Clarissa
Chumfong— I’m very thankful for their help with data collection. I am cheerfully
indebted to Wentai Luo, whose advice, patience, and general calming presence have
prevented several lab-related mistakes. I am also grateful to Dr. David Peyton and Rob
Jensen for their time and assistance with the NMR analysis. As always, I owe the most to
Marc who takes care of everything.
Page 8
vi
Table of Contents
Abstract ................................................................................................................................ i Acknowledgements ............................................................................................................. v List of Tables .................................................................................................................... vii List of Figures .................................................................................................................. viii 1. Introduction: Acid-Base Chemistry and Gas/Particle Partitioning in Organic Aerosol
Systems ............................................................................................................................... 1 1.1. General Characteristics of Aerosol Particulate Matter ............................................. 2 1.2. Equilibrium Gas/Particle Partitioning of Acids and Bases to Organic PM .............. 4 1.3. Acid-Base Chemistry in Non-Aqueous Systems ..................................................... 9
2. Acid-Base Chemistry in Simulated Atmospheric OPM ............................................... 12
2.1. Background ............................................................................................................ 12
2.2. Methods .................................................................................................................. 15
2.2.1. Solution Design ............................................................................................... 15 2.2.2. Acid-Base Titrations ........................................................................................ 16 2.2.3. NMR Experiments ........................................................................................... 20
2.3. Results .................................................................................................................... 23
2.4. Discussion .............................................................................................................. 26 3. Acid-Base Chemistry of Tobacco Smoke PM .............................................................. 30
3.1. Background ............................................................................................................ 30 3.1.1. Free Base Nicotine, Nicotine Delivery, and Tobacco Smoke “pH” ................ 30 3.1.2. Toward a Comprehensive Acid-Base Balance of Tobacco Smoke PM .......... 32
3.1.3. “Stealth” Acids and Bases ............................................................................... 34 3.2. Methods .................................................................................................................. 35
3.2.1. Sampling and Extraction ................................................................................. 35
3.2.2. Acid-Base Titrations ........................................................................................ 38
3.2.3. Ion Chromatography ........................................................................................ 42 3.3. Results .................................................................................................................... 43 3.4. Discussion .............................................................................................................. 54
4. Conclusions ................................................................................................................... 57 5. References ..................................................................................................................... 59
6. Appendices .................................................................................................................... 69 6.1. Appendix A: 1HNMR and HSQC Spectra for Simulated Organic PM .................. 69 6.2. Appendix B: Titration Curves for Tobacco Smoke PM ......................................... 73
6.3. Appendix C: 1HNMR Data for Acetic Acid and Nicotine in 95% IPA ................. 76 6.4. Appendix D: Ion Chromatograms .......................................................................... 79
Page 9
vii
List of Tables
Table 1. Properties of the solvents chosen for the liquid mixture to simulate atmospheric
organic PM ........................................................................................................................ 15 Table 2. Concentrations of the three solvent components used in titration and NMR
experiments ....................................................................................................................... 17 Table 3. Concentrations of solutes representing partitioning compounds used in titration
and NMR experiments. ..................................................................................................... 17
Table 4. Fraction of hexanoic acid and benzylamine that are ionized in 1:1 molar
solutions consisting of various portions of organic solvent .............................................. 26 Table 5. Range of analytical method and linear calibration curve R2 values for tobacco
smoke PM analytes quantified using ion chromatography ............................................... 43 Table 6. Measured WTPM extracted from two cigarettes of each brand, and total weak
acids and total weak bases measured by titration ............................................................. 44 Table 7. Cation concentrations measured in the first five puffs for five cigarette brands..
........................................................................................................................................... 47
Table 8. Cation concentrations measured after acidification in the first five puffs for five
cigarette brands ................................................................................................................. 47 Table 9. Anion concentrations measured in the first five puffs for five cigarette brands...
........................................................................................................................................... 48 Table 10. Anion concentrations measured after acidification in the first five puffs for five
cigarette brands ................................................................................................................. 49
Page 10
viii
List of Figures
Figure 1. Formation of organic particulate matter. ............................................................. 3
Figure 2. Partitioning behavior in neutral and partially-ionized acids and bases. .............. 9 Figure 3. Unprotonated and protonated forms of benzylamine and hexanoic acid. ......... 22 Figure 4. 1HNMR spectra of fully protonated and fully unprotonated hexanoic acid
(0.05M) and benzylamine (0.05M) ................................................................................... 22 Figure 5. Titration curves for 0.06F hexanoic acid dissolved in solutions consisting of
between 5% and 94% (by volume) organic solvent.......................................................... 24 Figure 6. Titration curves for 0.05F benzylamine dissolved in solutions consisting of
between 5% and 94% (by volume) organic solvent.......................................................... 25 Figure 7. The three forms of nicotine potentially present in solution. .............................. 30 Figure 8. Cigarette smoking apparatus used for sampling of tobacco smoke PM. ........... 37
Figure 9. Example of a tobacco smoke titration curve and the slope of the titration curve.
........................................................................................................................................... 40
Figure 10. Measured titratable acids and bases in the first five puffs (plus lighting puff)
for five cigarette brands. ................................................................................................... 44 Figure 11. Identified and unidentified weak acids in the first five puffs (plus lighting
puff) for five cigarette brands.. ......................................................................................... 46
Figure 12. Total measured acids less total measured bases in the first five puffs (plus
lighting puff) for five cigarette brands. ............................................................................. 50
Figure 13. Concentrations of strong base tracers (sodium and potassium, shown as
positive values) and strong acid tracers (chloride and nitrate, shown as negative values) in
the first five puffs (plus lighting puff) for five cigarette brands. ...................................... 51
Figure 14. Concentrations of ammonium in initial and acidified samples in the first five
puffs (plus lighting puff) for five cigarette brands............................................................ 52 Figure 15. Concentrations of acetate and formate in initial and acidified samples in the
first five puffs (plus lighting puff) for five cigarette brands ............................................. 53
Page 11
1
1. Introduction: Acid-Base Chemistry and Gas/Particle Partitioning in Organic Aerosol
Systems
The acid-base chemistry of aerosol particulate matter (PM) affects the equilibrium
partitioning of chemical compounds from the gas to the particulate phase. This chemistry
includes the dissociation of acids, the protonation of bases, and the formation of salts.
The proportion of organic versus inorganic material in a solvent system such as aerosol
PM affects the dissociation constants of acids and protonated bases. These dissociation
constants, together with the pH of the particulate phase, determine the ratio of the ionized
form of each compound to its “free” (neutral) form. Because only the neutral form is
“free” to partition to the gas phase, gas/particle equilibrium partitioning is shifted toward
the particulate phase for a given compound when the acid-base equilibrium of the
particulate phase favors ionization for that compound.
This thesis explores the importance of acid-base chemistry to two distinct areas of current
interest involving gas/particle partitioning to PM: 1.) the representation of relevant
physical and chemical processes in atmospheric equilibrium partitioning models, and 2.)
the characterization of acids and bases in tobacco smoke. In the first case, it is
demonstrated experimentally that significant portions of organic acids and bases can
undergo acid-base reactions and become ionized in solvents with compositional and
chemical characteristics similar to those of some types of atmospheric PM. This
ionization represents a potential mechanism (currently unrepresented in atmospheric
models representing partitioning to organic PM) by which atmospheric organics may
Page 12
2
enter the particulate phase. In the second case, a compositional analysis of tobacco smoke
PM in terms of acids, bases, and ions provides some of the data needed to characterize
the acid-base balance of tobacco smoke. This acid-base balance has been historically
difficult to measure, yet it has important implications for the bioavailability of nicotine in
tobacco smoke and its addictive properties.
1.1. General Characteristics of Aerosol Particulate Matter
Aerosol particulate matter is complex, and is made up of both organic and inorganic
components originating from a wide variety of emissions sources. Primary organic
aerosol (POA) consists of directly emitted organic particles from combustion or some
other source (Kanakidou et al., 2005; Zhang et al., 2015). Secondary organic aerosol
(SOA) often forms via the oxidation (primarily by hydroxyl radicals) of reactive volatile
organic gases to less-volatile compounds, which condense onto existing suspended
particulate matter or form new particles (Hallquist et al., 2009; Kroll and Seinfeld, 2008;
Ziemann and Atkinson, 2012) (Figure 1). Suspended PM usually contains both POA and
SOA, along with inorganic components such as acids, water, and some crustal materials
(Kanakidou et al., 2005; Zhang et al., 2015). All of these PM constituents may be
distributed in various morphologies made up of multiple phases. These phases may be
solid, liquid, or semisolid (Abramson et al., 2013), and, depending on atmospheric
conditions, a liquid phase may separate into additional phases; e.g. a primarily
aqueous/hydrophilic/polar phase and a primarily organic/hydrophobic/nonpolar phase
Page 13
3
(Arp et al., 2008; Chang and Pankow, 2006; Ciobanu et al., 2009; Song et al., 2012;
Wania et al., 2015; You and Bertram, 2015; Zuend and Seinfeld, 2012).
Figure 1. Formation of organic particulate matter.
PM is not static in its composition, but is constantly evolving, in part because SOA ages
in the atmosphere. Individual organic compounds become functionalized, fragmented,
and/or oligomerized (Barsanti and Pankow, 2006; Chacon-Madrid and Donahue, 2011;
Daumit et al., 2013; Jimenez et al., 2009; Shiraiwa et al., 2014; Song and Ng, 2005). As
SOA ages and moves downwind of an emission source, the products become more
oxidized, more polar, and more hygroscopic, and tend to grow in size and mass (Duplissy
et al., 2011; Jimenez et al., 2009). Changes in meteorological variables such as relative
humidity and temperature can alter the viscosity and the phase state of the particles (Li et
al., 2015). Finally, the chemical constituents of the particles may undergo chemical
reactions, such as acid-base reactions (Pankow, 2015, 2003).
Page 14
4
Both atmospheric and tobacco smoke PM are complex mixtures of organic and inorganic
components. In some cases, aerosol particles are composed primarily of inorganics such
as nitrates, sulfates, ammonium, and water (Bassett and Seinfeld, 1983). Commonly,
though, PM2.5 (which includes aerosols < 2.5 nm in diameter) contains significant
amounts of organic matter, including alkanes, alkenes, alcohols, carbonyls, peroxides,
organic acids, organic nitrates, and many more. Amounts of organic PM reported are
20% - 50% by mass at mid-latitudes (Kanakidou et al., 2005) and 80% - 95% in the
tropics, with 45% - 75% of the organics being water soluble (Trebs et al., 2005). In
tobacco smoke, at least 70% of the PM mass is composed of organic compounds, and
about 16% is water (Thielen et al., 2008). Provided the organic and inorganic components
are all sufficiently miscible with one another (e.g., the organics are fairly water-soluble),
aerosol particles are internally mixed and no separation into organic/inorganic phases
occurs (Marcolli et al., 2004). For such mixed aerosols, the bulk phase of the particle may
be more akin to a non-aqueous organic solution than to an aqueous solution, particularly
when relative humidity is low (Clegg et al., 2001).
1.2. Equilibrium Gas/Particle Partitioning of Acids and Bases to Organic PM
Several models have been developed to predict the equilibrium partitioning of matter
from the gas to the particulate phase, and inorganic PM is generally modeled separately
from organic PM (e.g. Griffin et al., 2003; Zhang et al., 2000). Organic absorptive
equilibrium partitioning models parameterize the partitioning of an organic atmospheric
Page 15
5
compound, i, from the gas to the particle phase using the equilibrium partitioning
constant, Kp (m3/μg):
p,
p,
g,
i
i
i
cK
c (1)
where 𝑐p,𝑖 is the concentration of i in the gas phase, in μg of compound i per μg total
particulate matter (TPM), and 𝑐g,𝑖 is the concentration of i in the gas phase, in μg of
compound i/m3 of air (Pankow, 1994). This absorptive gas/particle partitioning model
represents conditions at thermodynamic equilibrium. In general, whether an atmospheric
compound exists as a gas, a particle, or both depends on its volatility and the
characteristics of the existing PM. Kp is determined using the equation (Pankow, 1994):
omp, 6 010 MW
i
i
f RTK
p (2)
where 𝑓𝑜𝑚is the fraction of total particulate matter present that can absorb condensing
organic species, 𝑅 is the universal gas constant (8.2 x 10⁻⁵ m3atm mol-1 K-1), 𝑇 is the
temperature in Kelvin, MW̅̅ ̅̅ ̅ is the average molecular weight of the total particulate matter
present in g/mol, 𝜁𝑖is the unitless activity coefficient of compound i in the PM, and 𝑝𝑖0 is
the sub-cooled liquid vapor pressure of i in atm (Pankow, 1994).
Current SOA models using the above parameterization treat all partitioning compounds
as if they existed only in their neutral forms. However, some partitioning compounds are
Page 16
6
capable of ionization, and their ionized forms are not able to partition into the gas phase.
The theoretical equation for Kp would be more representative of reality for acids and
bases if it represented the equilibrium between the concentration of the free, un-ionized
fraction in the particle phase and the total concentration in the gas phase (Pankow, 2003).
The acid-base equilibrium (and the extent of ionization) for an acid j is described by its
thermodynamic acid dissociation constant, Ka. The acid dissociation constant is formally
defined in terms of the thermodynamic equilibrium between the protonated and
deprotonated forms of the acid:
a
{ }{ }
{ }
H AK
HA
(3)
where {H+} {A-} and {HA} are the activities of the hydrogen ion, the acid anion, and the
neutral form of the acid. Activity is equal to γC, where C is the molar concentration and γ
is an activity coefficient dependent on the composition of the solution).
Similarly, for a protonated base:
a
{ }{ }
{ }
B HK
BH
(4)
The acid dissociation constant is often expressed as:
a alog( )pK K (5)
More acidic compounds have relatively lower pKa values (higher Ka values).
Page 17
7
For aqueous solutions, Ka values are well-established (γ is assumed to be 1 for a dilute
aqueous solution), and pH (–log {H+}) can be easily measured with a calibrated glass
electrode. In complex non-aqueous media such as atmospheric OPM, it is practical to
measure the abundance of the hydrogen ion on the concentration scale, defining:
pcH= -log[H+] (6)
rather than using the definition:
pH = -log {H+} (7)
The acid dissociation constant may also be redefined on a concentration scale by
including the activity coefficients:
c
a a
[ ][ ]
[ ]
HA
A H
H AK K
HA
(8)
The concentrations [H+], [HA] and [A-] can be determined experimentally.
The overall partitioning constant for the acid HA, Kp,j, can be revised to include the effect
of the acid-base reaction (Pankow, 2003):
p,HA(fa)
p,HA
fa
KK
(9)
where 𝐾p,𝑗(𝑓𝑎) is the partitioning constant for the neutral (free) form of HA (calculated as
in Equation (2),and αfa represents the fraction of HA that is in the free form:
Page 18
8
-
[HA]
[HA]+[A ]fa (10)
Similar equations can be developed for bases:
p,B(fb)
p,B
fb
KK
a (11)
+
[B]
[B]+[HB ]fb (12)
The value of αfa depends on the acid-dissociation constant of the compound, Ka, as well
as the acidity of the solvent, {H+}:
fa
a
{ }
{ }
H
K H
(13)
afb +
a +{H }
K
K (14)
In general, when SOA compounds ionize or form salts, the solubility of the acid or base
in the particulate phase increases, because ions are not volatile (Mellouki et al., 2015;
Pankow, 2003). By equations (9) - (14), a greater fraction of a weak acid exists in the
ionic form under alkaline conditions, while a greater fraction of a weak base exists in the
ionic form under acidic conditions. Thus, high pH encourages the partitioning of organic
acids to the particulate phase and of bases to the gas phase, while low pH encourages the
partitioning of bases to the particulate phase and of acids to the gas phase (Figure 2). The
lower the αfa value for a given acid (or the lower the αfb value for a given base), the
Page 19
9
greater the ionized fraction and the greater the expected partitioning to the particulate
phase.
Figure 2. Partitioning behavior in neutral (top) and partially-ionized (bottom) acids and bases.
1.3. Acid-Base Chemistry in Non-Aqueous Systems
Acidity and acid-base equilibria are often discussed in terms of aqueous solutions;
however, when the medium is organic PM, the reactions occur in a non-aqueous system.
The equilibria of all chemical reactions depend on the medium in which they take place.
Thus, the extent of ionization (or “strength”) of an acid or base, depends on the activity
coefficients (γ) in that solution, which depend on the solvation energy (the energy
required to achieve dissolution of a solute species) of each of the potential solute species
(e.g. A-, H+, and HA) in a particular solvent. Intermolecular forces between solvent
molecules as well as between solute and solvent molecules determine the solvation
energy. Ultimately, the dissociation extent of an acid or protonated base depends on the
ability of the forces of attraction between solute-solvent molecules to overcome the
forces of attraction between solute-solute and solvent-solvent molecules.
Page 20
10
Dielectric constant, hydrogen-bonding ability, proton-donating capacity, electron-
donating capacity, temperature, pressure, polarizability, and steric considerations all
impact solvation energy to some extent, with dielectric constant and hydrogen-bonding
ability generally considered to be the most important characteristics for amphiprotic
solvents (Burger, 1983; Gyenes, 1967; Reichardt, 2003). The dielectric constant of a
solvent represents the decrease in electric field strength due to the solvent – the higher the
dielectric constant, the lower the energy state of the ion, and the more well-solvated it can
be. Dielectric constant is generally a measure of the polarity and dissociation power of a
solvent (Burger, 1983; Reichardt, 2003). In a solvent with a high dielectric constant (such
as water) the energy state of ions is low and acids, which ionize when they dissociate, are
generally more likely to dissociate than in non-aqueous solvents with lower dielectric
constants (Reichardt, 2003). Solvents with lower dielectric constants, which include
alcohols and most other organic solvents, favor neutral molecules over ionized forms.
Iso-ionic reactions, such as the dissociation of the protonated base illustrated in Equation
(4), have the same number and charge of ions on either side of the reaction. These
equilibria are far less affected by changes in dielectric constant and electrostatic
interactions than equilibria in which the number and charge of ions changes over the
course of the reaction (represented by the dissociation of the neutral acid in Equation (3)
(Gyenes, 1967; Trémillon, 1971). For example, the Ka of acetic acid (CH3COOH) is five
orders of magnitude lower in methanol (pKa = 9.63) than it is in water (pKa = 4.75), but
the Ka of protonated methylamine (CH3NH3+), changes by less than one order of
magnitude (pKa = 11.00 in methanol compared to pKa = 10.64 in water; Rived et al.,
Page 21
11
1998). Solvents like water and alcohol have strong interactions with solutes through the
creation of hydrogen bonds and preferentially solvate anions, while non-polar solvents
like dioxane have only weak interactions with the solute and solvate anions poorly
(Burger, 1983; Trémillon, 1971).
Page 22
12
2. Acid-Base Chemistry in Simulated Atmospheric OPM
2.1. Background
The distribution and composition of PM in the atmosphere affects global climate, human
health, and visibility (Dockery and Pope, 1994; Pope et al., 2002; Pöschl and Shiraiwa,
2015; Stocker et al., 2013; Zhang et al., 2015). The gas/particle partitioning behavior of
the semi-volatile and low-volatility organic compounds that comprise SOA remains a
source of considerable uncertainty in air quality and climate models, with PM typically
under-predicted (Hallquist et al., 2009; Kroll and Seinfeld, 2008; Stocker et al., 2013;
Zhang et al., 2015). The ionization of organic acids and bases through acid-base reactions
in atmospheric PM represents a mechanism that is relevant to gas/particle partitioning but
is missing from current models.
Many important atmospheric partitioning compounds are capable of ionization, such as
carboxylic acids (e.g. oxalic, succinic, malonic, and acetic acid) and weak bases (e.g.
ammonia and amines). These may take part in acid-base neutralization reactions of the
form:
- +HA+B A +BH (15)
Carboxylic acids are generally secondary pollutants derived from the oxidization of
precursor gases, and can make up (by mass) ~3% of total fine PM (Trebs et al., 2005),
~10% of SOA (Bao et al., 2012), and ~50% of the water soluble organic carbon in PM
(Mayol-Bracero et al., 2002). Amines are emitted by livestock operations and other types
Page 23
13
of industry, by automobiles, and by natural sources such as biomass burning (Ge et al.,
2011a). Near emission sources, total gaseous amines may exist in concentrations up to a
few hundred ppb (Tang et al., 2013). Amines are less abundant than ammonia in the
atmosphere, but are generally more basic and therefore could be more important in some
circumstances (Ge et al., 2011b; Qiu et al., 2011).
In atmospheric systems, bases such as ammonia and amines first neutralize strong
inorganic acids such as sulfuric and nitric acids, mechanisms accounted for by inorganic
partitioning models (Zhang et al., 2000). If excess bases exist, however, they can
potentially be neutralized by weaker, organic acids. The resulting ionization of both acid
and base would cause αfb and αfa to fall below unity, and increase the Kp values of both
compounds (Equations (9) and (11)). This scenario is most likely to occur in regions with
high ammonia emissions and high concentrations of PM.
Experimental and field studies suggest that neutralization and salt formation occur in
aerosol particles. The extent of the salt formation appears to depend on relative humidity,
the pH of the particle, and the strength of the acid (Häkkinen et al., 2014; Paciga et al.,
2014). In a charge-balance study of ambient PM in the tropics, Trebs et al. (2005) found
that the inclusion of organic acid anions in the model was necessary to balance the
positively-charged inorganic species, suggesting that not only the inorganic species were
present in ionic form. Amines have also been shown to form salts with nitric acid in
aerosol formed in chamber studies (Tang et al., 2013) and with acids in the atmosphere
(Smith et al., 2010).
Page 24
14
It is well-established that the water content of atmospheric organic PM, which is affected
by relative humidity and increases as SOA becomes more oxidized (Li et al., 2015), has a
significant effect on partitioning behavior through its effect on average molecular weight
and activity coefficients (Pankow et al., 2015). Water content is also likely to influence
partitioning through its effect on acid/base equilibria. The highly polar, amphiprotic, and
hydrogen-bond-forming character of water tends to increase ion solvation and encourage
the ionized form over the neutral form. For example, ammonia uptake by SOA
(normalized to carboxylic acid mass) has been shown to increase with relative humidity,
approaching the limiting value of full neutralization of ammonia by carboxylic acid (Li et
al., 2015).
In this work, experiments were conducted to demonstrate the effects of varying PM water
content on the acid-base equilibria of two representative partitioning compounds,
hexanoic acid and benzylamine. Organic solvent/water mixtures were developed to
approximate the characteristics of one type of theoretical atmospheric PM at different
water contents, and two types of experiments elucidate the changes in acid-base behavior.
First, acid-base titrations were used to estimate the pcKa values of each partitioning
compound in the solvent mixtures. Second, nuclear magnetic resonance imaging (NMR)
spectra were used to determine the fraction of each partitioning compound present in
ionic form, when both compounds are present in equal amounts.
Page 25
15
2.2. Methods
2.2.1. Solution Design
A simple liquid solvent system was chosen to approximate organic PM, which is in
reality a very complex mixture of thousands of compounds with a wide variety of
molecular properties. The solvent was chosen such that the three properties most likely to
affect intermolecular interactions and acid-base behavior (dielectric constant, hydrogen-
bonding ability, and polarity) would be representative of those values in one hypothetical
type of somewhat-oxidized organic PM. The chosen solvent mixture consists of equal
parts of two organic solvents: isopropanol (IPA), representing the more polar organic
compounds present in PM, and p-dioxane, representing the less-polar compounds present
in PM, along with a varying amount of water (Table 1). The solvent is composed of pairs
of molecules that interact strongly with one another (e.g. water/IPA) as well as pairs
molecules that interact weakly with one another (e.g. IPA/p-dioxane), as would be the
case in somewhat-oxidized SOA.
Table 1. Properties of the solvents chosen for the liquid mixture to simulate atmospheric organic PM (ε =
dielectric constant; δh= Hanson solubility parameter for hydrogen bonding; D= dipole moment).
Solvent Relative Permittivity Hydrogen-bonding capability
Polarity Structure
isopropyl alcohol ε =19.9 δh = 16.4 D = 1.66
p-dioxane ε =2.25 δh = 9.0 D= 0.45
water ε =78.5 δh = 42.3 D= 1.85
The water content range for the three solvents intended to represent organic PM (between
~6% and 33% by weight),was chosen to capture a range of expected water contents of
Page 26
16
organic PM under atmospheric conditions. Estimates of the total liquid water content of
PM2.5 range from 13% - 50% by weight, depending on relative humidity and particle
composition (Ho et al., 1974; Hueglin et al., 2005; McMurry, 2000; Rees et al., 2004),
with 35% - 50% of the total PM2.5 water associated with the organic fraction (Guo et al.,
2014). Hexanoic acid and benzylamine were chosen as the representative partitioning
acid and base, respectively.
2.2.2. Acid-Base Titrations
2.2.2.1. Solution Preparation
Three solvent mixtures were prepared to approximate OPM using equal volume
proportions of p-dioxane (TCI) and IPA (Sigma-Aldrich) and a varying amount of water
(18.2 MΩ·cm at 25 °C, Millipore) (Table 2). A mostly-aqueous solvent mixture (~95%
water by volume) was also prepared for comparison (Table 2). Hexanoic acid (Sigma-
Aldrich) and benzylamine (TCI) and were each added to the solutions in concentrations
between 0.05F and 0.06F, along with enough NaOH to bring each solution to a high pH
prior to titration (Table 3).The NaOH solution (10F) was prepared from a 1.0 mole
concentrate (Fluka, Sigma-Aldrich), which was diluted with a 50/50 mix of p-
dioxane/IPA. The water content of this solution was determined gravimetrically and
accounted for in the listed water content of each solution (Table 2). Listed purity of all
reagents used was >99%. The solutions were titrated with 2.0F HCl, prepared by diluting
4.0F HCl in p-dioxane (Sigma-Aldrich) with IPA.
Page 27
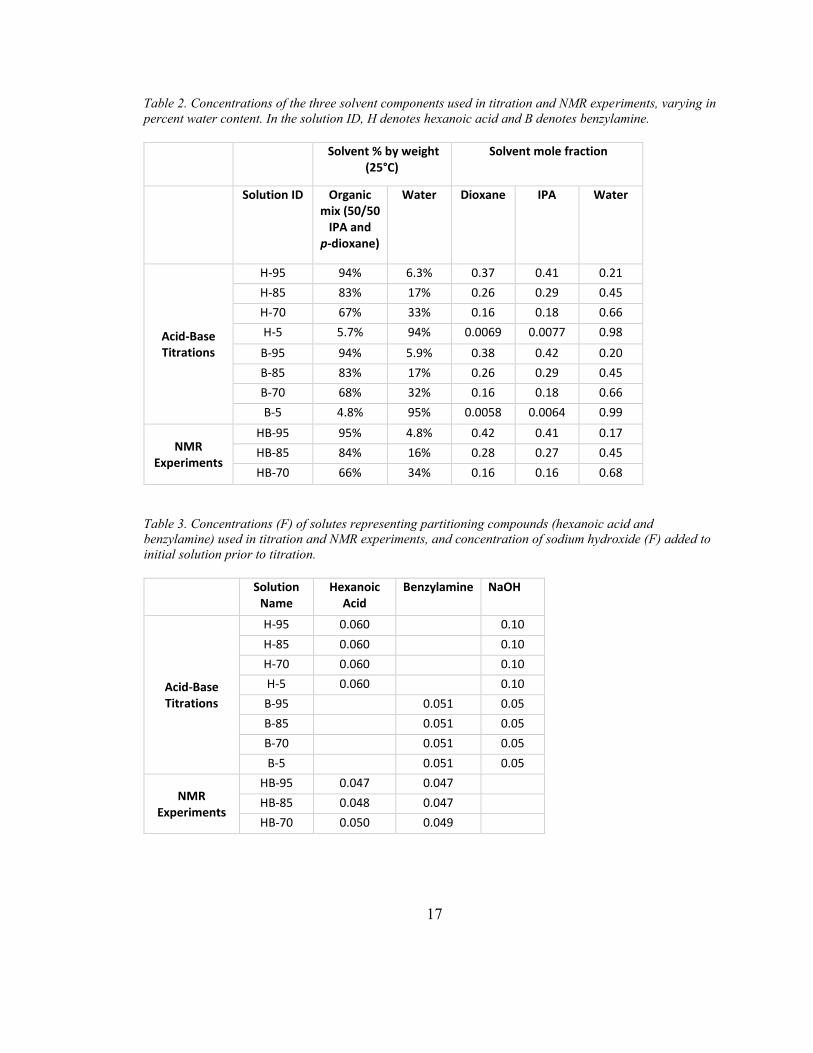
17
Table 2. Concentrations of the three solvent components used in titration and NMR experiments, varying in
percent water content. In the solution ID, H denotes hexanoic acid and B denotes benzylamine.
Solvent % by weight (25°C)
Solvent mole fraction
Solution ID Organic mix (50/50
IPA and p-dioxane)
Water Dioxane IPA Water
Acid-Base Titrations
H-95 94% 6.3% 0.37 0.41 0.21
H-85 83% 17% 0.26 0.29 0.45
H-70 67% 33% 0.16 0.18 0.66
H-5 5.7% 94% 0.0069 0.0077 0.98
B-95 94% 5.9% 0.38 0.42 0.20
B-85 83% 17% 0.26 0.29 0.45
B-70 68% 32% 0.16 0.18 0.66
B-5 4.8% 95% 0.0058 0.0064 0.99
NMR Experiments
HB-95 95% 4.8% 0.42 0.41 0.17
HB-85 84% 16% 0.28 0.27 0.45
HB-70 66% 34% 0.16 0.16 0.68
Table 3. Concentrations (F) of solutes representing partitioning compounds (hexanoic acid and
benzylamine) used in titration and NMR experiments, and concentration of sodium hydroxide (F) added to
initial solution prior to titration.
Solution Name
Hexanoic Acid
Benzylamine NaOH
Acid-Base Titrations
H-95 0.060 0.10
H-85 0.060 0.10
H-70 0.060 0.10
H-5 0.060 0.10
B-95 0.051 0.05
B-85 0.051 0.05
B-70 0.051 0.05
B-5 0.051 0.05
NMR Experiments
HB-95 0.047 0.047
HB-85 0.048 0.047
HB-70 0.050 0.049
Page 28
18
2.2.2.2. Analysis
A titration curve was developed for each solution, plotting pcH as a function of the
fraction of initial acid or base titrated (this fraction, f, was back-calculated using the
equivalence points of the titration curve). A pKa value for each solution was determined
from the inflection point of the titration curve, where f = 0.5. These were estimated using
the Gran technique (described in (Pankow, 1991)).
Titrations were carried out using a T-50 automatic titrator system (Mettler-Toledo). 5 mL
of each solution was titrated with a total of 0.3 mL of 2.0F HCl, in increments ranging
from 0.5µL to 10µL. Electrode potential (ΔE) was measured with a silver chloride glass
electrode (Mettler-Toledo InLab® Ultra-Micro). 1.0F LiCl in ethanol (Mettler-Toledo)
was used as a reference solution to minimize drift in junction potential. The electrode was
calibrated using aqueous buffer solutions (Nernst slope >96% of theoretical) at pH 4.00
and 10.00 (Fischer Scientific). Automatic titrator parameters were chosen to
accommodate a slower electrode response in organic solutions (Avdeef et al., 1999;
Scherrer and Donovan, 2009): a change in ΔE of less than 1.0 mV over 10 seconds was
required for equilibration after each addition of titrant before the recording of each
datapoint. The target change in electrode potential per aliquot was 6.0 mV, and the
threshold for detection of an equivalence point was 4500 mV/mL titrant. The total
difference in the mole fraction of water between the beginning and end of each titration,
accounting for both the titrant volume added and the water produced by neutralization of
Page 29
19
strong base during the titration, was less than 0.02. All titrations were carried out at
~20°C.
pcH was calculated from the ΔE measured by the instrument through calibration with
known values of strong acid and base. For a solution containing one weak acid, the
electroneutrality equation is (Pankow, 1991):
+
fa T[H ] + NSB = (1- )A + [OH ] (16)
Where AT is the total weak acid in the system, αfb is the fraction of acid that is in the
protonated form (HA), and NSB is the net strong base added by titration. When pH is
very low, [OH-] ≈ 0, αfa≈ 1, and [H+] ≈ –NSB, which is known from the amount of titrant
added.
Similarly, for a solution containing one weak base, the electroneutrality equation is
(Pankow, 1991):
+ -
fb T[H ] + NSB + (1- )B = [OH ] (17)
Where BT is the total weak base in the system, αfb is the fraction of base that is in the
unprotonated form (B), and NSB is the net strong base added by titration. When pH is
very low, [OH-]≈ 0, αfb≈ 0, and [H+] ≈ -(BT + NSB), which is known from the amount of
titrant added (NSB) and the initial amount of weak base (BT).
Page 30
20
The calculated [H+] can be related to the measured electrode potential, Δ𝐸, by the Nernst
equation:
+
0 (log ) (log[H ])H
E E E S S (18)
Where E0 includes the half-cell potential of the reference electrode, the standard half-cell
potential of the glass pH electrode, and the liquid junction potential; E is the standard
half-cell potential of the glass pH electrode (both in volts); and γH+ is the ionic activity
coefficient of the solution. S is the Nernst slope, and depends on temperature and solvent
composition. Assuming a constant γH+ gives:
0 (pH)E E E b S (19)
The slope S and intercept b of Equation (19) were determined using a linear least-squares
fit for the [H+] values calculated using Equations (16) and (17) at the low end of the pH
titration. This slope was applied to the remainder of the datapoints in order to calculate
[H+] from the measured electrode potential for the entire titration curve.
2.2.3. NMR Experiments
2.2.3.1. Solution Preparation
For 1HNMR, solvents were prepared using perdeuterated chemicals so that 1HNMR
spectra could be achieved without interference from outsized solvent peaks. Three
solvent mixtures to approximate organic PM were prepared using equal volume
proportions of p-dioxane-d8 (TCI) and IPA-d8 (Sigma-Aldrich) and a varying amount of
Page 31
21
deuterium hydroxide (all Cambridge Isotope Laboratories) (Table 2). Both benzylamine
and hexanoic acid were added to each solvent mixture, in proportions of approximately
1:1, at concentrations of ~0.05F (Table 3).
2.2.3.2. Analysis
Each ~0.7 mL sample was prepared in a 2.5 mm o.d. NMR tube (Bruker), and
tetramethylsilane was added as a reference solvent at a concentration of 0.1%. 1HNMR,
13CNMR (Carbon-13 NMR), and HSQC (Heteronuclear Single Quantum Correlation)
spectra were obtained using a Bruker AMX-600 NMR spectrometer and analyzed using
Bruker Topspin software (version 2.1).
1HNMR spectroscopy uses the nuclear resonance of protons in a magnetic field to reveal
the structure of a compound. The resonance frequency (δ) of each proton (normalized to
the operation frequency of the spectrometer and reported in units of ppm), provides
information about the proton’s surrounding environment. For protonated and
unprotonated species of the same compound, the resonances of the protons nearest the
protonation site (Figure 3; shown in blue for benzylamine and hexanoic acid) resonate at
different frequencies. For example, when hexanoic acid is fully protonated, its methylene
groups resonate at a frequency of δmax ≈ 2.27 ppm, compared to a frequency of δmin ≈ 2.11
when fully deprotonated.
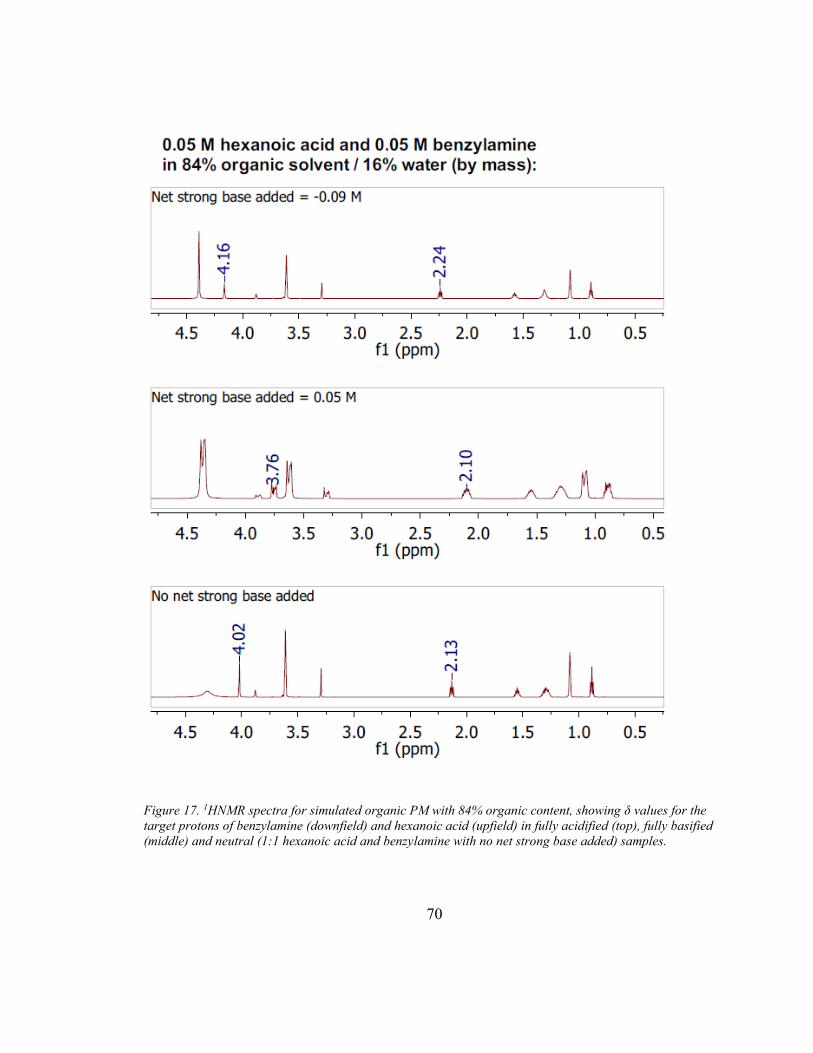
Page 32
22
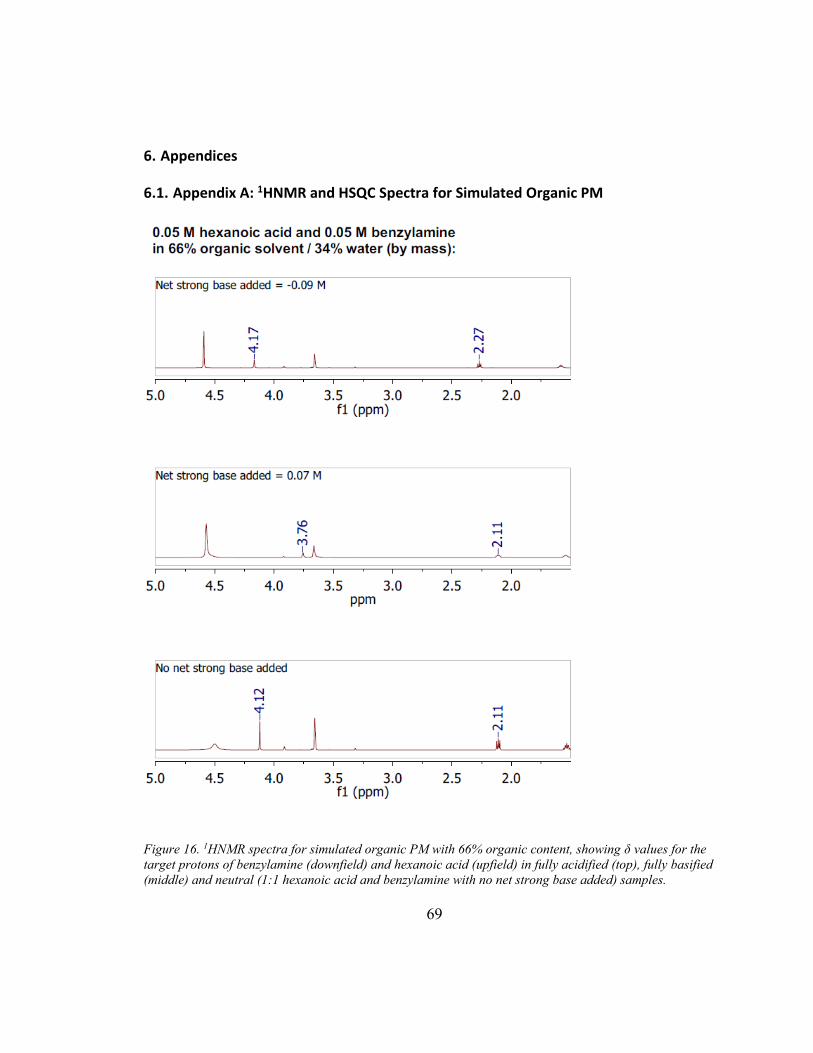
Figure 3. Unprotonated and protonated forms of benzylamine (left) and hexanoic acid (right). The 1HNMR
shift of the protons shown in blue gives information about the protonation state of the compound in
solution.
Figure 4. 1HNMR spectra of fully protonated (top) and fully unprotonated (bottom) hexanoic acid (0.05F)
and benzylamine (0.05F), dissolved in 35% IPA/35% p-dioxane/30% water (v/v/v).
When only some of the molecules in a compound are protonated, the resonance
frequency falls between the δmax and δmin, in a manner proportional to unprotonated
portion of the compound, αfb (Bezençon et al., 2014; Kim et al., 2013; Shivapurkar and
Jeannerat, 2011). Thus, the fraction ionized (1-αfb or 1-αfa) can be calculated using:
Page 33
23
min
max min
1 1fa
(20)
max
max min
1 1fb
(21)
The resonance frequencies of carbon atoms in 13CNMR were used in a manner analogous
to the frequencies of the protons in 1HNMR to verify the results. Two-dimensional HSQC
spectra were also obtained to verify that the target protons and carbon atoms were
identified correctly. HSQC spectra provide more information about molecular structure
by showing how protons are associated with nearby carbon atoms.
For each of the three 1:1 hexanoic acid/benzylamine solutions tested (Table 3), initial
1HNMR, 13CNMR,and HSQC spectra were collected. After each initial collection, δmax
was determined by adding excess (0.09 F) strong acid (DCl, Cambridge Isotope
Laboratories), and δmin was then determined by adding excess (0.1 F) net strong base
(NaOD, Cambridge Isotope Laboratories). In this way, a single sample was used to
collect all six spectra.
2.3. Results
The changing shape of the titration curves show hexanoic acid becoming weaker with
increased organic content in the solvent. The calculated pcKa increasedfrom 4.9 in the
near-aqueous solution to 8.8 in the 94% organic solution (Figure 5). The pcKa of
benzylamine decreased from 9.3 in the near-aqueous solution to 8.4 in the 70% organic
Page 34
24
solution, and then increased slightly to 8.6 in the 94% organic solution (Figure 6). The
benzylamine titration curves show a less pronounced change than for hexanoic acid,
especially for the three solutions with mostly-organic composition.
Figure 5. Titration curves for 0.06F hexanoic acid dissolved in solutions consisting of between 6% and
94% (by weight) organic solvent (equal parts p-dioxane and IPA) and water. The first equivalence point
(fraction titrated = 0) represents a solution of pure hexanoic acid, the second equivalence point (fraction
titrated = 1) represents a solution of pure sodium hexanoate, and the inflection point (fraction titrated =
0.5) occurs where pcH = pcKa.
Page 35
25
Figure 6. Titration curves for 0.05F benzylamine dissolved in solutions consisting of between 6% and 95%
(by weight) organic solvent (equal parts p-dioxane and IPA) and water. The first equivalence point
(fraction titrated = 0) represents a solution of pure benzylamine, the second equivalence point (fraction
titrated = 1) represents a solution of benzylamine plus enough strong acid to protonate it fully, and the
inflection point (fraction titrated = 0.5) occurs where pcH = pcKa.
The 1HNMR data for both hexanoic acid and benzylamine show that the fraction present
in the ionized form decreases with increasing organic content (Table 4; see Appendix A
for spectra). However, even at the highest level of organic content measured, which
corresponds to a simulated organic PM particle with water content = 0.17 (mole fraction),
46% of the hexanoic acid and 39% of the benzylamine are ionized. No difference in was
found between the results from1HNMR data and results calculated from 13CNMR data,
and HSQC spectra verified that protons were identified correctly.
Page 36
26
Table 4. Fraction of hexanoic acid and benzylamine that are ionized in 1:1 molar solutions consisting of
various portions of organic solvent (equal parts p-dioxane and IPA) and water, as determined by 1HNMR.
% Ionized at 1:1 Ratio
% organic solvent
(by mass)
Hexanoic Acid
Benzylamine
95% 46% 39%
84% 74% 75%
66% 95% 90%
2.4. Discussion
Hexanoic acid behaves as a weaker acid in organic PM with lower water content than in
aqueous PM or organic PM with higher water content. The rise in pcKa of hexanoic acid
demonstrated by the titrations and the decreased fraction in the ion form seen in the
1HNMR experiments both indicate that the ability of hexanoic acid to ionize decreases
with the organic content of the solvent mixture. These results agree with several other
studies that have demonstrated increased pKa with increased organic solvent content (e.g.
in methanol/water, ethanol/water, isopropanol/water, tetrahydrofuran/water, and
acetonitrile/water systems; Bosch et al., 1995; Cox, 2015; Rosés and Bosch, 2002). The
findings also agree with intermolecular attraction theory, in that organic mixtures are
poor solvators of ions compared to water (Cox, 2015; Sarmini and Kenndler, 1999). The
calculated near-aqueous pcKa for hexanoic acid (5.15) is larger than its value in aqueous
solution (4.88), suggesting that even a small amount (~5%) of these organics in the
solvent measurably impacts the acid-base equilibria by altering the relative strength of
intermolecular attractions in the solution.
Page 37
27
The pcKa values of benzylamine indicate that, when organic content is 70% or greater, it
behaves as a weaker base than in aqueous solution, although it slightly increases in
strength with organic contents between 70% and 95%. The strength of the base in pure
aqueous solution, at pcKa =9.33, is equal to the calculated near-aqueous pcKa. The
difference is much less pronounced than for hexanoic acid, which is in agreement with
other studies that demonstrated a similar pattern for protonated bases in organic
solvent/water mixtures (e.g. in methanol/water, ethanol/water, and acetonitrile/water
systems; Cox, 2015; Sarmini and Kenndler, 1999). This can be explained by the fact that
iso-ionic reactions, such as the protonation of a neutral base, are not strongly affected by
changes in the solution’s ability to solvate ions.
In the 94%-organic solution, hexanoic acid is no longer sufficiently acidic to protonate
benzylamine (as it does in water); in fact, the protonated benzylamine and the hexanoic
acid have similar pcKa values. As a result, hexanoic acid only partially protonates
benzylamine, which is demonstrated for an equimolar acid/base solution by the 1HNMR
results. Although the majority of the hexanoic acid does not protonate the benzylamine in
this solution (as it does in the solutions with higher water content), the significant fraction
of base and acid ionized (39% and 46%, respectively) shows that acid/base neutralization
does occur even in the most-organic solution tested. Regarding the gas/particle
partitioning of these two organic species to atmospheric PM, the 1HNMR data provide
evidence that neutralization reactions are likely to be important when excess base exists,
and should be considered in air quality models.
Page 38
28
Including acid/base reactions in equilibrium organic partitioning models is expected to
increase predicted total concentrations of SOA. For both hexanoic acid and benzylamine
partitioning to a neutral, mostly organic particle phase, including acid-base reactions
could theoretically cause Kp to increase nearly ten-fold in a particle that is 70% organic
(mole fraction water = 0.69), and about two-fold in a particle that is 30% organic (mole
fraction water = 0.19). This is based on the percent ionized in the 1HNMR experiments
and Equations (9) and (11), and assumes that the solvent characteristics of the PM are
similar to those of the experimental mixture. The effect would become increasingly
important for organic acids in more basic particles, and would become increasingly
important for ammonia and amines in more acidic particles. The overall effect is expected
to be strongest in alkaline conditions (when bases exist in concentrations higher than
required to neutralize strong inorganic acids), and when water content is high. It should
be noted that, because both Kp and α values in organic PM are coupled to the composition
of the PM (by Equation (2) and by [H+], respectively), a true predicted increase in Kp
would incorporate an iterative algorithm to solve simultaneously for individual Kp values,
individual α values, and total PM mass (Pankow, 2003).
The accuracy of the pcKa values calculated from the titration data results could be
determined and possibly improved by repeating the experiments with a few alterations.
First, the titrations should be replicated several times. Second, the concentrations of
solute added should be reduced so that any differences in γH+ (assumed constant in the
calculation of pcH) will be minimized. Finally, the calibration of the pcH scale to the
Page 39
29
measured electrode potential would be improved if a separate titration was carried out
over the whole of the pcH range using only strong acid and strong base.
The 1HNMR data may be subject to isotope effects. The strength of hydrogen bonds
varies among isotopes, which could bias the results slightly in favor of solvation of the
neutral form in deuterated solvents (Reichardt, 2003). The impact of changes in ionic
strength, concentration, and other solvent conditions is unlikely to have affected the
analysis significantly. No difference in was found between the results from1HNMR data
and another set of results calculated from 13CNMR, which is less sensitive to these
changes (Reichardt, 2003).
Page 40
30
3. Acid-Base Chemistry of Tobacco Smoke PM
3.1. Background
3.1.1. Free Base Nicotine, Nicotine Delivery, and Tobacco Smoke “pH”
Mainstream cigarette smoke is an aerosol composed of thousands of organic and
inorganic compounds, including the addictive compound nicotine, and water. In cigarette
smoke PM, nicotine can theoretically exist in three forms: unprotonated, or “free-base”
(Nic), monoprotonated (NicH+), and diprotonated (NicH22+) (Figure 7). At typical
acidities, the diprotonated form is expected to exist in such small proportions as to be
considered negligible (Pankow et al., 2003). Because ions are not volatile, only the
unprotonated form is present in the gas phase.
Figure 7. The three forms of nicotine potentially present in solution.
The addictive properties of nicotine are related to the efficiency of delivery to the brain
(Henningfield and Keenan, 1993). Because gaseous molecules are more bioavailable to
the tissues of the respiratory tract than particles, free base nicotine is more easily
absorbed than monoprotonated nicotine (Tomar and Henningfield, 1997). The fraction
free base, αfb, is related to the pH of the smoke and the pKa of nicotine (Equation (14)).
Page 41
31
Theory suggests, as do tobacco industry documentation and independent research, that
the amount of nicotine in the free base form depends on the pH of the PM phase of the
smoke (Henningfield et al., 2004; Pankow et al., 1997; Watson et al., 2015; Wayne et al.,
2006). If acids with sufficiently low pKa values are present, some or all of the free base
nicotine molecules become protonated and the fraction of free base nicotine is decreased:
+ -[Nic] + [HA] [NicH ] + [A ] (22)
Similarly, if bases with sufficiently high pKa values are present, the fraction of free-base
nicotine is increased:
3 4[NicH ] + [NH ] [Nic] + [NH ] (23)
Tobacco additives that have been investigated in terms of their ability to alter the pH of
the PM phase include ammonia, urea, diammonium phosphate (DAP), sodium hydroxide,
sodium carbonate, levulinic acid, lactic acid, and various nicotine salts of organic acids
(Henningfield et al., 2004; Lakritz et al., 2014; RJ Reynolds, 1991; Steele, 1989).
Through acid-base chemistry, cigarette composition effects the amount of free-base
nicotine in the smoke and, consequently, the addictive properties of tobacco.
Despite its direct relevance to public health, the acid-base balance of tobacco smoke PM
is not well-understood. Like atmospheric PM, tobacco smoke PM is not an aqueous
solution but an extremely complex liquid mixture composed primarily of condensed
organic compounds. Attempts to directly measure the pH of tobacco smoke PM have
Page 42
32
been unsuccessful, except possibly as a method for measuring relative acidity between
smoke samples (Pankow, 2001; Watson et al., 2004; Wayne et al., 2006). The difficulty
of measuring “smoke pH” has led researchers to focus on other ways of characterizing
the acid-base chemistry of tobacco smoke PM. The fraction of free-base nicotine in
tobacco smoke PM (αfb) has been measured directly using volatility-based techniques,
and falls in the range of 0.01 – 0.36 (Lauterbach et al., 2010; Pankow et al., 2003;
Watson et al., 2004). The wide variability in αfb values among brands suggests that the
acid-base chemistry imparted to smoke PM by different tobacco formulations has a
significant impact on the efficiency of nicotine absorption by smokers. Further
characterization of this acid-base balance will improve our understanding of the
underlying causes of this variability.
3.1.2. Toward a Comprehensive Acid-Base Balance of Tobacco Smoke PM
An acid-base balance for tobacco smoke PM can be developed using the electroneutrality
equation (ENE). The ENE equates the positively-charged species and the negatively-
charged species in an uncharged solution such as tobacco smoke PM. Positively charged
species include [H+], protonated weak bases, and cation tracers for strong bases, while
negatively charged species include [OH-], deprotonated weak acids or anion tracers for
strong acids. For tobacco smoke PM, a potential ENE is:
+ + + + +
- - - - - -
2 3 3
H + K + Na + NH4 + NicH
= OH + + NO + Cl + NO + HCOA
(24)
Page 43
33
Where [A-] is the combined concentration of anions formed from several organic acids.
For weak acid and weak base species, total concentrations of compounds are more easily
measured than ions alone. Substituting total concentrations of partially-ionized
compounds for the ion concentrations, and expressing [OH-] in terms of [H+] gives:
(25)
Where α1 is the fraction of unprotonated base or acid present in the PM and the
superscripts denote the chemical system (HA = acetic acid system (AcT = total acetic
acid), FA = formic acid system (FT = total formic acid), LA = lactic acid system (LT =
total lactic acid), GA = glycolic acid system (GT = total glycolic acid), NO2 = nitrous acid
system, and NH3 = ammonia system), KHHCO3is the Henry’s law constant for carbon
dioxide in tobacco smoke PM, K1HCO3is the acid dissociation constant for H2CO3,pCO2is
the atmospheric pressure of carbon dioxide, and Kw is the autoprotolysis constant of
tobacco smoke PM.
The work that follows provides some of the data needed to populate Equation (25) by
extracting smoke PM from 5 brands of cigarettes. Total concentrations of the organic
acids (acetic, formic, lactic, and glycolic), ammonia, and tracer ions potassium, sodium,
chloride, nitrite, and nitrate were determined using ion chromatography. To provide
3
2
NH+ + +
1 3(T) T
NOHA FA LA GA -
1 T 1 T 1 T 1 T 1 2(T)
- HCO3 HCO3 w23
1
H 1 + +
K + Na + 1- NH + 1- Nic + H
= Ac + F + L + G + NO + Cl
CO + NO + +
H H
( ) ( )
KpK K
Page 44
34
assurance that all of the important organic acids and bases have been accounted for in the
ENE, the total titratable acids and bases were determined using acid-base titrations.
Concurrent work by colleagues will provide values for total nicotine and αfb. Several
previous studies have reported concentrations of acids and ions in tobacco smoke,
including several organic acids, nitrite, nitrate, chloride, ammonia, potassium, and
sodium (Chen and Pankow, 2009; Lagoutte et al., 1994; Nanni et al., 1990; Quin and
Hobbs, 1958; Swauger et al., 2002). One previous study (Cundiff et al., 1962) quantified
strong acids (e.g. HCl), weak acids (e.g. organic acids), and very weak acids (e.g.
phenols) in tobacco smoke PM. Ultimately, the data presented here could be used, along
with a good estimation of the values of the constants KHHCO3and Kw, to develop a general
predictive model for the acid dissociation constants of organic acids in tobacco smoke
PM.
3.1.3. “Stealth” Acids and Bases
Ammonia may exist in “bound” or “unbound” forms in tobacco smoke (Chen and
Pankow, 2009). Unbound ammonia includes 3NH and+
4NH , while bound ammonia
includes compounds which may be converted to 3NH or+
4NH under certain conditions.
For example, amides may be converted to unbound ammonia via hydrolysis:
2 2 2H O + RCONR' R' NH+ RCOOH (26)
The accuracy of some tobacco smoke ammonia measurements has been called into
question because it is not always clear whether the measurement applies to the bound
Page 45
35
form of ammonia only, or to a combination of the bound and unbound forms (Chen and
Pankow, 2009). Bound ammonia is important to the overall acid-base balance of tobacco
smoke PM because, when the above reaction occurs, the released amines may increase
the basicity of smoke PM.
Another reaction of possible interest in tobacco smoke PM is the esterification of organic
acids:
2R'COOH + ROH R'COOR + H O (27)
Organic acid esters represent a potential source of basicity in tobacco smoke PM, because
acids are converted to a non-acid form through esterification. In order to determine
amounts of these “stealth” acids and bases, a portion of each smoke PM sample was
acidified to encourage the hydroloysis of amines and the esterification of organic acids
and then re-analyzed by ion chromatography.
3.2. Methods
3.2.1. Sampling and Extraction
Five brands of filtered cigarettes (Kool Superlongs, Marlboro Red 100s (soft pack),
American Spirit Blue Box, Camel 99’s, and Basic Red Pack 100’s) were examined in this
study, and three replicate samples were collected for each brand. Cigarettes were
purchased in Portland, OR in December, 2015. Cigarette packs were left at ambient
laboratory conditions prior to sampling, opened within a month of purchase, and sampled
within five hours of opening.
Page 46
36
For each sample, two cigarettes were lit simultaneously and smoked into a Teflon bag
using a pump and timer to evacuate puffs of air from an air-tight 4L chamber surrounding
the bag (Figure 8). The smoking apparatus consisted of the following parts in series: (i) a
glass dual cigarette holder (Clear Concepts, Bend, OR); (ii) a 0.25” TFE Teflon
Swagelok union (Solon, OH); (iii) a glass/TFE tee stopcock (Clear Concepts/Swagelok);
(iv) a 0.25” brass Swagelok union; (v) a 1” section of 0.25” I.D. flexible tubing
(Nalgene); (vi) an empty, pre-weighed 1L Tedlar gas sampling bag (Supelco). Teflon
tape was placed around the filter ends of the cigarettes for ease of placement and sealing.
Following the FTC smoking protocol (Marian et al., 2009), a 70 mL puff (35 mL per
cigarette) of 2-second duration was taken every 60 seconds. After the initial lighting puff,
five puffs were drawn, and then the bag was sealed to allow PM to accumulate on the
walls of the bag. After ten minutes, the bag was opened, the gaseous portion of the smoke
allowed to escape, and the bag weighed to determine the mass of wet total particulate
matter (WTPM) collected.
Page 47
37
Figure 8. Cigarette smoking apparatus used for sampling of tobacco smoke PM.
To extract the PM, 14 mL of 98% IPA (>99%, Sigma-Aldrich) / 2% nanopure water
(18.2 MΩ·cm at 25 °C, Millipore) were added to the bag. Using 98% IPA as a solvent for
the tobacco smoke PM ensures that both hydrophilic and hydrophobic components of the
smoke PM are dissolved. Because water content affects acid-base chemistry, 2% water
was included in the extraction solvent to ensure a constant level of water regardless of
water content in the PM. The amount of water in tobacco smoke PM ranges from 9% to
23% by mass, and is variable between brands (Chen and Pankow, 2009). The tobacco
smoke extract was poured into a glass beaker and distributed for analysis as follows: 3.0
mL unfiltered into a glass titration beaker for titration with strong acid; 3.0 mL unfiltered
into a glass titration beaker for titration with strong base; 3 mL filtered (0.2 µm filter;
National Scientific) for later analysis by ion chromatography. After the acid-side titration,
i
ii
iii
iv
v
vi
to pump
Page 48
38
an aliquot of acidified sample was filtered and refrigerated for later analysis by ion
chromatography, for determination of stealth acids and bases.
3.2.2. Acid-Base Titrations
Separate acid-side and base-side titrations were carried out at ambient temperature
(~20°C) using a T-50 automatic titrator system (Mettler-Toledo). Each 3.0 mL aliquot of
sample was titrated with a total of 2.0 mL of titrant (5.0 mN), in increments ranging from
5.0 uL to 50 uL. The acid titrant, a 5.0 mN solution of hydrochloric acid (Fischer
Scientific), was prepared in 95% IPA/5% nanopure water. The base titrant, a 5.0 mN
solution of lithium phenoxide (Sigma Aldrich), was prepared in 99.5% IPA/0.5% THF.
Lithium phenoxide as a moderately-strong base was chosen for its ability to titrate
organic acids without also titrating phenols, which are common constituents of tobacco
smoke PM and would be deprotonated by a stronger base. The titer of the lithium
phenoxide titrant was determined at the start of each sampling day against the
concentration-certified HCl titrant.
The electrode potential (ΔE) of the solution was measured after each addition of titrant
with a silver chloride glass electrode (Mettler-Toledo InLab® Ultra-Micro). 1.0M LiCl in
ethanol (Mettler Toledo) was used as a reference solution to minimize drift in junction
potential. Automatic titrator parameters were chosen to accommodate the relatively
sluggish electrode response of organic solutions (Avdeef et al., 1999; Scherrer and
Donovan, 2009): a change in ΔE of less than 0.5 mV over 10 seconds was required for
equilibration after each addition of titrant before the recording of each datapoint. The
Page 49
39
target change in electrode potential per aliquot was 10.0 mV, and the threshold for
detection of an equivalence point (EP) was 200 mV/mL of titrant for the acid titration and
450 mV/mL of titrant for the base titration. The concentrations (v/v) of IPA in the sample
at the end of the titrations were 96.8% for the acid side and 98.6% for the base side.
The amounts of titratable acids and bases were determined by examination of the EPs of
the titration, which are located at the maxima of the first derivative of the titration curve
(Figure 9). There are three visible EPs in the titration curves: the leftmost equivalence
point (EP1) represents the point at which all of the organic acids and nicotine are fully
protonated (RCOOH and NicH+), the middle equivalence point (EP2) represents the point
at which all of the organic acids are fully protonated and the nicotine is fully
unprotonated (RCOOH and Nic), and the rightmost equivalence point (EP3) represents
the point at which all of the organic acids and nicotine are fully unprotonated (RCOO-
and Nic). Organic acids behave as very weak acids in isopropanol, and nicotine is not
protonated by organic acids at EP2 in these samples. This was verified by a1HNMR
analysis which showed that, when dissolved in a 95% IPA solution with 1:1 with acetic
acid, nicotine remains fully unprotonated (Appendix C).
Page 50
40
Figure 9. Example of a tobacco smoke titration curve (electrode potential vs. equivalents of net strong base
added) and the slope of the titration curve (slope of electrode potential). Equivalence points (green
triangles) are used to determine concentrations of weak (titratable) acids and weak (titratable) bases.
The total titratable (weak) acids, AT, is given by:
T EP3 EP2A NSB NSB (28)
where NSBEP3 is the net strong base that has been added at EP3, and NSBEP2 is the net
strong base that has been added at EP2 (all in units of equivalents). The total titratable
(weak) bases, BT, is given by:
T EP1 EP2( )B NSB NSB (29)
where NSBEP1 is the net strong base that has been added at EP1. All acid and base
concentrations were normalized to equivalents per mg WTPM for reporting.
Page 51
41
EP1 and EP3 were calculated automatically by the titrator software (LabX, version 5;
Mettler-Toledo) using an algorithm that considers the 10 surrounding datapoints to
determine the derivative of the titration curve at each point. Due to software limitations,
EP2 could not be calculated this way (the surrounding points were gathered from two
separate titrations). The location of EP2 was determined manually using the Gran
technique (described in Pankow, 1991) and the points on the acid-side titration curve.
The base-side titration curve points were not used because the acid-side titration curves
were smoother and provided a more suitable dataset for the Gran technique (see
Appendix B).
A test of the titration method using known quantities of acetic acid and nicotine dissolved
in 95% IPA gave percent error values of -2.4% (for nicotine) and -5.9% (for acetic acid),
for concentrations similar to those expected in the samples. However, when the extraction
solvent was titrated alone alongside the samples, some titratable acids were quantified.
The amounts of titratable acids in four blank samples (two obtained after pouring into the
sampling bag), were measured and the average (0.58 ueq per 3 mL sample; RSD=7%)
was subtracted from the total titrated acids in each sample to calculate the titratable acids
in the tobacco smoke PM. The most likely source of the acids in the blank samples is
carbon dioxide, which dissolves in isopropanol and creates titratable carbonic acid (the
solubility of carbon dioxide is nearly ten times greater in isopropanol than in water
(Tokunaga, 1975)). No titratable bases were identified in the extraction solvent by
titration with HCl.
Page 52
42
3.2.3. Ion Chromatography
Stock ion standard solutions were prepared in nanopure water (18.2 MΩ·cm at 25 °C,
Millipore) with the following ACS reagents: sodium chloride (>99.0%, Sigma Aldrich),
sodium nitrate (>98.1%, Mallinckrodt Chemical Works), potassium nitrite (>99.0%, JT
Baker), sodium sulfate (>99.0%, Sigma Aldrich), potassium acetate (>99.0%, Fischer
Scientific), sodium formate (99.4%, JT Baker), glycolic acid (99%, Sigma Aldrich),
potassium chloride (>99.0%,Chem Products), and ammonium chloride (99.5%, Acros).
Chloroform (0.2%)was added to the anion stock solution to preserve the nitrate and
nitrite. For calibration, the stock solution was diluted in in 98% IPA, and linear
calibration curves (five point curves for anions and a seven point curve for cations) were
constructed with respect to peak height (Table 5). After the initial calculation in mg/L,
sample ion concentrations were converted to equivalents per mg WTPM for reporting.
Analyses of anions for both initial and acidified samples were made within 24 hours of
sample collection. Samples were run with cell and column temperatures of 40°C and a
compartment temperature of 35°Con a 4-mm IC-5000 ion chromatography system with a
25 uL sample loop (Dionex). The anion method used an AS-15 anion column with an
AG-15 guard column, a CR-ATC continuously regenerated anion trap column, and
ASRS-300 suppressor (current = 71 mA). Elution was with KOH at a flow rate of 0.75
mL/min and the following concentration gradient: hold at 10mM KOH for 10 minutes,
steadily increase to 22 mM from 10 to 12.5 minutes, step-increase to 45 mM at 12.5, and
hold at 45 mM for 25.5 minutes.
Page 53
43
Analyses of cations for both initial and acidified samples were made within 28 days of
sample collection. Samples were run at ambient temperature on a 4-mm IC-5000 ion
chromatography system with a 25 uL sample loop (Dionex). The analysis used a CS-12A
cation column, a CG 12A guard column, and a CSRS 300 suppressor (current = 51 mA).
Elution occurred at 1.0 mL/min with 20 mM methanesulfonic acid (MSA) for 15
minutes.
Table 5. Range of analytical method and linear calibration curve R2 values for tobacco smoke PM analytes
quantified using ion chromatography. Curves were run on five separate days for anion analysis, so
minimum and maximum R2is given for anion standards.
Analyte Concentration Range (mg/L)
R2
Low High Min Max
Glycolate 0.94 15.0 0.9977 0.9996
Acetate 3.13 50.0 0.9930 0.9960
Formate 1.25 20.0 0.9830 0.9962
Chloride 0.62 10.0 0.9965 0.9995
Nitrite 3.12 50.0 0.9953 0.9996
Nitrate 1.25 20.0 0.9972 0.9996
Sulfate 0.62 10.0 N/A N/A
Lactate 0.94 15.1 0.9937 0.9995
Potassium 0.67 20.1 0.9964
Sodium 1.00 30.1 0.9975
Ammonium 0.33 9.9 0.9980
3.3. Results
The mass of WTPM from the first 5 puffs (plus lighting puff) of two cigarettes ranged
from 14-27 mg for the five brands sampled (Table 6). Total titrated bases ranged from
532-610 neq/mg WTPM, and total titrated acids ranged from 449-763 neq/mg WTPM
(Table 6; Figure 10; see Appendix B for titration curves).
Page 54
44
Table 6. Measured WTPM extracted from two cigarettes of each brand (first 5 puffs plus lighting puff only),
and total weak acids and total weak bases measured by titration. N=3 for all brands.
WTPM (mg) Total Weak Acids (neq/mg WTPM)
Total Weak Bases (neq/mg WTPM)
Brand mean std. dev mean
std. dev mean
std. dev
Am. Spirit 14 +/- 1.9 559 +/- 27.8 582 +/- 64.2
Basic 27 +/- 1.3 763 +/- 16.5 543 +/- 17.3
Camel 22 +/- 2.3 632 +/- 30.3 556 +/- 23.7
Kool 20 +/- 2.3 449 +/- 97.0 532 +/- 92.5
Marlboro 22 +/- 0.64 707 +/- 29.1 610 +/- 21.2
Figure 10. Measured titratable acids and bases in the first five puffs (plus lighting puff) for five cigarette
brands. Error bars give the standard error (n=3 for all brands).
Ion chromatography identified weak acid anions in amounts corresponding to between
50-89% of the weak acids quantified by the titrations (Figure 11). These acids include
Page 55
45
acetic acid (acetate ion), formic acid (formate ion), glycolic acid (glycolate ion), lactic
acid (lactate ion), and nitrous acid (nitrite ion) (Table 9). Acetate and nitrite were the
most abundant anions, followed by formate and lactate (see Appendix D for
chromatograms). The proportions of the acid anions among brands were similar, but the
American Spirit brand contained nitrite at levels below the method detection limit, while
nitrite was abundant in other brands. Sulfate was present at trace levels in some brands
but was not quantified (see Appendix D). Several smaller peaks on the chromatogram
were not identified. Potassium, sodium, and ammonium were the only cation peaks in the
chromatograms from the initial sample, but a very small lithium peak (likely from trace
contamination introduced during titration) appeared in many of the acidified samples.
Sodium, ammonium, and potassium were identified in the cation analysis, although
sodium was present at concentrations below the method detection limit and was estimated
(Table 7; see Appendix D for chromatograms).
Page 56
46
Figure 11. Identified and unidentified weak acids in the first five puffs (plus lighting puff) for five cigarette
brands. Error bars give the standard error for ion chromatography measurements (n=3 for all brands).
The unidentified portion is equal to the titrated acids less the weak acids identified by ion chromatography.
Page 57
47
Table 7. Cation concentrations measuredin the first five puffs (plus lighting puff) for five cigarette brands
(n=3 for all brands). Concentrations highlighted in grey are below the quantitation limit of the method and
are estimated.
Cations (neq/mg WTPM) - Initial Sample
Sodium Ammonium Potassium
Brand mean std. dev mean
std. dev mean
std. dev
Am. Spirit 4.71 +/- 3.41 7.82 +/- 2.72 13.04 +/- 2.34
Basic 3.29 +/- 0.59 20.3 +/- 1.92 84.1 +/- 12.1
Camel 5.55 +/- 1.12 15.0 +/- 0.76 31.0 +/- 3.75
Kool 6.21 +/- 0.99 15.6 +/- 2.22 21.1 +/- 8.02
Marlboro 3.98 +/- 0.34 21.0 +/- 0.44 54.0 +/- 4.30
Table 8. Cation concentrations measured after acidification in the first five puffs (plus lighting puff) for five
cigarette brands (n=3 for all brands). Concentrations highlighted in grey are below the quantitation limit
of the method and are estimated.
Cations (neq/mg WTPM) - Acidified Sample
Sodium Ammonium Potassium
Brand mean std. dev mean
std. dev mean
std. dev
Am. Spirit 7.03 +/- 3.18 17.6 +/- 2.01 13.9 +/- 3.54
Basic 4.48 +/- 0.43 47.0 +/- 6.14 71.5 +/- 14.4
Camel 7.51 +/- 0.49 30.6 +/- 1.08 27.4 +/- 3.51
Kool 8.89 +/- 1.42 34.2 +/- 4.69 21.5 +/- 7.87
Marlboro 7.62 +/- 2.33 48.6 +/- 0.70 43.4 +/- 5.83
Page 58
48
Table 9. Anion concentrations measured in the first five puffs (plus lighting puff) for five cigarette brands
(n=3 for all brands). Concentrations highlighted in grey are below the quantitation limit of the method and
are estimated.
Anions (neq/mg WTPM) - Initial Sample
Glycolate Lactate Acetate
Brand mean std. dev mean
std. dev
mean
std. dev
Am. Spirit 30.1 +/- 1.65 77.0 +/- 6.12 122 +/- 9.91
Basic 29.2 +/- 0.96 84.4 +/- 3.00 161 +/- 3.50
Camel 29.1 +/- 2.21 68.5 +/- 2.11 140 +/- 10.6
Kool 21.8 +/- 3.23 55.3 +/- 8.75 142 +/- 29.6
Marlboro 31.7 +/- 1.98 68.9 +/- 2.11 155 +/- 8.01
Formate Chloride Nitrite Nitrate
Brand mean
std. dev
mean
std. dev
mean
std. dev
mean
std. dev
Am. Spirit 49.9 +/- 10.7 17.9 +/- 4.02 ND +/- ND +/- Basic 85.7 +/- 2.25 60.2 +/- 6.90 197 +/- 5.05 14.8 +/- 2.13 Camel 57.0 +/- 1.26 39.1 +/- 4.30 170 +/- 23.5 17.4 +/- 1.55 Kool 48.5 +/- 11.4 31.7 +/- 3.84 130 +/- 16.4 13.7 +/- 2.06 Marlboro 85.2 +/- 6.00 42.8 +/- 3.57 164 +/- 18.0 11.7 +/- 1.50
Page 59
49
Table 10. Anion concentrations measured after acidification in the first five puffs (plus lighting puff) for
five cigarette brands (n=3 for all brands). Concentrations highlighted in grey are below the quantitation
limit of the method and are estimated.
Anions (neq/mg WTPM) - Acidified Sample
Glycolate Lactate Acetate
Brand mean std. dev mean
std. dev mean
std. dev
Am. Spirit 31.7 +/- 3.17 76.2 +/- 5.03 79.9 +/- 20.6
Basic 31.4 +/- 1.45 81.8 +/- 0.43 154 +/- 3.52
Camel 31.0 +/- 4.24 63.9 +/- 1.31 119 +/- 14.6
Kool 24.5 +/- 1.85 57.2 +/- 10.9 129 +/- 28.9
Marlboro 34.8 +/- 0.76 67.4 +/- 0.59 148 +/- 10.5
Formate Nitrate Nitrite
Brand mean
std. dev
mean
std. dev mean
std. dev
Am. Spirit 39.9 +/- 12.1 5.12 +/- 0.39 ND +/-
Basic 86.2 +/- 2.08 33.9 +/- 4.64 23.2 +/- 3.57
Camel 39.9 +/- 2.12 33.7 +/- 0.74 41.1 +/- 3.43
Kool 31.1 +/- 9.45 23.3 +/- 3.00 15.0 +/- 3.00
Marlboro 87.1 +/- 6.65 35.7 +/- 1.60 20.5 +/- 3.40
Page 60
50
The net measured base (Figure 12) includes the total titrated (weak) bases and strong base
tracers (sodium and potassium), less the total titrated (weak) acids and strong acid tracers
(chloride and nitrate). The Basic Red brand had the greatest excess of acids and the
menthol brand Kool had the greatest excess of bases, with the other brands having a
smaller excess of base (American Spirit) or acid (Marlboro Red, Camel).
Figure 12. Total measured acids less total measured bases in the first five puffs (plus lighting puff) for five
cigarette brands. Total measured acids includes titrated acids and the strong acid tracers, chloride and
nitrate. Total measured bases includes titrated bases and the strong base tracers, potassium and sodium.
Levels of both strong acid tracers and strong base tracers were smallest for the American
Spirit brand and largest for the Basic Red brand. The Camel and Kool brands both had
higher concentrations of strong acid tracers than strong base tracers, while the Basic Red
brand had higher concentrations of strong base tracers, and Marlboro and American Spirit
brands had similar concentrations of each (Figure 13). Chloride and potassium were more
abundant in all samples than nitrate and sodium.
Page 61
51
Figure 13. Concentrations of strong base tracers (sodium and potassium, shown as positive values) and
strong acid tracers (chloride and nitrate, shown as negative values) in the first five puffs (plus lighting puff)
for five cigarette brands. Error bars show standard deviation (n=3 for all brands).
Ammonia concentrations after acidification approximately doubled over initial ammonia
concentrations (Figure 14; Table 8). Aside from a decrease in formate in the Camel brand
samples, concentrations of organic acids did not change appreciably with acidification
(Figure 15; Table 10).
Page 62
52
Figure 14. Concentrations of ammonium in initial and acidified samples in the first five puffs (plus lighting
puff) for five cigarette brands, showing contribution of bound “stealth” ammonia. Measurements for all
three replicates are shown; box height indicates the range and the center line represents the median
sample.
Page 63
53
Figure 15. Concentrations of acetate and formate in initial and acidified samples in the first five puffs (plus
lighting puff) for five cigarette brands, showing no consistent evidence of esterification. Measurements for
all three replicates are shown; box height indicates the range and the center line represents the median
sample.
Page 64
54
3.4. Discussion
Comparison of the total weak acid concentration from the titration equivalence points
with the total weak acid concentrations from the ion chromatography data suggests that,
on average, about 30% of the weak acids in tobacco smoke PM are unaccounted for by
the proposed ENE (Equation(25)). In fresh tobacco smoke, there are ~230 carboxylic
acids and ~200 amines. Propionic, butyric, valeric, oxalic, levulinic, succinic, malic,
malionic, and quinic acids are among the acids that have been identified and may
contribute to the missing portion (Borgerding and Klus, 2005; Lu et al., 2003;
Moldoveanu, 2012; Schumacher et al., 1977). Dicarboxylic acids such as oxalic acid and
those with low molecular weight (such as propionic and butyric acids) potentially
contribute more base-neutralizing power for their mass. If the unidentified peaks in the
anion chromatogram can be identified as organic acids and quantified, they may account
for some of the discrepancy. The majority of the weak base titrated is expected to be
accounted for by nicotine when that data becomes available, but ammonia and other
amines will make some contribution to total bases.
Comparison of total acids and bases indicates that American Spirit and Kool are the most
basic brands tested. This is at least partially consistent with an earlier free base nicotine
study (Pankow et al., 2003), which reported that the American Spirit brand had the
highest free base values of 12 cigarette brands studied. Marlboro and Camel brands are
shown here to be about equally acidic, while in the earlier study, early puffs of Marlboro
Page 65
55
cigarettes had more free base nicotine than Camel cigarettes. However, brand
formulations change over time, so comparisons between studies done over a range of
years may not valid in all cases. In general, the wide range of results in net basicity over
just the five brands sampled here lends support to the hypothesis that the proportions of
free base and monoprotonated nicotine in smoke PM vary widely among brands. The
variation in net basicity may be the result of differences among brands in the types and
amounts of additive used, tobacco curing practices, and/or tobacco type.
The increase in ammonium measured after acidification indicates that about half of the
ammonia in tobacco smoke PM is present in “bound” form, most likely as amines which
may be converted to ammonia under acidic conditions. This amount corresponds to the
amount of base needed to neutralize 2-4% of the weak acids titrated. Decreases in organic
acid concentrations after acidification were not large or consistent enough to suggest that
a significant amount of organic acids is becoming “bound” through esterification.
If tobacco smoke PM behaves similarly to the atmospheric organic PM, comparisons may
be drawn between the nicotine and the organic acids in tobacco smoke and the
benzylamine and hexanoic acid studied in Section 2. In solutions composed of 85%
organics (tobacco smoke PM has about 15% water), we might expect about 75% of the
organic acid and base to participate in neutralization reactions with one another,
assuming the solution is nearly neutral in terms of acidity (as, for example, the American
Spirit sample appears to be). In this case, both the weak acids and the nicotine are
Page 66
56
probably partially protonated. Further data collection, particularly of αfb values, will help
to further populate the ENE and shed light on the extent of protonation of specific acids
and bases in tobacco smoke PM.
Page 67
57
4. Conclusions
The acid-base chemistry of atmospheric organic particulate matter has the potential to
impact the gas/particle partitioning of organic compounds through the formation of ions.
Ionization favors partitioning to the particulate phase over partitioning to the gas phase.
The experiments presented here, through estimation of pKa values and direct observation
of ionization through 1HNMR, show hexanoic acid and benzylamine undergo
neutralization reactions in aqueous solutions with organic content as high as 95% by
mass. Although increasing the organic content of a solution decreases the amount of
ionization relative to that which occurs in a purely aqueous solution, a significant fraction
of organic acid and base is likely to ionize in an organic/aqueous mixture like
atmospheric PM. These results apply to solutions with equal amounts of acid and base,
and are relevant to atmospheric situations in which PM is approximately neutral;
however, the extent of ionization is dependent on the acidity of the PM as well as the
amount of organic content. Because atmospheric PM is generally acidic and organic acids
ionize to a greater extent under basic conditions, the effect of acid-base chemistry on
partitioning is likely to be strongest in areas with significant alkaline emissions relative to
acidic emissions. These acid-base reactions are chemical processes that are not
represented in current atmospheric organic PM models, and models may be improved by
incorporating them.
Page 68
58
The acid-base chemistry of tobacco smoke effects the protonation state and
bioavailability of nicotine, and is therefore relevant to public health and tobacco
regulation. The ion concentration and titration data presented here from five cigarette
brands indicates a range in the net basicity of cigarette smoke PM among brands,
suggesting that nicotine delivery efficiency also varies among brands. While the extent of
protonation of the individual acids and bases (including nicotine) was not determined,
future research relating these protonation states to the acid/base composition of tobacco
smoke could allow for improved prediction of the addictive properties of various
cigarette formulations.
Due to its impact on the ionization and volatility of acidic and basic organic compounds,
non-aqueous acid-base chemistry is highly relevant to current research in gas/particle
partitioning problems, including atmospheric particulate matter modeling and tobacco
science. It is important for atmospheric modelers and tobacco scientists to recognize the
importance of the nature of the “solvent” that is particulate matter, as it drastically
impacts the behavior of compounds in the PM, particularly acid-base reactions and
gas/particle partitioning behavior.
Page 69
59
5. References
Abramson, E., Imre, D., Beránek, J., Wilson, J., Zelenyuk, A., 2013. Experimental
determination of chemical diffusion within secondary organic aerosol particles.
Phys. Chem. Chem. Phys. 15, 2983–2991. doi:10.1039/C2CP44013J
Arp, H.P.H., Schwarzenbach, R.P., Goss, K.U., 2008. Ambient gas/particle partitioning.
1. Sorption mechanisms of apolar, polar, and ionizable organic compounds.
Environ. Sci. Technol. 42, 5541–5547. doi:10.1021/es703094u
Avdeef, A., Box, K.J., Comer, J.E.A., Gilges, M., Hadley, M., Hibbert, C., Patterson, W.,
Tam, K.Y., 1999. pH-metric log P 11. pKa determination of water-insoluble drugs
in organic solvent–water mixtures. J. Pharm. Biomed. Anal. 20, 631–641.
doi:10.1016/S0731-7085(98)00235-0
Bao, L., Matsumoto, M., Kubota, T., Sekiguchi, K., Wang, Q., Sakamoto, K., 2012.
Gas/particle partitioning of low-molecular-weight dicarboxylic acids at a
suburban site in Saitama, Japan. Atmos. Environ. 47, 546–553.
doi:10.1016/j.atmosenv.2009.09.014
Barsanti, K.C., Luo, W., Isabelle, L.M., Pankow, J.F., Peyton, D.H., 2007. Tobacco
smoke particulate matter chemistry by NMR. Magn. Reson. Chem. 45, 167–170.
doi:10.1002/mrc.1939
Barsanti, K.C., Pankow, J.F., 2006. Thermodynamics of the formation of atmospheric
organic particulate matter by accretion reactions—Part 3: Carboxylic and
dicarboxylic acids. Atmos. Environ. 40, 6676–6686.
doi:10.1016/j.atmosenv.2006.03.013
Bassett, M., Seinfeld, J.H., 1983. Atmospheric equilibrium model of sulfate and nitrate
aerosols. Atmos. Environ. 17, 2237–2252. doi:10.1016/0004-6981(83)90221-4
Bezençon, J., Wittwer, M.B., Cutting, B., Smieško, M., Wagner, B., Kansy, M., Ernst, B.,
2014. pKa determination by 1H NMR spectroscopy – An old methodology
revisited. J. Pharm. Biomed. Anal., NMR Spectroscopy in Pharmaceutical and
Biomedical Analysis 93, 147–155. doi:10.1016/j.jpba.2013.12.014
Borgerding, M., Klus, H., 2005. Analysis of complex mixtures – Cigarette smoke. Exp.
Toxicol. Pathol. 57, Supplement 1, 43–73. doi:10.1016/j.etp.2005.05.010
Bosch, E., Ràfols, C., Rosés, M., 1995. Variation of acidity constants and pH values of
some organic acids in water—2-propanol mixtures with solvent composition.
Page 70
60
Effect of preferential solvation. Anal. Chim. Acta 302, 109–119.
doi:10.1016/0003-2670(94)00435-O
Burger, K., 1983. Solvation, Ionic and Complex Formation Reactions in Non-Aqeuous
Solvents. Elsevier.
Chacon-Madrid, H.J., Donahue, N.M., 2011. Fragmentation vs. functionalization:
chemical aging and organic aerosol formation. AtmosChem Phys 11, 10553–
10563. doi:10.5194/acp-11-10553-2011
Chang, E.I., Pankow, J.F., 2006. Prediction of activity coefficients in liquid aerosol
particles containing organic compounds, dissolved inorganic salts, and water—
Part 2: Consideration of phase separation effects by an X-UNIFAC model.
Atmos. Environ. 40, 6422–6436. doi:10.1016/j.atmosenv.2006.04.031
Chen, C., Pankow, J.F., 2009. Gas/particle partitioning of two acid−base active
compounds in mainstream tobacco smoke: nicotine and ammonia. J. Agric. Food
Chem. 57, 2678–2690. doi:10.1021/jf803018x
Ciobanu, V.G., Marcolli, C., Krieger, U.K., Weers, U., Peter, T., 2009. Liquid−liquid
phase separation in mixed organic/inorganic aerosol particles. J. Phys. Chem. A
113, 10966–10978. doi:10.1021/jp905054d
Clegg, S.L., Seinfeld, J.H., Brimblecombe, P., 2001. Thermodynamic modelling of
aqueous aerosols containing electrolytes and dissolved organic compounds. J.
Aerosol Sci. 32, 713–738. doi:10.1016/S0021-8502(00)00105-1
Cox, B.G., 2015. Acids, bases, and salts in mixed-aqueous solvents. Org. Process Res.
Dev. 19, 1800–1808. doi:10.1021/op5003566
Cundiff, R., Sensabaugh, Jr, A., Markunas, P., 1962. Titrimetric determination of acid
fractions of tobacco smoke. Tob. Sci. 6, 25–27.
Daumit, K.E., Kessler, S.H., Kroll, J.H., 2013. Average chemical properties and potential
formation pathways of highly oxidized organic aerosol. Faraday Discuss. 165,
181–202. doi:10.1039/C3FD00045A
Dockery, D.W., Pope, C.A., 1994. Acute respiratory effects of particulate air pollution.
Annu. Rev. Public Health 15, 107–132.
doi:10.1146/annurev.pu.15.050194.000543
Page 71
61
Duplissy, J., DeCarlo, P.F., Dommen, J., Alfarra, M.R., Metzger, A., Barmpadimos, I.,
Prevot, A.S.H., Weingartner, E., Tritscher, T., Gysel, M., Aiken, A.C., Jimenez,
J.L., Canagaratna, M.R., Worsnop, D.R., Collins, D.R., Tomlinson, J.,
Baltensperger, U., 2011. Relating hygroscopicity and composition of organic
aerosol particulate matter. AtmosChem Phys 11, 1155–1165. doi:10.5194/acp-11-
1155-2011
Ge, X., Wexler, A.S., Clegg, S.L., 2011a. Atmospheric amines – Part I. A review. Atmos.
Environ. 45, 524–546. doi:10.1016/j.atmosenv.2010.10.012
Ge, X., Wexler, A.S., Clegg, S.L., 2011b. Atmospheric amines – Part II. Thermodynamic
properties and gas/particle partitioning. Atmos. Environ. 45, 561–577.
doi:10.1016/j.atmosenv.2010.10.013
Griffin, R.J., Nguyen, K., Dabdub, D., Seinfeld, J.H., 2003. A coupled hydrophobic-
hydrophilic model for predicting secondary organic aerosol formation. J.
Atmospheric Chem. 44, 171–190. doi:10.1023/A:1022436813699
Guo, H., Xu, L., Bougiatioti, A., Cerully, K.M., Capps, S.L., Hite, J.R., Carlton, A.G.,
Lee, S.-H., Bergin, M.H., Ng, N.L., Nenes, A., Weber, R.J., 2014. Particle water
and pH in the southeastern United States. AtmosChem Phys Discuss 14, 27143–
27193. doi:10.5194/acpd-14-27143-2014
Gyenes, I., 1967. Titration in Non-aqueous Media. Iliffe.
Häkkinen, S.A.K., McNeill, V.F., Riipinen, I., 2014. Effect of inorganic salts on the
volatility of organic acids. Environ. Sci. Technol. 48, 13718–13726.
doi:10.1021/es5033103
Hallquist, M., Wenger, J.C., Baltensperger, U., Rudich, Y., Simpson, D., Claeys, M.,
Dommen, J., Donahue, N.M., George, C., Goldstein, A.H., Hamilton, J.F.,
Herrmann, H., Hoffmann, T., Iinuma, Y., Jang, M., Jenkin, M.E., Jimenez, J.L.,
Kiendler-Scharr, A., Maenhaut, W., McFiggans, G., Mentel, T.F., Monod, A.,
Prévôt, A.S.H., Seinfeld, J.H., Surratt, J.D., Szmigielski, R., Wildt, J., 2009. The
formation, properties and impact of secondary organic aerosol: Current and
emerging issues. AtmosChem Phys 9, 5155–5236. doi:10.5194/acp-9-5155-2009
Henningfield, J.E., Keenan, R.M., 1993. Nicotine delivery kinetics and abuse liability. J.
Consult. Clin. Psychol. 61, 743–750.
doi:http://dx.doi.org.proxy.lib.pdx.edu/10.1037/0022-006X.61.5.743
Page 72
62
Henningfield, J.E., Pankow, J.F., Garrett, B.E., 2004. Ammonia and other chemical base
tobacco additives and cigarette nicotine delivery: Issues and research needs.
Nicotine Tob. Res. 6, 199–205. doi:10.1080/1462220042000202472
Ho, W., Hidy, G.M., Govan, R.M., 1974. Microwave measurements of the liquid water
content of atmospheric aerosols. J. Appl. Meteorol. 13, 871–879.
doi:10.1175/1520-0450(1974)013<0871:MMOTLW>2.0.CO;2
Hueglin, C., Gehrig, R., Baltensperger, U., Gysel, M., Monn, C., Vonmont, H., 2005.
Chemical characterisation of PM2.5, PM10 and coarse particles at urban, near-
city and rural sites in Switzerland. Atmos. Environ. 39, 637–651.
doi:10.1016/j.atmosenv.2004.10.027
Jimenez, J.L., Canagaratna, M.R., Donahue, N.M., Prevot, A.S.H., Zhang, Q., Kroll, J.H.,
DeCarlo, P.F., Allan, J.D., Coe, H., Ng, N.L., Aiken, A.C., Docherty, K.S.,
Ulbrich, I.M., Grieshop, A.P., Robinson, A.L., Duplissy, J., Smith, J.D., Wilson,
K.R., Lanz, V.A., Hueglin, C., Sun, Y.L., Tian, J., Laaksonen, A., Raatikainen,
T., Rautiainen, J., Vaattovaara, P., Ehn, M., Kulmala, M., Tomlinson, J.M.,
Collins, D.R., Cubison, M.J., Dunlea, E.J., Huffman, J.A., Onasch, T.B., Alfarra,
M.R., Williams, P.I., Bower, K., Kondo, Y., Schneider, J., Drewnick, F.,
Borrmann, S., Weimer, S., Demerjian, K., Salcedo, D., Cottrell, L., Griffin, R.,
Takami, A., Miyoshi, T., Hatakeyama, S., Shimono, A., Sun, J.Y., Zhang, Y.M.,
Dzepina, K., Kimmel, J.R., Sueper, D., Jayne, J.T., Herndon, S.C., Trimborn,
A.M., Williams, L.R., Wood, E.C., Middlebrook, A.M., Kolb, C.E.,
Baltensperger, U., Worsnop, D.R., 2009. Evolution of organic aerosols in the
atmosphere. Science 326, 1525–1529. doi:10.1126/science.1180353
Kanakidou, M., Seinfeld, J.H., Pandis, S.N., Barnes, I., Dentener, F.J., Facchini, M.C.,
Van Dingenen, R., Ervens, B., Nenes, A., Nielsen, C.J., Swietlicki, E., Putaud,
J.P., Balkanski, Y., Fuzzi, S., Horth, J., Moortgat, G.K., Winterhalter, R., Myhre,
C.E.L., Tsigaridis, K., Vignati, E., Stephanou, E.G., Wilson, J., 2005. Organic
aerosol and global climate modelling: a review. AtmosChem Phys 5, 1053–1123.
doi:10.5194/acp-5-1053-2005
Kim, H., Babu, C.R., Burgess, D.J., 2013. Quantification of protonation in organic
solvents using solution NMR spectroscopy: Implication in salt formation. Int. J.
Pharm. 448, 123–131. doi:10.1016/j.ijpharm.2013.03.040
Kroll, J.H., Seinfeld, J.H., 2008. Chemistry of secondary organic aerosol: Formation and
evolution of low-volatility organics in the atmosphere. Atmos. Environ. 42, 3593–
3624. doi:10.1016/j.atmosenv.2008.01.003
Page 73
63
Lagoutte, D., Lombard, G., Nisseron, S., Papet, M.P., Saint-Jalm, Y., 1994.
Determination of organic acids in cigarette smoke by high-performance liquid
chromatography and capillary electrophoresis. J. Chromatogr. A 684, 251–257.
doi:10.1016/0021-9673(94)00593-1
Lakritz, L., Stedman, R.L., Strange, E.D., 2014. Composition studies on tobacco
XXXLX: changes in smoke composition and filtration by artificial alteration of
smoke pH: formic and acetic acids and volatile phenols. Contrib. Tob. Res. 5,
104–108. doi:10.2478/cttr-2013-0224
Lauterbach, J.H., Bao, M., Joza, P.J., Rickert, W.S., 2010. Free-base nicotine in tobacco
products. Part I. Determination of free-base nicotine in the particulate phase of
mainstream cigarette smoke and the relevance of these findings to product design
parameters. Regul. Toxicol. Pharmacol. 58, 45–63.
doi:10.1016/j.yrtph.2010.05.007
Li, J., Cleveland, M., Ziemba, L.D., Griffin, R.J., Barsanti, K.C., Pankow, J.F., Ying, Q.,
2015. Modeling regional secondary organic aerosol using the Master Chemical
Mechanism. Atmos. Environ. 102, 52–61. doi:10.1016/j.atmosenv.2014.11.054
Lu, X., Cai, J., Kong, H., Wu, M., Hua, R., Zhao, M., Liu, J., Xu, G., 2003. Analysis of
cigarette smoke condensates by comprehensive two-dimensional gas
chromatography/time-of-flight mass spectrometry I. Acidic fraction. Anal. Chem.
75, 4441–4451. doi:10.1021/ac0264224
Marcolli, C., Luo, B., Peter, T., 2004. Mixing of the organic aerosol fractions: Liquids as
the thermodynamically stable phases. J. Phys. Chem. A 108, 2216–2224.
doi:10.1021/jp036080l
Mayol-Bracero, O.L., Guyon, P., Graham, B., Roberts, G., Andreae, M.O., Decesari, S.,
Facchini, M.C., Fuzzi, S., Artaxo, P., 2002. Water-soluble organic compounds in
biomass burning aerosols over Amazonia 2. Apportionment of the chemical
composition and importance of the polyacidic fraction. J. Geophys. Res.
Atmospheres 107, 8091. doi:10.1029/2001JD000522
McMurry, P.H., 2000. A review of atmospheric aerosol measurements. Atmos. Environ.
34, 1959–1999. doi:10.1016/S1352-2310(99)00455-0
Mellouki, A., Wallington, T.J., Chen, J., 2015. Atmospheric chemistry of oxygenated
volatile organic compounds: Impacts on air quality and climate. Chem. Rev. 115,
3984–4014. doi:10.1021/cr500549n
Page 74
64
Moldoveanu, S., 2012. Analysis of quinic acid and of myo-inositol in tobacco.
BeitrageZur Tab. Int. Contrib. Tob. Res. 25, 498–506.
Nanni, E.J., Lovette, M.E., Hicks, R.D., Fowler, K.W., Borgerding, M.F., 1990.
Separation and quantitation of monovalent anionic and cationic species in
mainstream cigarette smoke aerosols by high-performance ion chromatography. J.
Chromatogr. Sci. 28, 432–436. doi:10.1093/chromsci/28.8.432
Paciga, A.L., Riipinen, I., Pandis, S.N., 2014. Effect of ammonia on the volatility of
organic diacids. Environ. Sci. Technol. 48, 13769–13775. doi:10.1021/es5037805
Pankow, J.F., 2015. Phase considerations in the gas/particle partitioning of organic
amines in the atmosphere. Atmos. Environ. 122, 448–453.
doi:10.1016/j.atmosenv.2015.09.056
Pankow, J.F., 2003. Gas/particle partitioning of neutral and ionizing compounds to single
and multi-phase aerosol particles. 1. Unified modeling framework. Atmos.
Environ. 37, 3323–3333. doi:10.1016/S1352-2310(03)00346-7
Pankow, J.F., 2001. A consideration of the role of gas/particle partitioning in the
deposition of nicotine and other tobacco smoke compounds in the respiratory
tract. Chem. Res. Toxicol. 14, 1465–1481. doi:10.1021/tx0100901
Pankow, J.F., 1994. An absorption model of gas/particle partitioning of organic
compounds in the atmosphere. Atmos. Environ. 28, 185–188. doi:10.1016/1352-
2310(94)90093-0
Pankow, J.F., 1991. Aquatic Chemistry Concepts. CRC Press.
Pankow, J.F., Mader, B.T., Isabelle, L.M., Luo, W., Pavlick, A., Liang, C., 1997.
Conversion of nicotine in tobacco smoke to its volatile and available free-base
form through the action of gaseous ammonia. Environ. Sci. Technol. 31, 2428–
2433. doi:10.1021/es970402f
Pankow, J.F., Marks, M.C., Barsanti, K.C., Mahmud, A., Asher, W.E., Li, J., Ying, Q.,
Jathar, S.H., Kleeman, M.J., 2015. Molecular view modeling of atmospheric
organic particulate matter: Incorporating molecular structure and co-condensation
of water. Atmos. Environ. 122, 400–408. doi:10.1016/j.atmosenv.2015.10.001
Pankow, J.F., Tavakoli, A.D., Luo, W., Isabelle, L.M., 2003. Percent free base nicotine in
the tobacco smoke particulate matter of selected commercial and reference
cigarettes. Chem. Res. Toxicol. 16, 1014–1018. doi:10.1021/tx0340596
Page 75
65
Pope, C.A., Burnett, R.T., Thun, M.J., Calle, E.E., Krewski, D., Ito, K., Thurston, G.D.,
2002. Lung cancer, cardiopulmonary mortality, and long-term exposure to fine
particulate air pollution. J. Am. Med. Assoc. 287, 1132–1141.
Pöschl, U., Shiraiwa, M., 2015. Multiphase chemistry at the atmosphere–biosphere
interface influencing climate and public health in the anthropocene. Chem. Rev.
115, 4440–4475. doi:10.1021/cr500487s
Qiu, C., Wang, L., Lal, V., Khalizov, A.F., Zhang, R., 2011. Heterogeneous reactions of
alkylamines with ammonium sulfate and ammonium bisulfate. Environ. Sci.
Technol. 45, 4748–4755. doi:10.1021/es1043112
Quin, L.D., Hobbs, M.E., 1958. Analysis of nonvolatile acids in cigarette smoke by gas
chromatography of their methyl esters. Anal. Chem. 30, 1400–1405.
doi:10.1021/ac60140a032
Rees, S.L., Robinson, A.L., Khlystov, A., Stanier, C.O., Pandis, S.N., 2004. Mass balance
closure and the federal reference method for PM2.5 in Pittsburgh, Pennsylvania.
Atmos. Environ., Findings from EPA’s Particulate Matter Supersites Program 38,
3305–3318. doi:10.1016/j.atmosenv.2004.03.016
Reichardt, C., 2003. Solvents and Solvent Effects in Organic Chemistry, 3rd ed. John
Wiley & Sons.
Rived, F., Rosés, M., Bosch, E., 1998. Dissociation constants of neutral and charged
acids in methyl alcohol. The acid strength resolution. Anal. Chim. Acta 374, 309–
324. doi:10.1016/S0003-2670(98)00418-8
RJ Reynolds, 1991. Levulinic Acid. RJ Reynolds. Truth Tobacco Industry Documents.
https://industrydocuments.library.ucsf.edu/tobacco/docs/rymk0089
Rosés, M., Bosch, E., 2002. Influence of mobile phase acid–base equilibria on the
chromatographic behaviour of protolytic compounds. J. Chromatogr. A 982, 1–
30. doi:10.1016/S0021-9673(02)01444-9
Sarmini, K., Kenndler, E., 1999. Ionization constants of weak acids and bases in organic
solvents. J. Biochem. Biophys. Methods 38, 123–137. doi:10.1016/S0165-
022X(98)00033-5
Scherrer, R.A., Donovan, S.F., 2009. Automated potentiometric titrations in KCl/water-
saturated octanol: Method for quantifying factors influencing ion-pair
partitioning. Anal. Chem. 81, 2768–2778. doi:10.1021/ac802729k
Page 76
66
Schumacher, J.N., Green, C.R., Best, F.W., Newell, M.P., 1977. Smoke composition. An
extensive investigation of the water-soluble portion of cigarette smoke. J. Agric.
Food Chem. 25, 310–320. doi:10.1021/jf60210a003
Shiraiwa, M., Berkemeier, T., Schilling-Fahnestock, K.A., Seinfeld, J.H., Pöschl, U.,
2014. Molecular corridors and kinetic regimes in the multiphase chemical
evolution of secondary organic aerosol. AtmosChem Phys 14, 8323–8341.
doi:10.5194/acp-14-8323-2014
Shivapurkar, R., Jeannerat, D., 2011. Determination of the relative pKa’s of mixtures of
organic acids using NMR titration experiments based on aliased 1H–13C HSQC
spectra. Anal. Methods 3, 1316–1322. doi:10.1039/C0AY00771D
Smith, J.N., Barsanti, K.C., Friedli, H.R., Ehn, M., Kulmala, M., Collins, D.R.,
Scheckman, J.H., Williams, B.J., McMurry, P.H., 2010. Observations of aminium
salts in atmospheric nanoparticles and possible climatic implications. Proc. Natl.
Acad. Sci. 107, 6634–6639. doi:10.1073/pnas.0912127107
Song, G., Ng, N.L., 2005. Particle phase acidity and oligomer formation in secondary
organic aerosol. Environ. Sci. Amp Technol. 38, 6582–9. doi:10.1021/es049125k
Song, M., Marcolli, C., Krieger, U.K., Zuend, A., Peter, T., 2012. Liquid-liquid phase
separation and morphology of internally mixed dicarboxylic acids/ammonium
sulfate/water particles. AtmosChem Phys 12, 2691–2712. doi:10.5194/acp-12-
2691-2012
Steele, R., 1989. Chemical Evaluation of Levulinic Acid.RJ Reynolds. Truth Tobacco
Industry Documents.
https://industrydocuments.library.ucsf.edu/tobacco/docs/rsbd0095
Stocker, T., Qin, D., Plattner, G., Tignor, M., Allen, S., Boschung, J., Nauels, A., Xia, Y.,
Bex, B., Midgley, B., 2013. Climate change 2013: the physical science basis.
Contribution of working group I to the fifth assessment report of the
intergovernmental panel on climate change.
Swauger, J.E., Steichen, T.J., Murphy, P.A., Kinsler, S., 2002. An analysis of the
mainstream smoke chemistry of samples of the U.S. cigarette market acquired
between 1995 and 2000. Regul. Toxicol. Pharmacol. 35, 142–156.
doi:10.1006/rtph.2001.1521
Tang, X., Price, D., Praske, E., Lee, S.A., Shattuck, M.A., Purvis-Roberts, K., Silva, P.J.,
Asa-Awuku, A., Cocker III, D.R., 2013. NO3 radical, OH radical and O3-initiated
Page 77
67
secondary aerosol formation from aliphatic amines. Atmos. Environ. 72, 105–112.
doi:10.1016/j.atmosenv.2013.02.024
Thielen, A., Klus, H., Müller, L., 2008. Tobacco smoke: Unraveling a controversial
subject. Exp. Toxicol. Pathol. 60, 141–156. doi:10.1016/j.etp.2008.01.014
Tomar, S.L., Henningfield, J.E., 1997. Review of the evidence that pH is a determinant of
nicotine dosage from oral use of smokeless tobacco. Tob. Control 6, 219–225.
doi:10.1136/tc.6.3.219
Trebs, I., Metzger, S., Meixner, F.X., Helas, G., Hoffer, A., Rudich, Y., Falkovich, A.H.,
Moura, M.A.L., da Silva, R.S., Artaxo, P., Slanina, J., Andreae, M.O., 2005. The
NH4+-NO3−-Cl−-SO42−-H2O aerosol system and its gas phase precursors at a
pasture site in the Amazon Basin: How relevant are mineral cations and soluble
organic acids? J. Geophys. Res. Atmospheres 110, D07303.
doi:10.1029/2004JD005478
Trémillon, B., 1971. Chemistry in Non-Aqueous Solvents. Springer Science & Business
Media.
Wania, F., Lei, Y.D., Wang, C., Abbatt, J.P.D., Goss, K.-U., 2015. Using the chemical
equilibrium partitioning space to explore factors influencing the phase distribution
of compounds involved in secondary organic aerosol formation. AtmosChem
Phys 15, 3395–3412. doi:10.5194/acp-15-3395-2015
Watson, C.H., Trommel, J.S., Ashley, D.L., 2004. Solid-phase microextraction-based
approach to determine free-base nicotine in trapped mainstream cigarette smoke
total particulate matter. J. Agric. Food Chem. 52, 7240–7245.
doi:10.1021/jf049455o
Watson, C.V., Valentin-Blasini, L., Damian, M., Watson, C.H., 2015. Method for the
determination of ammonium in cigarette tobacco using ion chromatography.
Regul. Toxicol. Pharmacol. 72, 266–270. doi:10.1016/j.yrtph.2015.04.019
Wayne, G.F., Connolly, G.N., Henningfield, J.E., 2006. Brand differences of free-base
nicotine delivery in cigarette smoke: the view of the tobacco industry documents.
Tob. Control 15, 189–198. doi:10.1136/tc.2005.013805
You, Y., Bertram, A.K., 2015. Effects of molecular weight and temperature on liquid–
liquid phase separation in particles containing organic species and inorganic salts.
AtmosChem Phys 15, 1351–1365. doi:10.5194/acp-15-1351-2015
Page 78
68
Zhang, R., Wang, G., Guo, S., Zamora, M.L., Ying, Q., Lin, Y., Wang, W., Hu, M.,
Wang, Y., 2015. Formation of urban fine particulate matter. Chem. Rev. 115,
3803–3855. doi:10.1021/acs.chemrev.5b00067
Zhang, Y., Seigneur, C., Seinfeld, J.H., Jacobson, M., Clegg, S.L., Binkowski, F.S., 2000.
A comparative review of inorganic aerosol thermodynamic equilibrium modules:
Similarities, differences, and their likely causes. Atmos. Environ. 34, 117–137.
doi:10.1016/S1352-2310(99)00236-8
Ziemann, P.J., Atkinson, R., 2012. Kinetics, products, and mechanisms of secondary
organic aerosol formation. Chem. Soc. Rev. 41, 6582–6605.
doi:10.1039/C2CS35122F
Zuend, A., Seinfeld, J.H., 2012. Modeling the gas-particle partitioning of secondary
organic aerosol: the importance of liquid-liquid phase separation. AtmosChem
Phys 12, 3857–3882. doi:10.5194/acp-12-3857-2012
Page 79
69
6. Appendices
6.1. Appendix A: 1HNMR and HSQC Spectra for Simulated Organic PM
Figure 16. 1HNMR spectra for simulated organic PM with 66% organic content, showing δ values for the
target protons of benzylamine (downfield) and hexanoic acid (upfield) in fully acidified (top), fully basified
(middle) and neutral (1:1 hexanoic acid and benzylamine with no net strong base added) samples.
Page 80
70
Figure 17. 1HNMR spectra for simulated organic PM with 84% organic content, showing δ values for the
target protons of benzylamine (downfield) and hexanoic acid (upfield) in fully acidified (top), fully basified
(middle) and neutral (1:1 hexanoic acid and benzylamine with no net strong base added) samples.
Page 81
71
Figure 18. 1HNMR spectra for simulated organic PM with 95% organic content, showing δ values for the
target protons of benzylamine (downfield) and hexanoic acid (upfield) in fully acidified (top), fully basified
(middle) and neutral (1:1 hexanoic acid and benzylamine with no net strong base added) samples.
Page 82
72
Figure 19. HSQC spectra showing
the identification of target protons
(proton δ on the x-axis) by their
association with nearby carbon atoms
(carbon δ on the y-axis). Simulated
organic PM has 66% organic solvent
(top), 84% organic solvent (middle),
or 95% organic solvent (bottom).
Page 83
73
6.2. Appendix B: Titration Curves for Tobacco Smoke PM
Figure 20. Titration curves and slopes of titration curves for smoke PM extracted from the first five puffs
(plus lighting puff) of American Spirit and Basic brand cigarettes. Titration to the left of zero is with HCl
and titration to the right of zero is with lithium phenoxide.
Page 84
74
Figure 21. Titration curves and slopes of titration curves for smoke PM extracted from the first five puffs
(plus lighting puff) of Camel and Kool brand cigarettes. Titration to the left of zero is with HCl and
titration to the right of zero is with lithium phenoxide.
Page 85
75
Figure 23. Titration curves and and slopes of
titration curves for smoke PM extracted from the first
five puffs (plus lighting puff) of Marlboro brand
cigarettes. Titration to the left of zero is with HCl and
titration to the right of zero is with lithium phenoxide.
Figure 22. Titration curve and slope of
titration curve for a blank using the
extraction solvent in an empty sampling
bag. Titration to the left of zero is with
HCl and titration to the right of zero is
with lithium phenoxide.
Net strong base added (µeq)
Page 86
76
6.3. Appendix C: 1HNMR Data for Acetic Acid and Nicotine in 95% IPA
In 98% IPA, the pKa values of organic acids increase to such an extent that they no
longer protonate bases such as nicotine in approximately neutral solutions. The pKa of
acetic acid increases from 4.75 in water to 11.35 in pure IPA (Bosch et al., 1995). The
pKa of nicotine in IPA is not precisely known, but the following NMR data demonstrates
that acetic acid does not protonate nicotine at a 1:1 concentration in a 95% IPA solution.
Figure 24. Free base and monoprotonated forms of nicotine
Whether nicotine is in the free base or monoprotonated form can be determined by
subtracting the NMR frequencies (δ) of two of its protons (2’ and 5 in Figure 23) to
obtain a Δδ (Barsanti et al., 2007). Protonation is indicated by a shift of proton 2’
downfield relative to proton 5 (smaller Δδ), and fully-protonated and fully-unprotonated
bounds can be determined by the addition of excess acid and excess base, respectively.
1HNMR spectra of nicotine alone and nicotine/acetic acid d-4 show similar Δδ values
with and without the addition of acid, demonstrating that a stronger acid than acetic acid
(HCl) is required in both cases to achieve protonation of nicotine (Figure 25, Figure 26).
Page 87
77
Figure 25. 1HNMR spectra for nicotine in 95% IPA. Proton 2’ can be seen moving downfield relative to the
proton 5 with the addition of acid. In the top spectrum, nicotine is fully unprotonated, with Δδ = 7.42 - 3.16
= 4.26; in the bottom spectrum, nicotine is fully protonated by HCl, with Δδ = 7.66 – 4.64 = 3.02.
Proton 5
Proton 2’
Page 88
78
Figure 26. 1HNMR spectra for nicotine and acetic acid-d4 in 95% IPA. Proton 2’ can be seen moving
downfield relative to the proton 5 with the addition of acid. In the top spectrum, Δδ = 7.41 - 3.25 = 4.16; in
the bottom spectrum, Δδ = 7.57 – 4.58 = 2.99.
Proton 5
Proton 2’
Page 89
79
6.4. Appendix D: Ion Chromatograms
Figure 27. Ion chromatograms for anion standards at five concentrations used to construct calibration
curves. Lactate (bottom) was measured as a separate standard due to its poor peak resolution in a mixed
standard.
Page 90
80
Figure 28. Anion chromatograms for smoke PM extracted from the first five puffs (plus lighting puff) for American Spirit brand cigarettes from
initial sample (top) and acidified sample (bottom). X-axis = run-time and y-axis = signal in uS. Retention times are given for each analyte
peak.
Page 91
81
Figure 29. Anion chromatograms for smoke PM extracted from the first five puffs (plus lighting puff) for Basic brand cigarettes from initial
sample (top) and acidified sample (bottom). X-axis = run-time and y-axis = signal in uS. Retention times are given for each analyte peak.
Page 92
82
Figure 30. Anion chromatograms for smoke PM extracted from the first five puffs (plus lighting puff) for Camel brand cigarettes from initial
sample (top) and acidified sample (bottom). X-axis = run-time and y-axis = signal in uS. Retention times are given for each analyte peak.
Page 93
83
Figure 31. Anion chromatograms for smoke PM extracted from the first five puffs (plus lighting puff) for Kool brand cigarettes from initial
sample (top) and acidified sample (bottom). X-axis = run-time and y-axis = signal in uS. Retention times are given for each analyte peak.
Page 94
84
Figure 32. Anion chromatograms for smoke PM extracted from the first five puffs (plus lighting puff) for Marlboro brand cigarettes from initial
sample (top) and acidified sample (bottom). X-axis = run-time and y-axis = signal in uS. Retention times are given for each analyte peak.
Page 95
85
Figure 33. Anion (top) and cation (bottom) chromatograms for initial (black line) and acdified (blue line) blanks made using the extraction
solvent to extract from an empty sampling bag. A trace amount of sodium chloride is detected.
Page 96
86
Figure 34. Ion chromatograms for cation standards at seven concentrations used to construct the calibration curve.
Page 97
87
Figure 35. Cation chromatograms for smoke PM extracted from the first five puffs (plus lighting puff) for American Spirit brand cigarettes
from initial sample (top) and acidified sample (bottom). X-axis = run-time and y-axis = signal in uS. Retention times are given for each analyte
peak.
Page 98
88
Figure 36. Cation chromatograms for smoke PM extracted from the first five puffs (plus lighting puff) for Basic brand cigarettes from initial
sample (top) and acidified sample (bottom). X-axis = run-time and y-axis = signal in uS. Retention times are given for each analyte peak.
Page 99
89
Figure 37. Cation chromatograms for smoke PM extracted from the first five puffs (plus lighting puff) for Camel brand cigarettes from initial
sample (top) and acidified sample (bottom). X-axis = run-time and y-axis = signal in uS. Retention times are given for each analyte peak.
Page 100
90
Figure 38. Cation chromatograms for smoke PM extracted from the first five puffs (plus lighting puff) for Kool brand cigarettes from initial
sample (top) and acidified sample (bottom). X-axis = run-time and y-axis = signal in uS. Retention times are given for each analyte peak.
Page 101
91
Figure 39. Cation chromatograms for smoke PM extracted from the first five puffs (plus lighting puff) for Marlboro brand cigarettes from
initial sample (top) and acidified sample (bottom). X-axis = run-time and y-axis = signal in uS. Retention times are given for each analyte
peak.