Page 1
Acid-phase and Two-phase Codigestion of FOG in Municipal Wastewater
Ross A. Varin
Thesis submitted to the faculty of the Virginia Polytechnic Institute and State University in
partial fulfillment of the requirements for the degree of
Master of Science
In
Environmental Engineering
John T. Novak, Chair
Charles B. Bott
Gregory D. Boardman
May 13th
, 2013
Blacksburg, VA
Keywords: Codigestion, two-phase anaerobic digestion, acid-phase anaerobic digestion
Page 2
Acid-phase and Two-phase Codigestion of FOG in Municipal Wastewater
Ross A. Varin
Abstract
Acidogenic codigestion of fats, oils, and greases (FOG) was studied at 37°C using
suspended sludge digesters operated as sequencing batch reactors (SBRs). Volatile fatty acid
(VFA) production was found to increase with larger FOG loading rates, although this increase
was insignificant compared the theoretical VFA production from FOG addition. Long chain fatty
acids (LCFAs) were found to have accumulated in the reactor vessel in semi-solid balls that were
primarily composed of saturated LCFAs.
Adding high FOG loadings to an APD not acclimated to LCFAs allowed for a mass
balance calculation and resulted in near complete saturation of unsaturated LCFAs and
significant accumulation of LCFA material in the digester, which was found to be mostly 16:0,
18:0, and 18:1. While 18:2 and 18:3 LCFAs were nearly completely removed, 18:0 and 14:0
LCFAs were produced, most likely from the degradation of 18:2 and 18:3 LCFAs. The APD pH
was found to have a significant impact on the amount of accumulated LCFA material present,
with higher pH levels resulting in less accumulated material.
Two-phase codigestion of FOG was also studied using an APD followed by gas-phase
(GPD) digesters. The two-phase systems were compared by FOG addition to the APD versus
GPD. FOG addition to the APD resulted in 88% destruction of LCFAs, whereas FOG addition to
the GPD resulted in 95% destruction of LCFAs. Accumulated LCFAs in the APD receiving FOG
were composed mostly of stearic acid (18:0). The low pH of the APD is likely the cause of
LCFA accumulation due to saturation of unsaturated LCFAs.
Page 3
iii
Acknowledgements
I would like to thank my advisor, Dr. John Novak, for his mentorship and patience as
well as allowing me freedom of direction for this work. I would also like to thank Dr. Charles
Bott for the opportunity to work on this project and Hampton Roads Sanitation District for the
funding to do so. I also thank Dr. Greg Boardman for his time and input.
I would also like to thank Julie Petruska and Jody Smiley for their expertise and guidance
in the lab, as well as Beth Lucas and Betty Wingate for their administrative assistance.
I would also like to thank my fellow researchers: Evan Bowles and Jen Miller for their
mentorship in lab-scale digestion, Abhinav Gupta, Natalie Driskill, Sudhir Pathak, Renzun Zhao,
and Pallavi Bishnoi for their assistance in the lab, and a special thanks to Kuang Zhu without
whom this work may not have come to fruition.
Finally, I would like thank my family and friends for their tireless support during this
endeavor.
Page 4
iv
Table of Contents
Abstract .......................................................................................................................................... ii
Acknowledgements ...................................................................................................................... iii
Table of Contents ......................................................................................................................... iv
List of Figures ............................................................................................................................... vi
List of Tables .............................................................................................................................. viii
Introduction ................................................................................................................................... 1
Literature Review ......................................................................................................................... 3
Two-Phase Digestion .................................................................................................................. 3
FOG Addition ............................................................................................................................. 4
Summary ................................................................................................................................... 10
References ................................................................................................................................. 11
Acidogenesis and Two-phase Codigestion of Fats, Oils, and Greases and Municipal
Biosolids ....................................................................................................................................... 14
Abstract ..................................................................................................................................... 14
Introduction ............................................................................................................................... 14
Materials and Methods .............................................................................................................. 17
Results ....................................................................................................................................... 20
Discussion ................................................................................................................................. 28
Page 5
v
Conclusions ............................................................................................................................... 30
References ................................................................................................................................. 30
Degradation and Accumulation of Long Chain Fatty Acids in Acid-phase Codigestion of
Municipal Biosolids..................................................................................................................... 33
Abstract ..................................................................................................................................... 33
Introduction ............................................................................................................................... 33
Materials and Methods .............................................................................................................. 35
Results ....................................................................................................................................... 38
................................................................................................................................................... 46
Discussion ................................................................................................................................. 47
Conclusion ................................................................................................................................ 49
References ................................................................................................................................. 50
Page 6
vi
List of Figures
Figure 1 - Visual representation of thermodynamic free energy analysis with relative changes in
free energies (Lalman and Bagley 2001), Used under fair use, 2013 ............................................. 6
Figure 2 - Total experimental and theoretical VFA production (top) and pH (bottom) as a
function of FOG addition .............................................................................................................. 21
Figure 3 - Accumulated LCFAs (circled) seen floating near the liquid surface of a digester
receiving FOG; ruler shown in inches .......................................................................................... 22
Figure 4 - Schematic representation of the two-phase digestions systems receiving FOG addition
to the APD (right) and to the GPD (left)....................................................................................... 23
Figure 5 - Daily gas production in two-phase system................................................................... 24
Figure 6 - LCFA degradation in both two-phase systems as COD (top) and % of COD
concentration in feed (bottom) ...................................................................................................... 26
Figure 7 - Accumulated LCFAs after drying at 37°C from the FTA System APD (left), the FTG
System GPD (middle), and the FTA System GPD (right) (ruler shown in inches) ...................... 27
Figure 8 - Fate of non-degraded LCFAs in the FTA System (left) and the FTG System (right) . 28
Figure 9 - LCFA removal efficiency in the FTA System APD as a percentage of the individual
LCFA in the feed; negative values indicate production and accumulation .................................. 29
Figure 10 - pH and total VFA concentration in the effluent of both digesters during the high FOG
loading on a non-acclimated digester study .................................................................................. 39
Figure 11 - Degradation of LCFAs in g COD (top) and % of individual LCFA added (bottom)
with negative numbers indicating production ............................................................................... 41
Figure 12 - Fate of non-degraded LCFAs in 60% FOG digester (sum over entire sampling
campaign) ...................................................................................................................................... 42
Page 7
vii
Figure 13 - Non-degraded LCFAs in the effluents (top) and accumulated FOG (bottom) from
digesters receiving 20% FOG (mg COD) ..................................................................................... 45
Figure 14 - Degradation of LCFAs in g COD (top) and % of individual LCFA added (bottom)
with negative numbers indicating production ............................................................................... 46
Figure 15 - Fate of non-degraded LCFAs in the digesters receiving FOG ................................... 47
Page 8
viii
List of Tables
Table 1 - Characteristics of Digester Feed Components .............................................................. 17
Table 2 – Average of total VFA concentration and pH in the digester effluent for each FOG
loading........................................................................................................................................... 20
Table 3 - LCFA content of the feed, average APD effluent, and average GPD effluent for both
systems (mg/l COD) ..................................................................................................................... 25
Table 4 - Characteristics of Digester Feed Components .............................................................. 36
Table 5 - Operating parameters for FOG codigestion at controlled pH study .............................. 37
Table 6 - LCFA content (mg/l COD) in feed components, digester effluents, and accumulated
LCFA material (normalized to feed volume) for 60% FOG loading on a non-acclimated digester
study (effluent as average of all samples) ..................................................................................... 40
Table 7 - Total VFA concentrations and pH from digester effluent, average of all 10 samples .. 43
Table 8 - LCFA content in feed components and digester effluents (mg/l COD) for pH study
(effluent as average of all samples) .............................................................................................. 44
Page 9
1
Introduction
Two-phase digestion (TPD) is an advanced anaerobic, biological treatment system for
treating sludges from municipal wastewater treatment plants that is growing in popularity due to
its ability to produce more biogas over a conventional digestion system. Codigestion of fats, oils,
and grease (FOG) is also becoming more widely practiced because it can increase biogas
production from anaerobic digestion with municipal wastewater sludges. The combination of
these two practices is not as well characterized as each process individually.
The following literature review describes the research that has been conducted to better
understand TPD and FOG codigestion processes. The major conclusions that were drawn are that
FOG addition to the front end of a TPD system, the acid-phase digester (APD), will not result in
degradation of the primary components in FOG, long chain fatty acids (LCFAs). The short SRT
characteristic of an APD washes out the microbial communities responsible for the syntrophic
interactions that make degradation of FOG thermodynamically feasible. However, the APD can
serve to saturate any unsaturated LCFAs in the FOG and convert 18-carbon chain LCFAs to 16-
carbon chain LCFAs. This reduces inhibition of methanogenesis because unsaturated LCFAs are
more inhibitory to methanogens. In addition, shorter carbon chains are essentially one step
further down the degradation pathway and will be degraded faster.
The first manuscript presented, Acidogenesis and Two-phase Codigestion of Fats, Oils,
and Greases and Municipal Biosolids, studies the effect of FOG codigestion on APDs and a TPD
system. While greater FOG loadings on the APD resulted in increased volatile fatty acid (VFA)
production, this increase was insignificant compared to the theoretical VFA yield from the FOG
addition. LCFAs were also found to accumulate into semi-solid balls that floated at the liquid
Page 10
2
surface and were not removed through digester wasting. Two TPD systems were compared by
adding FOG to the APD in one system and to the GPD in the other. This allowed a comparison
of whether FOG should be added to the APD or GPD in a TPD system. Addition to the APD was
found to produce more gas, while addition to the GPD resulted in higher destruction of LCFAs.
Accumulated LCFA material was found in all digester receiving FOG, including the GPD being
fed with the effluent from the APD receiving FOG. While gas production was greater in the
system receiving FOG in the APD, significant accumulation of LCFA material in the APD
would cause detrimental operational problems in a full scale wastewater facility.
The second manuscript presented, Degradation and Accumulation of LCFAs in Acid-
phase Codigestion of Municipal Biosolids, explores the mechanisms of degradation and
accumulation of LCFAs in APDs receiving FOG. A high loading rate of FOG was added to a
digester previously not acclimated to LCFAs to perform a mass balance calculation on the
system and better understand what processes are taking place in FOG codigestion in APD
systems. LCFAs were again found to accumulate significantly and LCFAs with zero or one
double-bond were found to preferentially attached to the accumulated LCFA mass floating in the
digester, instead of passing through the system in the wasted effluent. This prompted a study into
the role of pH in accumulation and degradation of LCFAs in the APD system. While pH did not
affect degradation of LCFAs, it had a large impact on accumulation. Higher pH levels
corresponded to much less accumulation of LCFAs in the digester and at a neutral pH, no
accumulated LCFAs were found. Several theories are discussed that try to explain why this
occurred.
Page 11
3
Literature Review
Two-Phase Digestion
Two-phase digestion (TPD) is an advanced anaerobic, biological treatment system for
treating sludges from municipal wastewater treatment plants. TPD splits the individual anaerobic
microbial processes into two parts, allowing for each to operate more efficiently. This results in a
smaller reactor footprint, a shorter overall retention time, and more control over the entire
biosolids treatment process. TPD is considered an advanced digestion system because it is more
technically complex, resulting in better performance than conventional digestions processes.
Anaerobic digestion is a two-step process that involves two distinct microbial
communities which do not reach optimal performance when they coexist in the same
environment (Ghosh et al. 1975). TPD spatially separates hydrolysis and acidogenesis from
methanogenesis to achieve increased methane production and solids solubilization at half the
detention time of a conventional single-stage anaerobic digester (Ghosh et al. 1975). The first
digester in the TDP system is called the acid-phase, hydrolysis reactor, or fermenter and will be
referred to here as acid-phase digester (APD). The APD is of more interest here since the
characteristics of the second digester in which methanogenesis occurs, or gas-phase digester
(GPD), are similar to a conventional single-phase digester where the desire is to optimize
methane production.
Massey and Pohland (1978) found that near-complete inhibition of methanogenesis can
be achieved in the APD with kinetic control via manipulation of the solids retention time (SRT),
and that this allows for more stability and control when operating a TPD system, even with a
complex substrate. In this environment, hydrolysis and acidogenesis are taking place
simultaneously with the main products being volatile fatty acids (VFAs), mainly acetic and
Page 12
4
propionic acid (Eastman and Ferguson 1981). In continuous and batch experiments degrading
primary clarifier biosolids at 35°C, Eastman and Ferguson (1981) also found that hydrolysis is
the rate limiting step, while both the hydrolysis and acidogenesis are significantly affected by
pH. At an SRT of 36 hours, VFA production was 42% higher at pH 6.67 than at pH 5.1. In
addition, Eastman and Ferguson (1981) found the degradation of carbohydrates and nitrogenous
material to be 70% and 55%, respectively, while lipids were not degraded at all. More recent
studies have found similar results (Elefsiniotis and Oldham 1994, Ghosh et al. 1995). The
optimal parameters for APD operation have been widely studied and discussed, and summarized
by Demirel and Yenigün (2002). Their study found that for complex substrates, HRT was often
reported to be the most important parameter influencing VFA production and COD
solubilization, with reported optimal values usually falling between 0.5 – 3 days. Demirel and
Yenigün (2002) also found disagreement about the optimal pH for hydrolysis, but operating pHs
have generally been reported as being best between 5.5 - 7.0. A more recent study by Wu et al.
(2009) found that 5.0 was an optimal pH for COD solubilization over the range of pH 4.0 – 7.0,
but that COD solubilization is equivalent at pHs 5.0 and 8.0, and the rate of hydrolysis further
increases from pH 8.0 up to 10.0. Demirel and Yenigün (2002) also found that temperature was
frequently concluded to be an important factor, with 30-35°C being reported most often as
optimal.
FOG Addition
Mechanism of Degradation
Fats, oils, and greases (FOG) are a complex, high strength, organic waste material from a
variety of sources such as food processing facilities and restaurants. The most notable
Page 13
5
constituents of FOG are triglyceride esters, which are rapidly hydrolyzed to produce long chain
fatty acids (LCFAs) during degradation (Heukelekian and Mueller 1958). An early study into
anaerobic degradation of LCFAs was conducted by Novak and Carlson (1970). They found that
the primary mechanism of degradation is β-oxidation, which produces a chain with n-2 carbons
and an acetate molecule, as shown below (from Kim et al. (2004a)).
CH CH nC H H CH CH n C H CH C H H
Longer chains were found to take longer to degrade, and unsaturated LCFAs degraded more
quickly than the saturated versions. However, it was found that unsaturated LCFAs need to first
be saturated before β-oxidation can take place.
More recent studies have found that saturation is not necessarily required for unsaturated
LCFAs to undergo β-oxidation. Oleic acid (18:1) degrades up to 100 mg/l with palmitic (16:0)
and myristic (14:0) acids being major by-products with no stearic acid (18:0) produced (Lalman
and Bagley 2001). The study also found that 18:0 degrades with no byproducts in batch assays
fed with glucose, but takes a significant amount of time to do so (roughly 40% degradation after
50 days). In a separate study, linoleic acid (18:2) was found to degrade completely, but forms
18:1 and palmitoleic acid (16:1) as transient products that were degraded further to 16:0 and 14:0
as by-products; 18:0 was not found as an intermediate (Lalman and Bagley 2000). These studies
show that β-oxidation is not necessarily dependent on complete saturation because 18:0 was not
found as a product of degradation of 18:1 or 18:2 while 16:0 and 14:0 were found to be by-
products. This doesn’t necessarily prove that 18:0 was not formed as a brief intermediate, but
given the slow rate of degradation of 18:0, it is likely that 18:0 is not produced (Lalman and
Bagley 2001). In addition, Pereira et al. (2002) found that 16:0 is the major intermediate of the
degradation of 18:1, accounting for up to 80% of the LCFA intermediates. More recent studies
Page 14
6
agree with these results (Pereira et al. 2005, Palatsi et al. 2012). A thermodynamic analysis of
free energies (shown in Figure 1) agrees with the observed results presented in these studies,
although it is important to note that the free energies presented were calculated at 25°C and a pH
of 7 (Lalman and Bagley 2001).
Figure 1 - Visual representation of thermodynamic free energy analysis with relative changes in free energies
(Lalman and Bagley 2001), Used under fair use, 2013
Adsorption and Precipitation
FOG has been found to accumulate in a solid or semi-solid form in codigestion systems,
eventually leading to digester failure by sludge flotation and washout of sludge granules if not
removed from granular sludges (Hwu et al. 1998a, Jeganathan et al. 2006). This is significant
because some studies have found LCFA accumulation to take place quickly, within 24 hours
(Hanaki et al. 1981). Hwu et al. (1998a) also found that longer SRTs can decrease LCFA
adsorption. This accumulation can occur due to entrapment of LCFAs in biomass flocs,
adsorption onto microbe cells, or precipitation with divalent ions (Pereira et al. 2005).
Accumulation is most likely due to some combination of each of these three mechanisms. Hwu
et al. (1998b) determined that biosorption is significant and that it is required for degradation of
18:1 to occur. Pereira et al. (2005) found that precipitation occurred in inactivated (via autoclave)
Page 15
7
sludge, but that biological activity accounts for 20-38% of the total COD accumulated, with the
rest being due to precipitation by divalent cations. Several studies have determined 16:0 to be the
main LCFA adsorbed to biomass in enhanced granular sludge bed (EGSB) digesters degrading
16:0 or 18:1 (Pereira et al. 2005, Palatsi et al. 2012, Jeganathan et al. 2006). It is important to
note that these studies were all carried out using granular sludge in UASB or EGSB systems.
Several other experiments were conducted using continuous or semi-continuous digesters that
reported increased gas production from FOG addition with no mention of accumulated FOG in
the digesters, although all of them saw a lag in methane production (Kabouris et al. 2008,
Kabouris et al. 2009a, Davidsson et al. 2008, Luostarinen et al. 2009). This indicates the
significance of adsorption when discussing inhibition of anaerobic digestion processes by
LCFAs.
Mechanisms of Inhibition
While FOG addition can increase biogas production, it can also be inhibitory to
acidogens (Lalman and Bagley 2004), acetoclastic methanogens (Lalman and Bagley 2000,
Palatsi et al. 2012, Hanaki et al. 1981, Koster and Cramer 1987), and β-oxidizers (Lalman and
Bagley 2000, Pereira et al. 2002, Kim et al. 2004b). Acetoclastic methanogens seem to be the
most sensitive group to inhibition by LCFAs (Lalman and Bagley 2002). Hanaki et al. (1981)
found that LCFAs caused a lag in gas production for acetoclastic methanogens, while
hydrogenotrophic methanogens did not lag, but the latter experienced a lower gas production rate
compared to the control receiving only acetate. It was also observed that most of the LCFAs
adsorbed to the biomass solids, showing that solid, sorbed LCFAs are most likely inhibitory,
although addition of CaCl2 effectively mitigated this inhibition. Koster and Cramer (1987)
Page 16
8
reported similar results and further found a mixture of LCFAs to be more toxic than one single
LCFA. This was confirmed by Kim et al. (2004b), who found that unsaturated LCFAs are more
inhibitory to acetoclastic methanogens and propionate degradation than saturated LCFAs.
Lalman and Bagley (2002) found similar results and concluded that mixtures of LCFAs are more
inhibitory to butyrate consumption than individual LCFAs. Pereira et al. (2002) concluded that
the presence of 18:1 was inhibitory to the degradation of 16:0.
Koster and Cramer (1987) proposed that LCFA inhibition is caused by microbial toxicity,
although more recent studies have found evidence to the contrary (Lalman and Bagley 2001,
2000, Pereira et al. 2005, Palatsi et al. 2012, Lalman and Bagley 2002, Pereira et al. 2004).
Acetoclastic methanogens in a system fed with glucose can be completely inhibited by 18:1 or
18:2 LCFAs, while hydrogenotrophic methanogens in the same system show little to no
inhibition (Lalman and Bagley 2001, 2000). This also means that β-oxidation of LCFAs is not
likely to be inhibited by high partial pressures of hydrogen gas, since hydrogenotrophic
methanogens are not inhibited and will remove hydrogen gas from the system (Beccari et al.
1998) These studies are in agreement with Hanaki et al. (1981) and suggest that the mechanism
of inhibition is transport limitation through the cell wall caused by LCFA adsorption onto the
biomass. Because the H2 molecule is smaller than acetate, it more easily diffuses through the
LCFA layer into the cell so methanogens utilizing hydrogen can still absorb substrate, while
acetogenic methanogens starve because acetate is too large to diffuse through the adsorbed
LCFA layer and into the cell (Pereira et al. 2004). This is further supported by the fact that
methanogen inhibition is a reversible process and even though mineralization occurs,
biodegradation can still take place (Pereira et al. 2005, Palatsi et al. 2012). Degradation of
adsorbed 16:0 in an EGSB was inhibited by 18:1 LCFA, but was enhanced by stirring (Pereira et
Page 17
9
al. 2002). This study also recommended suspended sludge digesters over granular sludge due to
its better performance for LCFA accumulation and degradation.
FOG Addition to APD/Two-Phase/Fermenter
The key differences between an APD and a conventional anaerobic digester with respect
to LCFA degradation are that the APD lacks methanogens and has a lower pH. Lipid degradation
is only 10% in the APD at pH 5.6 (Ghosh et al. 1995). This is most likely because β-oxidation is
not thermodynamically favorable (Lalman and Bagley 2001), so syntrophic microbial
relationships are required to drive the reaction forward (Palatsi et al. 2012, Fox and Pohland
1994). The small amount of lipid degradation observed by some studies could be attributed to
hydrogenotrophic methanogens, which are known to have faster growth rates than acetoclastic
methanogens (Ghosh et al. 1995, Beccari et al. 1998). Therefore, the primary role of the two-
phase digestion system for the anaerobic co-digestion of FOG is to use the APD as a method of
saturating unsaturated LCFAs and converting 18-carbon chains to 16:0 in order to mitigate
inhibition in the methanogenic digester where further β-oxidation takes place (Kim et al. 2004a,
Beccari et al. 1998, Komatsu et al. 1991, Kim and Shin 2010).
Komatsu et al. (1991) added LCFAs to a suspended sludge two-phase digestion system
and found that inhibition occurs in the APD, but that unsaturated 18-chain LCFAs became
partially saturated. This was found to decrease inhibition of β-oxidation and methanogenesis in
the methane reactor compared to a single-phase system. It was also determined that pH 6.0 was
worse for acidification and β-oxidation in the APD than pH of 7.0. It was proposed that the low
pH converted the LCFAs to a non-ionized form, making them less soluble. Similar experiments
have been conducted, but achieved much more complete saturation of unsaturated LCFAs in the
Page 18
10
APD, although this was probably due to the longer SRT used (3.7 days), allowing growth of
hydrogenotrophic methanogens (Beccari et al. 1998). In these studies, as discussed previously,
18:1 and 18:2 LCFAs were added to APDs, but 16:0 was found in the effluent while 18:0 was
absent. More recent studies using both suspended and granular sludge for the methane reactor
have found similar results, although individual LCFAs were not quantified (Kim and Shin 2010,
Kabouris et al. 2009b). Miron et al. (2000) conducted experiments with suspended sludge
digesters at a variety of SRTs down to 2 days, with any below 8 days being only the acidogenic
phase of digestion. The study found that the pH of digesters operating below an 8 day SRT was
just below 5.0 and that saturated LCFAs with 12-, 14-, 16-, and 18-carbon chain lengths
accumulated while unsaturated LCFAs with 16- and 18-carbon chain lengths were easily
degraded. The accumulation of 18:0 could be due to high partial pressures of hydrogen gas
(Miron et al. 2000) or high concentrations of hydrogen ions because the pH was significantly
lower than the other studies mentioned here.
Summary
While both TPD and FOG addition can increase biogas production from anaerobic
digestion processes, the combination of these practices is complex. Because LCFAs are nonpolar
and require a long time to degrade, addition of FOG to the APD of a two-phase system
theoretically doesn’t result in any degradation of the FOG. If the APD is used as a pre-treatment
system to saturate the more inhibitory unsaturated LCFAs, an increase in biogas production
could be achieved. However, operational issues can occur due to this practice.
There is little agreement on the mechanisms of LCFA degradation or inhibition,
particularly when FOG is added to a two-phase system. Because of the large theoretical benefit
Page 19
11
of this practice, further study should focus on the mechanisms by which degradation, adsorption,
precipitation, and inhibition occur so that we may better understand how to improve current TPD
and FOG addition practices.
References
Ghosh, S., Conrad, J.R. and Klass, D.L. (1975) Anaerobic Acidogenesis of Wastewater Sludge.
Journal (Water Pollution Control Federation) 47(1), 30-45.
Massey, M.L. and Pohland, F.G. (1978) Phase Separation of Anaerobic Stabilization by Kinetic
Controls. Journal (Water Pollution Control Federation) 50(9), 2204-2222.
Eastman, J.A. and Ferguson, J.F. (1981) Solubilization of Particulate Organic Carbon during the
Acid Phase of Anaerobic Digestion. Journal (Water Pollution Control Federation) 53(3), 352-
366.
Elefsiniotis, P. and Oldham, W. (1994) Effect of HRT on Acidogenic Digestion of Primary
Sludge. Journal of Environmental Engineering 120(3), 645-660.
Ghosh, S., Buoy, K., Dressel, L., Miller, T., Wilcox, G. and Loos, D. (1995) Pilot- and Full-
Scale Two-Phase Anaerobic Digestion of Municipal Sludge. Water Environment Research 67(2),
206-214.
Demirel, B. and Yenigün, O. (2002) Two-phase anaerobic digestion processes: a review. Journal
of Chemical Technology & Biotechnology 77(7), 743-755.
Wu, H., Yang, D., Zhou, Q. and Song, Z. (2009) The effect of pH on anaerobic fermentation of
primary sludge at room temperature. Journal of Hazardous Materials 172(1), 196-201.
Heukelekian, H. and Mueller, P. (1958) Transformation of Some Lipids in Anaerobic Sludge
Digestion. Sewage and industrial wastes 30(9), 1108-1120.
Novak, J.T. and Carlson, D.A. (1970) The Kinetics of Anaerobic Long Chain Fatty Acid
Degradation. Water Pollution Control Federation 42(11), 1932-1943.
Kim, S.-H., Han, S.-K. and Shin, H.-S. (2004a) Two-phase anaerobic treatment system for fat-
containing wastewater. Journal of Chemical Technology & Biotechnology 79(1), 63-71.
Lalman, J.A. and Bagley, D.M. (2001) Anaerobic degradation and methanogenic inhibitory
effects of oleic and stearic acids. Water Res 35(12), 2975-2983.
Lalman, J.A. and Bagley, D.M. (2000) Anaerobic degradation and inhibitory effects of linoleic
acid. Water Res 34(17), 4220-4228.
Page 20
12
Pereira, M.A., Pires, O.C., Mota, M. and Alves, M.M. (2002) Anaerobic degradation of oleic
acid by suspended and granular sludge: identification of palmitic acid as a key intermediate.
Water Science and Technology 45, 6.
Pereira, M.A., Pires, O.C., Mota, M. and Alves, M.M. (2005) Anaerobic biodegradation of oleic
and palmitic acids: Evidence of mass transfer limitations caused by long chain fatty acid
accumulation onto the anaerobic sludge. Biotechnol Bioeng 92(1), 15-23.
Palatsi, J., Affes, R., Fernandez, B., Pereira, M.A., Alves, M.M. and Flotats, X. (2012) Influence
of adsorption and anaerobic granular sludge characteristics on long chain fatty acids inhibition
process. Water Res 46(16), 5268-5278.
Hwu, C.-S., van Lier, J.B. and Lettinga, G. (1998a) Physicochemical and biological performance
of expanded granular sludge bed reactors treating long-chain fatty acids. Process Biochemistry
33(1), 75-81.
Jeganathan, J., Nakhla, G. and Bassi, A. (2006) Long-Term Performance of High-Rate
Anaerobic Reactors for the Treatment of Oily Wastewater. Environmental Science &
Technology 40(20), 6466-6472.
Hanaki, K., Matsuo, T. and Nagase, M. (1981) Mechanism of inhibition caused by long-chain
fatty acids in anaerobic digestion process. Biotechnol Bioeng 23(7), 1591-1610.
Hwu, C.-S., Tseng, S.-K., Yuan, C.-Y., Kulik, Z. and Lettinga, G. (1998b) Biosorption of long-
chain fatty acids in UASB treatment process. Water Res 32(5), 1571-1579.
Kabouris, C., J., Tezel, U., Pavlostathis, S.G., Engelmann, M., Todd, A.C. and Gillette, R.A.
(2008) The Anaerobic Biodegradability of Municipal Sludge and Fat, Oil, and Grease at
Mesophilic Conditions. Water Environment Research 80(3), 212-221.
Kabouris, J.C., Tezel, U., Pavlostathis, S.G., Engelmann, M., Dulaney, J., Gillette, R.A. and
Todd, A.C. (2009a) Methane recovery from the anaerobic codigestion of municipal sludge and
FOG. Bioresour Technol 100(15), 3701-3705.
Davidsson, Å., Lövstedt, C., la Cour Jansen, J., Gruvberger, C. and Aspegren, H. (2008) Co-
digestion of grease trap sludge and sewage sludge. Waste Management 28(6), 986-992.
Luostarinen, S., Luste, S. and Sillanpää, M. (2009) Increased biogas production at wastewater
treatment plants through co-digestion of sewage sludge with grease trap sludge from a meat
processing plant. Bioresour Technol 100(1), 79-85.
Lalman, J. and Bagley, D. (2004) Extracting long-chain fatty acids from a fermentation medium.
Journal of the American Oil Chemists' Society 81(2), 105-110.
Koster, I.W. and Cramer, A. (1987) Inhibition of Methanogenesis from Acetate in Granular
Sludge by Long-Chain Fatty Acids. Applied and Environmental Microbiology 53(2), 7.
Page 21
13
Kim, S., Han, S. and Shin, H. (2004b) Kinetics of LCFA inhibition on acetoclastic
methanogenesis, propionate degradation and beta-oxidation. JOURNAL OF
ENVIRONMENTAL SCIENCE AND HEALTH PART A-TOXIC/HAZARDOUS
SUBSTANCES & ENVIRONMENTAL ENGINEERING 39, 13.
Lalman, J. and Bagley, D.M. (2002) Effects of C18 long chain fatty acids on glucose, butyrate
and hydrogen degradation. Water Res 36(13), 3307-3313.
Pereira, M.A., Sousa, D.Z., Mota, M. and Alves, M.M. (2004) Mineralization of LCFA
associated with anaerobic sludge: Kinetics, enhancement of methanogenic activity, and effect of
VFA. Biotechnol Bioeng 88(4), 502-511.
Beccari, M., Majone, M. and Torrisi, L. (1998) Two-reactor system with partial phase separation
for anaerobic treatment of olive oil mill effluents. Water Science and Technology 38, 8.
Fox, P. and Pohland, F.G. (1994) Anaerobic Treatment Applications and Fundamentals:
Substrate Specificity during Phase Separation. Water Environment Research 66(5), 716-724.
Komatsu, T., Hanaki, K. and Matsuo, T. (1991) PREVENTION OF LIPID INHIBITION IN
ANAEROBIC PROCESSES BY INTRODUCING A 2-PHASE SYSTEM. Water Science and
Technology 23, 12.
Kim, S.-H. and Shin, H.-S. (2010) Enhanced Lipid Degradation in an Upflow Anaerobic Sludge
Blanket Reactor by Integration with an Acidogenic Reactor. Water Environment Research 82(3),
267-272.
Kabouris, J.C., Tezel, U., Pavlostathis, S.G., Engelmann, M., Dulaney, J.A., Todd, A.C. and
Gillette, R.A. (2009b) Mesophilic and Thermophilic Anaerobic Digestion of Municipal Sludge
and Fat, Oil, and Grease. Water Environment Research 81(5), 476-485.
Miron, Y., Zeeman, G., van Lier, J.B. and Lettinga, G. (2000) The role of sludge retention time
in the hydrolysis and acidification of lipids, carbohydrates and proteins during digestion of
primary sludge in CSTR systems. Water Res 34(5), 1705-1713.
Page 22
14
Acidogenesis and Two-phase Codigestion of Fats, Oils, and
Greases and Municipal Biosolids
Abstract
Acidogenic codigestion of fats, oils, and greases (FOG) was studied using suspended sludge
digesters operated as sequencing batch reactors (SBRs). The digesters were maintained at a 2-
day retention time and at 37°C. Volatile fatty acid (VFA) production was found to increase with
larger FOG loading rates. This increase was insignificant compared to the theoretical VFA
production from FOG addition due to inhibition. Long chain fatty acids (LCFAs) were found to
have accumulated in the reactor vessel in semi-solid balls that were primarily composed of
saturated LCFAs. Two-phase codigestion of FOG was studied at 37°C using SBRs as acid-phase
(APD) followed by gas-phase (GPD) digesters operated with 2-day and 15-day retention times,
respectively. The two-phase systems were compared by FOG addition to the APD versus GPD.
FOG addition to the APD resulted in 11.18 l-day-1
of biogas production and 88% destruction of
LCFAs, whereas FOG addition to the GPD resulted in 9.87 l-day-1
of gas production and 95%
destruction of LCFAs. Accumulated LCFAs were again found in the APD receiving FOG and
were composed mostly of stearic acid (18:0).
Introduction
Two-phase digestion (TPD) is an advanced anaerobic, biological treatment system for
treating sludges from municipal wastewater treatment plants that is growing in popularity due to
its ability to produce more biogas over a conventional digestion system. Codigestion of fats, oils,
and greases (FOG) is also becoming more widely practiced because it can increase biogas
production from anaerobic digestion with municipal wastewater sludges. The combination of
these two practices is not as well characterized as each process individually.
TPD spatially separates the individual anaerobic microbial processes into two phases,
acidogenesis followed by methanogenesis, allowing for each to operate more efficiently. This
results in a smaller reactor footprint, a shorter overall retention time, and more control over the
Page 23
15
entire biosolids treatment process. TPD is considered an advanced digestion system because it is
more technically complex, resulting in better solids destruction and biogas production than
conventional digestions processes. The acid-phase digester (APD) is the major difference
between TPD and conventional digestions systems. The APD utilizes a short solids retention
time (SRT) to kinetically inhibit methanogens so that hydrolysis and acidogenesis can take place
at a lower pH that is more conducive to these reactions.
FOG is a complex, high strength, organic waste material from a variety of sources such
as food processing facilities and restaurants. The most notable constituents of FOG are
triglyceride esters, which are rapidly hydrolyzed to produce long chain fatty acids (LCFAs)
during degradation (Heukelekian and Mueller 1958). LCFAs are commonly denoted by the
number of carbon atoms in the chain followed by the number of double bonds in the chain. For
example, oleic acid has an 18-carbon chain and one double bond so it is denoted as 18:1. An
early study into anaerobic degradation of LCFAs was conducted by Novak and Carlson (1970).
They found that the primary mechanism of degradation is β-oxidation and that unsaturated
LCFAs degraded more quickly than the saturated versions, although unsaturated LCFAs need to
first become saturated before β-oxidation can take place.
More recent studies have found that saturation is not necessarily required for unsaturated
LCFAs to undergo β-oxidation. Studies have found that palmitic (16:0) and myristic (14:0) acids
are the major by-products of oleic acid (18:1) degradation (Lalman and Bagley 2001), and that
18:1 and palmitoleic acid (16:1) are transient products that were degraded further to 16:0 and
14:0 in the degradation of linoleic acid (18:2) (Lalman and Bagley 2000).
FOG has been found to accumulate in a solid or semi-solid form in codigestion systems,
eventually leading to digester failure by sludge flotation and washout of sludge granules if not
Page 24
16
removed from granular sludges (Hwu et al. 1998). Several studies have determined 16:0 to be the
main LCFA adsorbed to biomass in enhanced granular sludge bed (EGSB) digesters degrading
16:0 or 18:1 (Palatsi et al. 2012, Pereira et al. 2005). Other studies have found using continuous
or semi-continuous digesters resulted in increased gas production from FOG addition with no
mention of accumulated FOG in the digesters, although all of them saw a lag in methane
production (Kabouris et al. 2008, Kabouris et al. 2009, Davidsson et al. 2008, Luostarinen et al.
2009). This indicates the significance of adsorption when discussing inhibition of anaerobic
digestion processes by LCFAs.
While FOG addition can increase biogas production, it can also be inhibitory to
acidogens (Lalman and Bagley 2004), acetoclastic methanogens (Lalman and Bagley 2000,
Palatsi et al. 2012), and β-oxidizers (Lalman and Bagley 2000, Kim et al. 2004, Pereira et al.
2002). Some studies suggest that the mechanism of inhibition is transport limitation caused by
LCFA adsorption onto the biomass (Pereira et al. 2004) and that this is a reversible process, so
biodegradation can still take place even though mineralization occurs, (Palatsi et al. 2012, Pereira
et al. 2005). The short SRT characteristic of an APD washes out the microbial communities
responsible for the syntrophic interactions that make degradation of FOG thermodynamically
feasible (Palatsi et al. 2012). The primary role of the APD in a two-phase system codigesting
FOG is to saturate the unsaturated LCFAs and convert 18-carbon chains to 16:0 in order to
mitigate inhibition in the methanogenic digester where further β-oxidation takes place (Komatsu
et al. 1991, Kim and Shin 2010).
Page 25
17
Materials and Methods
Feed Characteristics
All municipal sludges were obtained from the nearby Christiansburg, VA Wastewater
Treatment plant. Seed sludge was taken from an anaerobic digester degrading combined
biosolids from the primary clarifier and thickened waste activated sludge (WAS). The feed
sludge used in the studies was a mixture of 70/30 v/v mixture of primary and thickened WAS
that was diluted with tap water to 2.5% total solids. FOG was shipped to the lab from the
Hampton Roads Sanitation District wastewater treatment plant in Williamsburg, VA. The FOG
was from a single source and sampled from a truck before mixing with FOG from other sources.
This ensured homogeneity of the FOG used in the study. The characteristics of the feed
components for the digesters are shown in Table 1.
Table 1 - Characteristics of Digester Feed Components
Component Feed Sludge FOG
COD (g/l) 37.8 (± 0.77)a
1,560 (± 577)
Total Solids (% of total mass) 2.48 (± 0.44) 57.2 (± 3.14)
Volatile Solids (% of total mass) 2.03 (± 0.44) 57.0 (± 3.06)
Lipids/LCFAs (% of total mass) N.D. 63.7
LCFAs (g/l COD) 1 1,453 a Bracketed values show 95% confidence interval
Acid-Phase Codigestion of FOG
Four 2-liter acid-phase anaerobic digesters were constructed and operated as completely
mixed Sequencing Batch Reactors (SBRs). Each digester was sealed to be airtight and kept at
37°C. Continuous mixing was accomplished using headspace gas recirculation via a peristaltic
pump. A 2-day SRT was maintained by manual feeding and wasting, daily. Great care was taken
Page 26
18
to limit the amount of air exposure so as to mitigate any oxygen toxicity effects. In two separate
sampling campaigns, various FOG loadings (ranging from 10 to 44% of the total COD in the
feed) were applied to the digesters by mixing the FOG with the feed sludge, plus a control that
received no FOG. The reactor vessels were emptied and cleaned between the two sampling
campaigns. Samples were taken daily from the wasted effluent for VFA and pH analysis.
Two-Phase Codigestion of FOG
Two separate two-phase digestion systems were constructed using two 2-liter acid-phase
digesters (APD) and two gas-phase methane digesters (GPD). The APDs were operated as
specified above with additional mixing just before sampling to ensure an accurate representation
of digester contents. The GPDs were 11.25 liters and operated at a 15 day SRT with the same
temperature and mixing parameters as the acid-phase digesters. 750ml of the APD effluent was
used each day to manually feed and waste the GPD.
A FOG loading comprising 20% of the total feed COD was applied to each system. In
one system, the FOG was added to the acid-phase by mixing it into the feed sludge. In the other
system, the FOG was added to the methane digesters by mixing a proportional weight into the
acid-phase effluent before feeding. This ensured that each two-phase system was treating the
same quantity of FOG. Samples of wasted effluent were analyzed for VFA, LCFA, pH, and
solids. Gas production was recorded and for the methane digesters, also analyzed for CH4 and
CO2 concentrations.
Page 27
19
Analytical Methods
Total solids (TS), volatile solids (VS), and chemical oxygen demand (COD) were determined by
Standard Methods 2540B, 2540B, and 5220C respectively (Clesceri et al. 1998); pH was
measured with a pH probe and meter. Biogas was collected in sampling bags and when full,
pumped out via peristaltic pump at a known rate for a measured time to determine quantity. CH4
and CO2 were quantified using thermal conductivity detection (TCD) on a Shimadzu GC-14A
gas chromatograph equipped with a Haysept D (6ft) column. The isocratic program was set up
with helium as the carrier gas, column (initial), injector, and TCD temperatures of 40, 70, and
110°C, respectively, and a detector current of 150mA.
The weight percentage for the lipids/LCFA component of the FOG was determined using
a hexane extraction technique based on Standard Method 5520D (Clesceri et al. 1998). Instead of
repeated washing in a separatory funnel, the samples were centrifuged after adding the hexane
and MTBE mixture in order to separate the hexane and aqueous layers. The hexane was allowed
to evaporate, leaving the lipid/LCFA material behind for quantification.
LCFA samples were prepared for GC analysis by conversion to Fatty Acid Methyl Esters
(FAMEs). This was achieved by an esterification process after extracting the lipids/LCFAs as
described above. A transesterification fluid containing mostly methanol was added to the
extracted lipid/LCFA sample in excess and heated to 90°C for 30 minutes. This replaces the
carboxylic acid with a methane group. The esterification process also severs the glycerin head
from the triglyceride molecule so that the individual LCFAs are represented in the analysis,
irrespective of the parent triglyceride. An HP 5890 GC using a flame ionization detector (FID)
was equipped with a Supelcowax 10 fused silica capillary column (30m x 0.32mm ID x 1.00 µm
Page 28
20
film thickness) for the analysis. Helium was the carrier gas and the program ran from 140°C to
260°C over 30 minutes.
VFAs were also analyzed with FID on a HP 5890 GC. A Nukol column (15m x 0.53mm
x 0.5µm film thickness) was used with helium as the carrier gas and a program from 80°C to
140°C over 10 minutes.
Results
Acid-Phase Codigestion of FOG
Four acid phase digesters were operated as SBRs with a 2-day SRT. Two separate
sampling campaigns were conducted under identical operating conditions, except for the amount
of FOG addition. After steady state was established, as determined by stability of the effluent pH
after 3 SRTs, the 10-day sampling campaign began. Samples were taken daily and the averages
are shown in Table 2.
Table 2 – Average of total VFA concentration and pH in the digester effluent for each FOG loading
FOG
(% of Total Feed COD) Campaign
Average Total VFA
Concentration (mg/l) Average pH
0 2 2390 4.84
10 2 2531 4.83
17 1 2248 5.62
20 2 2830 4.79
28 1 2974 5.01
30 2 3085 4.73
37 1 3401 4.92
44 1 4220 4.71
VFA production was found to increase with higher FOG loadings (see Figure 2), but was
significantly lower than theoretical VFA production, as calculated from the theoretical oxygen
demand of the LCFAs represented as acetic acid. An inhibitory effect is most likely the cause of
Page 29
21
this poor COD conversion to VFAs. The pH decreased with increased FOG loadings (see Figure
2), as expected due to the acid production, although the trend is much less consistent between
campaigns than VFA production. It is possible that the feed sludge used for campaign 1 had less
alkalinity to buffer the VFA production, although alkalinity was not quantified.
Figure 2 - Total experimental and theoretical VFA production (top) and pH (bottom) as a function of FOG addition
Large amounts of accumulated LCFAs were observed when the reactor vessels were
opened for cleaning at the end of each sampling campaign, and were generally observed to be in
proportion to the amount of FOG added. These solid, accumulated LCFAs were likely not
proportionally removed by wasting because the LCFAs floated near the top, whereas the effluent
02000400060008000
10000120001400016000180002000022000
0 10 20 30 40 50
To
tal
VF
A C
on
cen
tra
tio
ns
(mg
/L a
s a
ceti
c a
cid
equ
iva
len
ts)
% of Feed COD From FOG
Observed
Theoretical
4
4.5
5
5.5
6
6.5
7
0 10 20 30 40 50
Ste
ad
y S
tate
pH
% of Feed COD From FOG
Campaign 1
Campaign 2
Page 30
22
valve was located near the bottom of the liquid layer. Therefore, sludge was preferentially
wasted from digester areas with low concentrations of accumulated LCFAs. Regardless of
mixing considerations, some accumulated LCFA material (small grease balls) were found to
have a diameter greater than the effluent valve size and often got stuck in the effluent valve
towards the end of each campaign. Some of this accumulated LCFA material is shown in Figure
3.
Figure 3 - Accumulated LCFAs (circled) seen floating near the liquid surface of a digester receiving FOG; ruler
shown in inches
Two-Phase Codigestion of FOG
A summary of the two two-phase digestion systems is shown in Figure 4. FOG was
mixed with sludge when added to the FOG to Acid System (FTA), and was mixed with APD
effluent in the FOG to Gas System (FTG). All digesters were operated for at least 3 SRTs and
Page 31
23
the pH of each digester effluent was found to be stable before sampling began. Sampling
occurred 3 times per week from the wasted digester effluents.
Figure 4 - Schematic representation of the two-phase digestions systems receiving FOG addition to the APD (right)
and to the GPD (left)
The pH remained stable at 7.0 for the GPDs and 4.9 for the APDs of each system. The
pH of the APDs was similar to that observed in Campaign 2 of the acid-phase codigestion study.
The average volatile solids reduction (VSR) was 48% and 49% for the FTA and FTG systems,
respectively, and was not statistically different between the two systems. Daily gas production
for both phases of the each system is shown in Figure 5. Gas production from the APDs was
insignificant, as expected in an anaerobic environment dominated by hydrolysis and acidogenesis
reactions. The average daily gas production from the FTA system GPD was 11.18 l-day-1
while
that of the FTG system GPD was 9.87 l-day-1
. Gas production in the FTA system was 13%
greater, but this is most likely not significant due to the high variability in gas measurements.
Page 32
24
Figure 5 - Daily gas production in two-phase system
Table 3 shows the LCFA content of the feed and effluent for each digester of the two-
phase systems. The FTA System Feed was calculated by adding the LCFA content of the FOG
addition to the LCFA content of the sludge. The FTG System APD + FOG addition was
calculated by adding the LCFA content of the FOG addition to the average LCFA content of the
FTG System APD Effluent. It is important to note the limitations of the extraction procedure
used for analysis of LCFAs. Assuming no degradation of LCFAs in the APD, as evidenced in the
Acid-phase Codigestion of FOG study, recovery of LCFAs from the effluent was only 24%. This
is essentially due to flotation of sludge solids in the extraction procedure. This material was
discarded, but likely contained LCFAs because it floated above the aqueous layer. These LCFAs
were probably adsorbed onto the biomass surface and were most likely 16:0, as found in
previous studies (Palatsi et al. 2012, Pereira et al. 2005, Jeganathan et al. 2006). The LCFA
content of the FTA feed and ‘APD Effluent F G Addition’ are accurate, because nearly all
LCFA content comes from FOG addition; analysis of LCFAs in FOG was not affected by
extraction errors.
0.00
2.00
4.00
6.00
8.00
10.00
12.00
14.00
0 10 20 30
Ga
s P
rod
uct
ion
(l-
da
y-1
)
Time (days)
FTA System - GPD
FTG System - GPD
FTA System - APD
FTG System - APD
Page 33
25
The majority of LCFAs in the FOG were unsaturated 18-carbon chains, while most
LCFAs in all digester effluents were saturated. Degradation of the LCFAs occurred primarily in
the methane phase of digestion, although significant removal of the unsaturated 18-carbon chains
did occur in the acid phase. It is also important to note that stearic acid (18:0) increased in both
APDs and palmitic acid (16:0) increased in the APD of the FTG System.
Table 3 - LCFA content of the feed, average APD effluent, and average GPD effluent for both systems (mg/l COD)
System Component 14:0 14:1 16:0 16:1 18:0 18:1 18:2 18:3
FTA
Feed (sludge + FOG) 58 1 1197 25 468 1478 6994 1692
APD Effluent 55 0 732 7 650 323 176 18
GPD Effluent 8 0 152 1 83 71 9 0
FTG
Feed 51 0 445 19 202 388 55 2
APD Effluent 49 0 613 6 379 177 26 1
APD Effluent + FOG
Addition 107 1 1811 31 847 1655 7020 1694
GPD Effluent 20 0 250 1 75 107 17 1
A comparison of LCFA removal on a total and percentage COD basis is shown in Figure
6. This figure accounts for accumulated LCFAs in the digesters at the end of the sampling
campaign as non-degraded material. The FTG System was found to have better removal
efficiency (95%) compared to the FTA System (88%). The bottom portion of Figure 6 shows that
the FTA System did not remove the 16:0 and 18:0 LCFAs as well as the FTG System. This is
due to adsorption of the LCFAs onto sludge solids in the FTA System APD, where the saturated
acids were entrapped and not degraded because they weren’t transferred to the GPD.
Page 34
26
Figure 6 - LCFA degradation in both two-phase systems as COD (top) and % of COD concentration in feed
(bottom)
Total accumulation of LCFAs in the acid-phase digester of the FTA System was 34.8 g,
which accounts for 8% of the LCFAs added to the system. Accumulation also occurred in the
GPDs in both the FTA System (9.6 g) and the FTG System (7.4 g), although to a much lesser
extent. Figure 7 shows the accumulated LCFAs from all digesters except the FTG System APD,
which received no FOG and had no accumulated LCFAs. The accumulated LCFAs shown in
Figure 7 were selected as a qualitative representation of the median of the size distribution. The
accumulated LCFAs from the FTA System APD are similar in size to those observed in the acid-
0
50
100
150
200
250
300
14:0 14:1 16:0 16:1 18:0 18:1 18:2 18:3
LC
FA
Deg
rad
ati
on
(g
CO
D)
FTG System
FTA System
0
20
40
60
80
100
120
14:0 14:1 16:0 16:1 18:0 18:1 18:2 18:3
LC
FA
Deg
rad
ati
on
(% o
f fe
ed
co
nce
ntr
ati
on
)
FTG System
FTA System
Page 35
27
phase codigestion study. Because these are greater than ¼”, they were not able to be removed
even after the pre-sampling rapid mix procedure was implemented. Therefore, the shape of the
accumulated material in the FTA system GPD may be influenced by accumulation on a
microscopic level in the APD. This implies that once accumulation begins it is difficult to
reverse, even by transferring to a GPD. It is interesting to note the appearance of the accumulated
LCFAs from the FTG System GPD because it appears to show adsorption of the LCFAs to
particles in the sludge. This indicates that solids must be present in significant amounts in order
to support accumulation of LCFAs.
Figure 7 - Accumulated LCFAs after drying at 37°C from the FTA System APD (left), the FTG System GPD
(middle), and the FTA System GPD (right) (ruler shown in inches)
An analysis of non-degraded LCFAs from both systems is shown in Figure 8. Non-degraded
LCFAs passed through the systems and were measured in the GPD effluent, or accumulated in
the digesters and collected at the end of the sampling campaign, then analyzed for LCFA
content. Figure 8 shows that the GPD of each system is similar, with the accumulated and
effluent LCFAs being mostly saturated and somewhat equal. The major difference in the two
systems is the APD receiving FOG in FTA System. Because of the high level of accumulation
leading to poor degradation, a large portion of LCFAs are non-degraded because they never
Page 36
28
reach the gas-phase. This figure also shows that the loss of 16:0 between the feed and effluent of
the FTA System APD is caused by accumulation and not degradation.
Figure 8 - Fate of non-degraded LCFAs in the FTA System (left) and the FTG System (right)
Discussion
Table 3 shows that while the majority of LCFAs in the FOG are unsaturated 18-carbon
chains, the main LCFA in all digester effluents and accumulated material is 16:0. This is in
agreement with Pereira et al. (2005) and Palatsi et al. (2012) , although they found there to be no
other by-products, while the 18:0 LCFA and oleic acid (18:1) were found in significant
quantities in this research. The single double-bonded 18:1 LCFA was present in the feed in
significant quantities and may not have been completely degraded. While all LCFAs were found
to be degraded at least partially in the two-phase system, the FTA System APD receiving FOG
showed production of saturated LCFAs. This is shown in Figure 9 by negative values, which
indicate that the sum of the LCFA in the effluent and accumulated material from the digester is
greater than what was in the influent.
0
2000
4000
6000
8000
10000
12000
14000
16000
18000
20000
14:0
14:1
16:0
16:1
18:0
18:1
18:2
18:3
Accumulated in
APD
Accumulated in
GPD
Effluent from
GPD
0
2000
4000
6000
8000
10000
12000
14000
16000
18000
20000
LC
FA
-CO
D (
mg
CO
D)
Page 37
29
Figure 9 - LCFA removal efficiency in the FTA System APD as a percentage of the individual LCFA in the feed;
negative values indicate production and accumulation
It is possible that the low pH of the acid-phase environment caused saturation of
unsaturated 18-carbon chains where they would normally be β-oxidized to the 16:0 LCFA and
further to myristic acid (14:0). The driving force behind this would be the concentration of H+,
which is 100 times greater at an acid-phase pH of 5.0 compared to a conventional or gas-phase
environment pH near 7.0. A thermodynamic analysis of β-oxidation reactions was performed by
Lalman and Bagley (2001), and shows that while conversion of 18:2 to 16:0 is most favorable,
the reaction also produces an H+ ion. The high H
+ ion concentration in the APD digester could
make this reaction unfavorable so that 18:2 is converted to 18:1 instead, with no H+ ion as a
product. The same principle applies to β-oxidation of 18:1. Conversion of 18:1 to 16:1 or 16:0
produces an H+
ion, so the low pH level of an APD would make these reactions less favorable,
forcing 18:1 to be converted to 18:0 without any H+ as a product.
It is still unclear why so much LCFA was accumulated into large balls in the FTA system
APD instead of adsorbing to solids as smaller particles and being dispersed evenly through the
solution. The high rate of saturation results in removal of double bonds and causes the molecules
-100
-80
-60
-40
-20
0
20
40
60
80
100
14:0 14:1 16:0 16:1 18:0 18:1 18:2 18:3
LC
FA
Rem
ov
al
Eff
icie
ncy
in
FT
A
Sy
stem
AP
D (
%)
Page 38
30
to become less flexible. This could cause accumulation similar to the greater buildup of saturated
fats compared to unsaturated fats in human arteries, where inflexibility leads to LCFA molecules
becoming stuck to each other instead of flowing past.
Conclusions
These studies conclude that volatile fatty acid (VFA) production from acid-phase
digestion of municipal sludge increases with fats, oils, and grease (FOG) addition. Degradation
of long chain fatty acids (LCFAs) from FOG is low, however, and VFA production increases
only marginally when compared to the theoretical VFA yield. LCFAs also accumulate into large
balls that float at the digester liquid surface. This makes removal through wasting difficult and
has the potential to cause significant operational problems in a full scale digester.
In two-phase systems, near-complete degradation of FOG was achieved with satisfactory
gas production and volatile solids reduction. Adding FOG to the acid-phase digester (APD)
results in significant accumulation and could cause severe operational issues. The APD removes
a large fraction of unsaturated LCFAs, but produces saturated LCFAs in greater amounts than
the amount added. Further work is necessary to identify the role of pH during acid-phase
degradation and accumulation of LCFAs.
References
Heukelekian, H. and Mueller, P. (1958) Transformation of Some Lipids in Anaerobic Sludge
Digestion. Sewage and industrial wastes 30(9), 1108-1120.
Novak, J.T. and Carlson, D.A. (1970) The Kinetics of Anaerobic Long Chain Fatty Acid
Degradation. Water Pollution Control Federation 42(11), 1932-1943.
Lalman, J.A. and Bagley, D.M. (2001) Anaerobic degradation and methanogenic inhibitory
effects of oleic and stearic acids. Water Res 35(12), 2975-2983.
Page 39
31
Lalman, J.A. and Bagley, D.M. (2000) Anaerobic degradation and inhibitory effects of linoleic
acid. Water Res 34(17), 4220-4228.
Hwu, C.-S., van Lier, J.B. and Lettinga, G. (1998) Physicochemical and biological performance
of expanded granular sludge bed reactors treating long-chain fatty acids. Process Biochemistry
33(1), 75-81.
Palatsi, J., Affes, R., Fernandez, B., Pereira, M.A., Alves, M.M. and Flotats, X. (2012) Influence
of adsorption and anaerobic granular sludge characteristics on long chain fatty acids inhibition
process. Water Res 46(16), 5268-5278.
Pereira, M.A., Pires, O.C., Mota, M. and Alves, M.M. (2005) Anaerobic biodegradation of oleic
and palmitic acids: Evidence of mass transfer limitations caused by long chain fatty acid
accumulation onto the anaerobic sludge. Biotechnol Bioeng 92(1), 15-23.
Kabouris, C., J., Tezel, U., Pavlostathis, S.G., Engelmann, M., Todd, A.C. and Gillette, R.A.
(2008) The Anaerobic Biodegradability of Municipal Sludge and Fat, Oil, and Grease at
Mesophilic Conditions. Water Environment Research 80(3), 212-221.
Kabouris, J.C., Tezel, U., Pavlostathis, S.G., Engelmann, M., Dulaney, J., Gillette, R.A. and
Todd, A.C. (2009) Methane recovery from the anaerobic codigestion of municipal sludge and
FOG. Bioresour Technol 100(15), 3701-3705.
Davidsson, Å., Lövstedt, C., la Cour Jansen, J., Gruvberger, C. and Aspegren, H. (2008) Co-
digestion of grease trap sludge and sewage sludge. Waste Management 28(6), 986-992.
Luostarinen, S., Luste, S. and Sillanpää, M. (2009) Increased biogas production at wastewater
treatment plants through co-digestion of sewage sludge with grease trap sludge from a meat
processing plant. Bioresour Technol 100(1), 79-85.
Lalman, J. and Bagley, D. (2004) Extracting long-chain fatty acids from a fermentation medium.
Journal of the American Oil Chemists' Society 81(2), 105-110.
Kim, S., Han, S. and Shin, H. (2004) Kinetics of LCFA inhibition on acetoclastic
methanogenesis, propionate degradation and beta-oxidation. JOURNAL OF
ENVIRONMENTAL SCIENCE AND HEALTH PART A-TOXIC/HAZARDOUS
SUBSTANCES & ENVIRONMENTAL ENGINEERING 39, 13.
Pereira, M.A., Pires, O.C., Mota, M. and Alves, M.M. (2002) Anaerobic degradation of oleic
acid by suspended and granular sludge: identification of palmitic acid as a key intermediate.
Water Science and Technology 45, 6.
Pereira, M.A., Sousa, D.Z., Mota, M. and Alves, M.M. (2004) Mineralization of LCFA
associated with anaerobic sludge: Kinetics, enhancement of methanogenic activity, and effect of
VFA. Biotechnol Bioeng 88(4), 502-511.
Page 40
32
Komatsu, T., Hanaki, K. and Matsuo, T. (1991) PREVENTION OF LIPID INHIBITION IN
ANAEROBIC PROCESSES BY INTRODUCING A 2-PHASE SYSTEM. Water Science and
Technology 23, 12.
Kim, S.-H. and Shin, H.-S. (2010) Enhanced Lipid Degradation in an Upflow Anaerobic Sludge
Blanket Reactor by Integration with an Acidogenic Reactor. Water Environment Research 82(3),
267-272.
Clesceri, L.S., Greenberg, A.E., Eaton, A.D., Franson, M.A.H., American Public Health, A.,
American Water Works, A. and Water Environment, F. (1998) Standard methods for the
examination of water and wastewater, American Public Health Association, Washington, DC.
Jeganathan, J., Nakhla, G. and Bassi, A. (2006) Long-Term Performance of High-Rate
Anaerobic Reactors for the Treatment of Oily Wastewater. Environmental Science &
Technology 40(20), 6466-6472.
Page 41
33
Degradation and Accumulation of Long Chain Fatty Acids
in Acid-phase Codigestion of Municipal Biosolids
Abstract
The degradation and accumulation of long chain fatty acids (LCFAs) was studied in acidogenic
codigestion of wastewater sludge and fats, oils, and grease (FOG). The acid-phase digesters
(APDs) were operated as sequencing batch reactors (SBRs) at two or three day solids retention
times (SRTs) at 37°C. Adding high FOG loadings to an APD not acclimated to LCFAs resulted
in near complete saturation of unsaturated LCFAs and significant accumulation of LCFA
material in the digester, which was found to be mostly saturated. Non-degraded LCFAs with zero
or one double-bond were found to preferentially accumulate rather than pass through the system
through wasting. While 18:2 and 18:3 LCFAs were nearly completely removed, 18:0 and 14:0
LCFAs were produced, most likely from the degradation of 18:2 and 18:3 LCFAs. The APD pH
was found to have a significant impact on the amount of accumulated LCFA material present.
While degradation was unaffected, the amount of accumulated LCFAs in the digester at a pH of
4.9, 5.7, and 6.9 was 34.8 g, 14.4 g, and 0.0 g, respectively. Digester pH and sludge alkalinity are
important parameters in codigestion with FOG in a two-phase digestion system.
Introduction
Two-phase digestion (TPD) is an advanced anaerobic, biological treatment system for
treating sludges from municipal wastewater treatment plants that is growing in popularity due to
its ability to produce more biogas over a conventional digestion system. TPD spatially separates
the individual anaerobic microbial processes into two phases, acidogenesis followed by
methanogenesis, allowing for each to operate more efficiently. The acid-phase digester (APD)
utilizes a short solids retention time (SRT) to kinetically inhibit methanogens so that hydrolysis
and acidogenesis can take place at a lower pH that is more conducive to these reactions. Fat, oil,
and grease (FOG) codigestion is also becomingly more widely used because it can increase
biogas production from anaerobic digestion of sludges. However, the short SRT of an APD
Page 42
34
washes out the microbial communities responsible for the syntrophic interactions that make
degradation of FOG thermodynamically feasible (Palatsi et al. 2012).
FOG is a complex, high strength, organic waste material from a variety of sources such
as food processing facilities and restaurants. The most notable constituents of FOG are
triglyceride esters, which are rapidly hydrolyzed to produce long chain fatty acids (LCFAs)
during degradation (Heukelekian and Mueller 1958). LCFAs are commonly denoted by the
number of carbon atoms in the chain followed by the number of double bonds in the chain. For
example, oleic acid has an 18-carbon chain and one double bond so it is denoted as 18:1.An early
study into anaerobic degradation of LCFAs was conducted by Novak and Carlson (1970). They
found that the primary mechanism of degradation is β-oxidation and that unsaturated LCFAs
degraded more quickly than the saturated versions, although unsaturated LCFAs need to first
become saturated before β-oxidation can take place.
More recent studies have found that saturation is not necessarily required for unsaturated
LCFAs to undergo β-oxidation. Studies have found that palmitic (16:0) and myristic (14:0) acids
are the major by-products of oleic acid (18:1) degradation (Lalman and Bagley 2001), and that
18:1 and palmitoleic acid (16:1) are transient products that were degraded further to 16:0 and
14:0 in the degradation of linoleic acid (18:2) (Lalman and Bagley 2000).
FOG has been found to accumulate in a solid or semi-solid form in codigestion systems,
eventually leading to digester failure by sludge flotation and washout of sludge granules if not
removed from granular sludges (Hwu et al. 1998a). Several studies have determined 16:0 to be
the main LCFA adsorbed to biomass in enhanced granular sludge bed (EGSB) digesters
degrading 16:0 or 18:1 (Palatsi et al. 2012, Pereira et al. 2005). Other studies have found that
using continuous or semi-continuous digesters resulted in increased gas production from FOG
Page 43
35
addition with no mention of accumulated FOG in the digesters (Kabouris et al. 2008, Kabouris et
al. 2009, Davidsson et al. 2008, Luostarinen et al. 2009).
Miron et al. (2000) found that the pH of digesters operating below an 8 day SRT was just
below 5.0 and that saturated LCFAs with 12-, 14-, 16-, and 18-carbon chain lengths accumulated
while unsaturated LCFAs with 16- and 18-carbon chain lengths were easily degraded. It was
suggested that the accumulation of 18:0 could be due to high partial pressures of hydrogen gas
(Miron et al. 2000) or high concentrations of hydrogen ions because the pH was significantly
lower than neutral.
Materials and Methods
Feed Characteristics
All municipal sludges were obtained from the nearby Christiansburg, VA Wastewater
Treatment plant. Seed sludge was taken from an anaerobic digester degrading combined
biosolids from the primary clarifier and thickened waste activated sludge (WAS). The feed
sludge used in the studies was a mixture of 70/30 v/v primary and thickened WAS that was
diluted with tap water to 2.5% total solids. FOG was shipped to the lab from the Hampton Roads
Sanitation District wastewater treatment plant in Williamsburg, VA. The FOG was from a single
source and sampled from a truck before mixing with FOG from other sources. This ensured
homogeneity of the FOG used in the study. The characteristics of the feed components for the
digesters are shown in Table 4.
Page 44
36
Table 4 - Characteristics of Digester Feed Components
Component Feed Sludge FOG
COD (g/l) 37.8 (± 0.77)a
1,560 (± 577)
Total Solids (% of total mass) 2.48 (± 0.44) 57.2 (± 3.14)
Volatile Solids (% of total mass) 2.03 (± 0.44) 57.0 (± 3.06)
Lipids/LCFAs (% of total mass) N.D. 63.7
LCFAs (g/l COD) 1 1,453 a Bracketed values show 95% confidence interval
High FOG Loading on a Non-acclimated Digester
Two two-liter acid-phase anaerobic digesters were constructed and operated as
completely mixed Sequencing Batch Reactors (SBRs). Each digester was sealed to be airtight
and kept at 37°C. Continuous mixing was accomplished using headspace gas recirculation via a
peristaltic pump. A 3-day SRT was maintained by manual feeding and wasting, daily. Great care
was taken to limit the amount of air exposure so as to mitigate any oxygen toxicity effects.
Because the digester had previously received a low concentration of FOG, none was added for
7 days to allow for all β-oxidizing microbes to wash out. After this period, a high loading of
FOG was applied to the experimental digester so that 60% of the total COD in the feed was from
the FOG addition. Samples were taken daily from the wasted effluent for VFA, LCFA, and pH
analysis.
FOG Digestion at Controlled pHs
Four 2-liter acid-phase digesters were operated as completely mixed SBRs at an SRT of 2
days and temperature of 37°C using headspace gas recirculation for mixing. As shown in Table
5, one digester served as a control and received no FOG, one digester received 20% FOG
addition but no buffer (pH 4.9), two received 20% FOG addition and buffer to control for a
higher pH level (pH 5.7 and pH 6.9).
Page 45
37
Table 5 - Operating parameters for FOG codigestion at controlled pH study
FOG Addition
(% of total COD) Steady-state pH
Buffer Addition
(g-day-1
)
0 4.9 None
20 4.9 None
20 5.7 5.00
20 6.9 10.00
The buffer, anhydrous dibasic potassium phosphate (K2HPO4), and FOG were mixed
into the feed sludge before the feed/waste procedure. FOG addition began at startup for the
experimental digesters, which were operated for 30 days before sampling began. Samples were
taken daily for VFA, LCFA, and pH analysis.
Analytical Methods
Total solids (TS), volatile solids (VS), and chemical oxygen demand (COD) were
determined by Standard Methods 2540B, 2540B, and 5220C respectively (Clesceri et al. 1998);
pH was measured with a pH probe and meter. Gas production was determined for all digesters,
but it was determined to be negligible (<1% of COD in feed) and therefore not included here.
The weight percentage for the lipids/LCFA component of the FOG was determined using
a hexane extraction procedure based on Standard Method 5520D (Clesceri et al. 1998). Instead
of repeated washing in a separatory funnel, the samples were centrifuged after adding the hexane
and MTBE mixture in order to separate the hexane and aqueous layers. The hexane was allowed
to evaporate, leaving the lipid/LCFA material behind for quantification.
LCFA samples were prepared for gas chromatograph (GC) analysis by conversion to
Fatty Acid Methyl Esters (FAMEs). This was achieved by an esterification process after
extracting the lipids/LCFAs as described above. A transesterification fluid containing mostly
methanol was added to the extracted lipid/LCFA sample in excess and heated to 90°C for 30
Page 46
38
minutes. This replaces the carboxylic acid with a methane group. The esterification process also
severs the glycerin head from the triglyceride molecule so that the individual LCFAs are
represented in the analysis, irrespective of the parent triglyceride. An HP 5890 GC using a flame
ionization detector (FID) was equipped with a Supelcowax 10 fused silica capillary column (30m
x 0.32mm ID x 1.00 µm film thickness) for the analysis. Helium was the carrier gas and the
program ran from 140°C to 260°C over 30 minutes.
VFAs were also analyzed with FID on a HP 5890 GC. A Nukol column (15m x 0.53mm
x 0.5µm film thickness) was used with helium as the carrier gas and a program from 80°C to
140°C over 10 minutes.
Results
High FOG Loading on a Non-acclimated Digester
In order to easily track LCFA degradation and accumulation in a completely mixed SBR
digester system, a high loading rate of FOG was added on non-acclimated sludge. Because the
digester was not acclimated to FOG, initial adsorption of LCFAs onto sludge solids was included
in the mass balance calculation. An SRT of three days was used to allow for manual feeding
once per day, which reduced the chance for floating, accumulated LCFA material to escape
through wasting. Accumulated LCFAs in the waste stream were not accounted for in the mass
balance calculation, but was negligible. Daily FOG loading equal to 60% of the total COD began
for the experimental digester at Day 0 and continued through the entire sampling campaign while
the digesters continued to operate as completely mixed SBRs. The digesters had not been
previously acclimated to FOG or LCFAs.
Page 47
39
An increase in VFA concentration and drop in pH was observed, as shown in Figure 10,
but it is most likely that this is due to changes in the feed sludge composition and not the high
loading of FOG. The high loading of FOG did not significantly affect digester pH or VFA
concentration compared to the control digester.
Figure 10 - pH and total VFA concentration in the effluent of both digesters during the high FOG loading on a non-
acclimated digester study
The major component of the FOG used in this study was linoleic acid (18:2) and
represented 61% of the LCFA-COD in the feed receiving 60% FOG, as shown in Table 6. This
means 18:2 accounted for 37% of the total COD in the feed receiving 60% FOG. It is important
to note the limitations of the extraction procedure used for analysis of LCFAs. Assuming no
degradation of LCFAs in the APD, as evidenced by no difference in VFA production between
the control digester and the one receiving FOG, recovery of LCFAs from the effluent was only
44%. This is essentially due to flotation of sludge solids in the extraction procedure. This
material was discarded, but likely contained LCFAs because it floated above the aqueous layer.
These LCFAs were probably adsorbed onto the biomass surface and were most likely 16:0, as
found in previous studies (Palatsi et al. 2012, Pereira et al. 2005, Jeganathan et al. 2006). The
4.7
4.8
4.9
5
5.1
5.2
5.3
5.4
5.5
5.6
0
500
1000
1500
2000
2500
3000
3500
4000
0 2 4 6 8 10
pH
Eff
luen
t V
FA
Co
nce
ntr
ati
on
(mg
/l a
s a
ceti
c a
cid
)
Time (Days)
Control VFA
FOG VFA
Control pH
FOG pH
Page 48
40
LCFA content of the ‘60% F G Feed’ is accurate, because nearly all LCFA content comes from
FOG addition; analysis of LCFAs in FOG was not affected by extraction errors.
Degradation was low in the control digester compared to the digester receiving FOG,
although the same degradation pattern was observed in each; unsaturated 18-carbon LCFAs were
significantly removed while shorter chain and saturated LCFAs were degraded to less of an
extent. An accumulation of 31.2 g of LCFA material was collected at the end of the sampling
campaign from the reactor vessel and analyzed for LCFA content, as shown in Table 6. Because
this material was collected at the end of the sampling campaign, it was normalized to the sum of
the feed volume over the entire sampling campaign.
Table 6 - LCFA content (mg/l COD) in feed components, digester effluents, and accumulated LCFA material
(normalized to feed volume) for 60% FOG loading on a non-acclimated digester study (effluent as average of all
samples)
14:0 14:1 16:0 16:1 18:0 18:1 18:2 18:3 Total
Control Feed 105 0 625 88 723 258 144 28 1971
60% FOG Feed 125 1 2867 107 1514 3504 20819 5064 34000
Control Effluent 63 0 426 23 614 110 74 13 1324
FOG Effluent 78 0 617 34 886 670 2354 602 5243
Accumulated
FOG 276 1 2244 41 2779 2113 5 3 7462
A mass balance of the digester receiving FOG was conducted and the data are shown in
Figure 11. This approach accounts for all LCFAs added as FOG and all LCFAs in the digester
effluent and accumulated material throughout the sampling campaign. Figure 11 shows positive
values for degradation and negative values for production for each of the individual LCFAs
analyzed. While the unsaturated 18-carbon LCFAs were degraded, the saturated LCFAs were
produced faster than they were removed from the system. Almost all LCFA-COD was lost from
the removal of the 18:2 and linolenic acid (18:3) LCFAs, while nearly all LCFA-COD gained
came from production of stearic acid (18:0). The bottom portion of Figure 11 shows that the 18:0
Page 49
41
LCFA found in the effluent and accumulated LCFAs combined is nearly twice the amount that
was added to the digester as FOG. Therefore, the 18:0 LCFA must have been a product of the
degradation of unsaturated 18-carbon LCFAs.
Figure 11 - Degradation of LCFAs in g COD (top) and % of individual LCFA added (bottom) with negative
numbers indicating production
The production of 18:0 is surprising because it is not a known primary intermediate of the
degradation of unsaturated 18-carbon chains. The presence of 18:0 could be a degradation
-20
0
20
40
60
80
100
120
14:0 14:1 16:0 16:1 18:0 18:1 18:2 18:3
LC
FA
Deg
rad
ati
on
(g
CO
D)
-250
-200
-150
-100
-50
0
50
100
14:0 14:1 16:0 16:1 18:0 18:1 18:2 18:3
LC
FA
Deg
rad
ati
on
(%
of
ad
ded
LC
FA
s)
Page 50
42
intermediate of longer chain LCFAs (longer than 18 carbons) that were not analyzed here. A
more probable explanation is that that high H+ ion concentration or high partial pressure of H2
gas causes saturation of unsaturated 18-carbon LCFAs and accumulation of 18:0, as suggested
by Miron et al. (2000).
The sum of accumulated LCFAs from the digesters and the sum of LCFAs in the effluent
are shown as non-degraded LCFAs in Figure 12. The 18:2 and 18:3 LCFAs are more soluble
than shorter and more saturated LCFAs, and pass through the system through wasting. But
LCFAs with one or zero double bonds preferentially adsorb to sludge solids or other LCFAs and
end up in the accumulated LCFA matter found floating at the liquid surface. The presence of
unsaturated LCFAs in this accumulated material might be an indication that the LCFA was
adsorbed onto the sludge solids but was not degraded due to the short detention time used. This
is in agreement with previous studies that have found adsorption of unsaturated LCFAs onto
sludge solids to be the first step in degradation (Hwu et al. 1998b), although they are inhibitory
to β-oxidation of LCFAs (Pereira et al. 2002).
Figure 12 - Fate of non-degraded LCFAs in 60% FOG digester (sum over entire sampling campaign)
0
10
20
30
40
50
60
70
80
90
100
14:0 14:1 16:0 16:1 18:0 18:1 18:2 18:3
No
n-d
egra
ded
L
CF
As
in E
fflu
ent
vs.
Pre
cip
ita
te (
% o
f n
on
-deg
rad
ed
LC
FA
)
Precipitate
Effluent
Page 51
43
FOG Digestion at Controlled pHs
Four acid-phase digesters were operated simultaneously where the control received no
FOG, one digester received 20% FOG addition but no buffer (pH 4.9), and two received 20%
FOG addition and buffer to control for a higher pH level (pH 5.7 and pH 6.9). The digesters
reached steady state, as determined by stability of the pH of the effluent, before sampling began
and a constant FOG addition continued through the entire sampling campaign. Total VFA and
LCFA concentrations, as well as the mass of accumulated LCFA material, from each digester is
shown in Table 7.
Higher pH levels were accompanied by higher total VFA and LCFA concentrations in the
digester effluents and a lower mass of accumulated LCFAs in the digester. However, Table 7
shows that the VFA concentrations are highly variable across the sampling campaign, and are
not necessarily significant. The increase in total LCFA concentration in the effluent was larger
than the increase in total VFA concentration. This means the decrease in accumulated LCFAs is
probably due to higher pH levels causing LCFAs to be more soluble, or at least less likely to
adsorb to sludge solids.
Table 7 - Total VFA concentrations and pH from digester effluent, average of all 10 samples
pH
Total VFA
Concentration
(mg/l)
Total LCFAs in
Effluent (mg/l)
Total
Accumulated
LCFAs (g)
Control 4.88 (±0.21) a
2472 (±1163) 1055 (±304) 0.0
20% FOG, pH 4.9 4.87 (±0.11) 2556 (±906) 2233 (±506) 34.8
20% FOG, pH 5.7 5.67 (±0.15) 3039 (±1099) 2745 (±1089) 14.4
20% FOG, pH 6.9 6.91 (±0.16) 3092 (±511) 3592 (±1471) 0.0 aBracketed values indicate 95% confidence interval
The composition of the digester feed and effluents are shown in Table 8. The same
pattern of degradation occurred as with the mass balance study. Unsaturated LCFAs were nearly
completely removed while saturated LCFAs were produced or not well degraded. Unlike the
Page 52
44
mass balance study, the palmitic acid (16:0) was removed, although to a much smaller extent
than the unsaturated acids. All LCFAs were found in higher concentrations in the effluent at the
higher pH levels of the digesters. The same issues that affected LCFA extraction from sludge
also apply in this study. Due to LCFA adsorption onto biomass, only 30% of LCFAs were
recovered, with the remaining 70% presumably being adsorbed to biomass that passed through
the effluent. This assumes no degradation of LCFAs in the digester, but given the high variability
of the VFA production, it is likely that this is an appropriate assumption. VFA production was
not significantly different in each digester and therefore LCFAs were likely not degraded.
Table 8 - LCFA content in feed components and digester effluents (mg/l COD) for pH study (effluent as average of
all samples)
14:0 14:1 16:0 16:1 18:0 18:1 18:2 18:3
Control Feed 51 0 445 19 202 388 55 2
20% FOG Feed 58 1 1197 25 468 1478 6994 1692
Control 34 0 446 5 397 140 28 4
20% FOG, pH 4.9 50 0 720 6 700 418 270 29
20% FOG, pH 5.7 53 0 835 2 1451 293 113 14
20% FOG, pH 6.9 76 0 1076 3 1511 629 305 35
The sum of individual LCFAs in the digester effluents over the sampling campaign is
shown in Figure 13 along with an analysis of the accumulated LCFAs collected from the
digesters at the end of the sampling campaign. This agrees with the mass balance from the high
FOG loading on a non-acclimated digester study in that more saturated LCFAs are likely to be
found in the non-degraded, accumulated LCFA material floating at the liquid surface of the
digester. Higher pH levels correlate to less LCFA accumulation.
Page 53
45
Figure 13 - Non-degraded LCFAs in the effluents (top) and accumulated FOG (bottom) from digesters receiving
20% FOG (mg COD)
A mass balance of the digesters receiving FOG was conducted and the data are shown in
Figure 14. This approach accounts for all LCFAs added as FOG and all LCFAs in the digester
effluents and accumulated material throughout the sampling campaign. Figure 14 shows positive
values for degradation and negative values for production for each of the individual LCFAs
analyzed. While the unsaturated LCFAs were degraded, the saturated LCFAs were produced
faster than they were removed from the system. Almost all (>70%) LCFA-COD was lost from
0
10000
20000
30000
40000
50000
60000
70000
14:0 14:1 16:0 16:1 18:0 18:1 18:2 18:3
LC
FA
-CO
D (
mg
CO
D)
pH 4.9
pH 5.7
pH 6.9
0
2000
4000
6000
8000
10000
12000
14000
16000
18000
20000
14:0 14:1 16:0 16:1 18:0 18:1 18:2 18:3
LC
FA
-CO
D (
mg
CO
D)
pH 4.9
pH 5.7
pH 6.9
Page 54
46
the removal of the 18:2 LCFA, while nearly all LCFA-COD gained came from production of
18:0. The bottom portion of Figure 14 shows that the 18:0 LCFA found in the effluent and
accumulated LCFAs combined is nearly twice the amount that was added to the digester as FOG.
Therefore, the 18:0 LCFA must have been a product of the degradation of unsaturated 18-carbon
LCFAs.
Figure 14 - Degradation of LCFAs in g COD (top) and % of individual LCFA added (bottom) with negative
numbers indicating production
-100
-50
0
50
100
150
200
250
300
14:0 14:1 16:0 16:1 18:0 18:1 18:2 18:3
Ch
an
ge
in L
CF
A-C
OD
(g
CO
D)
20% FOG, pH 4.9
20% FOG, pH 5.8
20% FOG, pH 6.9
-300
-250
-200
-150
-100
-50
0
50
100
150
14:0 14:1 16:0 16:1 18:0 18:1 18:2 18:3
% C
ha
ng
e in
LC
FA
-CO
D
20% FOG, pH 4.9
20% FOG, pH 5.8
20% FOG, pH 6.9
Page 55
47
It is important to note that the digester had the same degradation pattern. This implies that
pH does not affect the degradation of LCFAs in the digester. This is shown again in Figure 15,
which shows that each digester had approximately the same amount of non-degraded FOG, but
that higher pH levels correlate to less accumulated LCFA material.
Figure 15 - Fate of non-degraded LCFAs in the digesters receiving FOG
Discussion
While pH doesn’t seem to affect production of intermediates, it does significantly affect
the accumulation of LCFAs. Accumulation of LCFAs can occur due to precipitation with
divalent cations (Pereira et al. 2005). Because the buffer used in this study was dibasic potassium
phosphate (K2HPO4), a large amount of monovalent K+ ions were present in solution. This could
have decreased the ratio of divalent to monovalent ions in solution and made precipitation of
LCFAs with divalent ions less favorable. While precipitation is likely the cause of LCFA
accumulation, adsorption probably accounts for the LCFAs that were not detected in the analysis
procedures. These LCFAs were adsorbed to the cell walls of biomass and escaped in the effluent.
0
10
20
30
40
50
60
70
80
90
100
20% FOG, pH
4.9
20% FOG, pH
5.8
20% FOG, pH
6.9
% L
CF
As
in F
eed
LCFAs in Accumulated
Material
LCFAs in Effluent
Page 56
48
Several studies have suggested that FOG addition to acidogenic digesters is an effective
way to minimize inhibition of acetoclastic methanogens in a subsequent methanogenic digester
(Komatsu et al. 1991, Kim et al. 2004, Kim and Shin 2010, Beccari et al. 1998). However, the
minimum operating pH of any of the digesters in these studies was 6.0, and none of these studies
mention accumulation of LCFAs in any significant amount. The digesters in this research
maintained a pH of 4.9 without the addition of buffer and showed significant accumulation of
LCFA material. This suggests that alkalinity is an important parameter to consider for FOG
codigestion with municipal biosolids in practice. While addition of FOG to the acidogenic
digester of a two-phase digestion system can increase biogas production, sufficient alkalinity
must be present to maintain an approximately neutral pH and prevent the accumulation of LCFA
material.
These studies suggest that 18:0 is an intermediate in the degradation pathway of
unsaturated 18-carbon LCFAs. It is possible that the low pH of the acid-phase environment
caused saturation of unsaturated 18-carbon chains where they would normally be β-oxidized to
the 16:0 LCFA and further to myristic acid (14:0). The driving force behind this would be the
concentration of H+, which is 100 times greater at an acid-phase pH of 5.0 compared to a
conventional or gas-phase environment pH near 7.0. A thermodynamic analysis of β-oxidation
reactions was performed by Lalman and Bagley (2001), and shows that while conversion of 18:2
to 16:0 is most favorable, the reaction also produces an H+ ion. The high H
+ ion concentration in
the APD digester could make this reaction unfavorable so that 18:2 is converted to 18:1 instead,
with no H+ ion as a product. The same principle applies to β-oxidation of 18:1. Conversion of
18:1 to 16:1 or 16:0 produces an H+
ion, so the low pH level of an APD would make these
reactions less favorable, forcing 18:1 to be converted to 18:0 without any H+ ion as a product.
Page 57
49
This is evidenced by lower production of 18:0 at pH 6.9 compared to pH 4.9 or 5.7, as shown in
Figure 14.
A high partial pressure of hydrogen gas could also cause saturation of unsaturated 18-
carbon LCFAs. The short SRTs used (2 days for the controlled pH study and 3 days for the high
FOG loading on a non-acclimated digester study) prevent hydrogenotrophic methanogens from
becoming established, which could result in a buildup of H2 gas (Beccari et al. 1998). A higher
partial pressure of H2 gas could cause saturation of unsaturated 18-carbon LCFAs during β-
oxidation. The effect of higher partial pressures of H2 could be exacerbated by the gas
recirculation system used for mixing, which creates more liquid-gas interaction area than a
conventional mechanically mixed digester.
Conclusion
These studies show that acid-phase codigestion of fat, oil, and grease (FOG) leads to
production and subsequent accumulation of saturated long chain fatty acids (LCFAs) in the form
of solid, accumulated LCFA material which floats at the liquid surface of the digester. While the
18:0 and 14:0 LCFAs are the major intermediates produced, all non-degraded LCFAs with zero
or one double bonds will become trapped in the digester instead of passing through the system in
the effluent. The low degradation is most likely due to the short retention time used for acid-
phase digestion.
The pH significantly affects accumulation of LCFAs. Higher pH levels result in less
accumulated LCFA material, but increase the concentration of LCFAs in the digester effluent.
Future work should focus on controlled pH acid-phase digestion followed by methane phase
digestion to assess effects on methane production and LCFA destruction.
Page 58
50
References
Palatsi, J., Affes, R., Fernandez, B., Pereira, M.A., Alves, M.M. and Flotats, X. (2012) Influence
of adsorption and anaerobic granular sludge characteristics on long chain fatty acids inhibition
process. Water Res 46(16), 5268-5278.
Heukelekian, H. and Mueller, P. (1958) Transformation of Some Lipids in Anaerobic Sludge
Digestion. Sewage and industrial wastes 30(9), 1108-1120.
Novak, J.T. and Carlson, D.A. (1970) The Kinetics of Anaerobic Long Chain Fatty Acid
Degradation. Water Pollution Control Federation 42(11), 1932-1943.
Lalman, J.A. and Bagley, D.M. (2001) Anaerobic degradation and methanogenic inhibitory
effects of oleic and stearic acids. Water Res 35(12), 2975-2983.
Lalman, J.A. and Bagley, D.M. (2000) Anaerobic degradation and inhibitory effects of linoleic
acid. Water Res 34(17), 4220-4228.
Hwu, C.-S., van Lier, J.B. and Lettinga, G. (1998a) Physicochemical and biological performance
of expanded granular sludge bed reactors treating long-chain fatty acids. Process Biochemistry
33(1), 75-81.
Pereira, M.A., Pires, O.C., Mota, M. and Alves, M.M. (2005) Anaerobic biodegradation of oleic
and palmitic acids: Evidence of mass transfer limitations caused by long chain fatty acid
accumulation onto the anaerobic sludge. Biotechnol Bioeng 92(1), 15-23.
Kabouris, C., J., Tezel, U., Pavlostathis, S.G., Engelmann, M., Todd, A.C. and Gillette, R.A.
(2008) The Anaerobic Biodegradability of Municipal Sludge and Fat, Oil, and Grease at
Mesophilic Conditions. Water Environment Research 80(3), 212-221.
Kabouris, J.C., Tezel, U., Pavlostathis, S.G., Engelmann, M., Dulaney, J., Gillette, R.A. and
Todd, A.C. (2009) Methane recovery from the anaerobic codigestion of municipal sludge and
FOG. Bioresour Technol 100(15), 3701-3705.
Davidsson, Å., Lövstedt, C., la Cour Jansen, J., Gruvberger, C. and Aspegren, H. (2008) Co-
digestion of grease trap sludge and sewage sludge. Waste Management 28(6), 986-992.
Luostarinen, S., Luste, S. and Sillanpää, M. (2009) Increased biogas production at wastewater
treatment plants through co-digestion of sewage sludge with grease trap sludge from a meat
processing plant. Bioresour Technol 100(1), 79-85.
Miron, Y., Zeeman, G., van Lier, J.B. and Lettinga, G. (2000) The role of sludge retention time
in the hydrolysis and acidification of lipids, carbohydrates and proteins during digestion of
primary sludge in CSTR systems. Water Res 34(5), 1705-1713.
Page 59
51
Clesceri, L.S., Greenberg, A.E., Eaton, A.D., Franson, M.A.H., American Public Health, A.,
American Water Works, A. and Water Environment, F. (1998) Standard methods for the
examination of water and wastewater, American Public Health Association, Washington, DC.
Jeganathan, J., Nakhla, G. and Bassi, A. (2006) Long-Term Performance of High-Rate
Anaerobic Reactors for the Treatment of Oily Wastewater. Environmental Science &
Technology 40(20), 6466-6472.
Hwu, C.-S., Tseng, S.-K., Yuan, C.-Y., Kulik, Z. and Lettinga, G. (1998b) Biosorption of long-
chain fatty acids in UASB treatment process. Water Res 32(5), 1571-1579.
Pereira, M.A., Pires, O.C., Mota, M. and Alves, M.M. (2002) Anaerobic degradation of oleic
acid by suspended and granular sludge: identification of palmitic acid as a key intermediate.
Water Science and Technology 45, 6.
Komatsu, T., Hanaki, K. and Matsuo, T. (1991) PREVENTION OF LIPID INHIBITION IN
ANAEROBIC PROCESSES BY INTRODUCING A 2-PHASE SYSTEM. Water Science and
Technology 23, 12.
Kim, S.-H., Han, S.-K. and Shin, H.-S. (2004) Two-phase anaerobic treatment system for fat-
containing wastewater. Journal of Chemical Technology & Biotechnology 79(1), 63-71.
Kim, S.-H. and Shin, H.-S. (2010) Enhanced Lipid Degradation in an Upflow Anaerobic Sludge
Blanket Reactor by Integration with an Acidogenic Reactor. Water Environment Research 82(3),
267-272.
Beccari, M., Majone, M. and Torrisi, L. (1998) Two-reactor system with partial phase separation
for anaerobic treatment of olive oil mill effluents. Water Science and Technology 38, 8.


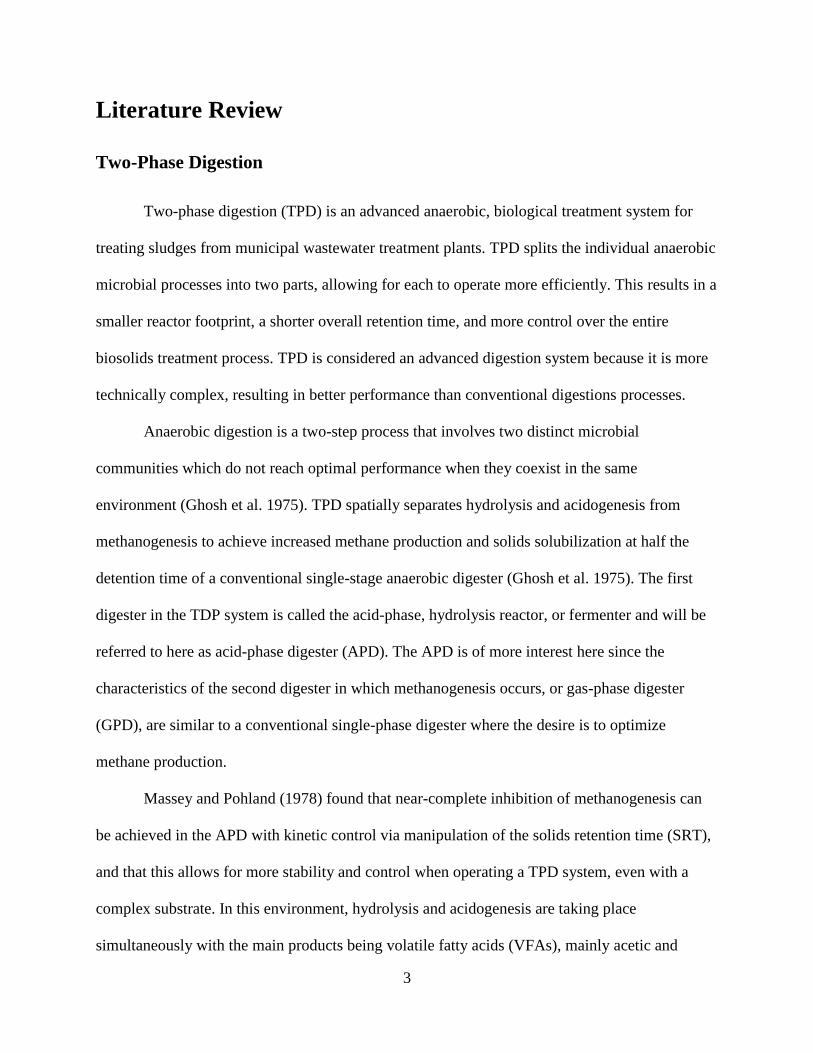


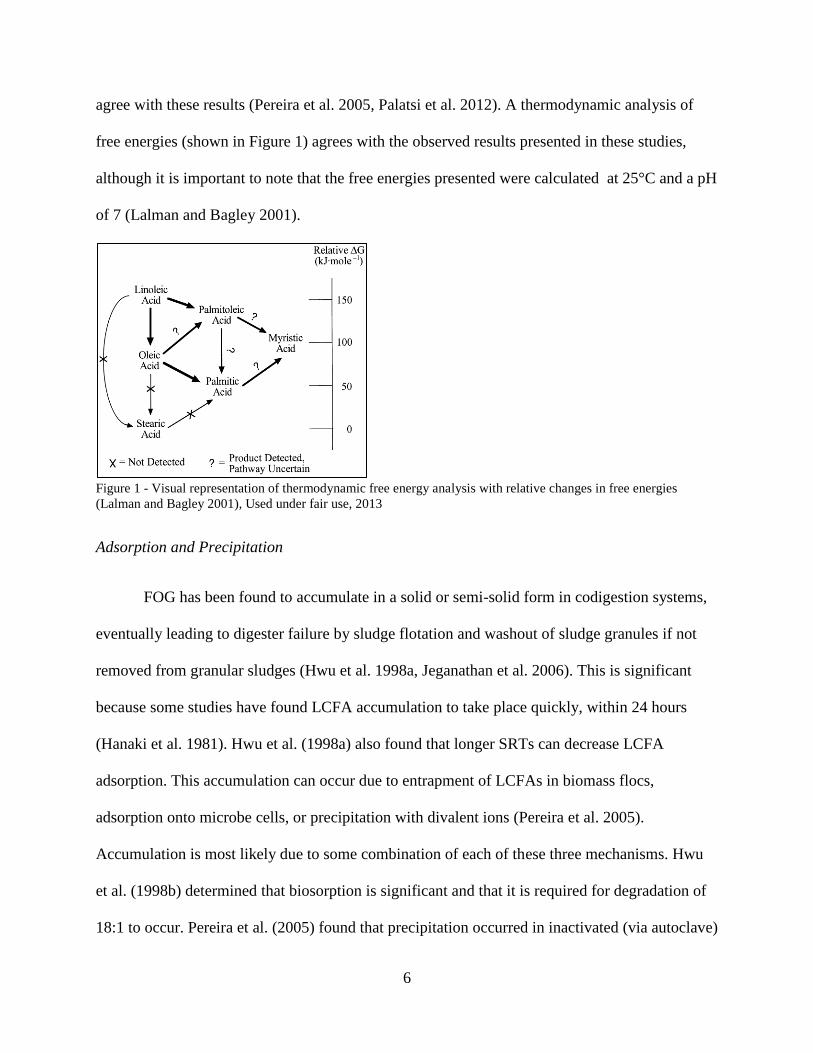


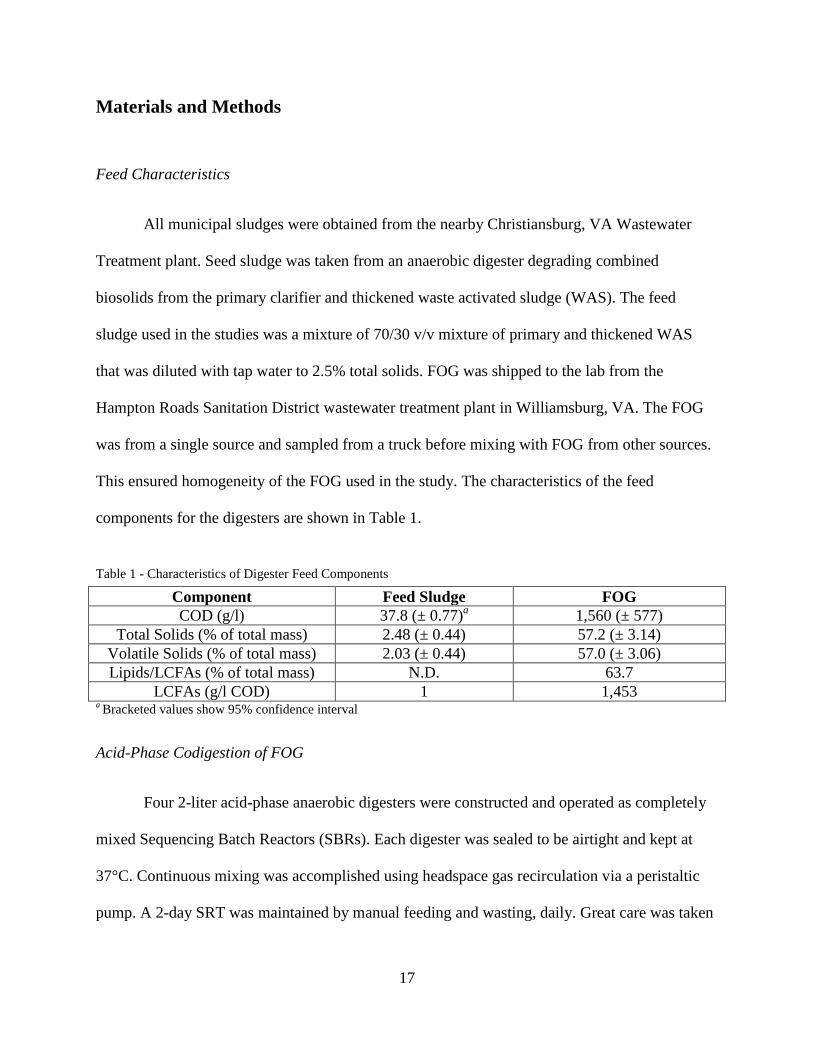
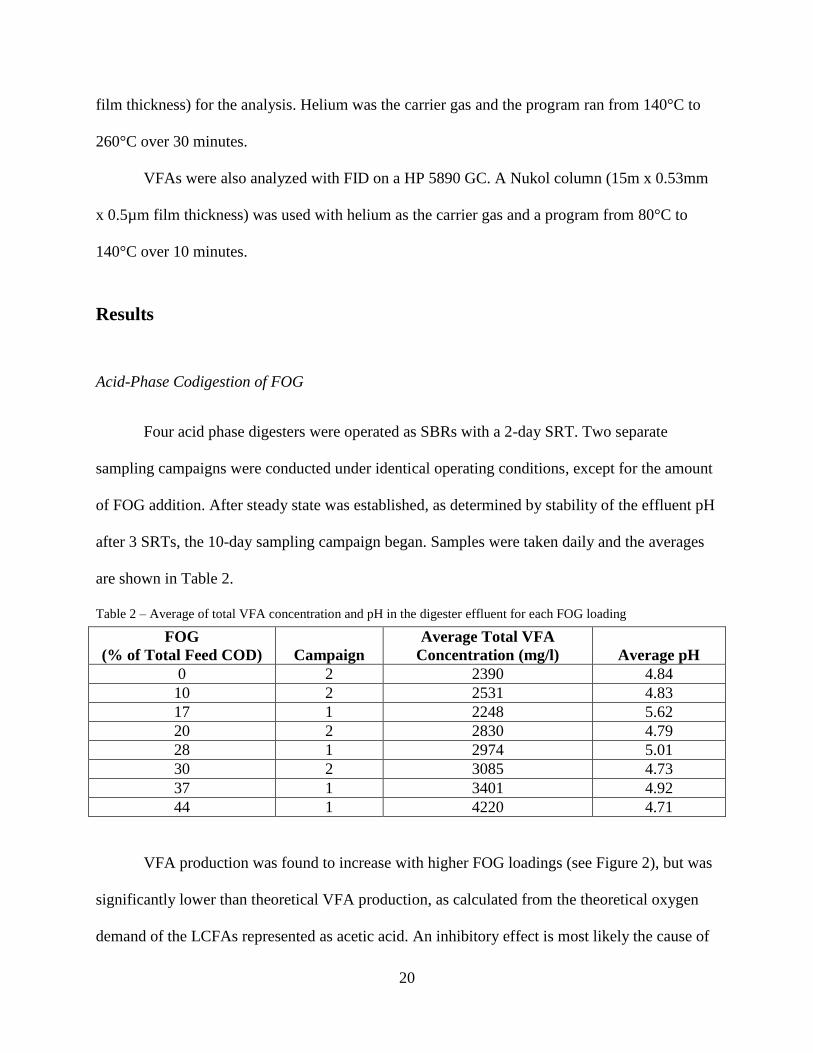

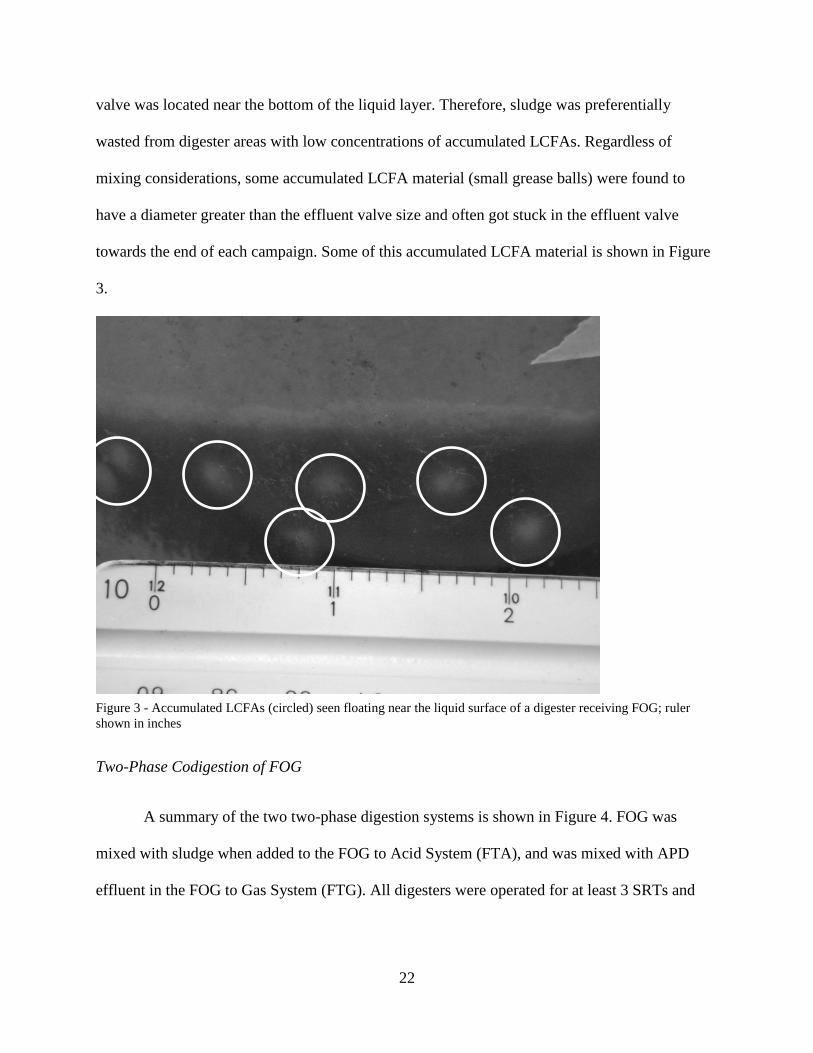
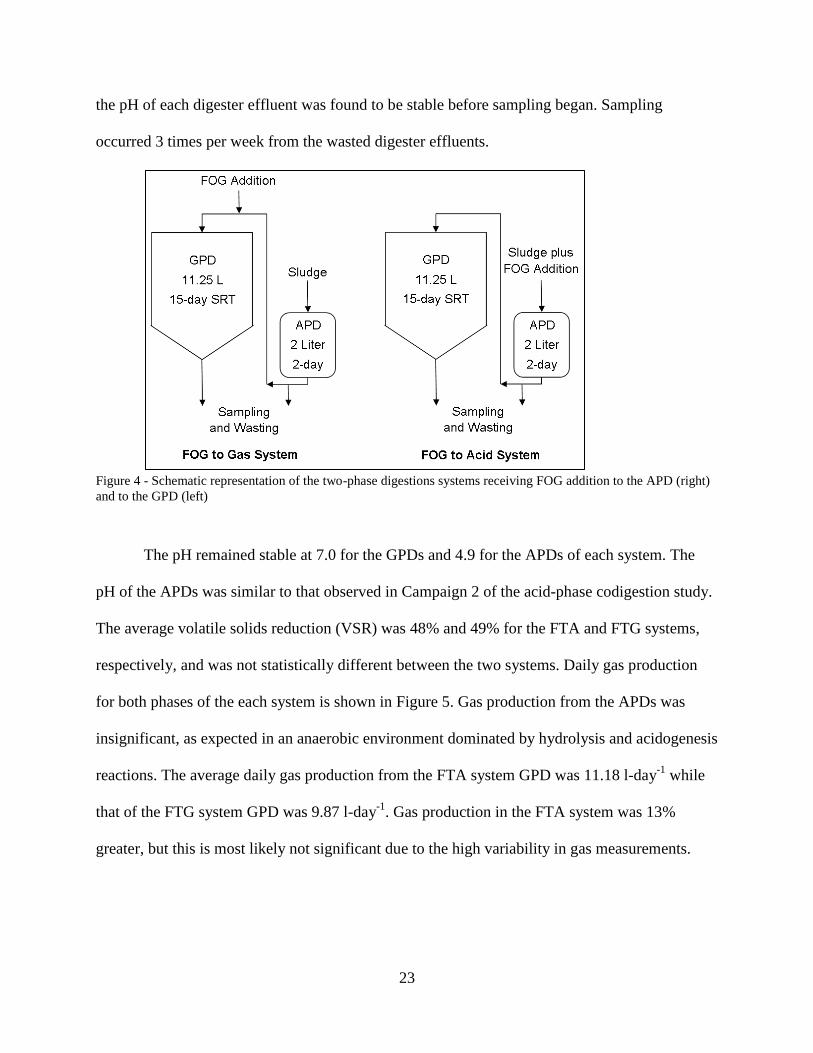
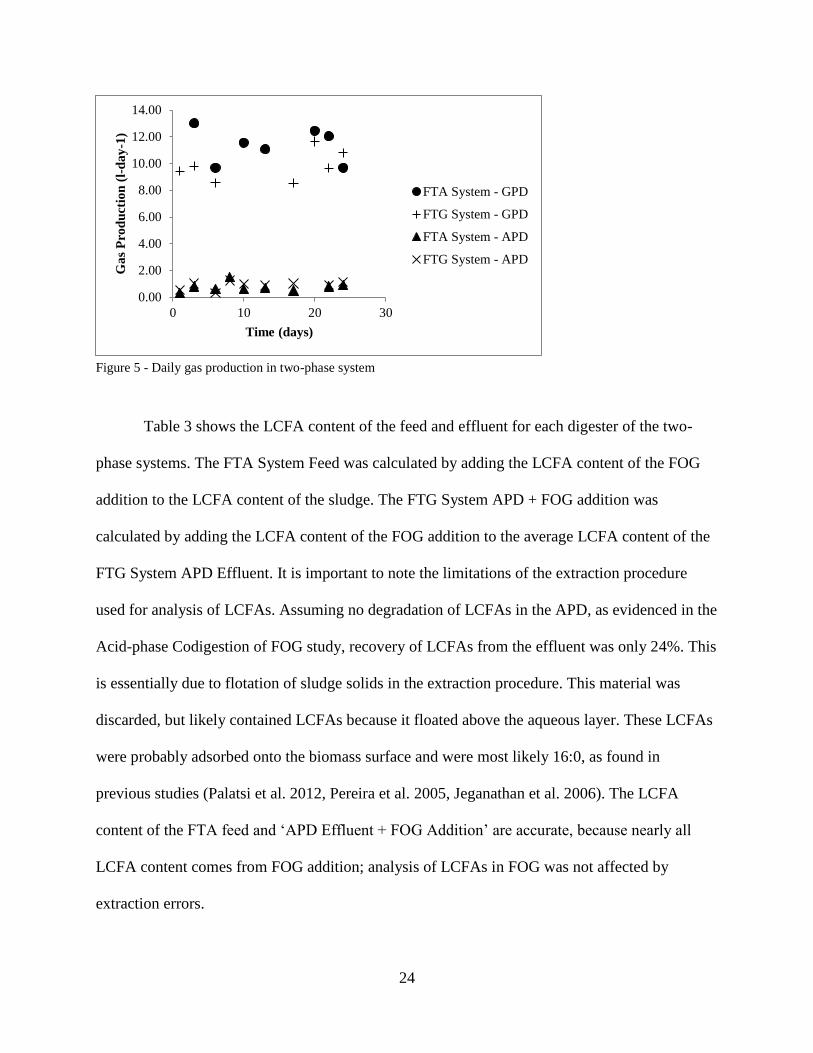

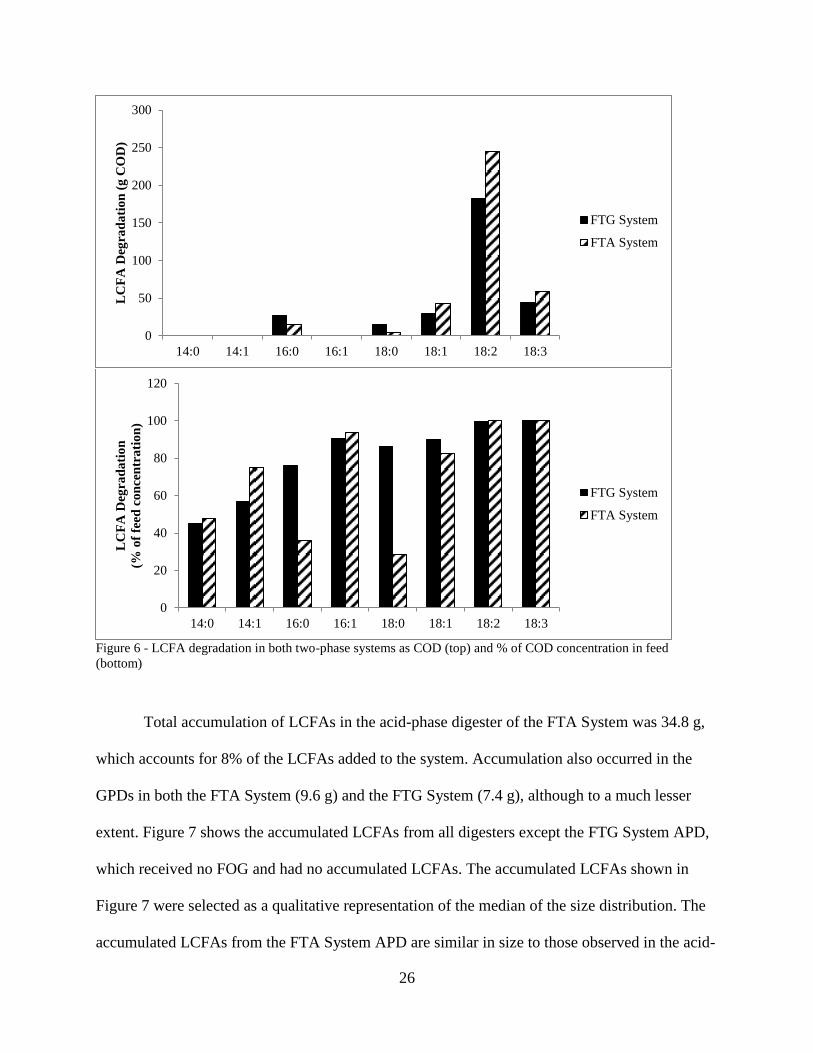
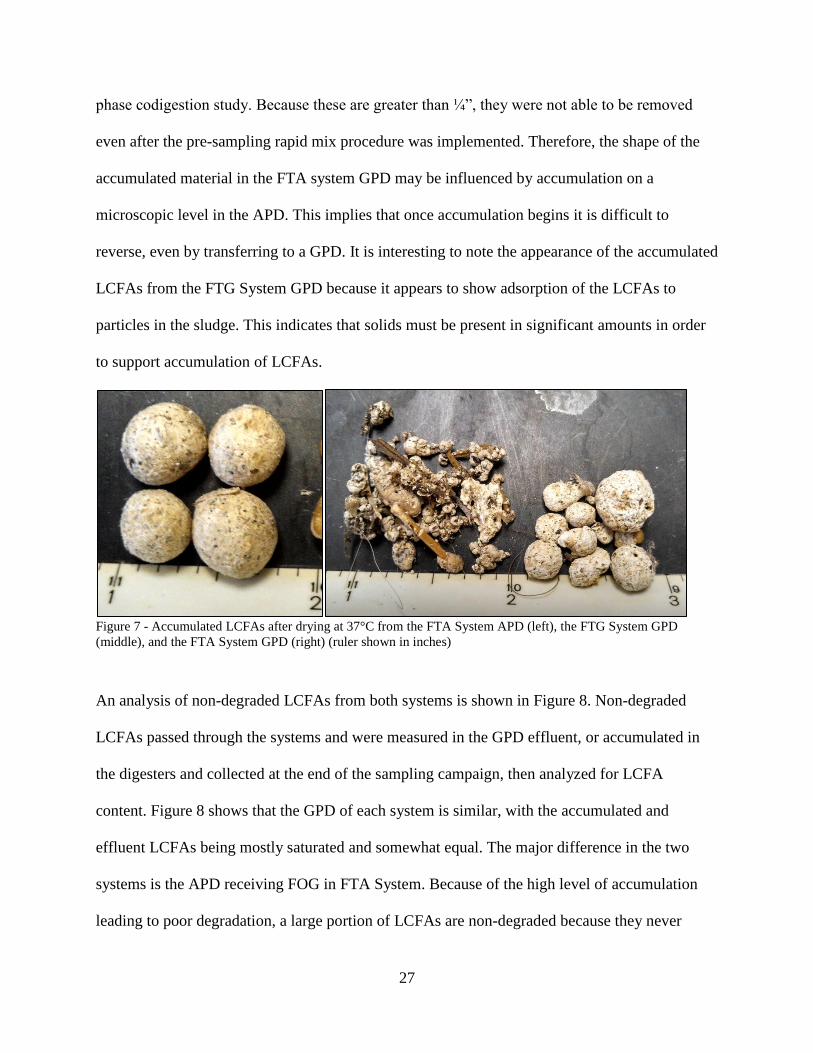
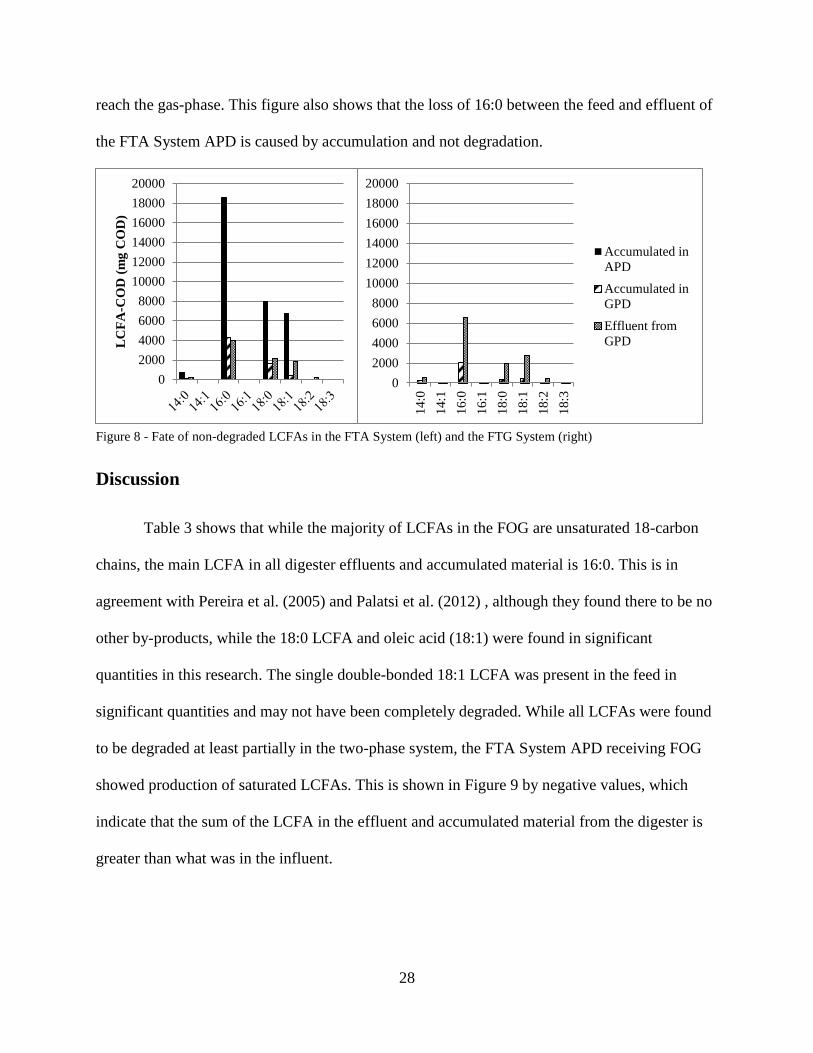
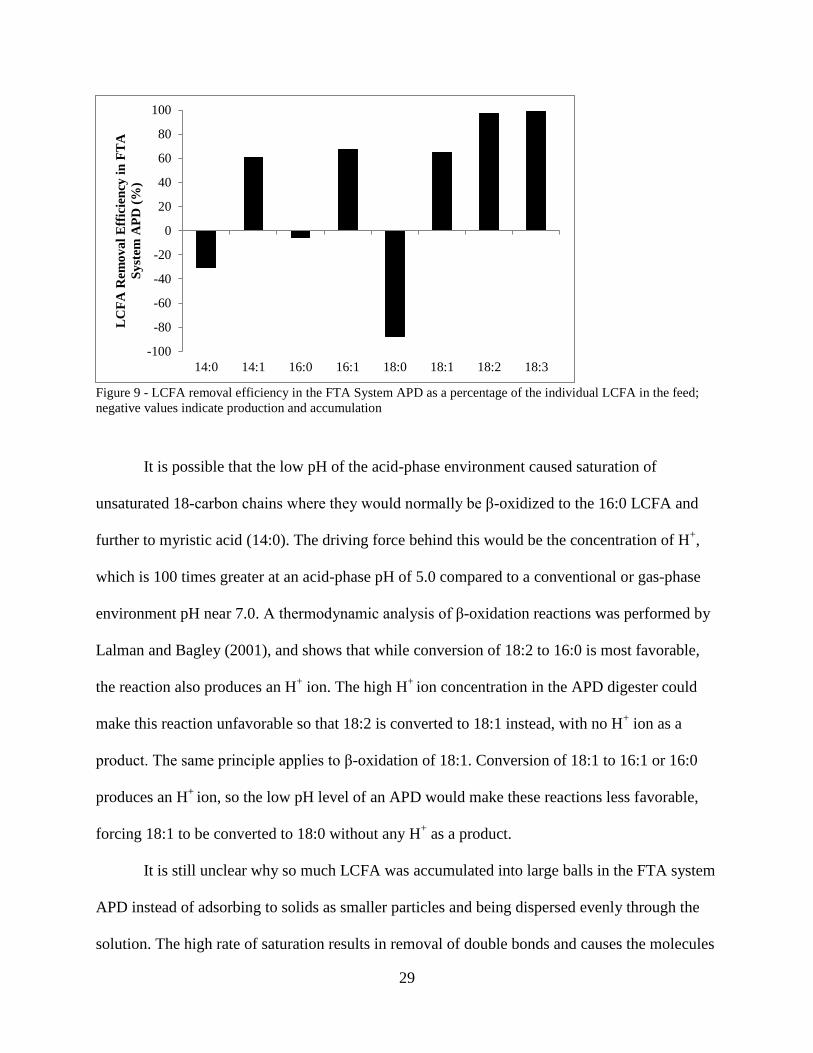


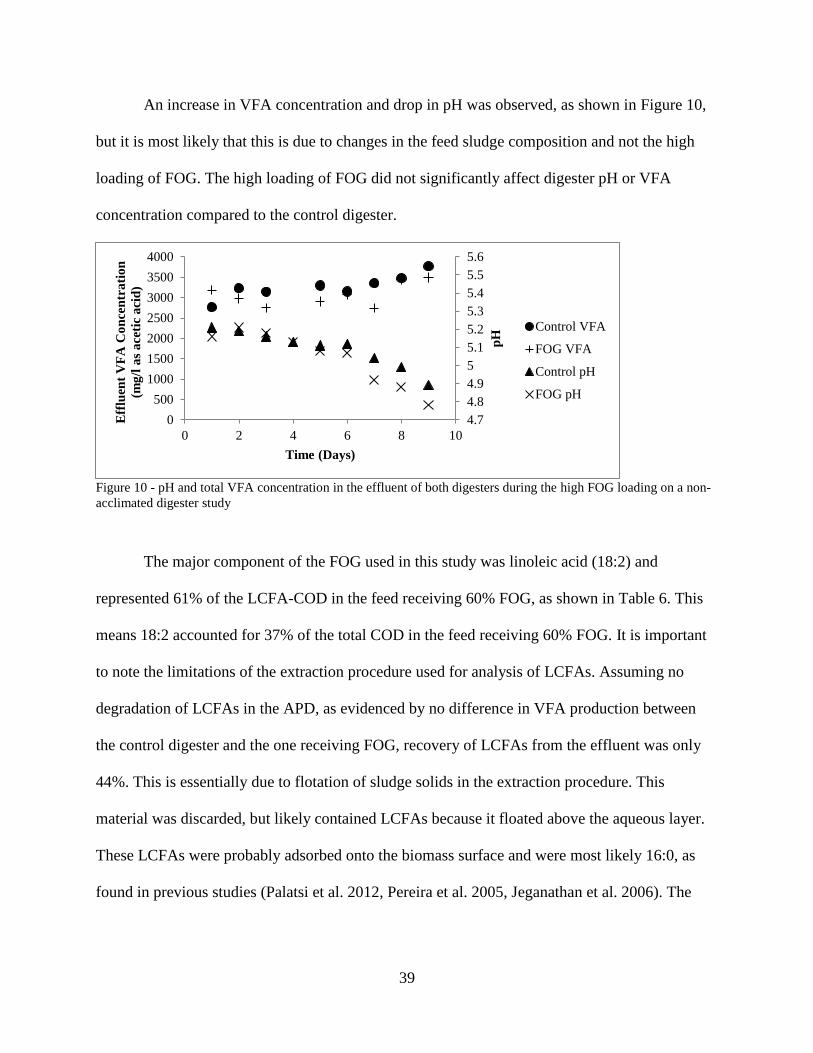


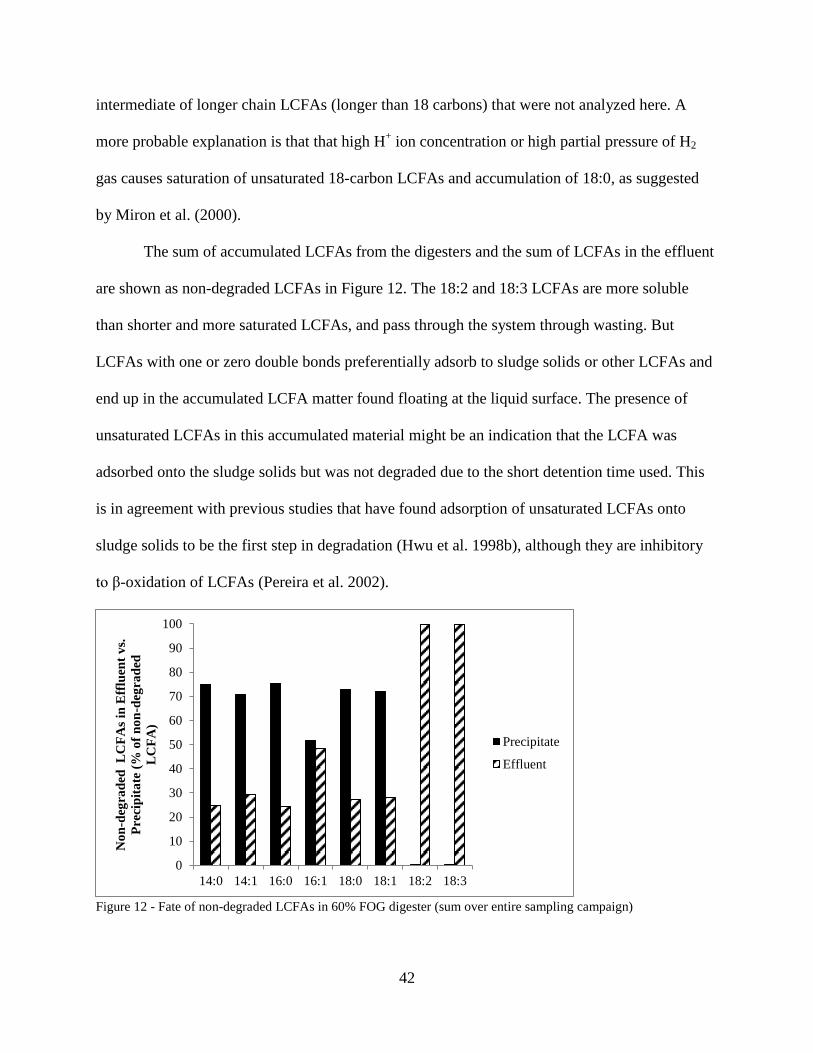
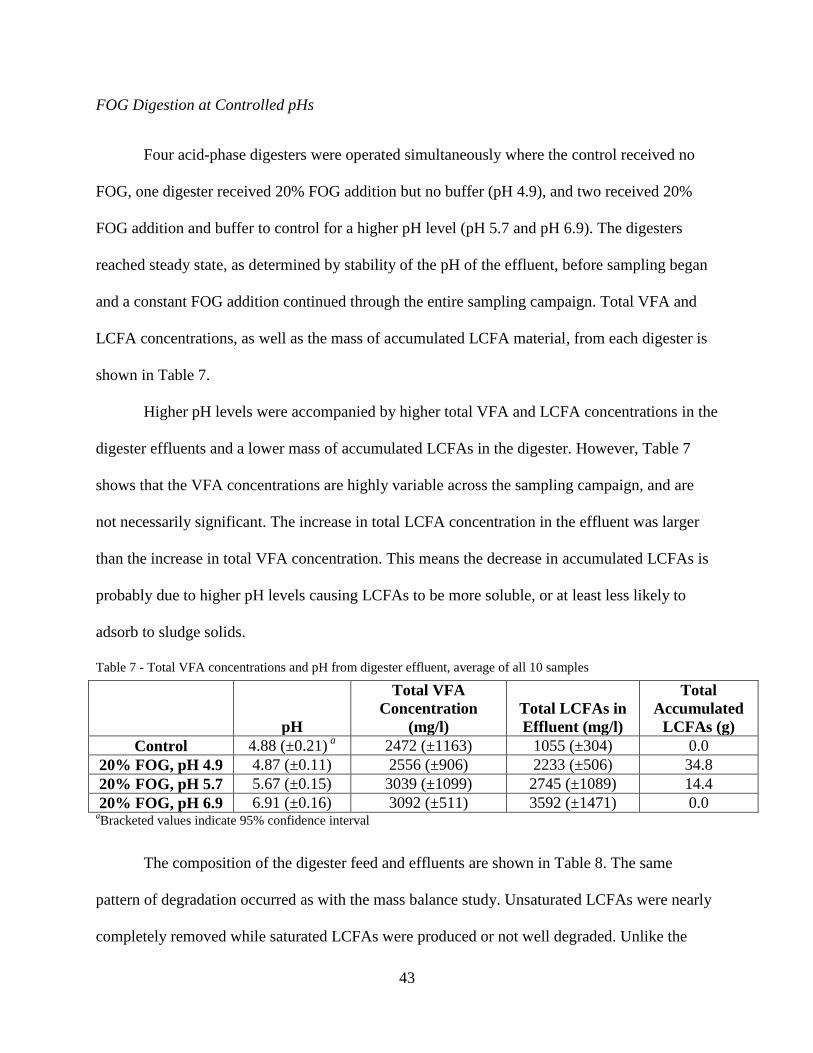
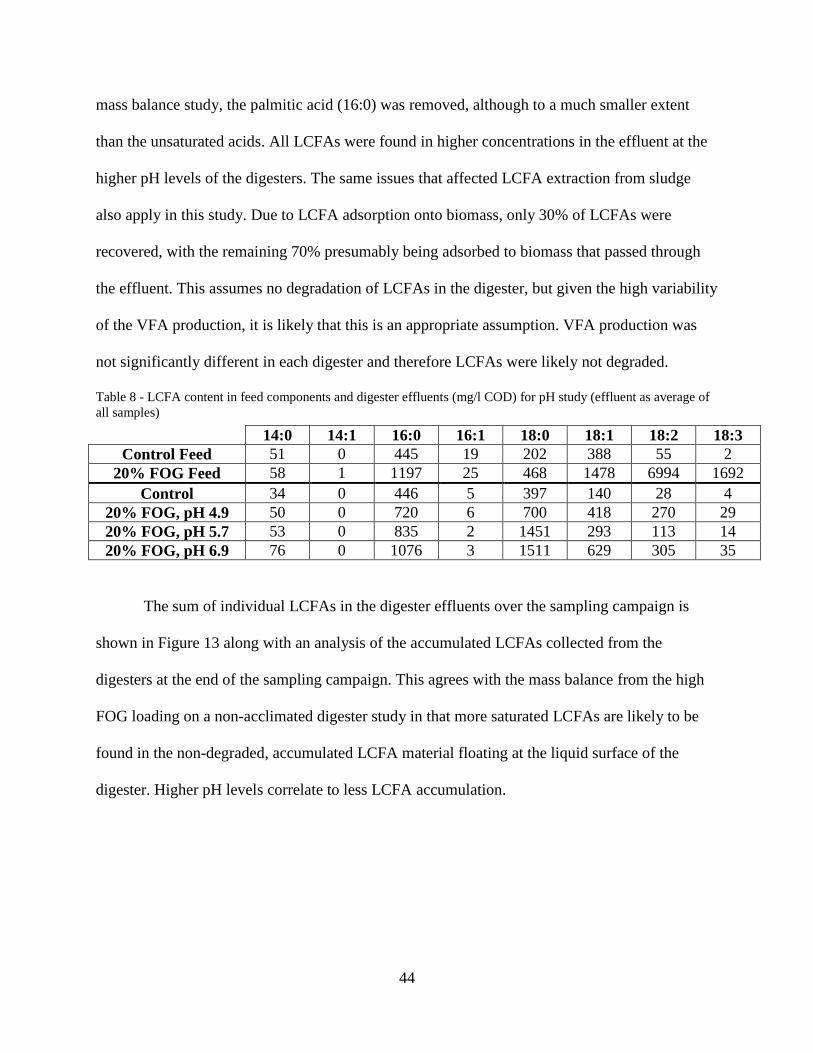
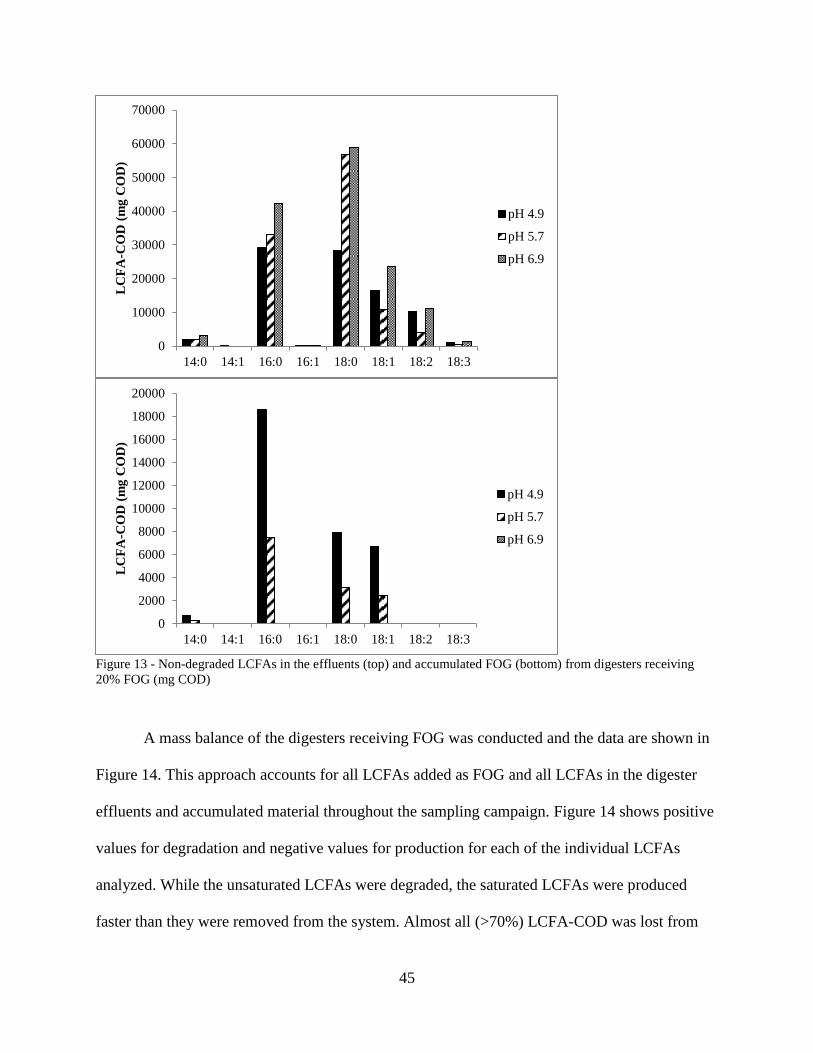

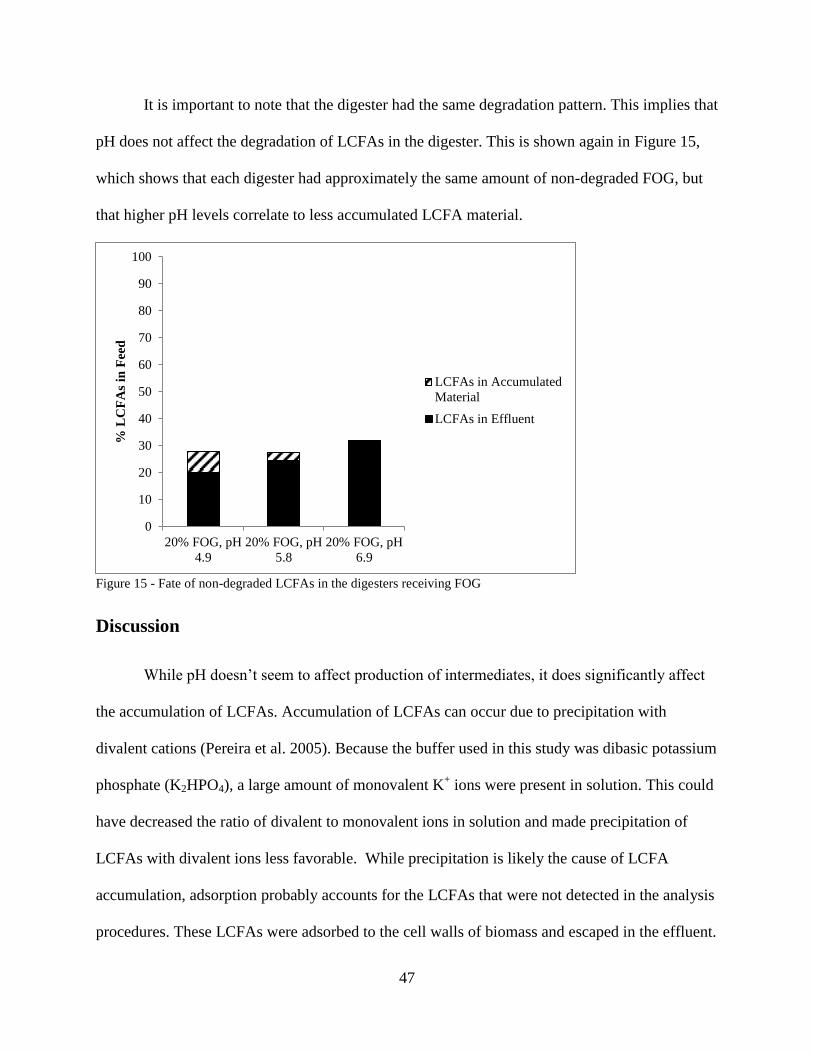


![Vehicular Fog Computing: A Viewpoint of Vehicles as the ...cwc.ucsd.edu/sites/cwc.ucsd.edu/files/Vehicular Fog... · fog computing paradigm [10]–[14]. Specifically, in the fog](https://static.documents.pub/doc/80x56/5ece3cb4a160d21f083aea78/vehicular-fog-computing-a-viewpoint-of-vehicles-as-the-cwcucsdedusitescwcucsdedufilesvehicular.jpg)


