so00 J. Phys. Chem. 1992, 96, 5000-5007 for hydrogen molecules to enter (diffuse) into the cavities so that the lower the temperature, the longer the time to attain the pressure equilibrium between the inside and outside of the cavity. Since all the temperature-dependent experimental data were obtained by taking 15 min of encapsulation time? we cannot exclude the possibility of incomplete hydrogen encapsulations at the low temperatures. According to the time-dependent hydrogen encapsulation study in Cs2,,-zeolite A done by Heo et the time required for the pressure equilibrium at the low temperatures is at least 180 min. However, at higher temperatures, the hydrogen encapsulation, which decreases with increasing temperature, can be found both in theory and in experiment. However, if we assume that our formalism is correct, the hydrogen encapsulation would increase exponentially with decreasing temperature (see Figure 4). One additional remark here is that in both pressure- and tem- perature-dependent studies, the theoretically calculated values always underestimated the experimental data (except for the first four low-temperaturedependent data). We believe that this may be due largely to the neglect of attractive interactions between guest hydrogen and the host Cs2,5-zeolite A molecules in our theoretical model. Nevertheless, we have been able to successfully functionalize the hydrogen encapsulation process without including any in- teraction between the host and the guest molecules at least with respect to pressure. This suggests that the major physical process responsible for the hydrogen encapsulation at high temperatures seems to be the molecular diffusion. We feel that experiments covering wider ranges of pressures and temperatures are needed to gain a more detailed understanding of this phenomenon. Such experiments are in preparation. Acknowledgment. N. H. Heo acknowledges the financial support from the Korea Science and Engineering Foundation. References and Notes Energy; Prenum Press: New York, 1975. Acc. Chem. Res. 1976, 9, 121. and references therein. Re&@ NO. HZ, 1333-74-0; CS, 7440-46-2. (1) Gregory, D. P. Science 1973, 12, 228. Verziroglu, T. N. Hydrogen (2) Fraenkel, D.; Shabtai, J. J. Am. Chem. Soc. 1977,99,7074. Seff, K. (3) Zhang, S.-Y.; Talu, 0.; Hayhurst, D. T. J. Phys. Chem. 1991,95, 1722 (4) Nicol, J. M.; Eckert, J.; Howard, J. J. Phys. Chem. 1988, 92, 7117. (5) de Menoval, L. C.; Raftery, D.; Liu, S.-B.; Takegosci, K.; Ryoo, R.; (6) Goldfard, D.; Kevan, L. J. Phys. Chem. 1986, 90, 2137. (7) For example, see: Mquarrie, D. A. Srarisrical Mechanics; Harper (8) Hill, T. L. Statistical Mechanics; McGraw-Hill Book Co.: New York, (9) Heo, N. H.; Rho, B. R.; Kim, D. H.; Kim, J. T. Hwahak Konghak (10) Rees, L. V. C.; Berry, T. Proc. Con/. Mol. Sieves 1969, 149. (11) Heo, N. H. Ph.D. Thesis, University of Hawaii at Manoa, 1987. Breck, D. W. Zeolite Molecular Sieves; Structure, Chemistry, and Use; John Wiley & Sons: New York, 1974; p 428. (12) Hirschfelder, J. 0.; Curtiss, C. F.; Bird, R. B. Molecular Theory of Gases and Liquids; John Wiley & Sons: New York, 1954. (1 3) Weast, R. C. Handbook of Chemistry and Physics; CRC Press: Boca Raton, FL, 1989. Pine, A. J. Phys. Chem. 1990, 94, 27. and Row: New York, 1976, Chapter 13. 1956; p 402. 1991, 29, 407. Acidic Properties of Alumina-Supported Metal Oxide Catalysts: An Infrared Spectroscopy Study Andrzej M. Turek,+ Israel E. Wachs,* Zettlemoyer Center for Surface Studies and Department of Chemical Engineering, Lehigh University, Bethlehem. Pennsylvania 18015 and Elaine DeCanio Research and Development Department, Texaco Inc., Beacon, New York 12508 (Received: October 8, 1991) The infrared spectra of the hydroxyl region and that of surface chemisorbed C 0 2 species for Re207/A1203, Cr03/A1203, M&3/,4@, V20s/A1203, Ti02/A1203, and Nb05/A1203 catalyticsystems have been investigated. A sequential consumption of the alumina OH groups upon deposition of the supported metal oxide has been found for all the investigated catalytic systems. A possible relationship between Bronsted acidity and a new low-frequency band in the hydroxyl region observed at high loadings of the supported metal oxide systems is postulated. The various chemisorbed C 0 2surface species formed on the uncovered parts of the exposed surface of alumina are identified. Furthermore, the applicability of the infrared C 0 2 chemisorption technique as a general method to determine the monolayer coverage for alumina-supported metal oxides has been confirmed because CO2 adsorption is suppressed as monolayer coverage is approached. Infrared pyridine chemisorption data for selected alumina-supported metal oxide catalysts are quantified, and a simple model for the Bransted acid site is proposed. Comparison with the molecular structures of the surface metal oxide overlayer, determined by Raman spectroscopy, reveals that there is no correlation between the surface metal oxide structures and the correspondingsurface hydroxyl chemistry, Br~lnsted acidity, and C02 chemisorption. Introduction Alumina-supported metal oxide catalysts are widely used in various catalytic processes. Molybdenum-based catalysts are well-known as very efficient hydrodesulfurization Molybdena/alumina, tungsta/alumina, and rhenia/alumina are all metathesis catalysts after induction with olefin a t room tem- perature&* or following a very mild reduction in H2? Chro- mia/alumina catalysts are used for the conversion of parafins to On leave from the Faculty of Chemistry, Jagiellonian University, ul. M. Karasia 3, 30 060 Cracow, Poland. To whom correspondence should be addressed. 0022-3654/92/2096-5000$03.00/0 olefinic hydrocarbons, in hydrodealkylation of aromatics, and to some extent in catalytic reforming.’O Vanadia/alumina catalytic systems are being examined as candidates for selective catalytic reduction of NO, by ammonia.” In many cases the catalytic activity and selectivity of these catalysts may be related to their acidity. The acidic properties of multicomponent metal oxide systems are usually determined by means of appropriate probe molecules acting as titrants or adsorbents.12 When the adsorption method is combined with infrared measurement of the adsorbed molecules, useful information about the type and concentration of surface acid sites can be obtained.” To avoid steric limitations, rather 0 1992 American Chemical Society
Transcript
so00 J . Phys. Chem. 1992, 96, 5000-5007
for hydrogen molecules to enter (diffuse) into the cavities so that the lower the temperature, the longer the time to attain the pressure equilibrium between the inside and outside of the cavity. Since all the temperature-dependent experimental data were obtained by taking 15 min of encapsulation time? we cannot exclude the possibility of incomplete hydrogen encapsulations at the low temperatures. According to the time-dependent hydrogen encapsulation study in Cs2,,-zeolite A done by Heo et the time required for the pressure equilibrium at the low temperatures is at least 180 min. However, at higher temperatures, the hydrogen encapsulation, which decreases with increasing temperature, can be found both in theory and in experiment. However, if we assume that our formalism is correct, the hydrogen encapsulation would increase exponentially with decreasing temperature (see Figure 4).
One additional remark here is that in both pressure- and tem- perature-dependent studies, the theoretically calculated values always underestimated the experimental data (except for the first four low-temperaturedependent data). We believe that this may be due largely to the neglect of attractive interactions between guest hydrogen and the host Cs2,5-zeolite A molecules in our theoretical model.
Nevertheless, we have been able to successfully functionalize the hydrogen encapsulation process without including any in- teraction between the host and the guest molecules at least with respect to pressure. This suggests that the major physical process responsible for the hydrogen encapsulation at high temperatures seems to be the molecular diffusion.
We feel that experiments covering wider ranges of pressures and temperatures are needed to gain a more detailed understanding of this phenomenon. Such experiments are in preparation.
Acknowledgment. N. H. Heo acknowledges the financial support from the Korea Science and Engineering Foundation.
References and Notes
Energy; Prenum Press: New York, 1975.
Acc. Chem. Res. 1976, 9, 121.
and references therein.
Re&@ NO. HZ, 1333-74-0; CS, 7440-46-2.
(1) Gregory, D. P. Science 1973, 12, 228. Verziroglu, T. N. Hydrogen
(2) Fraenkel, D.; Shabtai, J. J . Am. Chem. Soc. 1977,99,7074. Seff, K.
(3) Zhang, S.-Y.; Talu, 0.; Hayhurst, D. T. J . Phys. Chem. 1991,95, 1722
(4) Nicol, J. M.; Eckert, J.; Howard, J. J. Phys. Chem. 1988, 92, 7117. (5) de Menoval, L. C.; Raftery, D.; Liu, S.-B.; Takegosci, K.; Ryoo, R.;
(6) Goldfard, D.; Kevan, L. J . Phys. Chem. 1986, 90, 2137. (7) For example, see: Mquarrie, D. A. Srarisrical Mechanics; Harper
( 8 ) Hill, T. L. Statistical Mechanics; McGraw-Hill Book Co.: New York,
(9) Heo, N. H.; Rho, B. R.; Kim, D. H.; Kim, J. T. Hwahak Konghak
(10) Rees, L. V. C.; Berry, T. Proc. Con/. Mol. Sieves 1969, 149. (11) Heo, N. H. Ph.D. Thesis, University of Hawaii at Manoa, 1987.
Breck, D. W. Zeolite Molecular Sieves; Structure, Chemistry, and Use; John Wiley & Sons: New York, 1974; p 428.
(12) Hirschfelder, J. 0.; Curtiss, C. F.; Bird, R. B. Molecular Theory of Gases and Liquids; John Wiley & Sons: New York, 1954.
(1 3) Weast, R. C. Handbook of Chemistry and Physics; CRC Press: Boca Raton, FL, 1989.
Pine, A. J. Phys. Chem. 1990, 94, 27.
and Row: New York, 1976, Chapter 13.
1956; p 402.
1991, 29, 407.
Acidic Properties of Alumina-Supported Metal Oxide Catalysts: An Infrared Spectroscopy Study
Andrzej M. Turek,+ Israel E. Wachs,* Zettlemoyer Center for Surface Studies and Department of Chemical Engineering, Lehigh University, Bethlehem. Pennsylvania 18015
and Elaine DeCanio Research and Development Department, Texaco Inc., Beacon, New York 12508 (Received: October 8, 1991)
The infrared spectra of the hydroxyl region and that of surface chemisorbed C02 species for Re207/A1203, Cr03/A1203, M&3/,4@, V20s/A1203, Ti02/A1203, and Nb05/A1203 catalytic systems have been investigated. A sequential consumption of the alumina OH groups upon deposition of the supported metal oxide has been found for all the investigated catalytic systems. A possible relationship between Bronsted acidity and a new low-frequency band in the hydroxyl region observed at high loadings of the supported metal oxide systems is postulated. The various chemisorbed C02 surface species formed on the uncovered parts of the exposed surface of alumina are identified. Furthermore, the applicability of the infrared C02 chemisorption technique as a general method to determine the monolayer coverage for alumina-supported metal oxides has been confirmed because CO2 adsorption is suppressed as monolayer coverage is approached. Infrared pyridine chemisorption data for selected alumina-supported metal oxide catalysts are quantified, and a simple model for the Bransted acid site is proposed. Comparison with the molecular structures of the surface metal oxide overlayer, determined by Raman spectroscopy, reveals that there is no correlation between the surface metal oxide structures and the corresponding surface hydroxyl chemistry, Br~lnsted acidity, and C02 chemisorption.
Introduction Alumina-supported metal oxide catalysts are widely used in
various catalytic processes. Molybdenum-based catalysts are well-known as very efficient hydrodesulfurization Molybdena/alumina, tungsta/alumina, and rhenia/alumina are all metathesis catalysts after induction with olefin a t room tem- perature&* or following a very mild reduction in H2? Chro- mia/alumina catalysts are used for the conversion of parafins to
On leave from the Faculty of Chemistry, Jagiellonian University, ul. M. Karasia 3, 30 060 Cracow, Poland.
To whom correspondence should be addressed.
0022-3654/92/2096-5000$03.00/0
olefinic hydrocarbons, in hydrodealkylation of aromatics, and to some extent in catalytic reforming.’O Vanadia/alumina catalytic systems are being examined as candidates for selective catalytic reduction of NO, by ammonia.” In many cases the catalytic activity and selectivity of these catalysts may be related to their acidity.
The acidic properties of multicomponent metal oxide systems are usually determined by means of appropriate probe molecules acting as titrants or adsorbents.12 When the adsorption method is combined with infrared measurement of the adsorbed molecules, useful information about the type and concentration of surface acid sites can be obtained.” To avoid steric limitations, rather
0 1992 American Chemical Society
Alumina-Supported Metal Oxide Catalysts
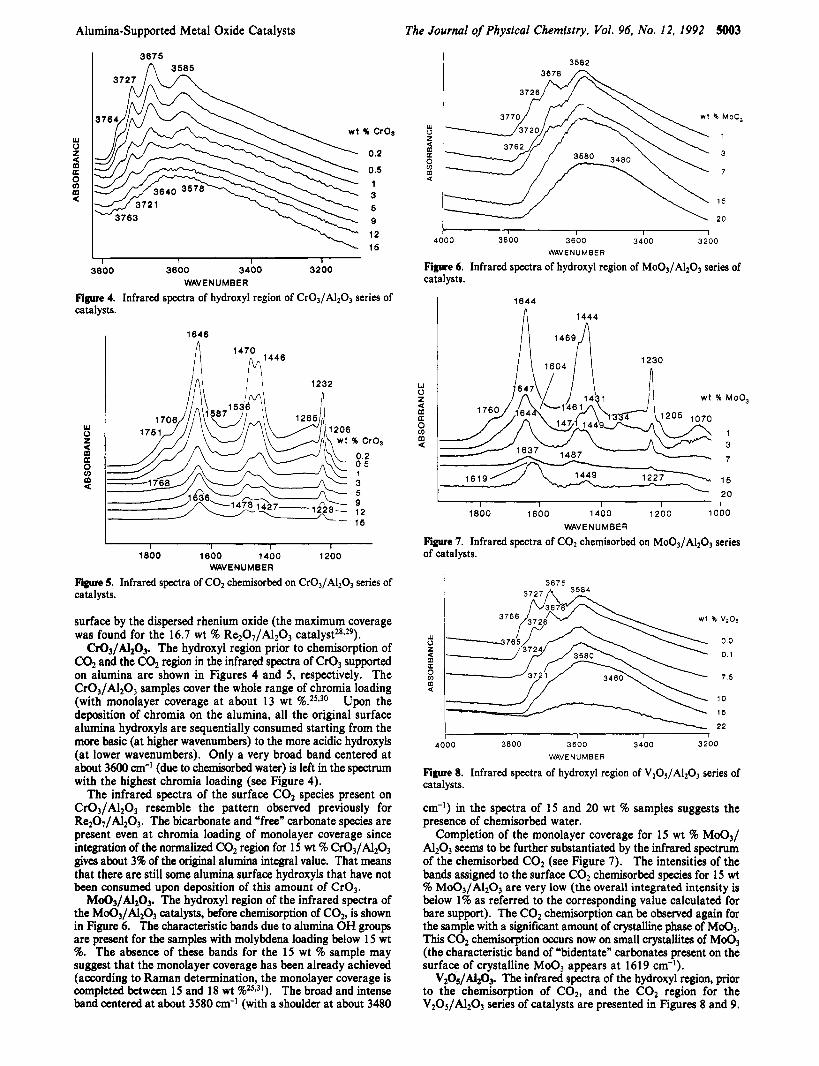
TABLE I: Assignment of IR Bands (cm-I) Observed upon Chemisorption of C02 on Pure Metal Oxides1s
simple molecules are used to probe unsaturated surface cations (Lewis acid sites: CO, NO, NH3, or pyridine as a probing molecule); weakly bonded surface protons (Br~rsted acid sites: NH3 or pyridine as a probing molecule); or surface hydroxyls (C02 as a probing molecule). The objectives of this work are to minitor the hydroxyl structure of these materials using IR spectroscopy and to study the IR spectra produced by C 0 2 and pyridine ad- sorption.
The IR assignments given in the literature for the species formed upon chemisorption of C 0 2 onto metal oxide surfaces are not completely consistent. According to Busca and L~renzelli '~ and Kiselew and Kryio~,'~ seven basic characteristic forms of the suface species can be detected (see Table I). The most frequently detected form of the surface chemisorbed C02 is the bicarbonate ion ('hydrogencarbonate ion"), HCOY. Thermal stability of this species is, however, reportedly lower than that of the other species. On decomposition, all the chemisorbed C02 species produce C02.
High-temperature infrared investigations of the adsorption of C 0 2 on 7-alumina have been reported by many authors.'620 According to Parkyns, the differences that appear in the recorded spectra may result from different pretreatment procedures applied in the specific studies.'" Busca and L~renzelli '~ have analyzed the existing assignments of the surface C 0 2 chemisorbed species on y-alumina and concluded that four types of surface C02 forms are usually observed: (i) two bands due to monodentate species at about 1530 and 1370 an-'; (ii) two bands assigned to bidentate species appearing in relatively broad ranges at 1730-1660 and 1270-1230 cm-I; (iii) two bands attributed to bridged surface C02 structures observed within a broad range at 1900-1750 and 1180 cm-I; (iv) four bands originating from bicarbonate species ap- pearing at 1650-1639,1490-1440, and 1236-1225 cm-' as well as in the hydroxyl region at 3610-3605 cd. There are also other bands reported in the literature with uncertain assignments (in the range 1780-1870 an-'), but according to Busca and Lorenzelli there is no band characteristic of "free carbonate species". Such an assignment has, however, been proposed by Rosynek for the
The Journal of Physical Chemistry, Vol. 96, No. 12, 1992 SO01
band appearing at 1445 cm-l.l6 Baumgarten and Zachos have concluded from their kinetics experiments that the unresolved band at 1455 cm-' in their IR spectra of adsorbed C 0 2 is actually a convolution of two bands: one assigned to the bicarbonate species and another one which can be attributed to a carbonate species (very likely "free carbonate species")2o. The IR study of these authors performed for deuterated samples of y-alumina showed that the surface C02 bands observed at 1647,1233, and 3612 cm-l for undeuterated ?alumina are shifted downward upon deuter- ation. This isotopic shift confirms that the bands are due to the surface hydrogencarbonate species. According to Little17 and Parkyns,'* the bands at 1530 and 1350 cm-' are caused by the monodentate carbonate form, while the bands at 1630-1590 and 127e1260 an-' are assigned by Little to the bidentate form. The bands at 1760 and 1180 an-' have been attributed by Fink to the bridging carbonate species.lg Similar assignments have also been proposed for C02 reactivity adsorbed on ~pa1umina.l~ The dif- ferences occur, however, for monodentate and bidentate species. The IR bands characteristic of the surface C02 monodentate form appear at 1600-1630 and 1470-1515 an-', while those due to the bidentate carbonate are observed at 1710 and 1315 cm-I, re- spectively.21*22 The physisorbed COz bands appear at about 2380 cm-'.20
The assignment of the IR bands in the hydroxyl region of y and rl-alumina has been thoroughly discussed by Knozinger and Ratnasamy in the context of the different coordination (tetrahedral or octahedral) of the surface aluminum cations bonded to the hydroxyl groups.1° Free hydroxyl groups on pure alumina are usually reported to possess the following vibrational frequencies: 3785-3800, 3760-3780, 3740-3745, 3730-3735, 368&3700 ~ 1 3 1 - I . ~ ~ The bands assigned to the more basic hydroxyls appear to be located at higher wavenumbers. The increase in acidity of a hydroxyl group shifts the corresponding band to a lower wavenumber. Quantum mechanical model cluster calculations has confmed the above conclusions drawn by Knozinger et al.loJ3 These calculations show that the acidity (as estimated both by the deprotonation energies and by the p i t ive charges on H atoms) increases in the sequence: OHo < OH' < OH" < OHto < OH"' (where t designates an A1 cation in tetrahedral coordination, and o designates an A1 cation in octahedral coordination), while the calculated stretching vibration frequencies decrease in the following order: vOHt > vOHO < v o w > vOHm > v ~ ~ ~ . ~ ~
Experimental Section The alumina-supported metal oxide catalysts were prepared
on Harshaw alumina (specific surface area 180 m2/g after cal- cination at 500 "C for 16 h). The vanadium oxide catalysts were prepared by incipient wetness impregnation of vanadium trieth- oxide oxide (Alpha) using methanol (Fisher certified ACS, 99.9% pure) as the solvent. The niobium oxide catalysts were prepared by the nonaqueous preparation technique using niobium ethoxide (Johnson Mattey) in propanol as the solvent. The alumina-sup ported rhenium oxide catalysts were prepared using the incipient wetness method; the alumina support was treated with a 60-70 wt % aqueous solution of perrhenic acid, HReO, (Alfa). The X-ray fluorescence and ICP analysis revealed that the Re contents ranged from 0.1 to 20 wt % Re/A1203 for samples dried at 120 OC and 0.1 to 12 wt % Re/A1203 (0.13-16.7 wt % R%07/A1203) after calcination at 500 "C. The latter series of Re/A1203 samples were used in the C 0 2 chemisorption experiments. The incipient wetness impregnation technique was also applied to prepare the alumina-supported chromium and molybdenum oxide catalysts. The alumina support was treated with an aqueous solution of Cr(N03)3 or ammonium heptamolybdate, respectively. The ti- tania/alumina catalysts were prepared by impregnating the alu- mina support with a nonaqueous solution of Ti[OCH(CH3)2]4 (Aldrich) in toluene. The more detailed description of the preparation techniques can be found e l~ewhere .~~
All samples were sieved through a 325-mesh sieve. The samples were pressed into 1.6-mm self-supporting wafers using a pressure of 6000 lbs (or higher) for 30 s. The wafers were mounted into a quartz cell (with NaCl windows attached to a glass gas han-
5002 The Journal of Physical Chemistry, Vol. 96, No. 12, 1992 Turek et al.
1644
1 1 4 4 1
I I I I I 3600 3000 2400 1800 1200
WAVE N U M BE R
Figure 1. Difference infrared spectrum of C02 chemisorbed on high surface area y-alumina.
dling/vacuum system). The FTIR data were collected using a Nicolet 170 sx FTIR spectrometer operating at a resolution of 4 cm-I with a liquid nitrogen cooled MCT detector and evacuated to 2 X Torr overnight at room temperature. The samples were heated under vacuum to 300 OC, at a rate of 10 OC/min, and kept at 300 OC for 90 min. Upon cooling at room temper- ature, the IR spectra of the hydroxyl region for the pretreated samples were recorded. The IR spectra of COz adsorbed on the alumina-supported metal oxide catalysts were obtained by exposing the samples to 50 Torr of C 0 2 (AGL, 99.99% purity; further purified by the freeze-thaw method) for 30 min, followed by evacuation to 2 X Torr for 30 min. The number of scans/spectrum was 100. The OH and COX infrared spectra were normalized to a constant thichess of 25 mg/cm2. The IR studies of the hydroxyl region and adsorbed C 0 2 were performed at Texaco.
The infrared spectra of the chemisorbed pyridine were obtained on an Analect fX-6160 FTIR spectrometer operating at a reso- lution of 2 cm-l. The samples were pressed into thin wafers (20-30 mg/cm2) and activated in situ in the IR cell (vacuum, 425 OC, 1 h). First, upon cooling the cell to 200 OC, the IR spectrum of the catalyst without pyridine was recorded. Then, pyridine was introduced into the cell at 5 Torr and contacted with the catalyst for 30 s. Physically adsorbed pyridine was subsequently desorbed by maintaining the sample in vacuum for 15 min. The IR spectrum of the chemisorbed pyridine was then recorded. The concentration of Bronsted and Lewis acid sites was evaluated from the intensities of PyH’ (1450 cm-I) and PyL (1540 cm-I) bands and their integrated extinction coefficients.26 The IR studies of pyridine adsorption were performed at Lehigh University.
Results The infrared spectrum of COz adsorbed on the pretreated
alumina support used in this study shows the features characteristic of five groups of chemisorbed COz surface species (Figure 1). The most intense bands at 1644, 1465, and 1227 cm-I are assigned to bicarbonate species, while the band at 1441 cm-’ reflects the presence of ‘free” carbonates. To minimize the interference from the alumina OH groups, the infrared spectrum of the bare support (without the chemisorbed COz surface species) was subtracted from the infrared spectrum with the chemisorbed COz surface species. Thus, an additional band at 3612 cm-’ characteristic of the OH group belonging to the surface bicarbonate species is revealed. Characteristic features of other chemisorbed species are present in Figure 1, though with less clarity. A band belonging to monodentate species can be observed at 1535 cm-’, while a band attributed to bidentate species can be found at 1262 cm-l (both the bands are not marked in Figure 1). The spectrum also reveals
3676
0.13
6.5
11.7
\ 15.6 I I I I
3800 3600 3400 3200 WAVE N U MBER
Figure 2. Infrared spectra of hydroxyl region of Re2O7/AI2O3 series of catalysts.
1646
% Re20,
0.13
6.5
11.7
- 15.6 I I I I I I
1800 1600 1400 1200 1000 WAVENUMEER
Figure 3. Infrared spectra of C02 chemisorbed on Re207/A1203 series of catalysts.
a band located at 1066 cm-’ which is very likely associated with one of the two forms of chemisorbed COz (the band position is closer to that o k e d for compounds with monodentate carbonate ligands.17 The shoulders protruding from the more intense bands at 1750, 1705, and 1200 an-] (not marked in Figure 1) also reveal the presence of a small fraction of the bridging COz surface species.
Re2O7/M2O3. The structures of surface rhenium oxide on alumina have been recently characterized by laser Raman spec- troscopy and X-ray absorption near-edge ~pec t roscopy.~~*~~ The hydroxyl region, before chemisorption of COz, and the COz region of the infrared spectra of Re207/A1203 catalysts are presented in Figures 2 and 3, respectively. From Figure 2 it can be seen that consumption of the alumina OH groups proceeds in a se- quential fashion. The bands due to more basic hydroxyls, located at higher frequencies, disappear first with the bands due to neutral and more acidic ones disappearing at higher loadings. The sample containing the highest amount of rhenia (15.6 wt % Rq0,/Al2O3) exhibits a broad band centered at about 3590 cm-I characteristic of chemisorbed water. The additional shoulder appearing at about 3460 cm-’ may be due to the hydroxyls associated with Bronsted acid sites appearing at higher loadings of the deposited ReZO7.’
Five different surface COz species can be observed at low loadings of rhenia, but only two types of the mast abundant surface carbonates (bicarbonates and ”free” carbonates) can be found at loadings close to monolayer coverage (see Figure 3). At high loadings of rhenia the positions of all the bands, except the band at 1469 cm-l belonging to the bicarbonate species, are slightly shifted downward. There is no Chemisorbed C 0 2 surface species left on the surface of alumina for the 15.6 wt % Re2O7/AlZO3 sample which by experimental determination corresponds to rhenia loading slightly below the maximum coverage of the alumina
Alumina-Supported Metal Oxide Catalysts
I 3075 3505
The Journal of Physical Chemistry, Vol. 96, No. 12, 1992 5003
3703
K CrOa
0.2
0.5 1 3 5 9 12 15
I I I I
3800 3000 3400 3200 WAVE N U MBER
Figure 4. Infrared spectra of hydroxyl region of Cr03/A1203 series of catalysts.
1640
% CrOJ
0.2 0 5 1 3 5 9 12 15
I I I I
1000 1000 1400 1200 WAVE NUMB E R
Figure 5. Infrared spectra of C02 chemisorbed on CrO3/AI2O3 series of catalysts.
surface by the dispersed rhenium oxide (the maximum coverage was found for the 16.7 wt % Re2O7/AI2O3 ~ a t a l y s t ~ * , ~ ~ ) .
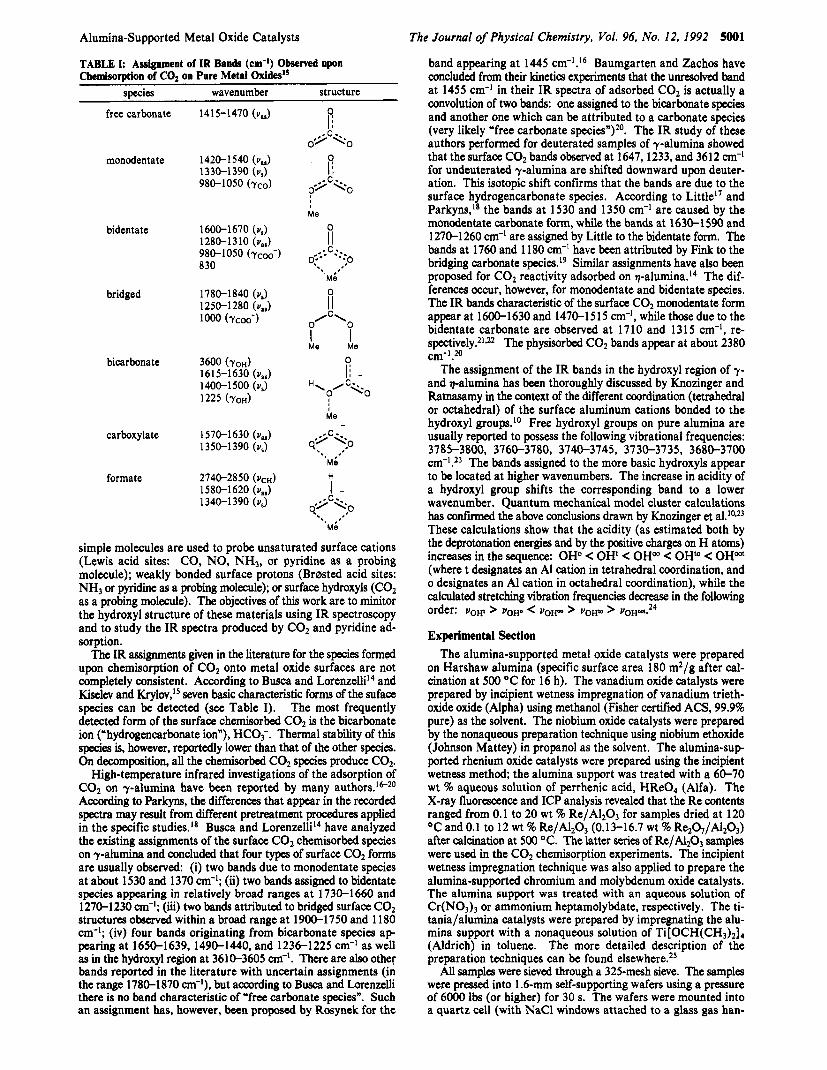
C r 0 3 / A 1 2 0 3 . The hydroxyl region prior to chemisorption of COz and the C02 region in the infrared spectra of Cr03 supported on alumina are shown in Figures 4 and 5, respectively. The Cr03/A1203 samples cover the whole range of chromia loading (with monolayer coverage at about 13 wt %.25*30 Upon the deposition of chromia on the alumina, all the original surface alumina hydroxyls are sequentially consumed starting from the more basic (at higher wavenumbers) to the more acidic hydroxyls (at lower wavenumbers). Only a very broad band centered at about 3600 cm-l (due to chemisorbed water) is left in the spectrum with the highest chromia loading (see Figure 4).
The infrared spectra of the surface COz species present on Cr03/A1203 resemble the pattern observed previously for Re207/A1203. The bicarbonate and ‘free” carbonate species are present even at chromia loading of monolayer coverage since integration of the normalized C02 region for 15 wt % cr03/&03 gives about 3% of the original alumina integral value. That means that there are still some alumina surface hydroxyls that have not been consumed upon deposition of this amount of Cr03.
Md3/&03. The hydroxyl region of the infrared spectra of the Md3/A203 catalysts, before chemisorption of C02, is shown in Figure 6. The characteristic bands due to alumina OH groups are present for the samples with molybdena loading below 15 wt %. The absence of these bands for the 15 wt % sample may suggest that the monolayer coverage has been already achieved (according to Raman determination, the monolayer coverage is completed between 15 and 18 wt %2J931). The broad and intense band centered at about 3580 cm-’ (with a shoulder at about 3480
3582 I
% MOO,
1
3
7
15
20 I I I
4000 3800 3600 3400 3200 WAVE N U M B E R
Figure 6. Infrared spectra of hydroxyl region of MoO3/AI2O3 series of catalysts.
I 1644
1230 A
1 3
7
15 20
I ~~
I I I I I 1600 1600 1400 1200 I000
WAVE N U M B E R
Figure 7. Infrared spectra of C02 chemisorbed on MoO3/AI2O3 series of catalysts.
a
1 22 I , I I i
4000 3800 3600 3400 3200 WAVE N U M BE R
Figure 8. Infrared spectra of hydroxyl region of V2O5/Al2O3 series of catalysts.
cm-’) in the spectra of 15 and 20 wt % samples suggests the presence of chemisorbed water.
Completion of the monolayer coverage for 15 wt % Moo3/ A 1 2 0 3 seems to be further substantiated by the infrared spectrum of the chemisorbed C 0 2 (see Figure 7). The intensities of the bands assigned to the surface C02 chemisorbed species for 15 wt % Mo03/A1203 are very low (the overall integrated intensity is below 1% as referred to the corresponding value calculated for bare support). The COz chemisorption can be observed again for the sample with a sisnificant amount of crystalline phase of M a 3 . This C02 chemisorption occurs now on small crystallites of M a 3 (the characteristic band of ‘bidentate” carbonates present on the surface of crystalline Moo3 appears at 1619 cm-I).
V205/A1203. The infrared spectra of the hydroxyl region, prior to the chemisorption of COz, and the C 0 2 region for the VZO5/A2O3 series of catalysts are presented in Figures 8 and 9.
5004 The Journal of Physical Chemistty, Vol. 96, No. 12, 1992
1647
1 4 f 1 ° 1231
Turek et al.
% v20,
0.0
0.1
7.5
10 15
22 I
I I I 1800 1600 1400 1200
WAVE N U M B E R
Figure 9. Infrared spectra of C02 chemisorbed on V2O5/AI2O3 series of catalysts.
3724 & Nb205
5
10
15
20
\ 25 I I I I I I
4000 3800 3600 3400 3200
WAVE NUMBER
Figure 10. Infrared spectra of hydroxyl region of Nb2O5/AI2O3 series of catalysts.
According to Raman determinations, the monolayer coverage for this series of catalysts is completed for the sample with 20 wt % loading of ~ a n a d i a . ~ ~ J ~ The infrared spectra of the hydroxyl region again show the sequential consumption of the alumina OH groups upon deposition of vanadia. For the 22 wt % sample only a broad and relatively weak band with a maximum at about 3600 cm-I remains: this band indicates the presence of chemisorbed water.
The change in intensity of the bands depicted in Figure 9 implies that, even for the sample exceeding the monolayer coverage of vanadia on alumina, the surface C02 chemisorbed species are still detectable (about 2% of the overall normalized integral area as compared with the bare support). However, only one band at 1613 cm-I is observed for the 22 wt % sample, probably associated with the presence of the bidentate C02 species anchored on the surface crystalline V205. For the alumina support this band is located at about 1587 cm-' and is overshadowed by the more intense band at 1647 cm-I.
mO5/AI2O, The infrared spectra of the hydroxyl region, prior to exposure to CO,, and the CO, region for Nb20S/A1203 are shown in Figures 10 and 11, respectively. The changes of intensity of the bands observed in the hydroxyl region follow the trend observed previously, however, with some differences. The 3769-cm-I band quickly disappears so that at higher loadings of niobia a -new* band between 3780 and 3800 cm-' is observed.
1643 n 1477
I I I I I I
1800 1600 1400 1200 1000
WAVE N U MBE R
Figure 11. Infrared spactra of C02 chemisorbed on Nb205/A1203 series of catalysts.
3675 3584
07,,7 f A
22 I I I
4000 3800 3600 3400 3200 3000
WAVE NUMB E R
Figure 12. Infrared spectra of hydroxyl region of Ti02/A1203 series of catalysts.
The 3724- and 3680-cm-' bands decrease in intensity but are still observed even for the samples in which the monolayer coverage has been exceeded (the monolayer coverage determined by Raman and XPS measurements corresponds to the 19 wt % ~ a m p l e ~ ~ , ~ ~ ) . At higher niobia loadings the broad band within the range 342Ck3580 c m - I , characteristic of the chemisorbed water and the niobia hydroxyls, is well-pronounced. A small feature is observed at about 3637 cm-'; however, the origin of this band is unknown.
All five types of the chemisorbed C02 surface forms can be identified in the infrared spectrum of the 5 wt % sample (Figure 11). The intensities of these bands decrease with niobia loading. For the 20 wt % sample (slightly above the monolayer coverage) the integral intensity of the overall region is evaluated as being below 1% of the corresponding value found for alumina.
TiO2/AIZO3. The last series of catalysts for which the infrared spectra have been recorded is TiOz/A1203. The infrared spectra of the hydroxyl region before CO, chemisorption and the COz region for Ti02/A1203 are shown in Figures 12 and 13. The monolayer coverage, according to Raman measurements, is achieved at titania loadings between 13.5 and 17 wt %6.2s The intensity patterns observed for the OH bands as the titania loading is increased has much in common with the pattern discussed for Nb20s/A1203 catalysts. The alumina OH groups are consumed selectively by the deposited titania. The original alumina hydroxyl band located at 3766 cm-' quickly disappears, but the decrease in intensity of the 3727- and 3675-cm-I bands is relatively low. These bands are still present even for the samples in which the monolayer coverage is already achieved or exceeded. At the same
Alumina-Supported Metal Oxide Catalysts The Journal of Physical Chemistry, Vol. 96, No. 12, 1992 SO05
W 0 z U m a
m 8 U
I I I 1 I
1800 1600 1400 1200 1000 WAVE NUMBER
Figure 13. Infrared spectra of C02 chemisorbed on Ti02/A1203 series of catalysts.
time, a “new” hydroxyl band can be observed at about 3785 cm-’ in the spectrum of the 22 wt % sample. The broad band at 3580 ad, due to chemisorbed water, can also be observed. In addition, another broad band at about 3460 cm-’ is revealed. The nature of this band is not quite understood.
The intensity pattern observed for the bands present in the C02 region of the titania/alumina infrared spectra resembles the patterns already discussed for CrO3/AI2O3 and Re207/A1203. Five types of C 0 2 chemisorbed surface species can be identified in the spectrum of 5 wt % Ti02/A1203, while only two types (bicarbonates and “free” carbonates) of the chemisorbed C 0 2 surface forms can be found in the infrared spectra of the 13.5 and 17 wt % samples. Integration of the overall C02 region, performed after normalization, reveals that for the 22 wt % catalyst still about 8% of the original integral area is still retained (the COz region for alumina is used as a reference). Such a high ratio can be partly attributed to the secondary C02 chemisorption which takes place on the surface of crystalline TiOz. The band with a maximum at about 1600 cm-l is very characteristic of the bidentate carbonate species which are formed on the surface of Ti02 (anatase) (the original band position according to Busca and Lorenzelli is 1580 cm-l 1 4 ) .
of pyridine. The pyridine adsorption experiments monitored by infrared spectroscopy have been performed on se- lected pairs of catalysts, with low and high concentration of the supported metal oxide, respectively. The results are tabulated in Table 11. All the samples reveal significant amounts of Lewis acid sites (LAS) present on the surface. The highest concentration of LAS, exceeding the value found for the bare support, has been detected for a low loading sample of Nb20S/A1203 (the detailed study of this system will be reported elsewhe&‘). Relatively low concentrations of LAS have been detected for Cr03/A1203 and VzOS/A1205. Bransted acid sites (BAS) are present only in the samples with high concentration of the deposited metal oxide, except for Cfi3/Al203 and Ti02/A1203 systems, where this type of acidity has not been found. The highest concentration of Bransted acid sites has been found for a high loading sample of VZOS/Al2OS. In fact, this sample is the only one where the amount of detected BAS is higher than that of LAS. Note also that the pyridine adsorption experiments were performed on a different IR system (see Experimental Section) and that the samples were evacuated at 425 OC prior to pyridine adsorption in order to removal residual moisture.
Discussion The infrared spectra of the hydroxyl region of the alumina-
supported metal oxides investigated in the present work can be divided into two categories. The first group includes the catalytic
TABLE Ik Acidic Properties of Al~mi~-S~pported Metal Oxide Catalysts
amount of BAS, amount of LAS, catalyst wnollg rrmolla
systems such as Re207/A1203, Cr03/A1203, Mo03/A1203, and V20S/Alz03, which (i) undergo systematic and sequential elim- ination of the alumina OH bands (from those located at higher wavenumbers to those located at lower wavenumbers) with in- crease in loading of the deposited metal oxide, and (ii) show the complete disappearance of the alumina hydroxyl bands at loadings exceeding monolayer coverage. The second group includes Ti02/A1203 and Nb2OS/Al2O5. A preliminary analysis of the spectral characteristics of these systems for high loadings of the deposited metal oxide may suggest that during the deposition of titania or niobia on alumina the alumina hydroxyls are not com- pletely consumed. However, the hydroxyl bands observed in the spectra of niobia/alumina (Figure 10) and titania/alumina (Figure 12) at loadings exceeding a monolayer coverage originate with the hydroxyls present on crystalline titania (anatase) or n i ~ b i a . ~ ~ , ~ ~ Thus, the hydroxyl bands assigned to the hydroxyls present on alumina are replaced in these spectra by the hydroxyl bands due to hydroxyls present on crystalline titania or niobia, respectively. The positions of these bands happen to coincide with those due to the hydroxyls on the alumina support. An unexpected feature observed in the spectra is a low-intensity band with maximum at about 3785-3800 cm-I. In general, all the alumina-supported metal oxide systems undergo a sequential elimination of the alumina OH bands with increasing surface metal oxide coverage.
The hydroxyl region in the IR spectra of rhenia/alumina catalysts has been recently presented in the paper by Sibeijn et al.36 The changes in the intensities of the hydroxyl bands upon increasing the rhenia loading also point to the selective con- sumption of the alumina OH groups by the deposited Re207. During the deposition, the Reo4- ions react predominantly with the basic alumina hydroxyls and at higher loadings of rhenia subsequently with the neutral and acidic alumina OH group. This conclusion is in agreement with our data. An increase in the intensity of the entire hydroxyl region for the 3 wt % R%07/A1203 sample reported in the paper by Sibeijn et al.36 seems to be, however, rather artificial and probably caused by an inadequate normalization procedure of the hydroxyl region to correct for sample weight and rhenia loading. Such a behavior cannot be easily explained and is not confirmed by our data which, even in the case of 0.1 wt % Re207/A1203, indicate a decrease of the intensity of the overall OH region by about 2% (upon suitable normalization). The decrease in intensity of the alumina OH bands with increasing rhenia loading can be observed over the entire range of rhenia loading investigated in the present work. The characteristic OH band intensity pattern observed for the rhenia/alumina series of catalysts is also observed for the other catalytic systems investigated in the present work (Cr03/A1203, Mo03/A1203, and V205/A1203).
All the investigated alumina-supported metal oxide systems possess a broad and intense band centered at about 3580-3600 cm-l in the hydroxyl region. This band is especially well pro- nounced at high loadings of the supported metal oxide when the alumina hydroxyl bands gradually disappear. In the spectrum of a bare support (see Figure 8 or 12) it is located at 3584 cm-’. This band is usually attributed to chemisorbed water. The band
Turek et al. 5006 The Journal of Physical Chemistry, Vol. 96, No. 12, 1992
can still be observed upon calcination of yalumina at 400 O C and disappears only upon calcination at 500 0C.37 The chemisorbed water interacts with “free” hydroxyls of alumina through hydrogen bonds or hydroxyl bonds. It may also form hydrogen bonds with surface oxygens of the support. Since there are few types of hydroxyls on the surface of y- or ~palumina?~ the interaction of these hydroxyls with the water molecules should lead to formation of several different types of hydrogen-bonded or hydroxyl-bonded structures. That would result in a very broad and practically unresolvable profile of the OH stretching region in the corre- sponding infrared spectrum. The characteristic shoulder located at about 3460-3490 cm-I, observed for the catalysts with the supported metal oxide loading close to the corresponding mono- layer coverage, is probably related to the formation of such H- bonded structures. Similar considerations have been presented by Ghiotti et for hydroxylated aerosil silica, but in their work the situation is much clearer and the infrared bands belonging to particular structures are relatively well pronounced due to the existence of only one type of silica OH groups. Moreover, in the case of titania/alumina and niobia/alumina catalysts, with loadings e x d i n g monolayer coverage, the interactions between the water molecules and the hydroxyls present on the surface of the crystalline phase of the deposited metal oxide will produce other bands appearing in the same region of the IR spectrum.
The infrared spectra of the surface species formed upon chemisorption of C02 onto the exposed surface of alumina reveal one common pattern characteristic of all the supported metal oxide systems investigated in the present paper. At very low loadings of the supported metal oxide, five different forms of the chemi- sorbed C02 surface species can be detected: bicarbonates and “free” carbonates with the infrared bands of the highest and comparable intensity, bridging carbonates with the fingerprint bands mostly at the highest wavenumbers in the region, and some traces of monodentate and bidentate carbonates with the very weak bands located at 1265 and 1587 an-’, respectively (see for instance Figure 3). With the increased loading of the supported metal oxide, the bands due to the last three forms quickly disappear. Comparison with the hydroxyl region in the corresponding infrared spectra suggest that these surface C 0 2 species are related to the most basic alumina OH groups that are being consumed by the first portions of the deposited metal oxide. The bicarbonate and “free” carbonate surface species appear to be related to the more neutral and acidic alumina hydroxyls. The bands of the surface chemisorbed C02 species are almost completely suppressed for the samples with metal oxide loadings that are known to corre- spond to monolayer coverage. Furthermore, the reappearance of the bands due to the surface chemisorbed C02 forms, originating mostly from bidentate species anchored on the crystalline phase of the deposited metal oxide (with the characteristic band at about 1610 an-’), provides additional evidence that monolayer coverage has already been exceeded.
The results of pyridine chemisorption (see Table 11) are basically in agreement with previous de t e rmina t ion~ .~J~-~~ All the inves- tigated catalysts possess measurable amounts of Lewis acid sites at both low and high loadings of the supported metal oxide, but Brsnsted acidity is detected only in samples with high surface coverages of the deposited metal oxide. The only discrepancy with the prior literature has been found for a high loading Cr03/A1203 catalyst, which according to Segawa and HallI3 should possess some detectable Bronsted acidity (comparable with Rq07/A1203). There are also no Brolnsted acid sites detectable for Ti02/A1203. It is possible, however, that there is still some residual Brensted acidity (< lo pmol/g) which was not detected because of the limitations of the applied technique. In fact, the relative acidities determined experimentally by Murrell et aL40 for the light gas oil cracking reaction imply that the amounts of Bronsted acid sites on Ti02/A1203 are relatively low compared with W03/A120, and Nb2O5/Al2O3. The experimental data collected by Murrell et al. represent the values measured after 0.5 h of the test reaction. Comparison of the Bronsted acidity measurements for the oxidized metal oxides (see Table 11) with the corresponding cracking oil measurements of Murrell et al. suggests that the low cracking
activities of the Re207/A1203, Cr03/A1203, Mo03/A1203, and V205/A1203 catalysts are due to the reduction of these sites during the gas oil cracking experiments because reducing conditions destroy the Bronsted acid sites.I3 Thus, the strength of Brsnsted acid sites as well as the reducibility of the metal oxide species are important parameters in determining the gas oil cracking activities.
Recent in situ Raman study on the structures of the alumi- na-supported metal oxides leads to the conclusion that the ap- pearance of Bronsted acidity at high loadings of the deposited metal oxide is associated with the increase of the surface density of the molecularly dispersed surface ~pecies.2~ Bronsted acid sites on low coverage samples of the alumina-supported catalysts are not observed. Thus, a “crowding” effect seems to be a necessary though probably insufficient condition (see Table 11) to create Brsnsted acid sites. In this context, the existing theories of surface acidity seem completely to fall short on explaining the effect of increased surface c o ~ e r a g e . ~ ’ . ~ ~ Tanabe’s model?’ originally proposed for diluted binary metal oxide systems, takes into account only the local environment of the minor cation component im- bedded in the overwhelming bulk of the second metal oxide. The isolated local structures are also assumed by the Dumesic and Kataoka model of Brsnsted acid site for the species present on the surface of the supporting metal In effect, both models address only the presence or absence of Brensted acid sites in the systems with relatively low concentration of the second metal oxide component. Rather simplified surface structures are also assumed by Bemholc et a1.40 in model quantum mechanical calculations of the Bransted acid sites in the alumina-supported metal oxides (titania, niobia, and tungsta). The results of their calculations point to an important role of the support and suggest that the observed differences in Brsnsted acidity may be related to the number of terminal OH bands in each particular surface metal oxide structure. The proposed model structures correspond, however, to the isolated structures which are characteristic of the low-coverage limit where Bronsted acid sites are not detected. Therefore, these results, though consistent with the experimental findings, should be viewed with caution. According to the results of recent in situ Raman experiments, at high loadings of the alumina-supported metal oxide the surface rhenia exist as 4-fold coordinated monomeric species, and the surface chromia and vanadia as Cfold coordinated polymeric species, while all the other metal oxides discussed here possess 6-fold coordinated polymeric or cluster ~ t ruc tures .~~ Comparison of these structural data with the results of the pyridine adsorption experiments leads to the conclusion that there is no direct relationship between the structures of the surface metal oxide species and their acidity.
In situ Raman studies of the surface rhenia species at high rhenia loadings on alumina have revealed the presence of two different monomeric rhenia forms with the same C,, symmetry.28 Since Bmnsted acid sites are observed only at high rhenia loadings, it is reasonable to assume that there is a relationship between one of these forms and Bransted acidity. The simplest conceivable model of a Bransted acid site that can be proposed here consists of two surface moieties sharing a common proton located between two oxygens belonging to two different neighboring Me-0-A1 and Me’e-Al’ fragments (where Me and Me’ are metal atoms of the deposited metal oxide). The proposed model is able to explain, for instance, why upon reduction of the catalyst the surface hydroxyls are easily restored and why upon heating the Rq07/A1203 catalyst the rhenium oxide is so easily expelled from the surface (the structure of two coupled surface rhenia monomers is very similar to the structure of the gaseous rhenium oxide dimer). The model has a general character, and it accounts for the lack of influence of the molecular structure of the surface metal oxide species upon the Bronsted acidity. We believe that no matter what are the structures of the proton connected surface metal oxide units, if they are in the privilaged configuration to each other the Bronsted acid site is formed.
C o a c l us i o as The following general conclusions related to all the alumina-
supported metal oxide catalysts investigated in the present study
Alumina-Supported Metal Oxide Catalysts The Journal of Physical Chemistry, Vol. 96, No. 12, 1992 5007
have been found to be valid: (i) During the deposition of a metal oxide on the surface of alumina, two processes are reflected in the hydroxyl region of the infrared spectra: (a) a sequential disappearance of the alumina OH groups and (b) the appearance of a “new” low frequency band at about 3460-3490 cm-’ (ten- tatively assigned to water molecules H-bonded to the Bransted acid sites). In addition, for high metal oxide loaded samples of titania/alumina and niobia/alumina, the hydroxyl bands of the OH groups present on the surface of crystalline phases of the deposited metal oxide can be also observed. (ii) The chemisorbed C 0 2 surface species are anchored only on the uncovered parts of the exposed surface of the alumina support. At very low loadings of the supported metal oxide the chemisorbed C 0 2 species can be assigned as bicarbonates (or hydrogencarbonate) ions, “free carbonate ions”, “bridging” carbonates, “monodentate” carbonates, and “bidentate” carbonates. At high loadings of the supported metal oxide only the first two species can be identified in the corresponding infrared spectra. Comparison of the present data with the results of in situ Raman experiments leads to the con- clusion that there is no direct relationship between surface metal oxide structures and (a) surface hydroxyl chemistry, (b) C 0 2 chemisorption patterns, and (c) Bransted acidity. Moreover, for the samples exceeding monolayer merage the effect of additional C 0 2 chemisorption on crystalline particles of the deposited metal oxide is experimentally confirmed. (iii) At monolayer coverage the percent of unoccupied surface of the alumina support is, in all cases, lower than 3%. This fmdmg confhns that the completion of the monolayer, as determined by C 0 2 chemisorption, occurs at essentially the same loading of the deposited metal oxide as determined in other experiments (Raman, XPS). In addition, the results of pyridine chemisorption have been quantified, and a simple model of a Bransted acid site has been proposed.
References and Notes (1) Schuit, G. C. A.; Gates, B. C. AIChE J. 1973,19,417. (2) Massoth, F. E. Ado. Coral. 1978, 27, 265. (3) Grange, P. Catal. Reu.-Sci. Eng. 1980, 21. (4) Lin, C. J.; Aldag, A. W.; Clark, A. J. Catal. 1974, 34, 494. (5) Lin. C. J.; Aldag, A. W.; Clark, A. J. Caral. 1976, 45, 287. (6) Mol, J. C.; Moulijn, J. A. Adu. Caral. 1975, 24, 131. (7) Xiaoding, Xu; Boelhouwer, C.; Vonk, D.; Benecke, J. I.; Mol. J. C. J .
(9) Goldwasser, J.; Engelhardt, J.; Hall, W. K.; J. Caral. 1981, 70, 275. (10) Knozinger, H.; Ratnasamy, P. Coral. Rev.-Sci. Eng. 1978,17,31, (11) Bosch, H.; Janssen, F. Caral. Today 1988, 2, 369. (12) Kijenski, J.; Baiker, A. Caral. Today 1989, 5, 1. (13) Segawa, K.; Hall, W. K. J. Caral. 1982, 76, 133. (14) Busca, G.; Lorenzelli, V. Mater. Chem. 1982, 7, 89. ( I 5) Kiselev, V. F.; Krylov, 0. V. Adsorption and Catalysis on Transition
Metals and Their Oxides; Springer Series in Surface Sciences; Ertl, G., Gomer, R., Eds.; Springer-Verlag: Berlin, 1989; Vol. 9.
(16) Rosynek, M. P. J. Phys. Chem. 1975, 79, 1280. (17) Little, L. H. Infrared Spectra of Adsorbed Species; Academic Press:
London, 1966. (18) Parkyns, N. D. J. Phys. Chem. 1971, 75, 526. (19) Fink, P. Z . Chem. 1967, 7, 324. (20) Baumgarten, E.; Zachos, A. Spectrochim. Acta 1981, 37A, 93. (21) Amenomiya, Y.; Morikawa, Y.; Pleizier, G. J. Catal. 1977,46,431. (22) Morterra, C.; Zacchina, A.; Coluccia, S.; Chiorino, A. J . Chem. Soc.,
Faraday Trans. 1 1977, 73, 1544. (23) Boehm, H.-P.; Knozinger, H. In Catalysis: Science and Technology;
Anderson, J. R., Boudart, M., Eds.; Springer-Verlag: New York, 1983; Vol. 4, p 49.
(24) Zhidomirov, G. M.; Kazansky, V. B. Adu. Caral. 1986, 34, 131. (25) Vuurman, M. A.; Wachs, I. E. J . Phys. Chem., in press. (26) Datka, J.; Turek, A. M.; Jehng, J. M.; Wachs, I. E. J. Caral. 1992,
(27) Hardcastle, F. D.; Wachs, I. E.; Horsley, J. A.; Via, G. H. J . Mol.
(28) Vuurman, M. A.; Wachs, I. E.; Stukens, D. J.; Oskam, A. Submitted
(29) Hardcastle, F. D.; Wachs, I. E. J . Mol. Caral. 1988, 46, 173. (30) Vuurman, M. A.; Hardcastle, F. D.; Wachs, I. E., to be published. (31) Chan, S. S.; Wachs, I. E.; Murrell, L. L.; Wang, L.; Hall, W. K. J .
Phys. Chem. 1984,88, 5831. (32) Deo, G.; Wachs, I. E. J . Catal. 1991, 129, 307. (33) Jehng, J. M.; Hardcastle, F. D.; Wachs, I. E. Solid State Ionics 1989,
32133,904. (34) Aranjo Gonzalez, W.; Nunes, P. P.; Lam, Y. L.; Guenin, M.; Primet,
M.; Teichner, S . J. In 5th Brasilian Symposium on Caralysis, IBP ed.; 1989; p 466.
(35) Chung, J. S.; Miranda, R.; Bennett, C. 0. J . Chem. SOC., Faraday Trans. 1 1985, 81, 19. (36) Sibeijn, M.; Spronk, R.; van Veen, J. A. R.; Mol, J. C. Carol. Lerr.
1991, 8, 201. (37) Borello, E.; Della Gatta, G.; Fubini, B.; Morterra, C.; Venturello, G.
J . Caral. 1974, 35, 1. (38) Ghiotti, G.; Garrone, E.; Morterra, C.; Bocuzzi, F. J. Phys. Chem.
1979,83, 2863. (39) Kiviat, F. E.; Petrakis, L. J. Phys. Chem. 1973, 77, 1232. (40) Bernholc, J.; Horsley, J. A.; Murrell, L. L.; Sherman, L. G.; Soled,