Acidification constraints on carbon and nitrogen (mainly soil) dynamics Filip Oulehle, Chris Evans, Henning Meesenburg, Jakub Hruška, Pavel Krám, Oldřich Myška, Jiří Kopáček, Jack Cosby, Dick Wright
Transcript
Acidification constraints on carbon and nitrogen (mainly soil)
dynamics
Filip Oulehle, Chris Evans, Henning Meesenburg, Jakub Hruška, Pavel Krám, Oldřich Myška, Jiří Kopáček, Jack Cosby, Dick Wright
Six things that I am going to talk about:
• Global extent of acid deposition (S and N)
• Effects of acid deposition on forest soil carbon accumulation
• Effects of acid deposition on DOC leaching from soils
• Linkages between DOC availability and soil respiration
• Effects of acid deposition on forest productivity
• Coupled C and N dynamics in MAGIC model
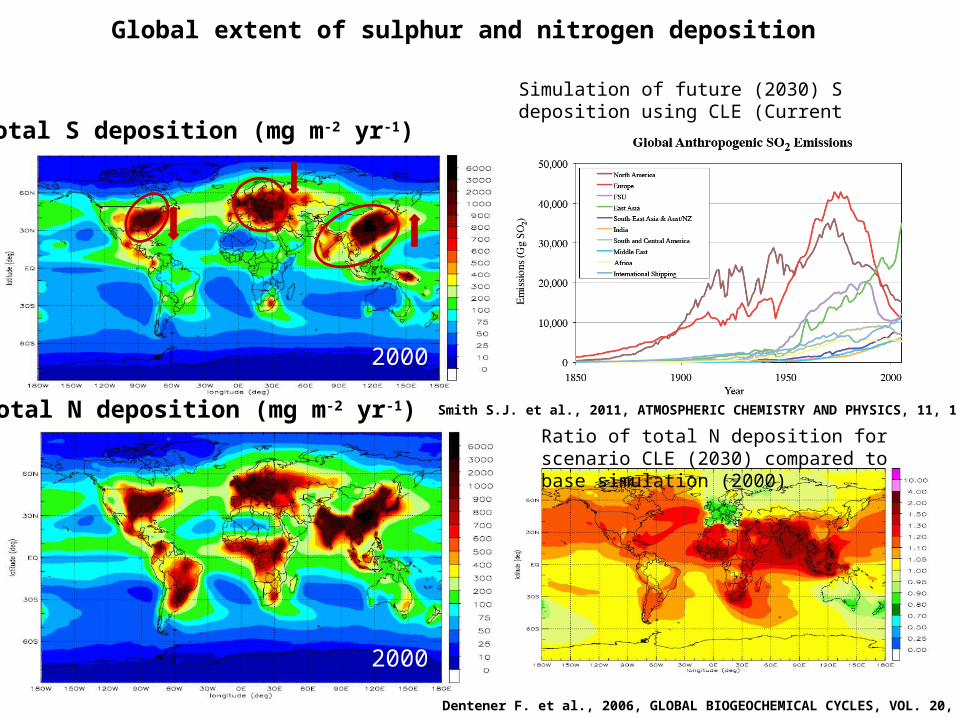
Total S deposition (mg m-2 yr-1)
2000
Total N deposition (mg m-2 yr-1)
2000
Dentener F. et al., 2006, GLOBAL BIOGEOCHEMICAL CYCLES, VOL. 20, GB4003
Ratio of total N deposition for scenario CLE (2030) compared to base simulation (2000)
Simulation of future (2030) S deposition using CLE (Current Legislation scenario)
Smith S.J. et al., 2011, ATMOSPHERIC CHEMISTRY AND PHYSICS, 11, 1101–1116
Global extent of sulphur and nitrogen deposition
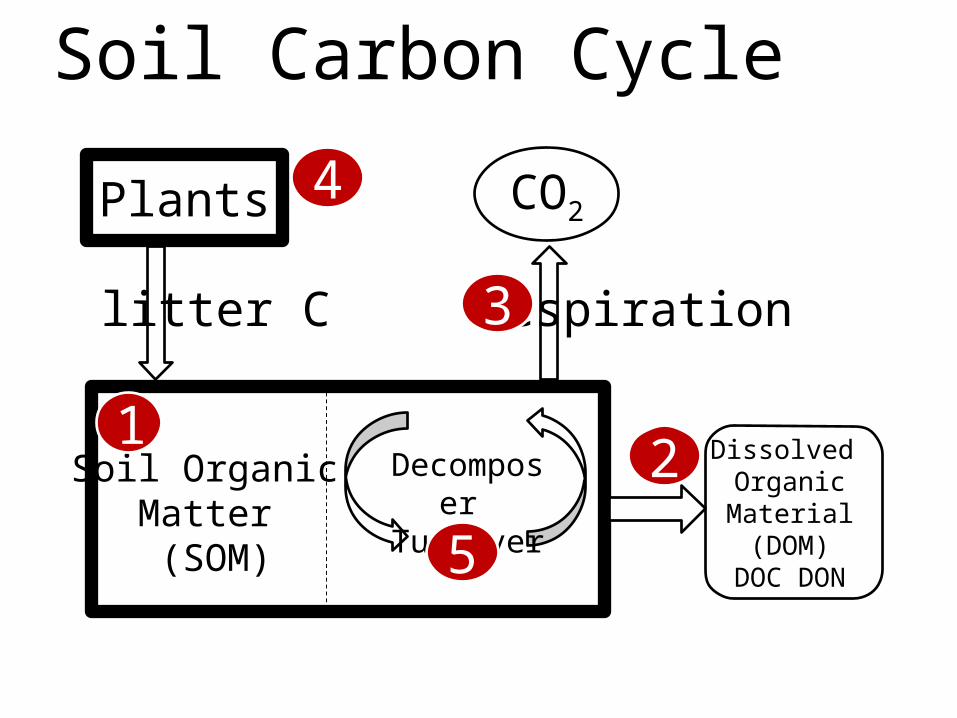
Soil Carbon Cycle
Plants
Soil Organic Matter (SOM)
Decomposer Turnover
CO2
litter C respiration
Dissolved Organic Material (DOM)
DOC DON
12
3
4
5
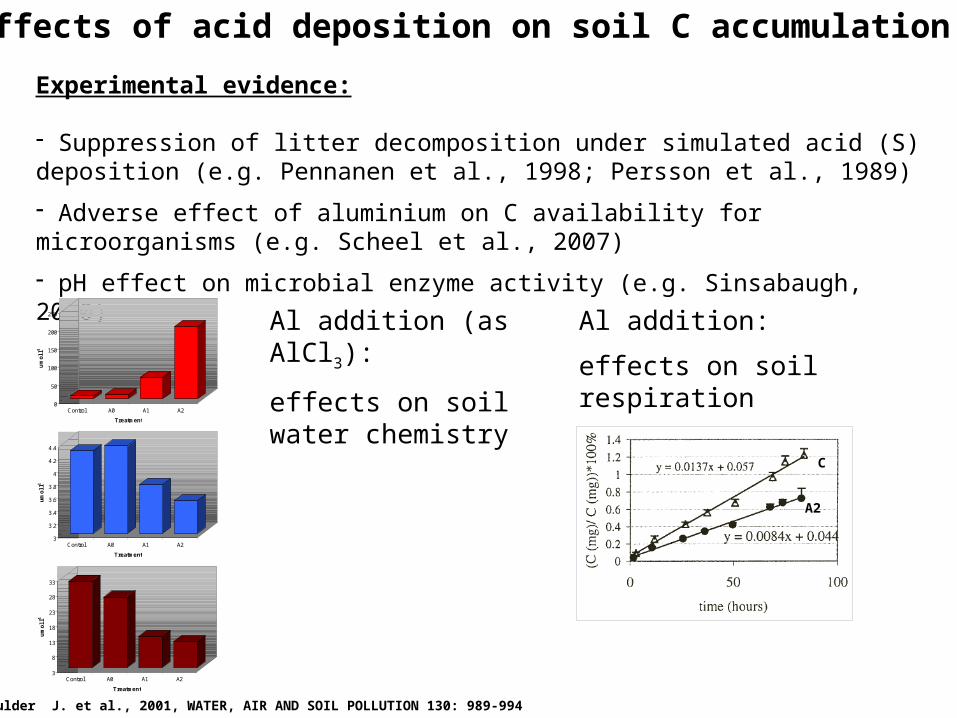
Effects of acid deposition on soil C accumulation
Experimental evidence:
- Suppression of litter decomposition under simulated acid (S) deposition (e.g. Pennanen et al., 1998; Persson et al., 1989)
- Adverse effect of aluminium on C availability for microorganisms (e.g. Scheel et al., 2007)
- pH effect on microbial enzyme activity (e.g. Sinsabaugh, 2010)
Al addition (as AlCl3):
effects on soil water chemistry
Al addition:
effects on soil respiration
C
A2
0
50
100
150
200
250
um
ol l
-1
Control A0 A1 A2
Treatment
Aluminium
3
3.2
3.4
3.6
3.8
4
4.2
4.4
um
ol l
-1
Control A0 A1 A2
Treatment
pH
3
8
13
18
23
28
33
um
ol l
-1
Control A0 A1 A2
Treatment
DOC
Mulder J. et al., 2001, WATER, AIR AND SOIL POLLUTION 130: 989-994
Long-term evidence:- Across Czech forest catchments (n=14), S bulk deposition explained 32% variability in soil C/N ratio and 50% variability in forest floor depth (Oulehle et al., 2008)
Nacetin spruce forest research plot:
Source www.emep.int
Wet deposition of sulphur (top) and nitrogen (bottom) in Europe based on the EMEP model
Effects of acid deposition on soil C accumulation
0
10
20
30
40
50
60S throughfallN bulk
S an
d N
dep
ositi
on (k
g ha
-1 y
r-1)
1994 1997 2003 20100
5
10
15
20
5.80 5.33 4.18 3.74
Forest floor massForest floor C pool
Fo
rest
flo
or
OM
po
ol
(kg
m-2
)
Oulehle F, Evans C.D., Hofmeister J et al., 2011, GLOBAL CHANGE BIOLOGY 17, 3115-3129
0
10
20
30
40
50
60
f(x) = − 2.60127411635608 x + 48.8546156167492R² = 0.887078505318422
S throughfallLinear (S throughfall)N bulk
S an
d N
dep
ositi
on (k
g ha
-1 y
r-1)
1994 1997 2003 20100
5
10
15
20
5.80 5.33 4.18 3.74
Forest floor massForest floor C pool
Fo
rest
flo
or
OM
po
ol
(kg
m-2
)
y=-0.133x + 269.83R2=0.95
Nacetin spruce forest research plot:
- Forest floor C pool reduced by 47% since 1994
- Total S deposition reduced by 77% since 1994
dC/dS = 509
Oulehle F, Evans C.D., Hofmeister J et al., 2011, GLOBAL CHANGE BIOLOGY 17, 3115-3129
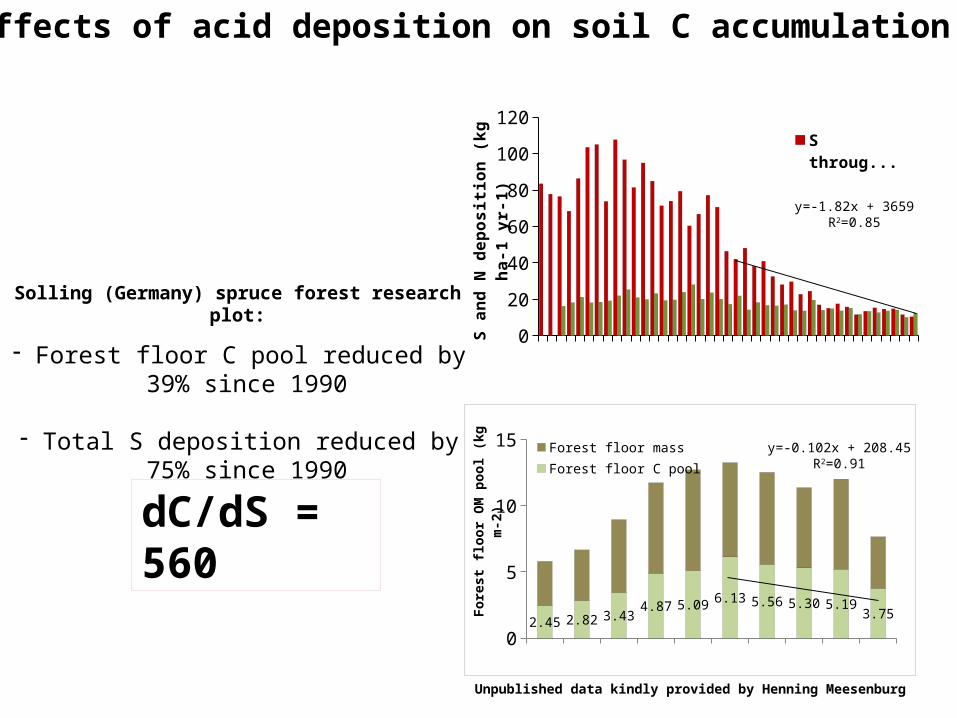
Effects of acid deposition on soil C accumulation
Solling (Germany) spruce forest research plot:
Source www.emep.int
Wet deposition of sulphur (top) and nitrogen (bottom) in Europe based on the EMEP model
Unpublished data kindly provided by Henning Meesenburg
Effects of acid deposition on soil C accumulation
- Forest floor C pool reduced by 39% since 1990
- Total S deposition reduced by 75% since 1990
Solling (Germany) spruce forest research plot:
dC/dS = 560
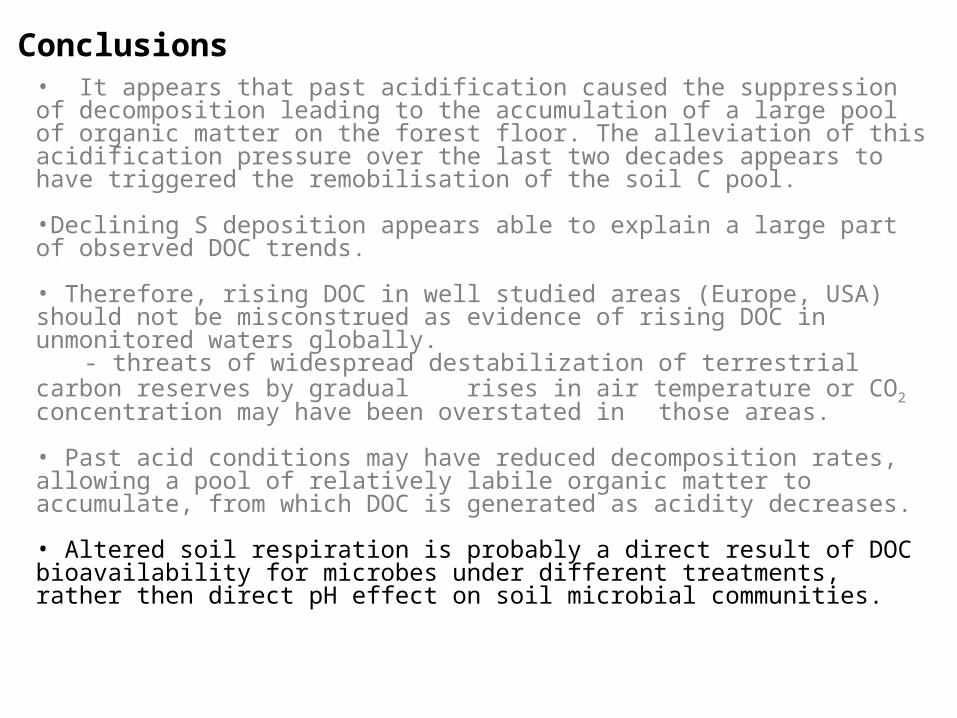
• It appears that past acidification caused the suppression of decomposition leading to the accumulation of a large pool of organic matter on the forest floor. The alleviation of this acidification pressure over the last two decades appears to have triggered the remobilisation of the soil C pool.
Conclusions
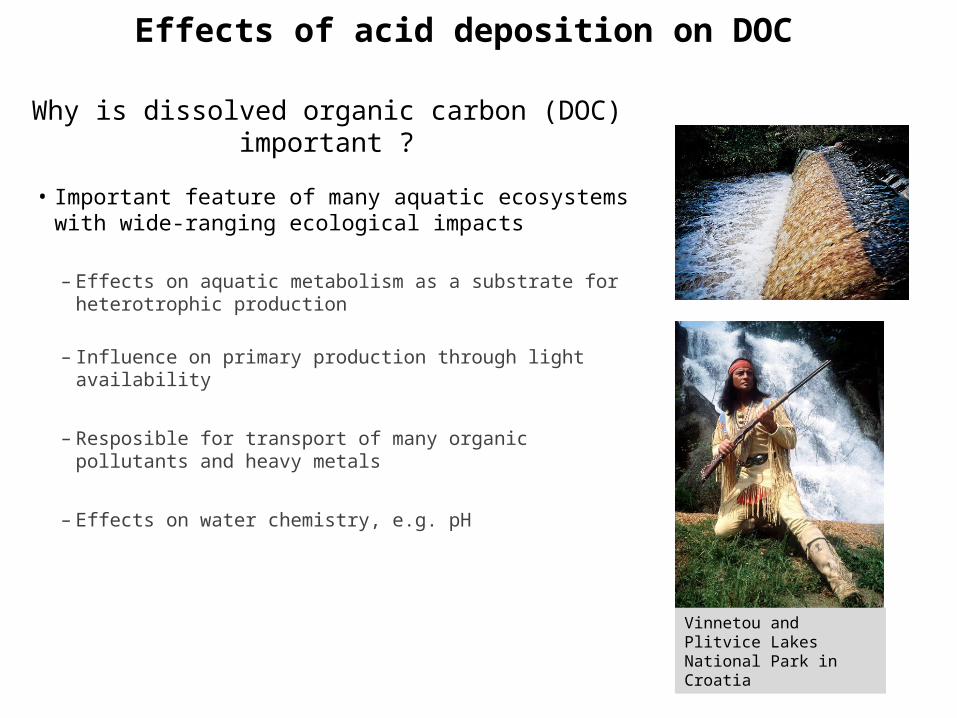
Why is dissolved organic carbon (DOC) important ?
• Important feature of many aquatic ecosystems with wide-ranging ecological impacts
– Effects on aquatic metabolism as a substrate for heterotrophic production
– Influence on primary production through light availability
– Resposible for transport of many organic pollutants and heavy metals
– Effects on water chemistry, e.g. pH
Vinnetou and Plitvice Lakes National Park in Croatia
Effects of acid deposition on DOC
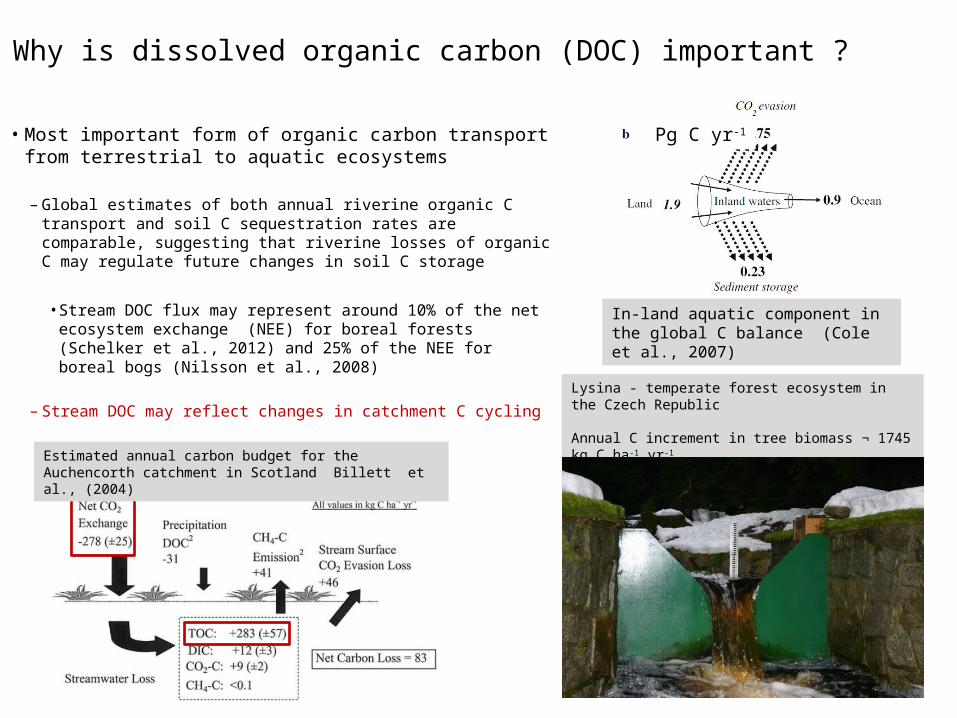
Why is dissolved organic carbon (DOC) important ?
• Most important form of organic carbon transport from terrestrial to aquatic ecosystems
– Global estimates of both annual riverine organic C transport and soil C sequestration rates are comparable, suggesting that riverine losses of organic C may regulate future changes in soil C storage
• Stream DOC flux may represent around 10% of the net ecosystem exchange (NEE) for boreal forests (Schelker et al., 2012) and 25% of the NEE for boreal bogs (Nilsson et al., 2008)
– Stream DOC may reflect changes in catchment C cycling
Estimated annual carbon budget for the Auchencorth catchment in Scotland Billett et al., (2004)
Lysina - temperate forest ecosystem in the Czech Republic
Annual C increment in tree biomass ¬ 1745 kg C ha-1 yr-1
Annual DOC flux – 97 kg C ha-1 yr-1 (6%)
Pg C yr-1
In-land aquatic component in the global C balance (Cole et al., 2007)
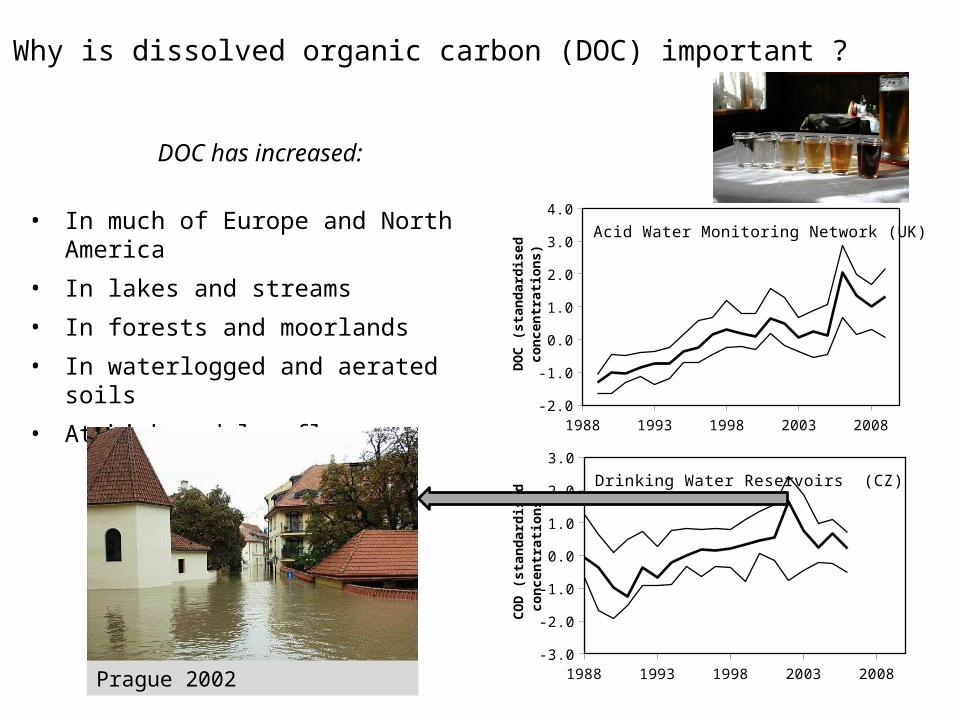
Why is dissolved organic carbon (DOC) important ?
DOC has increased:
• In much of Europe and North America
• In lakes and streams
• In forests and moorlands
• In waterlogged and aerated soils
• At high and low flows
1988 1993 1998 2003 2008-2.0
-1.0
0.0
1.0
2.0
3.0
4.0Acid Water Monitoring Network (UK)
DO
C (
stan
dar
dis
ed c
on
cen
tra-
tio
ns)
1988 1993 1998 2003 2008-3.0
-2.0
-1.0
0.0
1.0
2.0
3.0Drinking Water Reservoirs (CZ)
CO
D (
stan
dar
dis
ed
con
cen
trat
ion
s)
Prague 2002
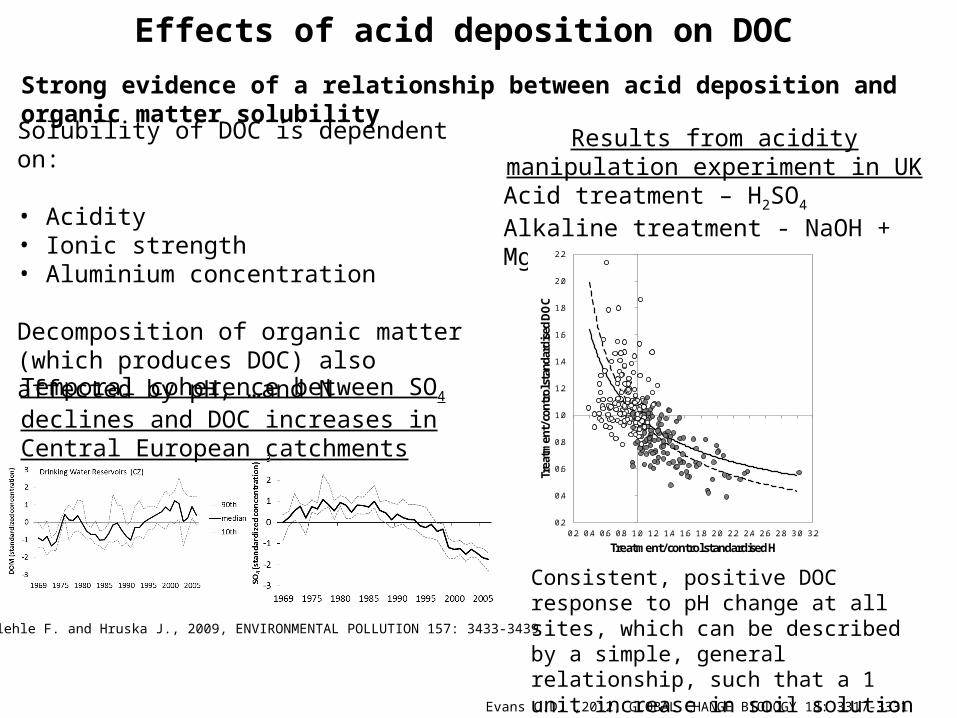
Strong evidence of a relationship between acid deposition and organic matter solubility
Decomposition of organic matter (which produces DOC) also affected by pH, …and N
Effects of acid deposition on DOC
Results from acidity manipulation experiment in UK
Acid treatment – H2SO4
Alkaline treatment - NaOH + MgCl2
Consistent, positive DOC response to pH change at all sites, which can be described by a simple, general relationship, such that a 1 unit increase in soil solution pH is sufficient to more than double DOC concentrations.
Temporal coherence between SO4 declines and DOC increases in Central European catchments
Oulehle F. and Hruska J., 2009, ENVIRONMENTAL POLLUTION 157: 3433-3439
Evans C.D. ,2012, GLOBAL CHANGE BIOLOGY 18: 3317-3331
• It appears that past acidification caused the suppression of decomposition leading to the accumulation of a large pool of organic matter on the forest floor. The alleviation of this acidification pressure over the last two decades appears to have triggered the remobilisation of the soil C pool.
•Declining S deposition appears able to explain a large part of observed DOC trends.
• Therefore, rising DOC in well studied areas (Europe, USA) should not be misconstrued as evidence of rising DOC in unmonitored waters globally.
- threats of widespread destabilization of terrestrial carbon reserves by gradual rises in air temperature or CO2 concentration may have been overstated in
those areas.
• Past acid conditions may have reduced decomposition rates, allowing a pool of relatively labile organic matter to accumulate, from which DOC is generated as acidity decreases.
Conclusions
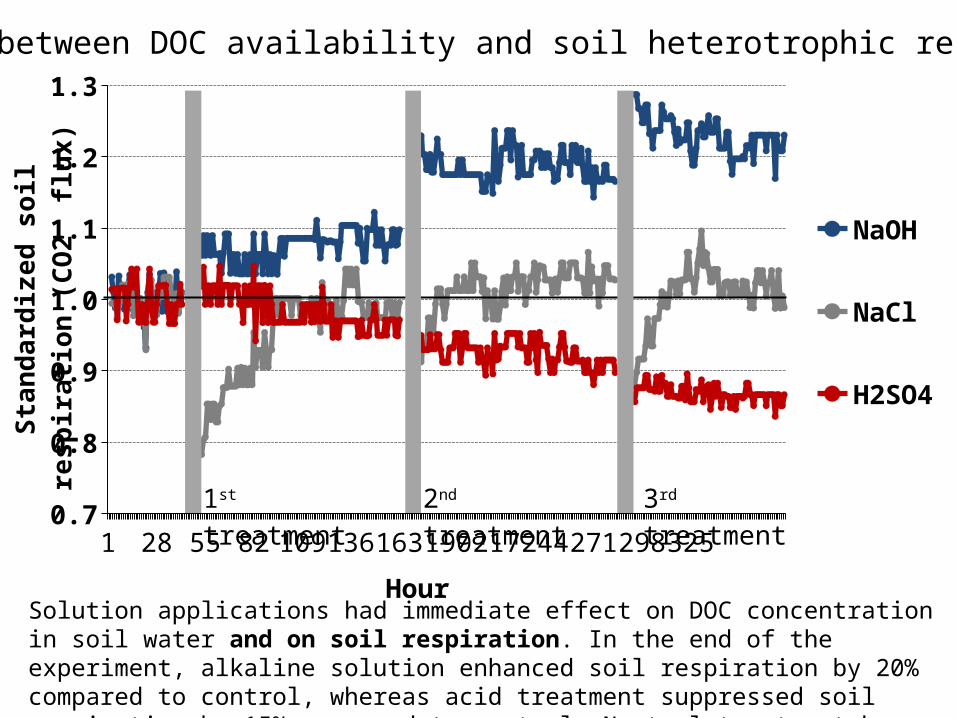
Linkages between DOC availability and soil heterotrophic respiration
Three mechanisms could lead to lower amount of bioavailable dissolved organic C (DOC) for the microbial community (Kopáček et al., 2013)
(1) Increased abundance of N for plant uptake, causing lower C allocation to plant roots(2) Chemical suppression of DOC solubility by soil acidification(3) Enhanced mineralisation of DOC due to increased abundance of electron acceptors in the form of sulphate and nitrate - in anoxic soil micro-sites.
Linkages between DOC availability and soil heterotrophic respiration
Linkages between DOC availability and soil heterotrophic respiration
Solution applications had immediate effect on DOC concentration in soil water.
Ctrl H2SO4 HCl NaOH NaCl0
20
40
60
80
100
120
140
160
180
200soilwater DOC 1st treat
2nd treat3rd treat
mg/
L
Linkages between DOC availability and soil heterotrophic respiration
1 27 53 79 1051311571832092352612873133390.7
0.8
0.9
1.0
1.1
1.2
1.3
NaOH
NaCl
H2SO4
Hour
Stan
dard
ized
soi
l res
pira
tion
(CO
2
flux)
1st treatment 2nd treatment 3rd treatment
Solution applications had immediate effect on DOC concentration in soil water and on soil respiration. In the end of the experiment, alkaline solution enhanced soil respiration by 20% compared to control, whereas acid treatment suppressed soil respiration by 15% compared to control. Neutral treatment has only short-term effect (suppression) on soil respiration.
• It appears that past acidification caused the suppression of decomposition leading to the accumulation of a large pool of organic matter on the forest floor. The alleviation of this acidification pressure over the last two decades appears to have triggered the remobilisation of the soil C pool.
•Declining S deposition appears able to explain a large part of observed DOC trends.
• Therefore, rising DOC in well studied areas (Europe, USA) should not be misconstrued as evidence of rising DOC in unmonitored waters globally.
- threats of widespread destabilization of terrestrial carbon reserves by gradual rises in air temperature or CO2 concentration may have been overstated in
those areas.
• Past acid conditions may have reduced decomposition rates, allowing a pool of relatively labile organic matter to accumulate, from which DOC is generated as acidity decreases.
• Altered soil respiration is probably a direct result of DOC bioavailability for microbes under different treatments, rather then direct pH effect on soil microbial communities.
Conclusions
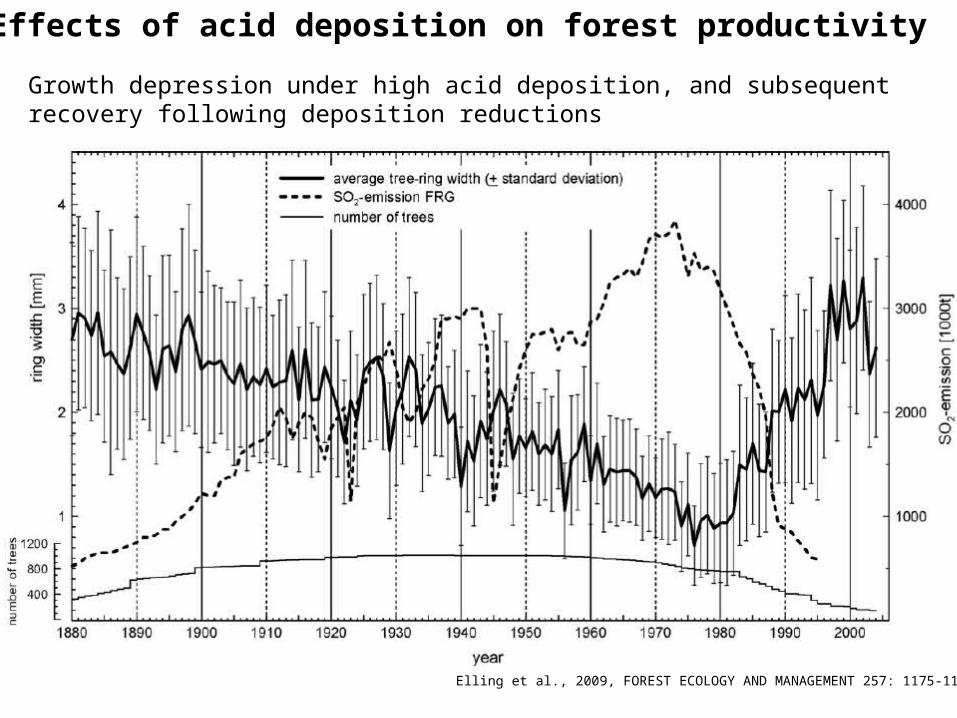
Effects of acid deposition on forest productivity
Growth depression under high acid deposition, and subsequent recovery following deposition reductions
Oulehle et al., 2011, GLOBAL CHANGE BIOLOGY 17, 3115-3129
Elling et al., 2009, FOREST ECOLOGY AND MANAGEMENT 257: 1175-1187
Results from Czech national forest inventories
18801890
19001910
19201930
19401950
19601970
19801990
20002009
1.0
1.5
2.0
2.5
3.0
tota
l ann
ual i
ncre
men
t (tC
ha-
1yr-1
)
• Annual above-ground carbon increment increased by 30% since 1950s
18801890
19001910
19201930
19401950
19601970
19801990
20002009
1.0
1.5
2.0
2.5
3.0
0
2
4
6
8
10
12
14
16
18
20
N deposition
tota
l ann
ual i
ncre
men
t (tC
ha-
1yr-1
)
N a
nd S
dep
ositi
on (k
g ha
-2 y
r-1)
dC/dN(1960-2010)=34
20-40 – de Vries et al., 200825 – Nadelhoffer et al., 199925-37 – Högberg et al., 200619 – Solberg et al., 20091880
18901900
19101920
19301940
19501960
19701980
19902000
20091.0
1.5
2.0
2.5
3.0
0
2
4
6
8
10
12
14
16
18
20
N depositionS deposition
tota
l ann
ual i
ncre
men
t (tC
ha-
1yr-1
)
N a
nd S
dep
ositi
on(k
g h
a-2
yr-1
)• In the European NITREX series of experiments, a 50% increase in tree growth was observed following experimental reduction of N and S inputs in N-saturated site (Emmett et al., 1998).
Effects of acid deposition on forest productivity
BUT
dC/dN(1960-1990)=10dC/dN(2000-2010)=154
• It appears that past acidification caused the suppression of decomposition leading to the accumulation of a large pool of organic matter on the forest floor. The alleviation of this acidification pressure over the last two decades appears to have triggered the remobilisation of the soil C pool.
•Declining S deposition appears able to explain a large part of observed DOC trends.
• Therefore, rising DOC in well studied areas (Europe, USA) should not be misconstrued as evidence of rising DOC in unmonitored waters globally.
- threats of widespread destabilization of terrestrial carbon reserves by gradual rises in air temperature or CO2 concentration may have been overstated in
those areas.
• Past acid conditions may have reduced decomposition rates, allowing a pool of relatively labile organic matter to accumulate, from which DOC is generated as acidity decreases.
• Altered soil respiration is probably a direct result of DOC bioavailability for microbes under different treatments, rather then direct pH effect on soil microbial communities.
• Growth reduction of conifer forests in Central Europe has been observed between the 1960s and 1980s.
• During recent decades a distinct increasing growth trends were observed. This trend might only be explained if climate, fertilization by N-deposition, and the strong reduction of SO2 pollution are taken into account.
Conclusions
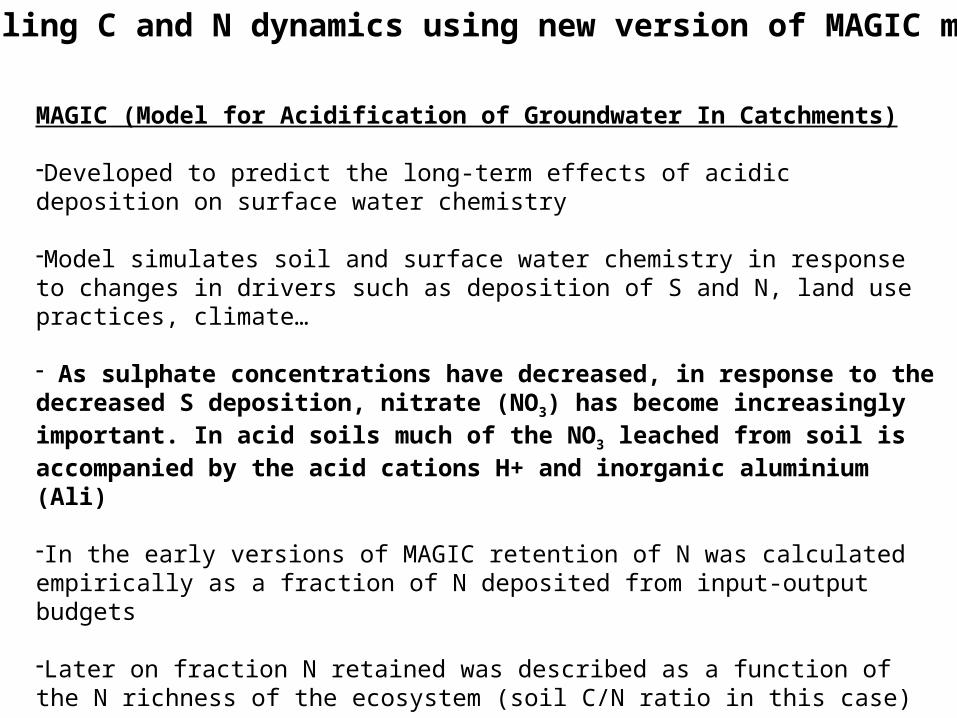
Modelling C and N dynamics using new version of MAGIC model
MAGIC (Model for Acidification of Groundwater In Catchments)
-Developed to predict the long-term effects of acidic deposition on surface water chemistry
-Model simulates soil and surface water chemistry in response to changes in drivers such as deposition of S and N, land use practices, climate…
- As sulphate concentrations have decreased, in response to the decreased S deposition, nitrate (NO3) has become increasingly important. In acid soils much of the NO3 leached from soil is accompanied by the acid cations H+ and inorganic aluminium (Ali)
-In the early versions of MAGIC retention of N was calculated empirically as a fraction of N deposited from input-output budgets
-Later on fraction N retained was described as a function of the N richness of the ecosystem (soil C/N ratio in this case)
-Alternative formulation of N retention in new version of MAGIC is based directly on the microbial processes which determine the balance of N mineralization and immobilization
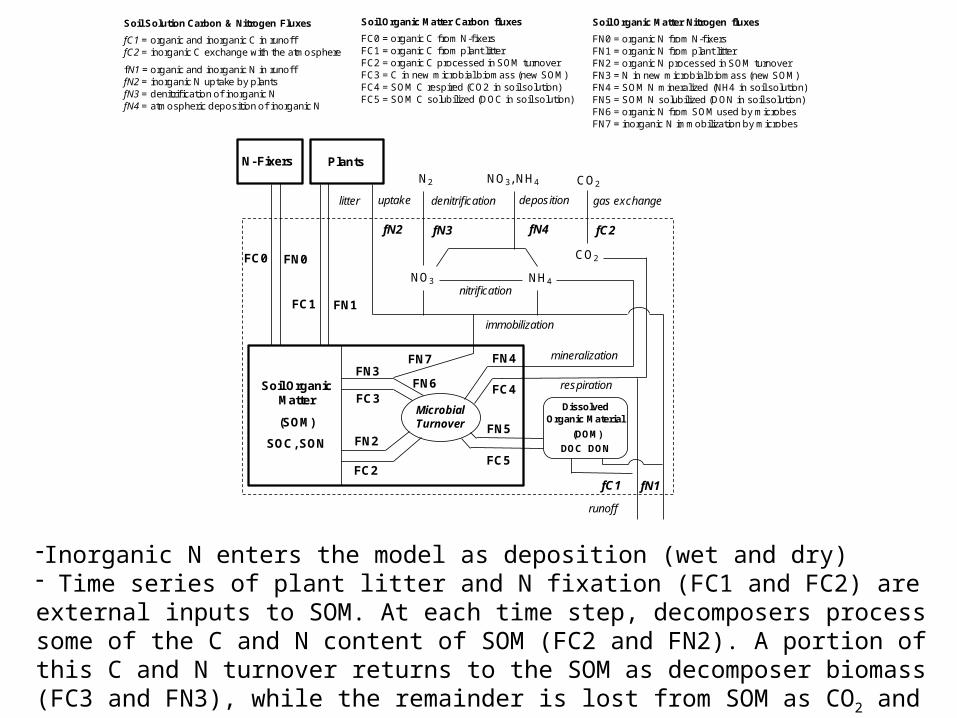
Soil Organic Matter Carbon fluxes
FC0 = organic C f rom N-f ixersFC1 = organic C f rom plant litterFC2 = organic C processed in SOM turnoverFC3 = C in new microbial biomass (new SOM)FC4 = SOM C respired (CO2 in soil solution)FC5 = SOM C solubilized (DOC in soil solution)
Soil Organic Matter Nitrogen fluxes
FN0 = organic N f rom N-f ixersFN1 = organic N f rom plant litterFN2 = organic N processed in SOM turnoverFN3 = N in new microbial biomass (new SOM)FN4 = SOM N mineralized (NH4 in soil solution) FN5 = SOM N solubilized (DON in soil solution)FN6 = organic N f rom SOM used by microbesFN7 = inorganic N immobilization by microbes
Soil Solution Carbon & Nitrogen Fluxes
fC1 = organic and inorganic C in runof f fC2 = inorganic C exchange with the atmosphere
fN1 = organic and inorganic N in runof ffN2 = inorganic N uptake by plantsfN3 = denitrif ication of inorganic N fN4 = atmospheric deposition of inorganic N
PlantsN2
CO2
fN2
FN7
FC4
FN4
Soil Organic Matter
(SOM)
SOC, SON
Microbial Turnover FN5
FC5
FC1 FN1
litter
NO3, NH4
NO3 NH4
FN2
FC2
FN3
FC3
uptake denitrification
nitrification
immobilization
mineralization
runoff
deposition
fN3 fN4
CO2
gas exchange
respiration
fC2
FN6
N- Fixers
FC0 FN0
fC1 fN1
Dissolved Organic Material
(DOM)
DOC DON
-Inorganic N enters the model as deposition (wet and dry)- Time series of plant litter and N fixation (FC1 and FC2) are external inputs to SOM. At each time step, decomposers process some of the C and N content of SOM (FC2 and FN2). A portion of this C and N turnover returns to the SOM as decomposer biomass (FC3 and FN3), while the remainder is lost from SOM as CO2 and NH4 (FC4 and FN4) or as DOC and DON (FC5 and FN5).
1940 1960 1980 2000 20200
100
200
300
400
1940 1960 1980 2000 20200
10
20
30
40
50
1940 1960 1980 2000 20200
20406080
100120
NO
3- (µ
eq l-
1)
- Lake, stream and soil water chemistry (nitrate) from different catchments in the Czech Republic
MAGIC application on three long-term monitoring sites in the Czech Republic
1940 1960 1980 2000 20200
100
200
300
400
1940 1960 1980 2000 20200
10
20
30
40
50
1940 1960 1980 2000 20200
20406080
100120
NO
3- (µ
eq l-
1)
- Constant carbon turnover
1940 1960 1980 2000 202005
1015202530
0
20
40
60
80
100
Carb
on fr
actio
n pr
oces
sed
(%)
Ali
conc
entr
ation
(um
ol+/
L)
1940 1960 1980 2000 202005
1015202530
020406080100120140
1940 1960 1980 2000 202005
1015202530
0
200
400
600
800
1000
- Adjusted carbon turnover based on Ali concentration
Modelling C and N dynamics using new version of MAGIC model
• It appears that past acidification caused the suppression of decomposition leading to the accumulation of a large pool of organic matter on the forest floor. The alleviation of this acidification pressure over the last two decades appears to have triggered the remobilisation of the soil C pool.
•Declining S deposition appears able to explain a large part of observed DOC trends.
• Therefore, rising DOC in well studied areas (Europe, USA) should not be misconstrued as evidence of rising DOC in unmonitored waters globally.
- threats of widespread destabilization of terrestrial carbon reserves by gradual rises in air temperature or CO2 concentration may have been overstated in
those areas.
• Past acid conditions may have reduced decomposition rates, allowing a pool of relatively labile organic matter to accumulate, from which DOC is generated as acidity decreases.
• Altered soil respiration is probably a direct result of DOC bioavailability for microbes under different treatments, rather then direct pH effect on soil microbial communities.
• Growth reduction of conifer forests in Central Europe has been observed between the 1960s and 1980s.
• During recent decades a distinct increasing growth trends were observed. This trend might only be explained if climate, fertilization by N-deposition, and the strong reduction of SO2 pollution are taken into account.
• Acidity changes in forest ecosystems might have a strong confounding influence on ecosystem sensitivity to eutrophication, with acidification accelerating N saturation (nitrate leaching), and recovery potentially resulting in reversion to N limitation (nitrate retention).
Conclusions
• It appears that past acidification caused the suppression of decomposition leading to the accumulation of a large pool of organic matter on the forest floor. The alleviation of this acidification pressure over the last two decades appears to have triggered the remobilisation of the soil C pool.
•Declining S deposition appears able to explain a large part of observed DOC trends.
• Therefore, rising DOC in well studied areas (Europe, USA) should not be misconstrued as evidence of rising DOC in unmonitored waters globally.
- threats of widespread destabilization of terrestrial carbon reserves by gradual rises in air temperature or CO2 concentration may have been overstated in
those areas.
• Past acid conditions may have reduced decomposition rates, allowing a pool of relatively labile organic matter to accumulate, from which DOC is generated as acidity decreases.
• Altered soil respiration is probably a direct result of DOC bioavailability for microbes under different treatments, rather then direct pH effect on soil microbial communities.
• Growth reduction of conifer forests in Central Europe has been observed between the 1960s and 1980s.
• During recent decades a distinct increasing growth trends were observed. This trend might only be explained if climate, fertilization by N-deposition, and the strong reduction of SO2 pollution are taken into account.
• Acidity changes in forest ecosystems might have a strong confounding influence on ecosystem sensitivity to eutrophication, with acidification accelerating N saturation (nitrate leaching), and recovery potentially resulting in reversion to N limitation (nitrate retention).