78
| 1
Acknowledgement and Study Contributors
This is a study analyzing the size and scope of the nonprofit sector in the Nashville MSA. I would
like to thank the Center for Nonprofit Management (CNM) for sponsoring this initiative with
special thanks to Lewis Lavine and Susan King for helping throughout the survey process.
Furthermore, many organizations spent their precious time completing the nonprofit survey. I thank
them for their efforts and contributions to this project.
This report is a product of teamwork. The following undergraduate research assistants contributed
to various aspects of this project:
John Meese: Literature Review and Data Gathering
Lance R. Ridings: Data Gathering, Outlier Analysis, and MSA Comparison
Taylor Eidson: Outlier Analysis, and Employment and Volunteering Data
| 2
Table of Contents
A Guide to the Numbers in This Study 3
Glossary of Terms 4
Executive Summary 5
I. Introduction 8
II. Literature Review and Methodology 9
II.1. Literature Review 9
II.2. Geography and Scope of the Nonprofit Sector 15
II.3. Economic Impact Definition and IMPLAN Software 16
II.4. Data and Data Sources 19
III. Characteristics of the Nonprofit Sector and the Nashville MSA Economy 21
III.1. Size, Scope and Change by Segment 21
III.2. The Nonprofit Sector and the Nashville MSA Economy 34
IV. Economic Assessment of the Nonprofit Sector 36
IV.1. Economic Impact—Export Component 36
IV.2. Economic Contributions—Total Spending 44
IV.3. Economic Contributions Plus Volunteering 50
V. Recession Crisis Management and Nonprofits in the Nashville MSA 53
VI. A Comparative Perspective on the Nonprofit Sector in the Nashville MSA 59
VII. Conclusion 63
VIII. Works Consulted 65
IX. Appendix: Survey Results 68
| 3
| 4
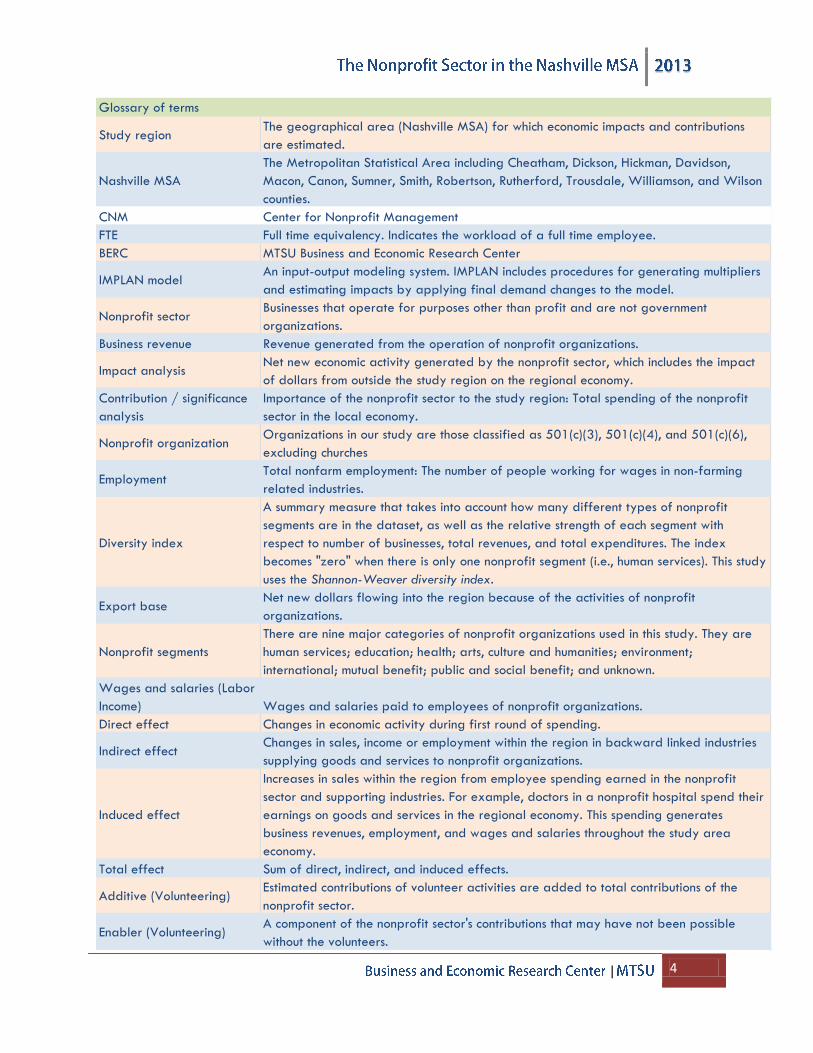
Study region The geographical area (Nashville MSA) for which economic impacts and contributions
are estimated.
Nashville MSA
The Metropolitan Statistical Area including Cheatham, Dickson, Hickman, Davidson,
Macon, Canon, Sumner, Smith, Robertson, Rutherford, Trousdale, Williamson, and Wilson
counties.
CNM Center for Nonprofit Management
FTE Full time equivalency. Indicates the workload of a full time employee.
BERC MTSU Business and Economic Research Center
IMPLAN model An input-output modeling system. IMPLAN includes procedures for generating multipliers
and estimating impacts by applying final demand changes to the model.
Nonprofit sector Businesses that operate for purposes other than profit and are not government
organizations.
Business revenue Revenue generated from the operation of nonprofit organizations.
Impact analysisNet new economic activity generated by the nonprofit sector, which includes the impact
of dollars from outside the study region on the regional economy.
Contribution / significance
analysis
Importance of the nonprofit sector to the study region: Total spending of the nonprofit
sector in the local economy.
Nonprofit organizationOrganizations in our study are those classified as 501(c)(3), 501(c)(4), and 501(c)(6),
excluding churches
EmploymentTotal nonfarm employment: The number of people working for wages in non-farming
related industries.
Diversity index
A summary measure that takes into account how many different types of nonprofit
segments are in the dataset, as well as the relative strength of each segment with
respect to number of businesses, total revenues, and total expenditures. The index
becomes "zero" when there is only one nonprofit segment (i.e., human services). This study
uses the Shannon-Weaver diversity index.
Export baseNet new dollars flowing into the region because of the activities of nonprofit
organizations.
Nonprofit segments
There are nine major categories of nonprofit organizations used in this study. They are
human services; education; health; arts, culture and humanities; environment;
international; mutual benefit; public and social benefit; and unknown.
Wages and salaries (Labor
Income) Wages and salaries paid to employees of nonprofit organizations.
Direct effect Changes in economic activity during first round of spending.
Indirect effectChanges in sales, income or employment within the region in backward linked industries
supplying goods and services to nonprofit organizations.
Induced effect
Increases in sales within the region from employee spending earned in the nonprofit
sector and supporting industries. For example, doctors in a nonprofit hospital spend their
earnings on goods and services in the regional economy. This spending generates
business revenues, employment, and wages and salaries throughout the study area
economy.
Total effect Sum of direct, indirect, and induced effects.
Additive (Volunteering)Estimated contributions of volunteer activities are added to total contributions of the
nonprofit sector.
Enabler (Volunteering)A component of the nonprofit sector's contributions that may have not been possible
without the volunteers.
Glossary of terms
| 5
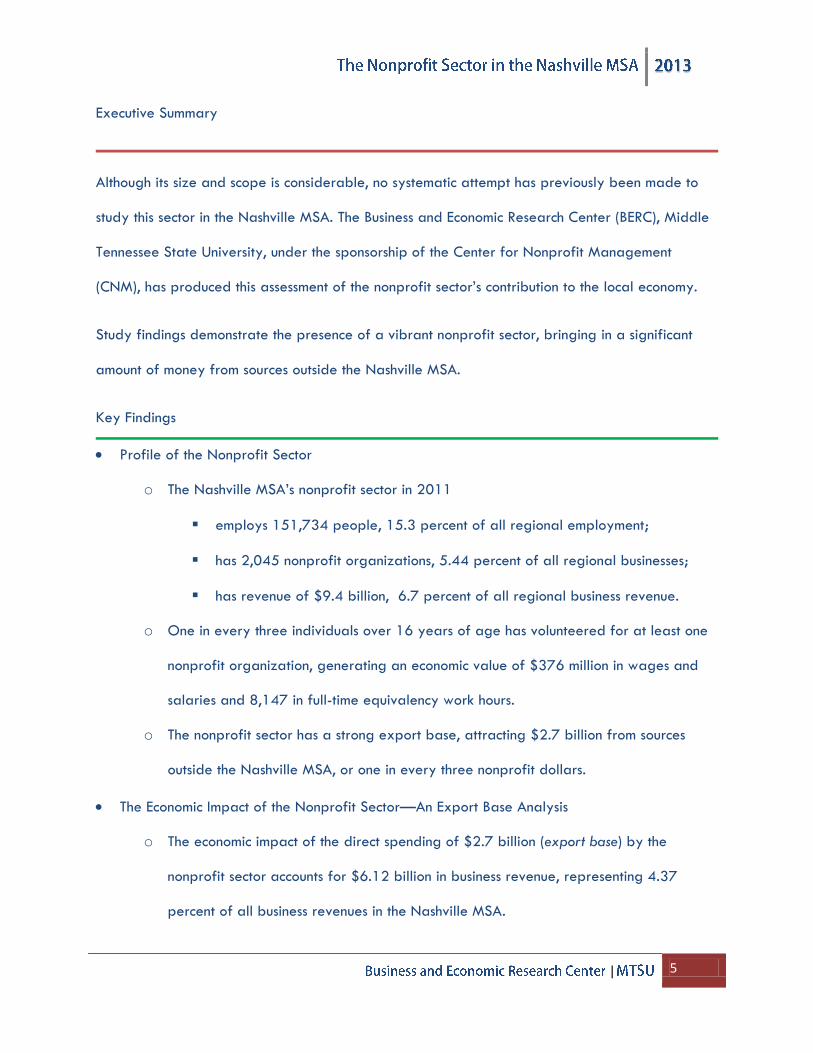
Executive Summary
Although its size and scope is considerable, no systematic attempt has previously been made to
study this sector in the Nashville MSA. The Business and Economic Research Center (BERC), Middle
Tennessee State University, under the sponsorship of the Center for Nonprofit Management
(CNM), has produced this assessment of the nonprofit sector’s contribution to the local economy.
Study findings demonstrate the presence of a vibrant nonprofit sector, bringing in a significant
amount of money from sources outside the Nashville MSA.
Key Findings
Profile of the Nonprofit Sector
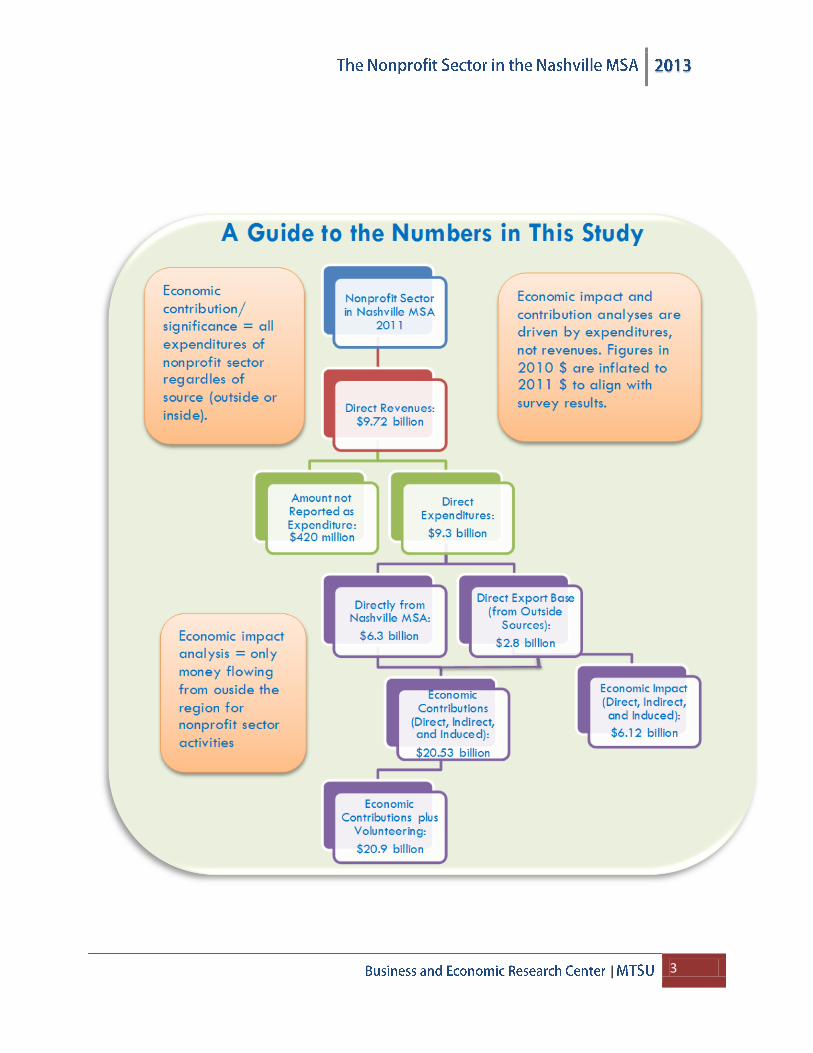
o The Nashville MSA’s nonprofit sector in 2011
employs 151,734 people, 15.3 percent of all regional employment;
has 2,045 nonprofit organizations, 5.44 percent of all regional businesses;
has revenue of $9.4 billion, 6.7 percent of all regional business revenue.
o One in every three individuals over 16 years of age has volunteered for at least one
nonprofit organization, generating an economic value of $376 million in wages and
salaries and 8,147 in full-time equivalency work hours.
o The nonprofit sector has a strong export base, attracting $2.7 billion from sources
outside the Nashville MSA, or one in every three nonprofit dollars.
The Economic Impact of the Nonprofit Sector—An Export Base Analysis
o The economic impact of the direct spending of $2.7 billion (export base) by the
nonprofit sector accounts for $6.12 billion in business revenue, representing 4.37
percent of all business revenues in the Nashville MSA.
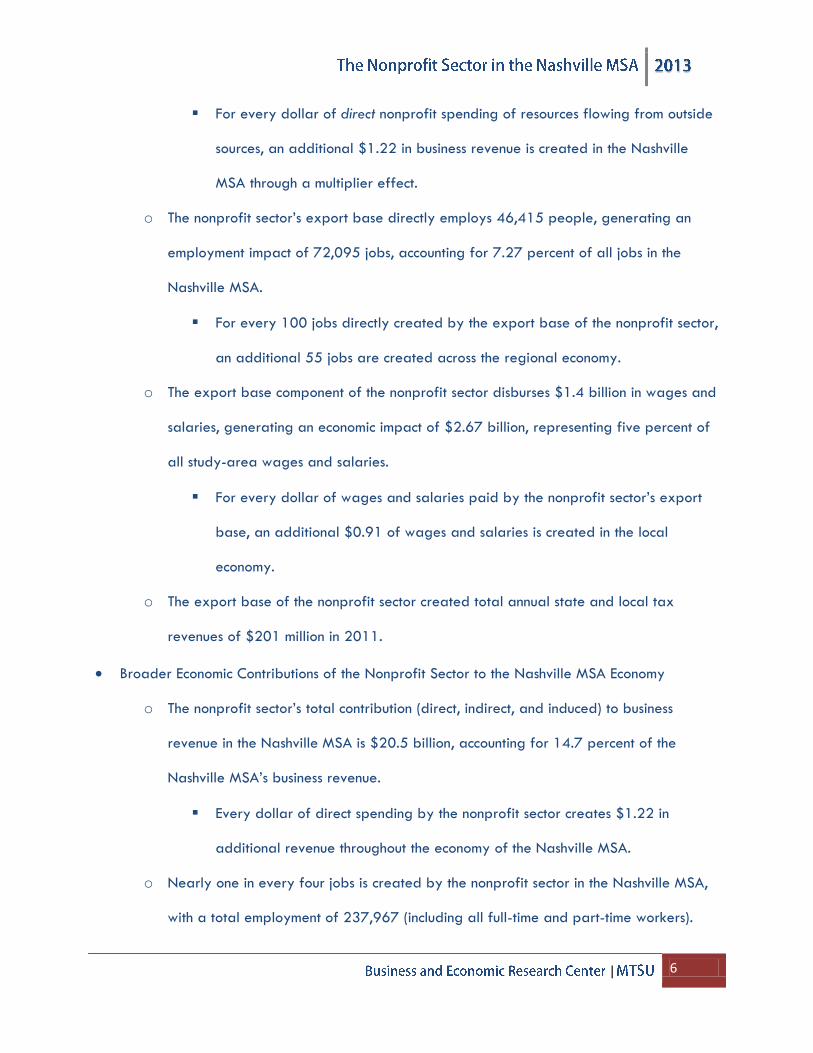
| 6
For every dollar of direct nonprofit spending of resources flowing from outside
sources, an additional $1.22 in business revenue is created in the Nashville
MSA through a multiplier effect.
o The nonprofit sector’s export base directly employs 46,415 people, generating an
employment impact of 72,095 jobs, accounting for 7.27 percent of all jobs in the
Nashville MSA.
For every 100 jobs directly created by the export base of the nonprofit sector,
an additional 55 jobs are created across the regional economy.
o The export base component of the nonprofit sector disburses $1.4 billion in wages and
salaries, generating an economic impact of $2.67 billion, representing five percent of
all study-area wages and salaries.
For every dollar of wages and salaries paid by the nonprofit sector’s export
base, an additional $0.91 of wages and salaries is created in the local
economy.
o The export base of the nonprofit sector created total annual state and local tax
revenues of $201 million in 2011.
Broader Economic Contributions of the Nonprofit Sector to the Nashville MSA Economy
o The nonprofit sector’s total contribution (direct, indirect, and induced) to business
revenue in the Nashville MSA is $20.5 billion, accounting for 14.7 percent of the
Nashville MSA’s business revenue.
Every dollar of direct spending by the nonprofit sector creates $1.22 in
additional revenue throughout the economy of the Nashville MSA.
o Nearly one in every four jobs is created by the nonprofit sector in the Nashville MSA,
with a total employment of 237,967 (including all full-time and part-time workers).
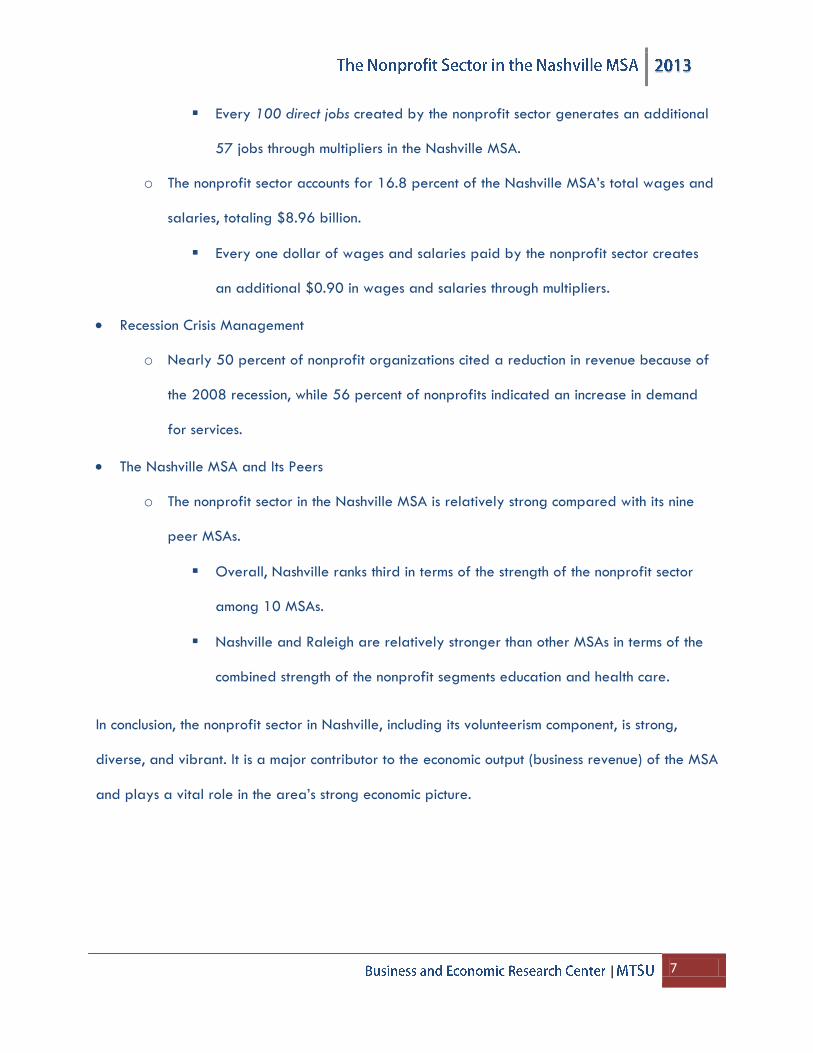
| 7
Every 100 direct jobs created by the nonprofit sector generates an additional
57 jobs through multipliers in the Nashville MSA.
o The nonprofit sector accounts for 16.8 percent of the Nashville MSA’s total wages and
salaries, totaling $8.96 billion.
Every one dollar of wages and salaries paid by the nonprofit sector creates
an additional $0.90 in wages and salaries through multipliers.
Recession Crisis Management
o Nearly 50 percent of nonprofit organizations cited a reduction in revenue because of
the 2008 recession, while 56 percent of nonprofits indicated an increase in demand
for services.
The Nashville MSA and Its Peers
o The nonprofit sector in the Nashville MSA is relatively strong compared with its nine
peer MSAs.
Overall, Nashville ranks third in terms of the strength of the nonprofit sector
among 10 MSAs.
Nashville and Raleigh are relatively stronger than other MSAs in terms of the
combined strength of the nonprofit segments education and health care.
In conclusion, the nonprofit sector in Nashville, including its volunteerism component, is strong,
diverse, and vibrant. It is a major contributor to the economic output (business revenue) of the MSA
and plays a vital role in the area’s strong economic picture.
| 8
I. Introduction
The nonprofit sector is an important part of both local and national economies because it includes
not only spending and associated employment but also volunteering and civic participation in
community affairs. Although its size and scope is considerable, no systematic attempt has
previously been made to study this sector in the Nashville MSA. The Business and Economic
Research Center (BERC), Middle Tennessee State University, under the sponsorship of the Center
for Nonprofit Management (CNM), has produced this assessment of the nonprofit sector’s
contribution to the local economy.
The purpose of this study is to find answers to the following questions:
i. What is the scope and size of the Nashville MSA’s nonprofit sector?
ii. How has the Nashville MSA’s nonprofit sector evolved over the years?
iii. How has the Nashville MSA’s nonprofit sector managed the economic downturn?
iv. How does the Nashville MSA’s nonprofit sector compare with that of peer MSAs?
To answer these questions, BERC designed and administered a nonprofit survey in addition to
obtaining nonprofit data from various sources. Study findings demonstrate the presence of a
vibrant nonprofit sector in the Nashville MSA, bringing in a significant amount of money from
sources outside the Nashville MSA.
The rest of this report will proceed as follows. The second chapter deals with the review of
selected literature and methodological issues. The third chapter presents a summary of the
characteristics of the Nashville MSA’s nonprofit sector. The fourth chapter provides a
comprehensive assessment of its economic contributions. The fifth and sixth chapters compare the
Nashville MSA’s nonprofit sector with that of peer MSAs, as well as the effect of the 2008
recession on nonprofit management. A conclusion and survey tables follow.
| 9
II. Literature Review and Methodology
How did BERC analyze the nonprofit sector’s contribution to the local economy? In this section, we
briefly address this question by reviewing literature, identifying data sources, and constructing the
conceptual framework for data analysis.
II.1. Literature Review
Literature on the nonprofit sector deals with a wide range of topics including the economics of
giving, dynamics of volunteering, management issues, civic participation, and economic impact
assessments. Given the scope of this study and the research questions posed earlier, we primarily
reviewed the literature on the economic contributions of the nonprofit sector to the state and local
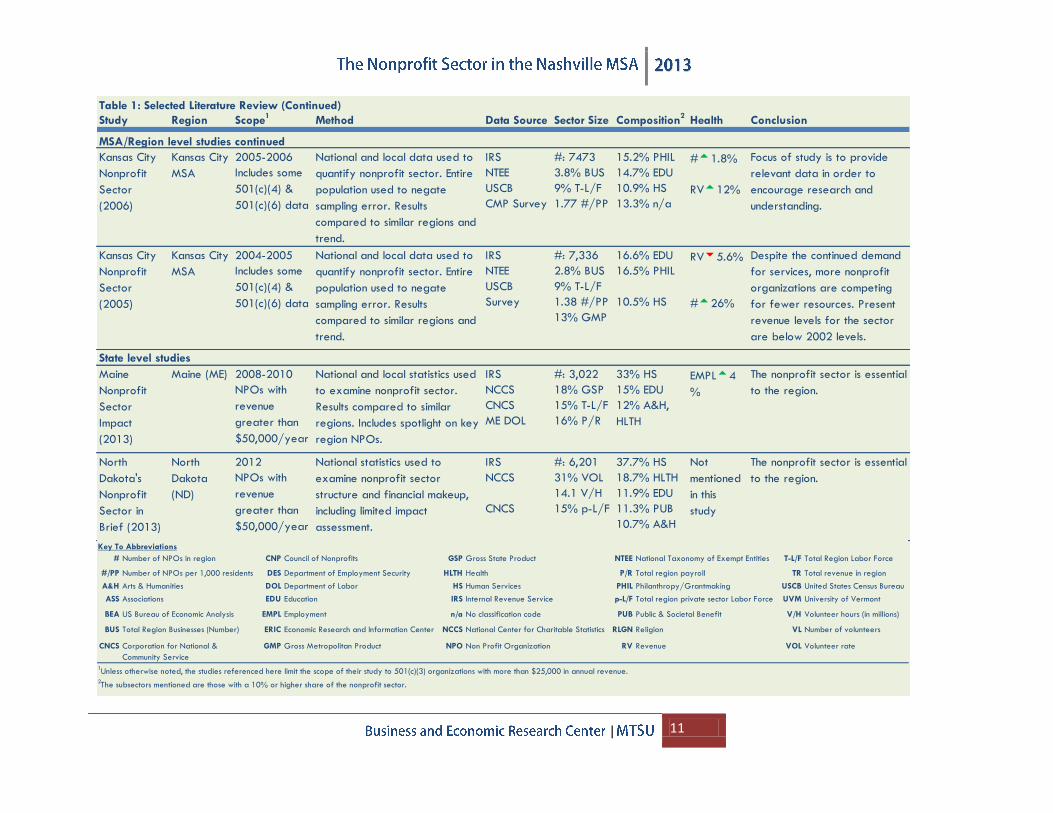
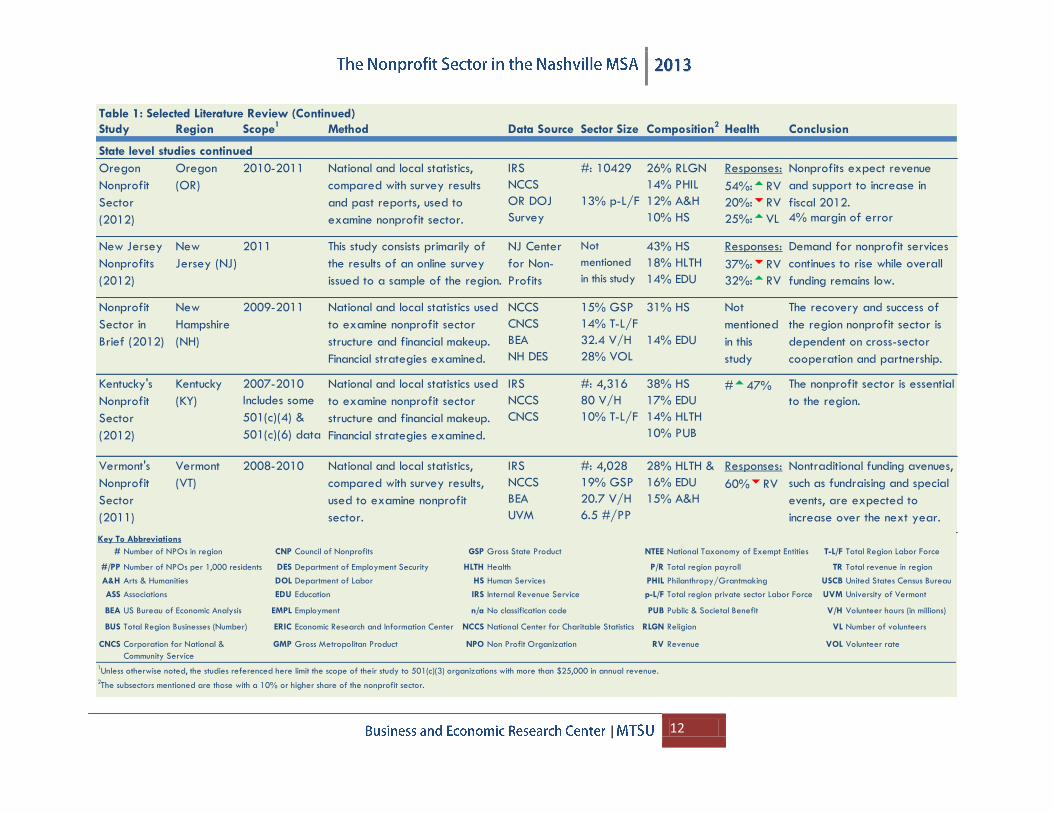
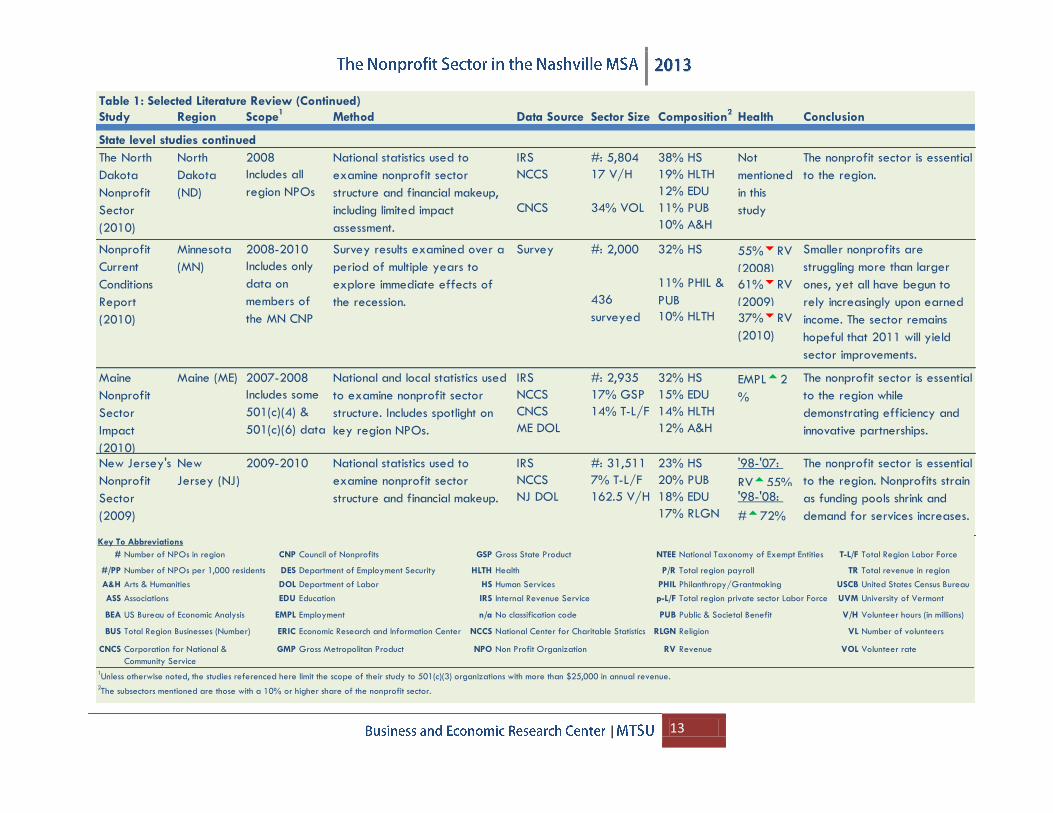
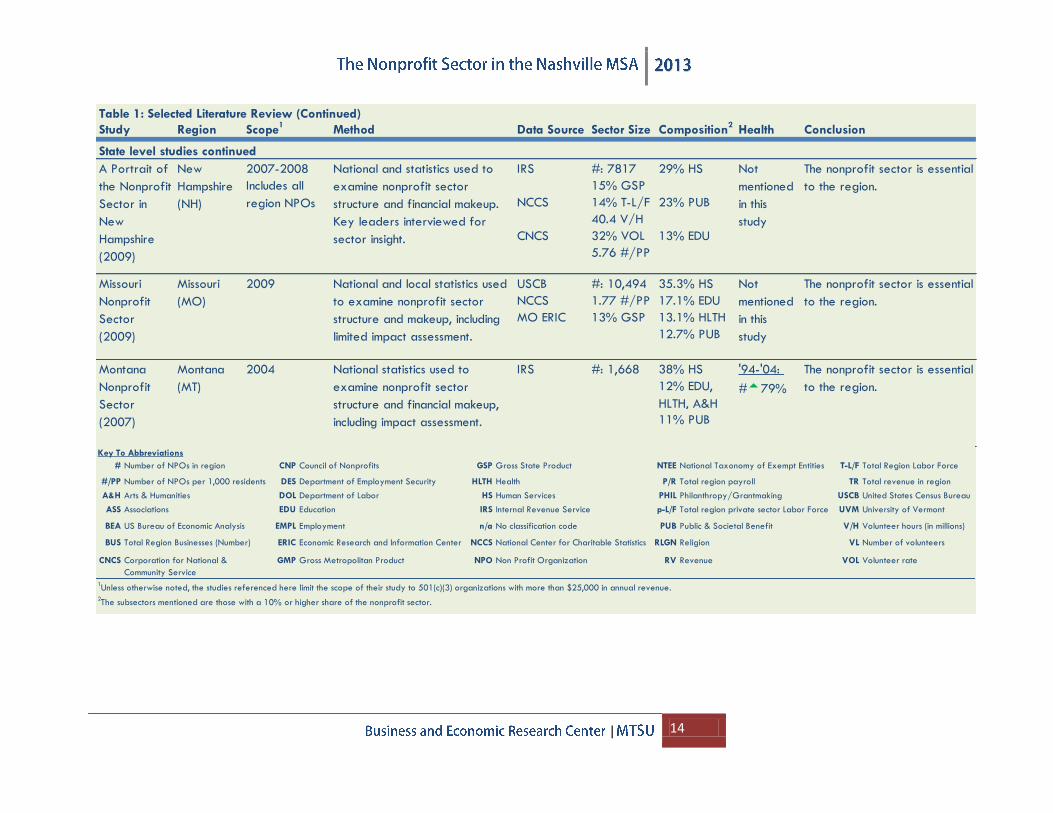
economies. The selected literature reviewed for this study, shown in Table 1, helped us develop
consistent methodology for analyzing the nonprofit sector in the Nashville MSA.
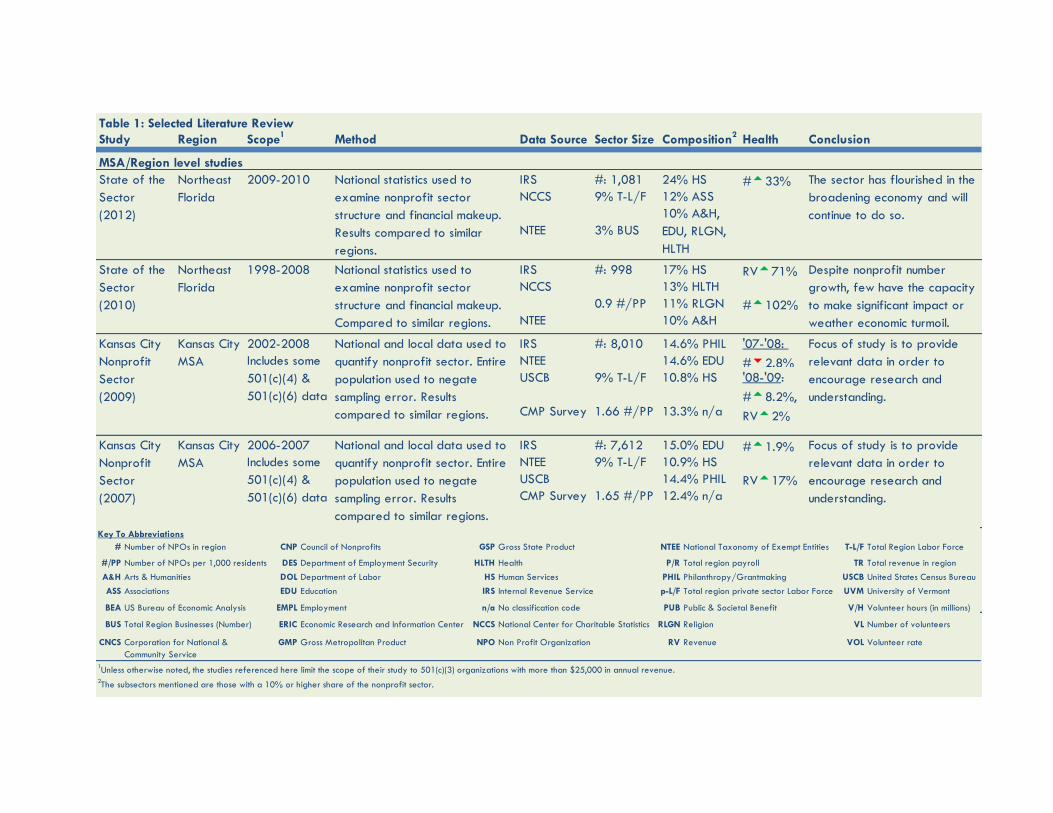
Table 1: Selected Literature Review
Study Region Scope1
Method Data Source Sector Size Composition2
Health Conclusion
MSA/Region level studies
IRS #: 1,081 24% HS
12% ASS
IRS 17% HS
13% HLTH
11% RLGN
NTEE 10% A&H
2002-2008 IRS 14.6% PHIL
NTEE 14.6% EDU
2006-2007 IRS #: 7,612 15.0% EDU
NTEE 10.9% HS
USCB 14.4% PHIL
Kansas City
Nonprofit
Sector
(2007)
9% T-L/F
#t1.9%
13.3% n/a
10.8% HS
1.66 #/PP
#: 8,010
CMP Survey
USCB
National and local data used to
quantify nonprofit sector. Entire
population used to negate
sampling error. Results
compared to similar regions.
Includes some
501(c)(4) &
501(c)(6) data
#t33% The sector has flourished in the
broadening economy and will
continue to do so.
'08-'09:
#t8.2%,
RVt2%
Focus of study is to provide
relevant data in order to
encourage research and
understanding.
Kansas City
MSA
Kansas City
Nonprofit
Sector
(2009)
12.4% n/a
RVt17%
Focus of study is to provide
relevant data in order to
encourage research and
understanding.1.65 #/PP
9% T-L/F
CMP Survey
National and local data used to
quantify nonprofit sector. Entire
population used to negate
sampling error. Results
compared to similar regions.
Includes some
501(c)(4) &
501(c)(6) data
Kansas City
MSA
10% A&H,
EDU, RLGN,
HLTH
State of the
Sector
(2012)
Northeast
Florida
2009-2010 National statistics used to
examine nonprofit sector
structure and financial makeup.
Results compared to similar
regions.
NCCS
NTEE 3% BUS
9% T-L/F
Despite nonprofit number
growth, few have the capacity
to make significant impact or
weather economic turmoil.
'07-'08:
#u2.8%
#t102%
RVt71%State of the
Sector
(2010)
National statistics used to
examine nonprofit sector
structure and financial makeup.
Compared to similar regions.
NCCS
0.9 #/PP
1998-2008Northeast
Florida
#: 998
# Number of NPOs in region CNP Council of Nonprofits GSP Gross State Product NTEE National Taxonomy of Exempt Entities T-L/F Total Region Labor Force
#/PP Number of NPOs per 1,000 residents DES Department of Employment Security HLTH Health P/R Total region payroll TR Total revenue in region
A&H Arts & Humanities DOL Department of Labor HS Human Services PHIL Philanthropy/Grantmaking USCB United States Census Bureau
ASS Associations EDU Education IRS Internal Revenue Service p-L/F Total region private sector Labor Force UVM University of Vermont
BEA US Bureau of Economic Analysis EMPL Employment n/a No classification code PUB Public & Societal Benefit V/H Volunteer hours (in millions)
BUS Total Region Businesses (Number) ERIC Economic Research and Information Center NCCS National Center for Charitable Statistics RLGN Religion VL Number of volunteers
CNCS Corporation for National &
Community Service
GMP Gross Metropolitan Product NPO Non Profit Organization RV Revenue VOL Volunteer rate
1Unless otherwise noted, the studies referenced here limit the scope of their study to 501(c)(3) organizations with more than $25,000 in annual revenue.
2The subsectors mentioned are those with a 10% or higher share of the nonprofit sector.
Key To Abbreviations
| 11
Table 1: Selected Literature Review (Continued)
Study Region Scope1
Method Data Source Sector Size Composition2
Health Conclusion
MSA/Region level studies continued
2005-2006 IRS #: 7473 15.2% PHIL
NTEE 3.8% BUS 14.7% EDU
USCB 9% T-L/F 10.9% HS
2004-2005 IRS #: 7,336 16.6% EDU
NTEE 2.8% BUS
USCB 9% T-L/F
1.38 #/PP
13% GMP
State level studies
2008-2010 IRS #: 3,022 33% HS
NCCS 18% GSP 15% EDU
CNCS 15% T-L/F
2012 IRS #: 6,201 37.7% HS
31% VOL 18.7% HLTH
14.1 V/H 11.9% EDU
11.3% PUB
10.7% A&H
National and local statistics used
to examine nonprofit sector.
Results compared to similar
regions. Includes spotlight on key
region NPOs.
NPOs with
revenue
greater than
$50,000/year
Maine (ME)Maine
Nonprofit
Sector
Impact
(2013)
ME DOL 16% P/R
12% A&H,
HLTH
EMPLt4
%
Kansas City
Nonprofit
Sector
(2005)
Kansas City
Nonprofit
Sector
(2006) CMP Survey 1.77 #/PP 13.3% n/a
Kansas City
MSA
National and local data used to
quantify nonprofit sector. Entire
population used to negate
sampling error. Results
compared to similar regions and
trend.
#t1.8% Focus of study is to provide
relevant data in order to
encourage research and
understanding.
Includes some
501(c)(4) &
501(c)(6) data
RVt12%
The nonprofit sector is essential
to the region.
Not
mentioned
in this
study
North
Dakota's
Nonprofit
Sector in
Brief (2013)
North
Dakota
(ND)
NPOs with
revenue
greater than
$50,000/year
National statistics used to
examine nonprofit sector
structure and financial makeup,
including limited impact
assessment.
CNCS
NCCS
15% p-L/F
Kansas City
MSA
#t26%
Despite the continued demand
for services, more nonprofit
organizations are competing
for fewer resources. Present
revenue levels for the sector
are below 2002 levels.
RVu5.6%
10.5% HS
16.5% PHIL
Survey
National and local data used to
quantify nonprofit sector. Entire
population used to negate
sampling error. Results
compared to similar regions and
trend.
Includes some
501(c)(4) &
501(c)(6) data
The nonprofit sector is essential
to the region.
# Number of NPOs in region CNP Council of Nonprofits GSP Gross State Product NTEE National Taxonomy of Exempt Entities T-L/F Total Region Labor Force
#/PP Number of NPOs per 1,000 residents DES Department of Employment Security HLTH Health P/R Total region payroll TR Total revenue in region
A&H Arts & Humanities DOL Department of Labor HS Human Services PHIL Philanthropy/Grantmaking USCB United States Census Bureau
ASS Associations EDU Education IRS Internal Revenue Service p-L/F Total region private sector Labor Force UVM University of Vermont
BEA US Bureau of Economic Analysis EMPL Employment n/a No classification code PUB Public & Societal Benefit V/H Volunteer hours (in millions)
BUS Total Region Businesses (Number) ERIC Economic Research and Information Center NCCS National Center for Charitable Statistics RLGN Religion VL Number of volunteers
CNCS Corporation for National &
Community Service
GMP Gross Metropolitan Product NPO Non Profit Organization RV Revenue VOL Volunteer rate
1Unless otherwise noted, the studies referenced here limit the scope of their study to 501(c)(3) organizations with more than $25,000 in annual revenue.
2The subsectors mentioned are those with a 10% or higher share of the nonprofit sector.
Key To Abbreviations
| 12
Table 1: Selected Literature Review (Continued)
Study Region Scope1
Method Data Source Sector Size Composition2
Health Conclusion
State level studies continued
IRS 26% RLGN Responses:
NCCS 14% PHIL 54%:tRV
OR DOJ 12% A&H 20%:uRV
Survey 10% HS 25%:tVL 4% margin of error
43% HS Responses:
18% HLTH 37%:uRV
14% EDU 32%:tRV
NCCS 15% GSP
CNCS 14% T-L/F
BEA 32.4 V/H
NH DES 28% VOL
2007-2010 IRS #: 4,316 38% HS
NCCS 80 V/H 17% EDU
14% HLTH
10% PUB
IRS #: 4,028 28% HLTH & Responses:
NCCS 19% GSP 16% EDU
BEA 20.7 V/H
UVM 6.5 #/PP
Nontraditional funding avenues,
such as fundraising and special
events, are expected to
increase over the next year.
60%uRV
15% A&H
National and local statistics,
compared with survey results,
used to examine nonprofit
sector.
2008-2010Vermont
(VT)
Vermont's
Nonprofit
Sector
(2011)
2009-2011New
Hampshire
(NH)
Nonprofit
Sector in
Brief (2012)
The nonprofit sector is essential
to the region.
#t47%
10% T-L/FCNCS
National and local statistics used
to examine nonprofit sector
structure and financial makeup.
Financial strategies examined.
Includes some
501(c)(4) &
501(c)(6) data
Kentucky
(KY)
Kentucky's
Nonprofit
Sector
(2012)
The recovery and success of
the region nonprofit sector is
dependent on cross-sector
cooperation and partnership.
Not
mentioned
in this
study
14% EDU
31% HSNational and local statistics used
to examine nonprofit sector
structure and financial makeup.
Financial strategies examined.
Oregon
(OR)
Oregon
Nonprofit
Sector
(2012)
Nonprofits expect revenue
and support to increase in
fiscal 2012.
Demand for nonprofit services
continues to rise while overall
funding remains low.
Not
mentioned
in this study
NJ Center
for Non-
Profits
This study consists primarily of
the results of an online survey
issued to a sample of the region.
2011New
Jersey (NJ)
New Jersey
Nonprofits
(2012)
13% p-L/F
#: 10429National and local statistics,
compared with survey results
and past reports, used to
examine nonprofit sector.
2010-2011
# Number of NPOs in region CNP Council of Nonprofits GSP Gross State Product NTEE National Taxonomy of Exempt Entities T-L/F Total Region Labor Force
#/PP Number of NPOs per 1,000 residents DES Department of Employment Security HLTH Health P/R Total region payroll TR Total revenue in region
A&H Arts & Humanities DOL Department of Labor HS Human Services PHIL Philanthropy/Grantmaking USCB United States Census Bureau
ASS Associations EDU Education IRS Internal Revenue Service p-L/F Total region private sector Labor Force UVM University of Vermont
BEA US Bureau of Economic Analysis EMPL Employment n/a No classification code PUB Public & Societal Benefit V/H Volunteer hours (in millions)
BUS Total Region Businesses (Number) ERIC Economic Research and Information Center NCCS National Center for Charitable Statistics RLGN Religion VL Number of volunteers
CNCS Corporation for National &
Community Service
GMP Gross Metropolitan Product NPO Non Profit Organization RV Revenue VOL Volunteer rate
1Unless otherwise noted, the studies referenced here limit the scope of their study to 501(c)(3) organizations with more than $25,000 in annual revenue.
2The subsectors mentioned are those with a 10% or higher share of the nonprofit sector.
Key To Abbreviations
| 13
Table 1: Selected Literature Review (Continued)
Study Region Scope1
Method Data Source Sector Size Composition2
Health Conclusion
State level studies continued
2008 IRS #: 5,804 38% HS
19% HLTH
12% EDU
11% PUB
10% A&H
2008-2010
2007-2008 IRS #: 2,935 32% HS
NCCS 17% GSP 15% EDU
CNCS 14% HLTH
ME DOL 12% A&H
IRS #: 31,511 23% HS
NCCS 7% T-L/F 20% PUB
18% EDU
17% RLGN
National statistics used to
examine nonprofit sector
structure and financial makeup,
including limited impact
assessment.
Includes all
region NPOs
North
Dakota
(ND)
The North
Dakota
Nonprofit
Sector
(2010)
The nonprofit sector is essential
to the region.
Not
mentioned
in this
study34% VOL
17 V/H
CNCS
NCCS
Smaller nonprofits are
struggling more than larger
ones, yet all have begun to
rely increasingly upon earned
income. The sector remains
hopeful that 2011 will yield
sector improvements.
55%uRV
(2008)
61%uRV
(2009)
37%uRV
(2010)
SurveySurvey results examined over a
period of multiple years to
explore immediate effects of
the recession.
Includes only
data on
members of
the MN CNP
Minnesota
(MN)
Nonprofit
Current
Conditions
Report
(2010)
32% HS#: 2,000
10% HLTH
11% PHIL &
PUB436
surveyed
2009-2010New
Jersey (NJ)
New Jersey's
Nonprofit
Sector
(2009)
14% T-L/F
EMPLt2
%
The nonprofit sector is essential
to the region while
demonstrating efficiency and
innovative partnerships.
The nonprofit sector is essential
to the region. Nonprofits strain
as funding pools shrink and
demand for services increases.
'98-'07:
RVt55%'98-'08:
#t72%
162.5 V/HNJ DOL
National statistics used to
examine nonprofit sector
structure and financial makeup.
Maine
Nonprofit
Sector
Impact
(2010)
Maine (ME)
Includes some
501(c)(4) &
501(c)(6) data
National and local statistics used
to examine nonprofit sector
structure. Includes spotlight on
key region NPOs.
# Number of NPOs in region CNP Council of Nonprofits GSP Gross State Product NTEE National Taxonomy of Exempt Entities T-L/F Total Region Labor Force
#/PP Number of NPOs per 1,000 residents DES Department of Employment Security HLTH Health P/R Total region payroll TR Total revenue in region
A&H Arts & Humanities DOL Department of Labor HS Human Services PHIL Philanthropy/Grantmaking USCB United States Census Bureau
ASS Associations EDU Education IRS Internal Revenue Service p-L/F Total region private sector Labor Force UVM University of Vermont
BEA US Bureau of Economic Analysis EMPL Employment n/a No classification code PUB Public & Societal Benefit V/H Volunteer hours (in millions)
BUS Total Region Businesses (Number) ERIC Economic Research and Information Center NCCS National Center for Charitable Statistics RLGN Religion VL Number of volunteers
CNCS Corporation for National &
Community Service
GMP Gross Metropolitan Product NPO Non Profit Organization RV Revenue VOL Volunteer rate
1Unless otherwise noted, the studies referenced here limit the scope of their study to 501(c)(3) organizations with more than $25,000 in annual revenue.
2The subsectors mentioned are those with a 10% or higher share of the nonprofit sector.
Key To Abbreviations
| 14
Table 1: Selected Literature Review (Continued)
Study Region Scope1
Method Data Source Sector Size Composition2
Health Conclusion
State level studies continued
2007-2008 #: 7817
15% GSP
14% T-L/F
40.4 V/H
32% VOL
5.76 #/PP
USCB #: 10,494 35.3% HS
NCCS 1.77 #/PP 17.1% EDU
13.1% HLTH
12.7% PUB
38% HS
11% PUB
12% EDU,
HLTH, A&H
The nonprofit sector is essential
to the region.
'94-'04:
#t79%
#: 1,668IRSNational statistics used to
examine nonprofit sector
structure and financial makeup,
including impact assessment.
2004Montana
(MT)
Montana
Nonprofit
Sector
(2007)
13% EDU
Not
mentioned
in this
study
The nonprofit sector is essential
to the region.
13% GSPMO ERIC
National and local statistics used
to examine nonprofit sector
structure and makeup, including
limited impact assessment.
2009Missouri
(MO)
Missouri
Nonprofit
Sector
(2009)
Not
mentioned
in this
study
The nonprofit sector is essential
to the region.
A Portrait of
the Nonprofit
Sector in
New
Hampshire
(2009)
New
Hampshire
(NH)
Includes all
region NPOs
National and statistics used to
examine nonprofit sector
structure and financial makeup.
Key leaders interviewed for
sector insight.
IRS
NCCS
CNCS
29% HS
23% PUB
# Number of NPOs in region CNP Council of Nonprofits GSP Gross State Product NTEE National Taxonomy of Exempt Entities T-L/F Total Region Labor Force
#/PP Number of NPOs per 1,000 residents DES Department of Employment Security HLTH Health P/R Total region payroll TR Total revenue in region
A&H Arts & Humanities DOL Department of Labor HS Human Services PHIL Philanthropy/Grantmaking USCB United States Census Bureau
ASS Associations EDU Education IRS Internal Revenue Service p-L/F Total region private sector Labor Force UVM University of Vermont
BEA US Bureau of Economic Analysis EMPL Employment n/a No classification code PUB Public & Societal Benefit V/H Volunteer hours (in millions)
BUS Total Region Businesses (Number) ERIC Economic Research and Information Center NCCS National Center for Charitable Statistics RLGN Religion VL Number of volunteers
CNCS Corporation for National &
Community Service
GMP Gross Metropolitan Product NPO Non Profit Organization RV Revenue VOL Volunteer rate
1Unless otherwise noted, the studies referenced here limit the scope of their study to 501(c)(3) organizations with more than $25,000 in annual revenue.
2The subsectors mentioned are those with a 10% or higher share of the nonprofit sector.
Key To Abbreviations

II.2. Geography and Scope of the
Nonprofit Sector
The geographical scope of this
study is confined to the Nashville
Metropolitan Statistical Area
(MSA), which includes 13 counties
in middle Tennessee, shown in
Map 1: Cheatham, Dickson,
Hickman, Davidson, Macon,
Canon, Sumner, Smith, Robertson,
Rutherford, Trousdale,
Williamson, and Wilson counties.
A clearly defined study area allows us to identify out-of-area monetary flows. If the source of a
nonprofit’s revenue is from outside a clearly
defined area, we then argue that the monetary
activity is net addition to the area’s economy. This
treatment is an important component of the
economic impact estimates in the following
sections.
Does this study include all nonprofit organizations?
Consistent with the literature, this study deals with
a selected number of nonprofit organizations.
BERC initially used the IRS classification of tax-
exempt institutions. BERC collected information for
Proposed Nonprofit Sector Study Area
Map 1: What is the study area?
What nonprofits are included in this study?
a. Public Charities (501(c)(3))
b. Civic League and Social Welfare
(501(c)(4))
c. Business Leagues and Associations
(501(c)(6))
Are all organizations in these groups
included in this study? No, there are two
exclusions:
a. Organizations with less than
$25,000 in annual revenue
b. Churches were excluded
| 16
institutions classified under the following subgroups: Public Charities (501(c)(3)), Civic Leagues and
Social Welfare Organizations (501(c)(4), and Business Leagues (501(c)(6).
In choosing nonprofits for this survey, BERC used the nonprofits’ income as a main criterion under
the following guideline: if the last reported income (IRS 990 form) was less than $25,000, BERC
excluded that organization. Furthermore, consistent with the literature, churches were excluded.
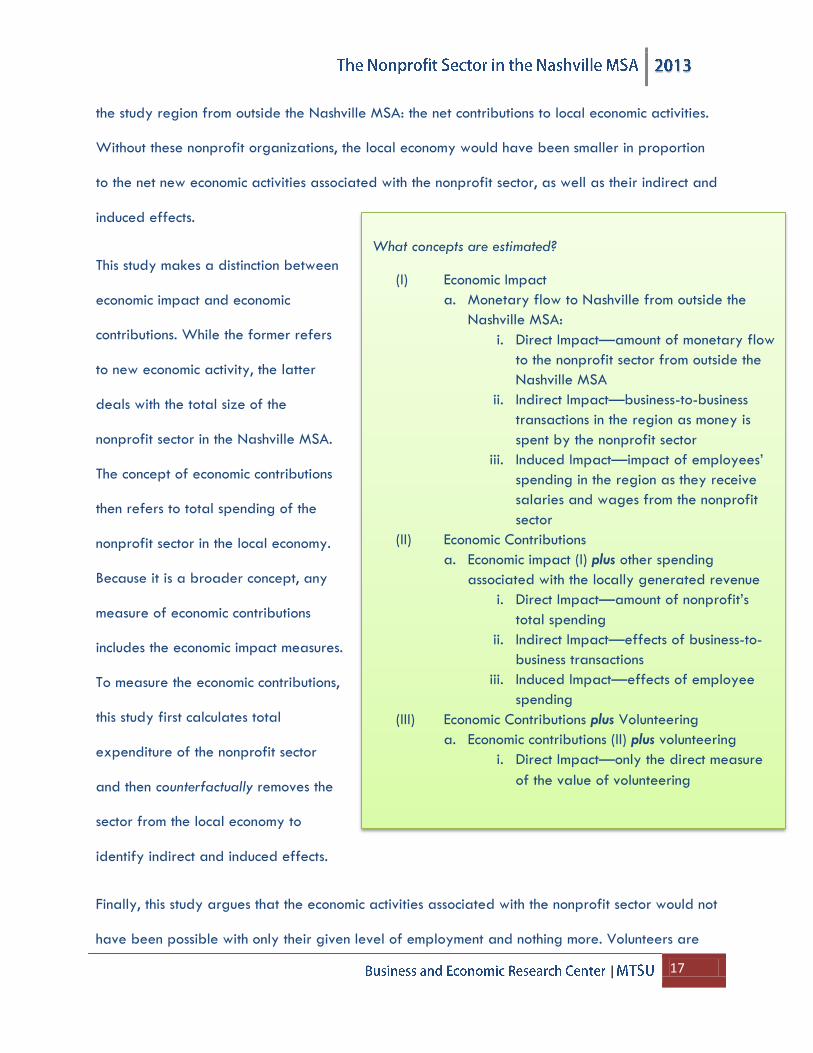
II.3. Economic Impact Definition and IMPLAN Software
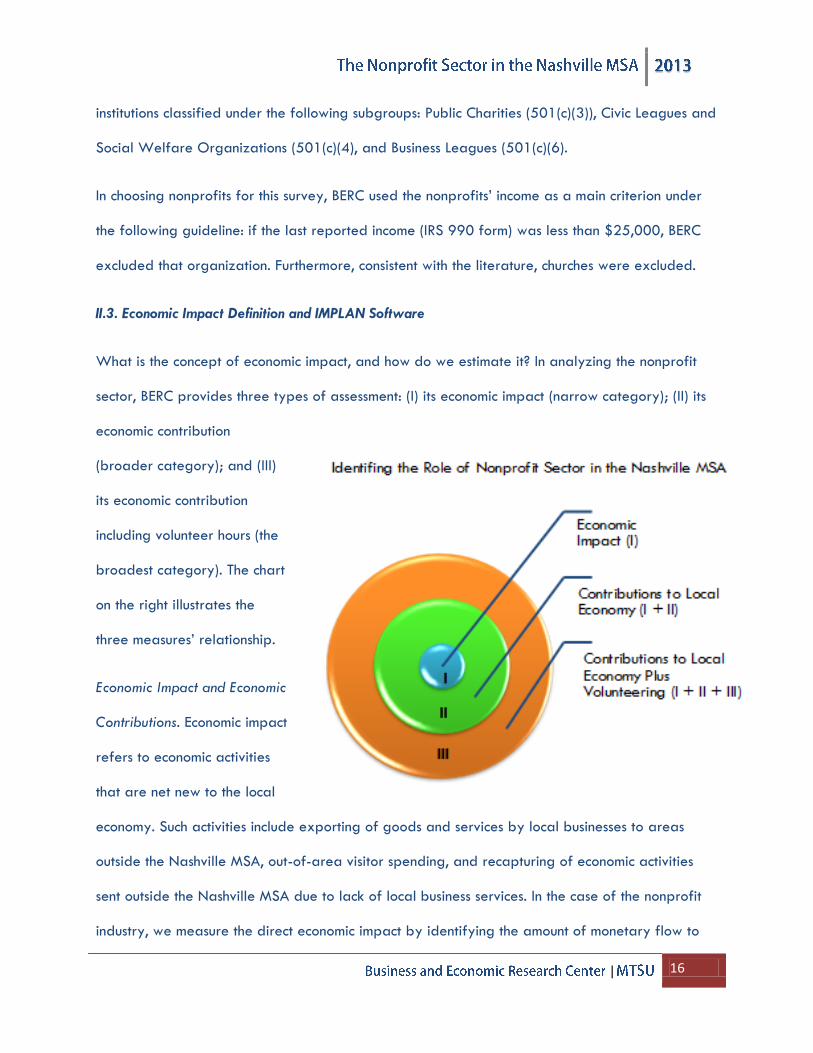
What is the concept of economic impact, and how do we estimate it? In analyzing the nonprofit
sector, BERC provides three types of assessment: (I) its economic impact (narrow category); (II) its
economic contribution
(broader category); and (III)
its economic contribution
including volunteer hours (the
broadest category). The chart
on the right illustrates the
three measures’ relationship.
Economic Impact and Economic
Contributions. Economic impact
refers to economic activities
that are net new to the local
economy. Such activities include exporting of goods and services by local businesses to areas
outside the Nashville MSA, out-of-area visitor spending, and recapturing of economic activities
sent outside the Nashville MSA due to lack of local business services. In the case of the nonprofit
industry, we measure the direct economic impact by identifying the amount of monetary flow to
| 17
the study region from outside the Nashville MSA: the net contributions to local economic activities.
Without these nonprofit organizations, the local economy would have been smaller in proportion
to the net new economic activities associated with the nonprofit sector, as well as their indirect and
induced effects.
This study makes a distinction between
economic impact and economic
contributions. While the former refers
to new economic activity, the latter
deals with the total size of the
nonprofit sector in the Nashville MSA.
The concept of economic contributions
then refers to total spending of the
nonprofit sector in the local economy.
Because it is a broader concept, any
measure of economic contributions
includes the economic impact measures.
To measure the economic contributions,
this study first calculates total
expenditure of the nonprofit sector
and then counterfactually removes the
sector from the local economy to
identify indirect and induced effects.
Finally, this study argues that the economic activities associated with the nonprofit sector would not
have been possible with only their given level of employment and nothing more. Volunteers are
What concepts are estimated?
(I) Economic Impact
a. Monetary flow to Nashville from outside the
Nashville MSA:
i. Direct Impact—amount of monetary flow
to the nonprofit sector from outside the
Nashville MSA
ii. Indirect Impact—business-to-business
transactions in the region as money is
spent by the nonprofit sector
iii. Induced Impact—impact of employees’
spending in the region as they receive
salaries and wages from the nonprofit
sector
(II) Economic Contributions
a. Economic impact (I) plus other spending
associated with the locally generated revenue
i. Direct Impact—amount of nonprofit’s
total spending
ii. Indirect Impact—effects of business-to-
business transactions
iii. Induced Impact—effects of employee
spending
(III) Economic Contributions plus Volunteering
a. Economic contributions (II) plus volunteering
i. Direct Impact—only the direct measure
of the value of volunteering
| 18
critically important in this sector. In a third category, this study quantifies total wages associated
with volunteer labor and adds the total direct wages to the economic contribution estimates.
IMPLAN Model. To estimate indirect and induced effects of economic activities, BERC uses the
IMPLAN model developed for the Nashville MSA. IMPLAN is a nationally recognized, commonly
used input-output model to measure the economic and fiscal effects of economic development
projects.
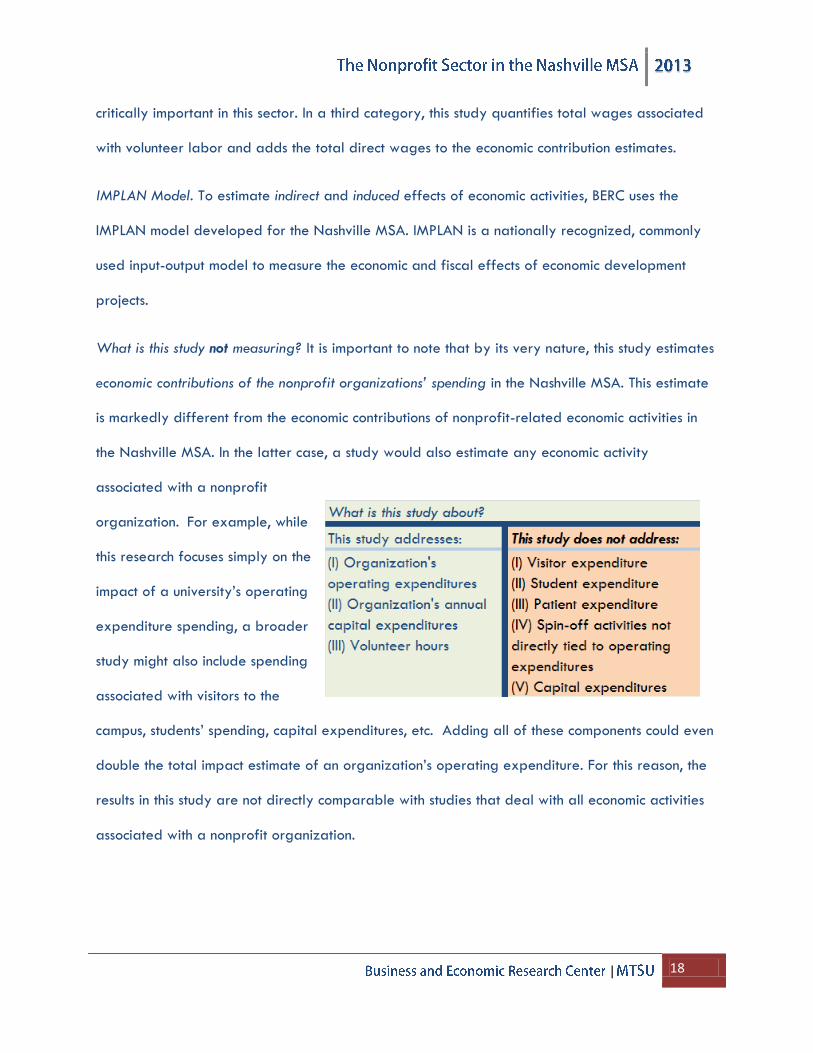
What is this study not measuring? It is important to note that by its very nature, this study estimates
economic contributions of the nonprofit organizations’ spending in the Nashville MSA. This estimate
is markedly different from the economic contributions of nonprofit-related economic activities in
the Nashville MSA. In the latter case, a study would also estimate any economic activity
associated with a nonprofit
organization. For example, while
this research focuses simply on the
impact of a university’s operating
expenditure spending, a broader
study might also include spending
associated with visitors to the
campus, students’ spending, capital expenditures, etc. Adding all of these components could even
double the total impact estimate of an organization’s operating expenditure. For this reason, the
results in this study are not directly comparable with studies that deal with all economic activities
associated with a nonprofit organization.
| 19
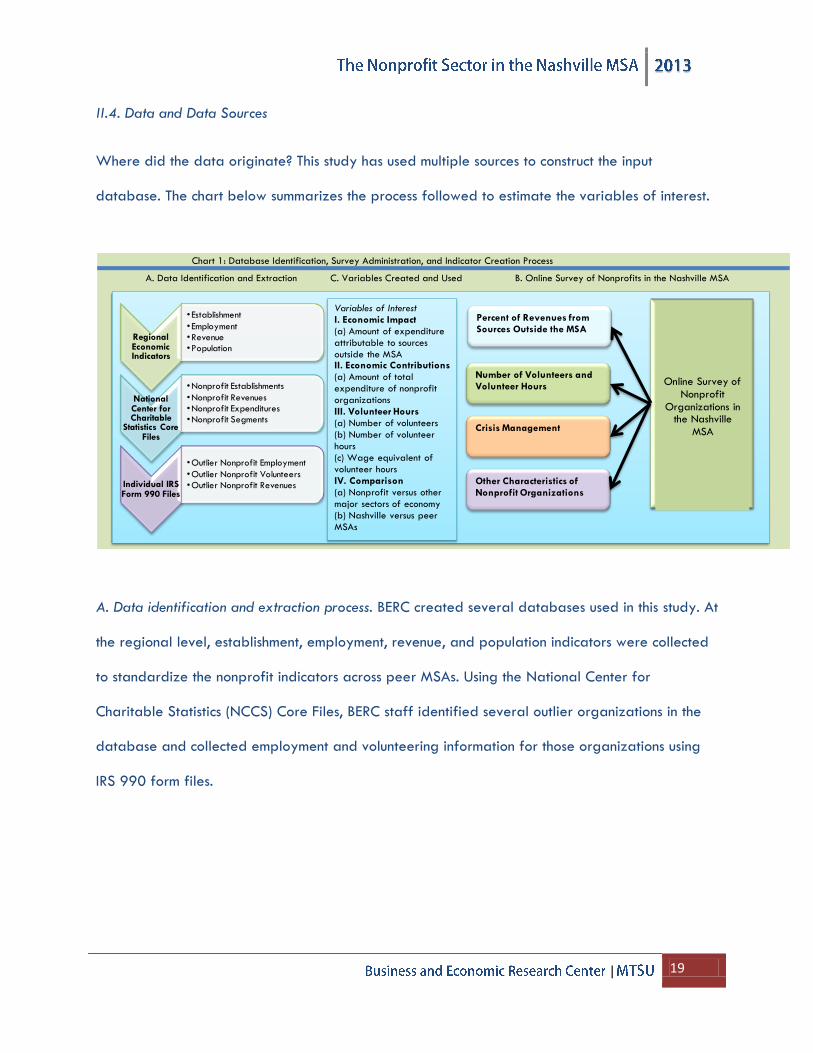
II.4. Data and Data Sources
Where did the data originate? This study has used multiple sources to construct the input
database. The chart below summarizes the process followed to estimate the variables of interest.
A. Data identification and extraction process. BERC created several databases used in this study. At
the regional level, establishment, employment, revenue, and population indicators were collected
to standardize the nonprofit indicators across peer MSAs. Using the National Center for
Charitable Statistics (NCCS) Core Files, BERC staff identified several outlier organizations in the
database and collected employment and volunteering information for those organizations using
IRS 990 form files.
Chart 1: Database Identification, Survey Administration, and Indicator Creation Process
A. Data Identification and Extraction C. Variables Created and Used B. Online Survey of Nonprofits in the Nashville MSA
Regional Economic Indicators
•Establishment
•Employment
•Revenue
•Population
National Center for Charitable
Statistics Core Files
•Nonprofit Establishments
•Nonprofit Revenues
•Nonprofit Expenditures
•Nonprofit Segments
Individual IRS Form 990 Files
•Outlier Nonprofit Employment
•Outlier Nonprofit Volunteers
•Outlier Nonprofit Revenues
Online Survey of
Nonprofit
Organizations in the Nashville
MSA
Percent of Revenues from
Sources Outside the MSA
Number of Volunteers and
Volunteer Hours
Crisis Management
Other Characteristics of
Nonprofit Organizations
Variables of Interest
I. Economic Impact
(a) Amount of expenditure
attributable to sources
outside the MSAII. Economic Contributions
(a) Amount of total
expenditure of nonprofit
organizations
III. Volunteer Hours
(a) Number of volunteers
(b) Number of volunteer
hours
(c) Wage equivalent of
volunteer hours
IV. Comparison
(a) Nonprofit versus other
major sectors of economy
(b) Nashville versus peer
MSAs
| 20
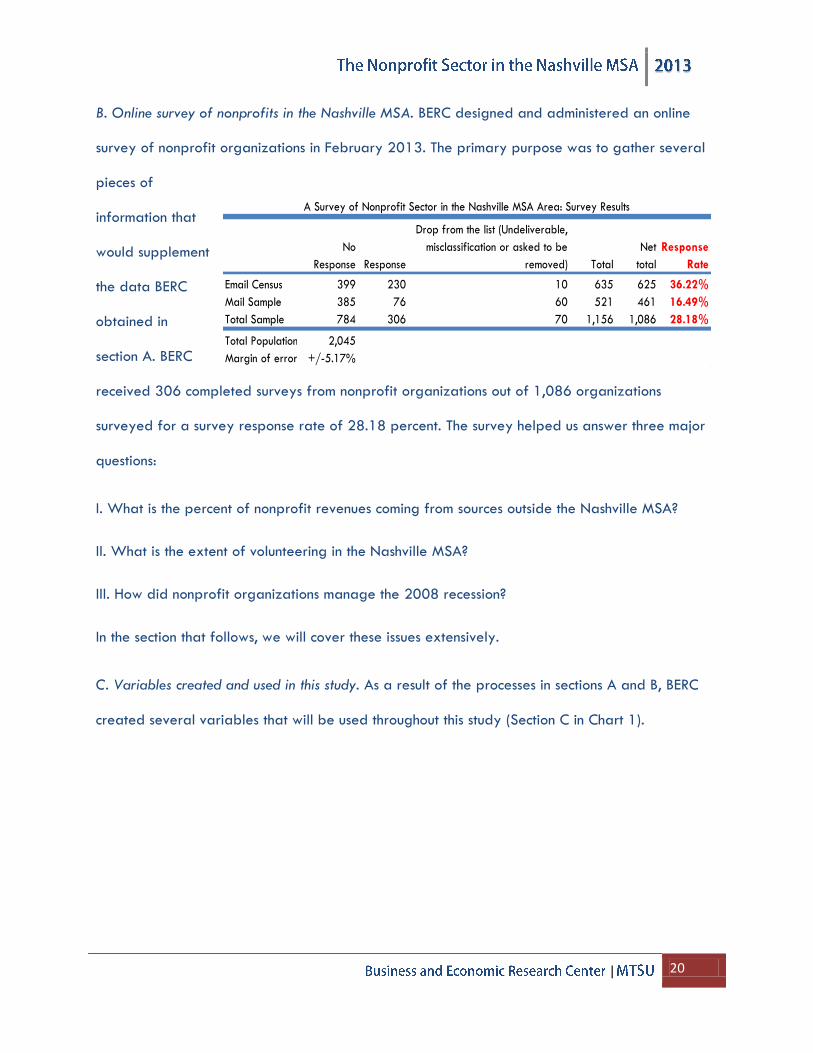
B. Online survey of nonprofits in the Nashville MSA. BERC designed and administered an online
survey of nonprofit organizations in February 2013. The primary purpose was to gather several
pieces of
information that
would supplement
the data BERC
obtained in
section A. BERC
received 306 completed surveys from nonprofit organizations out of 1,086 organizations
surveyed for a survey response rate of 28.18 percent. The survey helped us answer three major
questions:
I. What is the percent of nonprofit revenues coming from sources outside the Nashville MSA?
II. What is the extent of volunteering in the Nashville MSA?
III. How did nonprofit organizations manage the 2008 recession?
In the section that follows, we will cover these issues extensively.
C. Variables created and used in this study. As a result of the processes in sections A and B, BERC
created several variables that will be used throughout this study (Section C in Chart 1).
No
Response Response
Drop from the list (Undeliverable,
misclassification or asked to be
removed) Total
Net
total
Response
Rate
Email Census 399 230 10 635 625 36.22%
Mail Sample 385 76 60 521 461 16.49%
Total Sample 784 306 70 1,156 1,086 28.18%
Total Population 2,045
Margin of error +/-5.17%
A Survey of Nonprofit Sector in the Nashville MSA Area: Survey Results
| 21
III. Characteristics of the Nonprofit Sector and the Nashville MSA Economy
Organizations in the nonprofit sector represent a diverse group of the NAICS (North American
Industrial Classification System) sectors in the regional economy. They also differ in size in terms of
employment, revenue, and expenditure. For example, the 15 largest organizations in the
Nashville MSA’s nonprofit sector account for two-thirds of its total revenue and expenditure. This
section explores the dynamics of the nonprofit sector in the Nashville MSA.
III.1. Size, scope and change by segment
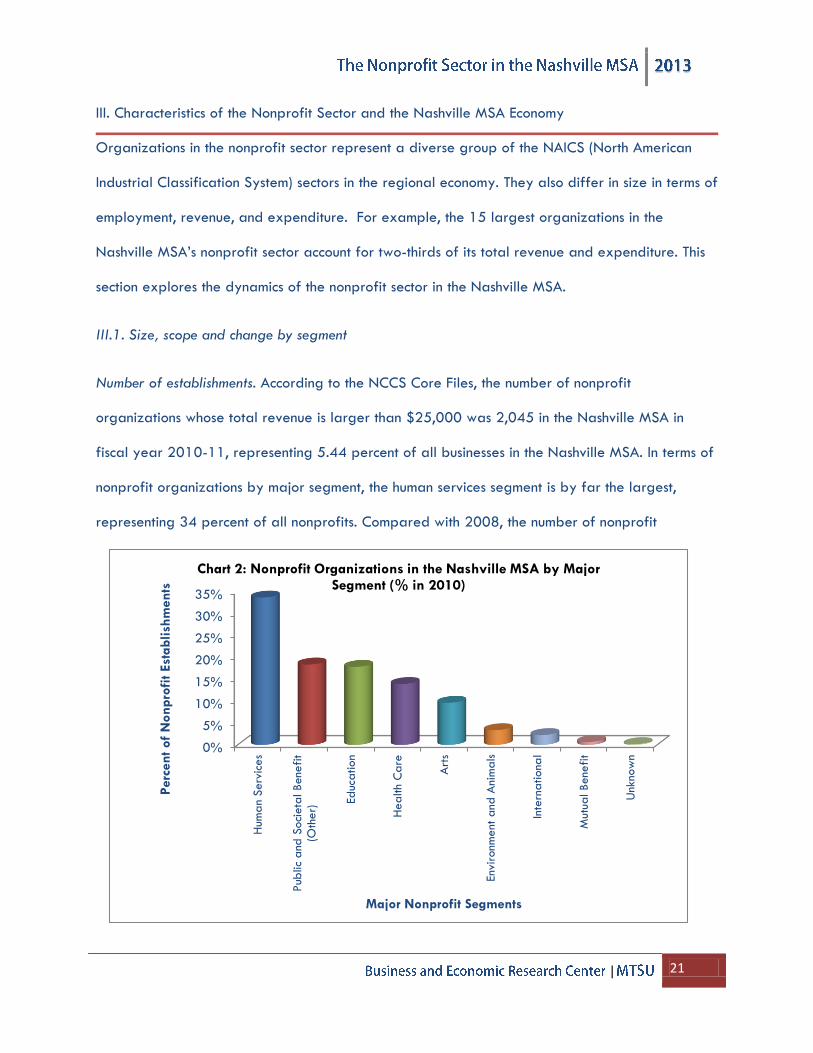
Number of establishments. According to the NCCS Core Files, the number of nonprofit
organizations whose total revenue is larger than $25,000 was 2,045 in the Nashville MSA in
fiscal year 2010-11, representing 5.44 percent of all businesses in the Nashville MSA. In terms of
nonprofit organizations by major segment, the human services segment is by far the largest,
representing 34 percent of all nonprofits. Compared with 2008, the number of nonprofit
0%
5%
10%
15%
20%
25%
30%
35%
Hum
an
Serv
ices
Pub
lic a
nd S
oci
eta
l Bene
fit
(Oth
er)
Educ
ation
Health
Care
Art
s
Environm
ent and
Anim
als
Inte
rnationa
l
Mutu
al Bene
fit
Unknow
n
Perc
ent of
Nonpro
fit
Est
ablish
ments
Major Nonprofit Segments
Chart 2: Nonprofit Organizations in the Nashville MSA by Major Segment (% in 2010)
| 22
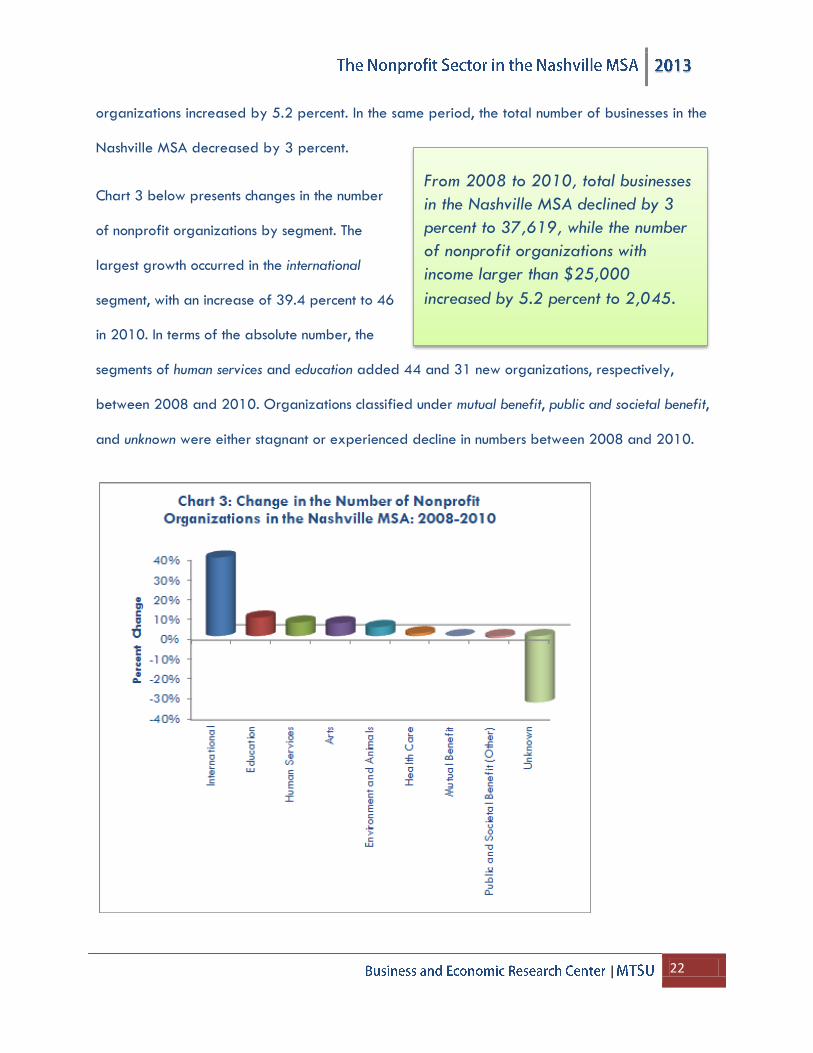
organizations increased by 5.2 percent. In the same period, the total number of businesses in the
Nashville MSA decreased by 3 percent.
Chart 3 below presents changes in the number
of nonprofit organizations by segment. The
largest growth occurred in the international
segment, with an increase of 39.4 percent to 46
in 2010. In terms of the absolute number, the
segments of human services and education added 44 and 31 new organizations, respectively,
between 2008 and 2010. Organizations classified under mutual benefit, public and societal benefit,
and unknown were either stagnant or experienced decline in numbers between 2008 and 2010.
From 2008 to 2010, total businesses
in the Nashville MSA declined by 3
percent to 37,619, while the number
of nonprofit organizations with
income larger than $25,000
increased by 5.2 percent to 2,045.
| 23
Nonprofit revenues. What is the size of the nonprofit sector in the Nashville MSA? To estimate this
figure, BERC used a consistent source, the NCCS Core Files, and an online survey. This report
presents a conservative estimate of total revenue because BERC excluded (a) all organizations
with less than $25,000 in annual revenue and (b) about 400 smaller organizations because the
mailed surveys were returned as undeliverable.
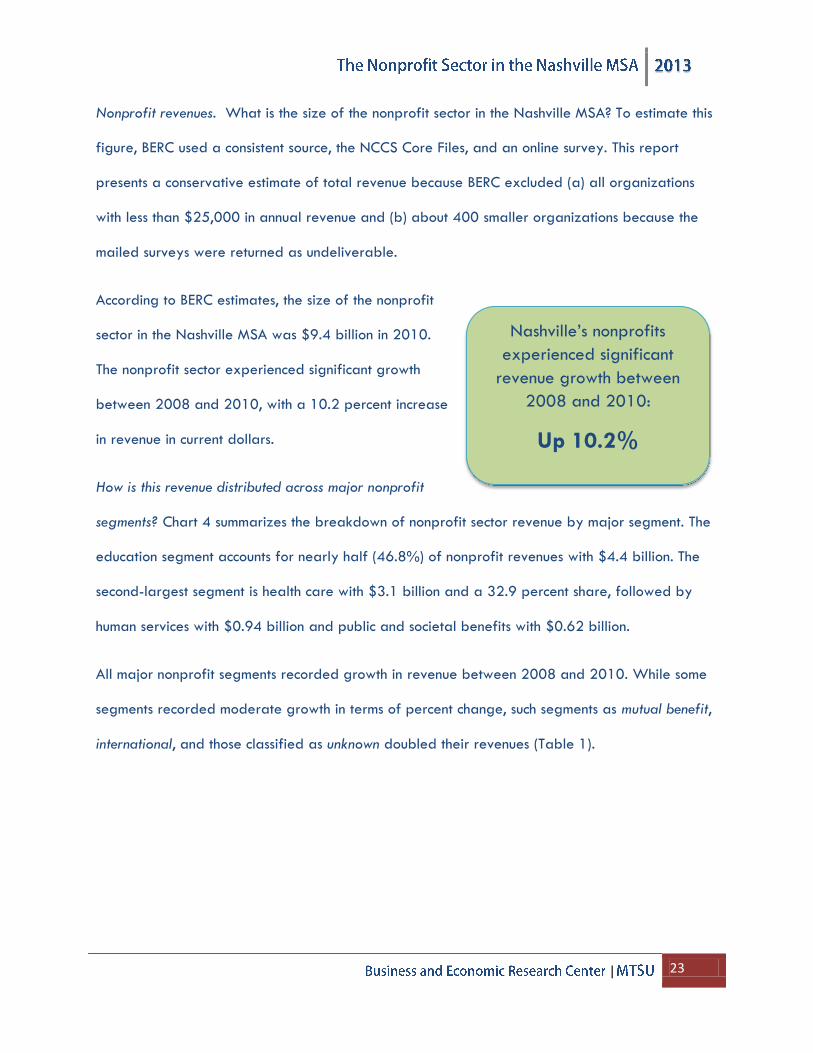
According to BERC estimates, the size of the nonprofit
sector in the Nashville MSA was $9.4 billion in 2010.
The nonprofit sector experienced significant growth
between 2008 and 2010, with a 10.2 percent increase
in revenue in current dollars.
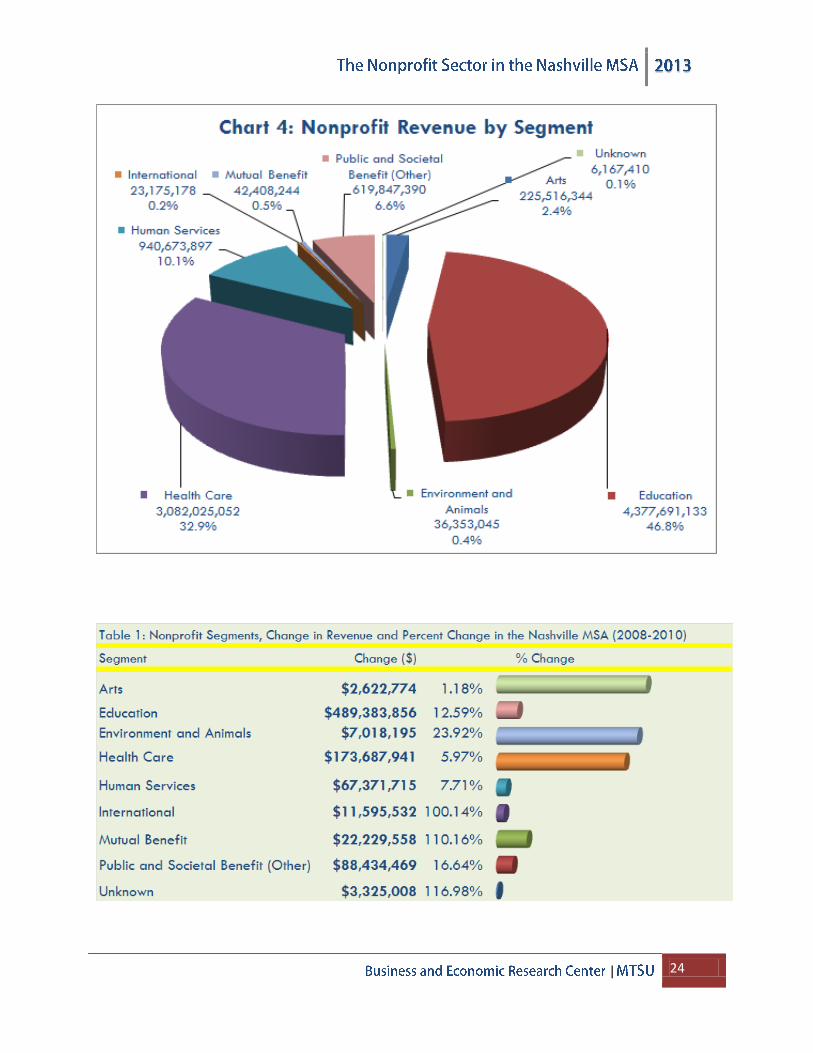
How is this revenue distributed across major nonprofit
segments? Chart 4 summarizes the breakdown of nonprofit sector revenue by major segment. The
education segment accounts for nearly half (46.8%) of nonprofit revenues with $4.4 billion. The
second-largest segment is health care with $3.1 billion and a 32.9 percent share, followed by
human services with $0.94 billion and public and societal benefits with $0.62 billion.
All major nonprofit segments recorded growth in revenue between 2008 and 2010. While some
segments recorded moderate growth in terms of percent change, such segments as mutual benefit,
international, and those classified as unknown doubled their revenues (Table 1).
Nashville’s nonprofits
experienced significant
revenue growth between
2008 and 2010:
Up 10.2%
| 24
| 25
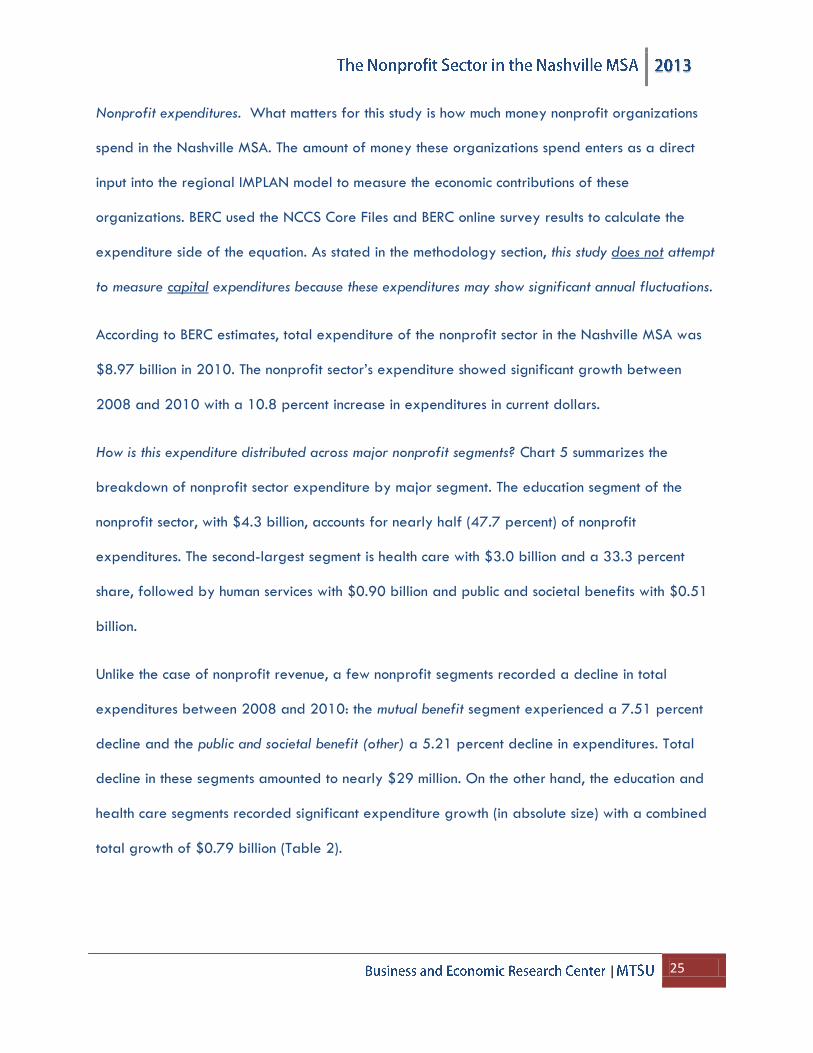
Nonprofit expenditures. What matters for this study is how much money nonprofit organizations
spend in the Nashville MSA. The amount of money these organizations spend enters as a direct
input into the regional IMPLAN model to measure the economic contributions of these
organizations. BERC used the NCCS Core Files and BERC online survey results to calculate the
expenditure side of the equation. As stated in the methodology section, this study does not attempt
to measure capital expenditures because these expenditures may show significant annual fluctuations.
According to BERC estimates, total expenditure of the nonprofit sector in the Nashville MSA was
$8.97 billion in 2010. The nonprofit sector’s expenditure showed significant growth between
2008 and 2010 with a 10.8 percent increase in expenditures in current dollars.
How is this expenditure distributed across major nonprofit segments? Chart 5 summarizes the
breakdown of nonprofit sector expenditure by major segment. The education segment of the
nonprofit sector, with $4.3 billion, accounts for nearly half (47.7 percent) of nonprofit
expenditures. The second-largest segment is health care with $3.0 billion and a 33.3 percent
share, followed by human services with $0.90 billion and public and societal benefits with $0.51
billion.
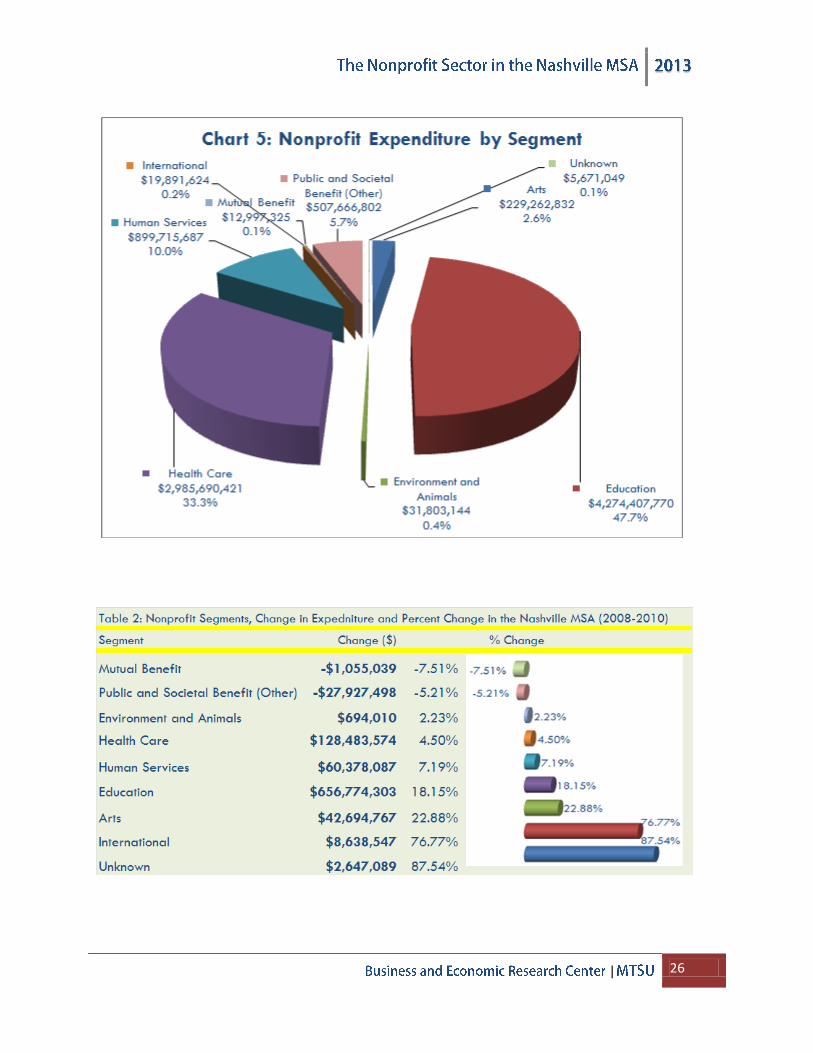
Unlike the case of nonprofit revenue, a few nonprofit segments recorded a decline in total
expenditures between 2008 and 2010: the mutual benefit segment experienced a 7.51 percent
decline and the public and societal benefit (other) a 5.21 percent decline in expenditures. Total
decline in these segments amounted to nearly $29 million. On the other hand, the education and
health care segments recorded significant expenditure growth (in absolute size) with a combined
total growth of $0.79 billion (Table 2).
| 26
| 27
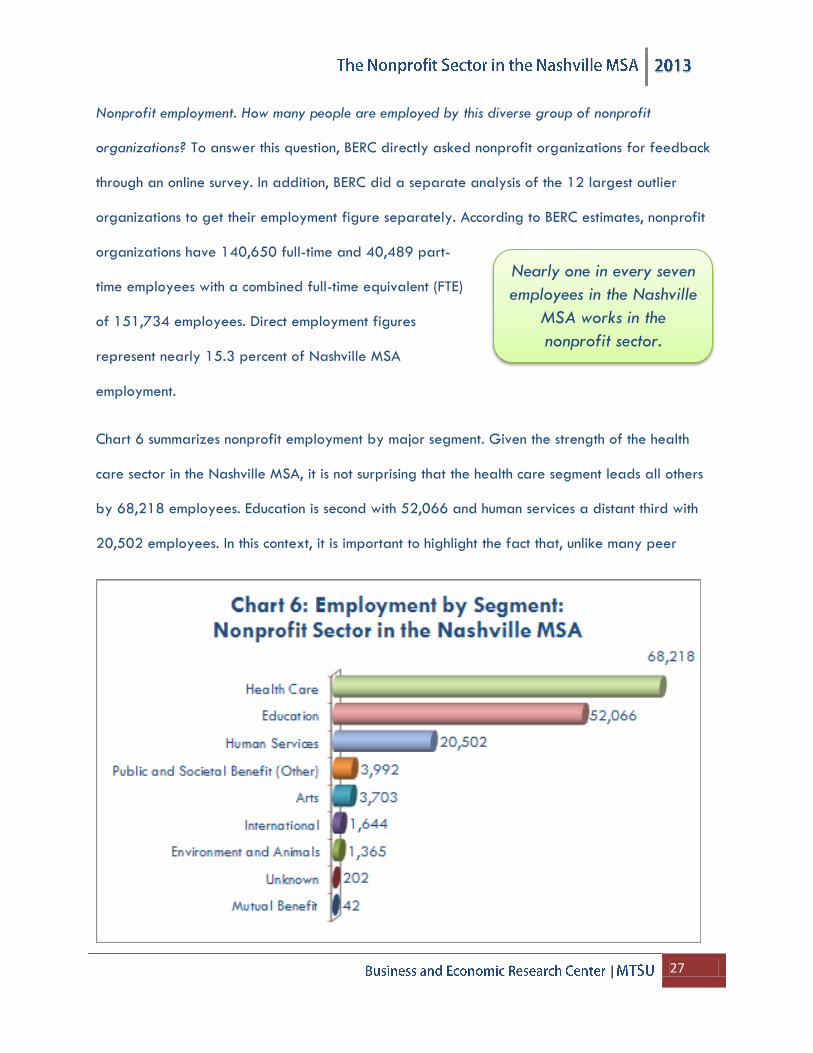
Nonprofit employment. How many people are employed by this diverse group of nonprofit
organizations? To answer this question, BERC directly asked nonprofit organizations for feedback
through an online survey. In addition, BERC did a separate analysis of the 12 largest outlier
organizations to get their employment figure separately. According to BERC estimates, nonprofit
organizations have 140,650 full-time and 40,489 part-
time employees with a combined full-time equivalent (FTE)
of 151,734 employees. Direct employment figures
represent nearly 15.3 percent of Nashville MSA
employment.
Chart 6 summarizes nonprofit employment by major segment. Given the strength of the health
care sector in the Nashville MSA, it is not surprising that the health care segment leads all others
by 68,218 employees. Education is second with 52,066 and human services a distant third with
20,502 employees. In this context, it is important to highlight the fact that, unlike many peer
Nearly one in every seven
employees in the Nashville
MSA works in the
nonprofit sector.
| 28
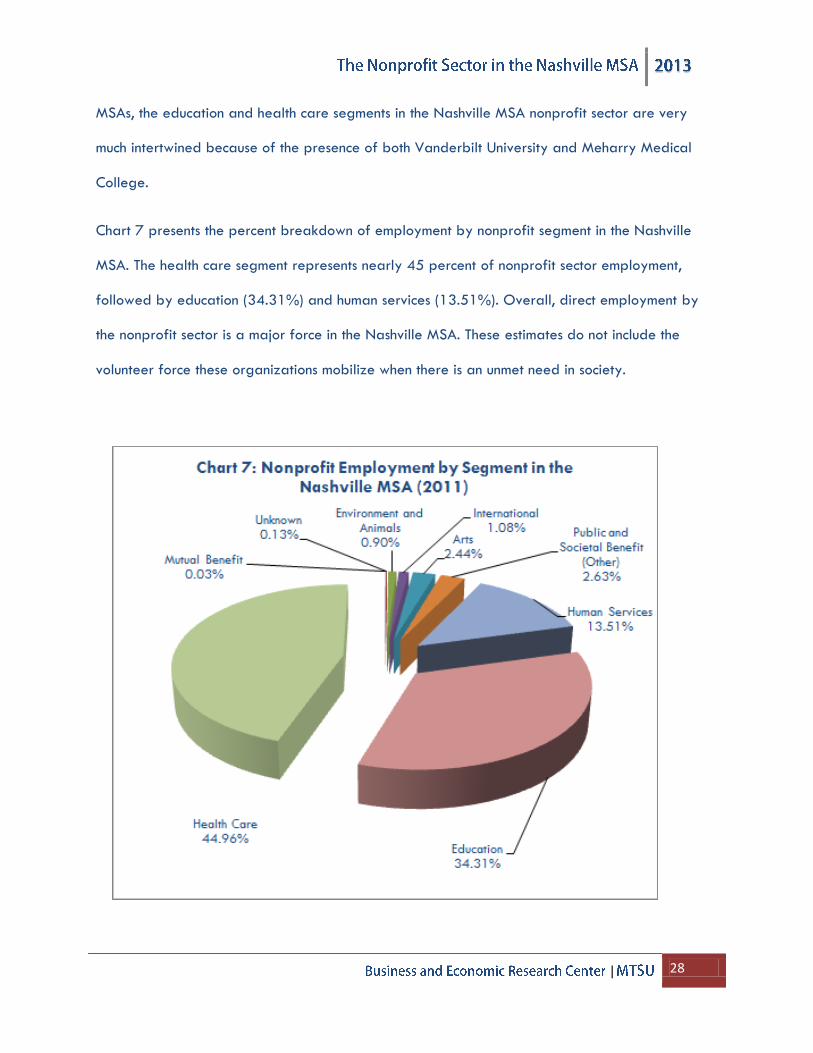
MSAs, the education and health care segments in the Nashville MSA nonprofit sector are very
much intertwined because of the presence of both Vanderbilt University and Meharry Medical
College.
Chart 7 presents the percent breakdown of employment by nonprofit segment in the Nashville
MSA. The health care segment represents nearly 45 percent of nonprofit sector employment,
followed by education (34.31%) and human services (13.51%). Overall, direct employment by
the nonprofit sector is a major force in the Nashville MSA. These estimates do not include the
volunteer force these organizations mobilize when there is an unmet need in society.
| 29
Nonprofit volunteers. BERC administered an online survey to measure the level of volunteer
activities in the nonprofit sector of the Nashville MSA. According to BERC estimates, a total of
429,588 people volunteered in nonprofit organizations in 2011. Since this survey was not a
survey of the population about its volunteering activities, this number may involve duplicate counts
of certain individuals volunteering for several organizations throughout the year. What does this
tell us about the extent of volunteering in the Nashville MSA? Assuming this number represents
unique individuals, one in every three people over 16 years of age volunteered in the nonprofit
sector in the Nashville MSA in 2011. This figure is a little
higher than U.S. figures measured through the Current
Population Survey (www.bls.gov): According to the
September 2012 estimates, slightly over one in every four
individuals over 16 years of age had volunteered in the
U.S. in 2011.
What is the significance of volunteering in the Nashville MSA? According to BERC estimates, the
volunteers in the Nashville MSA recorded 15,641,448 hours of volunteering in 2011. If we use
full-time (40 hours per week) employment figures,
these volunteer hours translate into 8,147 full-time
employment equivalency. When we use the 2011
average annual wage for a full-time nonfarm
employee in the Nashville MSA, $46,150, the
nonprofit volunteering’s monetary value is $376
million.
One in every three people
over 16 years of age has
volunteered in the
nonprofit sector in the
Nashville MSA.
Monetary value of nonprofit
volunteering in the Nashville MSA
is $376 million.
This value is equivalent to the
wages of 8,147 full-time
employees in the Nashville MSA.
| 30
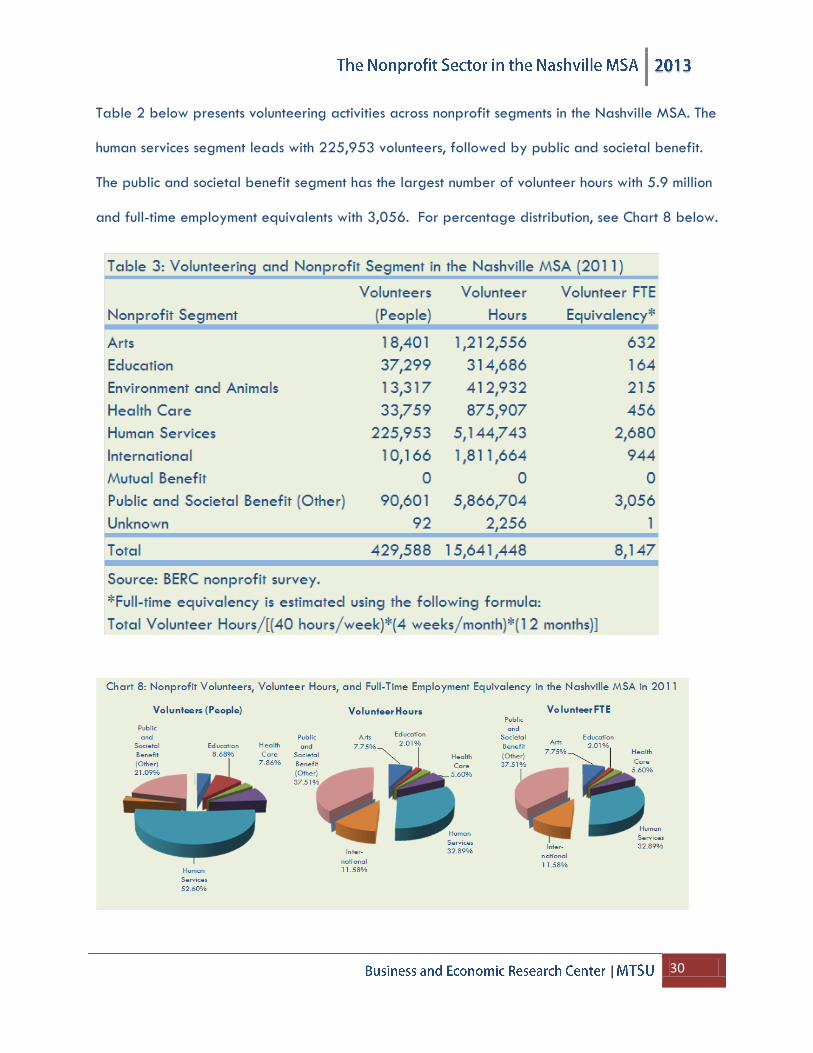
Table 2 below presents volunteering activities across nonprofit segments in the Nashville MSA. The
human services segment leads with 225,953 volunteers, followed by public and societal benefit.
The public and societal benefit segment has the largest number of volunteer hours with 5.9 million
and full-time employment equivalents with 3,056. For percentage distribution, see Chart 8 below.
| 31
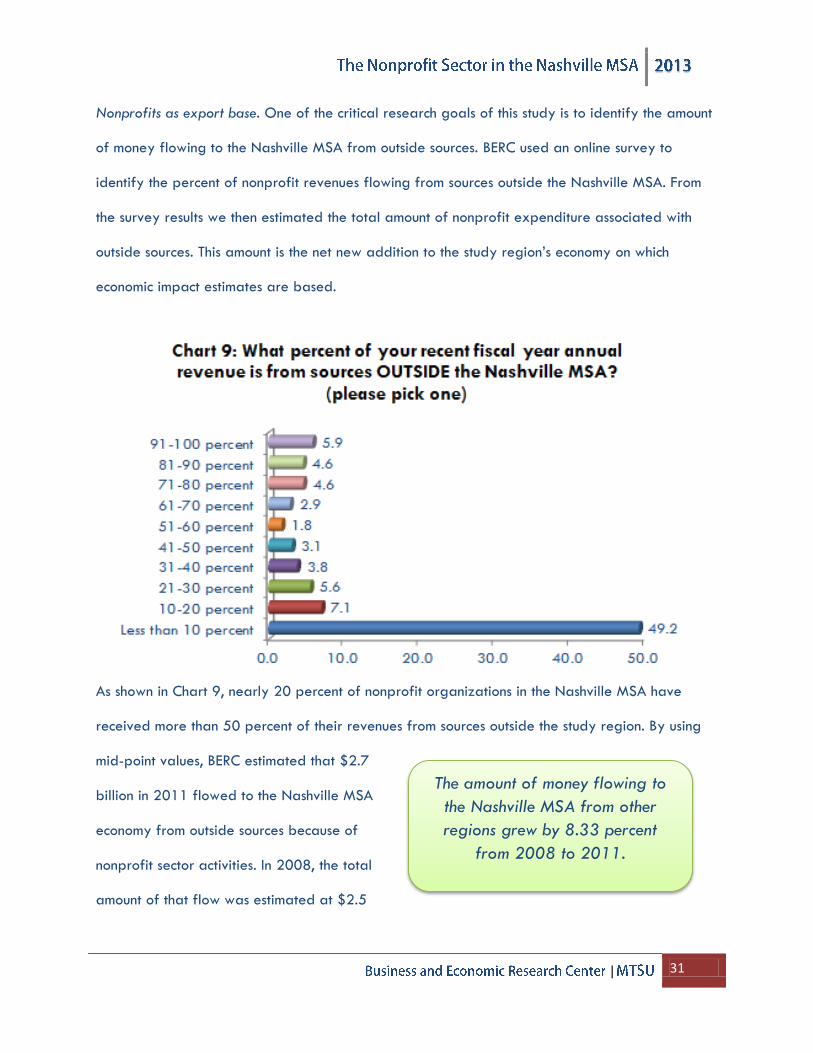
Nonprofits as export base. One of the critical research goals of this study is to identify the amount
of money flowing to the Nashville MSA from outside sources. BERC used an online survey to
identify the percent of nonprofit revenues flowing from sources outside the Nashville MSA. From
the survey results we then estimated the total amount of nonprofit expenditure associated with
outside sources. This amount is the net new addition to the study region’s economy on which
economic impact estimates are based.
As shown in Chart 9, nearly 20 percent of nonprofit organizations in the Nashville MSA have
received more than 50 percent of their revenues from sources outside the study region. By using
mid-point values, BERC estimated that $2.7
billion in 2011 flowed to the Nashville MSA
economy from outside sources because of
nonprofit sector activities. In 2008, the total
amount of that flow was estimated at $2.5
The amount of money flowing to
the Nashville MSA from other
regions grew by 8.33 percent
from 2008 to 2011.
| 32
billion. The amount of money flowing to the Nashville MSA from other regions grew by 8.33
percent between 2008 and 2011.
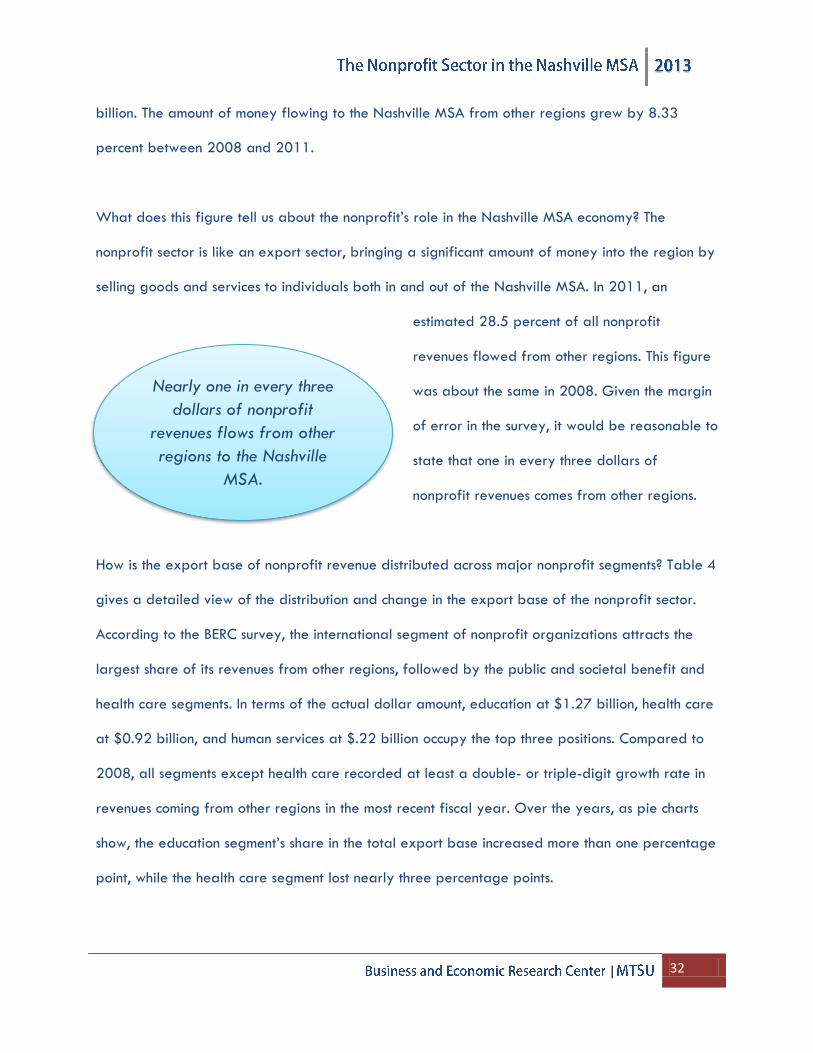
What does this figure tell us about the nonprofit’s role in the Nashville MSA economy? The
nonprofit sector is like an export sector, bringing a significant amount of money into the region by
selling goods and services to individuals both in and out of the Nashville MSA. In 2011, an
estimated 28.5 percent of all nonprofit
revenues flowed from other regions. This figure
was about the same in 2008. Given the margin
of error in the survey, it would be reasonable to
state that one in every three dollars of
nonprofit revenues comes from other regions.
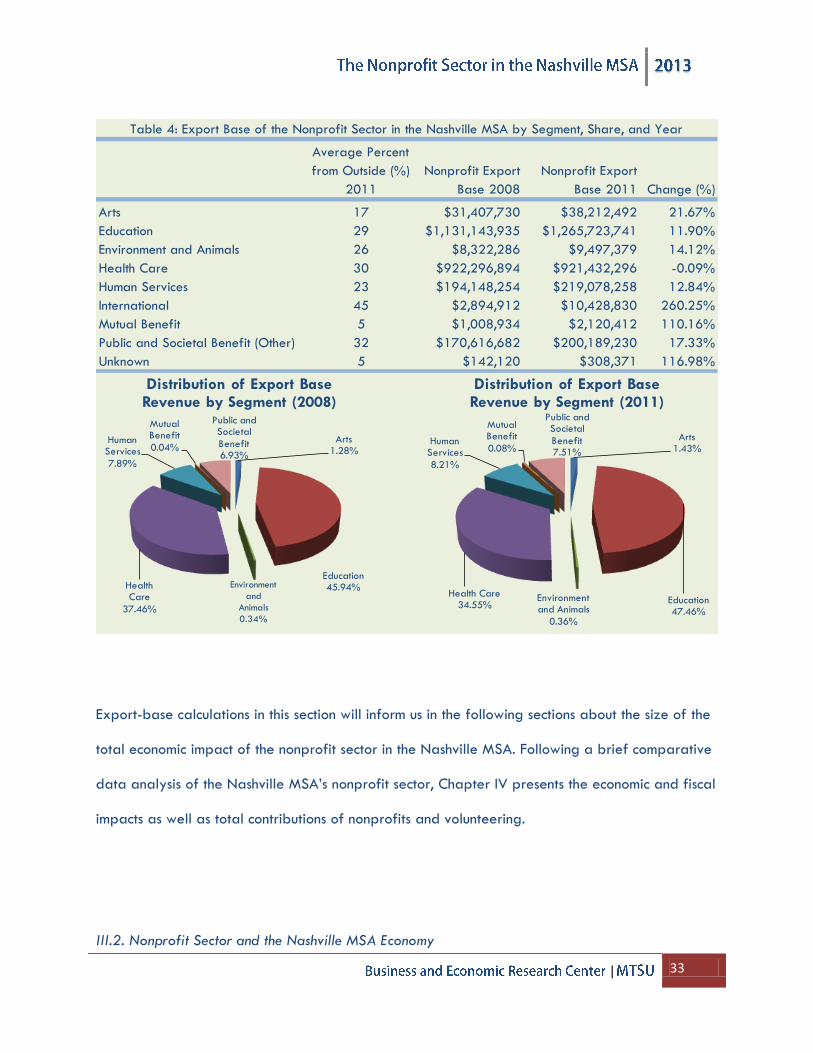
How is the export base of nonprofit revenue distributed across major nonprofit segments? Table 4
gives a detailed view of the distribution and change in the export base of the nonprofit sector.
According to the BERC survey, the international segment of nonprofit organizations attracts the
largest share of its revenues from other regions, followed by the public and societal benefit and
health care segments. In terms of the actual dollar amount, education at $1.27 billion, health care
at $0.92 billion, and human services at $.22 billion occupy the top three positions. Compared to
2008, all segments except health care recorded at least a double- or triple-digit growth rate in
revenues coming from other regions in the most recent fiscal year. Over the years, as pie charts
show, the education segment’s share in the total export base increased more than one percentage
point, while the health care segment lost nearly three percentage points.
Nearly one in every three
dollars of nonprofit
revenues flows from other
regions to the Nashville
MSA.
| 33
Export-base calculations in this section will inform us in the following sections about the size of the
total economic impact of the nonprofit sector in the Nashville MSA. Following a brief comparative
data analysis of the Nashville MSA’s nonprofit sector, Chapter IV presents the economic and fiscal
impacts as well as total contributions of nonprofits and volunteering.
III.2. Nonprofit Sector and the Nashville MSA Economy
Average Percent
from Outside (%)
2011
Nonprofit Export
Base 2008
Nonprofit Export
Base 2011 Change (%)
Arts 17 $31,407,730 $38,212,492 21.67%
Education 29 $1,131,143,935 $1,265,723,741 11.90%
Environment and Animals 26 $8,322,286 $9,497,379 14.12%
Health Care 30 $922,296,894 $921,432,296 -0.09%
Human Services 23 $194,148,254 $219,078,258 12.84%
International 45 $2,894,912 $10,428,830 260.25%
Mutual Benefit 5 $1,008,934 $2,120,412 110.16%
Public and Societal Benefit (Other) 32 $170,616,682 $200,189,230 17.33%
Unknown 5 $142,120 $308,371 116.98%
Table 4: Export Base of the Nonprofit Sector in the Nashville MSA by Segment, Share, and Year
Arts1.28%
Education45.94%Environment
and
Animals
0.34%
Health Care
37.46%
Human Services
7.89%
Mutual Benefit
0.04%
Public and Societal
Benefit 6.93%
Distribution of Export Base Revenue by Segment (2008)
Arts1.43%
Education47.46%
Environment and Animals
0.36%
Health Care34.55%
Human Services
8.21%
Mutual Benefit
0.08%
Public and Societal
Benefit 7.51%
Distribution of Export Base Revenue by Segment (2011)
| 34
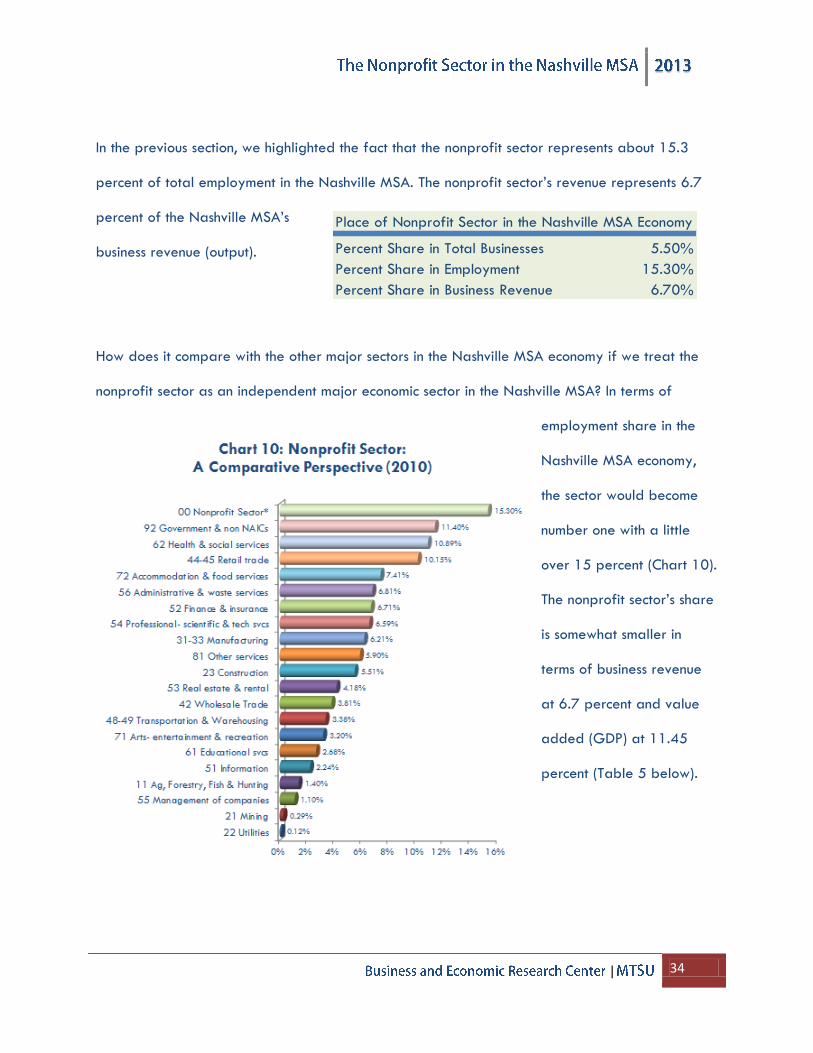
In the previous section, we highlighted the fact that the nonprofit sector represents about 15.3
percent of total employment in the Nashville MSA. The nonprofit sector’s revenue represents 6.7
percent of the Nashville MSA’s
business revenue (output).
How does it compare with the other major sectors in the Nashville MSA economy if we treat the
nonprofit sector as an independent major economic sector in the Nashville MSA? In terms of
employment share in the
Nashville MSA economy,
the sector would become
number one with a little
over 15 percent (Chart 10).
The nonprofit sector’s share
is somewhat smaller in
terms of business revenue
at 6.7 percent and value
added (GDP) at 11.45
percent (Table 5 below).
Place of Nonprofit Sector in the Nashville MSA Economy
Percent Share in Total Businesses 5.50%
Percent Share in Employment 15.30%
Percent Share in Business Revenue 6.70%
| 35
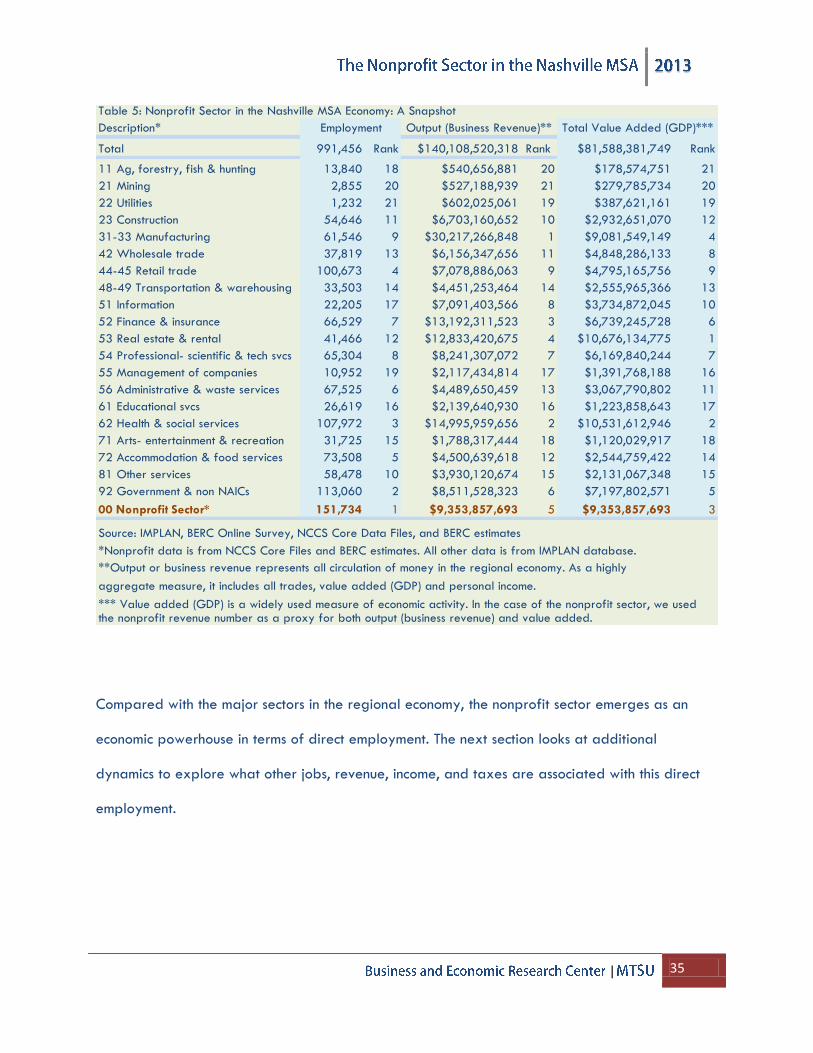
Compared with the major sectors in the regional economy, the nonprofit sector emerges as an
economic powerhouse in terms of direct employment. The next section looks at additional
dynamics to explore what other jobs, revenue, income, and taxes are associated with this direct
employment.
Table 5: Nonprofit Sector in the Nashville MSA Economy: A Snapshot
Description*
Total 991,456 Rank $140,108,520,318 Rank $81,588,381,749 Rank
11 Ag, forestry, fish & hunting 13,840 18 $540,656,881 20 $178,574,751 21
21 Mining 2,855 20 $527,188,939 21 $279,785,734 20
22 Utilities 1,232 21 $602,025,061 19 $387,621,161 19
23 Construction 54,646 11 $6,703,160,652 10 $2,932,651,070 12
31-33 Manufacturing 61,546 9 $30,217,266,848 1 $9,081,549,149 4
42 Wholesale trade 37,819 13 $6,156,347,656 11 $4,848,286,133 8
44-45 Retail trade 100,673 4 $7,078,886,063 9 $4,795,165,756 9
48-49 Transportation & warehousing 33,503 14 $4,451,253,464 14 $2,555,965,366 13
51 Information 22,205 17 $7,091,403,566 8 $3,734,872,045 10
52 Finance & insurance 66,529 7 $13,192,311,523 3 $6,739,245,728 6
53 Real estate & rental 41,466 12 $12,833,420,675 4 $10,676,134,775 1
54 Professional- scientific & tech svcs 65,304 8 $8,241,307,072 7 $6,169,840,244 7
55 Management of companies 10,952 19 $2,117,434,814 17 $1,391,768,188 16
56 Administrative & waste services 67,525 6 $4,489,650,459 13 $3,067,790,802 11
61 Educational svcs 26,619 16 $2,139,640,930 16 $1,223,858,643 17
62 Health & social services 107,972 3 $14,995,959,656 2 $10,531,612,946 2
71 Arts- entertainment & recreation 31,725 15 $1,788,317,444 18 $1,120,029,917 18
72 Accommodation & food services 73,508 5 $4,500,639,618 12 $2,544,759,422 14
81 Other services 58,478 10 $3,930,120,674 15 $2,131,067,348 15
92 Government & non NAICs 113,060 2 $8,511,528,323 6 $7,197,802,571 5
00 Nonprofit Sector* 151,734 1 $9,353,857,693 5 $9,353,857,693 3
Source: IMPLAN, BERC Online Survey, NCCS Core Data Files, and BERC estimates
*Nonprofit data is from NCCS Core Files and BERC estimates. All other data is from IMPLAN database.
**Output or business revenue represents all circulation of money in the regional economy. As a highly
aggregate measure, it includes all trades, value added (GDP) and personal income.
*** Value added (GDP) is a widely used measure of economic activity. In the case of the nonprofit sector, we used the nonprofit revenue number as a proxy for both output (business revenue) and value added.
Employment Output (Business Revenue)** Total Value Added (GDP)***
| 36
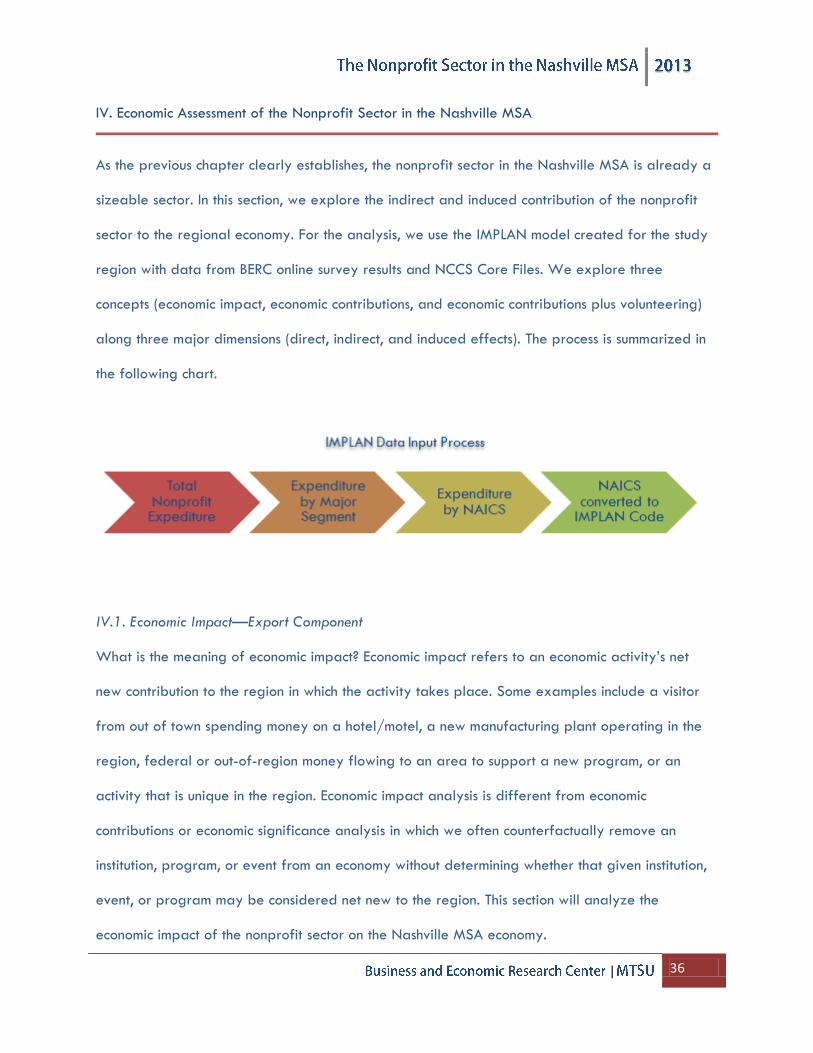
IV. Economic Assessment of the Nonprofit Sector in the Nashville MSA
As the previous chapter clearly establishes, the nonprofit sector in the Nashville MSA is already a
sizeable sector. In this section, we explore the indirect and induced contribution of the nonprofit
sector to the regional economy. For the analysis, we use the IMPLAN model created for the study
region with data from BERC online survey results and NCCS Core Files. We explore three
concepts (economic impact, economic contributions, and economic contributions plus volunteering)
along three major dimensions (direct, indirect, and induced effects). The process is summarized in
the following chart.
IV.1. Economic Impact—Export Component
What is the meaning of economic impact? Economic impact refers to an economic activity’s net
new contribution to the region in which the activity takes place. Some examples include a visitor
from out of town spending money on a hotel/motel, a new manufacturing plant operating in the
region, federal or out-of-region money flowing to an area to support a new program, or an
activity that is unique in the region. Economic impact analysis is different from economic
contributions or economic significance analysis in which we often counterfactually remove an
institution, program, or event from an economy without determining whether that given institution,
event, or program may be considered net new to the region. This section will analyze the
economic impact of the nonprofit sector on the Nashville MSA economy.
| 37
How is the direct economic impact figure determined? BERC used an online nonprofit survey to
capture what percent of nonprofit revenue flows from sources outside the study region. This
estimate gives a conservative figure regarding resource flow to the region from outside sources.
Many nonprofit organizations may provide a unique service to the study-area residents. In certain
medical fields, there may not be even close substitutes within the Nashville MSA. However, making
an assessment of each organization’s unique contribution to the region is beyond the scope of this
project. Therefore, as a conservative estimate, economic impact assessment in this study focuses on
the amount of funding flowing to Nashville from other regions.
In reporting economic impact and economic contribution estimates, we follow the procedure
outlined below:
(1) Business revenue (output) effect—direct, indirect (the effect of business-to-business
interactions), and induced (the effect of employee spending of wages and salaries) by
nonprofit segment and major industries. These measures (indirect and induced) are also called
the ripple effect. The business revenue effect represents all economic activities (i.e., trades,
value added, income, taxes, proprietary income, etc.) associated with the activity. Therefore,
this figure should not be aggregated with any other measures reported here.
(2) Employment effect—direct, indirect, and induced by nonprofit segment and major industries.
(3) Labor income effect—direct, indirect, and induced by nonprofit segment and major industries.
(4) Local and state taxes—total taxes by nonprofit segment.
In this context, it is also important to remember the major assumptions used for this section:
(1) The study region is the Nashville MSA—13 counties in middle Tennessee.
| 38
(2) Only nonprofit organizations registered under 501(c)(3), 501(c)(4), and 501(c)(6) are
included. As a further step, all churches are excluded.
(3) Only organizations with an annual revenue of $25,000 and above are included.
(4) In the economic impact section, only the component of revenue flowing to the Nashville
MSA from outside sources is included.
(5) No further assumptions regarding the substitution effect, recapture rate, or any other
attributes of nonprofit organizations have been made.
(6) Data sources are the NCCS Core Files for screening purposes and total nonprofit revenue
and the BERC online nonprofit survey for an average percent of revenue flowing from
outside the Nashville MSA.
(7) There may be a certain degree of discrepancy in data files in terms of number of
establishments, revenue, expenditure, and employment, resulting from
a. the use of multiple databases;
b. several levels of aggregation;
c. change in data year and impact year (for example, the NCCS Core Files are
primarily for the year 2010-11; we deflated these numbers to 2011 to align with
survey estimates).
Economic Impact by Segment
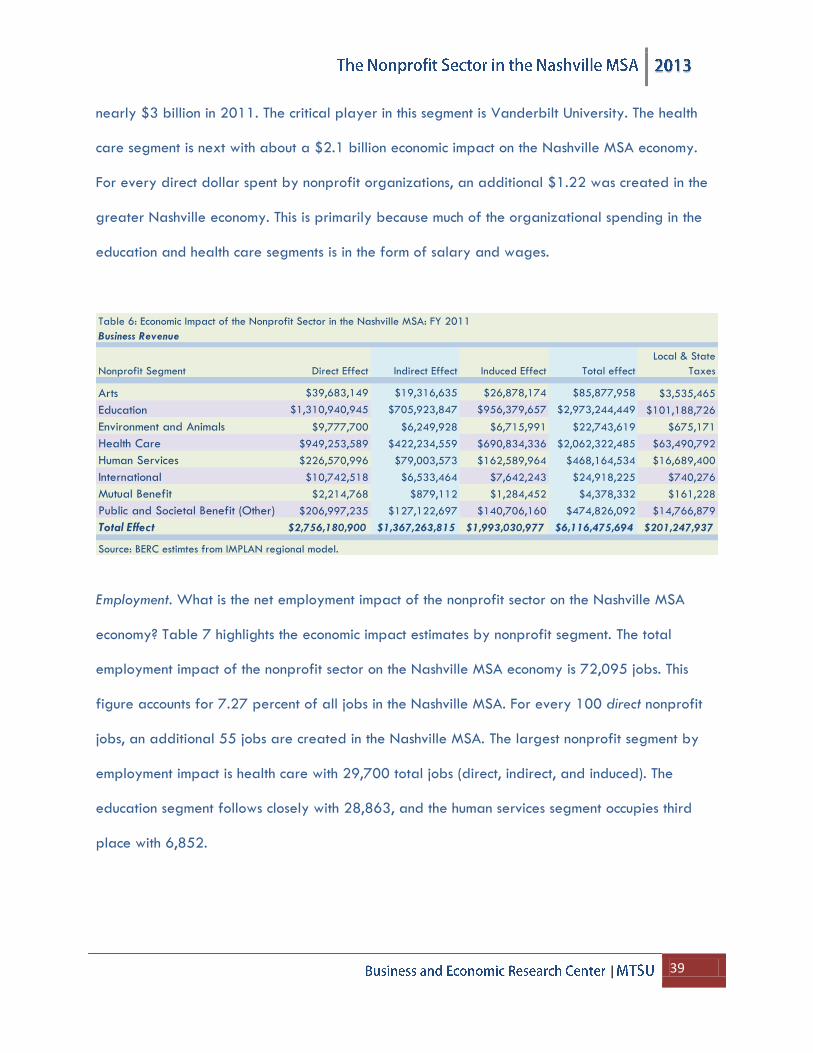
Business Revenue. Nonprofit organizations’ total economic impact in the Nashville MSA, measured
as business revenue, is $6.12 billion (Table 6). This represents 4.37 percent of the Nashville MSA’s
total output (business revenue) in 2011. In FY 2011, activities associated with the nonprofit
organizations accounted for $201.3 million in state and local taxes. Which segment’s impact is the
largest? The education segment generated the largest economic impact among nonprofits with
| 39
nearly $3 billion in 2011. The critical player in this segment is Vanderbilt University. The health
care segment is next with about a $2.1 billion economic impact on the Nashville MSA economy.
For every direct dollar spent by nonprofit organizations, an additional $1.22 was created in the
greater Nashville economy. This is primarily because much of the organizational spending in the
education and health care segments is in the form of salary and wages.
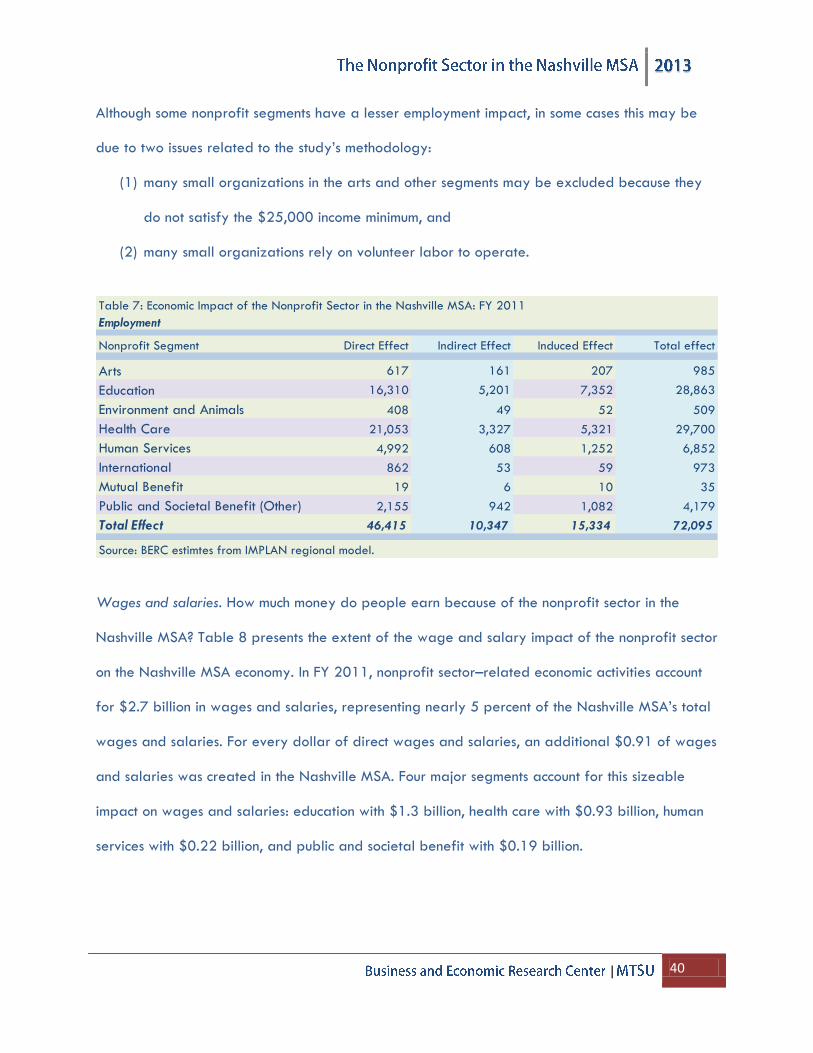
Employment. What is the net employment impact of the nonprofit sector on the Nashville MSA
economy? Table 7 highlights the economic impact estimates by nonprofit segment. The total
employment impact of the nonprofit sector on the Nashville MSA economy is 72,095 jobs. This
figure accounts for 7.27 percent of all jobs in the Nashville MSA. For every 100 direct nonprofit
jobs, an additional 55 jobs are created in the Nashville MSA. The largest nonprofit segment by
employment impact is health care with 29,700 total jobs (direct, indirect, and induced). The
education segment follows closely with 28,863, and the human services segment occupies third
place with 6,852.
Table 6: Economic Impact of the Nonprofit Sector in the Nashville MSA: FY 2011
Business Revenue
Nonprofit Segment Direct Effect Indirect Effect Induced Effect Total effect
Local & State
Taxes
Arts $39,683,149 $19,316,635 $26,878,174 $85,877,958 $3,535,465
Education $1,310,940,945 $705,923,847 $956,379,657 $2,973,244,449 $101,188,726
Environment and Animals $9,777,700 $6,249,928 $6,715,991 $22,743,619 $675,171
Health Care $949,253,589 $422,234,559 $690,834,336 $2,062,322,485 $63,490,792
Human Services $226,570,996 $79,003,573 $162,589,964 $468,164,534 $16,689,400
International $10,742,518 $6,533,464 $7,642,243 $24,918,225 $740,276
Mutual Benefit $2,214,768 $879,112 $1,284,452 $4,378,332 $161,228
Public and Societal Benefit (Other) $206,997,235 $127,122,697 $140,706,160 $474,826,092 $14,766,879
Total Effect $2,756,180,900 $1,367,263,815 $1,993,030,977 $6,116,475,694 $201,247,937
Source: BERC estimtes from IMPLAN regional model.
| 40
Although some nonprofit segments have a lesser employment impact, in some cases this may be
due to two issues related to the study’s methodology:
(1) many small organizations in the arts and other segments may be excluded because they
do not satisfy the $25,000 income minimum, and
(2) many small organizations rely on volunteer labor to operate.
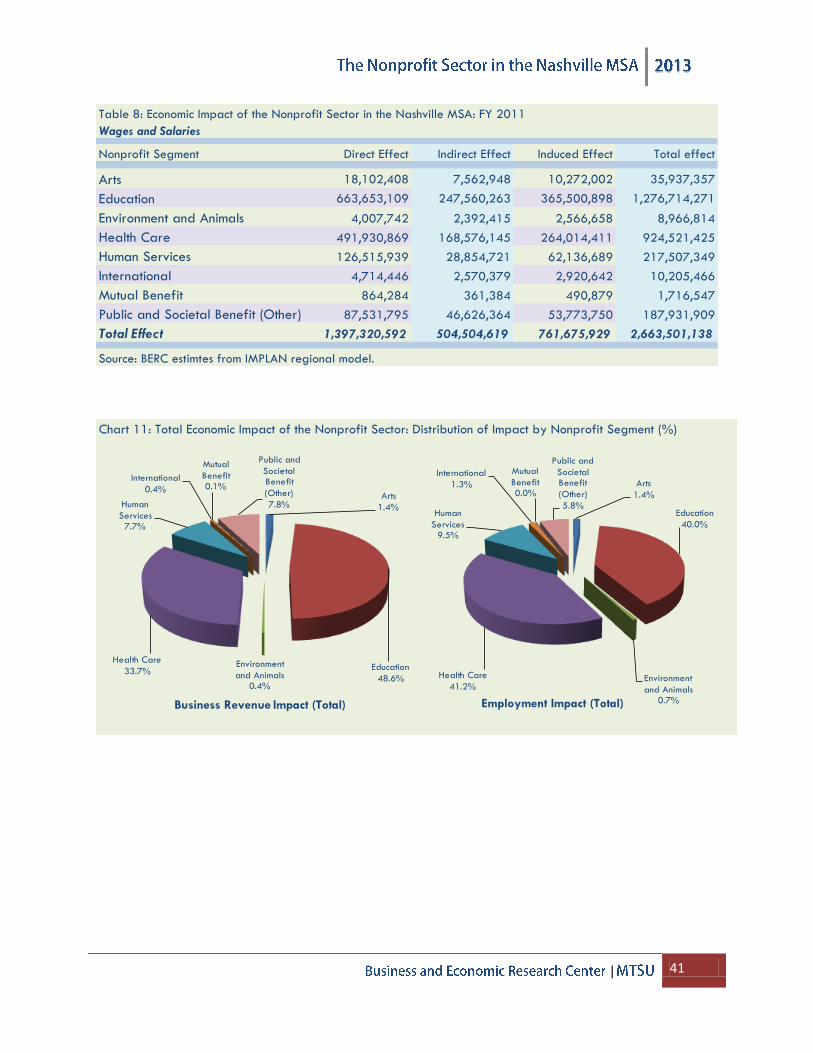
Wages and salaries. How much money do people earn because of the nonprofit sector in the
Nashville MSA? Table 8 presents the extent of the wage and salary impact of the nonprofit sector
on the Nashville MSA economy. In FY 2011, nonprofit sector–related economic activities account
for $2.7 billion in wages and salaries, representing nearly 5 percent of the Nashville MSA’s total
wages and salaries. For every dollar of direct wages and salaries, an additional $0.91 of wages
and salaries was created in the Nashville MSA. Four major segments account for this sizeable
impact on wages and salaries: education with $1.3 billion, health care with $0.93 billion, human
services with $0.22 billion, and public and societal benefit with $0.19 billion.
Table 7: Economic Impact of the Nonprofit Sector in the Nashville MSA: FY 2011
Employment
Nonprofit Segment Direct Effect Indirect Effect Induced Effect Total effect
Arts 617 161 207 985
Education 16,310 5,201 7,352 28,863
Environment and Animals 408 49 52 509
Health Care 21,053 3,327 5,321 29,700
Human Services 4,992 608 1,252 6,852
International 862 53 59 973
Mutual Benefit 19 6 10 35
Public and Societal Benefit (Other) 2,155 942 1,082 4,179
Total Effect 46,415 10,347 15,334 72,095
Source: BERC estimtes from IMPLAN regional model.
| 41
Table 8: Economic Impact of the Nonprofit Sector in the Nashville MSA: FY 2011
Wages and Salaries
Nonprofit Segment Direct Effect Indirect Effect Induced Effect Total effect
Arts 18,102,408 7,562,948 10,272,002 35,937,357
Education 663,653,109 247,560,263 365,500,898 1,276,714,271
Environment and Animals 4,007,742 2,392,415 2,566,658 8,966,814
Health Care 491,930,869 168,576,145 264,014,411 924,521,425
Human Services 126,515,939 28,854,721 62,136,689 217,507,349
International 4,714,446 2,570,379 2,920,642 10,205,466
Mutual Benefit 864,284 361,384 490,879 1,716,547
Public and Societal Benefit (Other) 87,531,795 46,626,364 53,773,750 187,931,909
Total Effect 1,397,320,592 504,504,619 761,675,929 2,663,501,138
Source: BERC estimtes from IMPLAN regional model.
Chart 11: Total Economic Impact of the Nonprofit Sector: Distribution of Impact by Nonprofit Segment (%)
Arts
1.4%
Education
48.6%
Environment
and Animals0.4%
Health Care
33.7%
Human
Services7.7%
International
0.4%
Mutual
Benefit0.1%
Public and
Societal Benefit
(Other)
7.8%
Business Revenue Impact (Total)
Arts
1.4%
Education
40.0%
Environment
and Animals0.7%
Health Care
41.2%
Human
Services9.5%
International
1.3%
Mutual
Benefit0.0%
Public and
Societal Benefit
(Other)
5.8%
Employment Impact (Total)
| 42
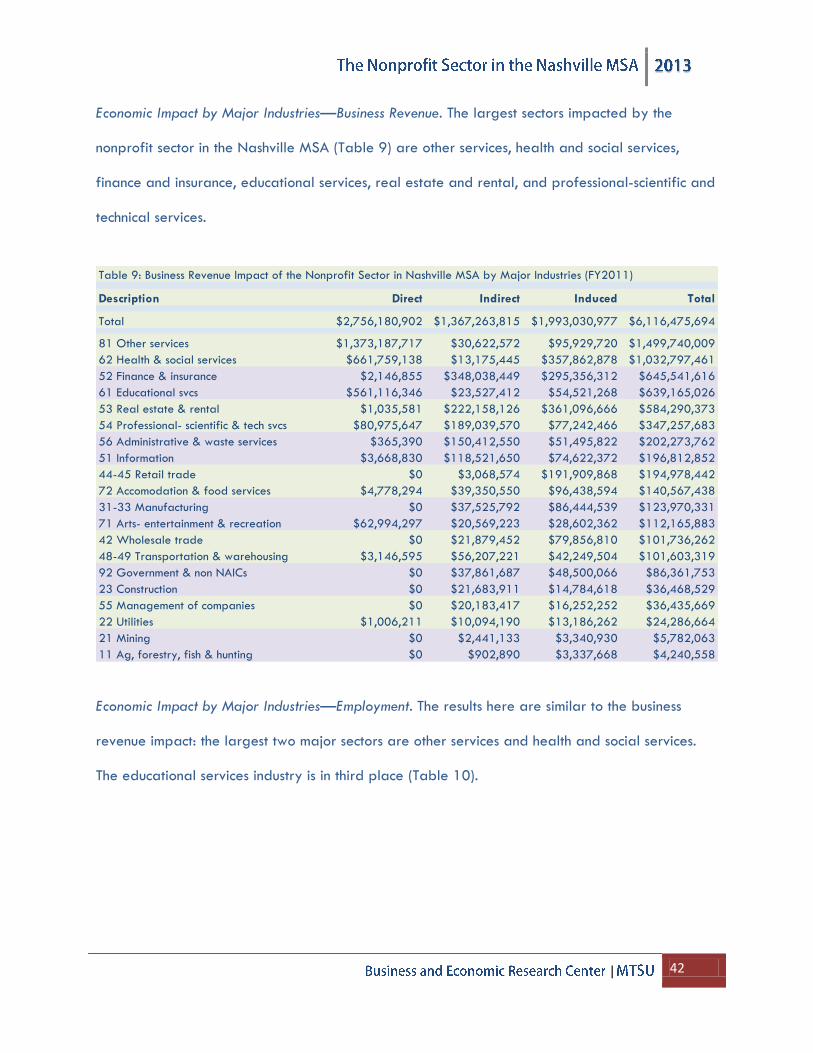
Economic Impact by Major Industries—Business Revenue. The largest sectors impacted by the
nonprofit sector in the Nashville MSA (Table 9) are other services, health and social services,
finance and insurance, educational services, real estate and rental, and professional-scientific and
technical services.
Economic Impact by Major Industries—Employment. The results here are similar to the business
revenue impact: the largest two major sectors are other services and health and social services.
The educational services industry is in third place (Table 10).
Table 9: Business Revenue Impact of the Nonprofit Sector in Nashville MSA by Major Industries (FY2011)
Description Direct Indirect Induced Total
Total $2,756,180,902 $1,367,263,815 $1,993,030,977 $6,116,475,694
81 Other services $1,373,187,717 $30,622,572 $95,929,720 $1,499,740,009
62 Health & social services $661,759,138 $13,175,445 $357,862,878 $1,032,797,461
52 Finance & insurance $2,146,855 $348,038,449 $295,356,312 $645,541,616
61 Educational svcs $561,116,346 $23,527,412 $54,521,268 $639,165,026
53 Real estate & rental $1,035,581 $222,158,126 $361,096,666 $584,290,373
54 Professional- scientific & tech svcs $80,975,647 $189,039,570 $77,242,466 $347,257,683
56 Administrative & waste services $365,390 $150,412,550 $51,495,822 $202,273,762
51 Information $3,668,830 $118,521,650 $74,622,372 $196,812,852
44-45 Retail trade $0 $3,068,574 $191,909,868 $194,978,442
72 Accomodation & food services $4,778,294 $39,350,550 $96,438,594 $140,567,438
31-33 Manufacturing $0 $37,525,792 $86,444,539 $123,970,331
71 Arts- entertainment & recreation $62,994,297 $20,569,223 $28,602,362 $112,165,883
42 Wholesale trade $0 $21,879,452 $79,856,810 $101,736,262
48-49 Transportation & warehousing $3,146,595 $56,207,221 $42,249,504 $101,603,319
92 Government & non NAICs $0 $37,861,687 $48,500,066 $86,361,753
23 Construction $0 $21,683,911 $14,784,618 $36,468,529
55 Management of companies $0 $20,183,417 $16,252,252 $36,435,669
22 Utilities $1,006,211 $10,094,190 $13,186,262 $24,286,664
21 Mining $0 $2,441,133 $3,340,930 $5,782,063
11 Ag, forestry, fish & hunting $0 $902,890 $3,337,668 $4,240,558
| 43
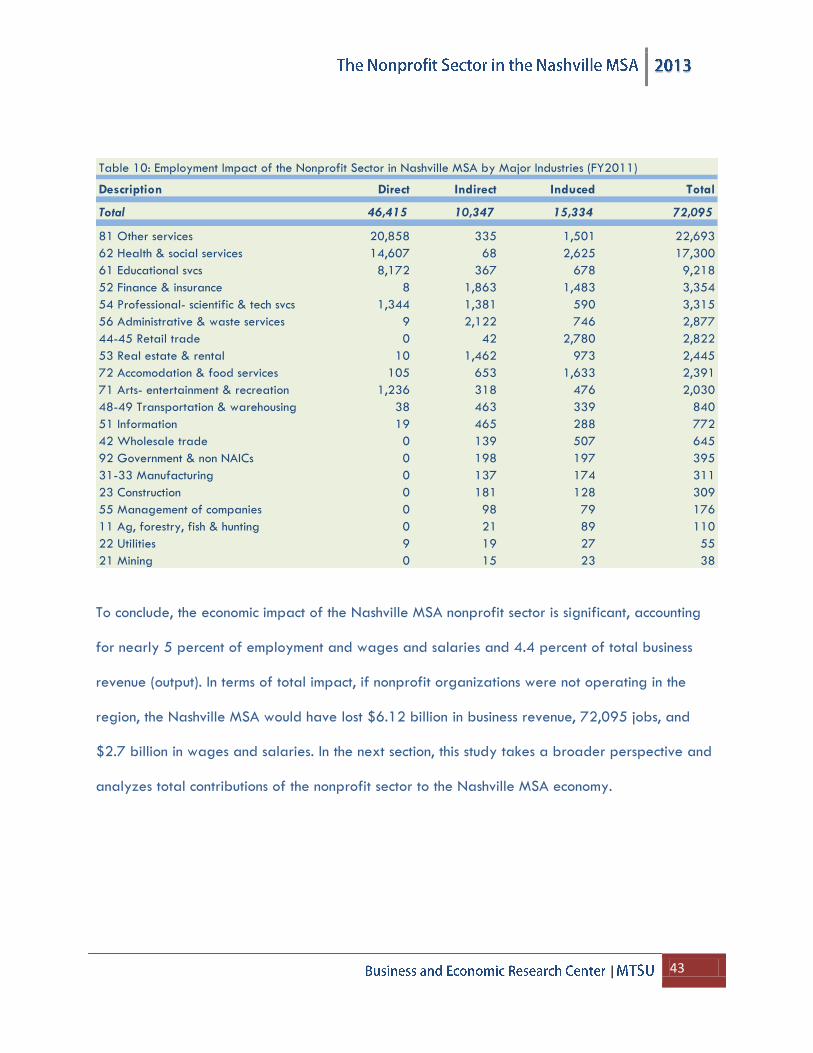
To conclude, the economic impact of the Nashville MSA nonprofit sector is significant, accounting
for nearly 5 percent of employment and wages and salaries and 4.4 percent of total business
revenue (output). In terms of total impact, if nonprofit organizations were not operating in the
region, the Nashville MSA would have lost $6.12 billion in business revenue, 72,095 jobs, and
$2.7 billion in wages and salaries. In the next section, this study takes a broader perspective and
analyzes total contributions of the nonprofit sector to the Nashville MSA economy.
Table 10: Employment Impact of the Nonprofit Sector in Nashville MSA by Major Industries (FY2011)
Description Direct Indirect Induced Total
Total 46,415 10,347 15,334 72,095
81 Other services 20,858 335 1,501 22,693
62 Health & social services 14,607 68 2,625 17,300
61 Educational svcs 8,172 367 678 9,218
52 Finance & insurance 8 1,863 1,483 3,354
54 Professional- scientific & tech svcs 1,344 1,381 590 3,315
56 Administrative & waste services 9 2,122 746 2,877
44-45 Retail trade 0 42 2,780 2,822
53 Real estate & rental 10 1,462 973 2,445
72 Accomodation & food services 105 653 1,633 2,391
71 Arts- entertainment & recreation 1,236 318 476 2,030
48-49 Transportation & warehousing 38 463 339 840
51 Information 19 465 288 772
42 Wholesale trade 0 139 507 645
92 Government & non NAICs 0 198 197 395
31-33 Manufacturing 0 137 174 311
23 Construction 0 181 128 309
55 Management of companies 0 98 79 176
11 Ag, forestry, fish & hunting 0 21 89 110
22 Utilities 9 19 27 55
21 Mining 0 15 23 38
| 44
IV.2. Economic Contributions—Total Spending
This section answers the following question: What is the true size of the nonprofit sector in the
Nashville MSA? To answer this question, BERC estimated total expenditure of the nonprofit sector
by nonprofit segment, major industry, and IMPLAN codes. BERC then counterfactually removed the
nonprofit sector from the model to estimate indirect, induced, and state and local tax impacts. We
would like to caution the reader about the conceptual difference between an economic impact
and an economic contribution. In the latter case, some portions of activities, goods, and services
might still be provided by other agencies or individuals without much loss to the local economy if
nonprofit organizations providing those goods and services ceased to exist. In reporting the
contributions of the nonprofit sector to the local economy, we follow a similar format to the one
outline under the economic impact section.
Business revenue. What is the total contribution of the nonprofit sector to the Nashville MSA
economy? How much money do these nonprofits spend in the local economy? How does total
nonprofit revenue (direct + indirect + induced) compare with total business revenue in the
Nashville MSA? Which nonprofit sector contributes the most to the local economy? How much state
and local tax revenue is generated by the operations of the Nashville MSA’s nonprofit sector?
These are the major questions this section addresses.
Economic Contributions by Nonprofit Segment
Business revenue. Table 11 provides a detailed view of the Nashville MSA’s nonprofit sector’s total
contribution to the local economy. A total of $9.3 billion (in 2011 $) in direct spending generates
additional revenue of $11.3 billion in the local economy. This means that for every dollar of
money spent by the nonprofit sector, an additional $1.22 is created through the ripple effect.
Total contribution of the nonprofit sector to the local economy is $20.53 billion, representing 14.7
| 45
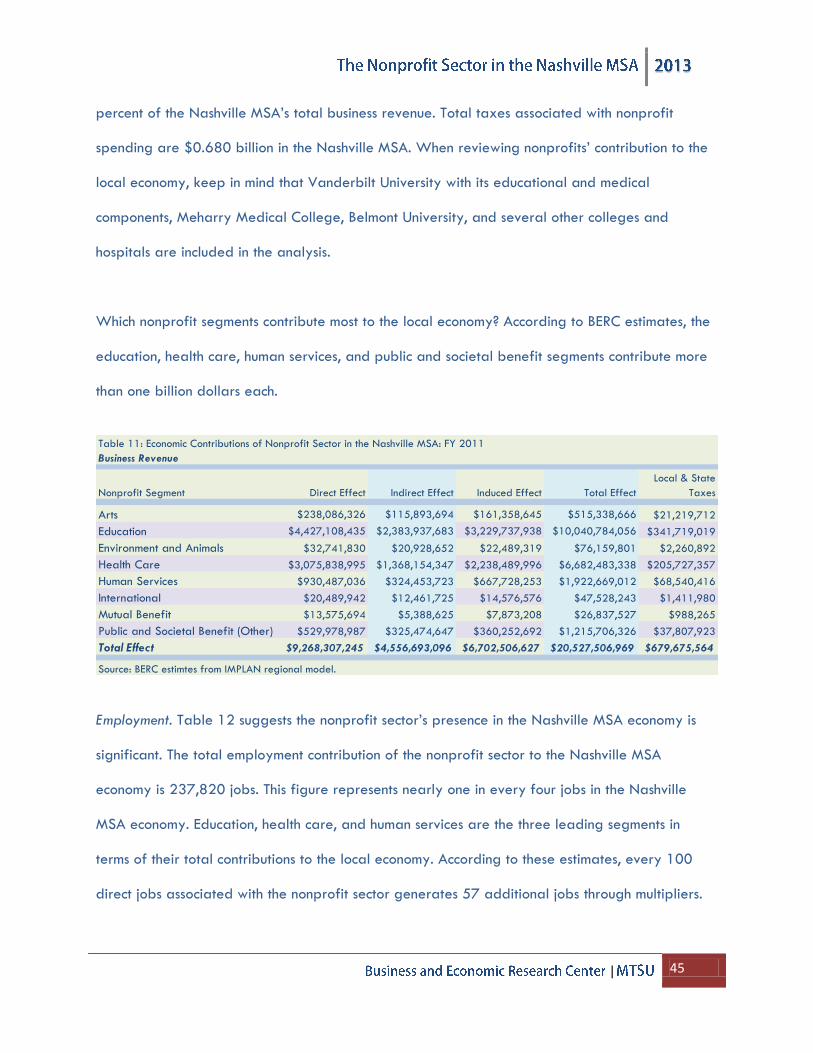
percent of the Nashville MSA’s total business revenue. Total taxes associated with nonprofit
spending are $0.680 billion in the Nashville MSA. When reviewing nonprofits’ contribution to the
local economy, keep in mind that Vanderbilt University with its educational and medical
components, Meharry Medical College, Belmont University, and several other colleges and
hospitals are included in the analysis.
Which nonprofit segments contribute most to the local economy? According to BERC estimates, the
education, health care, human services, and public and societal benefit segments contribute more
than one billion dollars each.
Employment. Table 12 suggests the nonprofit sector’s presence in the Nashville MSA economy is
significant. The total employment contribution of the nonprofit sector to the Nashville MSA
economy is 237,820 jobs. This figure represents nearly one in every four jobs in the Nashville
MSA economy. Education, health care, and human services are the three leading segments in
terms of their total contributions to the local economy. According to these estimates, every 100
direct jobs associated with the nonprofit sector generates 57 additional jobs through multipliers.
Table 11: Economic Contributions of Nonprofit Sector in the Nashville MSA: FY 2011
Business Revenue
Nonprofit Segment Direct Effect Indirect Effect Induced Effect Total Effect
Local & State
Taxes
Arts $238,086,326 $115,893,694 $161,358,645 $515,338,666 $21,219,712
Education $4,427,108,435 $2,383,937,683 $3,229,737,938 $10,040,784,056 $341,719,019
Environment and Animals $32,741,830 $20,928,652 $22,489,319 $76,159,801 $2,260,892
Health Care $3,075,838,995 $1,368,154,347 $2,238,489,996 $6,682,483,338 $205,727,357
Human Services $930,487,036 $324,453,723 $667,728,253 $1,922,669,012 $68,540,416
International $20,489,942 $12,461,725 $14,576,576 $47,528,243 $1,411,980
Mutual Benefit $13,575,694 $5,388,625 $7,873,208 $26,837,527 $988,265
Public and Societal Benefit (Other) $529,978,987 $325,474,647 $360,252,692 $1,215,706,326 $37,807,923
Total Effect $9,268,307,245 $4,556,693,096 $6,702,506,627 $20,527,506,969 $679,675,564
Source: BERC estimtes from IMPLAN regional model.
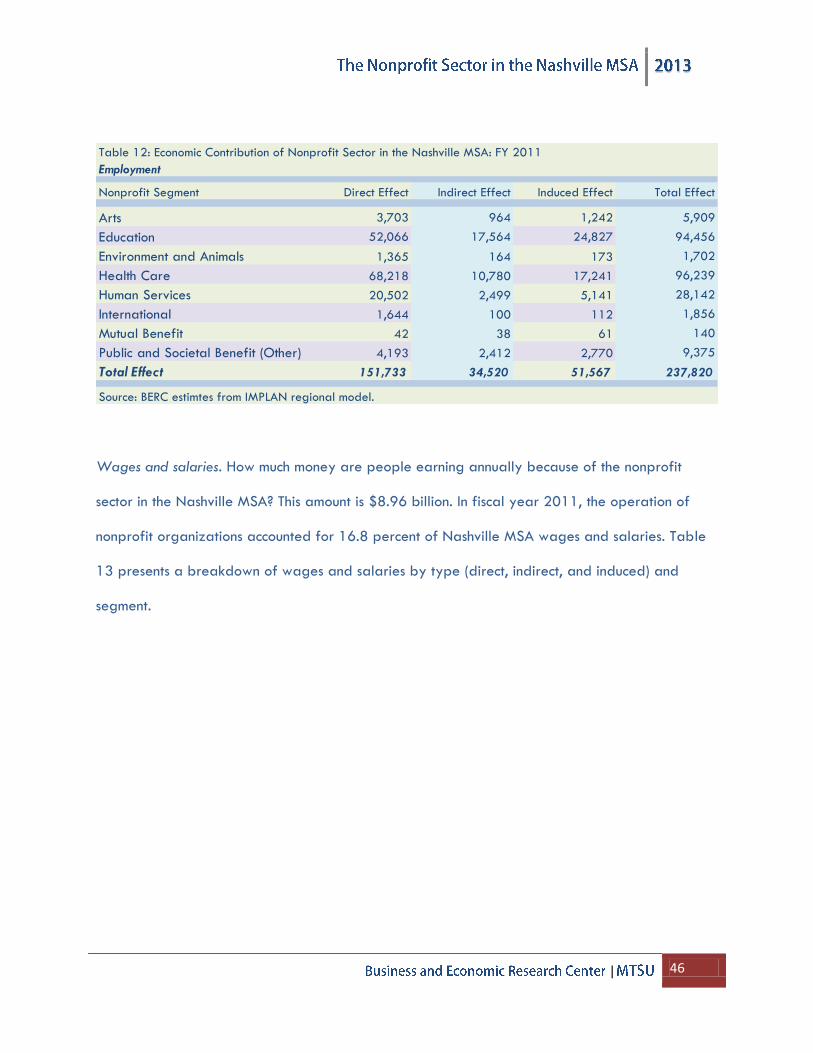
| 46
Wages and salaries. How much money are people earning annually because of the nonprofit
sector in the Nashville MSA? This amount is $8.96 billion. In fiscal year 2011, the operation of
nonprofit organizations accounted for 16.8 percent of Nashville MSA wages and salaries. Table
13 presents a breakdown of wages and salaries by type (direct, indirect, and induced) and
segment.
Table 12: Economic Contribution of Nonprofit Sector in the Nashville MSA: FY 2011
Employment
Nonprofit Segment Direct Effect Indirect Effect Induced Effect Total Effect
Arts 3,703 964 1,242 5,909
Education 52,066 17,564 24,827 94,456
Environment and Animals 1,365 164 173 1,702
Health Care 68,218 10,780 17,241 96,239
Human Services 20,502 2,499 5,141 28,142
International 1,644 100 112 1,856
Mutual Benefit 42 38 61 140
Public and Societal Benefit (Other) 4,193 2,412 2,770 9,375
Total Effect 151,733 34,520 51,567 237,820
Source: BERC estimtes from IMPLAN regional model.
| 47
For every dollar of direct wages and salaries paid by the nonprofit sector, an additional $0.90 is
generated in the study area through multipliers. The largest nonprofit segments are education,
health care, human services, and public and societal benefit. Chart 12 presents the percent
distribution of business revenue and employment contributions of the nonprofit sector.
Table 13: Economic Contribution of Nonprofit Sector in the Nashville MSA: FY 2011
Wages and Salaries
Nonprofit Segment Direct Effect Indirect Effect Induced Effect Total Effect
Arts 108,702,143 45,375,293 61,666,255 215,743,692
Education 2,241,187,260 836,022,541 1,234,313,317 4,311,523,117
Environment and Animals 13,420,413 8,011,296 8,594,768 30,026,477
Health Care 1,593,989,357 546,232,378 855,478,045 2,995,699,779
Human Services 519,578,586 118,501,243 255,184,406 893,264,234
International 8,992,186 4,902,660 5,570,742 19,465,588
Mutual Benefit 5,297,737 2,215,149 3,008,901 10,521,787
Public and Societal Benefit (Other) 224,109,350 119,378,359 137,677,968 481,165,676
Total Effect 4,715,277,032 1,680,638,919 2,561,494,402 8,957,410,350
Source: BERC estimtes from IMPLAN regional model.
Chart 12: Total Economic Contributions of Nonprofit Sector: Distribution of Contributions by Nonprofit Segment (%)
Arts
2.5%
Education
48.9%
Environment
and Animals0.4%
Health Care
32.6%
Human
Services9.4%
International
0.2%
Mutual
Benefit0.1%
Public and
Societal Benefit
(Other)
5.9%
Business Revenue Contributions (Total)
Arts
2.5%
Education
39.7%
Environment
and Animals0.7%
Health Care
40.5%
Human
Services11.8%
International
0.8%
Mutual
Benefit0.1%
Public and
Societal Benefit
(Other)
3.9%
Employment Contribution (Total)
| 48
Economic Contribution by Major Industry
Business revenue. Table 14 presents the contribution of the nonprofit sector by major industry. A
caveat is in order regarding comparison of this table with the nonprofit segment table: the
nonprofit education segment is different from the education sector under the NAICS classification
as included in Table 14. One organization may be designated under the nonprofit education
segment, but it may be operating under the other services sector of the NAICS industry
classification. Other services, health and social services, and education are the largest industries
associated with the nonprofit sector in the Nashville MSA.
Employment. Table 15 provides employment contributions of the nonprofit sector to the Nashville
MSA economy. For this segment, BERC used two data streams: data derived from the regional
IMPLAN model and BERC estimates based on the nonprofit survey.
Table 14: Business Revenue Contribution of Nonprofit Sector in the Nashville MSA by Major Industries (FY2011)
Description Direct Indirect Induced Total
Total $9,579,922,286 $4,658,156,887 $6,819,704,637 $21,057,783,810
81 Other services $4,603,575,268 $105,106,440 $332,142,783 $5,040,824,492
62 Health & social services $2,333,509,941 $43,945,933 $1,245,026,529 $3,622,482,403
61 Educational svcs $1,978,802,892 $80,672,128 $190,627,593 $2,250,102,612
52 Finance & insurance $9,952,708 $1,144,491,225 $998,997,784 $2,153,441,718
53 Real estate & rental $2,738,942 $769,827,234 $1,215,622,468 $1,988,188,644
54 Professional- scientific & tech svcs $275,064,434 $654,812,309 $270,927,565 $1,200,804,308
56 Administrative & waste services $1,536,702 $516,388,747 $178,233,037 $696,158,486
51 Information $22,965,528 $407,014,857 $257,082,876 $687,063,262
44-45 Retail trade $0 $10,279,708 $650,795,933 $661,075,641
71 Arts- entertainment & recreation $320,545,926 $77,555,256 $99,573,737 $497,674,920
72 Accomodation & food services $20,215,170 $133,691,354 $331,888,403 $485,794,927
31-33 Manufacturing $0 $126,906,414 $294,263,748 $421,170,162
48-49 Transportation & warehousing $8,428,984 $193,650,256 $146,759,375 $348,838,616
42 Wholesale trade $0 $72,033,989 $264,272,273 $336,306,262
92 Government & non NAICs $0 $129,516,375 $166,943,318 $296,459,693
23 Construction $0 $75,454,123 $51,855,312 $127,309,435
55 Management of companies $0 $70,518,318 $56,567,331 $127,085,648
22 Utilities $2,585,790 $34,724,401 $45,130,942 $82,441,133
21 Mining $0 $8,517,976 $11,904,890 $20,422,866
11 Ag, forestry, fish & hunting $0 $3,049,843 $11,088,740 $14,138,583
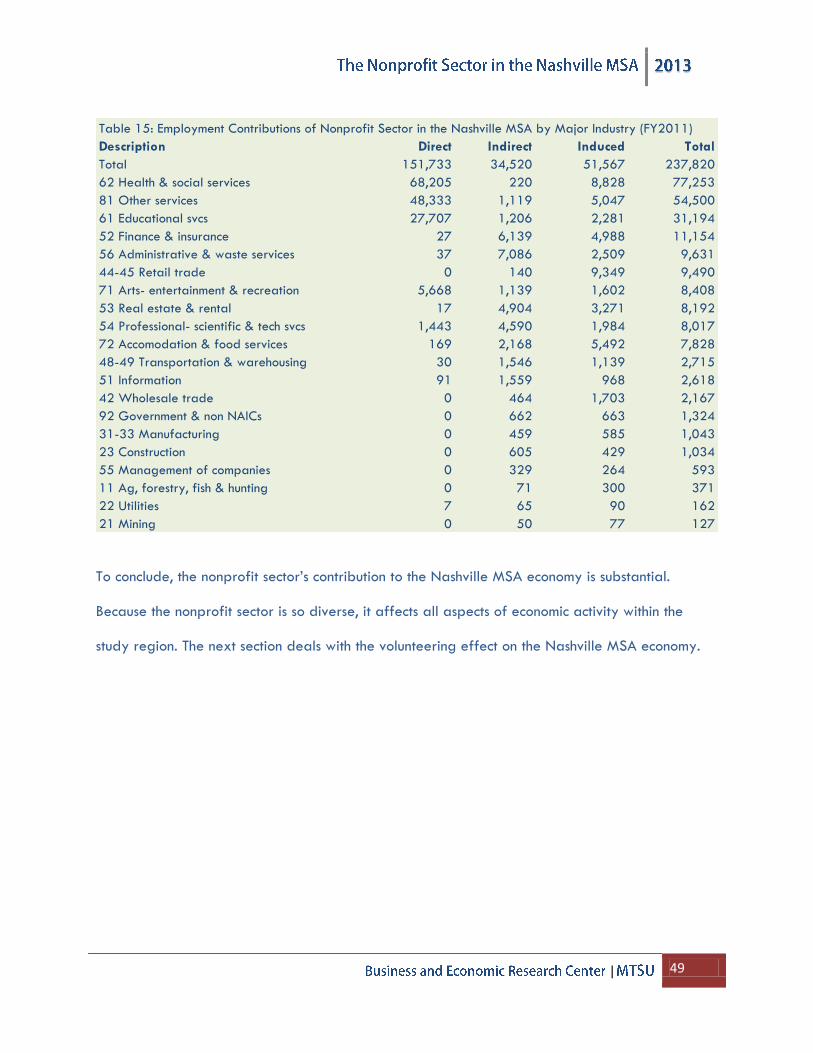
| 49
To conclude, the nonprofit sector’s contribution to the Nashville MSA economy is substantial.
Because the nonprofit sector is so diverse, it affects all aspects of economic activity within the
study region. The next section deals with the volunteering effect on the Nashville MSA economy.
Table 15: Employment Contributions of Nonprofit Sector in the Nashville MSA by Major Industry (FY2011)
Description Direct Indirect Induced Total
Total 151,733 34,520 51,567 237,820
62 Health & social services 68,205 220 8,828 77,253
81 Other services 48,333 1,119 5,047 54,500
61 Educational svcs 27,707 1,206 2,281 31,194
52 Finance & insurance 27 6,139 4,988 11,154
56 Administrative & waste services 37 7,086 2,509 9,631
44-45 Retail trade 0 140 9,349 9,490
71 Arts- entertainment & recreation 5,668 1,139 1,602 8,408
53 Real estate & rental 17 4,904 3,271 8,192
54 Professional- scientific & tech svcs 1,443 4,590 1,984 8,017
72 Accomodation & food services 169 2,168 5,492 7,828
48-49 Transportation & warehousing 30 1,546 1,139 2,715
51 Information 91 1,559 968 2,618
42 Wholesale trade 0 464 1,703 2,167
92 Government & non NAICs 0 662 663 1,324
31-33 Manufacturing 0 459 585 1,043
23 Construction 0 605 429 1,034
55 Management of companies 0 329 264 593
11 Ag, forestry, fish & hunting 0 71 300 371
22 Utilities 7 65 90 162
21 Mining 0 50 77 127
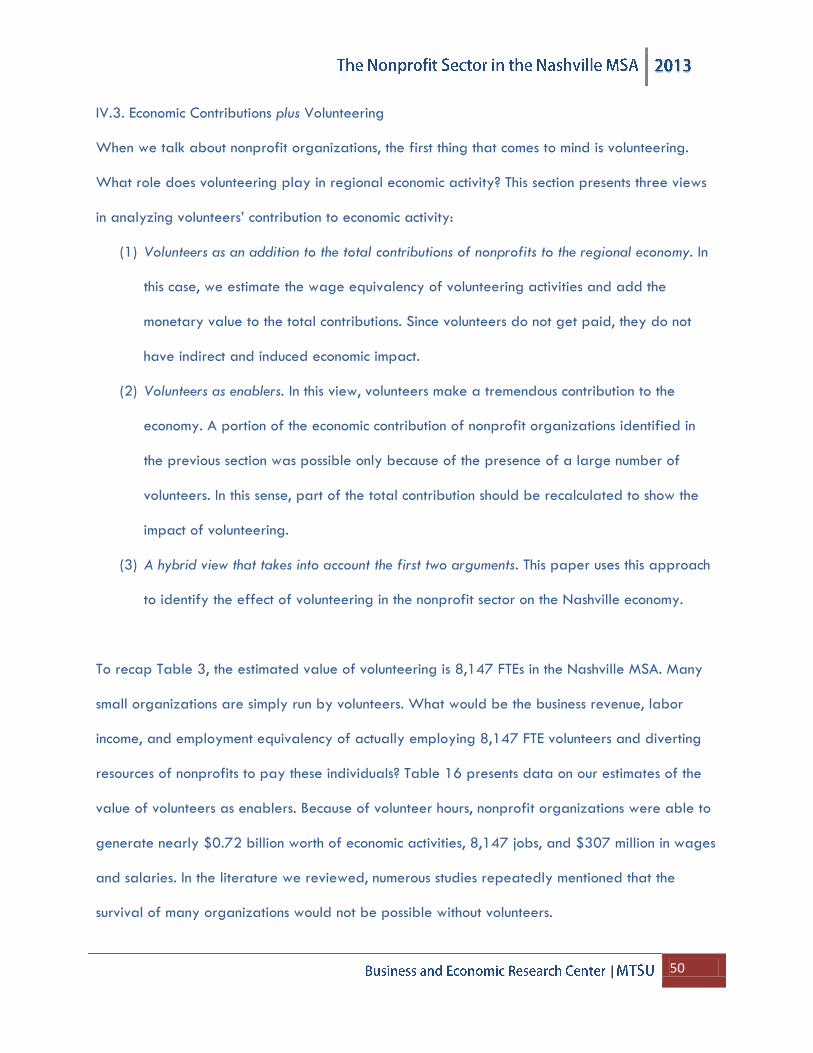
| 50
IV.3. Economic Contributions plus Volunteering
When we talk about nonprofit organizations, the first thing that comes to mind is volunteering.
What role does volunteering play in regional economic activity? This section presents three views
in analyzing volunteers’ contribution to economic activity:
(1) Volunteers as an addition to the total contributions of nonprofits to the regional economy. In
this case, we estimate the wage equivalency of volunteering activities and add the
monetary value to the total contributions. Since volunteers do not get paid, they do not
have indirect and induced economic impact.
(2) Volunteers as enablers. In this view, volunteers make a tremendous contribution to the
economy. A portion of the economic contribution of nonprofit organizations identified in
the previous section was possible only because of the presence of a large number of
volunteers. In this sense, part of the total contribution should be recalculated to show the
impact of volunteering.
(3) A hybrid view that takes into account the first two arguments. This paper uses this approach
to identify the effect of volunteering in the nonprofit sector on the Nashville economy.
To recap Table 3, the estimated value of volunteering is 8,147 FTEs in the Nashville MSA. Many
small organizations are simply run by volunteers. What would be the business revenue, labor
income, and employment equivalency of actually employing 8,147 FTE volunteers and diverting
resources of nonprofits to pay these individuals? Table 16 presents data on our estimates of the
value of volunteers as enablers. Because of volunteer hours, nonprofit organizations were able to
generate nearly $0.72 billion worth of economic activities, 8,147 jobs, and $307 million in wages
and salaries. In the literature we reviewed, numerous studies repeatedly mentioned that the
survival of many organizations would not be possible without volunteers.
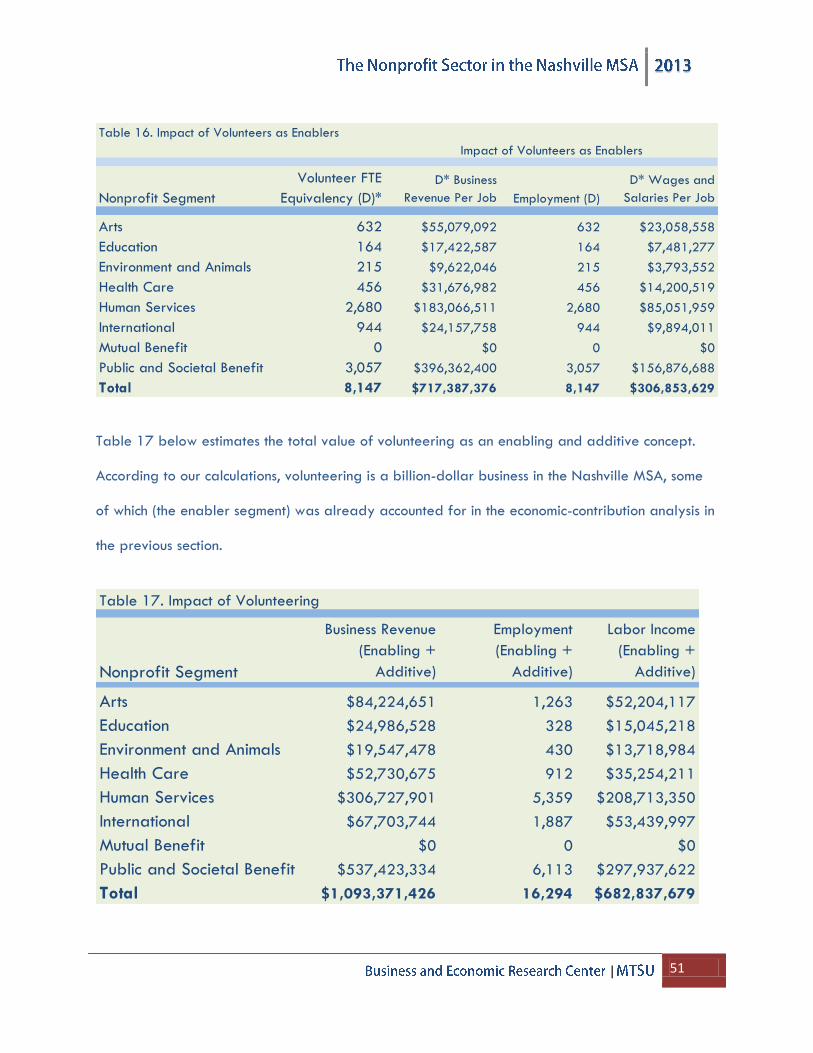
| 51
Table 17 below estimates the total value of volunteering as an enabling and additive concept.
According to our calculations, volunteering is a billion-dollar business in the Nashville MSA, some
of which (the enabler segment) was already accounted for in the economic-contribution analysis in
the previous section.
Table 16. Impact of Volunteers as Enablers
Nonprofit Segment
Volunteer FTE
Equivalency (D)*
D* Business
Revenue Per Job Employment (D)
D* Wages and
Salaries Per Job
Arts 632 $55,079,092 632 $23,058,558
Education 164 $17,422,587 164 $7,481,277
Environment and Animals 215 $9,622,046 215 $3,793,552
Health Care 456 $31,676,982 456 $14,200,519
Human Services 2,680 $183,066,511 2,680 $85,051,959
International 944 $24,157,758 944 $9,894,011
Mutual Benefit 0 $0 0 $0
Public and Societal Benefit 3,057 $396,362,400 3,057 $156,876,688
Total 8,147 $717,387,376 8,147 $306,853,629
Impact of Volunteers as Enablers
Table 17. Impact of Volunteering
Nonprofit Segment
Business Revenue
(Enabling +
Additive)
Employment
(Enabling +
Additive)
Labor Income
(Enabling +
Additive)
Arts $84,224,651 1,263 $52,204,117
Education $24,986,528 328 $15,045,218
Environment and Animals $19,547,478 430 $13,718,984
Health Care $52,730,675 912 $35,254,211
Human Services $306,727,901 5,359 $208,713,350
International $67,703,744 1,887 $53,439,997
Mutual Benefit $0 0 $0
Public and Societal Benefit $537,423,334 6,113 $297,937,622
Total $1,093,371,426 16,294 $682,837,679
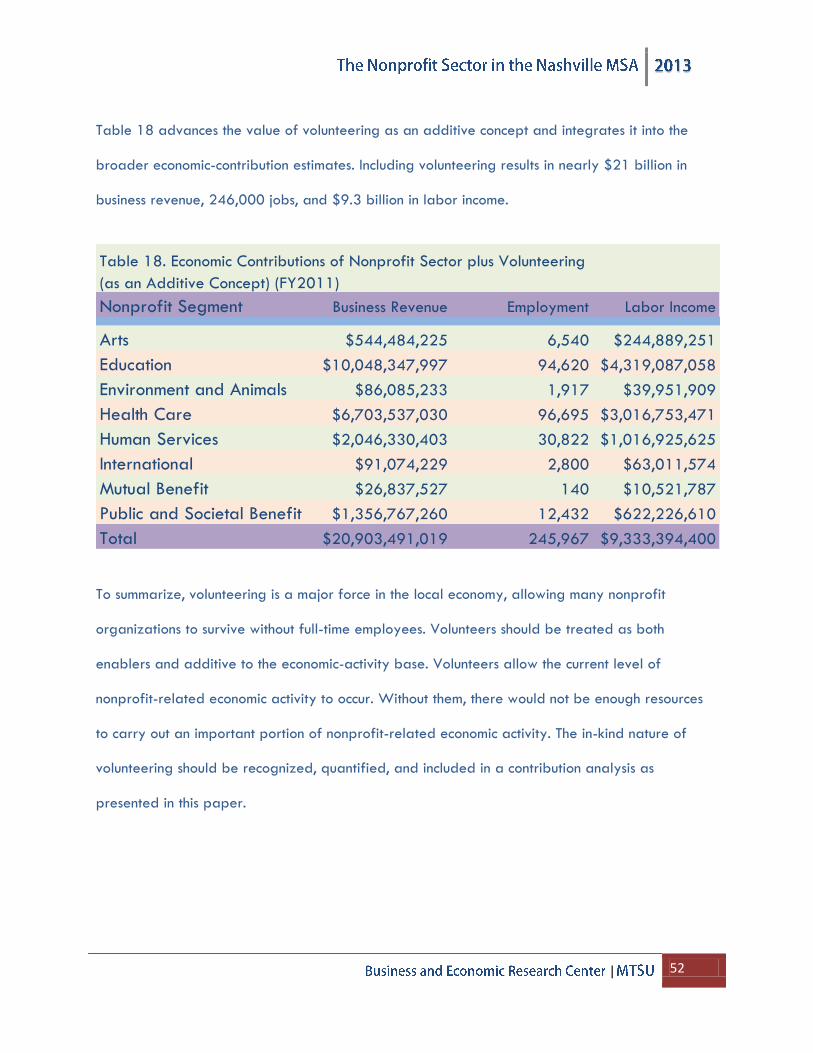
| 52
Table 18 advances the value of volunteering as an additive concept and integrates it into the
broader economic-contribution estimates. Including volunteering results in nearly $21 billion in
business revenue, 246,000 jobs, and $9.3 billion in labor income.
To summarize, volunteering is a major force in the local economy, allowing many nonprofit
organizations to survive without full-time employees. Volunteers should be treated as both
enablers and additive to the economic-activity base. Volunteers allow the current level of
nonprofit-related economic activity to occur. Without them, there would not be enough resources
to carry out an important portion of nonprofit-related economic activity. The in-kind nature of
volunteering should be recognized, quantified, and included in a contribution analysis as
presented in this paper.
Nonprofit Segment Business Revenue Employment Labor Income
Arts $544,484,225 6,540 $244,889,251
Education $10,048,347,997 94,620 $4,319,087,058
Environment and Animals $86,085,233 1,917 $39,951,909
Health Care $6,703,537,030 96,695 $3,016,753,471
Human Services $2,046,330,403 30,822 $1,016,925,625
International $91,074,229 2,800 $63,011,574
Mutual Benefit $26,837,527 140 $10,521,787
Public and Societal Benefit $1,356,767,260 12,432 $622,226,610
Total $20,903,491,019 245,967 $9,333,394,400
Table 18. Economic Contributions of Nonprofit Sector plus Volunteering
(as an Additive Concept) (FY2011)
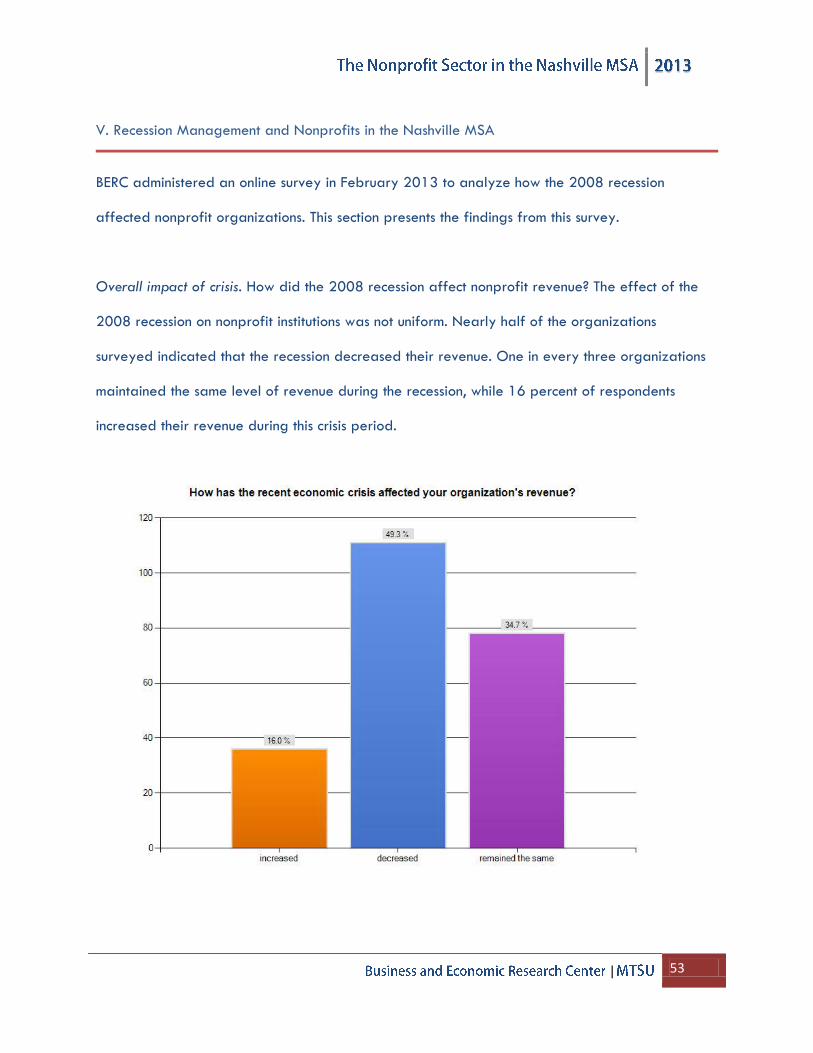
| 53
V. Recession Management and Nonprofits in the Nashville MSA
BERC administered an online survey in February 2013 to analyze how the 2008 recession
affected nonprofit organizations. This section presents the findings from this survey.
Overall impact of crisis. How did the 2008 recession affect nonprofit revenue? The effect of the
2008 recession on nonprofit institutions was not uniform. Nearly half of the organizations
surveyed indicated that the recession decreased their revenue. One in every three organizations
maintained the same level of revenue during the recession, while 16 percent of respondents
increased their revenue during this crisis period.
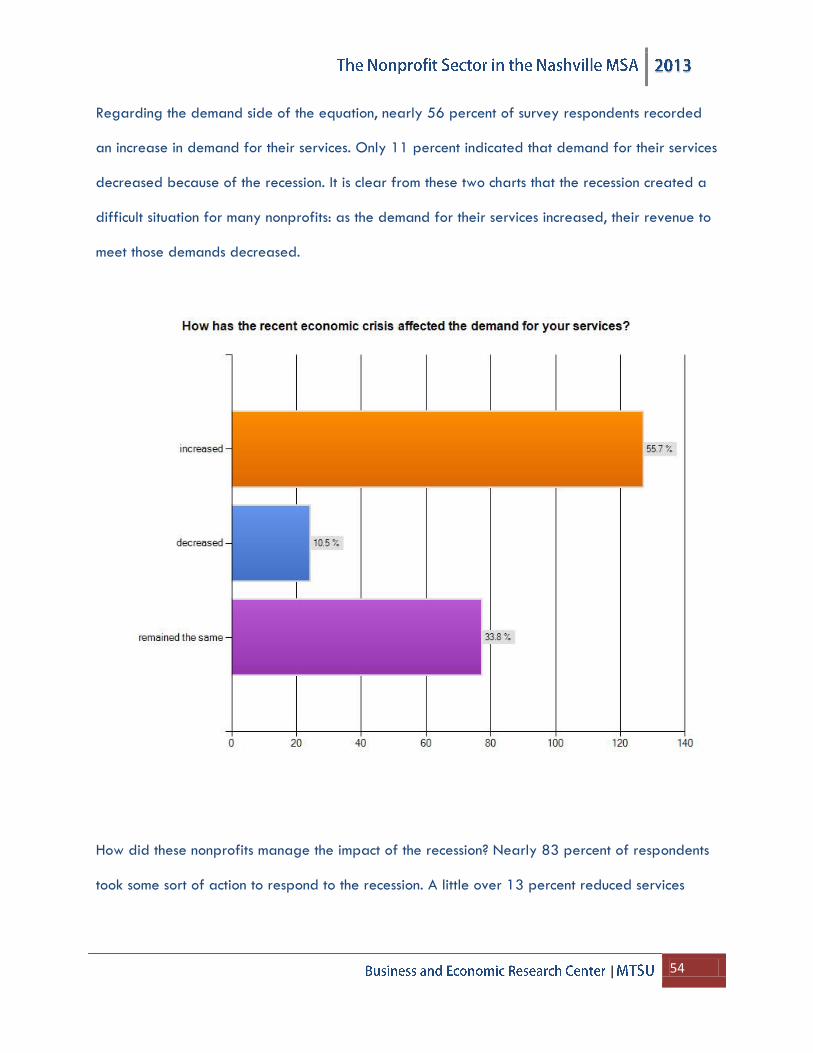
| 54
Regarding the demand side of the equation, nearly 56 percent of survey respondents recorded
an increase in demand for their services. Only 11 percent indicated that demand for their services
decreased because of the recession. It is clear from these two charts that the recession created a
difficult situation for many nonprofits: as the demand for their services increased, their revenue to
meet those demands decreased.
How did these nonprofits manage the impact of the recession? Nearly 83 percent of respondents
took some sort of action to respond to the recession. A little over 13 percent reduced services
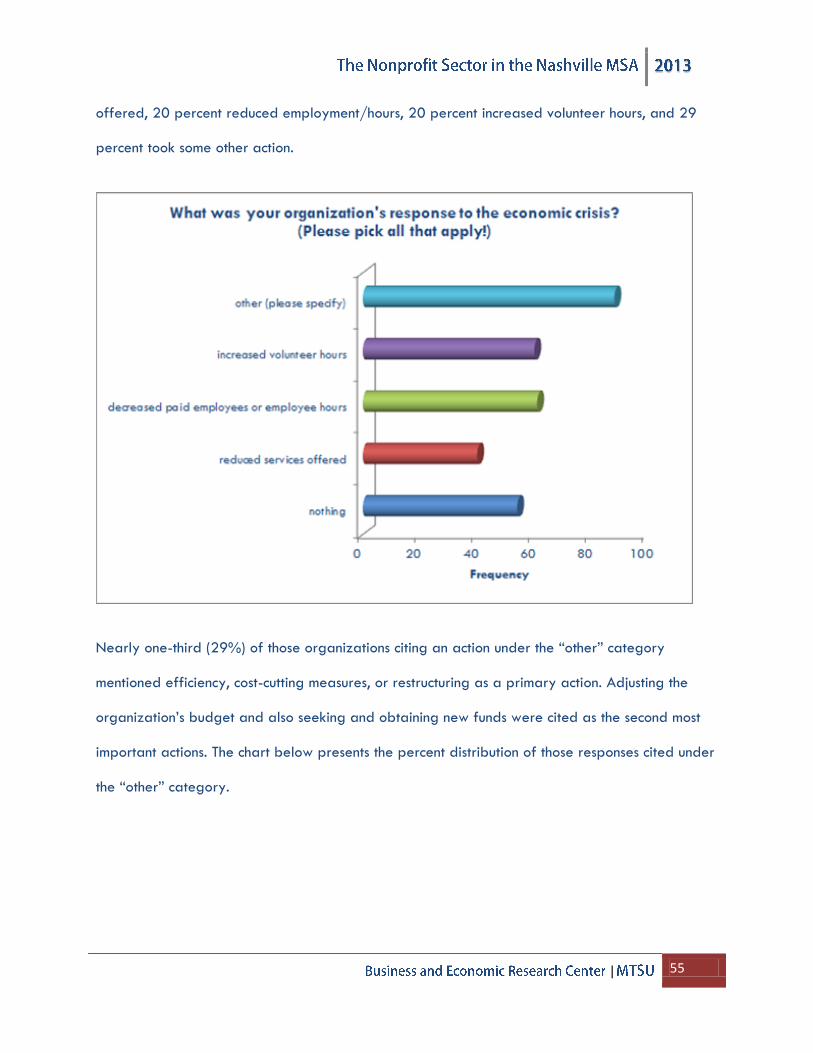
| 55
offered, 20 percent reduced employment/hours, 20 percent increased volunteer hours, and 29
percent took some other action.
Nearly one-third (29%) of those organizations citing an action under the “other” category
mentioned efficiency, cost-cutting measures, or restructuring as a primary action. Adjusting the
organization’s budget and also seeking and obtaining new funds were cited as the second most
important actions. The chart below presents the percent distribution of those responses cited under
the “other” category.
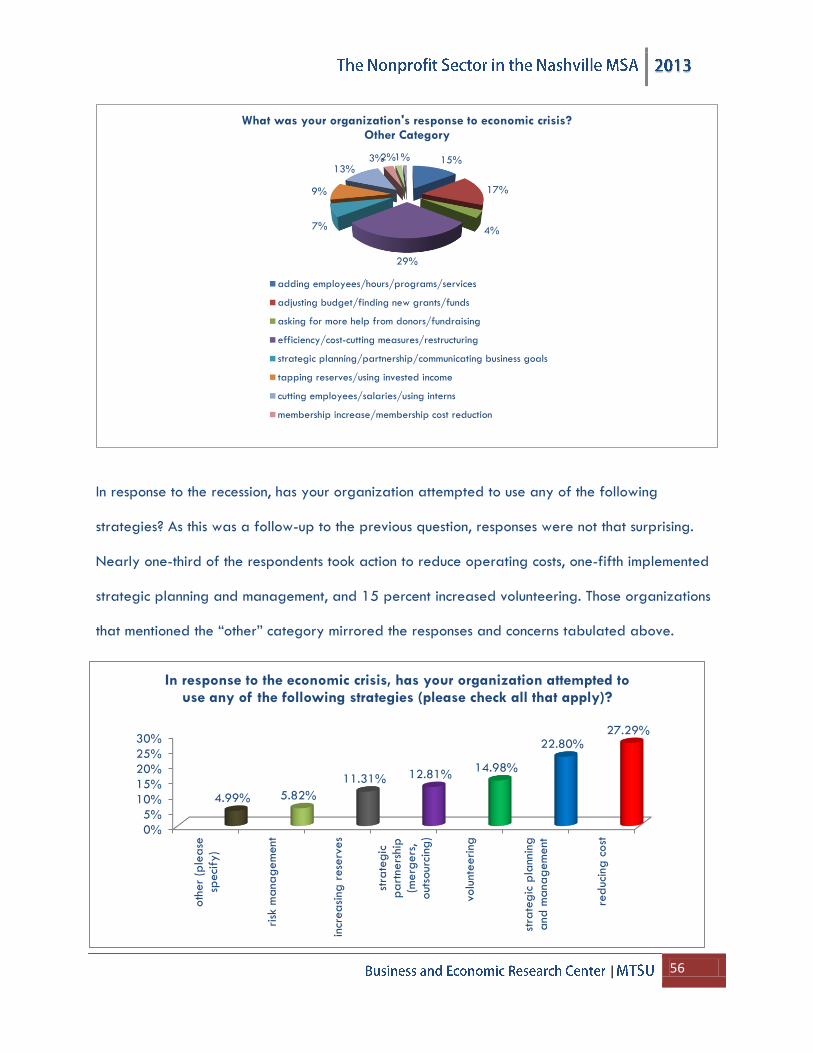
| 56
In response to the recession, has your organization attempted to use any of the following
strategies? As this was a follow-up to the previous question, responses were not that surprising.
Nearly one-third of the respondents took action to reduce operating costs, one-fifth implemented
strategic planning and management, and 15 percent increased volunteering. Those organizations
that mentioned the “other” category mirrored the responses and concerns tabulated above.
15%
17%
4%
29%
7%
9%
13%3%2%1%
What was your organization's response to economic crisis? Other Category
adding employees/hours/programs/services
adjusting budget/finding new grants/funds
asking for more help from donors/fundraising
efficiency/cost-cutting measures/restructuring
strategic planning/partnership/communicating business goals
tapping reserves/using invested income
cutting employees/salaries/using interns
membership increase/membership cost reduction
0%
5%
10%
15%
20%
25%
30%
oth
er
(ple
ase
speci
fy)
risk
mana
gem
ent
incr
easi
ng r
ese
rves
stra
tegic
pa
rtners
hip
(merg
ers
,out
sourc
ing)
volu
nteeri
ng
stra
tegic
pla
nnin
gand m
anag
em
ent
red
uci
ng
cost
4.99% 5.82%
11.31% 12.81%14.98%
22.80%27.29%
In response to the economic crisis, has your organization attempted to use any of the following strategies (please check all that apply)?
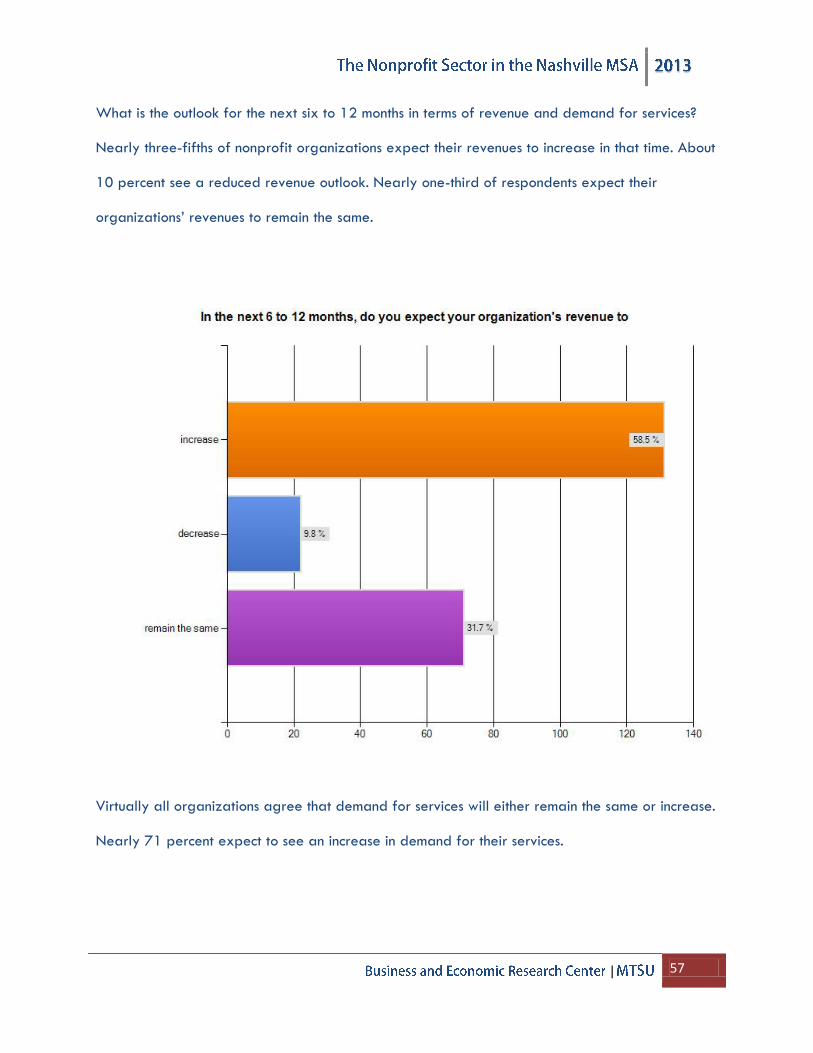
| 57
What is the outlook for the next six to 12 months in terms of revenue and demand for services?
Nearly three-fifths of nonprofit organizations expect their revenues to increase in that time. About
10 percent see a reduced revenue outlook. Nearly one-third of respondents expect their
organizations’ revenues to remain the same.
Virtually all organizations agree that demand for services will either remain the same or increase.
Nearly 71 percent expect to see an increase in demand for their services.
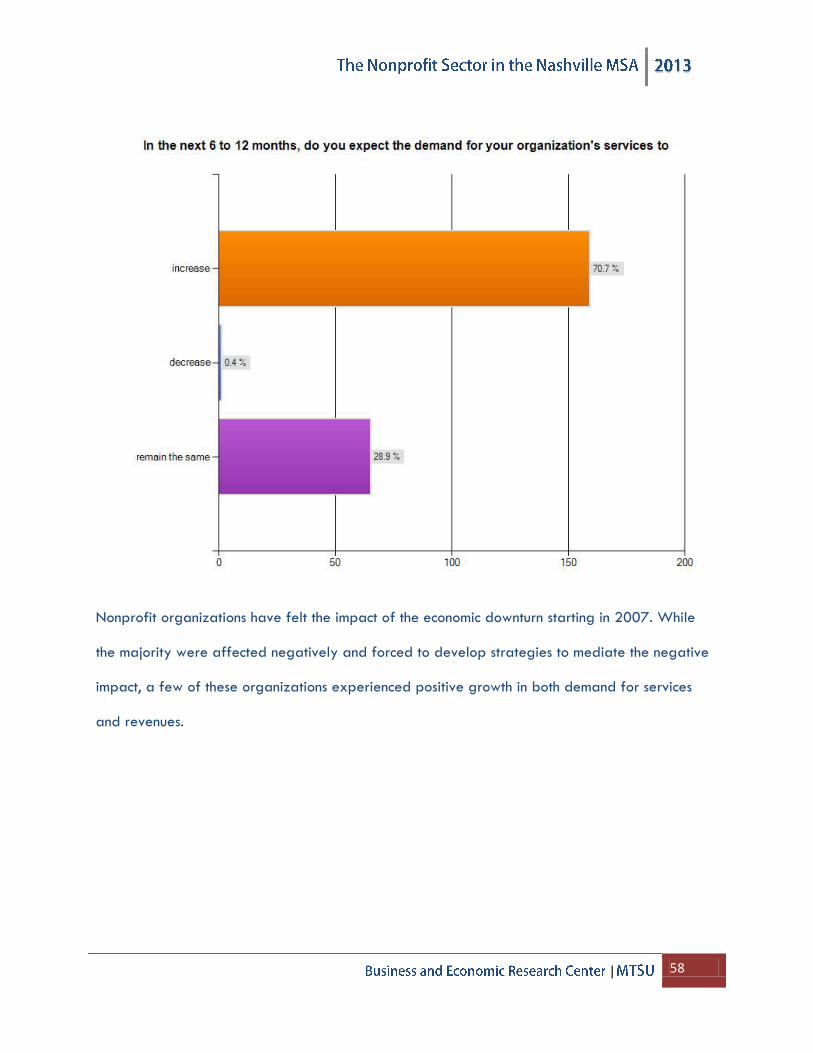
| 58
Nonprofit organizations have felt the impact of the economic downturn starting in 2007. While
the majority were affected negatively and forced to develop strategies to mediate the negative
impact, a few of these organizations experienced positive growth in both demand for services
and revenues.
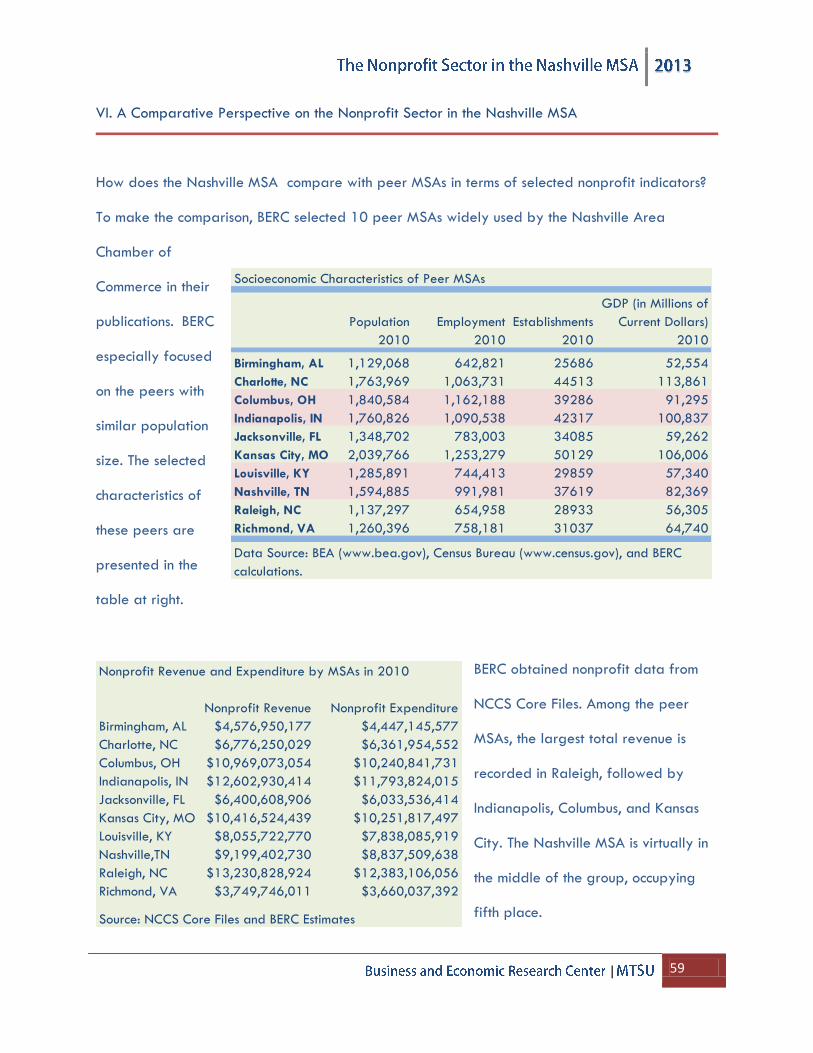
| 59
VI. A Comparative Perspective on the Nonprofit Sector in the Nashville MSA
How does the Nashville MSA compare with peer MSAs in terms of selected nonprofit indicators?
To make the comparison, BERC selected 10 peer MSAs widely used by the Nashville Area
Chamber of
Commerce in their
publications. BERC
especially focused
on the peers with
similar population
size. The selected
characteristics of
these peers are
presented in the
table at right.
BERC obtained nonprofit data from
NCCS Core Files. Among the peer
MSAs, the largest total revenue is
recorded in Raleigh, followed by
Indianapolis, Columbus, and Kansas
City. The Nashville MSA is virtually in
the middle of the group, occupying
fifth place.
Socioeconomic Characteristics of Peer MSAs
Population Employment Establishments
GDP (in Millions of
Current Dollars)
2010 2010 2010 2010
Birmingham, AL 1,129,068 642,821 25686 52,554
Charlotte, NC 1,763,969 1,063,731 44513 113,861
Columbus, OH 1,840,584 1,162,188 39286 91,295
Indianapolis, IN 1,760,826 1,090,538 42317 100,837
Jacksonville, FL 1,348,702 783,003 34085 59,262
Kansas City, MO 2,039,766 1,253,279 50129 106,006
Louisville, KY 1,285,891 744,413 29859 57,340
Nashville, TN 1,594,885 991,981 37619 82,369
Raleigh, NC 1,137,297 654,958 28933 56,305
Richmond, VA 1,260,396 758,181 31037 64,740
Data Source: BEA (www.bea.gov), Census Bureau (www.census.gov), and BERC
calculations.
Nonprofit Revenue and Expenditure by MSAs in 2010
Nonprofit Revenue Nonprofit Expenditure
Birmingham, AL $4,576,950,177 $4,447,145,577
Charlotte, NC $6,776,250,029 $6,361,954,552
Columbus, OH $10,969,073,054 $10,240,841,731
Indianapolis, IN $12,602,930,414 $11,793,824,015
Jacksonville, FL $6,400,608,906 $6,033,536,414
Kansas City, MO $10,416,524,439 $10,251,817,497
Louisville, KY $8,055,722,770 $7,838,085,919
Nashville,TN $9,199,402,730 $8,837,509,638
Raleigh, NC $13,230,828,924 $12,383,106,056
Richmond, VA $3,749,746,011 $3,660,037,392
Source: NCCS Core Files and BERC Estimates
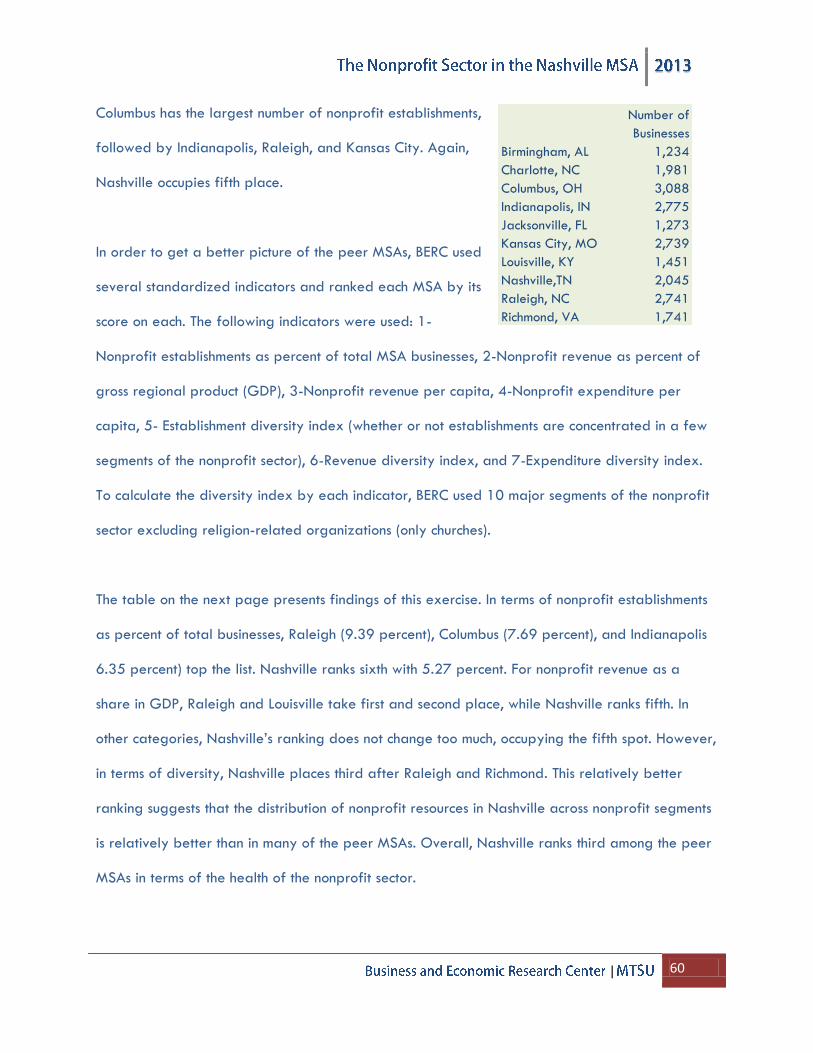
| 60
Columbus has the largest number of nonprofit establishments,
followed by Indianapolis, Raleigh, and Kansas City. Again,
Nashville occupies fifth place.
In order to get a better picture of the peer MSAs, BERC used
several standardized indicators and ranked each MSA by its
score on each. The following indicators were used: 1-
Nonprofit establishments as percent of total MSA businesses, 2-Nonprofit revenue as percent of
gross regional product (GDP), 3-Nonprofit revenue per capita, 4-Nonprofit expenditure per
capita, 5- Establishment diversity index (whether or not establishments are concentrated in a few
segments of the nonprofit sector), 6-Revenue diversity index, and 7-Expenditure diversity index.
To calculate the diversity index by each indicator, BERC used 10 major segments of the nonprofit
sector excluding religion-related organizations (only churches).
The table on the next page presents findings of this exercise. In terms of nonprofit establishments
as percent of total businesses, Raleigh (9.39 percent), Columbus (7.69 percent), and Indianapolis
6.35 percent) top the list. Nashville ranks sixth with 5.27 percent. For nonprofit revenue as a
share in GDP, Raleigh and Louisville take first and second place, while Nashville ranks fifth. In
other categories, Nashville’s ranking does not change too much, occupying the fifth spot. However,
in terms of diversity, Nashville places third after Raleigh and Richmond. This relatively better
ranking suggests that the distribution of nonprofit resources in Nashville across nonprofit segments
is relatively better than in many of the peer MSAs. Overall, Nashville ranks third among the peer
MSAs in terms of the health of the nonprofit sector.
Number of
Businesses
Birmingham, AL 1,234
Charlotte, NC 1,981
Columbus, OH 3,088
Indianapolis, IN 2,775
Jacksonville, FL 1,273
Kansas City, MO 2,739
Louisville, KY 1,451
Nashville,TN 2,045
Raleigh, NC 2,741
Richmond, VA 1,741
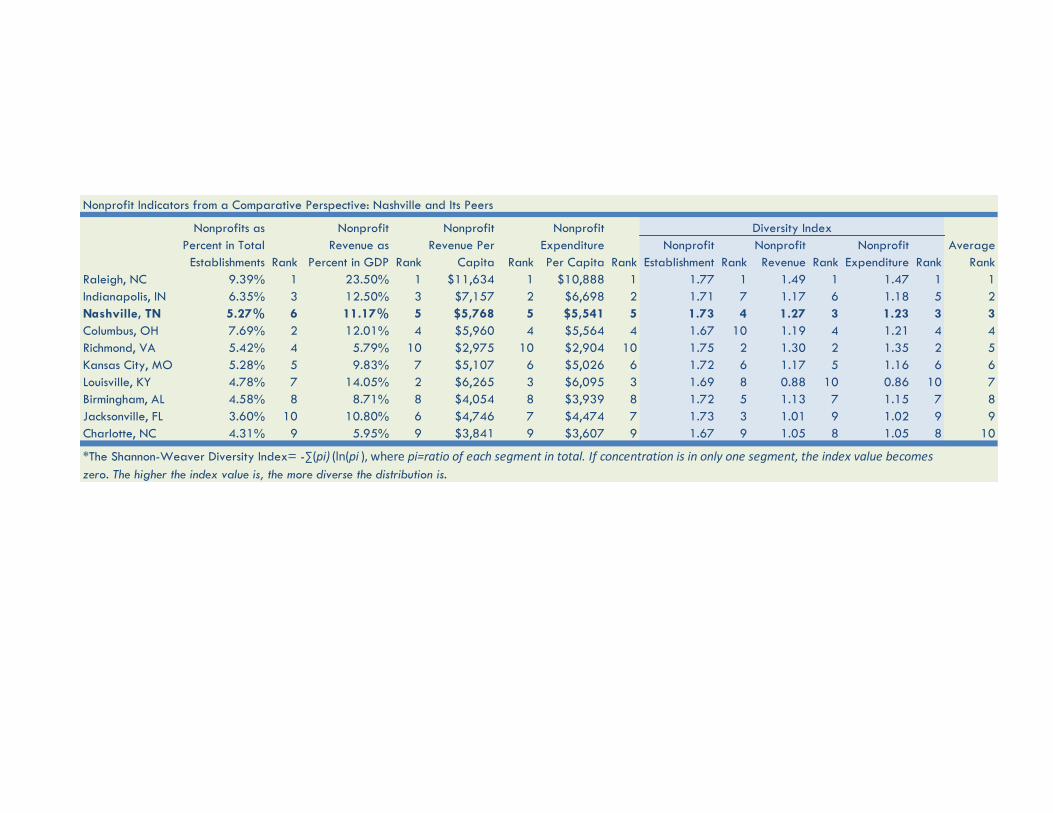
Nonprofit Indicators from a Comparative Perspective: Nashville and Its Peers
Rank Rank Rank Rank
Nonprofit
Establishment Rank
Nonprofit
Revenue Rank
Nonprofit
Expenditure Rank
Average
Rank
Raleigh, NC 9.39% 1 23.50% 1 $11,634 1 $10,888 1 1.77 1 1.49 1 1.47 1 1
Indianapolis, IN 6.35% 3 12.50% 3 $7,157 2 $6,698 2 1.71 7 1.17 6 1.18 5 2
Nashville, TN 5.27% 6 11.17% 5 $5,768 5 $5,541 5 1.73 4 1.27 3 1.23 3 3
Columbus, OH 7.69% 2 12.01% 4 $5,960 4 $5,564 4 1.67 10 1.19 4 1.21 4 4
Richmond, VA 5.42% 4 5.79% 10 $2,975 10 $2,904 10 1.75 2 1.30 2 1.35 2 5
Kansas City, MO 5.28% 5 9.83% 7 $5,107 6 $5,026 6 1.72 6 1.17 5 1.16 6 6
Louisville, KY 4.78% 7 14.05% 2 $6,265 3 $6,095 3 1.69 8 0.88 10 0.86 10 7
Birmingham, AL 4.58% 8 8.71% 8 $4,054 8 $3,939 8 1.72 5 1.13 7 1.15 7 8
Jacksonville, FL 3.60% 10 10.80% 6 $4,746 7 $4,474 7 1.73 3 1.01 9 1.02 9 9
Charlotte, NC 4.31% 9 5.95% 9 $3,841 9 $3,607 9 1.67 9 1.05 8 1.05 8 10
*The Shannon-Weaver Diversity Index= -∑(pi) (ln(pi ), where pi=ratio of each segment in total. If concentration is in only one segment, the index value becomes
zero. The higher the index value is, the more diverse the distribution is.
Diversity IndexNonprofits as
Percent in Total
Establishments
Nonprofit
Revenue as
Percent in GDP
Nonprofit
Revenue Per
Capita
Nonprofit
Expenditure
Per Capita
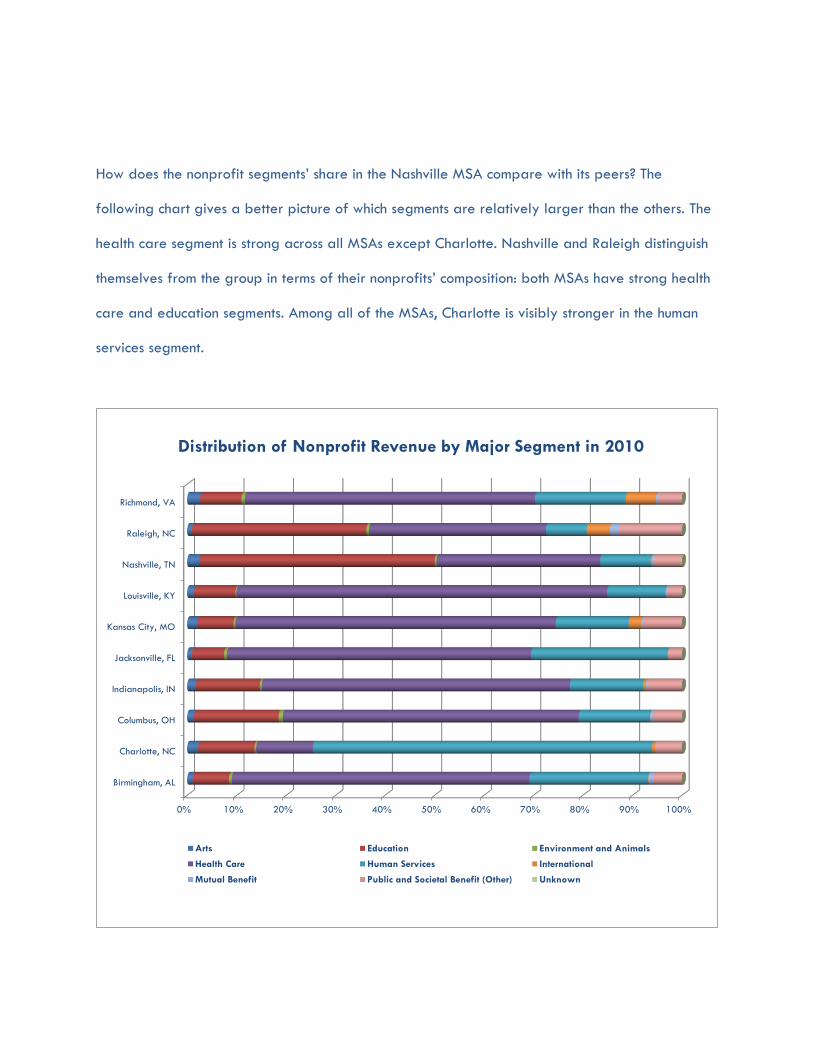
How does the nonprofit segments’ share in the Nashville MSA compare with its peers? The
following chart gives a better picture of which segments are relatively larger than the others. The
health care segment is strong across all MSAs except Charlotte. Nashville and Raleigh distinguish
themselves from the group in terms of their nonprofits’ composition: both MSAs have strong health
care and education segments. Among all of the MSAs, Charlotte is visibly stronger in the human
services segment.
0% 10% 20% 30% 40% 50% 60% 70% 80% 90% 100%
Birmingham, AL
Charlotte, NC
Columbus, OH
Indianapolis, IN
Jacksonville, FL
Kansas City, MO
Louisville, KY
Nashville, TN
Raleigh, NC
Richmond, VA
Distribution of Nonprofit Revenue by Major Segment in 2010
Arts Education Environment and Animals
Health Care Human Services International
Mutual Benefit Public and Societal Benefit (Other) Unknown
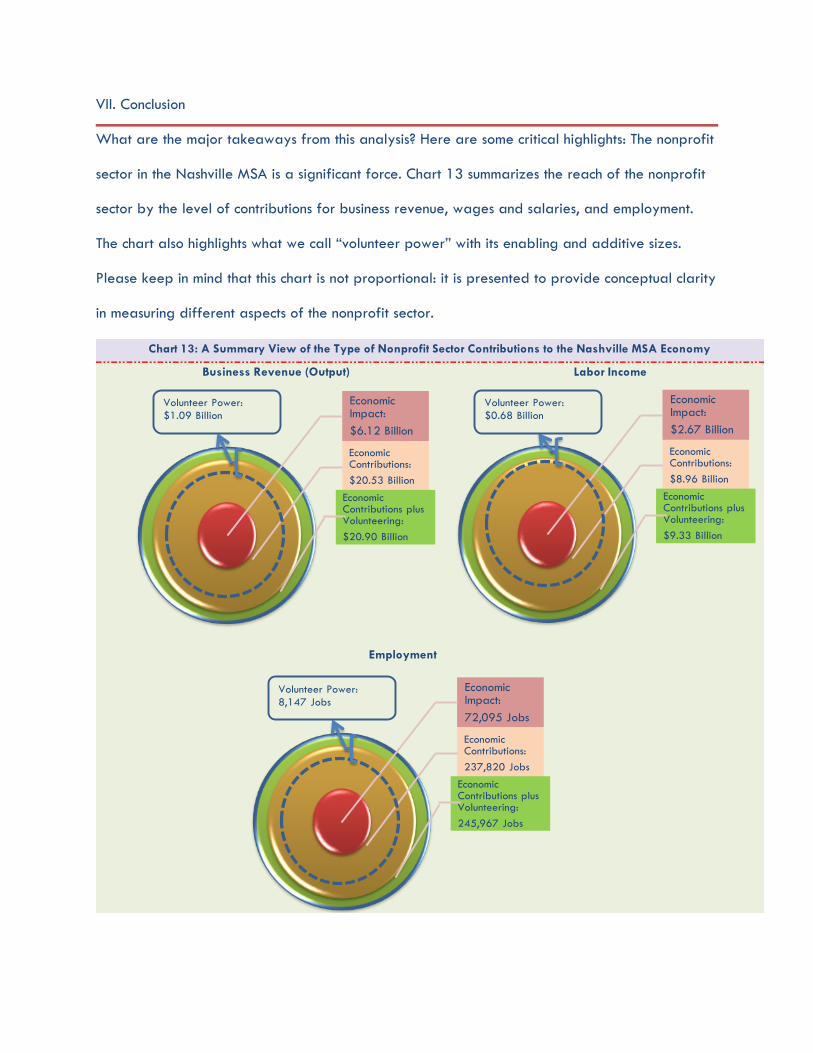
VII. Conclusion
What are the major takeaways from this analysis? Here are some critical highlights: The nonprofit
sector in the Nashville MSA is a significant force. Chart 13 summarizes the reach of the nonprofit
sector by the level of contributions for business revenue, wages and salaries, and employment.
The chart also highlights what we call “volunteer power” with its enabling and additive sizes.
Please keep in mind that this chart is not proportional: it is presented to provide conceptual clarity
in measuring different aspects of the nonprofit sector.
Business Revenue (Output) Labor Income
Employment
Chart 13: A Summary View of the Type of Nonprofit Sector Contributions to the Nashville MSA Economy
Economic Impact:
$6.12 Billion
Economic Contributions:
$20.53 Billion
Economic Contributions plus Volunteering:
$20.90 Billion
Volunteer Power:
$1.09 Billion
Economic Impact:
$2.67 Billion
Economic Contributions:
$8.96 Billion
Economic Contributions plus Volunteering:
$9.33 Billion
Volunteer Power:
$0.68 Billion
Economic Impact:
72,095 Jobs
Economic Contributions:
237,820 Jobs
Economic Contributions plus Volunteering:
245,967 Jobs
Volunteer Power:
8,147 Jobs
| 64
Both economic impact and economic contribution analysis suggest that the nonprofit sector
accounts for a sizeable portion of the Nashville MSA economy. It is a relatively diverse sector
compared with peer MSAs. Not all nonprofits, however, are created equal: some emerge and
grow during recessionary periods that result in many unmet demands from different segments of
the population, while others experience a significantly reduced budget with ever-increasing
demand for goods and services. The BERC online survey suggests that nonprofit organizations are
able to respond to the recession using a variety of strategic management tools.
This study aims to start a conversation about the size and scope of the nonprofit sector in the
Nashville MSA. We hope that the findings in this report provide a compelling reason to do just
that.
| 65
VIII. Works Consulted
Alliance of Arizona Nonprofits. (2009). Finding a way [Summary]. Phoenix, AZ.
Alliance of Arizona Nonprofits. (2010). Arizona nonprofits ride out the economic storm [Summary].
Phoenix, AZ.
Alliance of Arizona Nonprofits. (2011). A breaking point—Nonprofits face a precarious crossroads
[Summary]. Phoenix, AZ.
Alliance of Arizona Nonprofits. (2012). Borderline: Hope and concerns for Arizona nonprofits.
Phoenix, AZ.
Center for Non-Profits (NJ). (2009). New Jersey’s non-profit sector: An economic force for
strengthening the Garden State. North Brunswick, NJ.
Civic Enterprises. (2009). The quiet crisis: The impact of the economic downturn on the nonprofit
sector. Washington, DC: Bridgeland, J. M., McNaught, M., Reed, B., Dunkelman, M., & Civic, E.
Colorado Nonprofit Association. (2008). Return on investment: The economic impact of the nonprofit
sector in Colorado. Denver, CO: Geller, S.L., Sokolowski, S.W., Salamon, L.M., Raines, K.
Colorado Nonprofit Association. (2010). Understanding giving: Beliefs and behaviors of Colorado’s
donors. Denver, CO.
Colorado Nonprofit Association and Community Resource Center. (2009). Weathering the storm:
Challenges and opportunities facing Colorado nonprofits during recession. Denver, CO.
Connecticut Association of Nonprofits. (2010). The economic health and impact of nonprofits in
Connecticut: How a strong partnership between nonprofits and the state creates a better Connecticut.
Hartford, CT.
Donors Forum. (2010). Economic outlook 2010: Illinois nonprofits and grantmakers still reeling after
rough year. Chicago, IL.
The Foraker Group. (2011). Report on the Alaska nonprofit economy: Executive summary.
Anchorage, AK.
Idaho Nonprofit Center. (2012). The economic impacts of Idaho’s nonprofit organizations: Research
report. Moscow, ID: Peterson, S.
Institute for Economic Advancement. (2008). The benefit of doing good: The structure, contribution,
and impact of Arkansas nonprofits on the state’s economy. Little Rock, AR.
Johns Hopkins University Center for Civil Society Studies. (2009). Impact of the 2007-09 economic
recession on nonprofit organizations. Baltimore, MD: Salamon, L.M., Geller, S.L., Spence, K.L.
| 66
KBT & Associates (2009). Philanthropy in the first state: Delaware’s nonprofits, individual donors,
and grantmaking organizations. Jacksonville, FL: Littlepage, M.K.
Kentucky Nonprofit Network. (2012). More than charity: Kentucky’s nonprofit sector. Lexington, KY.
Maine Association of Nonprofits (2013). Partners in prosperity: The Maine nonprofit sector impact. Portland, ME.
Maine Association of Nonprofits (2010). Partners in prosperity: The Maine nonprofit sector impact.
Portland, ME.
Midwest Center for Nonprofit Leadership. (2005). Building a healthy community through nonprofit service: 2005 annual report on the Kansas City nonprofit sector. Kansas City, MO: Helm, S., Nemenoff, B., & Renz, D.O.
Midwest Center for Nonprofit Leadership. (2006). Building a healthy community through nonprofit service: 2006 annual report on the Kansas City nonprofit sector. Kansas City, MO: Anderson, F.O., Helm, S., Nemenoff, B., & Renz, D.O.
Midwest Center for Nonprofit Leadership. (2007). Building a healthy community through nonprofit service: 2007 annual report on the Kansas City nonprofit sector. Kansas City, MO: Anderson, F.O., Nemenoff, E., & Renz, D.O.
Midwest Center for Nonprofit Leadership. (2009a). Building a healthy community through nonprofit service: 2009 annual report on the Kansas City nonprofit sector. Kansas City, MO: Anderson, F.O. & Renz, D.O.
Midwest Center for Nonprofit Leadership. (2009b). The 2009 Missouri nonprofit sector at glance.
Kansas City, MO.
Minnesota Council of Nonprofits. (2010). Nonprofit current conditions report: Analysis of a
Minnesota Council of Nonprofits member survey. Saint Paul, MN: Deffley, R.D.
Montana Nonprofit Association. (2007). The Montana nonprofit sector. Helena, MT.
New Hampshire Center for Nonprofits. (2009). Essential: A portrait of the nonprofit sector in New
Hampshire. Concord, NH.
New Hampshire Center for Nonprofits. (2012). New Hampshire’s nonprofit sector in brief. Concord,
NH.
New Jersey Center for Non-Profits. (2009). New Jersey’s non-profit sector: An economic force for
strengthening the Garden State. North Brunswick, NJ.
New Jersey Center for Non-Profits. (2012). New Jersey non-profits 2012: Trends and outlook.
North Brunswick, NJ.
Nonprofit Association of Oregon. (2011). Oregon nonprofit sector report: The state of the nonprofit sector in Oregon.
Nonprofit Center of Northeast Florida. (2010). State of the sector. Jacksonville, FL: Littlepage,
M.K.
| 67
Nonprofit Center of Northeast Florida. (2012). State of the sector: How Northeast Florida’s nonprofits have changed and adapted in good times and bad. Jacksonville, FL.
North Dakota Association of Nonprofit Organizations. (2010). Vibrant. Diverse. Essential. The North
Dakota nonprofit sector. Bismarck, ND.
North Dakota Association of Nonprofit Organizations. (2013). North Dakota’s nonprofit sector in
brief. Bismarck, ND.
Vermont Community Foundation. (2011). Vermont’s nonprofit sector: A vital community in a time of
change. Middlebury, VT.
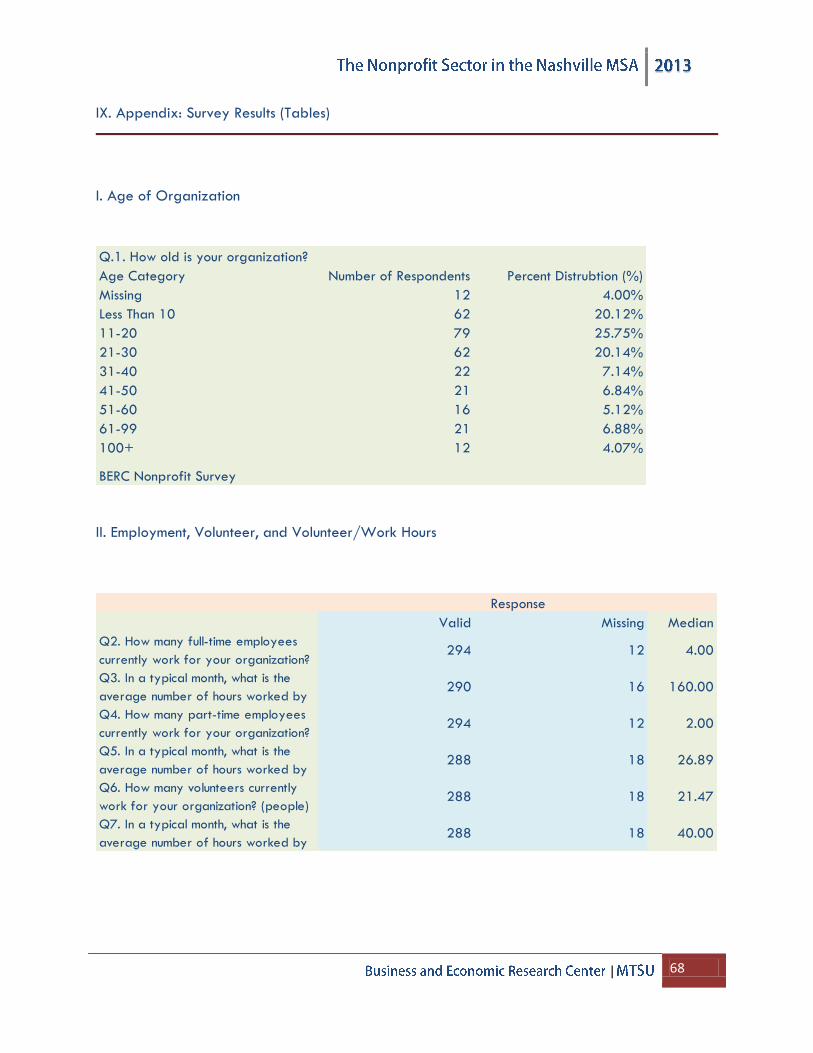
| 68
IX. Appendix: Survey Results (Tables)
I. Age of Organization
II. Employment, Volunteer, and Volunteer/Work Hours
Q.1. How old is your organization?
Age Category Number of Respondents Percent Distrubtion (%)
Missing 12 4.00%
Less Than 10 62 20.12%
11-20 79 25.75%
21-30 62 20.14%
31-40 22 7.14%
41-50 21 6.84%
51-60 16 5.12%
61-99 21 6.88%
100+ 12 4.07%
BERC Nonprofit Survey
Valid Missing Median
Q2. How many full-time employees
currently work for your organization? 294 12 4.00
Q3. In a typical month, what is the
average number of hours worked by 290 16 160.00
Q4. How many part-time employees
currently work for your organization? 294 12 2.00
Q5. In a typical month, what is the
average number of hours worked by 288 18 26.89
Q6. How many volunteers currently
work for your organization? (people)288 18 21.47
Q7. In a typical month, what is the
average number of hours worked by 288 18 40.00
Response

| 69
III. Total Expenditure and Revenue by Income Group
Categories Frequency Percent
Missing 40 12.9
25K-50K 42 13.7
51K-105K 27 8.7
106K-250K 46 15.2
251K-410K 19 6.2
411K-800K 32 10.6
801K-2,500K 32 10.3
2,501K-4,300K 14 4.7
4,301K-9,500K 14 4.5
9,501K-14,200K 7 2.2
14,201K-24,700K 3 1.1
24,701K-54,700K 3 1.0
54,701K and Above 27 8.8
Total 306 100.0
Q8. What was your organization's total expenditure for the recent fiscal
year ($)? (Please pick one.)
Categories Frequency Percent
Missing 47 15.2
25K-50K 54 17.7
51K-105K 31 10.3
106K-250K 37 12.0
251K-410K 25 8.1
411K-800K 24 7.8
801K-2,500K 32 10.5
2,501K-4,300K 10 3.4
4,301K-9,500K 15 5.0
9,501K-14,200K 4 1.3
14,201K-24,700K 1 .5
24,701K-54,700K 3 .9
54,701K and Above 22 7.3
Total 306 100.0
Q9. What was your organization's total expenditure for fiscal year 2008 ($)?
(Please pick one.)
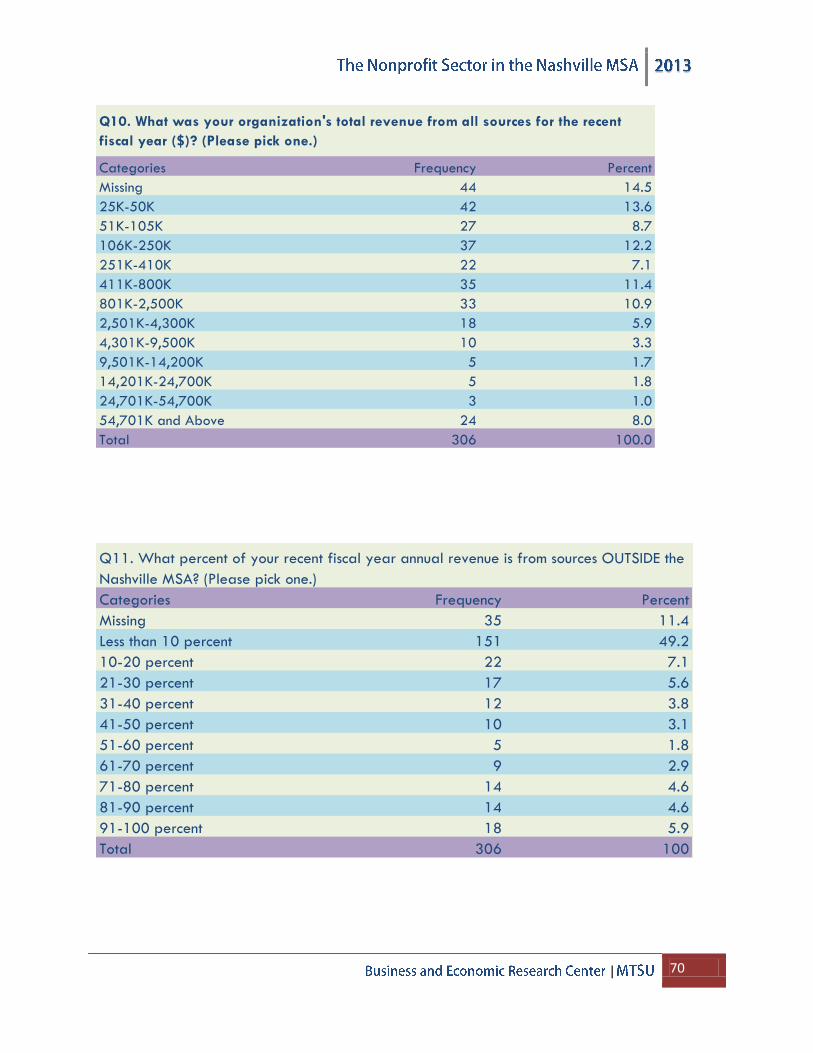
| 70
Categories Frequency Percent
Missing 44 14.5
25K-50K 42 13.6
51K-105K 27 8.7
106K-250K 37 12.2
251K-410K 22 7.1
411K-800K 35 11.4
801K-2,500K 33 10.9
2,501K-4,300K 18 5.9
4,301K-9,500K 10 3.3
9,501K-14,200K 5 1.7
14,201K-24,700K 5 1.8
24,701K-54,700K 3 1.0
54,701K and Above 24 8.0
Total 306 100.0
Q10. What was your organization's total revenue from all sources for the recent
fiscal year ($)? (Please pick one.)
Categories Frequency Percent
Missing 35 11.4
Less than 10 percent 151 49.2
10-20 percent 22 7.1
21-30 percent 17 5.6
31-40 percent 12 3.8
41-50 percent 10 3.1
51-60 percent 5 1.8
61-70 percent 9 2.9
71-80 percent 14 4.6
81-90 percent 14 4.6
91-100 percent 18 5.9
Total 306 100
Q11. What percent of your recent fiscal year annual revenue is from sources OUTSIDE the
Nashville MSA? (Please pick one.)
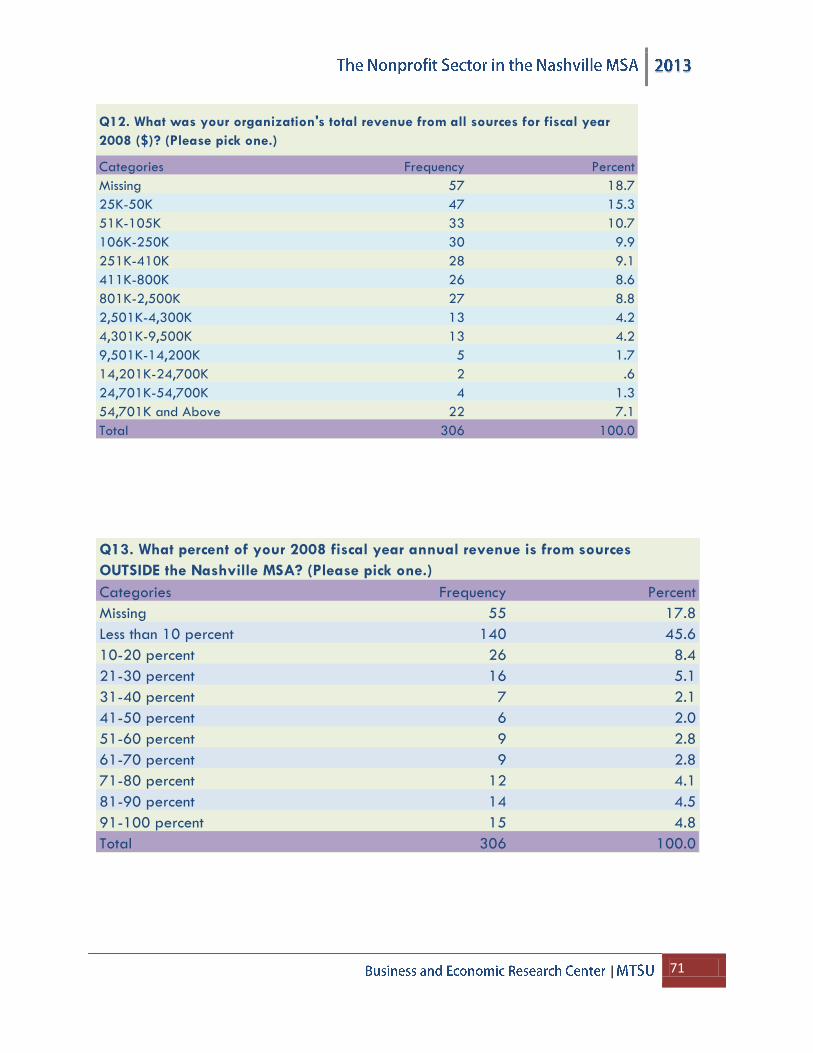
| 71
Categories Frequency Percent
Missing 57 18.7
25K-50K 47 15.3
51K-105K 33 10.7
106K-250K 30 9.9
251K-410K 28 9.1
411K-800K 26 8.6
801K-2,500K 27 8.8
2,501K-4,300K 13 4.2
4,301K-9,500K 13 4.2
9,501K-14,200K 5 1.7
14,201K-24,700K 2 .6
24,701K-54,700K 4 1.3
54,701K and Above 22 7.1
Total 306 100.0
Q12. What was your organization's total revenue from all sources for fiscal year
2008 ($)? (Please pick one.)
Categories Frequency Percent
Missing 55 17.8
Less than 10 percent 140 45.6
10-20 percent 26 8.4
21-30 percent 16 5.1
31-40 percent 7 2.1
41-50 percent 6 2.0
51-60 percent 9 2.8
61-70 percent 9 2.8
71-80 percent 12 4.1
81-90 percent 14 4.5
91-100 percent 15 4.8
Total 306 100.0
Q13. What percent of your 2008 fiscal year annual revenue is from sources
OUTSIDE the Nashville MSA? (Please pick one.)
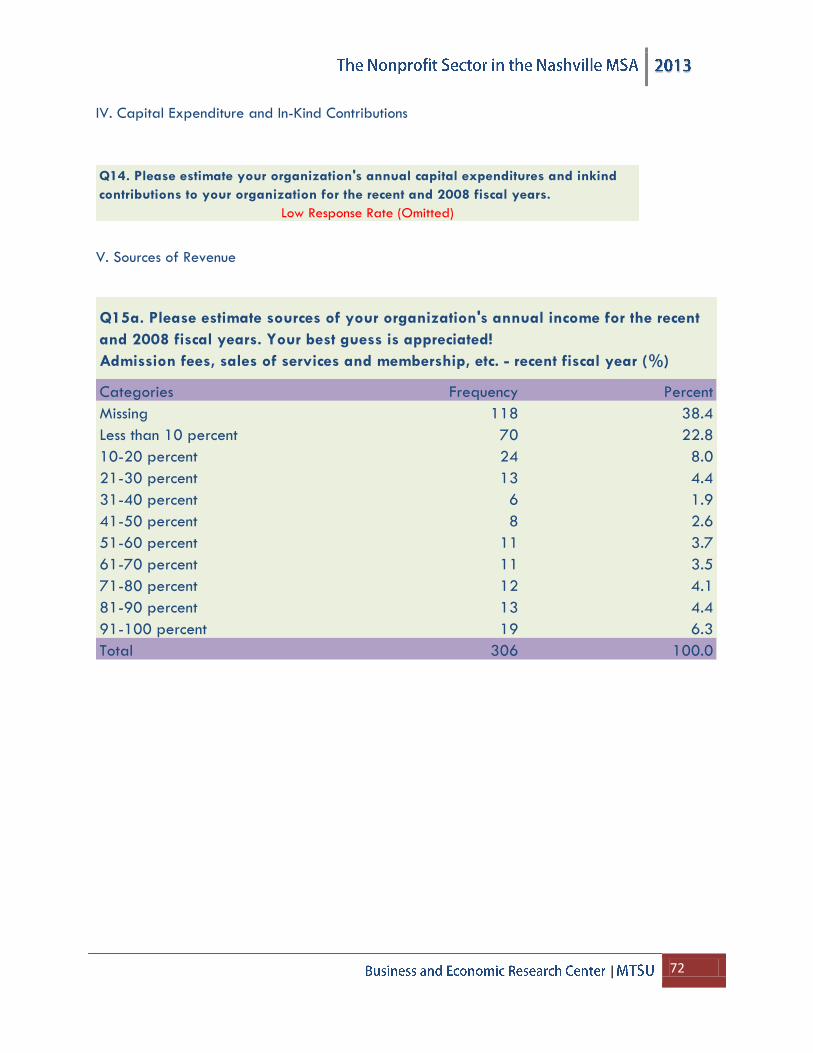
| 72
IV. Capital Expenditure and In-Kind Contributions
V. Sources of Revenue
Q14. Please estimate your organization's annual capital expenditures and inkind
contributions to your organization for the recent and 2008 fiscal years.
Low Response Rate (Omitted)
Categories Frequency Percent
Missing 118 38.4
Less than 10 percent 70 22.8
10-20 percent 24 8.0
21-30 percent 13 4.4
31-40 percent 6 1.9
41-50 percent 8 2.6
51-60 percent 11 3.7
61-70 percent 11 3.5
71-80 percent 12 4.1
81-90 percent 13 4.4
91-100 percent 19 6.3
Total 306 100.0
Q15a. Please estimate sources of your organization's annual income for the recent
and 2008 fiscal years. Your best guess is appreciated!
Admission fees, sales of services and membership, etc. - recent fiscal year (%)
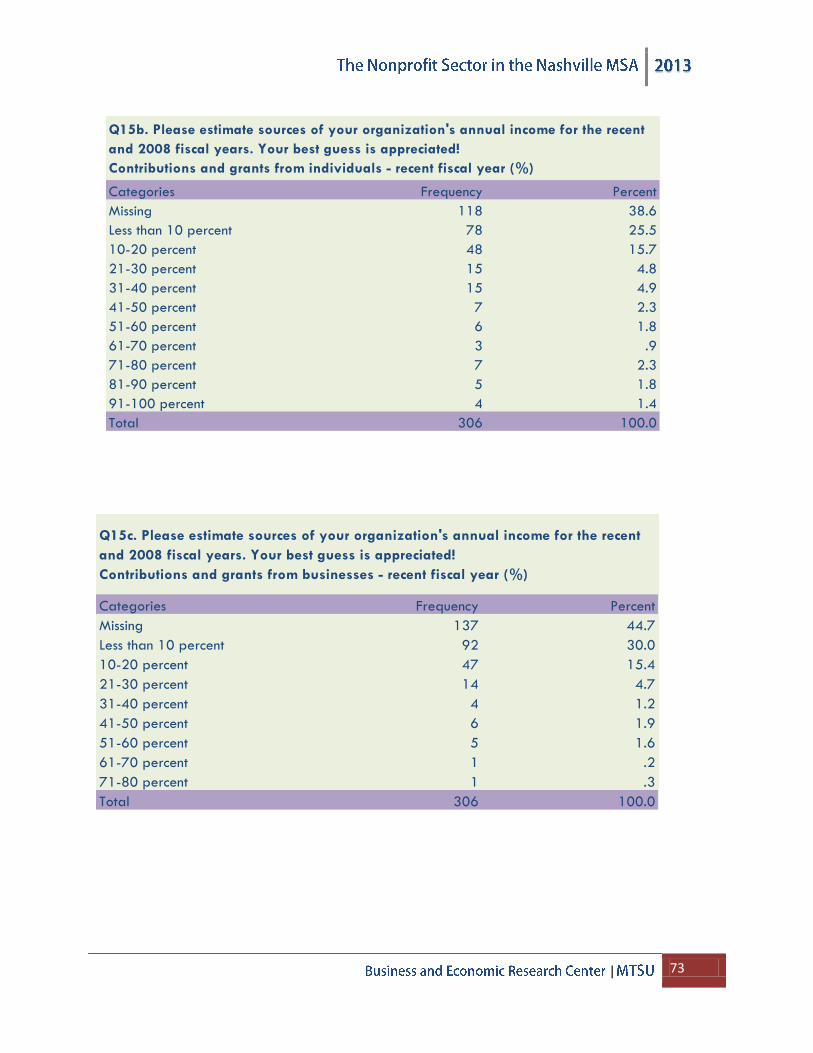
| 73
Categories Frequency Percent
Missing 118 38.6
Less than 10 percent 78 25.5
10-20 percent 48 15.7
21-30 percent 15 4.8
31-40 percent 15 4.9
41-50 percent 7 2.3
51-60 percent 6 1.8
61-70 percent 3 .9
71-80 percent 7 2.3
81-90 percent 5 1.8
91-100 percent 4 1.4
Total 306 100.0
Q15b. Please estimate sources of your organization's annual income for the recent
and 2008 fiscal years. Your best guess is appreciated!
Contributions and grants from individuals - recent fiscal year (%)
Categories Frequency Percent
Missing 137 44.7
Less than 10 percent 92 30.0
10-20 percent 47 15.4
21-30 percent 14 4.7
31-40 percent 4 1.2
41-50 percent 6 1.9
51-60 percent 5 1.6
61-70 percent 1 .2
71-80 percent 1 .3
Total 306 100.0
Q15c. Please estimate sources of your organization's annual income for the recent
and 2008 fiscal years. Your best guess is appreciated!
Contributions and grants from businesses - recent fiscal year (%)
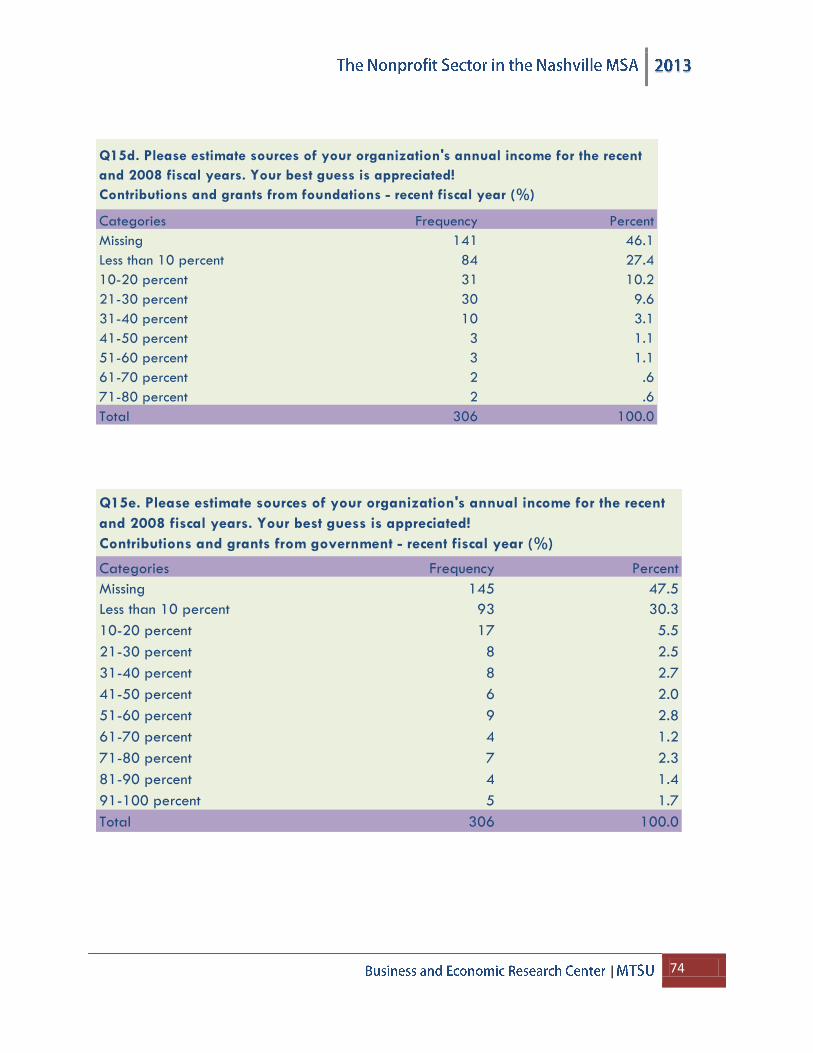
| 74
Categories Frequency Percent
Missing 141 46.1
Less than 10 percent 84 27.4
10-20 percent 31 10.2
21-30 percent 30 9.6
31-40 percent 10 3.1
41-50 percent 3 1.1
51-60 percent 3 1.1
61-70 percent 2 .6
71-80 percent 2 .6
Total 306 100.0
Q15d. Please estimate sources of your organization's annual income for the recent
and 2008 fiscal years. Your best guess is appreciated!
Contributions and grants from foundations - recent fiscal year (%)
Categories Frequency Percent
Missing 145 47.5
Less than 10 percent 93 30.3
10-20 percent 17 5.5
21-30 percent 8 2.5
31-40 percent 8 2.7
41-50 percent 6 2.0
51-60 percent 9 2.8
61-70 percent 4 1.2
71-80 percent 7 2.3
81-90 percent 4 1.4
91-100 percent 5 1.7
Total 306 100.0
Q15e. Please estimate sources of your organization's annual income for the recent
and 2008 fiscal years. Your best guess is appreciated!
Contributions and grants from government - recent fiscal year (%)
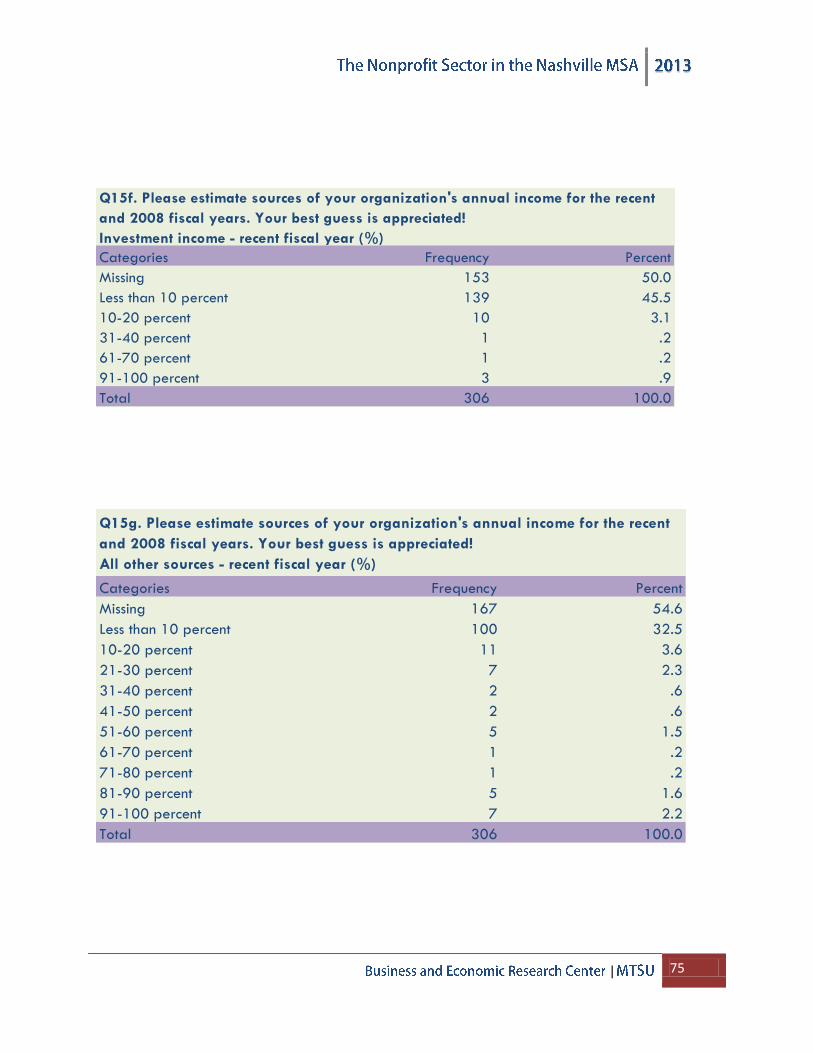
| 75
Categories Frequency Percent
Missing 153 50.0
Less than 10 percent 139 45.5
10-20 percent 10 3.1
31-40 percent 1 .2
61-70 percent 1 .2
91-100 percent 3 .9
Total 306 100.0
Q15f. Please estimate sources of your organization's annual income for the recent
and 2008 fiscal years. Your best guess is appreciated!
Investment income - recent fiscal year (%)
Categories Frequency Percent
Missing 167 54.6
Less than 10 percent 100 32.5
10-20 percent 11 3.6
21-30 percent 7 2.3
31-40 percent 2 .6
41-50 percent 2 .6
51-60 percent 5 1.5
61-70 percent 1 .2
71-80 percent 1 .2
81-90 percent 5 1.6
91-100 percent 7 2.2
Total 306 100.0
Q15g. Please estimate sources of your organization's annual income for the recent
and 2008 fiscal years. Your best guess is appreciated!
All other sources - recent fiscal year (%)
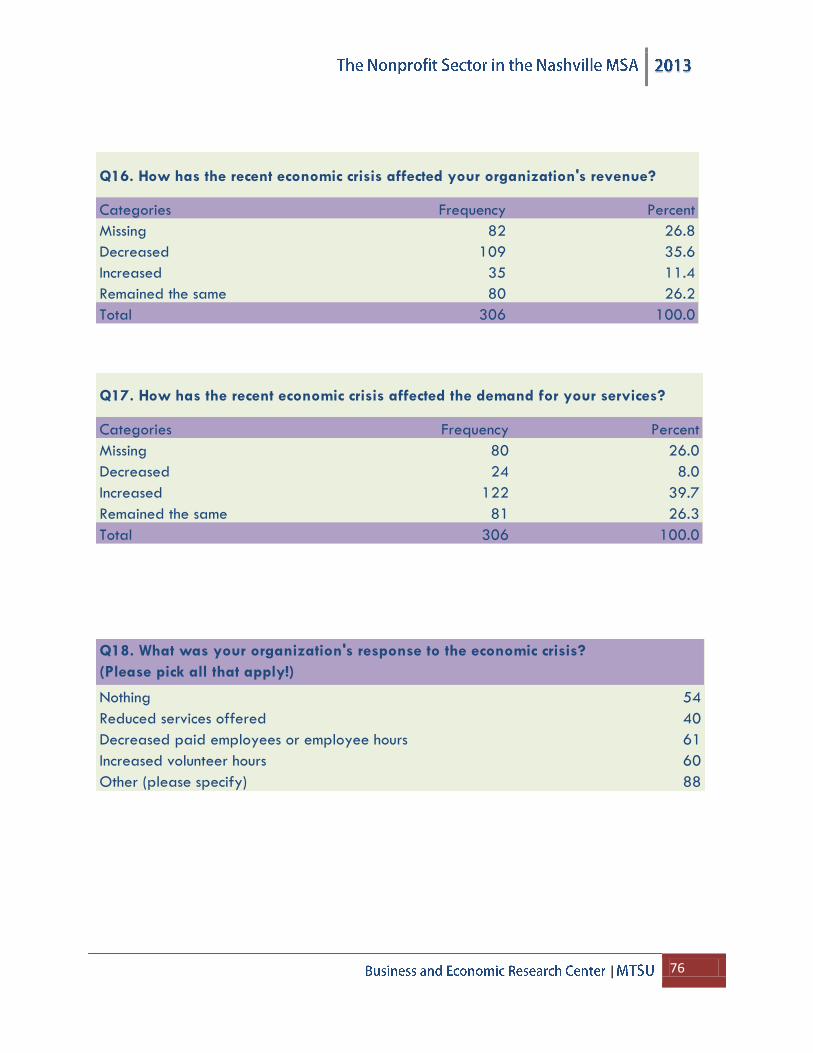
| 76
Categories Frequency Percent
Missing 82 26.8
Decreased 109 35.6
Increased 35 11.4
Remained the same 80 26.2
Total 306 100.0
Q16. How has the recent economic crisis affected your organization's revenue?
Categories Frequency Percent
Missing 80 26.0
Decreased 24 8.0
Increased 122 39.7
Remained the same 81 26.3
Total 306 100.0
Q17. How has the recent economic crisis affected the demand for your services?
Nothing 54
Reduced services offered 40
61
Increased volunteer hours 60
Other (please specify) 88
Q18. What was your organization's response to the economic crisis?
(Please pick all that apply!)
Decreased paid employees or employee hours
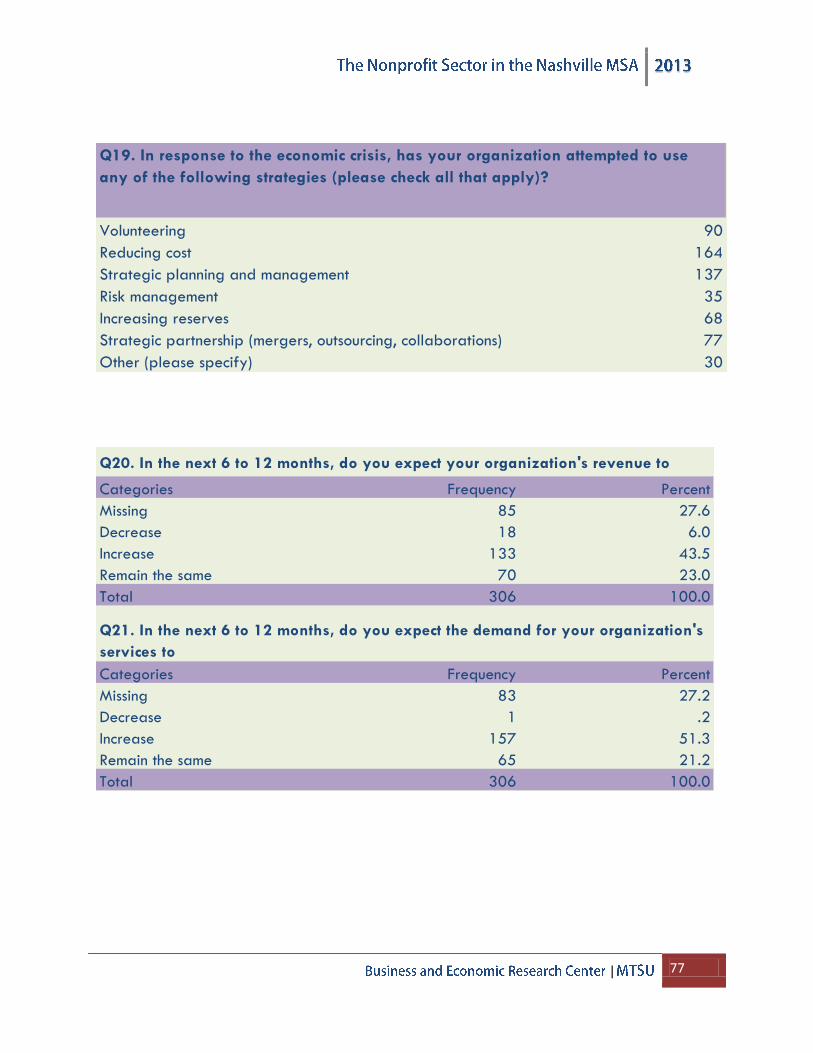
| 77
90
164
137
35
68
77
30
Q19. In response to the economic crisis, has your organization attempted to use
any of the following strategies (please check all that apply)?
Volunteering
Reducing cost
Strategic planning and management
Risk management
Increasing reserves
Strategic partnership (mergers, outsourcing, collaborations)
Other (please specify)
Categories Frequency Percent
Missing 85 27.6
Decrease 18 6.0
Increase 133 43.5
Remain the same 70 23.0
Total 306 100.0
Categories Frequency Percent
Missing 83 27.2
Decrease 1 .2
Increase 157 51.3
Remain the same 65 21.2
Total 306 100.0
Q21. In the next 6 to 12 months, do you expect the demand for your organization's
services to
Q20. In the next 6 to 12 months, do you expect your organization's revenue to


