32
Land Leverage D ynam ics in Property M arkets G reg C ostello C urtin U niversity,A ustralia C hris Leishm an U niversity ofG lasgow
| Date post: | 30-Dec-2015 |
| Category: |
Documents |
| Upload: | garrett-rivas |
| View: | 17 times |
| Download: | 0 times |
Land Leverage Dynamics in Property Markets
Greg Costello
Curtin University, Australia
Chris Leishman
University of Glasgow

The authors gratefully acknowledge:
•The Royal Institution of Chartered Surveyors (RICS) education trust for providing funding towards this research.
•rics.org/research
•Landgate and the Valuer General of Western Australia for providing data used in this research
Acknowledgements
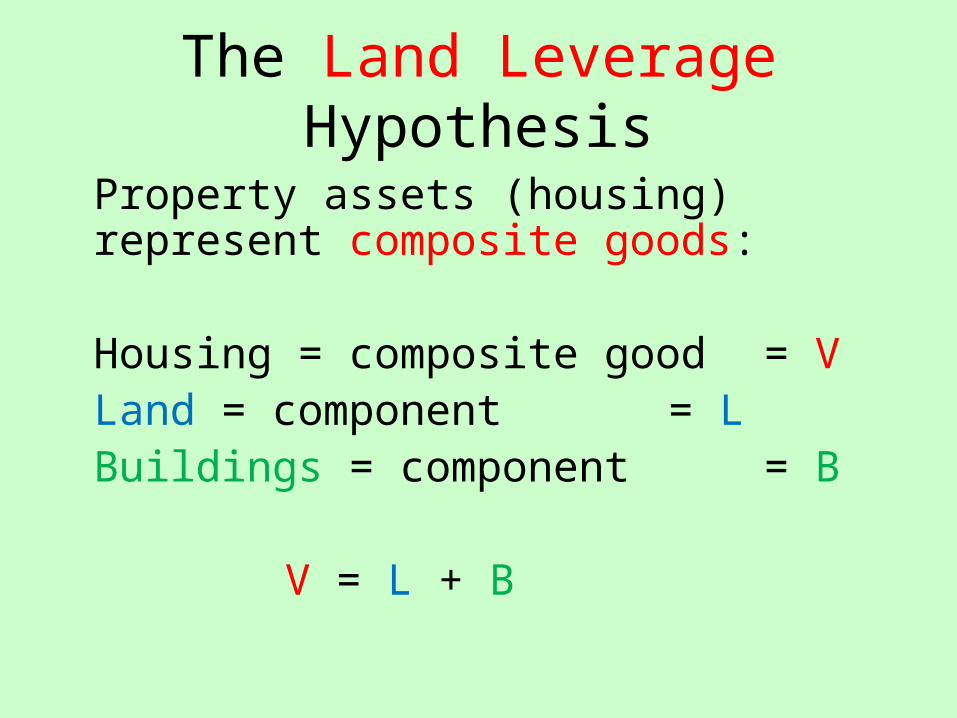
The Land Leverage Hypothesis
Property assets (housing) represent composite goods:
Housing = composite good = VLand = component = LBuildings = component = B
V = L + B


The Land Leverage Hypothesis
Property assets (housing) represent composite goods:
Housing = composite good = VLand = component = LBuildings = component = B
V = L + B
The Land Leverage Hypothesis
Land leverage reflects:the proportion of the total property valueembodied in:the value of the landas distinct from improvements (buildings)as a significant factor for establishing the future path of property prices

The Land Leverage Hypothesis
It follows that the value of land and value of improvements on that land are likely to evolve differently over time?
As economists we should not find this surprising ???
The Land Leverage Hypothesis
Intuition and economic theory suggest significant demand/supply asymmetry between land and improvement components
Demand/Supply Asymmetry
Demand side
Improvements = capital input in housing production
Land capitalises the market value of location and infrastructure (schools /shopping/employment centres

Perth Australia, house and vacant land prices1988-2008

Land Leverage ???
Background ???

Background 1- the old• One Hundred Years of Land Values
in Chicago: The Relationship of the Growth of Chicago to the Rise of Its Land Values, 1830-1933
• Hoyt, H., 1933. The University of Chicago Press, Chicago.
Background 1- the new
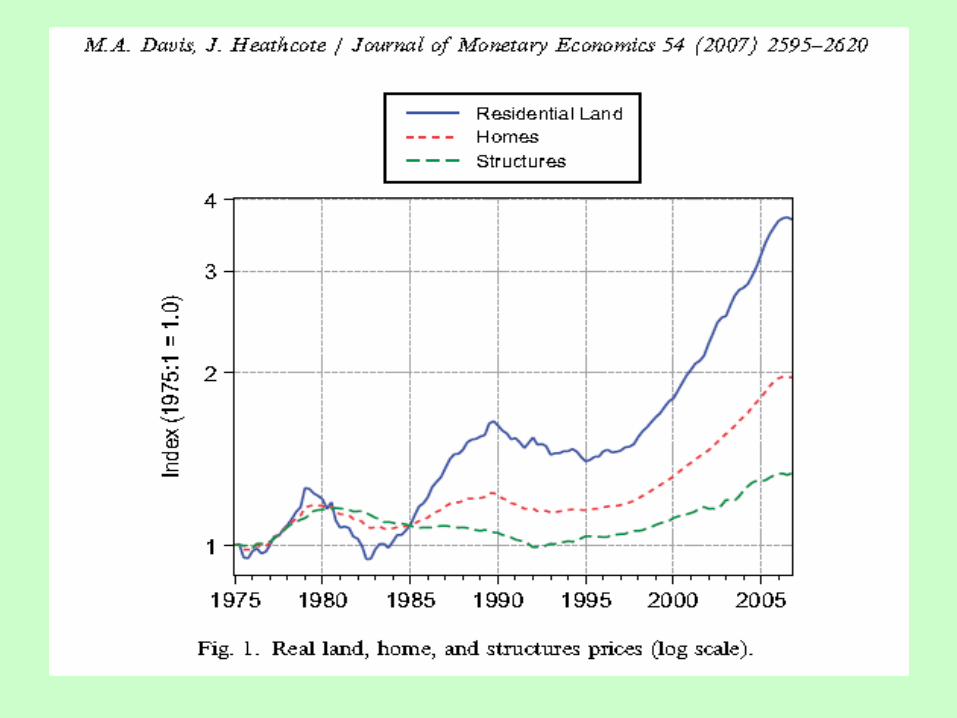
•The price and quantity of residential land in the United States
• Davis, M., Heathcote, J., 2007. Journal of
Monetary Economics 54, pp. 2595–2620.

Background 1- the new
• The price of residential land in large U.S. Cities
• Davis, M., Palumbo, M., 2008. Journal of Urban Economics 63, 352–384.
Background 1- the new
• Land leverage: decomposing home price dynamics
• Bostic, R. , Longhofer, S., Redfearn, C., 2007. Real Estate Economics 35, 183–208.

Background 1- the newBourassa, S.C., Haurin, DR, Haurin, J.L., Hoesli, M., Sun, J.,2009. House Price Changes and Idiosyncratic Risk: The Impact of Property Characteristics. Real Estate Economics 37: 2: pp.259-278.
Bourassa, S.C., Hoesli, M, Scognamiglio, D., Zhang, S., 2010. Land Leverage and House Prices. Swiss Finance Institute Research Paper Series N 10-48, Electronic copy available at: http://ssrn.com/abstract=1715532
Why is this important ???
Housing affordability

A stylized example• Consider two homes, one located in Sydney and
the other in Adelaide, both homes are valued at $450,000
• The Sydney home is a cheaper home in an established area with older depreciated improvements worth $90,000 and land worth $360,000
• The Adelaide home is a higher-end home of new construction with an allocation of $360,000 to improvements and $90,000 to land value
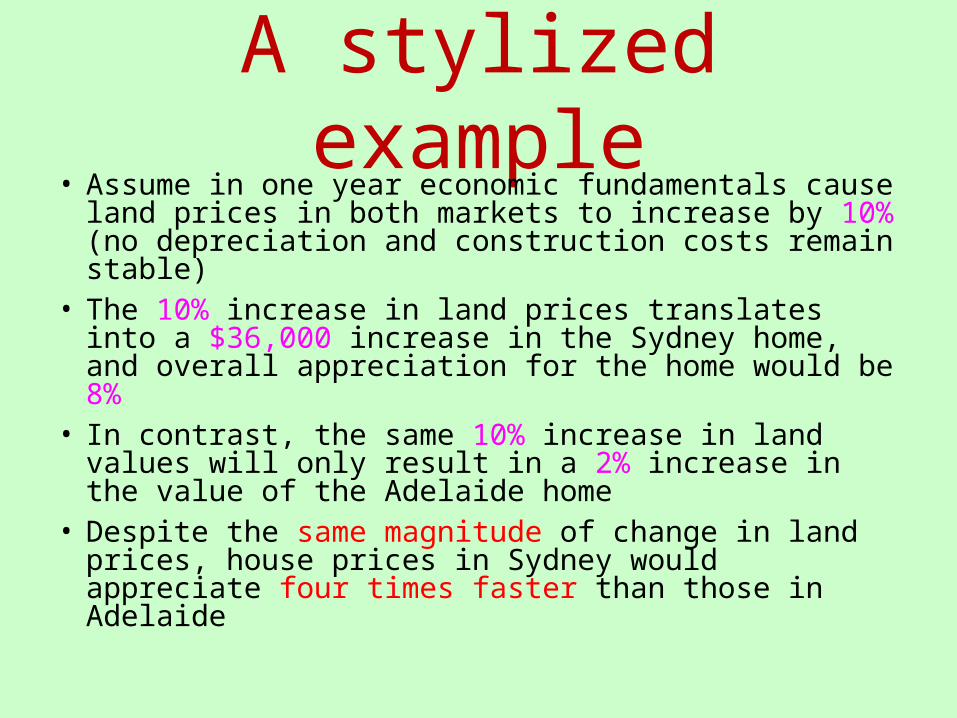
A stylized example• Assume in one year economic fundamentals cause
land prices in both markets to increase by 10% (no depreciation and construction costs remain stable)
• The 10% increase in land prices translates into a $36,000 increase in the Sydney home, and overall appreciation for the home would be 8%
• In contrast, the same 10% increase in land values will only result in a 2% increase in the value of the Adelaide home
• Despite the same magnitude of change in land prices, house prices in Sydney would appreciate four times faster than those in Adelaide
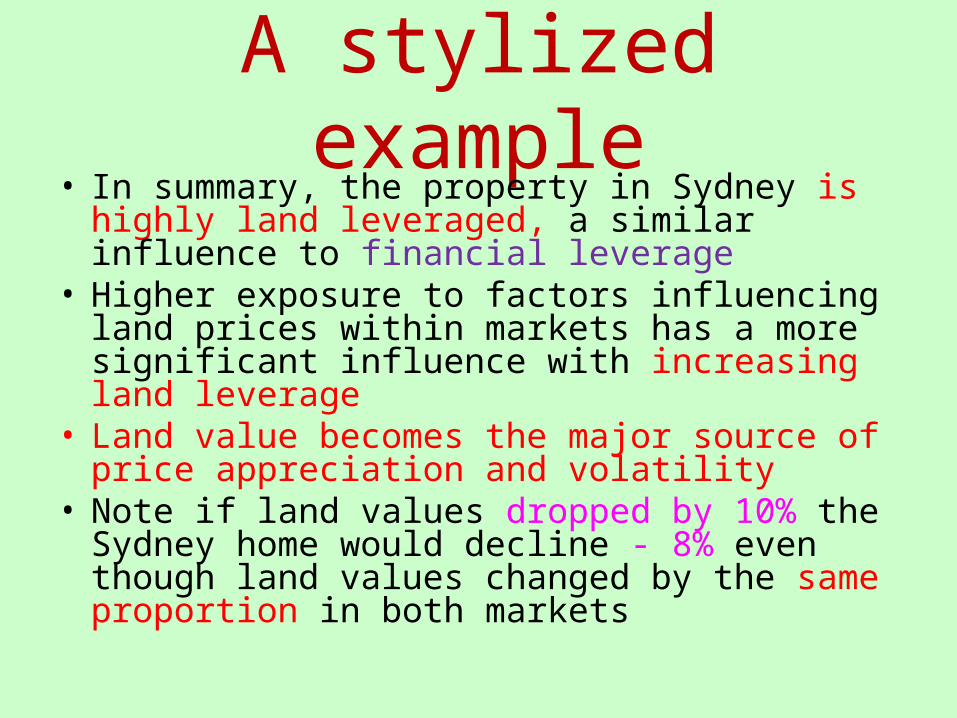
A stylized example• In summary, the property in Sydney is highly
land leveraged, a similar influence to financial leverage
• Higher exposure to factors influencing land prices within markets has a more significant influence with increasing land leverage
• Land value becomes the major source of price appreciation and volatility
• Note if land values dropped by 10% the Sydney home would decline - 8% even though land values changed by the same proportion in both markets
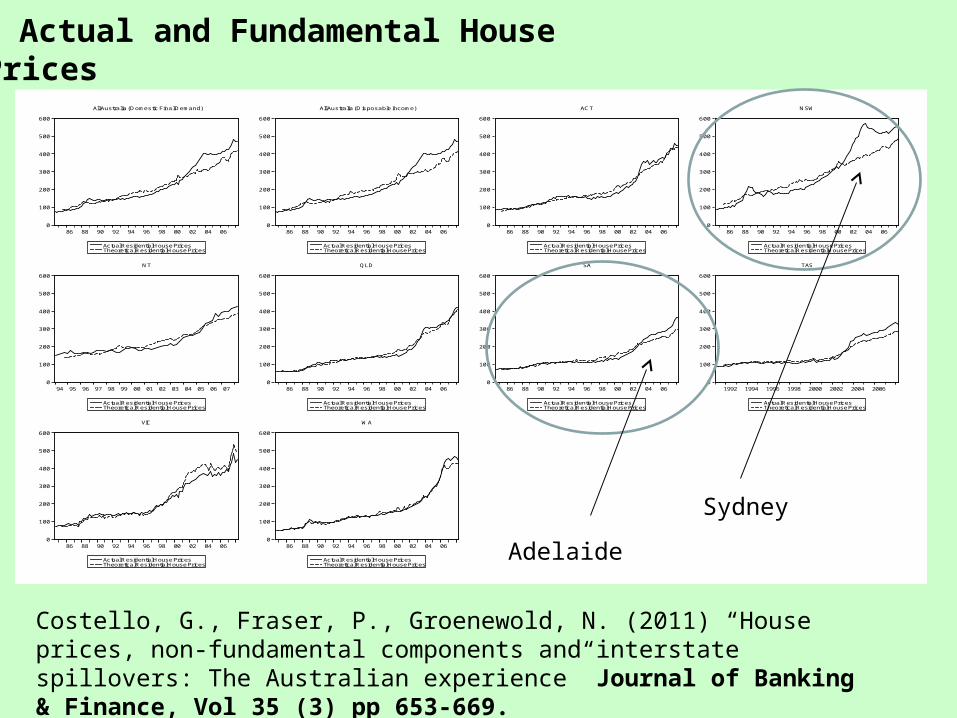
Actual and Fundamental House Prices
0
100
200
300
400
500
600
86 88 90 92 94 96 98 00 02 04 06
Actual Residential House PricesTheoretical Residential House Prices
All Australia (Domestic Final Demand)
0
100
200
300
400
500
600
86 88 90 92 94 96 98 00 02 04 06
Actual Residential House PricesTheoretical Residential House Prices
All Australia (Disposable Income)
0
100
200
300
400
500
600
86 88 90 92 94 96 98 00 02 04 06
Actual Residential House PricesTheoretical Residential House Prices
ACT
0
100
200
300
400
500
600
86 88 90 92 94 96 98 00 02 04 06
Actual Residential House PricesTheoretical Residential House Prices
NSW
0
100
200
300
400
500
600
94 95 96 97 98 99 00 01 02 03 04 05 06 07
Actual Residential House PricesTheoretical Residential House Prices
NT
0
100
200
300
400
500
600
86 88 90 92 94 96 98 00 02 04 06
Actual Residential House PricesTheoretical Residential House Prices
QLD
0
100
200
300
400
500
600
86 88 90 92 94 96 98 00 02 04 06
Actual Residential House PricesTheoretical Residential House Prices
SA
0
100
200
300
400
500
600
1992 1994 1996 1998 2000 2002 2004 2006
Actual Residential House PricesTheoretical Residential House Prices
TAS
0
100
200
300
400
500
600
86 88 90 92 94 96 98 00 02 04 06
Actual Residential House PricesTheoretical Residential House Prices
VIC
0
100
200
300
400
500
600
86 88 90 92 94 96 98 00 02 04 06
Actual Residential House PricesTheoretical Residential House Prices
WA
Sydney
Adelaide
Costello, G., Fraser, P., Groenewold, N. (2011) “House prices, non-fundamental components and interstate spillovers: The Australian experience” Journal of Banking & Finance, Vol 35 (3) pp 653-669.

Implications of Land Leverage (for big cities)?
Prices for housing are largely driven by changes in price of the land component
Older housing has higher land leverage than for new housing
Older housing will have higher growth rates than for newer housing
Implications of Land Leverage (for big cities)?
Trend growth rates for the building and land components are different
Land prices increasing = an increasingly important component of aggregate regional/national wealth
Data and Methodology
In order to calculate land leverage for an individual property, the value of the land must be identified separately from the value of the improvements

Some results for Perth 1988-2011
• Average land leverage 63% (63% land, 37% building)
• Average overall total property price change +12.3% p.a.
• Land component +13.9%
• Improvements + 8.7%
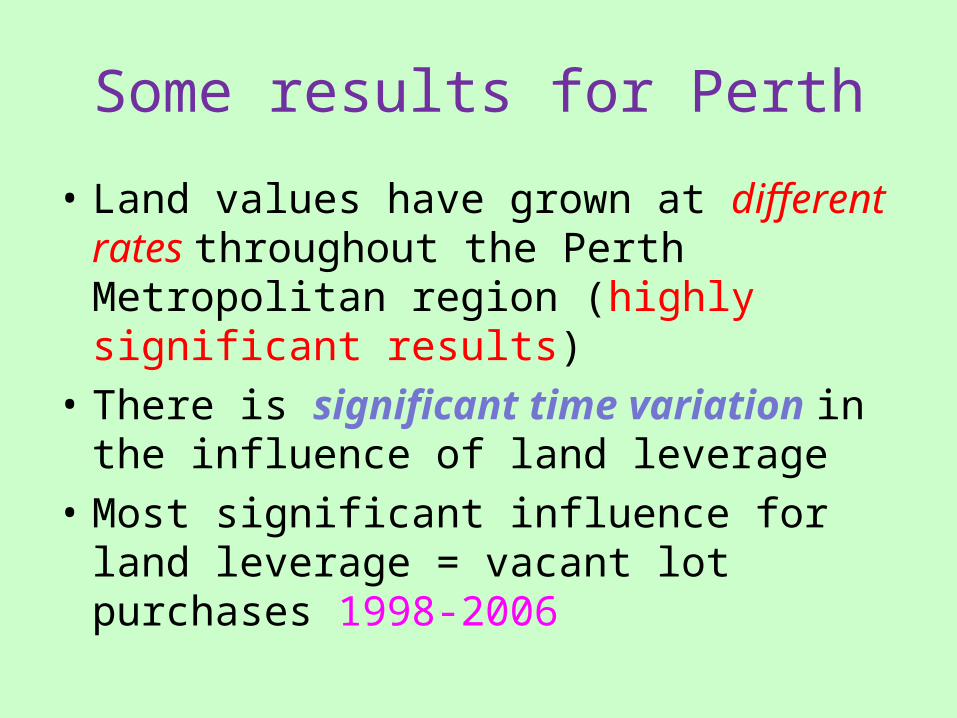
Some results for Perth
• Land values have grown at different rates throughout the Perth Metropolitan region (highly significant results)
• There is significant time variation in the influence of land leverage
• Most significant influence for land leverage = vacant lot purchases 1998-2006

What next ??
• How does this work in submarkets with large variations in the age of the housing stock?
• What happens when vacant land is also being sold in submarkets?
• Is there a special value for heritage property?• Do neighbourhoods exhibit specific
depreciation characteristics for housing stock?
Policy considerations1. Housing affordability
2. Measurement of house prices
3. Housing subsidy policy (rental markets)
4. Zoning policy - intensity of land-use


