Quantifying CMAQ Simulation Uncertainties of Particulate Matter in the Presence of Uncertain Emissions Rates. Wenxian Zhang, Marcus Trail, Alexandra Tsimpidi , Yongtao Hu , Athanasios Nenes , and Armistead Russell CMAS Annual Conference Oct 17, 2012. RD83479901. Acknowledgements. - PowerPoint PPT Presentation
Quantifying CMAQ Simulation Uncertainties of Particulate Matter in the Presence of Uncertain Emissions Rates Wenxian Zhang, Marcus Trail, Alexandra Tsimpidi, Yongtao Hu, Athanasios Nenes, and Armistead Russell CMAS Annual Conference Oct 17, 2012
Transcript
Quantifying CMAQ Simulation Uncertainties of Particulate Matter in the
Presence of Uncertain Emissions Rates
Wenxian Zhang, Marcus Trail, Alexandra Tsimpidi, Yongtao Hu, Athanasios Nenes, and Armistead Russell
CMAS Annual ConferenceOct 17, 2012
Acknowledgements
• U.S. EPA• Southern Company/ Georgia Power• Phillips 66
RD83479901
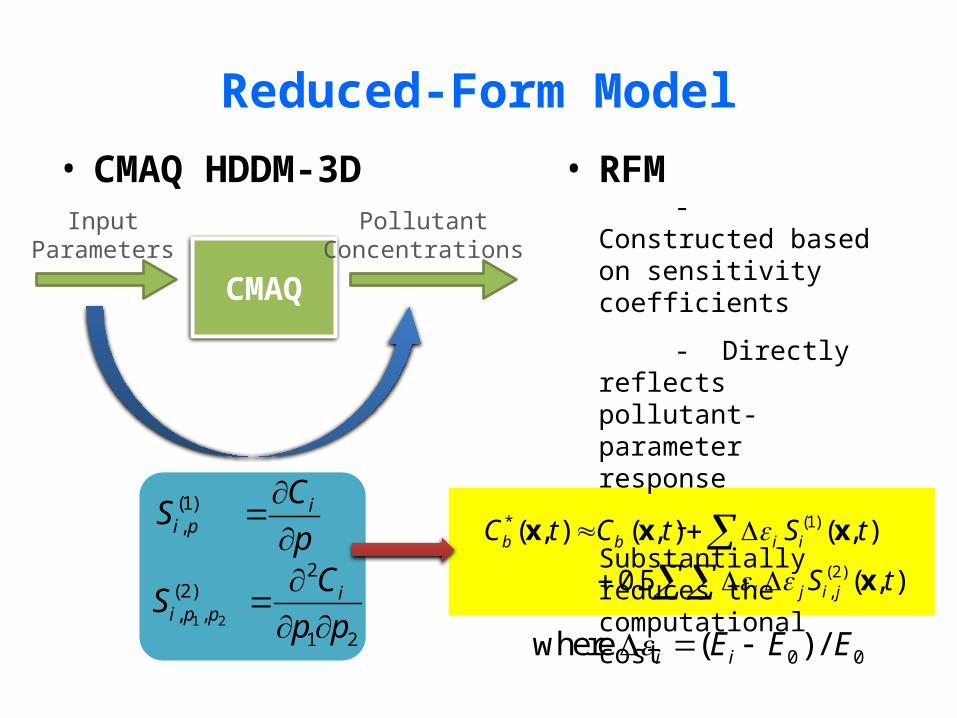
Overview• Uncertainties in regional air quality models• Method for uncertainty analysis - Monte Carlo method - Reduced-form model based on high-order DDM sensitivity analysis
• Quantification of uncertainties in simulated PM2.5 concentrations due to uncertain emissions
• Quantification of uncertainties in model response to emissions control in the presence of uncertain emissions
• Quantification of uncertainties in first-order sensitivities of PM2.5 due to emission uncertainties
Uncertainties in Air Quality Models
ERCKuCt
Ciii
i
)()(
Original AQM
How to Quantify Uncertainties?
Concentration 1Concentration 2Concentration 3...Concentration N
sensitivity to point source emissionsJuly 23, 2006
Sen
sitiv
ity P
erce
ntile
s (μ
g m-
3)
Simulated Sensitivity (μg m-3)
• 97.5th
• 50th
• 2.5th
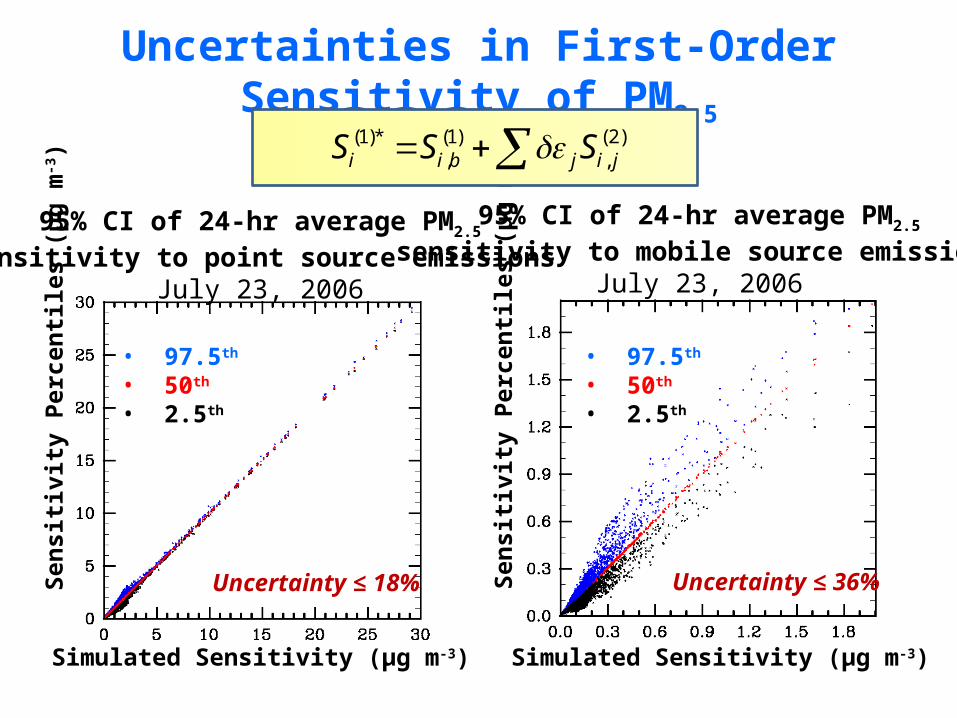
95% CI of 24-hr average PM2.5
sensitivity to mobile source emissionsJuly 23, 2006
• 97.5th
• 50th
• 2.5th
Sen
sitiv
ity P
erce
ntile
s (μ
g m-
3)
Simulated Sensitivity (μg m-3)
(1)* (1) (2), ,i i b j i jS S S
Uncertainty ≤ 36%Uncertainty ≤ 18%
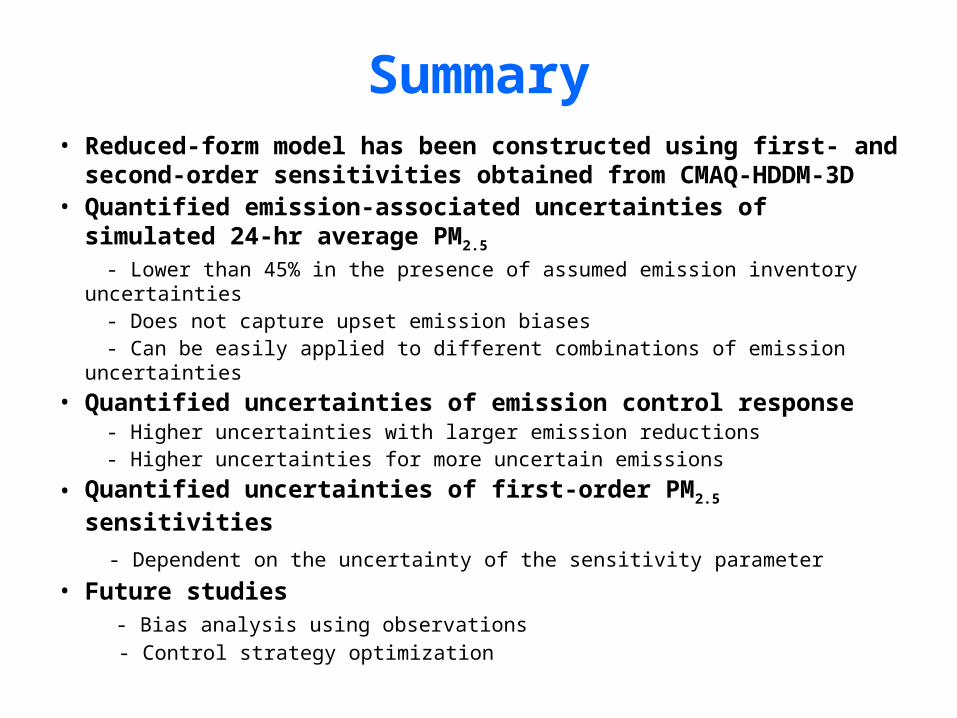
Summary• Reduced-form model has been constructed using first- and
second-order sensitivities obtained from CMAQ-HDDM-3D• Quantified emission-associated uncertainties of simulated 24-hr
average PM2.5
- Lower than 45% in the presence of assumed emission inventory uncertainties - Does not capture upset emission biases - Can be easily applied to different combinations of emission uncertainties• Quantified uncertainties of emission control response - Higher uncertainties with larger emission reductions - Higher uncertainties for more uncertain emissions
• Quantified uncertainties of first-order PM2.5 sensitivities
- Dependent on the uncertainty of the sensitivity parameter
• Future studies - Bias analysis using observations - Control strategy optimization