28
1
1
2
ACKNOWLEDGEMENTS
ACKNOWLEDGEMENTS
This report was researched and written by Ben Kunstman, Eric Schaeffer
and Alexandra Shaykevich of the Environmental Integrity Project with data
analysis provided by Keene Kelderman and Courtney Bernhardt.
THE ENVIRONMENTAL INTEGRITY PROJECT
The Environmental Integrity Project
(http://www.environmentalintegrity.org) is a nonpartisan, nonprofit
organization established in March of 2002 by former EPA enforcement
attorneys to advocate for effective enforcement of environmental laws. EIP
has three goals: 1) to provide objective analyses of how the failure to enforce
or implement environmental laws increases pollution and affects public
health; 2) to hold federal and state agencies, as well as individual
corporations, accountable for failing to enforce or comply with
environmental laws; and 3) to help local communities obtain the protection
of environmental laws.
For questions about this report, please contact EIP Director of
Communications
Tom Pelton at (443) 510-2574 or [email protected].
PHOTO CREDITS:
Images: Cover, Karen Kasmauski, International League of Conservation
Photographers; inside, iStockphoto.
3
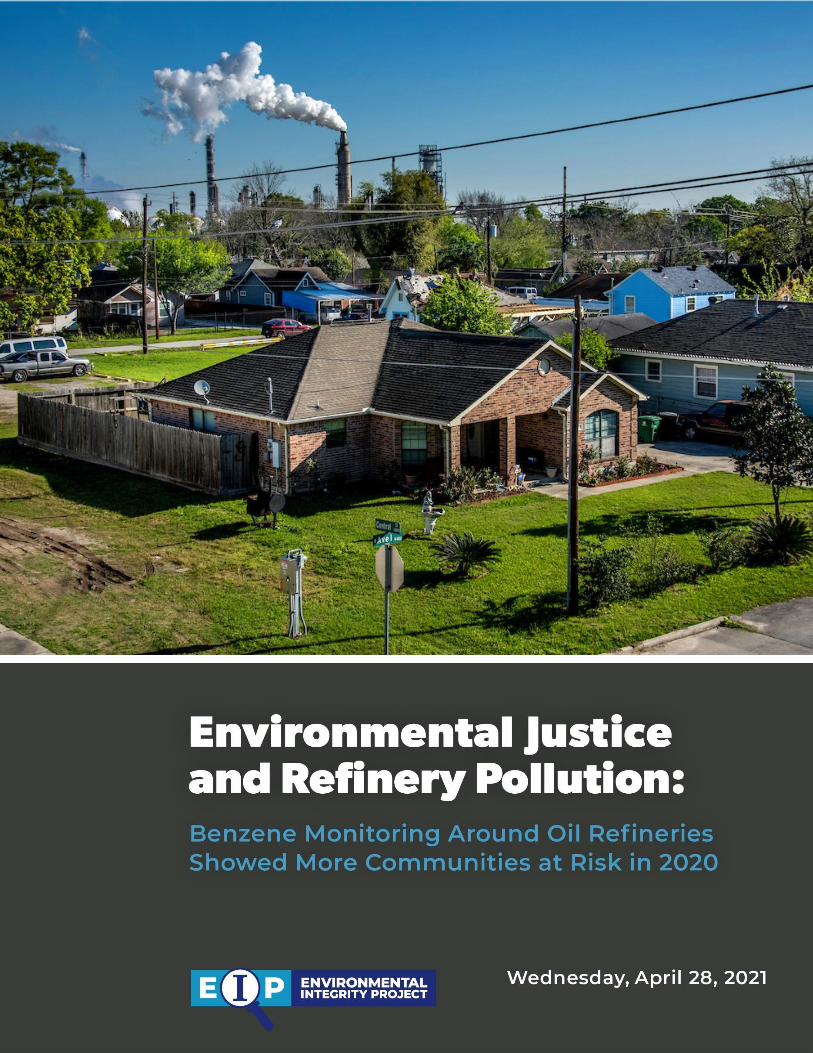
Environmental Justice and Refinery
Pollution
Benzene Monitoring Around Oil Refineries Found More
Communities at Risk in 2020
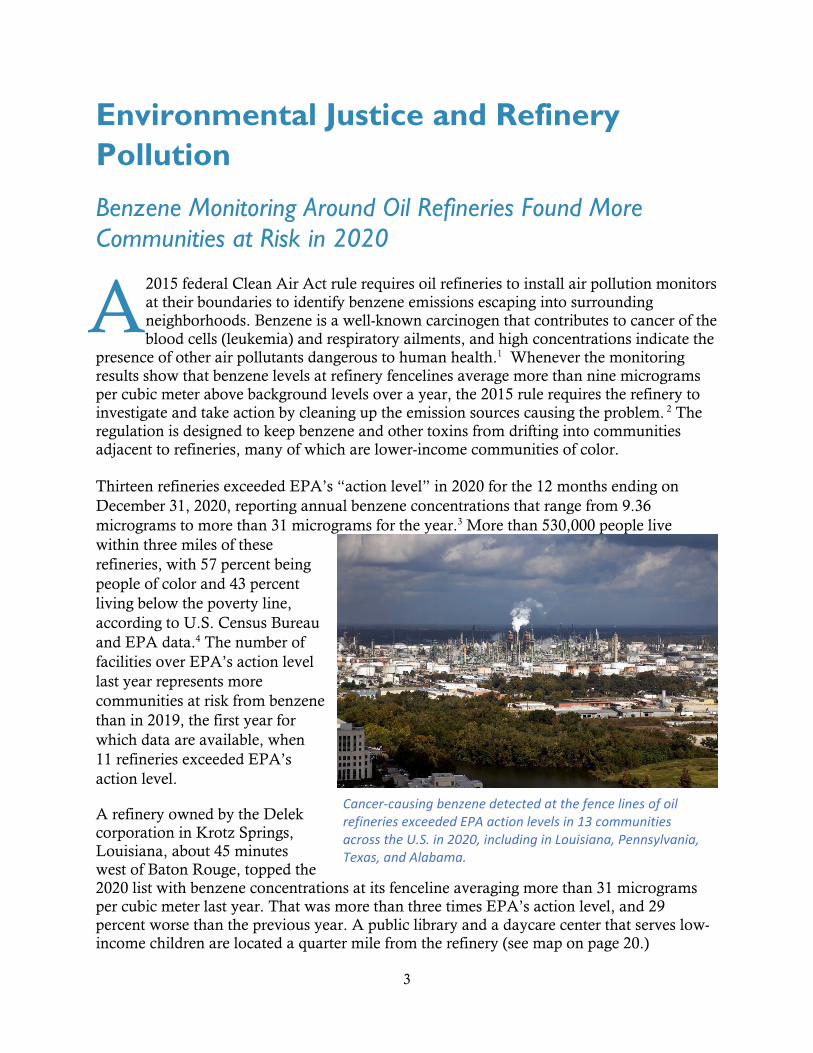
2015 federal Clean Air Act rule requires oil refineries to install air pollution monitors
at their boundaries to identify benzene emissions escaping into surrounding neighborhoods. Benzene is a well-known carcinogen that contributes to cancer of the
blood cells (leukemia) and respiratory ailments, and high concentrations indicate the
presence of other air pollutants dangerous to human health.1 Whenever the monitoring
results show that benzene levels at refinery fencelines average more than nine micrograms
per cubic meter above background levels over a year, the 2015 rule requires the refinery to
investigate and take action by cleaning up the emission sources causing the problem. 2 The
regulation is designed to keep benzene and other toxins from drifting into communities adjacent to refineries, many of which are lower-income communities of color.
Thirteen refineries exceeded EPA’s “action level” in 2020 for the 12 months ending on
December 31, 2020, reporting annual benzene concentrations that range from 9.36
micrograms to more than 31 micrograms for the year.3 More than 530,000 people live
within three miles of these
refineries, with 57 percent being
people of color and 43 percent
living below the poverty line,
according to U.S. Census Bureau
and EPA data.4 The number of
facilities over EPA’s action level
last year represents more
communities at risk from benzene
than in 2019, the first year for
which data are available, when
11 refineries exceeded EPA’s
action level.
A refinery owned by the Delek
corporation in Krotz Springs,
Louisiana, about 45 minutes
west of Baton Rouge, topped the
2020 list with benzene concentrations at its fenceline averaging more than 31 micrograms
per cubic meter last year. That was more than three times EPA’s action level, and 29
percent worse than the previous year. A public library and a daycare center that serves low-income children are located a quarter mile from the refinery (see map on page 20.)
A
Cancer-causing benzene detected at the fence lines of oil refineries exceeded EPA action levels in 13 communities across the U.S. in 2020, including in Louisiana, Pennsylvania, Texas, and Alabama.
4
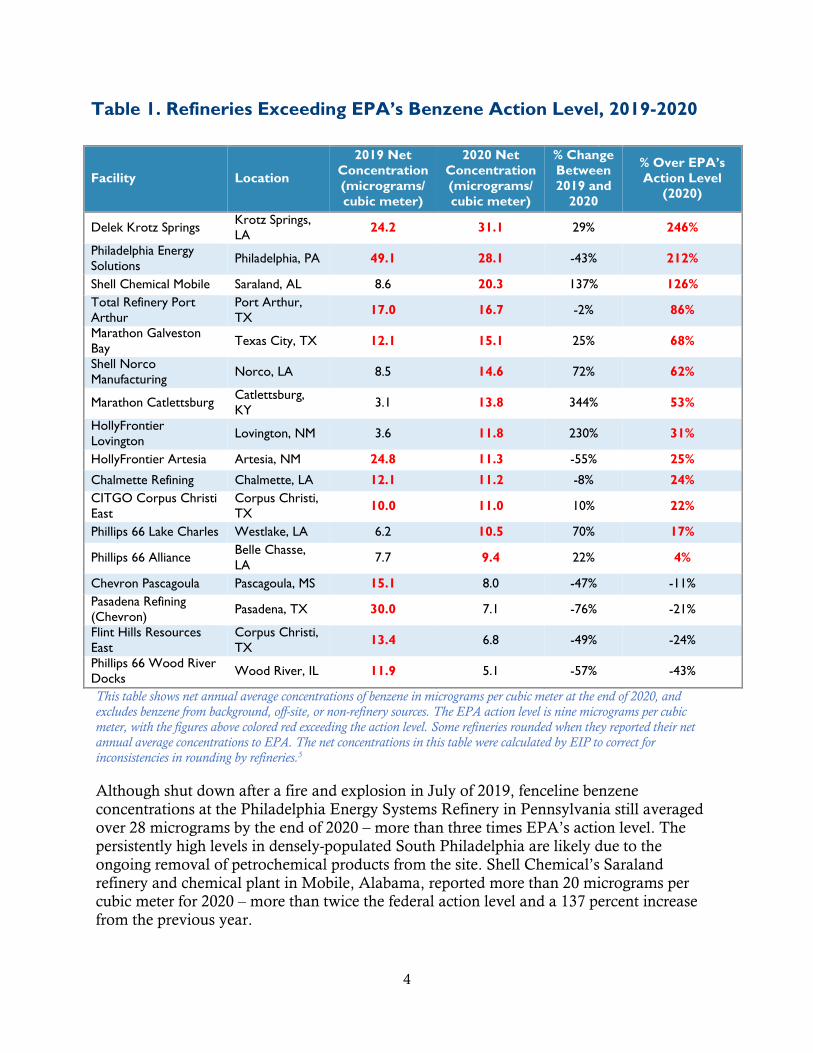
Table 1. Refineries Exceeding EPA’s Benzene Action Level, 2019-2020
Facility Location
2019 Net
Concentration
(micrograms/
cubic meter)
2020 Net
Concentration
(micrograms/
cubic meter)
% Change
Between
2019 and
2020
% Over EPA’s
Action Level
(2020)
Delek Krotz Springs Krotz Springs,
LA 24.2 31.1 29% 246%
Philadelphia Energy
Solutions Philadelphia, PA 49.1 28.1 -43% 212%
Shell Chemical Mobile Saraland, AL 8.6 20.3 137% 126%
Total Refinery Port
Arthur
Port Arthur,
TX 17.0 16.7 -2% 86%
Marathon Galveston
Bay Texas City, TX 12.1 15.1 25% 68%
Shell Norco
Manufacturing Norco, LA 8.5 14.6 72% 62%
Marathon Catlettsburg Catlettsburg,
KY 3.1 13.8 344% 53%
HollyFrontier
Lovington Lovington, NM 3.6 11.8 230% 31%
HollyFrontier Artesia Artesia, NM 24.8 11.3 -55% 25%
Chalmette Refining Chalmette, LA 12.1 11.2 -8% 24%
CITGO Corpus Christi
East
Corpus Christi,
TX 10.0 11.0 10% 22%
Phillips 66 Lake Charles Westlake, LA 6.2 10.5 70% 17%
Phillips 66 Alliance Belle Chasse,
LA 7.7 9.4 22% 4%
Chevron Pascagoula Pascagoula, MS 15.1 8.0 -47% -11%
Pasadena Refining
(Chevron) Pasadena, TX 30.0 7.1 -76% -21%
Flint Hills Resources
East
Corpus Christi,
TX 13.4 6.8 -49% -24%
Phillips 66 Wood River
Docks Wood River, IL 11.9 5.1 -57% -43%
This table shows net annual average concentrations of benzene in micrograms per cubic meter at the end of 2020, and excludes benzene from background, off-site, or non-refinery sources. The EPA action level is nine micrograms per cubic meter, with the figures above colored red exceeding the action level. Some refineries rounded when they reported their net annual average concentrations to EPA. The net concentrations in this table were calculated by EIP to correct for inconsistencies in rounding by refineries.5
Although shut down after a fire and explosion in July of 2019, fenceline benzene
concentrations at the Philadelphia Energy Systems Refinery in Pennsylvania still averaged
over 28 micrograms by the end of 2020 – more than three times EPA’s action level. The
persistently high levels in densely-populated South Philadelphia are likely due to the
ongoing removal of petrochemical products from the site. Shell Chemical’s Saraland
refinery and chemical plant in Mobile, Alabama, reported more than 20 micrograms per cubic meter for 2020 – more than twice the federal action level and a 137 percent increase
from the previous year.
5
The number of refineries with annual benzene concentrations above EPA’s action level in
2020 included five in Louisiana (Chalmette, Phillips 66 Lake Charles, Phillips 66 Alliance,
Shell Norco, and Delek Krotz Springs) three in Texas (Total Port Arthur, Marathon Galveston Bay, and Citgo Corpus Christi East), two in New Mexico (HollyFrontier
Lovington and HollyFrontier Artesia), and one in Kentucky (Marathon Catlettsburg).
It should be noted that the figures for all of the refineries in Table 1 are net annual benzene
levels – not the actual benzene levels – because the federal regulations allow refineries to
exclude “background” concentrations of benzene in their calculations, as well as emissions
from benzene storage tanks and other non-refining equipment and off-site facilities.
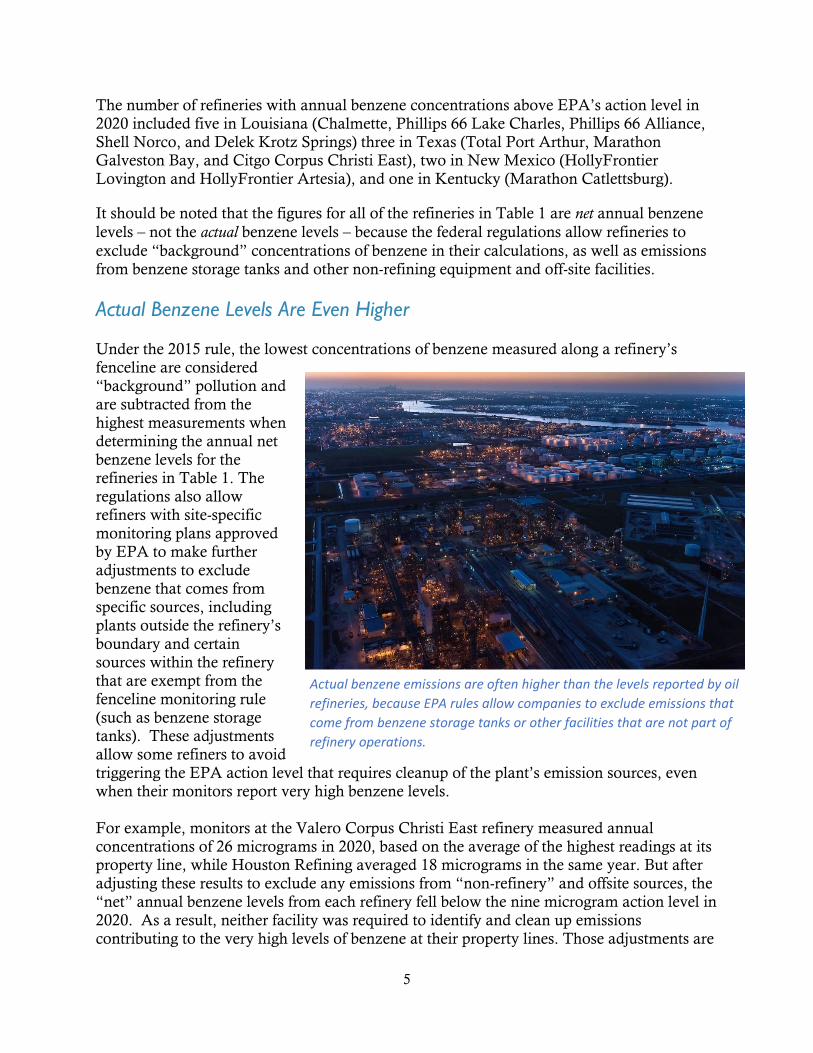
Actual Benzene Levels Are Even Higher
Under the 2015 rule, the lowest concentrations of benzene measured along a refinery’s
fenceline are considered
“background” pollution and
are subtracted from the
highest measurements when
determining the annual net
benzene levels for the refineries in Table 1. The
regulations also allow
refiners with site-specific
monitoring plans approved
by EPA to make further
adjustments to exclude
benzene that comes from specific sources, including
plants outside the refinery’s
boundary and certain
sources within the refinery
that are exempt from the
fenceline monitoring rule
(such as benzene storage tanks). These adjustments
allow some refiners to avoid
triggering the EPA action level that requires cleanup of the plant’s emission sources, even
when their monitors report very high benzene levels.
For example, monitors at the Valero Corpus Christi East refinery measured annual
concentrations of 26 micrograms in 2020, based on the average of the highest readings at its property line, while Houston Refining averaged 18 micrograms in the same year. But after
adjusting these results to exclude any emissions from “non-refinery” and offsite sources, the
“net” annual benzene levels from each refinery fell below the nine microgram action level in
2020. As a result, neither facility was required to identify and clean up emissions
contributing to the very high levels of benzene at their property lines. Those adjustments are
Actual benzene emissions are often higher than the levels reported by oil
refineries, because EPA rules allow companies to exclude emissions that
come from benzene storage tanks or other facilities that are not part of
refinery operations.

6
based on methodologies approved by EPA. But from a public health perspective, what
matters to nearby communities are the actual benzene levels at the perimeter of refineries
close to their neighborhoods, regardless of where they come from.
Table 2 below presents the actual annual benzene concentrations based on the
measurements for 17 refineries, as well as the highest short-term (two-week) concentration
that each reported for the year. This data has not been adjusted downward to exclude
emissions from background, off-site, or non-refinery sources.
Table 2. Actual Benzene Concentrations and Nearby Populations, 2020
Location
Actual Benzene Levels
(micrograms per cubic
meter)
Population Within 3 Miles
Facility
Highest
2-week
Avg.
Annual Average
Concentration
Total
Residents
% People
of Color6
% Below
Poverty
Level
Delek Krotz Springs (LA) 114.0 31.6 1,280 3% 43.1%
Philadelphia Energy Solutions
(PA) 190.0 28.8 306,335 61% 45.1%
Valero Corpus Christi East (TX) 386.0 26.0 38,223 87% 58.7%
Shell Chemical Mobile Saraland
(AL) 92.4 21.0 18,229 31% 43.8%
Marathon Galveston Bay Texas
City (TX) 40.6 19.6 36,328 57% 38.8%
Houston Refining LP (TX) 98.0 18.0 86,718 89% 55.7%
Total Refinery Port Arthur (TX) 38.1 17.8 24,375 42% 37.3%
Shell Norco Manufacturing
Complex (LA) 79.3 15.3 12,499 30% 24.0%
Marathon Catlettsburg Refining
(KY) 166.0 14.1 11,538 3% 44.6%
HollyFrontier Lovington (NM) 210.0 14.0 120 42% 15.8%
HollyFrontier Artesia (NM) 31.0 12.7 13,522 54% 35.4%
CITGO Corpus Christi East (TX) 47.0 11.9 40,616 87% 59.7%
Chalmette Refining (LA) 57.5 11.7 56,803 55% 33.5%
Phillips 66 Lake Charles Westlake
(LA) 49.0 11.2 11,255 20% 34.5%
Phillips 66 Alliance Belle Chasse
(LA) 54.5 10.5 700 50% 25.4%
Flint Hills Resources Corpus
Christi West (TX) 51.8 9.4 6,893 64% 37.7%
Shell Deer Park (TX) 32.1 9.2 31,653 41% 25.0%
TOTAL 697,087 62% 44.7%
Benzene levels are expressed in micrograms per cubic meter. The benzene sampling concentrations above reflect actual
annual measurements as of December 31, 2020, not "net" concentrations that refineries use to assess compliance with EPA’s
action level of nine micrograms. Demographic data is from EPA’s Enforcement and Compliance History Online. The totals
reflect the percentage of total population that are people of color or living below the poverty line.

7
Short-Term Benzene Concentrations May Threaten Public Health
Short-term benzene spikes are alarmingly high at some refineries, which report the average
benzene concentration for each two-week monitoring period. The National Institute for
Occupational Safety and Health (NIOSH) advises limiting worker exposure to no more than 319 micrograms (100 parts per billion) over a 10-hour work period.7 The Chevron refinery
in Pasadena, Texas, recorded benzene concentrations averaging 77 percent higher than that
-- 565 micrograms or 177 ppb -- for the two-week period ending October 30, 2019. Valero
Corpus Christi East reported 386 micrograms (121 ppb) for the two weeks ending on May
27, 2020, while claiming that the benzene came from offsite sources. Other refineries
reported two-week concentrations that are high enough to suggest that benzene could have
exceeded the NIOSH limit for one or more 10-hour periods, as benzene concentrations can vary widely from one hour to the next within a two-week period.
The federal Agency for Toxic Substances Disease Registry has identified a “minimal risk
level” of 29 micrograms (9 ppb) for inhalation exposures up to 14 days, as higher
concentrations may pose risks to the immune system.8 This acute inhalation minimal risk
level is defined as the exposure to benzene that is likely to be without an appreciable risk of
adverse non-cancer effects. At least 23 refineries across the U.S. reported exceeding this threshold for one or more two-week periods between January 1 and December 31 of 2020.
See Appendix A for the list.
The 2015 Clean Air Act rule requires no response to these short-term events. The action
level is triggered only when benzene emissions from sources within the refinery that are
subject to the rule result in annual concentrations that exceed “background” levels by nine micrograms. But EPA has plenty of authority – under Section 114 of the Clean Air Act, for
example – to investigate these events, require additional monitoring, determine whether the
responsible parties are violating any other emission limits that apply to benzene and if so, to
order cleanups.
Ground Zero for Environmental Justice
If this broader category of refineries – those with actual emissions over the EPA action level
– are taken into account, the nearby populations put at risk are even larger than the 530,000
people mentioned earlier. Nearly 700,000 people live within three miles of the 17 refineries
reporting actual annual fenceline benzene concentrations above nine micrograms per cubic
meter (Table 2).9 People of color account for nearly 62 percent of this total, while nearly 45 percent live on incomes below the poverty level (the percentages at each location vary). In
contrast, as of 2019 people of color made up about 40 percent of the total U.S. population,10
while 10.5 percent of the national population earns incomes below the poverty line.11 Many
of the surrounding neighborhoods lie less than a mile from some of the largest benzene
sources. These are the kinds of communities hit especially hard by COVID-19, where
residents who lack affordable health care already suffer from the kind of ailments that make
them especially vulnerable to toxic air pollutants like benzene. To get an idea of how close

8
people live near these pollution hotspots, please consult the maps on pages 18-22, which
show how close schools and libraries are to the refineries. An example is in Corpus Christi,
below.
Population Surrounding Valero Refinery in Corpus Christi, TX
The people who live near plants like the one in Corpus Christi are not necessarily exposed
to the benzene levels found at a refinery’s property line. Downwind concentrations may
vary according to wind direction, weather conditions, emissions from other sources, and
other environmental variables. But the presence of benzene in such high concentrations so
close to places where so many people live should be a cause for concern. The Biden
Administration has pledged to make environmental justice a reality and not just a slogan.
The EPA can help keep that promise by doing more to protect the communities that
surround these refineries from dangerous and potentially deadly air pollutants.
More than 38,000 people live within three miles of the Valero refinery in Corpus Christi, with 87 percent of
them people of color and 59 percent living below the poverty line. As shown with the blue marker, a public
school – Oak Park Elementary School – is located one mile south of an air pollution monitor that recorded a
dangerous spike in benzene concentrations in May of 2020. Many homes and parks are even closer.

9
Benzene and the Fenceline Monitoring Rule
Benzene is a potent carcinogen and one of the most dangerous pollutants released by oil
refineries and petrochemical plants. Because it is highly volatile and prone to leak from
storage tanks, wastewater impoundments, and other sources where emissions are hard to
measure, a 2015 Clean Air Act rule required each refinery to install air pollution monitors (sorbent tube monitors) along their plant boundary that measure the average benzene
concentrations for each two-week sampling period. That average is determined based on the
amount of benzene that has accumulated in the tubes after 14 days.12
The benzene levels reported every two weeks reflect the difference between the highest and
the lowest concentrations measured anywhere along the fenceline for that sampling period.
The lowest measurements are subtracted because they are assumed to represent “background” levels of pollution from outside the refinery. Whenever the resulting net
concentrations exceed nine micrograms per cubic meter over any 12-month period, the
refinery must investigate the root cause and clean up any emission sources causing the
problem. The goal is to identify and repair leaks quickly and to minimize public exposure
to benzene and other hard-to-measure toxins that may drift across a plant’s property lines
and into neighborhoods that may be right across the street.
Benzene contributes to various forms of leukemia that suppress the formation of healthy
blood cells, weaken immune systems, and make people susceptible to other diseases. EPA
estimates that inhaling benzene at a concentration as low as 1.3 micrograms per cubic meter
over a lifetime could result in up to one additional cancer death per 100,000 people exposed
to that level.13 As benzene levels rise, those risks increase proportionately. For example, the
lifetime exposure to ten times that, or as low as 13 micrograms per cubic meter, can result in
one additional cancer death per 10,000 (using EPA’s low-dose linearity concentrations at specified risk levels).
The 2015 rule also recognized that significant concentrations of benzene also may signal the
presence of a large cloud of other toxins – like formaldehyde, naphthalene, ethyl benzene,
toluene, or xylene – that either present their own cancer risks, attack respiratory systems, or
contribute to smog formation.14 The cleanup requirements that are triggered when annual
fenceline benzene exceeds nine micrograms are intended to reduce emissions of those associated pollutants as well.
Annual Benzene Concentrations Exceed EPA’s Action Level at 13 Refineries
This report identifies refineries where annual benzene concentrations exceeded the nine
microgram action level at the end of the 2019 and 2020 calendar years. The 2015 rule set an
action level based on a “rolling annual average” that is recalculated every two weeks. For
example, the action level would by triggered by annual benzene concentrations averaging 10
micrograms over the 26 two-week sampling periods ending on October 14. Annual
concentrations would be recalculated on October 28 and at subsequent fourteen-day
intervals, based on the results of the most recent 26 two-week sampling periods.
10
As discussed on page 5, these are net or adjusted numbers that do not include background
levels of benzene or emissions from storage tanks and nearby facilities. The Delek Refinery
in Krotz Spring, Louisiana, had consistently high benzene concentrations. For the 50 two-
week sampling periods reported from this facility since early 2019, only ten registered below
EPA’s action level (nine micrograms per cubic meter of air). It has also had large
concentration spikes, registering net benzene concentrations as high as 106.5 and 113.5
micrograms per cubic meter for the sampling periods ending on April 6, 2020 and May 4,
2020, respectively, and peaking at 153 micrograms per cubic meter of air for the sampling
period ending on December 17, 2019. Net concentrations decreased in the most recent
quarter of 2020, with each sampling period between October through December registering
below the nine microgram per cubic meter threshold.
High benzene concentrations have persisted at the former Philadelphia Energy Solutions
(PES) refinery in Pennsylvania (shown in Table 1), where annual benzene levels were more
than three times higher than the action level more than a year the plant closed. Short-term
emissions in 2020 peaked in the first quarter with concentrations that averaged 128 and 189
micrograms over the two-week periods ending on January 15 and February 12, respectively. Even after the site was sold to developers last June, one of the monitors recorded a 14-day
average of 80 micrograms in late July. These high concentrations are partly the result of
emissions released as tanks are drained and gasoline and other petrochemical products are
removed from the site.15
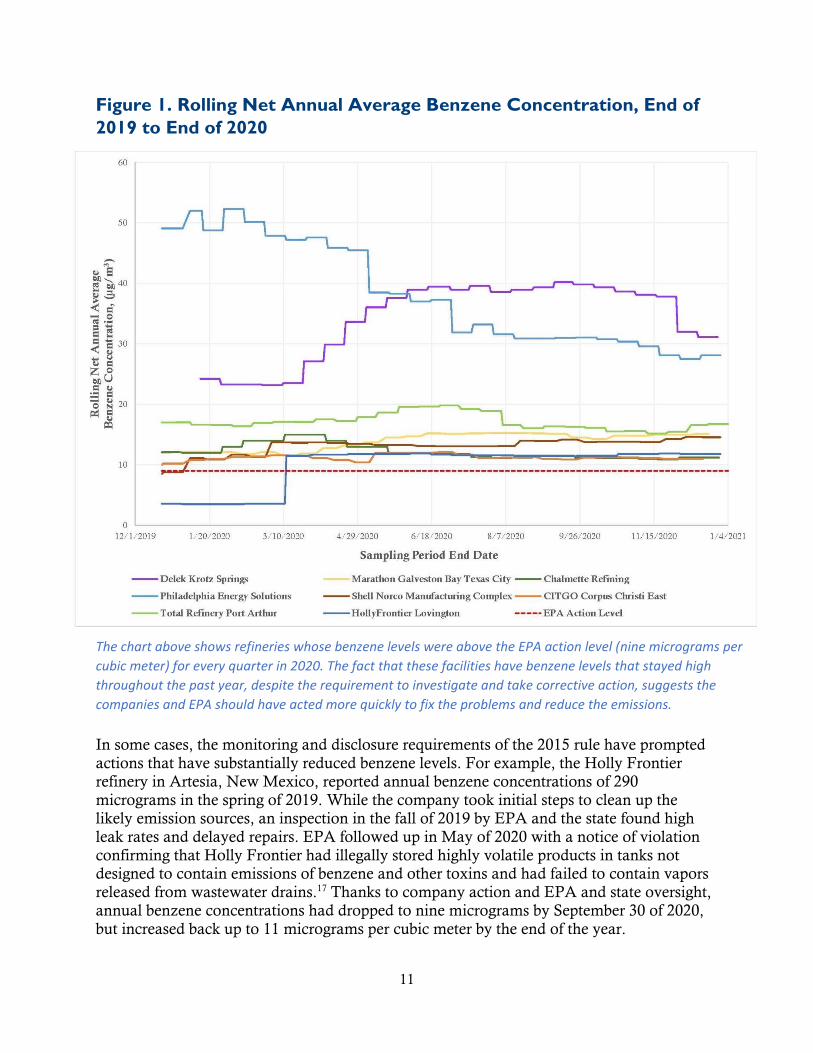
All of the refineries in Table 1 are required to investigate the source of these high benzene
levels and take corrective action, e.g., by identifying and repairing leaks from tanks or other
equipment. Yet monitoring data shows that annual concentrations of benzene have
continued to exceed the 9 microgram action level for eight of these thirteen refineries at the
end of every quarter in 2020.16 As an example, Delek Krotz Springs measured an annual
average benzene concentration of 23.5 micrograms at the end of the first quarter of 2020
(the 26 monitoring periods from March 26, 2019 to March 23, 2020), increased up to 39.5
micrograms for the rolling annual average at the end of the second quarter (from July 2,
1990 to June 30, 2020), and had a rolling annual average of 40.2 micrograms at the end of
the third quarter (September 24, 2019 to September 21, 2020). These rolling annual average
benzene concentrations are shown below in Figure 1.
11
Figure 1. Rolling Net Annual Average Benzene Concentration, End of
2019 to End of 2020
In some cases, the monitoring and disclosure requirements of the 2015 rule have prompted
actions that have substantially reduced benzene levels. For example, the Holly Frontier
refinery in Artesia, New Mexico, reported annual benzene concentrations of 290
micrograms in the spring of 2019. While the company took initial steps to clean up the
likely emission sources, an inspection in the fall of 2019 by EPA and the state found high
leak rates and delayed repairs. EPA followed up in May of 2020 with a notice of violation
confirming that Holly Frontier had illegally stored highly volatile products in tanks not designed to contain emissions of benzene and other toxins and had failed to contain vapors
released from wastewater drains.17 Thanks to company action and EPA and state oversight,
annual benzene concentrations had dropped to nine micrograms by September 30 of 2020,
but increased back up to 11 micrograms per cubic meter by the end of the year.
The chart above shows refineries whose benzene levels were above the EPA action level (nine micrograms per
cubic meter) for every quarter in 2020. The fact that these facilities have benzene levels that stayed high
throughout the past year, despite the requirement to investigate and take corrective action, suggests the
companies and EPA should have acted more quickly to fix the problems and reduce the emissions.
12
Other plants, such as Marathon Galveston Bay or Total Port Arthur, show little apparent
progress as benzene concentrations averaged over 12 months continue to exceed nine
micrograms from one quarter to the next. EPA and states need to step in where these high annual concentrations persist, and they should require refineries to accelerate their efforts to
find and fix the emission sources causing this pollution.
The annual benzene levels at the Holly Frontier refinery in Lovington, New Mexico,
apparently resulted from a large offsite oil spill in the spring of 2020. Valero Corpus Christi
and Houston Refining also reported very high concentrations in 2020 that supposedly
reflected emissions from other nearby sources.
Site-Specific Monitoring Plans May Obscure High Benzene Levels The annual benzene levels at two other Texas refineries (Houston Refining and Valero
Corpus Christi East) are far above the nine microgram action level, according to data from
their fenceline monitors as seen in Table 2. But so far, both have avoided the investigation
and cleanup that would normally follow. This is because they are under “site-specific
monitoring plans” approved by EPA that apparently show that most or all of the benzene
measured at their property lines comes from off-site sources. For example, the monitors at
Valero’s East Refinery in Corpus Christi measured an unadjusted annual average benzene concentration of 26 micrograms at the end of 2020 based on actual fenceline measurements.
But under Valero’s site-specific plan, the reported annual results drop to no more than 4
micrograms (far below the action level) after excluding the benzene thought to come from
nearby sources.
Annual concentrations at Marathon’s refinery in Galveston Bay averaged 19.6 micrograms
for the year of 2020 based on actual measurements from its monitors. While the annual average was adjusted downward to 14.5 micrograms after excluding background and
benzene from non-refinery sources, the result was still high enough to exceed the nine
microgram action level.
To be fair, the Clean Air Act rule is designed to push refiners to clean up emission sources
under their control when they are responsible for elevating benzene concentrations above
the action level. No doubt it is challenging to allocate the responsibility for fenceline benzene concentrations in industrial neighborhoods crowded with petrochemical plants.
But regardless of who is at fault, it is the government’s obligation to respond quickly when
the data demonstrates a potential threat to public health.
Also, although not widely understood, the 2015 rule applies only to benzene released by
specific emission sources within refineries that are subject to “Subpart CC” of the
regulations that apply to hazardous air pollutants under Section 112 of the Clean Air Act. For example, some refineries also produce benzene that is stored onsite in tanks before it
can be sold to chemical manufacturers. While subject to other Clean Air Act rules, such as
Hazardous Organic National Emission Standards for Hazardous Air Pollutants,18 these
particular types of storage tanks are not covered by the Subpart CC regulations that
established the benzene fenceline monitoring requirements.
13
Not surprisingly, several refineries have proposed reducing the benzene concentrations at
their fencelines to account for emissions from these tanks and other sources that are onsite but exempt from Subpart CC. EPA has already approved site-specific monitoring plans that
exclude emissions from sources that are managed onsite but exempt from Subpart CC.
CITGO’s East refinery in Corpus Christi submitted a similar proposal in November of 2020
that is still pending before EPA.19
These exemptions are the consequence of EPA’s approach to regulating hazardous air
pollutants, which has established separate standards for each of the industrial categories that may be found within the same petrochemical plant. For example, while Subpart CC
regulates emissions from “petroleum refining process units,” Subparts F, G, H, and I cover
emissions from the manufacturing and storage of chemical products at the same facility.
But the fenceline monitoring rules are meant to protect public health by requiring refineries
to investigate and clean up emission sources whenever net annual benzene levels exceed
nine micrograms. That objective is obviously undercut when refiners can stay below that
action level by adjusting monitoring results to exclude any benzene from tanks and other sources that operate within the refinery, but are not regulated under Subpart CC.
Short-Term Benzene Concentrations Dangerously High at Some Refineries The National Institute of Occupational Safety and Health (NIOSH) recommends that
workers limit exposure to no more than 100 parts per billion (ppb) for any 10-hour period
unless respirators are in use.20 The Valero Corpus Christi East and Chevron Pasadena
monitors show that those limits were exceeded for a full two-week average at each plant.
Benzene at one of the Valero monitors averaged 121 ppb (386 micrograms) during the two
weeks between May 13 and May 27 of 2020, although Valero adjusted that to zero after
concluding that all of that benzene came from sources outside its property line. The Chevron Pasadena Refinery outside of Houston reported that concentrations averaged 178
ppb (567 micrograms) at one of its fenceline monitors between October 16 and October 30
of 2019. Again, these numbers reflect the average benzene concentration over 14 days,
whereas the NIOSH limits apply for much shorter periods of time.
People living near refineries are not necessarily exposed to the amount of benzene measured
at the plant’s boundaries, as that may depend on wind direction, weather conditions, emissions from other sources, and other variables. But when a refinery monitor reports that
the average benzene level over two weeks is higher than the amount that workers should be
exposed to for more than 10 hours without respirators, that should cause alarm. Keep in
mind that the NIOSH recommendations were developed to protect healthy workers, not
children, the elderly, or those suffering from ailments made worse by air pollution.
Benzene levels can vary widely within a few hours or less. For example, over the course of a
two-week sampling period, concentrations could be well over the average for one or more 10-hour periods, then fall to much lower levels in between. Determining the average
benzene concentration over a two-week period is not enough to know whether the NIOSH
10-hour limits (or any short-term limit) has been breached.
14
While the 2015 rule Clean Air Act rule requires refiners to investigate and take corrective
action whenever the annual action level is exceeded, no response is required even when
benzene concentrations averaged over two weeks are much higher than the amount that workers should not be exposed to for more than 10 hours unless they are wearing
respirators. Whether through regulation or by exercising its enforcement authority EPA
should, at a minimum, require more frequent, or real-time sampling when two-week
benzene averages are exceptionally high.
Where a refinery claims that high benzene levels at its fenceline came from a neighboring
facility, EPA should investigate the off-site source to determine whether any laws have been violated or what action can be taken to prevent recurrence. For example, Motiva’s refinery
in Port Arthur, Texas, reported that benzene levels averaged 122 micrograms at one of its
monitors between November 28 and December 12, 2019, due to emissions from an ethylene
production facility nearby. That is very likely Motiva’s own chemical plant, which disclosed
the release of benzene emissions from a “process upset” to the state of Texas within the
same 14-day period.
Impact of Short-Term Exposure to Benzene on Vulnerable Populations
The NIOSH standards referenced earlier are designed to protect healthy workers, and not
vulnerable populations such as young children, the elderly, those suffering from respiratory diseases or immune disorders and others who may be particularly vulnerable to airborne
carcinogens like benzene. The Agency for Toxic Substances Disease Registry (ATSDR) has
established a “Minimal Risk Level” of 29 micrograms (9 ppb) for short-term exposures that
last no more than fourteen days. This acute inhalation minimal risk level is defined as the
exposure to benzene that is likely to be without an appreciable risk of adverse noncancerous
effects, which for benzene would pose risks to the immune system.21
Appendix A identifies 23 refineries where actual fenceline benzene levels have averaged at
least 29 micrograms per cubic meter over one or more two-week periods in 2020. Benzene
levels at seven of these plants highlighted in Appendix A have exceeded 90 micrograms per
cubic meter, or more than three times the ATSDR Minimal Risk Level. More frequent
monitoring at such facilities might identify periods when concentrations exceed the 10-hour
NIOSH standard.
Environmental Justice: Still Waiting
More than 2,600 people live within a mile of the Valero East refinery in Corpus Christi, and
nine out of 10 live in households where income falls below the poverty line. Another 1,600 people live less than a mile from the Chevron Pasadena plant, more than half on incomes
below the poverty level. Eighty percent of the residents in both of these communities are
Latino. Air pollution can further exacerbate environmental justice issues in these fenceline
communities. These issues include lack of access to affordable health care, and higher rates
of asthma, COVID-19, immune disorders, and other ailments that put the community at
risk.
15
Table 2 identifies characteristics of the population surrounding the 17 refineries where
actual annual benzene concentrations exceeded nine micrograms per cubic meter at the end
of 2020. As stated previously, nearly 700,000 people live within three miles of these plants, in numbers that range from 120 near the remote HollyFrontier Lovington refinery in New
Mexico to the more than 300,000 people surrounding the now-closed Philadelphia Energy
Solutions refinery in Pennsylvania.
U.S. Census data tell a familiar story. Overall, nearly two thirds of those living within three
miles of these seventeen refineries are people of color, predominately African American or
Latino. Nearly half live below the poverty line, compared to the national average of 10.5 percent.22 President Biden has promised to make environmental justice a reality and not just
a slogan. These neighborhoods are a good place to start.
Recommendations:
1. As of the end of 2020, at least 13 refineries reported that annual benzene levels
exceed EPA’s nine microgram action level under federal regulations. Seven of these
same plants also exceeded this 12-month action level at the end of 2019. EPA needs
to investigate why such high benzene concentrations persist at these plants and take
enforcement action if needed to reduce emissions from the sources responsible.
2. Four more refineries that reported actual annual benzene concentrations of more
than nine micrograms did not exceed EPA’s action level, because some or most of
the benzene measured was attributed to “background” or off-site sources of
pollution. Many refineries operate in close proximity to other petrochemical plants, which means that some of the benzene that shows up at one refinery’s property line
may have come from an upwind chemical plant. But in such cases, EPA needs to
identify the offsite emission sources and bring them under control.
3. NIOSH recommends that workers wear respirators whenever benzene levels average
100 ppb (or 319 micrograms per cubic meter) over a 10-hour workday. At least two
refineries in Texas exceeded these limits at their fencelines for 14 days, including one
in the fourth quarter of 2019. EPA should respond immediately when benzene levels
are that high, especially when thousands of people who are especially vulnerable to air pollution live nearby.
4. Seven refineries each reported benzene concentrations that averaged more than 90
micrograms over two-week periods in 2020. Benzene is highly volatile and
concentrations may fluctuate widely within a few short hours, depending on the
wind, weather, emission levels and other variables. At a minimum, EPA should
require these refineries to monitor benzene at shorter intervals to determine whether
the 10-hour NIOSH advisory or other short-term health-based standards are being
exceeded, and to warn nearby communities when these pollution spikes are
16
happening. The agency should also follow up with enforcement as needed to clean
up emission sources causing the problem.
5. The Clean Air Act exempts some refining-related processes and chemical
manufacturing from the benzene fenceline monitoring requirements, even though these benzene sources operate within the refinery or on adjacent properties. To
protect vulnerable communities downwind, the fenceline benzene monitoring and
cleanup requirements should apply to all petrochemical plants and other major
sources of benzene.
6. Nearly two-thirds of those living within three miles of the 17 refineries with the
highest benzene levels in 2020 are people of color and almost half live below the
poverty line. They may lack access to affordable health care and are more likely to be
plagued by asthma, COVID-19, or other immune deficiencies that make them especially vulnerable to air pollution. The Biden Administration needs to bring
environmental justice to these communities, which have already waited far too long.
7. Anyone who lives near these refineries or who is concerned about the health threats
from air pollution can help by emailing or writing EPA Administrator Michael
Regan and local Congressional representatives to demand strong EPA action to
crack down on benzene emissions.
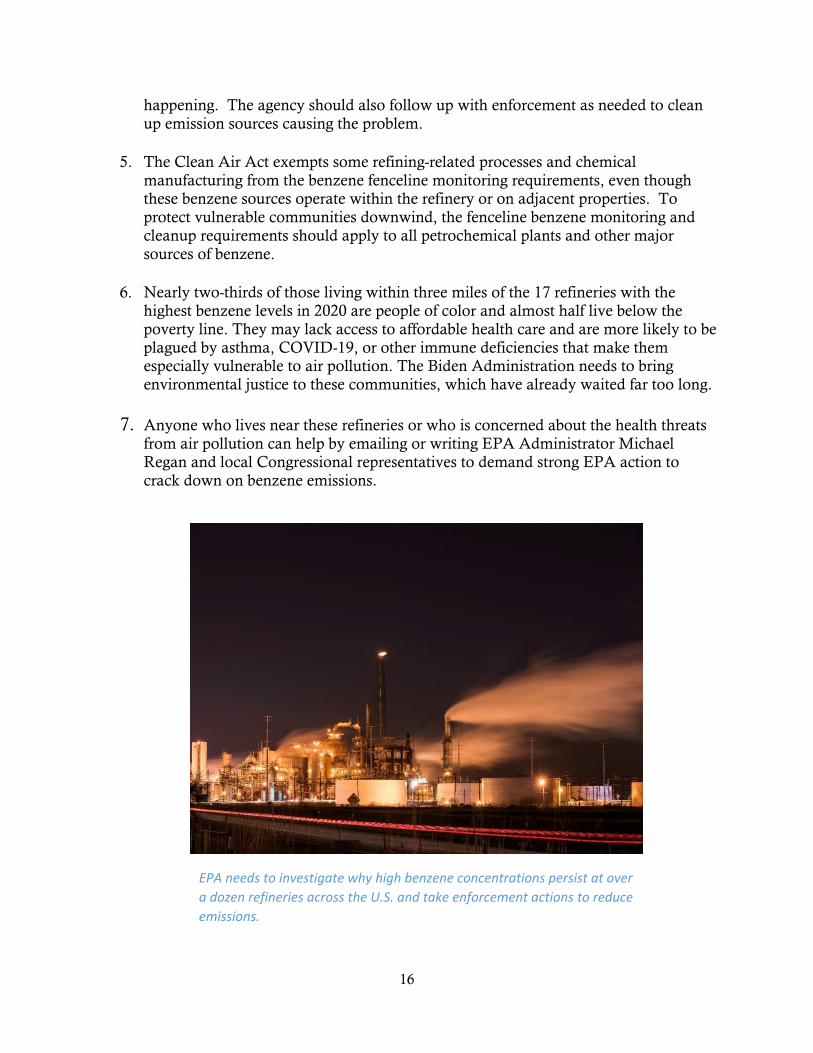
EPA needs to investigate why high benzene concentrations persist at over
a dozen refineries across the U.S. and take enforcement actions to reduce
emissions.

17
Mapping Benzene at Refinery Fencelines:
The Environmental Integrity Project mapped benzene fenceline monitors around five of the
refineries that exceeded the nine microgram per cubic meter “action level” using sampling
point locations provided in the refinery monitoring reports submitted to EPA. This “hot
spot” analysis focused on certain facilities that measured large concentration spikes over
two-week sampling periods above 90 micrograms per cubic meter, or ten-times the action
level concentration. As noted earlier, the actual exposure to benzene in nearby communities
can vary from the concentrations measured at a refinery’s border, depending on factors like
proximity, emissions from non-refinery sources, weather conditions, and wind direction. A
one-mile radius was drawn around each monitor that recorded benzene concentrations
spikes above 90 micrograms one or more times during the fifteen-month period that ended
on December 31, 2020.
We used regional land use data (sources identified in Appendix C) to identify affected
communities living in close proximity to the benzene concentration spikes, which could
potentially be exposed to levels of benzene pollution that exceed the federal acute risk level
for inhalation. We also mapped potential locations of concern for inhalation exposure – like
schools, libraries, and hospitals – where children or those suffering from preexisting medical
conditions may have potential inhalation exposure pathways to benzene pollution and other
hazardous air pollutants in the air.
18
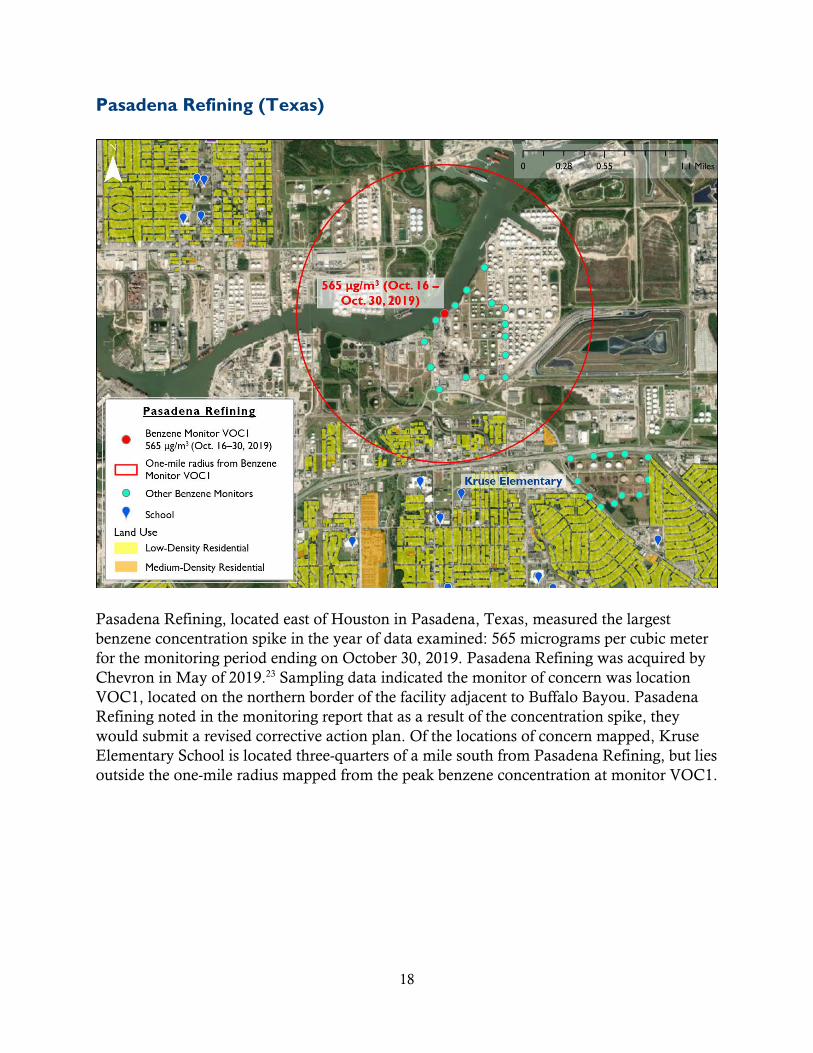
Pasadena Refining (Texas)
Pasadena Refining, located east of Houston in Pasadena, Texas, measured the largest
benzene concentration spike in the year of data examined: 565 micrograms per cubic meter
for the monitoring period ending on October 30, 2019. Pasadena Refining was acquired by
Chevron in May of 2019.23 Sampling data indicated the monitor of concern was location
VOC1, located on the northern border of the facility adjacent to Buffalo Bayou. Pasadena
Refining noted in the monitoring report that as a result of the concentration spike, they
would submit a revised corrective action plan. Of the locations of concern mapped, Kruse
Elementary School is located three-quarters of a mile south from Pasadena Refining, but lies
outside the one-mile radius mapped from the peak benzene concentration at monitor VOC1.
19
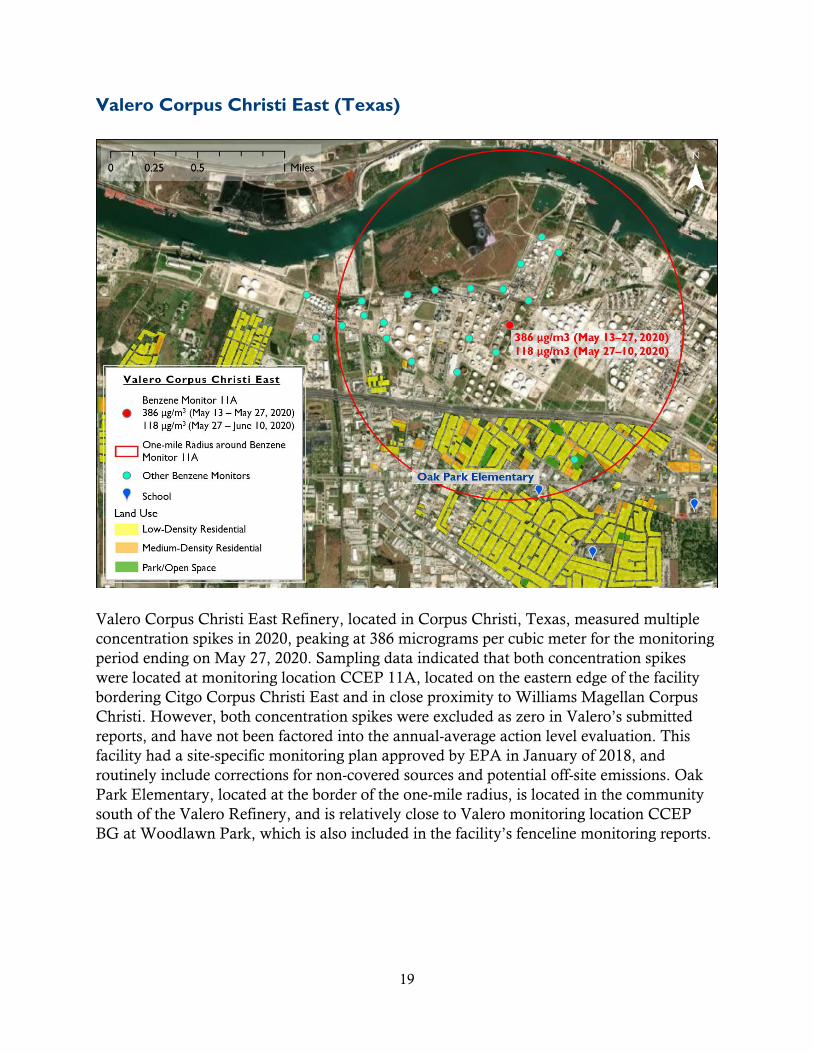
Valero Corpus Christi East (Texas)
Valero Corpus Christi East Refinery, located in Corpus Christi, Texas, measured multiple
concentration spikes in 2020, peaking at 386 micrograms per cubic meter for the monitoring
period ending on May 27, 2020. Sampling data indicated that both concentration spikes
were located at monitoring location CCEP 11A, located on the eastern edge of the facility
bordering Citgo Corpus Christi East and in close proximity to Williams Magellan Corpus
Christi. However, both concentration spikes were excluded as zero in Valero’s submitted
reports, and have not been factored into the annual-average action level evaluation. This
facility had a site-specific monitoring plan approved by EPA in January of 2018, and
routinely include corrections for non-covered sources and potential off-site emissions. Oak
Park Elementary, located at the border of the one-mile radius, is located in the community
south of the Valero Refinery, and is relatively close to Valero monitoring location CCEP
BG at Woodlawn Park, which is also included in the facility’s fenceline monitoring reports.
20
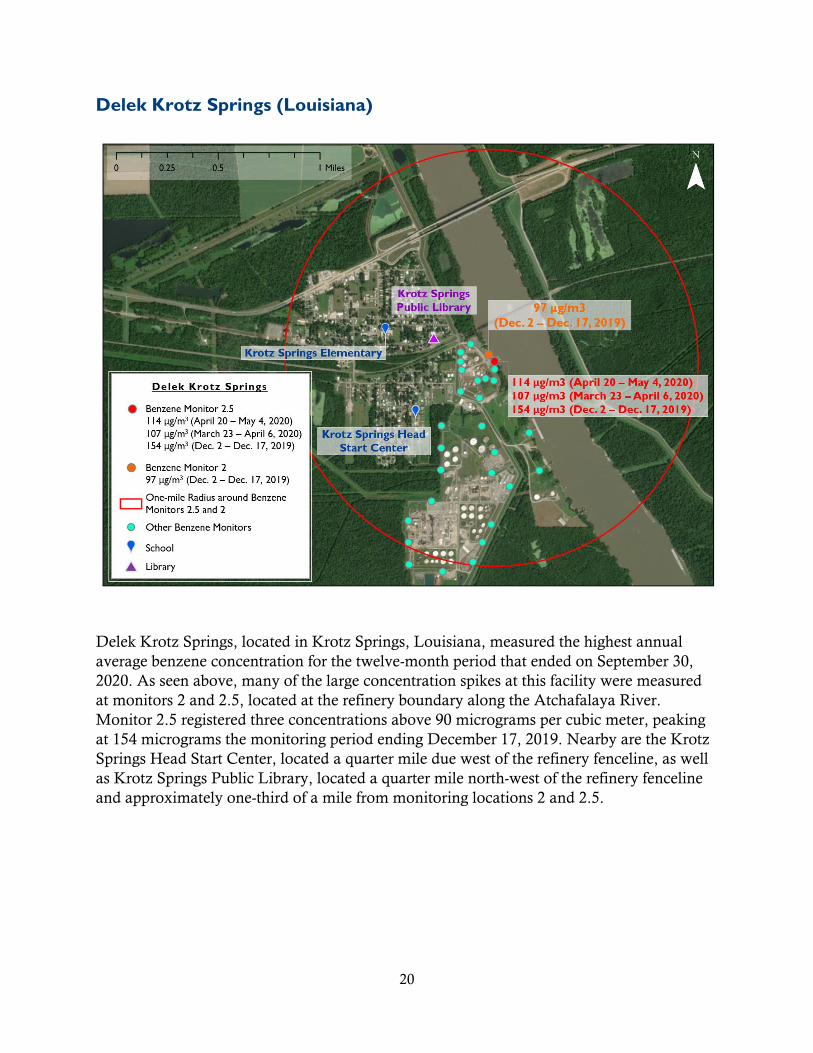
Delek Krotz Springs (Louisiana)
Delek Krotz Springs, located in Krotz Springs, Louisiana, measured the highest annual
average benzene concentration for the twelve-month period that ended on September 30,
2020. As seen above, many of the large concentration spikes at this facility were measured
at monitors 2 and 2.5, located at the refinery boundary along the Atchafalaya River.
Monitor 2.5 registered three concentrations above 90 micrograms per cubic meter, peaking
at 154 micrograms the monitoring period ending December 17, 2019. Nearby are the Krotz
Springs Head Start Center, located a quarter mile due west of the refinery fenceline, as well
as Krotz Springs Public Library, located a quarter mile north-west of the refinery fenceline
and approximately one-third of a mile from monitoring locations 2 and 2.5.
21
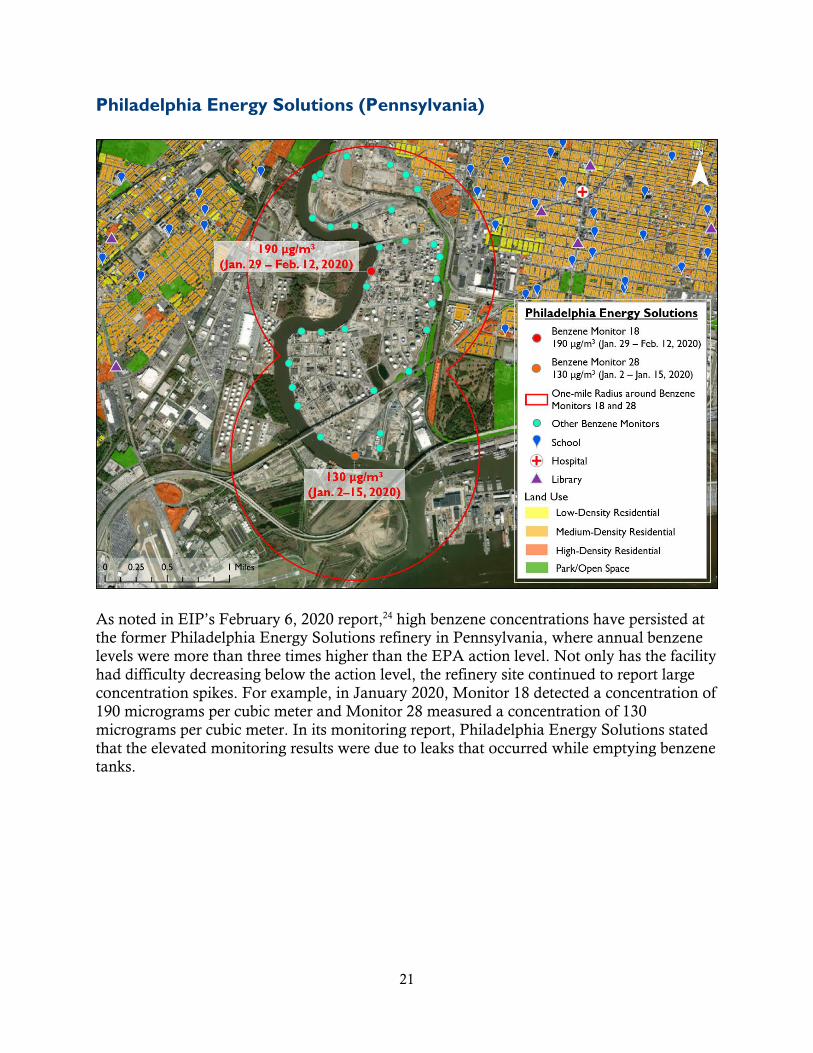
Philadelphia Energy Solutions (Pennsylvania)
As noted in EIP’s February 6, 2020 report,24 high benzene concentrations have persisted at the former Philadelphia Energy Solutions refinery in Pennsylvania, where annual benzene
levels were more than three times higher than the EPA action level. Not only has the facility
had difficulty decreasing below the action level, the refinery site continued to report large
concentration spikes. For example, in January 2020, Monitor 18 detected a concentration of
190 micrograms per cubic meter and Monitor 28 measured a concentration of 130
micrograms per cubic meter. In its monitoring report, Philadelphia Energy Solutions stated
that the elevated monitoring results were due to leaks that occurred while emptying benzene tanks.
22
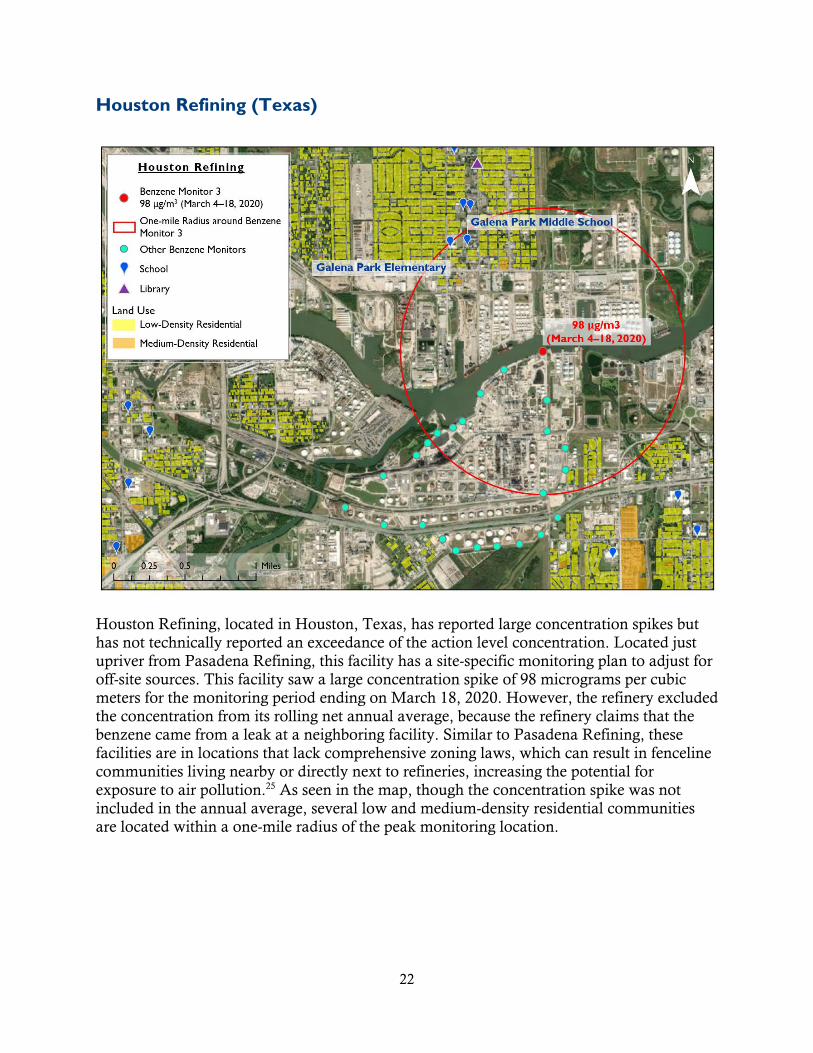
Houston Refining (Texas)
Houston Refining, located in Houston, Texas, has reported large concentration spikes but
has not technically reported an exceedance of the action level concentration. Located just
upriver from Pasadena Refining, this facility has a site-specific monitoring plan to adjust for off-site sources. This facility saw a large concentration spike of 98 micrograms per cubic
meters for the monitoring period ending on March 18, 2020. However, the refinery excluded
the concentration from its rolling net annual average, because the refinery claims that the
benzene came from a leak at a neighboring facility. Similar to Pasadena Refining, these
facilities are in locations that lack comprehensive zoning laws, which can result in fenceline
communities living nearby or directly next to refineries, increasing the potential for
exposure to air pollution.25 As seen in the map, though the concentration spike was not
included in the annual average, several low and medium-density residential communities are located within a one-mile radius of the peak monitoring location.
23
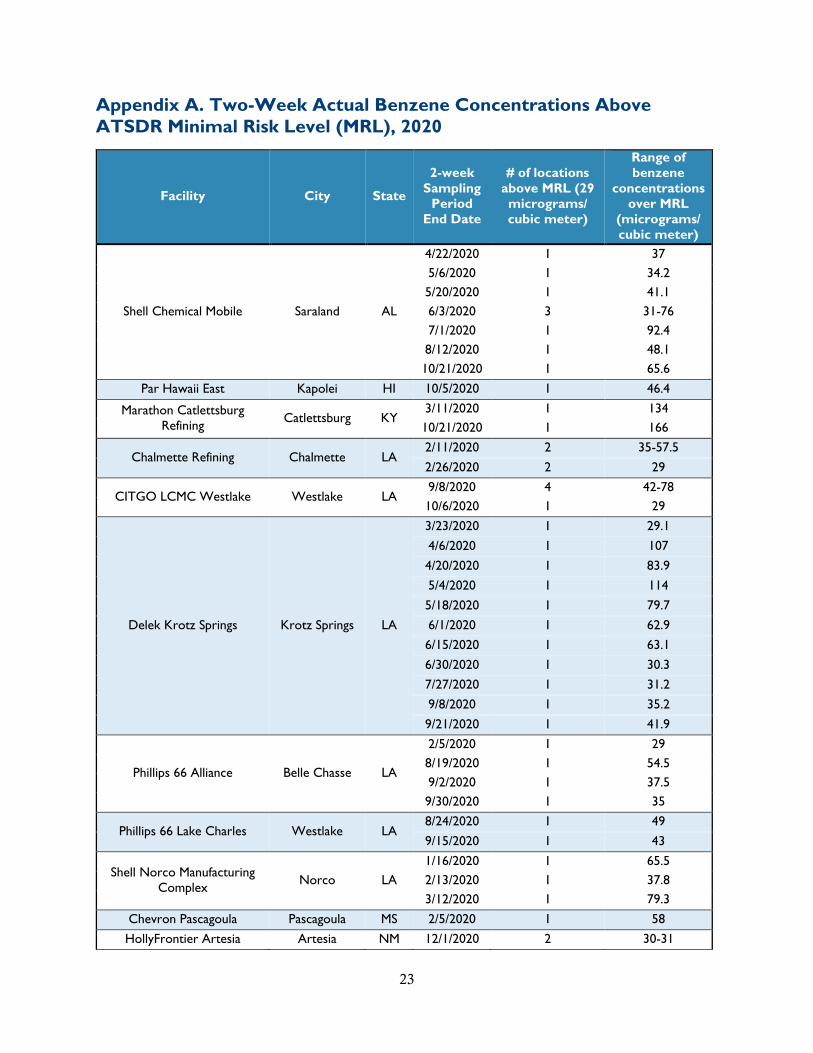
Appendix A. Two-Week Actual Benzene Concentrations Above
ATSDR Minimal Risk Level (MRL), 2020
Facility City State
2-week
Sampling
Period
End Date
# of locations
above MRL (29
micrograms/
cubic meter)
Range of
benzene
concentrations
over MRL
(micrograms/
cubic meter)
Shell Chemical Mobile Saraland AL
4/22/2020 1 37
5/6/2020 1 34.2
5/20/2020 1 41.1
6/3/2020 3 31-76
7/1/2020 1 92.4
8/12/2020 1 48.1
10/21/2020 1 65.6
Par Hawaii East Kapolei HI 10/5/2020 1 46.4
Marathon Catlettsburg
Refining Catlettsburg KY
3/11/2020 1 134
10/21/2020 1 166
Chalmette Refining Chalmette LA 2/11/2020 2 35-57.5
2/26/2020 2 29
CITGO LCMC Westlake Westlake LA 9/8/2020 4 42-78
10/6/2020 1 29
Delek Krotz Springs Krotz Springs LA
3/23/2020 1 29.1
4/6/2020 1 107
4/20/2020 1 83.9
5/4/2020 1 114
5/18/2020 1 79.7
6/1/2020 1 62.9
6/15/2020 1 63.1
6/30/2020 1 30.3
7/27/2020 1 31.2
9/8/2020 1 35.2
9/21/2020 1 41.9
Phillips 66 Alliance Belle Chasse LA
2/5/2020 1 29
8/19/2020 1 54.5
9/2/2020 1 37.5
9/30/2020 1 35
Phillips 66 Lake Charles Westlake LA 8/24/2020 1 49
9/15/2020 1 43
Shell Norco Manufacturing
Complex Norco LA
1/16/2020 1 65.5
2/13/2020 1 37.8
3/12/2020 1 79.3
Chevron Pascagoula Pascagoula MS 2/5/2020 1 58
HollyFrontier Artesia Artesia NM 12/1/2020 2 30-31
24
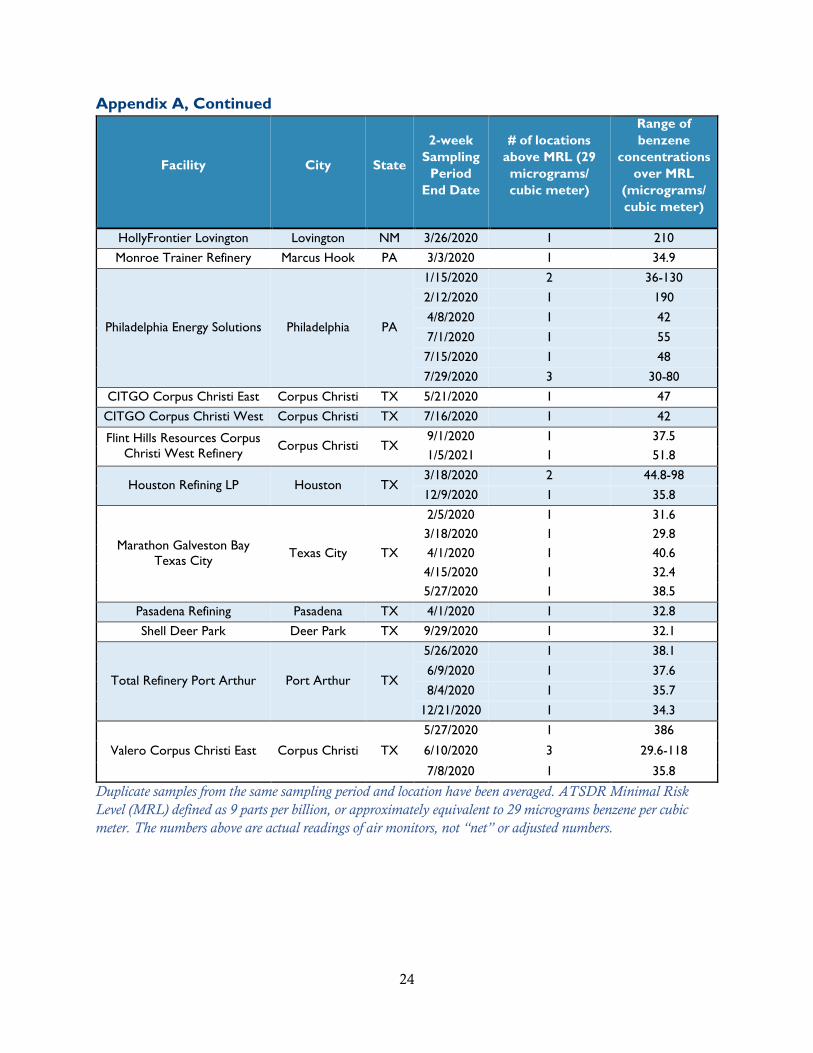
Appendix A, Continued
Facility City State
2-week
Sampling
Period
End Date
# of locations
above MRL (29
micrograms/
cubic meter)
Range of
benzene
concentrations
over MRL
(micrograms/
cubic meter)
HollyFrontier Lovington Lovington NM 3/26/2020 1 210
Monroe Trainer Refinery Marcus Hook PA 3/3/2020 1 34.9
Philadelphia Energy Solutions Philadelphia PA
1/15/2020 2 36-130
2/12/2020 1 190
4/8/2020 1 42
7/1/2020 1 55
7/15/2020 1 48
7/29/2020 3 30-80
CITGO Corpus Christi East Corpus Christi TX 5/21/2020 1 47
CITGO Corpus Christi West Corpus Christi TX 7/16/2020 1 42
Flint Hills Resources Corpus
Christi West Refinery Corpus Christi TX
9/1/2020 1 37.5
1/5/2021 1 51.8
Houston Refining LP Houston TX 3/18/2020 2 44.8-98
12/9/2020 1 35.8
Marathon Galveston Bay
Texas City Texas City TX
2/5/2020 1 31.6
3/18/2020 1 29.8
4/1/2020 1 40.6
4/15/2020 1 32.4
5/27/2020 1 38.5
Pasadena Refining Pasadena TX 4/1/2020 1 32.8
Shell Deer Park Deer Park TX 9/29/2020 1 32.1
Total Refinery Port Arthur Port Arthur TX
5/26/2020 1 38.1
6/9/2020 1 37.6
8/4/2020 1 35.7
12/21/2020 1 34.3
Valero Corpus Christi East Corpus Christi TX
5/27/2020 1 386
6/10/2020 3 29.6-118
7/8/2020 1 35.8
Duplicate samples from the same sampling period and location have been averaged. ATSDR Minimal Risk
Level (MRL) defined as 9 parts per billion, or approximately equivalent to 29 micrograms benzene per cubic
meter. The numbers above are actual readings of air monitors, not “net” or adjusted numbers.
25
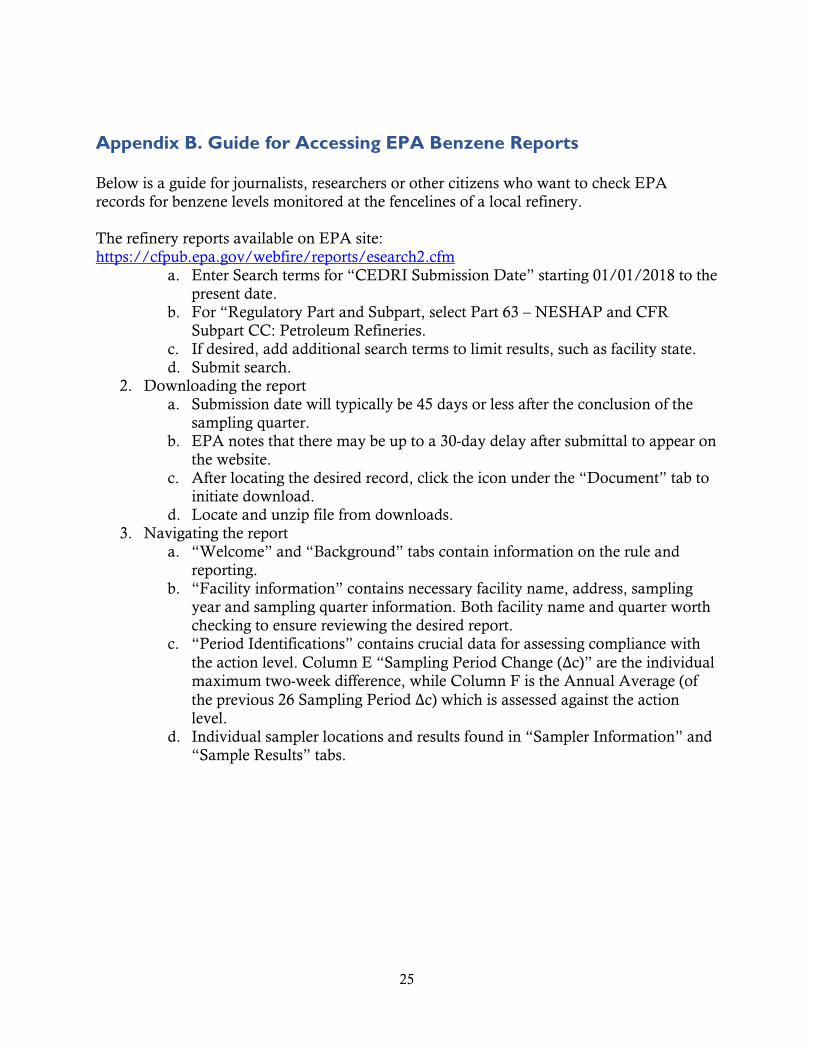
Appendix B. Guide for Accessing EPA Benzene Reports
Below is a guide for journalists, researchers or other citizens who want to check EPA
records for benzene levels monitored at the fencelines of a local refinery.
The refinery reports available on EPA site:
https://cfpub.epa.gov/webfire/reports/esearch2.cfm
a. Enter Search terms for “CEDRI Submission Date” starting 01/01/2018 to the
present date.
b. For “Regulatory Part and Subpart, select Part 63 – NESHAP and CFR
Subpart CC: Petroleum Refineries.
c. If desired, add additional search terms to limit results, such as facility state.
d. Submit search. 2. Downloading the report
a. Submission date will typically be 45 days or less after the conclusion of the
sampling quarter.
b. EPA notes that there may be up to a 30-day delay after submittal to appear on
the website.
c. After locating the desired record, click the icon under the “Document” tab to
initiate download. d. Locate and unzip file from downloads.
3. Navigating the report
a. “Welcome” and “Background” tabs contain information on the rule and
reporting.
b. “Facility information” contains necessary facility name, address, sampling
year and sampling quarter information. Both facility name and quarter worth
checking to ensure reviewing the desired report. c. “Period Identifications” contains crucial data for assessing compliance with
the action level. Column E “Sampling Period Change (Δc)” are the individual
maximum two-week difference, while Column F is the Annual Average (of
the previous 26 Sampling Period Δc) which is assessed against the action
level.
d. Individual sampler locations and results found in “Sampler Information” and
“Sample Results” tabs.
26
Appendix C: Mapping Data Sources
1. Oak Ridge National Laboratory (ORNL) Geographic Information Science and
Technology (GIST) Group; National Geospatial-Intelligence Agency (NGA);
Homeland Security Infrastructure Program (HSIP) Team. Public Schools, ESRI
Feature Service Feature Class. Available at:
https://services1.arcgis.com/Hp6G80Pky0om7QvQ/arcgis/rest/services/Public_Sc
hools/FeatureServer
2. Oak Ridge National Laboratory (ORNL) Geographic Information Science and
Technology (GIST) Group; National Geospatial-Intelligence Agency (NGA);
Homeland Security Infrastructure Program (HSIP) Team. Private Schools, ESRI
Feature Service Feature Class. Available at:
https://services1.arcgis.com/Hp6G80Pky0om7QvQ/arcgis/rest/services/Public_Sc
hools/FeatureServer
3. Harris County Land Use, ESRI Feature Service Feature Class. (8/18/2016).
Available at:
https://mycity2.houstontx.gov/pubgis02/rest/services/HoustonMap/Landuse/Ma
pServer
4. City of Philadelphia Planning Commission. City of Philadelphia Land Use, ESRI
Feature Service Feature Class. Available at:
https://services.arcgis.com/fLeGjb7u4uXqeF9q/arcgis/rest/services/Land_Use/Fe
atureServer
5. Enriched PLS_FY2016_Outlet_puout16a, ESRI Feature Service Feature Class.
Available at:
https://services1.arcgis.com/4yjifSiIG17X0gW4/arcgis/rest/services/Enriched%20
PLS_FY2016_Outlet_puout16a/FeatureServer
6. Definitive Healthcare Bed Locations. ESRI Feature Service Feature Class. Available
at:
https://services7.arcgis.com/LXCny1HyhQCUSueu/arcgis/rest/services/Definitiv
e_Healthcare_USA_Hospital_Beds/FeatureServer
7. City of Corpus Christi. Land Use, Nueces County, ESRI Feature Service Feature
Class. Available at:
https://services.arcgis.com/0J4ZNc4NaTguvRy0/ArcGIS/rest/services/OpenData
/FeatureServer
27
Endnotes
1 Benzene; CASRN 71-43-2,” Chemical Assessment Study, Integrated Risk Information System, National Center for Environmental Assessment, US Environmental Protection Agency, Section II.C.2, p. 33, available
online at https://cfpub.epa.gov/ncea/iris/iris_documents/documents/subst/0276_summary.pdf#nameddest=cancerinhal 2 43 CFR § 63.658. 3 All benzene values reported by refineries under 43 CFR §63.658 based on records obtained by searching the US EPA “WEBFIRE” site at https://cfpub.epa.gov/webfire/reports/eSearchResults.cfm. 4 Demographic data for each facility obtained from U.S. Environmental Protection Agency’s “Environmental Compliance History Online (ECHO)” at https://echo.epa.gov/. EPA demographic statistics of surrounding
area based on 2010 U.S. Census and 2006-2010 American Community Survey 5-Year Summary data. 5 Annual average net concentration numbers obtained from refinery benzene reports, publicly available on the EPA website. Standard procedure is to take annual average from refinery report, under the “Period
Identifications” tab and the last reported value under the “Annual Average Δc” in column F. For facilities with rounding in the reported average, the annual average is checked and calculated as specified by rule, using the
past 26 weeks of “Sampling Period Δc” data in column E. Substantial differences were seen for the calculated average from Marathon Catlettsburg and HollyFrontier Lovington, and the table reflects the calculated value
from the past 26 sampling results. Pasadena Refining also provided rounded values within column E, and each
two-week sampling period Δc was calculated from subtracting the lowest benzene concentration from the highest in the “Sample Results” tab. Since Delek Krotz Springs first submitted reports in 2020, the 2019 net concentration reflects the first annual average reported for this facility once 26 weeks of sampling were
completed, which was an average of 24.2 micrograms for the period ending on 1/27/2020. 6 People of color based on percent identified as “minority” population in ECHO database, and includes African-American, Hispanic, Asian/Pacific Islander and American Indian residents. 7 CDC. Occupational Safety and Health Guideline for Benzene, p. 1, https://www.cdc.gov/niosh/docs/81-123/pdfs/0049.pdf. NIOSH recommended exposure limit given as 0.1 ppm as an 10-hour time weighted average, which is equivalent to 100 ppb or 319 µg/m3 using the conversion equivalent of 1 ppm benzene=3.19
mg/m3 given at: https://www.cdc.gov/niosh/npg/npgd0049.html. Definition for NIOSH recommended exposure limits (RELs) and time-weighted average concentration given in NIOSH Pocket Guide to Chemical
Hazards, available at https://www.cdc.gov/niosh/npg/pgintrod.html. 8 “Toxicological Profile for Benzene, Agency for Toxic Substances Disease Registry, US Department of Health and Human Services (2007), p. A-3, available at https://www.atsdr.cdc.gov/toxprofiles/tp3.pdf. ATSDR
minimal risk level (MRL) for inhalation of benzene given as 9 ppb, which can be converted to approximately 29 µg/m3 using the conversion equivalent of 1 ppm benzene=3.19 mg/m3 given at:
https://www.cdc.gov/niosh/npg/npgd0049.html. 9 Demographic data for each facility obtained from US EPA’s “Environmental Compliance History Online (ECHO)” at https://echo.epa.gov/. 10 US Census Bureau. QuickFacts, Population estimates as of 2019. People of color estimated as those not included in “White alone, not Hispanic or Latino, percent” category, which was 60.1% in 2019. Available at: https://www.census.gov/quickfacts/fact/table/US/PST045219. 11 US Census Bureau. Income and Poverty in the United States: 2019. September 15, 2020. Report Number P60-270. At Table B-5. Available at:
https://www.census.gov/content/dam/Census/library/publications/2020/demo/p60-270.pdf. 12 Supra, n. 1. 13 EPA Integrated Risk Information System (IRIS). Benzene; CASRN 71-43-2. At 33. Available at:
https://cfpub.epa.gov/ncea/iris/iris_documents/documents/subst/0276_summary.pdf 14 EPA. Petroleum Refinery Sector Risk and Technology Review and New Source Performance Standards
Final Rule, 80 Fed. Reg. 75,181 (December 1, 2015). Available at: https://www.govinfo.gov/content/pkg/FR-2015-12-01/pdf/2015-26486.pdf. 15 Philadelphia Energy Solutions benzene report to EPA includes comments under sample result data. For example, the sampling period ending on 1/2/2020 noted at Sampler 7 “Related to fugitives during benzene
28
tanks de-inventory operations (non-routine). De-inventory is part of shut down of refinery processing operations.” Available at https://cfpub.epa.gov/webfire/reports/esearch2.cfm under Part 63, subpart CC. 16 Facilities exceeding the action level at the end of each quarter of 2020 include Delek Krotz Springs, Shell
Norco, Chalmette Refining, HollyFrontier Lovington, Philadelphia Energy Solutions, Total Port Arthur, Marathon Galveston Bay, and Citgo Corpus Christi East. HollyFrontier Artesia began and ended 2020 above
the action level, though briefly dipped below the 9 microgram threshold at the end of the third quarter of 2020. 17 EPA. HollyFrontier Navajo Artesia Refinery Inspection Report. 10/1/29-10/4/29. Redacted version
available at: https://www.documentcloud.org/documents/6792943-insprptairhollyfrontierartesiarefinery20191001.html#document/p12/a554557 18 EPA “Synthetic Organic Chemical Manufacturing Industry: Organic National Emission Standards for
Hazardous Air Pollutants (NESHAP) - 40 CFR 63 Subparts F,G,H,I,” available at: https://www.epa.gov/stationary-sources-air-pollution/synthetic-organic-chemical-manufacturing-industry-organic-national, accessed April 9, 2021. 19 CITGO Petroleum Corporation. “Site-Specific Benzene Fenceline Monitoring Plan (Proposed). November 12, 2020. Available at https://cfpub.epa.gov/webfire/reports/esearch2.cfm under Part 63, subpart CC. 20 NIOSH Benzene REL available at: https://www.cdc.gov/niosh/npg/npgd0049.html. TWA of 0.1 ppm (100 ppb) defines guidance for 10-hour workday exposure. 21 “Toxicological Profile for Benzene, Agency for Toxic Substances Disease Registry, US Department of
Health and Human Services (2007), p. A-3, available at https://www.atsdr.cdc.gov/toxprofiles/tp3.pdf. ATSDR minimal risk level (MRL) for inhalation of benzene given as 9 ppb, which can be converted to
approximately 29 µg/m3 using the conversion equivalent of 1 ppm benzene=3.19 mg/m3 given at: https://www.cdc.gov/niosh/npg/npgd0049.html. 22 US Census Bureau. Income and Poverty in the United States: 2019. September 15, 2020. Report Number P60-270. At Table B-5. Available at:
https://www.census.gov/content/dam/Census/library/publications/2020/demo/p60-270.pdf. 23 See Chevron Pasadena History. Available at: https://pasadena.chevron.com/about/history 24 Environmental Integrity Project, “Monitoring for Benzene at Refinery Fencelines,” February 6, 2020. Link: https://environmentalintegrity.org/wp-content/uploads/2020/02/Benzene-Report-2.6.20.pdf 25 See Union of Concerned Scientists and Texas Environmental Justice Advocacy Services (t.e.j.a.s). “Double
Jeopardy in Houston: Acute and Chronic Chemical Exposures Pose Disproportionate Risks for Marginalized Communities.” October 1, 2016. At 3. Available at: https://www.jstor.org/stable/resrep17254.


