PALADIN ENERGY LTD ACN 061 681 098 Level 4, 502 Hay Street, Subiaco, Western Australia 6008 Postal: PO Box 201, Subiaco, Western Australia 6904 Tel: +61 (8) 9381 4366 Fax: +61 (8) 9381 4978 Email: [email protected]Website: www.paladinenergy.com.au Ref: 318106 29 August 2013 ASX Market Announcements Australian Securities Exchange 20 Bridge Street SYDNEY NSW 2000 By Electronic Lodgement Dear Sir/Madam Paladin Energy Ltd 30 June 2013 Annual Report Attached please find the 2013 Annual Report including audited financial statements for the year ended 30 June 2013 together with Appendix 4E and Management, Discussion and Analysis. Yours faithfully Paladin Energy Ltd JOHN BORSHOFF Managing Director/CEO For personal use only
Transcript
PALADIN ENERGY LTDACN 061 681 098
Level 4, 502 Hay Street, Subiaco, Western Australia 6008 Postal: PO Box 201, Subiaco, Western Australia 6904
29 August 2013 ASX Market Announcements Australian Securities Exchange 20 Bridge Street SYDNEY NSW 2000
By Electronic Lodgement
Dear Sir/Madam
Paladin Energy Ltd 30 June 2013 Annual Report
Attached please find the 2013 Annual Report including audited financial statements for the year ended 30 June 2013 together with Appendix 4E and Management, Discussion and Analysis. Yours faithfully Paladin Energy Ltd
JOHN BORSHOFF Managing Director/CEO
For
per
sona
l use
onl
y
PALADIN ENERGY LTDACN 061 681 098
Level 4, 502 Hay Street, Subiaco, Western Australia 6008 Postal: PO Box 201, Subiaco, Western Australia 6904
NEWS RELEASE For Immediate Distribution PALADIN ENERGY: FINANCIAL REPORT FOR YEAR ENDED
30 JUNE 2013 Perth, Western Australia – 29 August 2013: Paladin Energy Ltd (“Paladin” or “the Company”) (TSX:PDN / ASX:PDN) announces the release of its consolidated Financial Report for the year ended 30 June 2013. The Financial Report is appended to this News Release.
HIGHLIGHTS
OPERATIONS
Combined production for the year of 8.255Mlb U3O8, an increase of 20% over the year ended 30 June 2012.
June 2013 quarterly combined production of 2.143Mlb U3O8, an increase of 8% over the March 2013 quarter.
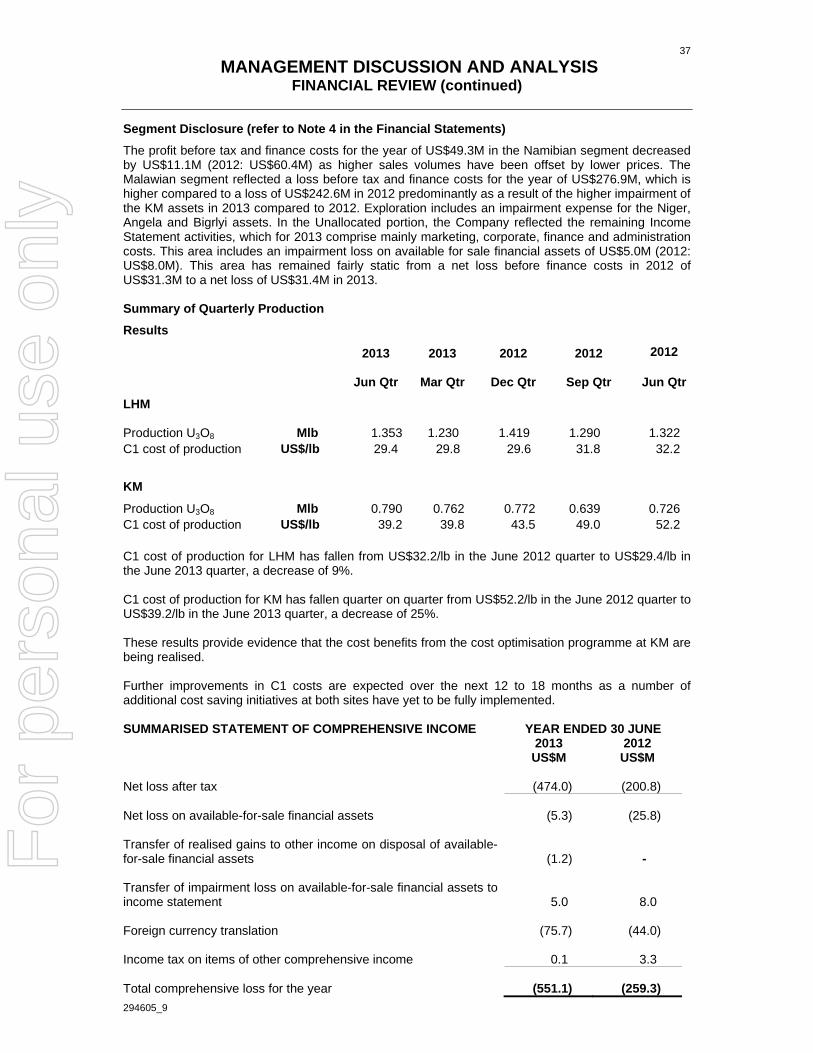
C1 cost of production(1) continued to fall quarter on quarter. Langer Heinrich C1 cost of production has fallen 9% from US$32.2/lb in the June 2012 quarter to US$29.4/lb in the June 2013 quarter. Kayelekera C1 cost of production has decreased 25% from US$52.2/lb U3O8 in the June 2012 quarter to US$39.2/lb in the June 2013 quarter.
Both mines now operating consistently and production optimisation initiatives continue to improve recoveries and reduce unit operating costs.
Completion Tests satisfied at both Langer Heinrich and Kayelekera.
FY2013 production well within guidance of 8.0 - 8.5Mlb U3O8.
SALES AND REVENUE
Strong sales of US$107.4M for the June 2013 quarter selling 2.326Mlb U3O8 at an average realised sales price of US$46.22/lb.
Sales revenue for the year increased by 12% from US$365.8M in 2012 to US$408.4M in 2013. Sales volume for the year increased by 23% from 6.698Mlb U3O8 in 2012 to 8.253Mlb U3O8 in 2013.
Average realised sales price of US$49.5/lb U3O8 for the year ended 30 June 2013, compared to average UxC spot price of US$43.9/lb.
CORPORATE
Successful raising of A$88M/US$80.7M through a private placement of 125.6M ordinary shares in August 2013.
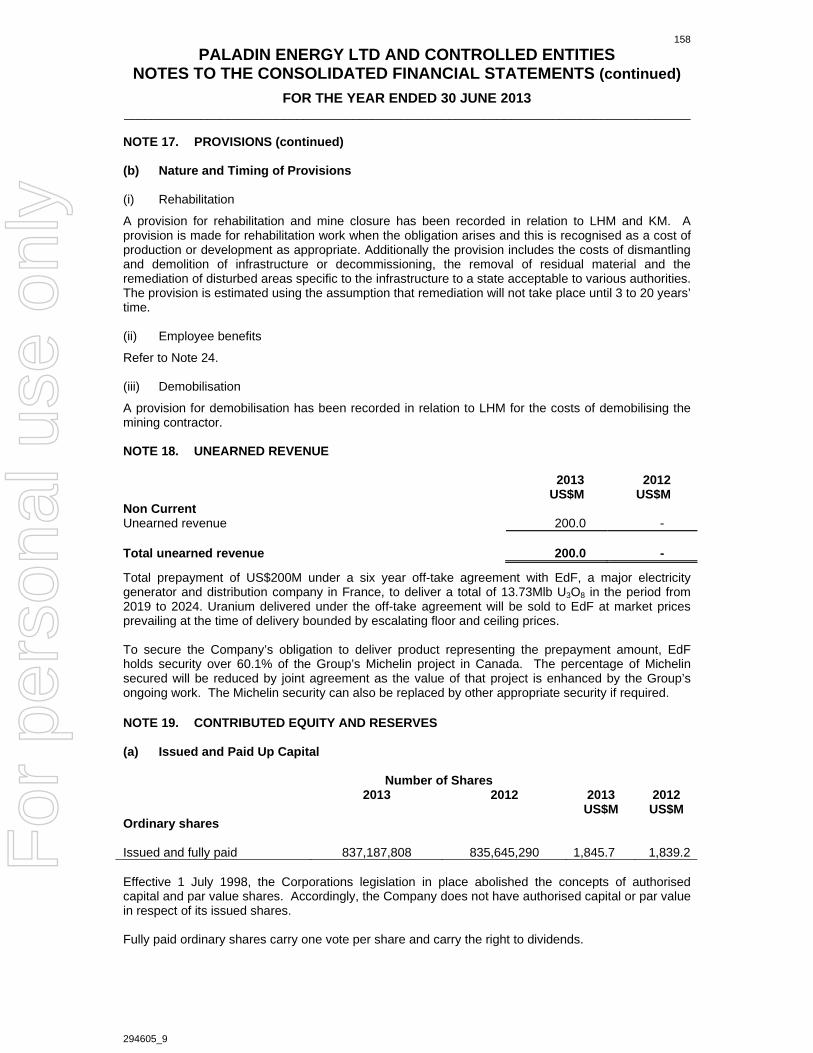
Payment of US$200M received from Electricité de France S.A. (“EdF”) pursuant to the Long-term Off-take Contract.
Total debt repayment of US$181M during the year including repayment of balance of March 2013 Convertible Bond of US$134M.
Post year-end negotiations were terminated for the sale of a minority interest in the Langer Heinrich Mine after the preferred bidder advised at a late stage that because of the recent weakness in the uranium spot price it wanted to renegotiate the terms, including price, to an unacceptable level.
Total impairment for the year of US$335.9M as previously advised. (1) C1 cost of production = cost of production excluding product distribution costs, sales royalties and depreciation and amortisation before adjustment for impairment. C1 cost, which is non-IFRS information, is a widely used ‘industry standard’ term.
For
per
sona
l use
onl
y
312381_2 Page 2
Results
(References below to 2013 and 2012 are to the equivalent year ended 30 June 2013 and 2012 respectively).
Safety and Sustainability:
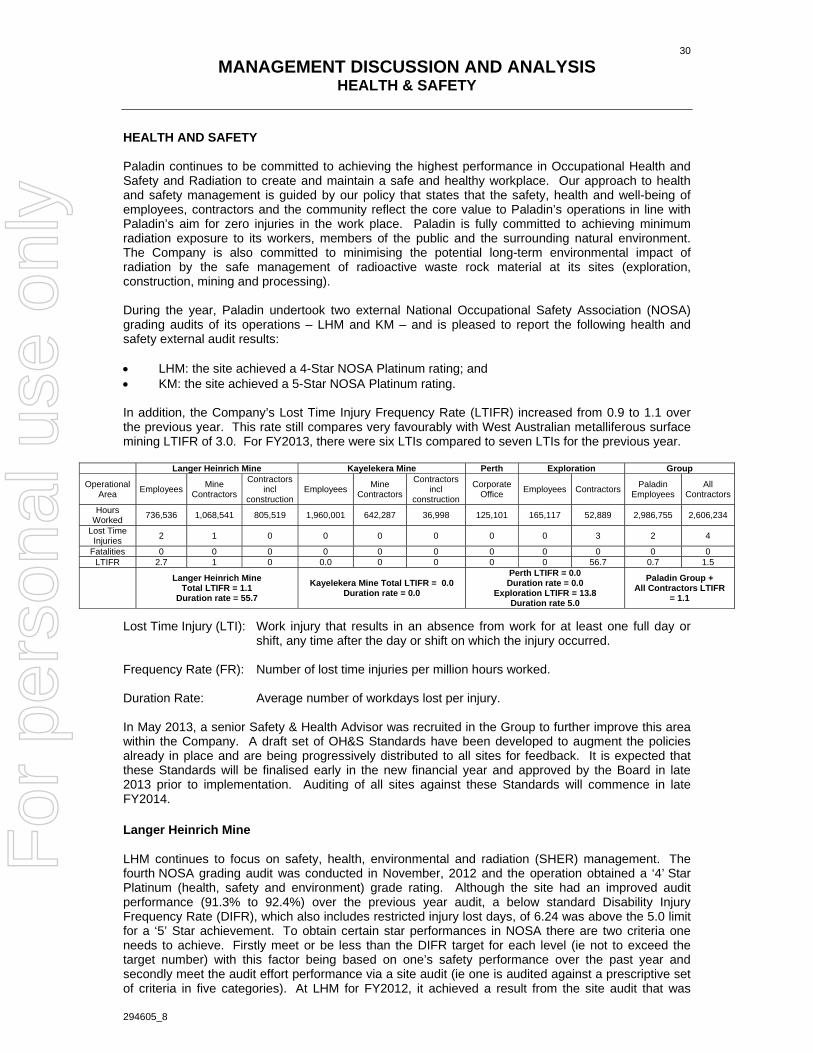
- Continued high safety performance with the 12-month moving average Lost Time Injury Frequency Rate increasing from 0.9 to 1.1. This rate still compares favourably with the West Australian metalliferous surface mining LTIFR of 3.0. For FY2013, there were six LTIs compared to seven LTIs for the previous year.
- The annual NOSA HSE grading audit for Langer Heinrich confirmed a 4 Star Platinum rating.
- During the June quarter, the annual external safety, health and environment NOSA audit at Kayelekera Mine for the period May 2012 to May 2013 was conducted and a 5 Star Platinum result achieved with a higher effort performance (92%) than last year (90%). In addition, Kayelekera Mine also achieved a milestone of 459 LTI free days on 30 June 2013.
- Post year end the Kayelekera Mine suffered a workplace fatality. A Malawi national employee died on 30 July 2013 after being struck in the chest by a light vehicle wheel he was inflating at the time. Relevant authorities were notified and the Malawian Police and the Company have investigated the incident, with the findings and outcomes pending. Prior to this tragic accident, Kayelekera Mine had operated for 489 days without a LTI.
Production:
- Record production for the year of 8.255Mlb U3O8, an increase of 20% on year ended 30 June 2012, well within stated guidance of between 8.0 and 8.5Mlb.
- June quarterly production of 2.143Mlb U3O8, up 8% on the March 2013 quarter.
Langer Heinrich Mine:
- Production for FY2013 of 5.292Mlb U3O8, an increase of 20% over the year ended 30 June 2012.
- June quarterly production of 1.353Mlb U3O8, an increase of 10% over the March 2013 quarter:
Processing recovery for FY2013 of 86.0% versus design of 85%.
Feed grades for FY2013 of 812ppm U3O8 versus design of 800ppm.
- The ongoing efforts to improve water efficiency continue. The negotiations to obtain desalinated water from the Areva plant were delayed but have since progressed well and finalisation is imminent. Despite this delay, no adverse impacts on production are expected as the site is now self-sufficient in water due to the successful implementation of a number of initiatives.
- Production capacity remains robust and consistent.
- Langer Heinrich C1 cost of production has fallen 9% from US$32.2/lb in the June 2012 quarter to US$29.4/lb in the June 2013 quarter.
- Further optimisation initiatives are underway. The addition of the demonstration Hydrosort unit is progressing well in terms of both time and cost and commissioning of this unit is expected in the September 2013 quarter.
Kayelekera Mine:
- Production for FY2013 of 2.963Mlb U3O8, an increase of 20% over the year ended 30 June 2012.
- Record June quarterly production of 0.790Mlb U3O8, an increase of 4% over the March 2013 quarter:
Processing recovery of 84.6% versus design of 87%.
Feed grades for FY2013 of 1,143ppm U3O8 on track (design is 1,150ppm).
- The improved leach performance is attributable in part to the successful completion of a mill classification optimisation initiative, which has resulted in consistently finer leach feed material at the same mill power consumption.
- Kayelekera C1 cost of production has fallen quarter on quarter from US$52.2/lb in the June 2012 quarter to US$39.2/lb in the June 2013 quarter, a decrease of 25%.
For
per
sona
l use
onl
y
312381_2 Page 3
- Benefits of process optimisation will continue to be realised. The acid recycling (Nano technology) project and grid power supply remain the two key elements of production optimisation.
Acid recycling initiatives remain on schedule for commissioning in the September 2013 quarter.
The grid power initiative is now scheduled for completion in the March quarter of 2014, a delay of 3 months.
Completion Tests:
- The Completion Tests under both the Langer Heinrich Mine project finance facility and the Kayelekera Mine project finance facility were satisfied during the March 2013 quarter which has resulted in a reduction in interest charges and provides greater flexibility with regards to voluntary prepayments and distributions under both facility agreements.
- Following both operations reaching steady state operation, the sites successfully completed their stated production and optimisation targets for FY 2013 This work to improve process recoveries and reduce unit operating costs will continue. Some elements of this work have the potential to better utilise the reserve base at Langer Heinrich by being able to use lower ROM feed grades.
- Paladin also remains focused on reducing costs across all facets of the business and work continues to identify more cost saving opportunities. Paladin is currently undertaking a further review of costs across the organisation with a particular focus on exploration costs, corporate costs, discretionary capex and site costs.
- With realisation of the acid recycling and grid power initiatives at the Kayelekera Mine, a reduction in C1 cost of production of between US$4-6/lb is expected by the June 2014 quarter.
Profit and Loss:
- Total sales volume for the year of 8.253Mlb U3O8 being a 23% increase over the year ended 30 June 2012 sales of 6.698Mlb U3O8.
- Sales revenue increased 12% from US$365.8M in 2012 to US$408.4M for the year ended 30 June 2013, as a result of the higher sales volumes. The average realised uranium price for the year was US$49.5/lb U3O8 (2012: US$54.6/lb). The average UxC spot price for the year was US$43.9/lb.
- Gross profit for the year of US$25.0M is 5% higher than in 2012 (US$23.9M) due to a 23% increase in sales volume and a lower impairment of Kayelekera Mine inventory of US$30.9M (2012: US$39.0M), which has partially been offset by lower prices.
- Total impairment of US$335.9M for the year including U$180.0M advised on 2 August 2013:
US$97.1M has been recorded for Kayelekera Mine assets for the June 2013 quarter, totalling US$237.9M for the year due to continued uranium price weakness
US$17.2M has been recorded to reduce the cost of Kayelekera Mine inventory held to net realisable value for the June 2013 quarter, totalling US$30.9M for the year
US$62.1M impairment of exploration assets:
Niger exploration assets were impaired by US$37.4M due to the cessation of exploration activities by Paladin in Niger as a consequence of significantly increased security risks.
Angela Uranium Project was impaired by US$6.8M; and
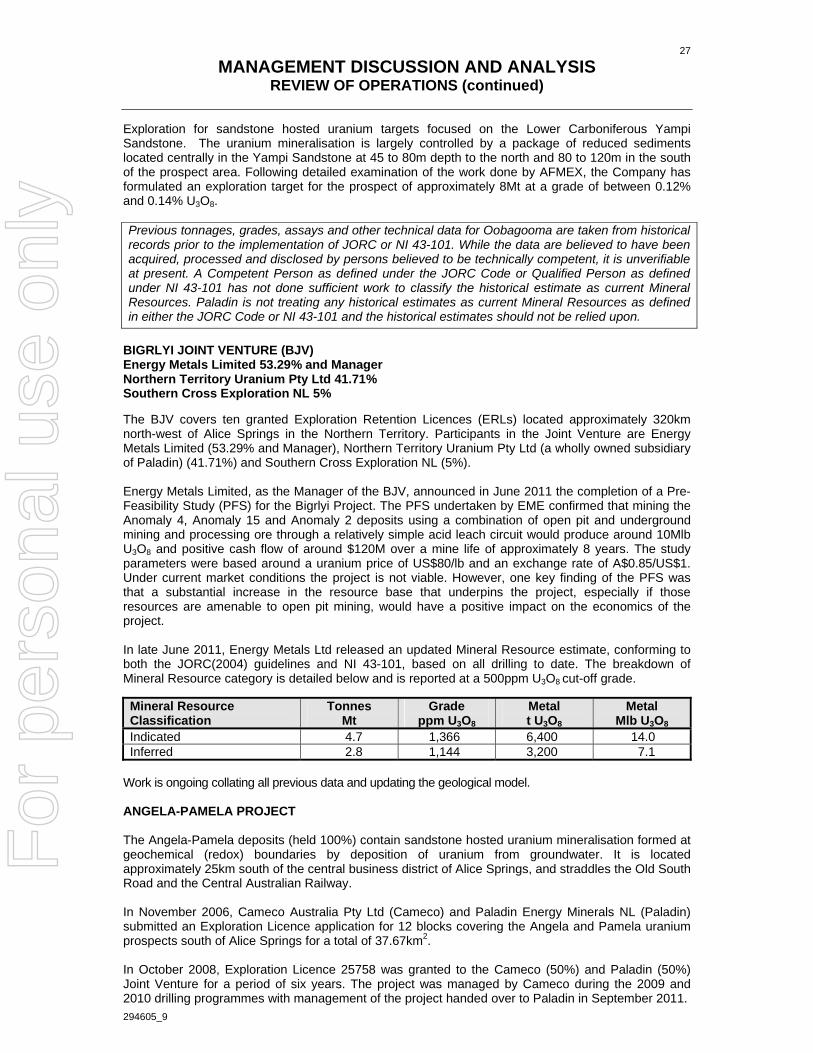
Bigrlyi Project was impaired by US$17.9M.
US$5.0M impairment of investments.
- Income tax expense for the year of US$88.4M is predominantly the result of the de-recognition of the net deferred tax asset at December 2012 of US$98.2M at Kayelekera arising from unrealised foreign exchange differences and carry forward tax losses previously recognised. The unrealised foreign exchange difference had arisen on intercompany loans due to the extreme devaluation of 104% in the Malawian Kwacha over the previous 12 months from an average of US$1=MKW160 to US$1=MKW327 at 31 December 2012.
- Net loss after tax attributable to members of US$420.9M was recorded for the year.
For
per
sona
l use
onl
y
312381_2 Page 4
Cash Flow:
- Positive cashflow from operating activities of US$194.5M for the year ended 30 June 2013 was primarily due to receipts from customers of US$400.0M and receipt of the long-term off-take agreement funds of US$200.0M. Positive cash flow of US$86.8M was generated by the Langer Heinrich and Kayelekera operations before investment in working capital required to support higher production levels, payments for administration, marketing and non-production costs of US$33.9M. The remaining expenditure comprises US$1.4M for exploration and net interest paid of US$41.4M.
- Cash outflow from investing activities of US$46.2M for the year ended 30 June 2013:
plant and equipment acquisitions of US$30.6M, predominantly due to the new tailings facility at Langer Heinrich and Kayelekera; and
capitalised exploration expenditure of US$16.5M. Exploration expenditure in foreseeable periods will be lower.
- Cash outflow from financing activities of US$181.5M for the year ended 30 June 2013 was mainly attributable to repayment of the US$134M remaining on the US$325M Convertible Bonds issued on 11 March 2008, repayment of project financing for Kayelekera Mine of US$29.9M and Langer Heinrich Mine of US$17.0M.
Cash Position:
- Cash of US$78.1M at 30 June 2013.
- Successful raising of A$88M/US$80.7M through a private placement to institutional and accredited investors of 125.6M ordinary shares in August 2013.
- Post capital raising and assuming an average spot price of US$42.50 for the period, the new cash position (prior to cost savings targeted) will see Paladin into the September 2014 quarter.
Long-term Off-take Contract with a US$200M prepayment:
- US$200M payment received pursuant to the Long-Term Off-take Contract with Electricité de France S.A.
Mid-term Sales Contracts Secured:
- Two mid-term off-take agreements secured for a total of 6.3Mlb U3O8 being delivered from late 2012 to end of 2015 at approximately 2Mlb pa from both mines. Pricing will be determined predominately by the market price at the time of delivery (without floor or ceiling limitations), while a minority portion of the delivery prices will be in accordance with a series of specified fixed prices, which exceed current spot uranium prices.
Exploration and Development:
- Aurora – Michelin Uranium Project, Canada – Work is now substantially complete on an updated mineral resource estimate for the Michelin deposit. Final Quality Analysis/Quality Control and peer review of the mineral resource is now underway and announcement of the results is expected in the next quarter. Preparation for the upcoming summer exploration programme is ongoing.
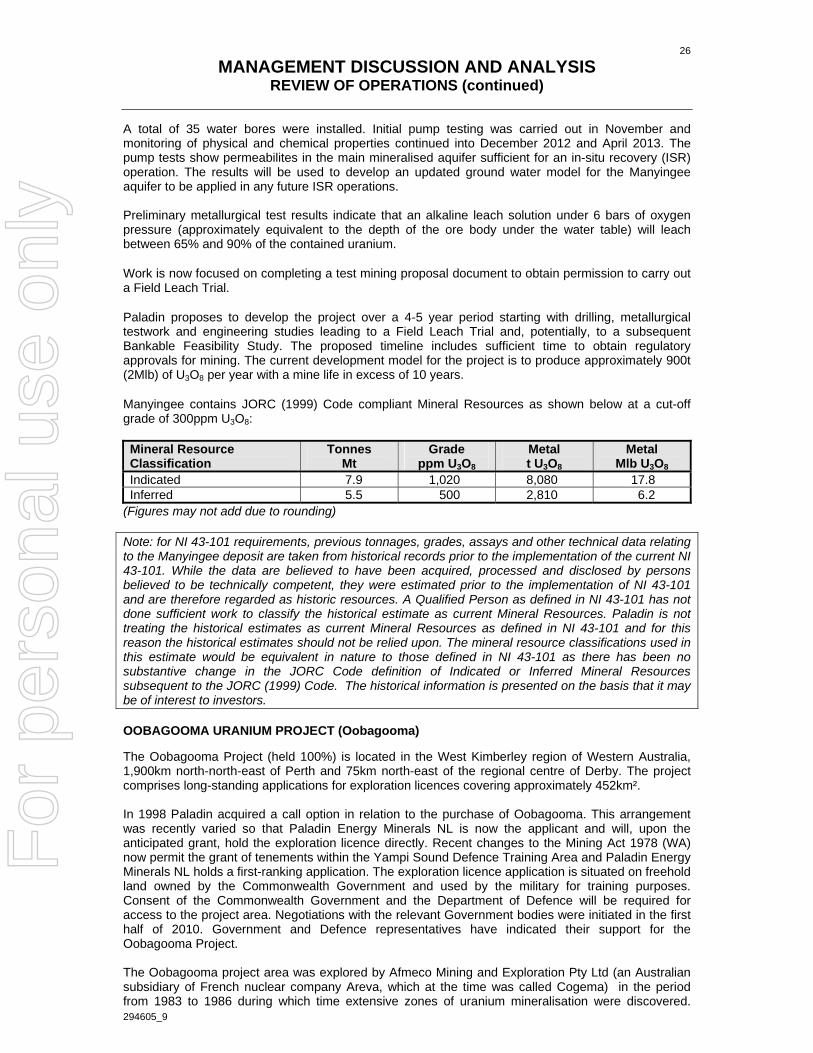
- Manyingee Project, Western Australia – Work at Manyingee concentrated on updating the geological model to provide input into an updated mineral resource estimate. Water sampling was undertaken to obtain baseline data and hydrogeological modelling was commenced in support of an application for a future Field Leach Trial. Preliminary metallurgical test results indicate that an alkaline leach solution under six bars of oxygen pressure (approximately equivalent to the depth of the ore body under the water table) will leach up to 90% of the contained uranium.
- Angela Project, Northern Territory Australia –Paladin is the sole owner of the Angela project following the completion of an agreement to purchase the 50% interest previously held by Cameco Australia Pty Ltd. As a consequence, an additional 15.4Mlb U3O8 of Inferred mineral resources has been added to Paladin’s attributable mineral resource base.
- Niger –Terrorist attacks on the Areva mining operations at Arlit and in the nearby town of Agadez in Niger have halted the Company’s planned activities on its nearby exploration properties. Paladin is currently in discussion with the relevant Niger authorities and has applied for a Force Majeure consideration so it can halt expenditure until the security situation improves.
For
per
sona
l use
onl
y
312381_2 Page 5
Guidance FY2014
- Combined production guidance for FY2014 is forecast to be 8.3 to 8.7Mlb U3O8.
- Uranium sales volumes are expected to fluctuate quarter-on-quarter due to the uneven timing of contractual commitments and resultant scheduling by customers. Now that production has reached design levels, sales and production volumes are expected to be comparable on an annualised basis.
Langer Heinrich Minority Interest Sale
- On 1 August 2013 negotiations were terminated for the sale of a minority interest in the Langer Heinrich Mine after the preferred bidder advised at a late stage that because of the recent weakness in the uranium spot price it wanted to renegotiate the terms, including price, to a level that in the Board’s view was unacceptable. The Board determined that it would not accept such value destruction and that a price was required that more appropriately reflected Langer Heinrich’s intrinsic and strategic value.
- There remains high interest in the asset and Paladin believes that the current weakness in the spot uranium price (US$35.00/lb) should not overly influence the valuation of a flagship asset such as Langer Heinrich. Specifically, Langer Heinrich:
has a +20 years minelife;
is a modern, technologically advanced operation;
is operating in a country that is politically stable; and
is currently operating at consistent levels with further expansion capacity.
- In this context, Paladin strongly believes it can generate greater value to its shareholders through the actions it has taken for Langer Heinrich and has established a threshold expectation for an asset holding very high strategic qualities.
- A number of requests have been received post the termination announcement and Paladin will in September resume efforts to sell a minority interest in Langer Heinrich.
The documents comprising the Financial Report for the year ended 30 June 2013, including the Report to Shareholders, Management Discussion and Analysis, Financial Statements and Certifications are attached and will be filed with the Company’s other documents on Sedar (sedar.com) and on the Company’s website (paladinenergy.com.au).
Generally Accepted Accounting Practice
The news release includes non-GAAP performance measures: C1 cost of production, non-cash costs as well as other income and expenses. The Company believes that, in addition to the conventional measures prepared in accordance with GAAP, the Company and certain investors use this information to evaluate the Company’s performance and ability to generate cash flow. The additional information provided herein should not be considered in isolation or as a substitute for measures of performance prepared in accordance with GAAP.
Declaration
The information in this Announcement relating to exploration and mineral resources is, except where stated, based on information compiled by David Princep B.Sc who is a Fellow of the AusIMM. Mr Princep has sufficient experience that is relevant to the style of mineralisation and type of deposit under consideration and to the activity that he is undertaking to qualify as a Competent Person as defined in the 2004 Edition of the “Australasian Code for Reporting of Exploration Results, Mineral Resources and Ore Reserves”, and as a Qualified Person as defined in NI 43-101. Mr Princep is a full-time employee of Paladin Energy Ltd and consents to the inclusion of this information in the form and context in which it appears.
For
per
sona
l use
onl
y
312381_2 Page 6
Conference Call
Conference Call and Investor Update is scheduled for 06:30 Perth & Hong Kong, Friday 30 August 2013, 18:30 Toronto and 23:30 London, Thursday 29 August 2013. Details are included in a separate news release dated 23 August 2013.
Contacts
For additional information, please contact:
John Borshoff Managing Director/CEO Tel: +61-8-9381-4366 or Mobile: +61-419-912-571 Email: [email protected] Alan Rule Chief Financial Officer Tel: +61-8-9381-4366 or Mobile: +61-438- 942-144 Email: [email protected]
Greg Taylor Investor Relations Contact Tel: +1 905 337-7673 or Mobile: +1 416-605-5120 (Toronto) Email: [email protected] Andrew Mirco Investor Relations Contact Tel: +61-8-9381-4366 or Mobile: +61-409-087-171 Email: [email protected]
For
per
sona
l use
onl
y
Appendix 4E - Financial Report Financial year ended 30 June 2013
Paladin Energy Ltd
ABN or equivalent company reference
ACN. 061 681 098
Results for announcement to the market
30 June 2013
US$M 30 June 2012
US$M
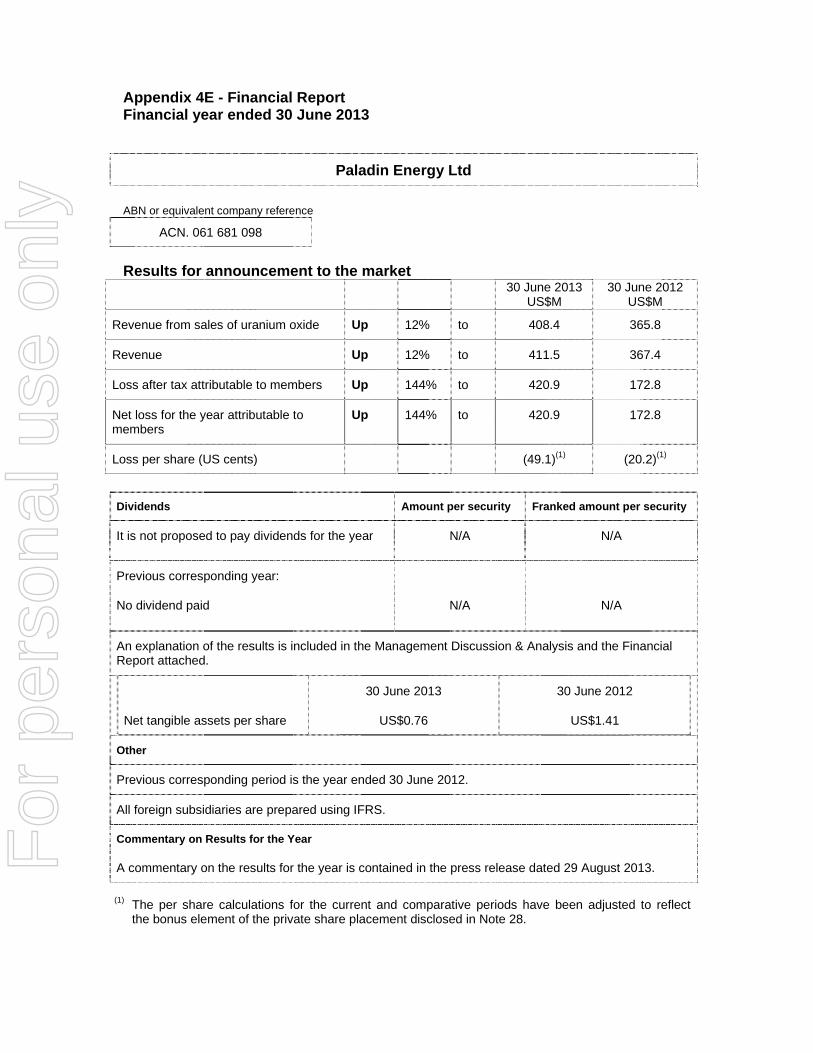
Revenue from sales of uranium oxide Up 12% to 408.4 365.8
Revenue Up 12% to 411.5 367.4
Loss after tax attributable to members Up 144% to 420.9 172.8
Net loss for the year attributable to members
Up 144% to 420.9 172.8
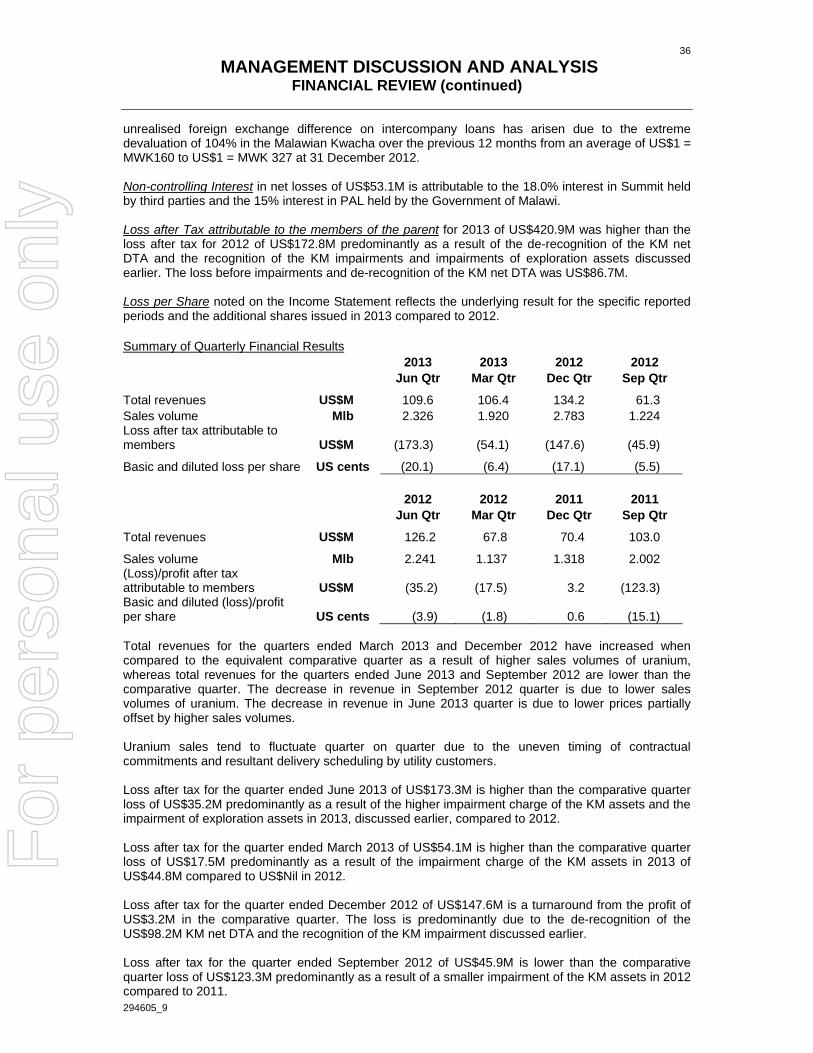
Loss per share (US cents) (49.1)(1) (20.2)(1)
Dividends Amount per security Franked amount per security
It is not proposed to pay dividends for the year N/A N/A
Previous corresponding year:
No dividend paid
N/A
N/A
An explanation of the results is included in the Management Discussion & Analysis and the Financial Report attached.
Net tangible assets per share
30 June 2013
US$0.76
30 June 2012
US$1.41
Other
Previous corresponding period is the year ended 30 June 2012.
All foreign subsidiaries are prepared using IFRS.
Commentary on Results for the Year
A commentary on the results for the year is contained in the press release dated 29 August 2013.
(1) The per share calculations for the current and comparative periods have been adjusted to reflect the bonus element of the private share placement disclosed in Note 28.
For
per
sona
l use
onl
y
PALADIN ENERGY LTD
ACN 061 681 098
ANNUAL
REPORT
2013
For
per
sona
l use
onl
y
2
CONTENTS __________________________________________________________________________________ CORPORATE VALUES AND KEY ACHIEVEMENTS .......................................................................... 3
CHAIRMAN’S LETTER ......................................................................................................................... 7
INSIGHTS FROM THE MANAGING DIRECTOR/CEO ......................................................................... 9
NUCLEAR POWER – GETTING BACK ON TRACK .......................................................................... 11
MANAGEMENT DISCUSSION AND ANALYSIS ................................................................................ 13
REVIEW OF OPERATIONS .......................................................................................................... 14
HEALTH & SAFETY ...................................................................................................................... 30
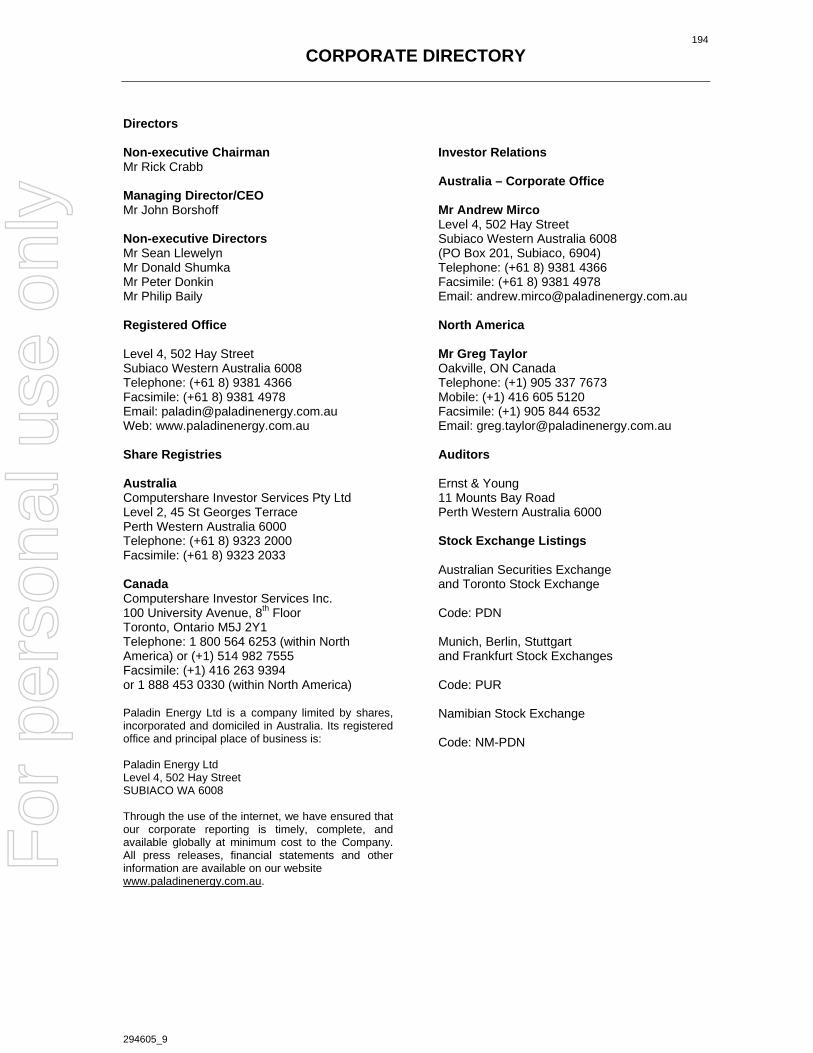
The annual report covers the Group consisting of Paladin Energy Ltd (referred throughout as the Company or Paladin) and its controlled entities.
Paladin Energy Ltd is a company limited by shares, incorporated and domiciled in Australia. Its registered office and principal place of business is: Paladin Energy Ltd Level 4 502 Hay Street SUBIACO WA 6008 Through the use of the internet, we have ensured that our corporate reporting is timely, complete, and available globally at minimum cost to the Company. All press releases, financial statements and other information are available on our website www.paladinenergy.com.au.
For
per
sona
l use
onl
y
3
CORPORATE VALUES AND KEY ACHIEVEMENTS __________________________________________________________________________________
CORPORATE VALUES
Create shareholder wealth by developing the considerable opportunities Paladin has and continues to generate.
Become a major player in the global uranium supply market.
Operate at global best practice with particular emphasis on safety and the environment.
Reward employee performance and provide a fulfilling work environment.
Contribute to the growth and prosperity of the countries in which Paladin operates by conducting operations in an efficient and effective manner and by seeking out opportunities for expansion.
Respond to the attitudes and expectations of the communities in which it operates as part of its corporate social responsibility obligations.
Act with integrity, honesty and cultural sensitivity in all of its dealings.
PALADIN TODAY
Overview Paladin’s value is based on four key drivers - producing mines, quality pipeline, proven team
and industry positioning.
Operations Strong production growth delivered, all underpinned by early life cycle mines.
Development and building of producing assets successfully completed.
Mines operating at nameplate capacity.
Innovation & Project Pipeline
Proven track record in mining and processing innovation.
Established in-house technical strength.
Consolidating a unique, geographically diversified asset base.
Positioning Going Forward
Only non-aligned pure play uranium producer.
Long-term business strategy and vision is to gain added strength through establishment of key partnerships.
Maintain Paladin to be a partner of choice.
Focus on optimisation of producing mines. Progress well underway through technical innovation and cost optimisation.
Project pipeline able to drive organic growth.
For
per
sona
l use
onl
y
4
CORPORATE VALUES AND KEY ACHIEVEMENTS __________________________________________________________________________________
KEY ACHIEVEMENTS FOR THE YEAR
August 2012 Secured Long-term Off-take Agreement with a US$200M pre-payment with Électricité de France.
November 2012 Announced cost reductions/production optimisation initiatives of US$60 - US$80M over next 2 years.
December 2012 Record quarterly combined production from Langer Heinrich and Kayelekera of 2.191Mlb U3O8.
February 2013 Bankers’ Completion Tests satisfied at both mines.
March 2013 Repaid in full the outstanding balance of the US$325M March 2013 Convertible Bonds.
June 2013 Record annual production of 8.255Mlb U3O8, well within stated guidance of 8.0 - 8.5Mlb.
C1 cost of production(1) year on year – LHM reduced by 9%, KM reduced by 24%.
KEY ANNUAL DATA
(1) Refer to ‘Reconciliation of C1 Cost of Production to Cost of Goods Sold’ in Financial Review section.
8.25Mlb U3O8 sold, up from 6.70Mlb, a 23% increase
Sales revenue up 12% from US$365.8M to US$408.4M
Production up 20% from 6.9Mlb to 8.255Mlb U3O8
For
per
sona
l use
onl
y
5
CORPORATE VALUES AND KEY ACHIEVEMENTS __________________________________________________________________________________
WHAT WE SET OUT TO DO IN 2013
Achieve steady state production at design levels for both Langer Heinrich and Kayelekera mines.
Optimise production costs at Langer Heinrich and Kayelekera.
Complete Stage 4 Langer Heinrich Mine feasibility study.
(lower priority due to low uranium prices)
2013 production guidance in the range of 8.0 to 8.5Mlb U3O8.
Resource update for Kayelekera Mine.
Continue to improve NOSA health and safety system rating for Langer Heinrich
and Kayelekera mines.
Consolidate sustainability reporting.
Initiate resource upgrade programmes at Michelin and Manyingee Projects.
Increase value in future term supply contracts.
Continue to seek value increase in existing pipeline projects through joint venture
and M&A.
Drive organic growth through project pipeline.
WHAT WE PLAN TO DO IN 2014
2014 production guidance in the range of 8.3 to 8.7Mlb U3O8.
Further reduce unit production costs at Langer Heinrich and Kayelekera mines via: - Focused cost management. - Optimisation of existing processes. - Ongoing development and introduction of process innovation.
CODE
Not achieved
Ongoing
Achieved
For
per
sona
l use
onl
y
6
CORPORATE VALUES AND KEY ACHIEVEMENTS __________________________________________________________________________________
Develop resource update for Michelin project.
Improve NOSA health and safety system rating for Langer Heinrich and Kayelekera mines.
Increase value through strategic partnerships.
Commence statutory approvals process to enable a Field Leach Trial at Manyingee.
Sell minority equity interest in selected uranium assets.
Strengthen balance sheet through debt reduction.
For
per
sona
l use
onl
y
7
CHAIRMAN’S LETTER __________________________________________________________________________________ Dear Fellow Shareholders
Operationally the past financial year has been a watershed for Paladin. Both the Langer Heinrich and Kayelekera mines delivered record production with the result that the 8.255Mlb (3,745t) U3O8 annual production was well within the stated guidance of between 8.0 and 8.5Mlb.
Our dedicated teams based in Namibia and Malawi, with support from our Perth based technical services team, worked hard to overcome the occasional technical issues that arise in complex operations such as these. Moreover, they achieved these impressive production results whilst also substantially reducing unit costs of production.
Safety performance at both operations during the financial year was to a high standard however, sadly, after 489 days with zero lost time injuries at Kayelekera, a fatality occurred on 30 July 2013 in the tyre fitting workshop. On behalf of the Board, employees and shareholders, I extend my sympathy to Mr Khwima Phiri’s family. Following an investigation, additional procedures have been instituted with a view to preventing such accidents in the future.
It is a frustrating irony for Paladin’s employees and shareholders that, following some seven years of continuous building, expansion, upgrade and modification at both operations, this impressive operational platform should be reached when the spot price for uranium is at an eight year low. As a consequence, the return to the Governments of Namibia and Malawi through royalties and taxes has also diminished. However, although our product marketing team have worked hard to achieve the best prices possible, the uranium price is totally beyond Paladin’s control.
As detailed further in this Annual Report, the Board and management of Paladin feel confident that a strong future exists for the uranium industry and, for that reason, we continue to support the existing operations. The Langer Heinrich mine is clearly a world class, long life, lower quartile cost mine with a bright future.
Unfortunately the Kayelekera mine has a limited resource life and, due to the nature and location of the orebody, is a higher cost operation. The Company is continuing to work on strategies to extend the mine life and reduce costs in the expectation that, in a higher uranium price environment, the Company can begin to receive a return on its investment and see higher returns provided to Malawi.
Shareholders will recall that during the financial year, in August 2012, the Company entered into an important long-term off-take contract with Électricité de France (EdF) for delivery of uranium in the period 2019 to 2024 incorporating a prepayment of US$200M. The prepayment was applied largely to repayment of convertible notes due March 2013.
The contract with EdF represented a key component of Paladin’s strategic initiatives aimed at improving the Company’s balance sheet. The other component of the strategic initiatives involved a potential sale of a minority interest in the Langer Heinrich mine. The sharp decline in the uranium price during the latter part of this sale process had the consequence that the Paladin Board decided to terminate the process after the preferred bidder advised on 1 August 2013 that it wanted to renegotiate the terms, including price, at the final stage of the process. The Board determined it would not be in the best interests of shareholders to continue to negotiate and took the responsible decision that the Company would not sell a part of this asset at a significant discount to Paladin’s underlying value.
Following that decision, the Board also determined it needed to move quickly to allay any potential market concerns about its balance sheet and place the Company in a position of strength, enabling the Company sufficient time to focus on achieving an optimal outcome in future negotiations on asset sales to achieve debt reduction.
With the circumstances as they evolved, the Paladin Board took the prudent approach to make a placement to stabilise its cash position enabling Paladin to continue to operate through this weak price environment and providing essential time to complete our strategic initiatives.
The equity raising was successfully completed in a difficult equity market and this clearly reflects strong institutional support for both Paladin and the future of the uranium industry.
The Paladin Board remains committed to asset sales and will continue to keep the door open for the sale of a minority interest in Langer Heinrich. However, it was felt important to send a strong message to potential bidders that Paladin will not be forced to sell its most valuable asset in this current weak market.
I am pleased that during the year the Company released on its website its first Sustainability Report under the Global Reporting Initiative. This is a comprehensive set of information on sustainability practices and I encourage shareholders to review this report. As I note in the report, Paladin’s core focus over recent years – particularly since the events in Japan in March 2011 – has been building on the foundations of business sustainability under extremely challenging market conditions.
In addition to the work on reducing production costs, the Company has moved to reduce costs throughout the organisation such as significantly deferring exploration and, unfortunately, making redundant a number of our staff. Regardless, our intention remains to retain our core capability in studied anticipation of improvement in the uranium price. On behalf of the Board, I wish to thank all staff for remaining loyal and dedicated to the Company during these difficult economic times. I thank John Borshoff also for his tireless efforts and offer to remain on a reduced salary. I sincerely hope that the future will offer due reward for all employees, shareholders and supporting communities.
Yours faithfully
RICK CRABB BJuris(Hons),LLB,MBA,FAICD
For
per
sona
l use
onl
y
9
INSIGHTS FROM THE MANAGING DIRECTOR/CEO __________________________________________________________________________________ Dear Shareholder
Those that have been following Paladin for many years will know that we have been building the Company with a specific vision in mind. Even with the unique challenges of uranium and the short-term negative reaction from Fukushima the uranium industry nevertheless offers a great opportunity to create a company of global significance in the energy sector with appropriate rewards for its shareholders. The construction of two technologically innovative mining operations in Africa and the concurrent assembly of a geographically diversified project pipeline to provide the nursery and basis for the establishment of additional uranium mines (when prices justify) reflect two of our three major cornerstone principles for achieving the Paladin vision. The third equally important cornerstone was building the Company’s human capital, ensuring the right blend of expertise and experience required to establish and guide a mining company involved with the intricacies of dealing with uranium. With these cornerstones in place, Paladin remains well differentiated from its peers.
Thus, Paladin has moved itself into a prominent position in the global uranium mining and nuclear fuel supply landscape.
Today, the forward thinking approach that Paladin has taken, establishing uniqueness both operationally and strategically in the uranium industry, has given the Company value both tangible and intangible, through its achievements to date and the platform it has created for future opportunities.
I have spoken about the benefits that would arise for Paladin from the technically innovative processes we conceived and deployed at our mines and the advantages these would confer in terms of cost minimisation and production optimisation in later years. At the same time, I have also spoken about the need for a uranium price increase to incentivise much needed supply growth as well as the other significant constraints that are limiting new uranium mine development. As a result, the uranium industry is struggling to achieve a sustainable level of production to ensure sufficient future supply. Worryingly for the uranium consumers, nearly all the major uranium mining companies have effectively and independently started calling a halt to their respective greenfield expansion programmes until certain price thresholds are met, starting from a minimum price for uranium of about US$70/lb.
Last November I advised that we had reached an important milestone in the development of Paladin. For the first time in nearly eight years Paladin had moved from being in a predominantly construction growth phase into one of production. I also advised that the Company had begun a broad cost reduction/production optimisation programme that, by its nature could only be attempted once construction activities were completed and the operations had reached their design performances and were essentially de-risked. Our work over the last twelve months to June clearly show the positive results and trends for both production increases and unit cost reductions which are a considerable achievement in improving our operations and corporate performance.
It is pleasing to note that the FY13 costs reductions we forecast in early November 2012 were exceeded at both sites, and further gains are expected for FY14. At Langer Heinrich Mine, the C1 cost of production was reduced by 9% compared to end FY12. At Kayelekera Mine, the C1 cost of production for FY13 was reduced by 24% on a similar comparison. Further improvement is expected from both sites.
Our safety record for FY13 remained at a high standard over all our operations. Tragically, post reporting period in late July, a fatality occurred at the Kayelekera Mine site in our maintenance workshop with a freak accident involving the repair of a light vehicle tyre. Safety remains our number one priority and our policy is for zero harm to our workforce and procedures are being reviewed and reinforced to ensure this type of accident will not occur again.
Since Paladin built Kayelekera in 2011, no greenfield uranium mine developments have been undertaken. In fact, if anything, the industry has regressed. The Trekkopje project in Namibia has been terminated by the French and the Imouraren project in Niger has been delayed. BHP has indefinitely deferred their Olympic Dam expansion in Australia and abandoned their multi mine uranium strategy altogether having sold the Yeelirrie project in Western Australia. Apart from the new Chinese-owned Husab project in Namibia currently in its early construction phase, and the long-delayed Cigar Lake project in Canada, nothing of any significance is happening elsewhere in terms of net new uranium mine development. On the contrary, several major producers are experiencing production constraints which will limit their ability to maintain output at current levels over the next six
For
per
sona
l use
onl
y
10
INSIGHTS FROM THE MANAGING DIRECTOR/CEO (continued)
or so years. In other words, the uranium industry is seeing stagnating performance and is basically running out of time to achieve necessary supply growth targets. No one with economic sense is prepared to invest more capital to grow greenfield production at anywhere near current uranium prices. In a very real way, this is placing Paladin in an excellent position to take advantage when prices inevitably do increase to correct the severe imbalance that currently exists.
Consider the irony. The nuclear power industry post-Fukushima is normalising and returning to growth. This is evident when one looks at what is happening in existing and emerging nuclear economies. In China, India, the UAE, along with Russia, South Korea and UK, nuclear power programmes have been re-affirmed. There are now 68 nuclear reactors under construction in 13 countries.
However, the supply outlook for uranium post-Fukushima presents a stark contrast. Although demand has overcome post-Fukushima uncertainty, supply has gone into a tailspin with the projected supply gap is ever widening. Despite the building demand fundamentals, uranium producers are exhibiting a perfectly rational unwillingness to grow capacity under current conditions. I believe the supply shortage is now unavoidable and will be undeniably apparent sooner rather than later. The consumers – the world’s nuclear utilities – are hoping against hope that somehow the mining industry will commit economic suicide and add new production at a time when returns offered by current prices are negative. This will not happen.
The problem of supply growth is not only limited by today’s uranium price. Timely supply will become even more difficult to achieve as other crucial drivers have their full negative impact such as a lack of confidence in achieving an elevated and sustainable pricing structure and a lack of conviction in the financial markets.
Although the key issue is the poor pricing outlook, which provides no solid incentive to start new production, additional constraints beyond finance are also retarding supply growth. This ranges from the technical, political and regulatory to the poorer quality of available exploitable ore bodies. All of these challenges will significantly decrease the ability of the industry to advance the development of much needed new mines in an orderly and timely manner. I would say that the situation has arrived where it is almost impossible for the mining industry to meet the projected demand over at least the next decade and a half.
The hugely escalating capital costs now required to build uranium mines combined with the complex stakeholder issues that need to be resolved to accommodate the demanding regulatory regimes mean that the experienced operators are best positioned to provide growth. It will be very difficult in this extreme environment for the next generation of junior companies to contribute substantially and build projects that would cost from US$300M - US$400M and upwards to well over US$1bn for conventional mining operations along with all the attendant risks that need to be negotiated. For instance, to build Langer Heinrich today, would take a capital expenditure in the vicinity of US$0.9bn to US$1.1bn.
As an extremely experienced leader and innovator in this complex environment, Paladin is in a prime position to benefit its shareholders.
Our efforts to unlock value from our existing 100% owned assets continue with the focus on selling a minority interest in our Langer Heinrich Project. This is necessary to strengthen our balance sheet by reducing overall debt. As we have previously disclosed, negotiations with one party were at an advanced stage when the uranium price downtown provoked the other party to choose to renegotiate the price and other terms. To preserve shareholder value, Paladin had no choice other than to terminate the discussions and defer efforts to sell the minority interest in this world class asset until the market environment improves.
A minority interest in Langer Heinrich offers the only opportunity in the world for a party to acquire at a valuable equity-level participation in an operating uranium mining project, which has significant upside potential and a long mine life with immeasurable strategic value. The Company is confident that it will achieve its objective of receiving fair value, having shown its resolve that it will not discount the significant scarcity value that the project has earned and that will be the driving factor in price determination.
For
per
sona
l use
onl
y
11
NUCLEAR POWER – GETTING BACK ON TRACK __________________________________________________________________________________ More than two years after the Great East Japan Earthquake and resultant tsunami struck the Tohuku region, causing massive loss of life and widespread physical destruction including the Fukushima Dai-ichi nuclear power plants operated by Tokyo Electric Power Company, the world’s nuclear power programmes are now facing the future with renewed confidence. Globally, there are 435 operable nuclear power plants (a number that includes 48 plants in Japan that are still off-line pending re-start approvals by Japan’s Nuclear Regulation Authority) that produced approximately 11% of the world’s electricity in 2012. Sixty-eight new nuclear power reactors, located in 12 countries, are now under construction, with a total of 162 reactors in the “planned” category, both numbers of which are higher than immediately prior to the Fukushima event. Therefore, subsequent to the necessary reappraisal of nuclear power in light of the Fukushima experience, the demand outlook for nuclear fuel and its basic component, natural uranium concentrates, has never been brighter. Now, however the principal focus must return to future uranium supply.
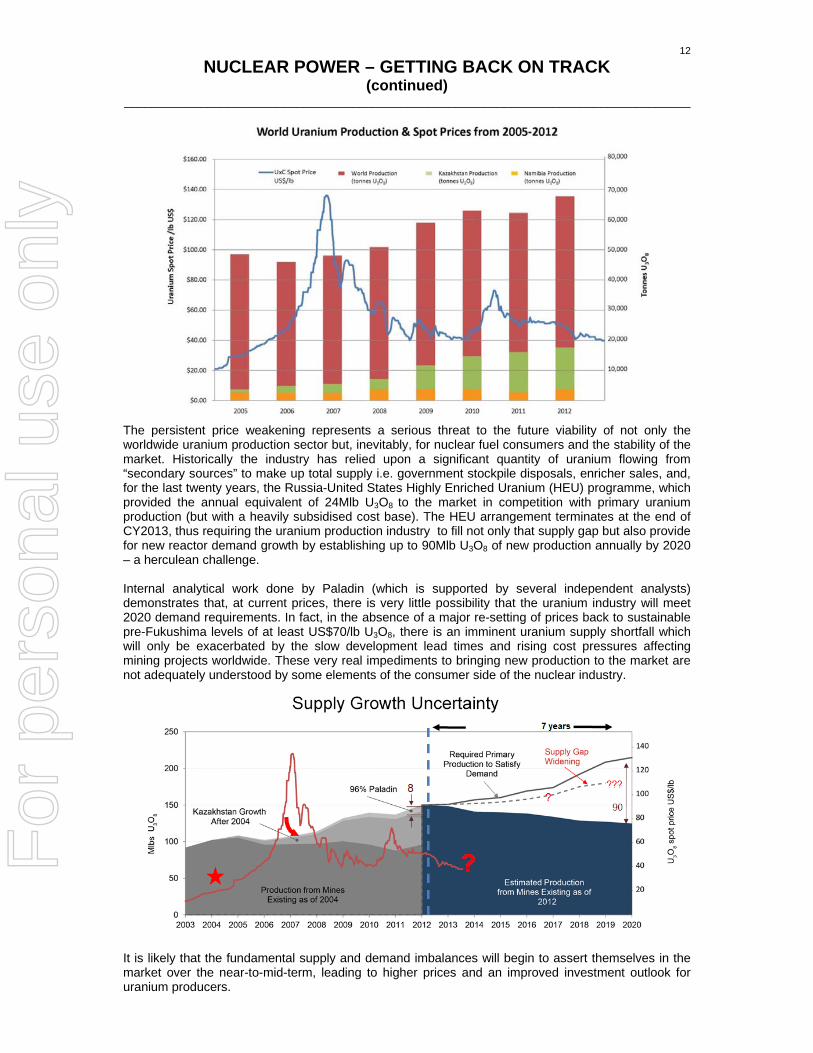
Market and Supply Issues The uranium market has experienced contradictory conditions over the past year in which reasserted medium and long-term demand growth has been temporarily masked by short-term excess supply and, as a result, unsustainably weak prices. World uranium production has continued to rise in response to higher prices prevailing prior to Fukushima reaching 68,805mt U3O8 (151.7Mlb) in 2012, up 9% on 2011 production. However, this is still below estimated reactor demand of 172Mlb U3O8 in 2012. Most of the production increase is attributable to Namibia and Kazakhstan, neither of which will sustain these growth rates in the longer term. Short-term price weakness became evident in mid-2012 and erosion of both spot and mid-term pricing continued throughout the year, with the spot uranium price falling to $39.50/pound U3O8 by the end of FY2013.
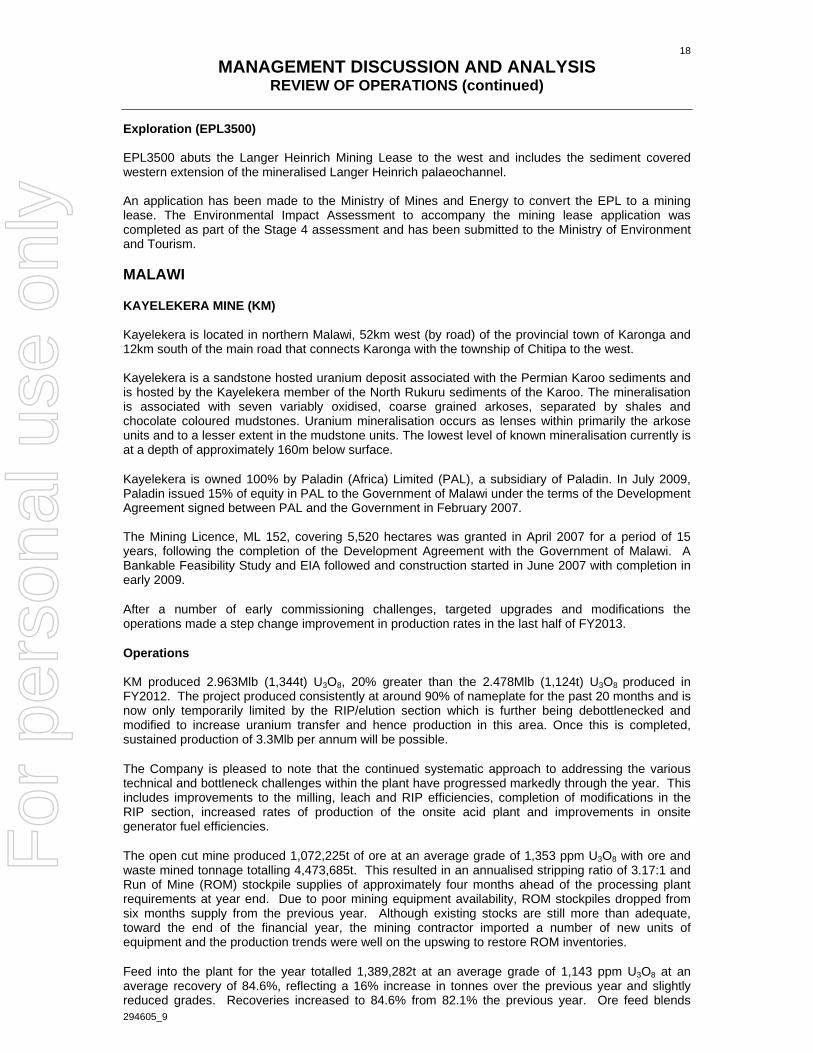
The persistent price weakening represents a serious threat to the future viability of not only the worldwide uranium production sector but, inevitably, for nuclear fuel consumers and the stability of the market. Historically the industry has relied upon a significant quantity of uranium flowing from “secondary sources” to make up total supply i.e. government stockpile disposals, enricher sales, and, for the last twenty years, the Russia-United States Highly Enriched Uranium (HEU) programme, which provided the annual equivalent of 24Mlb U3O8 to the market in competition with primary uranium production (but with a heavily subsidised cost base). The HEU arrangement terminates at the end of CY2013, thus requiring the uranium production industry to fill not only that supply gap but also provide for new reactor demand growth by establishing up to 90Mlb U3O8 of new production annually by 2020 – a herculean challenge. Internal analytical work done by Paladin (which is supported by several independent analysts) demonstrates that, at current prices, there is very little possibility that the uranium industry will meet 2020 demand requirements. In fact, in the absence of a major re-setting of prices back to sustainable pre-Fukushima levels of at least US$70/lb U3O8, there is an imminent uranium supply shortfall which will only be exacerbated by the slow development lead times and rising cost pressures affecting mining projects worldwide. These very real impediments to bringing new production to the market are not adequately understood by some elements of the consumer side of the nuclear industry.
It is likely that the fundamental supply and demand imbalances will begin to assert themselves in the market over the near-to-mid-term, leading to higher prices and an improved investment outlook for uranium producers.
For
per
sona
l use
onl
y
13
MANAGEMENT DISCUSSION AND ANALYSIS __________________________________________________________________________________
294605_8
The following Management Discussion and Analysis (MD&A) for Paladin Energy Ltd (Paladin or the Company) should be read in conjunction with the Directors’ Report and the audited Financial Report for the year ended 30 June 2013. The effective date of this report is 29 August 2013. The Financial Report has been prepared in accordance with Australian Accounting Standards, International Financial Reporting Standards (IFRS) as issued by the International Accounting Standards Board, other authoritative pronouncements of the Australian Accounting Standards and the Corporations Act 2001. In addition to these Australian requirements further information has been included in the Consolidated Financial Statements for the year ended 30 June 2013 in order to comply with applicable Canadian securities law, as the Company is listed on the Toronto Stock Exchange. Additional information relating to the Company, including public announcements, is available at www.paladinenergy.com.au. FORWARD LOOKING STATEMENTS
Some of the statements contained in this MD&A, including those relating to strategies and other statements, are predictive in nature, and depend upon or refer to future events or conditions, or include words such as “expects”, “intends”, “plans”, “anticipates”, “believes”, “estimates” or similar expressions that are forward looking statements. Forward looking statements include, without limitation, the information concerning possible or assumed further results of operations as set forth herein. These statements are not historical facts but instead represent only expectations, estimates and projections regarding future events and are qualified in their entirety by the inherent risks and uncertainties surrounding future expectations generally. The forward looking statements contained in this MD&A are not guarantees of future performance and involve certain risks and uncertainties that are difficult to predict. The future results of the Company may differ materially from those expressed in the forward looking statements contained in this MD&A due to, among other factors, the risks and uncertainties inherent in the business of the Company. The Company does not undertake any obligation to update or release any revisions to these forward looking statements to reflect events or circumstances after the date of this MD&A or to reflect the occurrence of unanticipated events.
For
per
sona
l use
onl
y
14
MANAGEMENT DISCUSSION AND ANALYSIS REVIEW OF OPERATIONS
294605_9
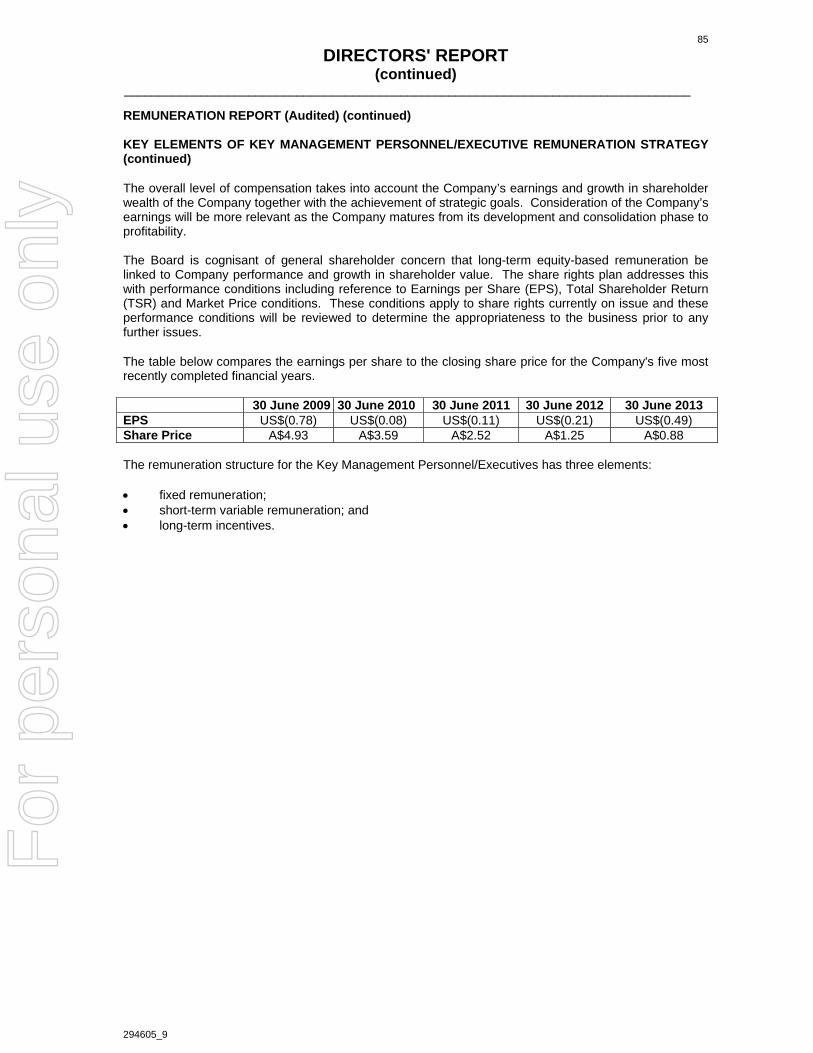
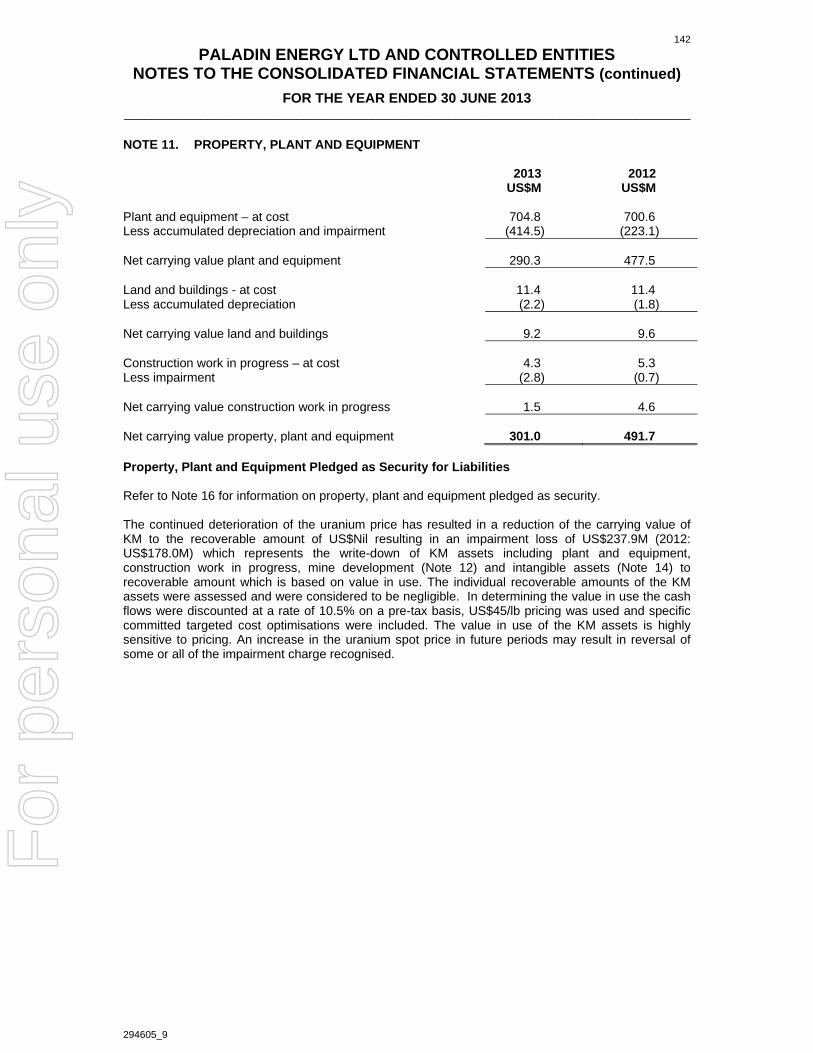
Paladin’s total Mineral Resource inventory includes 177,265t U3O8 (390.1Mlb) at 0.07% U3O8 in the Indicated and Measured categories (including ROM stockpiles) and 81,773t of U3O8 (180.3Mlb) at 0.06% U3O8 in the Inferred Resource category. A summary of the status of each of the advanced projects is detailed in the following table. This table does not include additional JORC(2004) and NI 43-101 compliant Mineral Resources from Bikini, Andersons, Mirrioola, Watta and Warwai deriving from Paladin’s 82.08% ownership of Summit Resources Ltd, as well as the Duke Batman and Honey Pot deposits.
For
per
sona
l use
onl
y
15
MANAGEMENT DISCUSSION AND ANALYSIS REVIEW OF OPERATIONS (continued)
294605_9
Project
Overview Mining Method/ Deposit Type
Outlook
Resources
Uranium Production
*Langer Heinrich Mine - 100% (Namibia, Southern Africa)
The Company’s cornerstone asset commenced production in 2007. The Stage 3 expansion is complete with production at 5.2Mlb per annum (pa). Studies are underway for a further expansion to 8.5Mlb pa.
Planning is underway for resource extension and development drilling.
Open pit - underground; sandstone
Future direction of project will be determined by market conditions
Inferred: 10.7Mt @ 0.13% (30.8Mlb U3O8)
Mineral Resources are quoted inclusive of any Ore Reserves that may be applicable. Mineral Resources detailed above in all cases represent 100% of the resource – not the participant’s share. *Conforms to JORC(2004) guidelines & is NI 43-101 Compliant. **Conforms to JORC(1999) guidelines. (a) For Kayelekera, the Government of Malawi holds a 15% equity interest in the subsidiary, Paladin (Africa) Limited, the holder of the Kayelekera Mining Licence. (b) For Valhalla, Skal & Odin, Paladin’s interest is based on 50% deriving from the Isa Uranium Joint Venture and 41.04% via Paladin’s 82.08% ownership of Summit Resources Ltd. Langer Heinrich and Kayelekera Mineral Resources have been depleted for mining to the end of June 2013. M&I = Measured and Indicated.
For
per
sona
l use
onl
y
16
MANAGEMENT DISCUSSION AND ANALYSIS REVIEW OF OPERATIONS (continued)
294605_9
NAMIBIA LANGER HEINRICH MINE (LHM) LHM in Namibia is owned 100% by Paladin through its wholly owned Namibian subsidiary, Langer Heinrich Uranium (Pty) Ltd (LHUPL). Paladin purchased the Langer Heinrich project in August 2002 and, following development and construction, commenced producing from the open pit mine and conventional alkaline leach plant in early 2007 with annual production of 2.7Mlb of U3O8 achieved in 2008/2009. Soon afterwards, a Stage 2 expansion was undertaken to increase production to 3.7Mlb pa U3O8 followed by construction and commissioning of the Stage 3 expansion, completed in FY2012. The mine has produced consistently at a rate of 5.2Mlb pa U3O8 for the past 12 months. Langer Heinrich is a surficial, calcrete type uranium deposit containing a Mineral Resource of 77,980t U3O8 at a grade of 0.054% U3O8 (250ppm U3O8 cut-off grade) in seven mineralised zones designated Detail 1 to 7 (see figure below), along the length of the Langer Heinrich valley within the 15km length of a contiguous paleodrainage system. The deposit is located in the Namib Desert, 80km from the major seaport of Walvis Bay.
Operations
This year marked the first year of production without major construction occurring simultaneously with production. Production for the year totalled 5.292Mlb (2,401t) U3O8, up 20% from the previous year’s total of 4.417Mlb (2,004t) U3O8. With various stages of expansion, the mine has now sustained production increases of approximately 20% year on year for the past four consecutive years.
As FY2013 was the first steady state operating year, there was a substantial focus on final commissioning and optimisation. This focus was not only on the newer Stage 3 configuration, but also on the older Stage 1 and 2 equipment. The results thus far have been impressive, providing significant gains in efficiency and reduction in costs of operation. These gains have placed the operation in a very strong position going forward and further improvements are anticipated.
During the year, the mine ramped-up to meet Stage 3 ore feed requirements with the mining of 7,610,806t of ore at an average grade of 568ppm U3O8, an increase of 16% over the previous year. The total mined tonnages (ore and waste) were 27,751,086t at an average stripping ratio of 2.65:1.
Ore feed into the plant totalled 3,439,902t, an increase of 30% over the previous year, at an average grade of 812ppm U3O8. This was 11% lower than the feed grade of 909ppm U3O8 the previous year. Recovery also improved substantially to 86.0%, up from 83.2%. All of these positive production metrics reflect the benefit of the Stage 3 equipment and the additional efficiencies obtained largely due to steady state operations and a sharp focus on optimisation initiatives.
For
per
sona
l use
onl
y
17
MANAGEMENT DISCUSSION AND ANALYSIS REVIEW OF OPERATIONS (continued)
294605_9
In November 2012, the Company announced an initiative to materially reduce the operating and unit costs at LHM. In this announcement, a 7.5% reduction on costs was forecast and, in the June quarterly report, the Company was pleased to announce that the C1 cost of production for FY2013 had been reduced by 9% compared to June 2012, with further cost reductions expected in FY2014. The Stage 4 expansion study continued to advance with a re-focussed mandate, as the efficiencies and capacities of the various Stage 3 units of equipment in the plant were realised and became better quantified. This has presented a unique opportunity to improve on and optimise various aspects of the Stage 4 study and resultant expected future outcomes and underlines the feasibility of increasing production up to 8.7Mlb U3O8 pa at a time when higher uranium prices justify expansion. During the interim, various piloting and testing programmes will continue in order to consider the available options and enhancements in preparation for this future expansion. The goal of this work is higher production, with reduced unit costs and improved process efficiencies, while reducing feed grade into the plant to the reserve average of 520ppm U3O8. The work undertaken will ensure that the project will be in an excellent position to respond at short notice for expansion when the price incentive is considered to be sufficient. Mineral Resources and Ore Reserves conforming to both the JORC(2004) code and NI 43-101 are detailed below. Mineral Resource estimate (depleted for mining at end of June 2013) for Details 1 to 7:-
Ore Reserve has been depleted for mining to the end of June 2013
The Ore Reserve was estimated from the original un-depleted Measured and Indicated Mineral Resource of 139.3Mt at a grade of 0.055% U3O8. The Mineral Resource estimate was completed using Multi Indicator Kriging and incorporates a specific adjustment based on expected mining parameters. As a result, additional dilution and mining recovery are not included in the Ore Reserve estimation. These reserves form the basis of the continuing life of mine plan for the Project. The revised mine plan allows a project life in excess of 20 years, based on a processing feed rate of 3.45Mt/a
For
per
sona
l use
onl
y
18
MANAGEMENT DISCUSSION AND ANALYSIS REVIEW OF OPERATIONS (continued)
294605_9
Exploration (EPL3500) EPL3500 abuts the Langer Heinrich Mining Lease to the west and includes the sediment covered western extension of the mineralised Langer Heinrich palaeochannel. An application has been made to the Ministry of Mines and Energy to convert the EPL to a mining lease. The Environmental Impact Assessment to accompany the mining lease application was completed as part of the Stage 4 assessment and has been submitted to the Ministry of Environment and Tourism. MALAWI KAYELEKERA MINE (KM) Kayelekera is located in northern Malawi, 52km west (by road) of the provincial town of Karonga and 12km south of the main road that connects Karonga with the township of Chitipa to the west. Kayelekera is a sandstone hosted uranium deposit associated with the Permian Karoo sediments and is hosted by the Kayelekera member of the North Rukuru sediments of the Karoo. The mineralisation is associated with seven variably oxidised, coarse grained arkoses, separated by shales and chocolate coloured mudstones. Uranium mineralisation occurs as lenses within primarily the arkose units and to a lesser extent in the mudstone units. The lowest level of known mineralisation currently is at a depth of approximately 160m below surface.
Kayelekera is owned 100% by Paladin (Africa) Limited (PAL), a subsidiary of Paladin. In July 2009, Paladin issued 15% of equity in PAL to the Government of Malawi under the terms of the Development Agreement signed between PAL and the Government in February 2007. The Mining Licence, ML 152, covering 5,520 hectares was granted in April 2007 for a period of 15 years, following the completion of the Development Agreement with the Government of Malawi. A Bankable Feasibility Study and EIA followed and construction started in June 2007 with completion in early 2009.
After a number of early commissioning challenges, targeted upgrades and modifications the operations made a step change improvement in production rates in the last half of FY2013.
Operations KM produced 2.963Mlb (1,344t) U3O8, 20% greater than the 2.478Mlb (1,124t) U3O8 produced in FY2012. The project produced consistently at around 90% of nameplate for the past 20 months and is now only temporarily limited by the RIP/elution section which is further being debottlenecked and modified to increase uranium transfer and hence production in this area. Once this is completed, sustained production of 3.3Mlb per annum will be possible.
The Company is pleased to note that the continued systematic approach to addressing the various technical and bottleneck challenges within the plant have progressed markedly through the year. This includes improvements to the milling, leach and RIP efficiencies, completion of modifications in the RIP section, increased rates of production of the onsite acid plant and improvements in onsite generator fuel efficiencies.
The open cut mine produced 1,072,225t of ore at an average grade of 1,353 ppm U3O8 with ore and waste mined tonnage totalling 4,473,685t. This resulted in an annualised stripping ratio of 3.17:1 and Run of Mine (ROM) stockpile supplies of approximately four months ahead of the processing plant requirements at year end. Due to poor mining equipment availability, ROM stockpiles dropped from six months supply from the previous year. Although existing stocks are still more than adequate, toward the end of the financial year, the mining contractor imported a number of new units of equipment and the production trends were well on the upswing to restore ROM inventories.
Feed into the plant for the year totalled 1,389,282t at an average grade of 1,143 ppm U3O8 at an average recovery of 84.6%, reflecting a 16% increase in tonnes over the previous year and slightly reduced grades. Recoveries increased to 84.6% from 82.1% the previous year. Ore feed blends
For
per
sona
l use
onl
y
19
MANAGEMENT DISCUSSION AND ANALYSIS REVIEW OF OPERATIONS (continued)
294605_9
demonstrated that the plant could consistently process in the order of 20-25% mudstone ores without any material difficulties.
In November 2012, the Company announced an initiative to reduce unit operating costs at KM by 7.5%. This was a major focus as the operation moved from ramp-up phase to sustainable production. The main area of reduction was a marked decrease in imported acid and the achievement of acid independence later in the year. The largest contributors to acid independence were ore blend management and the acid plant optimisation, which now routinely produces 250tpd of acid as compared to 220tpd previously. In addition to acid savings, there were further substantial savings made as a consequence of the debottlenecking and optimisation discussed above, as well as in areas such as reagents, reducing the workforce and transport plus a reduction in theft due to a more targeted security programme. The Company reported that the C1 cost of production for FY2013 at KM was reduced by 24% compared to June 2012. In addition, initiatives in acid recycling and grid power connection, are expected to result in further substantial cost reductions in FY2014.
Mineral Resources and Ore Reserves Estimation A revised and updated geological model is being developed for the project based on extensive pit mapping and structural modelling. Additional work is being carried out by the mine geologists, assisted by external consultants, to improve the understanding of the structurally complex nature of the resource. This information is expected to be incorporated into a revised and updated mineral resource estimate in the future. At this stage, no additional resource drilling is anticipated; however, this may be reviewed based on the geology modelling results. Mineral Resources and Ore Reserves conforming to both the JORC(2004) code and NI 43-101 are detailed below. Mineral Resource at 300ppm U3O8 Cut-off
Stockpiles 1.54 945 1,454 3.21Inferred Resources 5.4 623 3,336 7.4(Figures may not add due to rounding and are quoted inclusive of any Ore Reserves and are depleted for mining to end of June 2013) The Mineral Resource is unchanged from that previously reported except for depletion due to mining activities to 30 June 2013. The Mineral Resource estimate is based on Multi Indicator Kriging techniques with a specific adjustment based on parameters derived from the mining process. Ore Reserves Economic analysis on this Resource has indicated a break-even cut-off grade of 400ppm U3O8. Ore Reserve at 400ppm U3O8 Cut-off
(Figures may not add due to rounding and are depleted for mining to end of June 2013)
For
per
sona
l use
onl
y
20
MANAGEMENT DISCUSSION AND ANALYSIS REVIEW OF OPERATIONS (continued)
294605_9
The underlying Ore Reserve is unchanged from the one announced in 2008 and has only been depleted for mining until 30 June 2013. The updated Mineral Resource estimate, which will be based on all drilling to date, is expected to result in the estimation of additional Measured and Indicated category material. The cost, processing, mining and pricing parameters used in the Ore Reserve estimation are now well understood, and as such, their use in any updated Ore Reserve estimation can be reasonably justified. The 2011 drilling showed that the mineralisation was not fully delineated, particularly at depth with additional mineralisation identified below and to the west of the current mine units. Once the updated geological model has been completed, an assessment of the potential economic viability of this deeper mineralisation will be undertaken. Pending the outcome of this assessment, additional drilling may be completed further to the west. Exploration Regional exploration drilling involved the completion of 14 holes totalling 1,784m in the Mlowo area in North Mpata approximately 15km north-east of the mine site. Drilling was terminated early due to technical problems of the drilling contractor and no alternate contractor could be sourced at short notice. Although uranium mineralisation was frequently encountered, all intersections were sub-economic and no more drilling is likely to be undertaken in this area. Other exploration work concentrated on ground geophysical and geological surveys of seven target areas in preparation for drilling in the Mwakenja and Mwopa areas north-west of the mine site as well as in the North Rukuru Basin and the Livingstonia area to the south of the mine site. NIGER (West Africa) PROJECT AGADEZ Project Agadez is located in northern Niger, north-west Africa, 30km west and north-west of the township of Agadez. It includes four exploration concessions, Tagait 4 (TAG4), Toulouk 1 (TOU1), Terzemazour 1 (TER1), and Ekazan 1 (EKA1) covering a total area of 990km2. The tenements are located in the Tim Mersoï Basin and are prospective for sandstone type uranium mineralisation in Carboniferous, Permian and Jurassic sediments. The basin has historically produced in excess of 280Mlb U3O8 from two mines (Somair and Cominak) held by Areva. The Project contains a low-grade Inferred Mineral Resource of 11Mlb U3O8 at 210ppm U3O8 at a cut-off grade of 120ppm U3O8, defined by the previous owners, in shallow sediments. Paladin, however, is targeting higher grade uranium mineralisation in the lower stratigraphies of the area. In early 2011, Paladin carried out a drilling programme that further defined targets for follow-up in the prospective strata. Information from this drilling was used to plan a 15,000m follow up drilling campaign; however, this was put on hold due to the deteriorating security situation, particularly within the Agadez region. Following an escalation in terrorist activities in the Agadez and Arlit areas, all fieldwork on the project has ceased and a force majeure has been requested from the government authorities for indefinite suspension of further expenditure. Exploration licences TAG4, TOU1 and TER1 were halved due to statutory requirements for renewal and were subsequently re-granted for another three years. F
or p
erso
nal u
se o
nly
21
MANAGEMENT DISCUSSION AND ANALYSIS REVIEW OF OPERATIONS (continued)
294605_9
CANADA MICHELIN PROJECT The Michelin Project is located 140km north-east of Goose Bay, Labrador, Canada, and 40km south-west of the community of Postville. This project is held 100% through the Aurora Energy Ltd group, wholly owned by Paladin. Paladin completed the acquisition of the uranium assets of Aurora Energy Resources Inc. (Aurora) from Fronteer Gold Inc. in February 2011. Paladin now holds title to significant uranium assets within the highly prospective Central Mineral Belt (CMB) of Eastern Canada. In December 2011, the Nunatsiavut Government voted to lift the three year moratorium of the mining development and production of uranium on Labrador Inuit land. In March 2012, the Government enacted an amendment to the Labrador Inuit Lands Act, formally lifting that moratorium. The Nunatsiavut Government is a regional, aboriginal government formed in 2005. Five of Paladin’s six deposits fall within the Labrador Inuit Lands, the area administered by the Nunatsiavut Government. The CMB contains publically reported 83.9Mlb U3O8 Measured and Indicated Mineral Resources as well as an additional 86.6Mlb U3O8 Inferred Mineral Resource in 12 deposits owned by various parties. The largest of these deposits is Michelin, the star of Aurora’s CMB project and one of the world’s top five albitite-hosted resources. Seven of the deposits, with 83.9Mlb U3O8 Measured and Indicated Mineral resources and 66.7Mlb U3O8 of Inferred Mineral resource, are within 50km of the potential Michelin mill site. With the exception of one, Aurora owns all of these deposits. The table below summarises Aurora’s uranium resources in Labrador. U3O8 Mineral Resources, conforming to the Joint Ore Reserves Committee (JORC) guidelines, reported by Aurora for the Michelin Project are as follows:
The resources are reported at cut-off grades that contemplated underground (0.05% U3O8 cut-off) and open pit (0.02% U3O8 cut-off) mining, based on preliminary economic assumptions. Following the decision by the Nunatsiavut Government to define a process for lifting the moratorium on uranium processing, Paladin considers the mineral resources associated with the Michelin project to be current mineral resources as defined in National Instrument (NI) 43-101. A technical report titled “Michelin Uranium Project, Labrador, Canada, NI 43-101 Technical Report on Preliminary Assessment,” with an effective date of 1 August 2009, was previously filed by Fronteer Development Group Inc (the previous owner of Aurora) on Sedar. Paladin carried out drilling programmes at Michelin and surrounding areas during both the 2012 northern summer field season and 2013 northern winter field season. A total of 32 diamond core drill holes including 7,920m, which included 28 holes drilled at the Michelin Project and an additional four at the Running Rabbit Lake Prospect 1km east-north-east of the Michelin ore body. Significant results received are detailed in the following table. Uranium mineralisation at Michelin occurs in strongly foliated felsic and mafic Aillik Group rocks in the N60°E-striking, 50°SE-dipping lenticular main zone and in two small hanging wall lenses. Drill intercepts targeting gaps in previous drilling generally showed more variable intercepts than expected; however, in general, they confirmed the core of the mineralisation. An updated resource estimate is planned for August/September 2013. Some large ~100m drilling gaps still exist in the south-west portion of the Michelin mineralisation and these will be targeted for the next drilling programme.
Deposit Measured Mineral Resources Indicated Mineral Resources Inferred Mineral Resources
MANAGEMENT DISCUSSION AND ANALYSIS REVIEW OF OPERATIONS (continued)
294605_9
Geological mapping, prospecting and ground geophysical surveys were carried out along the Michelin trend east and west of the main mineralised zone. The results will now be combined to develop detailed targets for future follow up scout drilling. Exploration data from the current 2013 northern summer field season will be used to plan for an expanded winter drilling programme expected to commence in February 2014. QUEENSLAND Summit Resources (Aust) Pty Ltd (SRA), a wholly owned subsidiary of Summit Resources Limited (Summit), operates the Isa Uranium Joint Venture (IUJV) as well as the Mount Isa North Uranium Project. Paladin has an 82.08% majority shareholding in Summit. These areas cover approximately 1,356km2 and host a number of uranium deposits and resources including the Valhalla and Skal deposits. In January 2009, Paladin completed the takeover of Fusion Resources Ltd (Fusion). This added Fusion’s Valhalla North Project uranium resources, including Honey Pot and Duke Batman, on 361km2 of prospective ground, to the suite of Queensland uranium properties. The Queensland Government lifted the 27-year old ban on uranium mining in Queensland on 22 October 2012. Paladin’s response to this positive change is to pursue a long-term investment strategy in Australia. ISA URANIUM JOINT VENTURE (IUJV) Summit Resources (Aust) Pty Ltd (SRA) 50% and Manager Mount Isa Uranium Pty Ltd (MIU) 50% The IUJV covers ground containing the Valhalla, Odin and Skal uranium deposits 40km north of Mount Isa in Queensland. Participants in the Joint Venture are SRA and MIU, each holding a 50% interest with SRA as manager. MIU is a wholly owned subsidiary of Valhalla Uranium Pty Ltd (VUL), a formerly-listed public company and now a wholly owned subsidiary of Paladin. Following Paladin’s successful takeover of VUL in 2006 and Paladin’s acquisition of 82.08% of the issued capital in Summit, Paladin’s effective participating interest in the IUJV is now 91.04%. Ground subject to the IUJV covers 17km2 at Valhalla and 10km2 at Skal. These two areas lie within a much larger holding of contiguous tenements of 1,633km2 held 100% and managed by SRA and Paladin. A mineral resource estimate for the Valhalla, Odin and Skal deposits is included at the end of this section. Work within the Joint Venture during the year concentrated on mineralogical and metallurgical testing, which will be used to develop a new processing flow-sheet for these types of mineralisation.
For
per
sona
l use
onl
y
23
MANAGEMENT DISCUSSION AND ANALYSIS REVIEW OF OPERATIONS (continued)
294605_9
Isa North and Valhalla North Project Areas
For
per
sona
l use
onl
y
24
MANAGEMENT DISCUSSION AND ANALYSIS REVIEW OF OPERATIONS (continued)
294605_9
MOUNT ISA NORTH URANIUM PROJECT Summit Resources (Aust) Pty Ltd (SRA) 100% and Operator The project is located 10km to 70km north and east of Mount Isa and contains numerous uranium anomalies, most of which still have to be investigated in detail. Exploration continues on Summit’s 100% owned Mount Isa North Project where Summit holds 1,356km2 of granted tenements that are prospective for uranium, copper and base metals. The tenements are centred on the city of Mount Isa. The project includes the Bikini, Watta, Warwai, Mirrioola and Andersons uranium deposits, in addition to numerous other uranium prospects. Work during the year concentrated on Watta and Warwai and their mineral resource status is shown in the table at the end of this section. Regional exploration confirmed targets for future follow-up drilling. VALHALLA NORTH PROJECT The Valhalla North Project (held 100%) is located on two tenements currently totalling 361km2, situated 40 to 75km north of the Valhalla deposit. The geological setting is similar to the Summit/Paladin projects to the south where albitised basalts with interbedded metasediments are mineralised along east-west and north-south structures in Eastern Creek Volcanics. Following extensive validation and revision of the existing drill data, an update to the Watta Mineral Resource was completed. No drilling has been completed since the previous Mineral Resource estimate in 2007. The Warwai deposit, located 1.5km south-east of Watta, has been included in the updated Mineral Resource estimate for the first time. A total of 31 Summit and historic core holes were used in the Mineral Resource estimate and the new resource is included in the Mount Isa overall resource statement at the end of this section. RESOURCE AND DEVELOPMENT STATUS MOUNT ISA REGION - ALL PROJECTS Further metallurgical testwork confirmed that the ore is amenable to high temperature and pressure alkaline leach. Previous mineralogical and metallurgical work showed the mineralisation to be of a very fine grained and sometimes refractory nature, containing increased gangue carbonate minerals. This explains a high acid consumption by such leach tests resulting in marginal economics at current uranium prices. Alkaline leaching the ore, however, showed acceptable recoveries of 80 to 90% at high temperature and pressure, with normal reagent consumption. Radiometric sorting of the mineralisation showed further encouraging results. Testwork in FY2014 will aim at confirming an economic flow-sheet based on alkaline leach and radiometric sorting. The JORC and NI43-101 compliant Mineral Resources under Paladin’s management in the Mount Isa region now totals 106.2Mlb U3O8 Measured and Indicated Mineral Resources and 42.2Mlb U3O8 Inferred Mineral Resources. Of this, 95.8Mlb U3O8 Measured and Indicated Mineral Resources as well as 37.4Mlb U3O8 Inferred Mineral Resources are attributable to Paladin. 51.4% of the Mineral Resources are located at Valhalla; the rest is distributed over the Bikini, Skal, Odin, Andersons, Mirrioola, Watta, Warwai, Duke Batman and Honeypot deposits. The table below lists JORC and NI43-101 compliant Mineral Resources by deposit, on a 100% project basis.
For
per
sona
l use
onl
y
25
MANAGEMENT DISCUSSION AND ANALYSIS REVIEW OF OPERATIONS (continued)
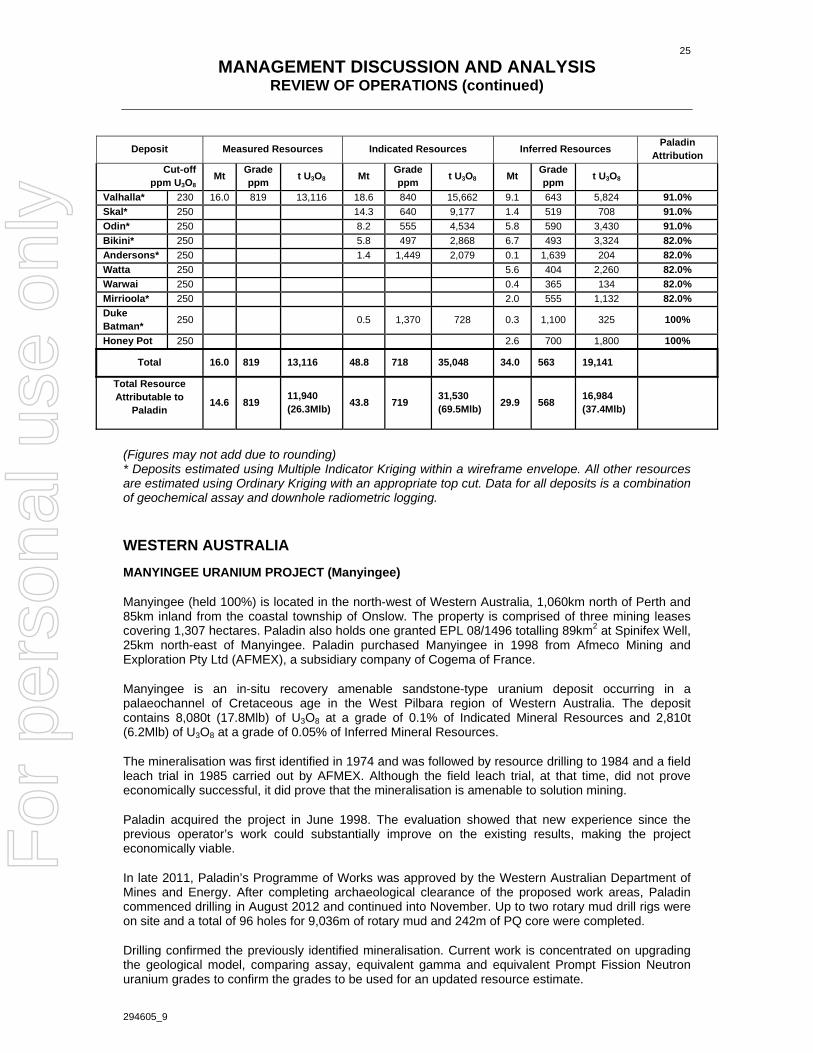
Total 16.0 819 13,116 48.8 718 35,048 34.0 563 19,141
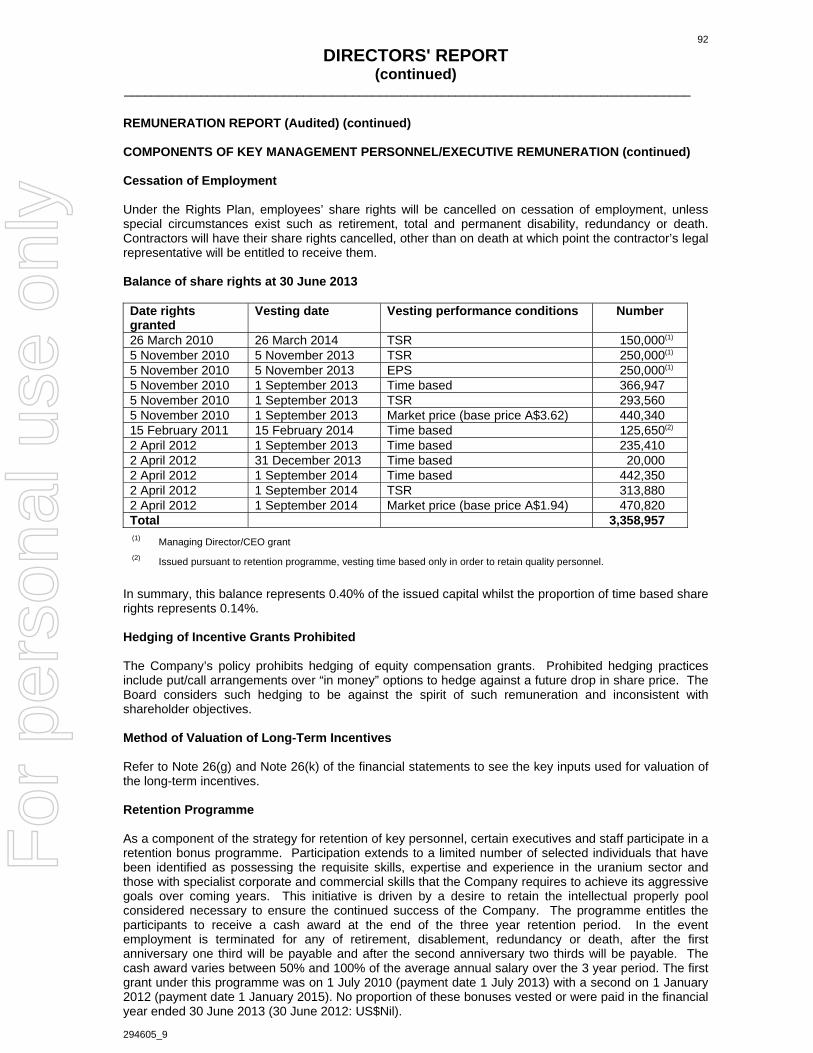
Total Resource Attributable to
Paladin 14.6 819
11,940 (26.3Mlb)
43.8 719 31,530 (69.5Mlb)
29.9 568 16,984 (37.4Mlb)
(Figures may not add due to rounding) * Deposits estimated using Multiple Indicator Kriging within a wireframe envelope. All other resources are estimated using Ordinary Kriging with an appropriate top cut. Data for all deposits is a combination of geochemical assay and downhole radiometric logging. WESTERN AUSTRALIA MANYINGEE URANIUM PROJECT (Manyingee)
Manyingee (held 100%) is located in the north-west of Western Australia, 1,060km north of Perth and 85km inland from the coastal township of Onslow. The property is comprised of three mining leases covering 1,307 hectares. Paladin also holds one granted EPL 08/1496 totalling 89km2 at Spinifex Well, 25km north-east of Manyingee. Paladin purchased Manyingee in 1998 from Afmeco Mining and Exploration Pty Ltd (AFMEX), a subsidiary company of Cogema of France.
Manyingee is an in-situ recovery amenable sandstone-type uranium deposit occurring in a palaeochannel of Cretaceous age in the West Pilbara region of Western Australia. The deposit contains 8,080t (17.8Mlb) of U3O8 at a grade of 0.1% of Indicated Mineral Resources and 2,810t (6.2Mlb) of U3O8 at a grade of 0.05% of Inferred Mineral Resources.
The mineralisation was first identified in 1974 and was followed by resource drilling to 1984 and a field leach trial in 1985 carried out by AFMEX. Although the field leach trial, at that time, did not prove economically successful, it did prove that the mineralisation is amenable to solution mining.
Paladin acquired the project in June 1998. The evaluation showed that new experience since the previous operator’s work could substantially improve on the existing results, making the project economically viable.
In late 2011, Paladin’s Programme of Works was approved by the Western Australian Department of Mines and Energy. After completing archaeological clearance of the proposed work areas, Paladin commenced drilling in August 2012 and continued into November. Up to two rotary mud drill rigs were on site and a total of 96 holes for 9,036m of rotary mud and 242m of PQ core were completed.
Drilling confirmed the previously identified mineralisation. Current work is concentrated on upgrading the geological model, comparing assay, equivalent gamma and equivalent Prompt Fission Neutron uranium grades to confirm the grades to be used for an updated resource estimate.
For
per
sona
l use
onl
y
26
MANAGEMENT DISCUSSION AND ANALYSIS REVIEW OF OPERATIONS (continued)
294605_9
A total of 35 water bores were installed. Initial pump testing was carried out in November and monitoring of physical and chemical properties continued into December 2012 and April 2013. The pump tests show permeabilites in the main mineralised aquifer sufficient for an in-situ recovery (ISR) operation. The results will be used to develop an updated ground water model for the Manyingee aquifer to be applied in any future ISR operations. Preliminary metallurgical test results indicate that an alkaline leach solution under 6 bars of oxygen pressure (approximately equivalent to the depth of the ore body under the water table) will leach between 65% and 90% of the contained uranium.
Work is now focused on completing a test mining proposal document to obtain permission to carry out a Field Leach Trial.
Paladin proposes to develop the project over a 4-5 year period starting with drilling, metallurgical testwork and engineering studies leading to a Field Leach Trial and, potentially, to a subsequent Bankable Feasibility Study. The proposed timeline includes sufficient time to obtain regulatory approvals for mining. The current development model for the project is to produce approximately 900t (2Mlb) of U3O8 per year with a mine life in excess of 10 years.
Manyingee contains JORC (1999) Code compliant Mineral Resources as shown below at a cut-off grade of 300ppm U3O8: Mineral Resource Classification
(Figures may not add due to rounding) Note: for NI 43-101 requirements, previous tonnages, grades, assays and other technical data relating to the Manyingee deposit are taken from historical records prior to the implementation of the current NI 43-101. While the data are believed to have been acquired, processed and disclosed by persons believed to be technically competent, they were estimated prior to the implementation of NI 43-101 and are therefore regarded as historic resources. A Qualified Person as defined in NI 43-101 has not done sufficient work to classify the historical estimate as current Mineral Resources. Paladin is not treating the historical estimates as current Mineral Resources as defined in NI 43-101 and for this reason the historical estimates should not be relied upon. The mineral resource classifications used in this estimate would be equivalent in nature to those defined in NI 43-101 as there has been no substantive change in the JORC Code definition of Indicated or Inferred Mineral Resources subsequent to the JORC (1999) Code. The historical information is presented on the basis that it may be of interest to investors. OOBAGOOMA URANIUM PROJECT (Oobagooma)
The Oobagooma Project (held 100%) is located in the West Kimberley region of Western Australia, 1,900km north-north-east of Perth and 75km north-east of the regional centre of Derby. The project comprises long-standing applications for exploration licences covering approximately 452km². In 1998 Paladin acquired a call option in relation to the purchase of Oobagooma. This arrangement was recently varied so that Paladin Energy Minerals NL is now the applicant and will, upon the anticipated grant, hold the exploration licence directly. Recent changes to the Mining Act 1978 (WA) now permit the grant of tenements within the Yampi Sound Defence Training Area and Paladin Energy Minerals NL holds a first-ranking application. The exploration licence application is situated on freehold land owned by the Commonwealth Government and used by the military for training purposes. Consent of the Commonwealth Government and the Department of Defence will be required for access to the project area. Negotiations with the relevant Government bodies were initiated in the first half of 2010. Government and Defence representatives have indicated their support for the Oobagooma Project. The Oobagooma project area was explored by Afmeco Mining and Exploration Pty Ltd (an Australian subsidiary of French nuclear company Areva, which at the time was called Cogema) in the period from 1983 to 1986 during which time extensive zones of uranium mineralisation were discovered.
For
per
sona
l use
onl
y
27
MANAGEMENT DISCUSSION AND ANALYSIS REVIEW OF OPERATIONS (continued)
294605_9
Exploration for sandstone hosted uranium targets focused on the Lower Carboniferous Yampi Sandstone. The uranium mineralisation is largely controlled by a package of reduced sediments located centrally in the Yampi Sandstone at 45 to 80m depth to the north and 80 to 120m in the south of the prospect area. Following detailed examination of the work done by AFMEX, the Company has formulated an exploration target for the prospect of approximately 8Mt at a grade of between 0.12% and 0.14% U3O8. Previous tonnages, grades, assays and other technical data for Oobagooma are taken from historical records prior to the implementation of JORC or NI 43-101. While the data are believed to have been acquired, processed and disclosed by persons believed to be technically competent, it is unverifiable at present. A Competent Person as defined under the JORC Code or Qualified Person as defined under NI 43-101 has not done sufficient work to classify the historical estimate as current Mineral Resources. Paladin is not treating any historical estimates as current Mineral Resources as defined in either the JORC Code or NI 43-101 and the historical estimates should not be relied upon.
BIGRLYI JOINT VENTURE (BJV) Energy Metals Limited 53.29% and Manager Northern Territory Uranium Pty Ltd 41.71% Southern Cross Exploration NL 5% The BJV covers ten granted Exploration Retention Licences (ERLs) located approximately 320km north-west of Alice Springs in the Northern Territory. Participants in the Joint Venture are Energy Metals Limited (53.29% and Manager), Northern Territory Uranium Pty Ltd (a wholly owned subsidiary of Paladin) (41.71%) and Southern Cross Exploration NL (5%). Energy Metals Limited, as the Manager of the BJV, announced in June 2011 the completion of a Pre-Feasibility Study (PFS) for the Bigrlyi Project. The PFS undertaken by EME confirmed that mining the Anomaly 4, Anomaly 15 and Anomaly 2 deposits using a combination of open pit and underground mining and processing ore through a relatively simple acid leach circuit would produce around 10Mlb U3O8 and positive cash flow of around $120M over a mine life of approximately 8 years. The study parameters were based around a uranium price of US$80/lb and an exchange rate of A$0.85/US$1. Under current market conditions the project is not viable. However, one key finding of the PFS was that a substantial increase in the resource base that underpins the project, especially if those resources are amenable to open pit mining, would have a positive impact on the economics of the project. In late June 2011, Energy Metals Ltd released an updated Mineral Resource estimate, conforming to both the JORC(2004) guidelines and NI 43-101, based on all drilling to date. The breakdown of Mineral Resource category is detailed below and is reported at a 500ppm U3O8 cut-off grade.
Work is ongoing collating all previous data and updating the geological model. ANGELA-PAMELA PROJECT The Angela-Pamela deposits (held 100%) contain sandstone hosted uranium mineralisation formed at geochemical (redox) boundaries by deposition of uranium from groundwater. It is located approximately 25km south of the central business district of Alice Springs, and straddles the Old South Road and the Central Australian Railway. In November 2006, Cameco Australia Pty Ltd (Cameco) and Paladin Energy Minerals NL (Paladin) submitted an Exploration Licence application for 12 blocks covering the Angela and Pamela uranium prospects south of Alice Springs for a total of 37.67km2. In October 2008, Exploration Licence 25758 was granted to the Cameco (50%) and Paladin (50%) Joint Venture for a period of six years. The project was managed by Cameco during the 2009 and 2010 drilling programmes with management of the project handed over to Paladin in September 2011.
For
per
sona
l use
onl
y
28
MANAGEMENT DISCUSSION AND ANALYSIS REVIEW OF OPERATIONS (continued)
294605_9
Following extensive compilation and validation of historic data and drilling programmes in 2009 and 2010, Paladin undertook an initial estimate of U3O8 mineral resource at Angela-Pamela, Australia. This estimate is in compliance with the NI 43-101 and the JORC guidelines. The Mineral Resource estimate is based on 794 holes totalling 180,468m and covers the Angela (1 to 5) and Pamela deposits. The mineralisation plunges shallowly ( approximately 9°), to the west. The larger of the deposits, Angela 1, has been defined up to 4.3km to the west at depths up to 600m and remains open. The mineralisation is contained within nine individual stratigraphic sequences with mineralised thicknesses of up to 10.4m. The cut-off for the Mineral Resource is a combination of grade greater than or equal to 300ppm U3O8 and thickness greater than 0.5m. In addition, areas of low grade probability were removed from the model. Mineral Resource Classification
TonnesMt
Gradeppm U3O8
Metalt U3O8
MetalMlb U3O8
Inferred 10.7 1,310 13,980 30.8 (Figures in the table above may not add due to rounding) The Mineral Resource estimation was completed using a two-dimensional conditional simulation with the dataset being derived predominantly from recent and historic downhole radiometric logging. The radiometric grades have been extensively validated against laboratory assays. As part of the licence conditions, baseline groundwater and dust monitoring were completed prior to the commencement of drilling activities. This programme is ongoing as part of a series of environmental studies, including water, fauna and flora, dust, radiation, meteorology and soils. In late June 2013, Paladin became the sole owner of the Angela project following the completion of an agreement to purchase the 50% interest previously held by Cameco. Field work in FY2013 included the completion of drill site rehabilitation and limited environmental monitoring. Currently, no activity is being undertaken. The information above relating to exploration, mineral resources and ore reserves is, except where stated, based on information compiled by Eduard Becker B.Sc, David Princep B.Sc and Andrew Hutson B.E, all of whom are members of the AusIMM. Messrs Becker, Princep and Hutson each have sufficient experience that is relevant to the style of mineralisation and type of deposit under consideration and to the activity that he is undertaking to qualify as Competent Persons as defined in the 2004 Edition of the “Australasian Code for Reporting of Exploration Results, Mineral Resources and Ore Reserves”, and Messrs Princep and Hutson as a Qualified Person as defined in NI 43-101. Messrs Becker, Princep and Hutson are full-time employees of Paladin Energy Ltd and consent to the inclusion of this information in the form and context in which it appears.
AUSTRALIA’S URANIUM POLITICS At the national level of Australian politics, both the Federal Labor Party and the Federal Coalition parties support development of the uranium industry. However, the granting of licences to mine uranium is a decision made within the residual jurisdiction of each state government. The state based Labor Government of South Australia supports existing mines and is receptive to new uranium projects. The state based Country Liberal Government of the Northern Territory also supports existing mines and is receptive to new uranium projects, including Paladin’s Angela-Pamela Project. The opposition Labor Party supports uranium mining, although has, in the past, opposed development of the Angela-Pamela Project. The Liberal-National Party Coalition Government of the State of Western Australia supports uranium mining in Western Australia and several uranium mining projects have progressed to environmental
For
per
sona
l use
onl
y
29
MANAGEMENT DISCUSSION AND ANALYSIS REVIEW OF OPERATIONS (continued)
294605_9
assessment (and in one case, approval) since that Government was elected in late 2008. At its State Conference in June 2011, the opposition Labor Party reaffirmed its stance against uranium mining. A state election held in Queensland on 24 March 2012 resulted in a change of government from Labor to a Liberal-National Party (“LNP”). The previous state Labor Government in Queensland would not grant a licence to mine uranium. Subsequent to the election, Premier Campbell Newman announced a change in government policy to facilitate uranium mining in Queensland. On 30 October 2012, he announced the establishment of the Uranium Implementation Committee, which would establish a best-practices framework for the recommencement of uranium mining in Queensland. In March 2013, the Queensland Uranium Implementation Committee completed its report to the Queensland Government recommending a policy framework for the orderly development and operation of a recommenced uranium mining and export industry in Queensland. URANIUM DATABASE Paladin owns a substantial uranium database, compiled over 30 years of investigations by the international uranium mining house Uranerzbergbau in Germany, incorporating all aspects of the uranium mining and exploration industry worldwide and including detailed exploration data for Africa and Australia. The written down value of the capitalised database is US$Nil. Uniquely among Australian companies, the primary focus of Paladin’s activities for the past years has been uranium. In that time the Company has maintained and expanded the library of databases consisting of extensive collections of technical, geological, metallurgical, geophysical and geochemical resources including resource evaluations, drill hole data, downhole logging data, airborne radiometric surveys results, open-file data, and photographic archives. The geology resource database is managed in an integrated relational database system readily available for processing of exploration and mining data. The data continues to be utilised by the Company as an asset for project generation to evaluate opportunities and generate new uranium prospects and projects for acquisition and exploration. DEEP YELLOW LTD (DYL) Paladin 19.50% DYL is an ASX-listed, advanced stage uranium exploration company with a portfolio of exploration projects in the southern African nation of Namibia and in Australia. It also has a listing on the Namibian Stock Exchange (NSX). DYL’s focus is in Namibia, where its operations are conducted by its wholly owned subsidiary Reptile Uranium Namibia (Pty) Ltd (RUN). RUN, the operator, holds 100% of two EPLs covering 1,346km2 and five joint venture EPLs covering 2,098km2. All seven tenements are situated in the Namib Naukluft Desert Park inland from Walvis Bay and south and west of Paladin’s LHM. Its flagship is the high grade alaskite Omahola Project, where mining studies are being conducted and the next phase of metallurgical testwork is being planned as inputs into a PFS. Drilling was completed earlier this year and a new prospectivity analysis is well advanced, identifying multiple new targets that have the potential for similar higher grade alaskites. F
or p
erso
nal u
se o
nly
30
MANAGEMENT DISCUSSION AND ANALYSIS HEALTH & SAFETY
294605_8
HEALTH AND SAFETY Paladin continues to be committed to achieving the highest performance in Occupational Health and Safety and Radiation to create and maintain a safe and healthy workplace. Our approach to health and safety management is guided by our policy that states that the safety, health and well-being of employees, contractors and the community reflect the core value to Paladin’s operations in line with Paladin’s aim for zero injuries in the work place. Paladin is fully committed to achieving minimum radiation exposure to its workers, members of the public and the surrounding natural environment. The Company is also committed to minimising the potential long-term environmental impact of radiation by the safe management of radioactive waste rock material at its sites (exploration, construction, mining and processing). During the year, Paladin undertook two external National Occupational Safety Association (NOSA) grading audits of its operations – LHM and KM – and is pleased to report the following health and safety external audit results: LHM: the site achieved a 4-Star NOSA Platinum rating; and KM: the site achieved a 5-Star NOSA Platinum rating. In addition, the Company’s Lost Time Injury Frequency Rate (LTIFR) increased from 0.9 to 1.1 over the previous year. This rate still compares very favourably with West Australian metalliferous surface mining LTIFR of 3.0. For FY2013, there were six LTIs compared to seven LTIs for the previous year.
Langer Heinrich Mine Kayelekera Mine Perth Exploration Group
Kayelekera Mine Total LTIFR = 0.0 Duration rate = 0.0
Perth LTIFR = 0.0 Duration rate = 0.0
Exploration LTIFR = 13.8 Duration rate 5.0
Paladin Group + All Contractors LTIFR
= 1.1
Lost Time Injury (LTI): Work injury that results in an absence from work for at least one full day or shift, any time after the day or shift on which the injury occurred.
Frequency Rate (FR): Number of lost time injuries per million hours worked. Duration Rate: Average number of workdays lost per injury. In May 2013, a senior Safety & Health Advisor was recruited in the Group to further improve this area within the Company. A draft set of OH&S Standards have been developed to augment the policies already in place and are being progressively distributed to all sites for feedback. It is expected that these Standards will be finalised early in the new financial year and approved by the Board in late 2013 prior to implementation. Auditing of all sites against these Standards will commence in late FY2014. Langer Heinrich Mine
LHM continues to focus on safety, health, environmental and radiation (SHER) management. The fourth NOSA grading audit was conducted in November, 2012 and the operation obtained a ‘4’ Star Platinum (health, safety and environment) grade rating. Although the site had an improved audit performance (91.3% to 92.4%) over the previous year audit, a below standard Disability Injury Frequency Rate (DIFR), which also includes restricted injury lost days, of 6.24 was above the 5.0 limit for a ‘5’ Star achievement. To obtain certain star performances in NOSA there are two criteria one needs to achieve. Firstly meet or be less than the DIFR target for each level (ie not to exceed the target number) with this factor being based on one’s safety performance over the past year and secondly meet the audit effort performance via a site audit (ie one is audited against a prescriptive set of criteria in five categories). At LHM for FY2012, it achieved a result from the site audit that was
For
per
sona
l use
onl
y
31
MANAGEMENT DISCUSSION AND ANALYSIS HEALTH & SAFETY (continued)
294605_9
higher than the 5 star target ie 92.4%, which was better than the previous year’s audit result of 91.3%. However, it failed in its DIFR as it had too many disabling injuries (where the person who was injured could return to work but not in his normal occupation due to an injury. These ‘disabling’ injuries include lost time injuries as well.) During the year, LHM reported three LTIs – two LHM employees and a Karibib Mining and Construction Company (KMCC) contractor employee. The site annual LTIFR improved marginally from 1.3 to 1.1. The mining contractor, KMCC, has obtained international OHSAS 18001 certification, which will further assist in improving site occupational health and safety performance. As at 30 June 2013, the site had worked 97 days without a LTI. A Safety Action Plan was implemented in July 2012 to address an upward LTI trend evident in the latter part of FY2012. Key components of the plan include increased and formalised workplace inspections and work observations by supervisors, hazard identification for all site activities and the implementation of a behaviour-based safety approach (Unwritten Ground Rules – IGRs) that investigates the current culture and the need to change behaviours. This plan has been successful in refocusing the workforce towards a safer work environment. In addition, a ‘drive to stay alive’ road safety campaign has seen a decrease in reported unacceptable driving practices on the mine access road. Access control to the mining lease area and to restricted areas on the mine site is of a high standard following the measures taken last year. No reported unauthorised accesses were recorded. Further improved control is expected with the installation of biometric readers at the main gate plant protection office. In terms of occupational monitoring, radiation work is continuing on building the monitoring database so that radiation conditions at LHM can be characterised. A reporting strategy is being developed for the Government as well as a system to regularly inform the workforce of their working conditions. A revised Radiation Management Plan will be submitted to the Namibian regulators in FY2014. Worker radiation doses over the past year were a small fraction of the recommended annual limit. For the 2012 calendar year, the mean designated worker annual dose was 2.4 mSv compared with the internationally recommended annual dose limit of 20 mSv for occupational radiation exposure. LHM continues to be actively involved with the Chamber of Mines’ Uranium Institute in Namibia, a leading source of advocacy, training and research on uranium related issues. Kayelekera Mine Like LHM, KM put a concentrated effort into its SHER management during the year with the continued implementation of the NOSA safety system. The third NOSA grading audit was conducted in June 2013 and the operation achieved a ‘5’ Star Platinum (health, safety and environment) grade rating with an improved preliminary performance score of 92.0% (from 90.0%). For its annual safety performance within the NOSA system, KM received the following safety awards: 1st place award – CMB 253 NOSA Integrated Five Star System Sector C1 (open pit mines) –
KM gained the highest overall score during the audit period 1 April 2012 to 31 March 2013 in Sector category – Section C1;
1st place award – SHE Risk Manager of the Year Mining – Roy Liesching, Safety, Health & Radiation Manager at KM; and
3rd place award – Top Ten Mining Company – of all companies, Internationally, audited by NOSA in the Mining Sector.
The site reported no LTIs for the year therefore, the site annual LTIFR decreased from 0.6 to zero (0.0). As at 30 June 2013, the site had worked 459 days without an LTI. It was with great sadness the Company reported a workplace fatality post year end on 31 July. A Malawi national employee, Mr. Khwima Phiri, who was employed in the mine’s engineering workshop, died after being struck in the chest by a light vehicle wheel he was inflating at the time. Following an investigation, additional procedures have been instituted with a view to preventing such accidents in the future. This served as a stark reminder to all that safety is of paramount importance and the policy
For
per
sona
l use
onl
y
32
MANAGEMENT DISCUSSION AND ANALYSIS HEALTH & SAFETY (continued)
294605_9
of zero harm to all and vigilance must be maintained always. Our thoughts are with the family of Mr Phiri. During the year, site safety improvements included training employees in various safety disciplines such as the safe use of hand tools, working safely at height and risk/hazard identification and management. All employees and contractors underwent awareness training regarding the contents and requirements of the site Health and Safety Policy and Health and Safety target and objectives. The plant road was also upgraded, increasing safety for all vehicles and equipment. As radiation working conditions stabilise at KM, opportunities are being investigated to optimise engineering controls so that radiation exposures are As Low As Reasonably Practicable. In the coming year, the Radiation Management System will be enhanced as improvements made to infrastructure are commissioned. The mean designated worker annual radiation dose was 2.1 mSv for the 2012 calendar year, compared with the internationally recommended annual occupational radiation dose limit of 20 mSv. Exploration Paladin’s diversified exploration continued during the year with programmes undertaken across Queensland, Western Australia, Malawi and Canada. All the exploration programmes involved drilling activities and field work being undertaken in remote locations. Exploration reported three LTIs for the year. Two contractors in Malawi (same incident) and one contractor on the Aurora project (Canada), increasing the annual Exploration LTIFR rate from 0.0 to 13.8. As at 30 June 2013, the exploration group had worked 107 days without a LTI. An in-house Exploration OH&S Management System, developed to provide consistency across all Paladin exploration sites, is being implemented at all active sites. In FY2013, implementation of this system was 60% complete for Malawi (commenced in late FY2012) and around 30% complete at both the Manyingee (Western Australia) and Aurora (Canada) projects. It is expected that full system implementation will be completed by the end of FY2014.
For
per
sona
l use
onl
y
33
MANAGEMENT DISCUSSION AND ANALYSIS FINANCIAL REVIEW
294605_8
SUMMARISED INCOME STATEMENT YEAR ENDED 30 JUNE 2013
US$M 2012
US$M
Revenue 411.5 367.4 Gross profit 25.0
23.9
Exploration and evaluation expenses (1.4) (2.5) Administration, marketing and site non-production costs (39.5) (47.0) Other expenses and income (305.9) (197.2) Loss before interest and tax (321.8) (222.8) Finance costs (63.8) (56.7) Income tax (expense)/benefit (88.4) 78.7 Loss after tax (474.0) (200.8) Loss after tax attributable to: Non-controlling interests (53.1) (28.0) Members of the parent (420.9) (172.8) (474.0) (200.8) Loss per share – basic and diluted (US cents) (49.1) (20.2) Operational overview LHM commenced production in 2007 with a capacity of 2.7Mlb U3O8 pa. After operating at this level for a sustained period of time, construction of the Stage 2 expansion to 3.7Mlb U3O8 pa commenced in CY2008. LHM reached the Stage 2 design capacity in December 2009. The plant has consistently operated at the 3.7Mlb U3O8 pa rate from the beginning of CY2010. Construction of the Stage 3 expansion to 5.2Mlb U3O8 commenced at the beginning of CY2010 and was completed at 31 March 2012. Commercial production was declared from 1 April 2012. The plant has achieved Stage 3 design performance and the focus has turned to production optimisation. The plant achieved record annual production totalling 5.292Mlb U3O8 for FY2013, 20% higher than FY2012. Construction of KM, with a 3.3Mlb U3O8 design capacity, commenced in 2007, and after a two-year construction phase, the mine entered its production ramp-up phase in CY2009. KM continued to ramp-up its production volumes through to July 2010. Commercial production was declared from 1 July 2010. KM made its first delivery of uranium to customers in December 2009. During FY2012, the operation made substantial positive steps toward the design of 3.3Mlb U3O8 pa through a programme of plant upgrades aimed at addressing bottlenecks. The plant achieved record annual production totalling 2.963Mlb U3O8 for FY2013, 20% higher than FY2012. The focus at KM has turned to production optimisation with acid recycling (Nano technology) project and grid power supply representing two key elements. Acid recycling initiatives are scheduled for commissioning in the September 2013 quarter and the grid power is scheduled for completion in the March 2014 quarter. References below to 2013 and 2012 refer to the equivalent twelve months ended 30 June 2013 and 2012 respectively. C1 cost of production = cost of production excluding product distribution costs, sales royalties and depreciation and amortisation before adjustment for impairment. C1 cost, which is non-IFRS
For
per
sona
l use
onl
y
34
MANAGEMENT DISCUSSION AND ANALYSIS FINANCIAL REVIEW (continued)
294605_9
information, is a widely used ‘industry standard’ term. C1 cost information (unreviewed) has been extracted from the financial statements. (Refer to Reconciliation of C1 Cost of Production to Cost of Goods sold below). For an analysis of total cost of sales refer to Note 5(b) to the financial statements. Analysis of Income Statement ANALYSIS OF REVENUE AND GROSS PROFIT Year ended 30 June 2013
US$M 2012 US$M
Revenue from sales of uranium oxide
Up
12%
408.4
365.8
Interest income and other revenue 3.1 1.6 Total revenue 411.5 367.4 Cost of sales (355.6) (304.5) Impairment – inventory and stores and consumables
(30.9)
(39.0)
Gross profit Up 5% 25.0 23.9Realised uranium sales price US$49.5/lb
Mlb U3O8
US$54.6/lb
Mlb U3O8 LHM sales volume(1) KM sales volume(2)
Up Up
23% 24%
5.548 2.705
4.518 2.180
Total sales volume Up 23% 8.253 6.698
LHM production KM production
Up Up
20% 20%
5.292 2.963
4.417 2.478
Total production Up 20% 8.255 6.895 (1) Includes 0.580Mlb (2012: 0.650Mlb) of LHM material sold through Paladin Energy Ltd/Paladin
Nuclear Ltd. (2) Includes 0.100Mlb of KM material sold through Paladin Energy Ltd/Paladin Nuclear Ltd. Revenue increased 12%, from US$367.4M in 2012 to US$411.5M in 2013 due to a 12% increase in sales of uranium from US$365.8M in 2012 to US$408.4M in 2013. Sales volume in 2013 of 8.253MIb U3O8 increased by 23% from 6.698MIb U3O8 in 2012. The average realised uranium sales price in 2013 was US$49.5/lb U3O8 (2012: US$54.6/lb U3O8) compared to the average UxC spot price for the year of US$43.9/lb U3O8. RECONCILIATION OF C1 COST OF PRODUCTION TO COST OF GOODS SOLD YEAR ENDED 30 JUNE 2013 YEAR ENDED 30 JUNE 2012 LHM KM TOTAL LHM KM TOTAL Volume Produced (lb) 5,292,474 2,962,652 8,255,126 4,416,696 2,478,109 6,894,805 US$M US$M US$M US$M US$M US$M Cost of Production (C1) 159.5 126.2 285.7 136.2 129.8 266.0 Cost of Production/lb (C1) US$30.0/lb US$42.6/lb US$30.8/lb US$52.4/lb Depreciation & amortisation 28.4 20.2 48.6 20.6 27.2 47.8 Production distribution costs 6.1 7.3 13.4 4.3 7.5 11.8 Royalties 7.4 4.2 11.6 7.1 2.8 9.9 Inventory movement (1.3) (18.0) (19.3) (6.5) (37.3) (43.8) Other 14.7 0.9 15.6 10.9 1.9 12.8 Cost of goods sold 214.8 140.8 355.6 172.6 131.9 304.5 Gross Profit in 2013 of US$25.0M is 5% higher than in 2012 (US$23.9M) due to a 23% increase in sales volume and a lower impairment of KM inventory of US$30.9M (2012: US$39.0M), which has been partially offset by lower prices. An impairment was required to reduce the cost of KM inventory
For
per
sona
l use
onl
y
35
MANAGEMENT DISCUSSION AND ANALYSIS FINANCIAL REVIEW (continued)
294605_9
held to a net realisable value using the continued low uranium prices. The C1 cost of production for LHM, for the year, in 2013 remained relatively stable at US$30.0/lb U3O8 (2012: US$30.8/lb U3O8). The C1 cost of production for KM in 2013 decreased to US$42.6/lb U3O8 (2012: US$52.4/lb U3O8). These results provide evidence that the cost benefits from the cost optimisation programme are being realised. Further improvements in C1 costs are expected over the next 12 to 18 months as a number of cost saving initiatives at both sites have yet to be fully implemented. Exploration and Evaluation Expenditure of US$1.4M in 2013, which relates to early stage work and project generation activities in Australia and Malawi, decreased from 2012 (US$2.5M). ANALYSIS OF ADMINISTRATION, MARKETING EXPENSES & SITE NON-PRODUCTION COSTS YEAR ENDED 30 JUNE 2013
US$M 2012US$M
Corporate & marketing Up 4% (21.9) (21.0)Restructure costs Up 100% (0.3) - Mines sites (LHM & KM) Down 22% (8.5) (10.9) Canadian operations Down 84% (0.4) (2.5)Non-cash – share-based payments Down 43% (3.9) (6.9)Non-cash – depreciation Down 9% (1.9) (2.1) LHM Stage 4 expansion project Down 69% (1.1) (3.6)KM research and development Up 100% (1.5) - Total (39.5) (47.0) Administration, Marketing and Non-production Costs have decreased by US$7.5M from US$47.0M to US$39.5M. There has been a decrease of US$3.0M in non-cash share-based payments expense as there was a reduction in the number of share rights granted compared to 2012, a decrease of US$2.5M relating to the LHM Stage 4 expansion project and a decrease in expenditure of US$2.4M relating to non production costs at LHM and KM. These savings have been partially offset by expenditure of US$1.5M relating to a metallurgical research and development project at KM and restructure costs of US$0.3M. Corporate and marketing costs have increased due to one-off costs in relation to consultants and advisory services. Other Expenses and Income have increased from US$197.2M to US$305.9M due predominantly to a higher impairment charge of the KM assets in 2013 of US$237.9M compared to US$178.0M in 2012 and the US$62.1M (2012 US$Nil) impairment of exploration assets. The Niger exploration assets were impaired to US$Nil by an impairment charge of US$37.4M due to the cessation of exploration activities by Paladin in Niger as a consequence of increased political risk. The Angela Uranium Project was impaired to a carrying value of US$Nil by an impairment charge of US$6.8M and the Bigrlyi Project was impaired to a carrying value of US$10M by an impairment charge of US$17.9M due to a decision to reduce the amount being spent and on planned studies on these projects until the uranium price increases. The continued low uranium price has resulted in a reduction of the recoverable value of KM assets, resulting in the impairment charge. This was partially offset by a lower write-off of the fixed costs of KM of US$3.7M predominantly during the August 2012 plant shutdown compared to US$9.7M in the comparative year. Finance Costs have increased from US$56.7M by US$7.1M to US$63.8M due to all interest being expensed in 2013 compared to 2012 where a proportion of the LHM project finance interest was capitalised as part of the Stage 3 expansion and the accretion of higher funding costs relating to LHM project finance. Finance costs relate primarily to interest payable and accretion on the outstanding US$134M convertible bonds issued 11 March 2008 repaid in March 2013, the US$300M convertible bonds issued 5 November 2010, the US$274M convertible bonds issued 30 April 2012, the US$68.1M project finance loan for KM and the US$101.5M project finance loan for LHM Stage 3. Income Tax Expense of US$88.4M for the year to 30 June 2013 is predominantly the result of the de-recognition of the US$98.2M KM net deferred tax assets (“DTA”) at 31 December 2012 arising from unrealised foreign exchange losses and carry forward tax losses previously recognised. The
For
per
sona
l use
onl
y
36
MANAGEMENT DISCUSSION AND ANALYSIS FINANCIAL REVIEW (continued)
294605_9
unrealised foreign exchange difference on intercompany loans has arisen due to the extreme devaluation of 104% in the Malawian Kwacha over the previous 12 months from an average of US$1 = MWK160 to US$1 = MWK 327 at 31 December 2012. Non-controlling Interest in net losses of US$53.1M is attributable to the 18.0% interest in Summit held by third parties and the 15% interest in PAL held by the Government of Malawi. Loss after Tax attributable to the members of the parent for 2013 of US$420.9M was higher than the loss after tax for 2012 of US$172.8M predominantly as a result of the de-recognition of the KM net DTA and the recognition of the KM impairments and impairments of exploration assets discussed earlier. The loss before impairments and de-recognition of the KM net DTA was US$86.7M. Loss per Share noted on the Income Statement reflects the underlying result for the specific reported periods and the additional shares issued in 2013 compared to 2012. Summary of Quarterly Financial Results 2013 2013 2012 2012 Jun Qtr Mar Qtr Dec Qtr Sep Qtr
Total revenues US$M 109.6 106.4 134.2 61.3 Sales volume Mlb 2.326 1.920 2.783 1.224 Loss after tax attributable to members US$M (173.3) (54.1) (147.6) (45.9)
Basic and diluted loss per share US cents (20.1) (6.4) (17.1) (5.5) 2012 2012 2011 2011 Jun Qtr Mar Qtr Dec Qtr Sep Qtr
Total revenues US$M 126.2 67.8 70.4 103.0
Sales volume Mlb 2.241 1.137 1.318 2.002 (Loss)/profit after tax attributable to members US$M (35.2) (17.5) 3.2 (123.3) Basic and diluted (loss)/profit per share US cents (3.9) (1.8) 0.6 (15.1) Total revenues for the quarters ended March 2013 and December 2012 have increased when compared to the equivalent comparative quarter as a result of higher sales volumes of uranium, whereas total revenues for the quarters ended June 2013 and September 2012 are lower than the comparative quarter. The decrease in revenue in September 2012 quarter is due to lower sales volumes of uranium. The decrease in revenue in June 2013 quarter is due to lower prices partially offset by higher sales volumes. Uranium sales tend to fluctuate quarter on quarter due to the uneven timing of contractual commitments and resultant delivery scheduling by utility customers. Loss after tax for the quarter ended June 2013 of US$173.3M is higher than the comparative quarter loss of US$35.2M predominantly as a result of the higher impairment charge of the KM assets and the impairment of exploration assets in 2013, discussed earlier, compared to 2012. Loss after tax for the quarter ended March 2013 of US$54.1M is higher than the comparative quarter loss of US$17.5M predominantly as a result of the impairment charge of the KM assets in 2013 of US$44.8M compared to US$Nil in 2012. Loss after tax for the quarter ended December 2012 of US$147.6M is a turnaround from the profit of US$3.2M in the comparative quarter. The loss is predominantly due to the de-recognition of the US$98.2M KM net DTA and the recognition of the KM impairment discussed earlier. Loss after tax for the quarter ended September 2012 of US$45.9M is lower than the comparative quarter loss of US$123.3M predominantly as a result of a smaller impairment of the KM assets in 2012 compared to 2011.
For
per
sona
l use
onl
y
37
MANAGEMENT DISCUSSION AND ANALYSIS FINANCIAL REVIEW (continued)
294605_9
Segment Disclosure (refer to Note 4 in the Financial Statements)
The profit before tax and finance costs for the year of US$49.3M in the Namibian segment decreased by US$11.1M (2012: US$60.4M) as higher sales volumes have been offset by lower prices. The Malawian segment reflected a loss before tax and finance costs for the year of US$276.9M, which is higher compared to a loss of US$242.6M in 2012 predominantly as a result of the higher impairment of the KM assets in 2013 compared to 2012. Exploration includes an impairment expense for the Niger, Angela and Bigrlyi assets. In the Unallocated portion, the Company reflected the remaining Income Statement activities, which for 2013 comprise mainly marketing, corporate, finance and administration costs. This area includes an impairment loss on available for sale financial assets of US$5.0M (2012: US$8.0M). This area has remained fairly static from a net loss before finance costs in 2012 of US$31.3M to a net loss of US$31.4M in 2013. Summary of Quarterly Production
Results
2013 2013 2012 2012 2012
Jun Qtr Mar Qtr Dec Qtr Sep Qtr Jun Qtr
LHM
Production U3O8 Mlb 1.353
1.230
1.419 1.290 1.322
C1 cost of production US$/lb 29.4 29.8 29.6 31.8 32.2
KM
Production U3O8 Mlb 0.790 0.762 0.772 0.639 0.726C1 cost of production US$/lb 39.2 39.8 43.5 49.0 52.2 C1 cost of production for LHM has fallen from US$32.2/lb in the June 2012 quarter to US$29.4/lb in the June 2013 quarter, a decrease of 9%. C1 cost of production for KM has fallen quarter on quarter from US$52.2/lb in the June 2012 quarter to US$39.2/lb in the June 2013 quarter, a decrease of 25%. These results provide evidence that the cost benefits from the cost optimisation programme at KM are being realised. Further improvements in C1 costs are expected over the next 12 to 18 months as a number of additional cost saving initiatives at both sites have yet to be fully implemented. SUMMARISED STATEMENT OF COMPREHENSIVE INCOME YEAR ENDED 30 JUNE 2013
US$M 2012
US$M
Net loss after tax (474.0) (200.8) Net loss on available-for-sale financial assets (5.3) (25.8) Transfer of realised gains to other income on disposal of available-for-sale financial assets (1.2) - Transfer of impairment loss on available-for-sale financial assets to income statement 5.0 8.0 Foreign currency translation (75.7) (44.0) Income tax on items of other comprehensive income 0.1 3.3 Total comprehensive loss for the year (551.1) (259.3)
For
per
sona
l use
onl
y
38
MANAGEMENT DISCUSSION AND ANALYSIS FINANCIAL REVIEW (continued)
294605_9
Net Loss after Tax is discussed under the Summarised Income Statement section. Foreign Currency Translation relates to the foreign currency translation reserve movement as a result of the translation of subsidiaries with Australian and Canadian dollar functional currencies into the Company presentation currency of US dollars on an ongoing basis and for the comparative period. Transfer of Realised Gains to Other Income in 2013 of US$1.2M relates to the disposal of an available-for-sale financial asset. Net Loss on Available-for-Sale Financial Assets in 2013 of US$5.0M primarily relates to the fair value decrement in available-for-sale financial assets attributable to a decrease in the share price. Income Tax on Items of Other Comprehensive Income in 2013 relates to tax on movements in available-for-sale financial assets. SUMMARISED STATEMENT OF FINANCIAL POSITION YEAR ENDED 30 JUNE 2013
US$M 2012
US$M
Total current assets 324.4 391.6 Total non current assets 1,513.3 1,956.1 Total assets 1,837.7 2,347.7 Total current liabilities 131.4 253.9 Total non current liabilities 1,058.1 899.0 Total liabilities 1,189.5 1,152.9 Net Assets 648.2 1,194.8 Current Assets have decreased to US$324.4M at 30 June 2013 due to a decrease in cash, inventories and trade and other receivables. Cash and cash equivalents have decreased from US$112.1M to US$78.1M at 30 June 2013 as a result of the repayment of US$134M convertible bonds, principal repayments for KM and LHM project finance facilities of US$46.9M, payments for plant and equipment, exploration and evaluation project expenditure as well as finance costs, corporate costs and an increase in inventories. This has been partially offset by the receipt of long-term off-take agreement funds of US$200.0M from EdF and an increase in receipts from customers. Trade and other receivables have decreased from US$82.8M to US$78.3M at 30 June 2013 as a result of a decrease in VAT receivable predominantly due to a decrease in VAT receivable in Namibia due to the decrease in expenditure with the completion of Stage 3 in FY2012. Inventories have decreased from US$186.5M to US$158.8M at 30 June 2013 predominantly due to LHM inventory produced at a lower cost per lb resulting from cost optimisation improvements and KM inventory being valued at a lower net realisable value due to the lower uranium prices when compared to 2012. Sales volumes for the year of 8.253Mlb U3O8 matching production of 8.255Mlb U3O8, whereas in 2012 sales volumes for the year of 6.698Mlb U3O8 were 0.197Mlb U3O8 lower than production of 6.985Mlb U3O8. Additionally, there was a lower KM inventory impairment discussed under the Summarised Income Statement section. Non Current Assets have decreased from US$1,956.1M to US$1,513.3M at 30 June 2013 as a result of the de-recognition of the KM net DTA, the decrease in property, plant and equipment, mine development and intangible assets due to the KM impairment discussed under the Summarised Income Statement section and a decrease in the exploration assets, which is due to the foreign exchange movement on the Australian and Canadian dollar denominated exploration assets because
For
per
sona
l use
onl
y
39
MANAGEMENT DISCUSSION AND ANALYSIS FINANCIAL REVIEW (continued)
294605_9
of the increase in value of the US dollar against both currencies and the impairment of the Niger, Angela and Bigrlyi projects discussed under the Summarised Income Statement section. Additionally, there was a decrease in the fair value of other financial assets primarily attributable to the decrease in the share price of DYL and the foreign exchange movement due to the depreciation of the Australian dollar against the US dollar. ROM stockpiles at LHM increased as planned as part of Stage 3 production expansion in order to meet the future mine plan ore-blend requirements. Current Liabilities have decreased from US$253.9M to US$131.4M at 30 June 2013 primarily as a result of the repayment of the US$134M convertible bonds. Additionally there has been a slight decrease in creditors of US$9.2M, which has been partially offset by an increase in employee provisions of US$6.5M due to a transfer from non current employee provisions. Non Current Liabilities have increased from US$899.0M to US$1,058.1M at 30 June 2013 primarily due to the receipt of the long-term off-take agreement funds of US$200.0M and an increase in the KM rehabilitation provision, which has been partially offset by a decrease in employee provisions and a decrease in the non current portion of interest bearing loans and borrowings of US$40.9M. This is mainly attributable to the repayment of project financing for KM of US$29.9M and LHM of US$17.0M, offset by the accretion relating to convertible bonds. Segment Disclosure (refer to Note 4 in the Financial Statements) In the Statement of Financial Position as at 30 June 2013, the Group reflected an increase in assets for the Namibian segment in the period predominantly due to an increase in inventory and plant and equipment additions, predominantly the new tailings facility which has been partially offset by depreciation and amortisation. For the Malawian segment, assets have decreased as a result of the de-recognition of the KM net DTA and the KM impairments. The Exploration segment has decreased due to the impairment of the Niger, Angela and Bigrlyi assets and the strengthening of the US dollar against the Australian and Canadian dollars, which has resulted in a decrease in the US dollar value of exploration assets within Australian and Canadian dollar functional currency subsidiaries. This has been partially offset by additional capitalised exploration expenditure. SUMMARISED STATEMENT OF CHANGES IN EQUITY YEAR ENDED 30 JUNE 2013
US$M 2012
US$M
Total equity at the beginning of the financial year 1,194.8 1,355.2 Total comprehensive loss for the year (551.1) (259.3) Recognised value of unlisted employee options and performance share rights 4.5 7.4 Movement in other reserves - 25.1 Contributions of equity, net of transaction costs - 66.4 Total equity at the end of the financial year 648.2 1,194.8 Total Comprehensive Loss for the Year Ended 30 June 2013 is discussed under the Statement of Comprehensive Income section. Recognised Value of Unlisted Employee Options and Performance Rights in 2013 totals US$4.5M (2012: US$7.4M). During the period 1,717,850 performance share rights vested (2012: 1,113,275). Of these, 175,332 were issued from shares held in trust by Paladin Energy Ltd and 1,542,518 resulted in additional shares being issued. No performance rights were granted (2012: 1,980,400). Contributions of Equity in 2012 of $63.2M relates to the share placement of 56,866,232 shares at A$1.20 each. The number of fully paid ordinary shares on issue at 30 June 2013 is 837,187,808, an increase of 1,542,518 during the year. Performance rights of 3,358,957 remain outstanding at 30
For
per
sona
l use
onl
y
40
MANAGEMENT DISCUSSION AND ANALYSIS FINANCIAL REVIEW (continued)
294605_9
June 2013 to the employees and consultants directly engaged in corporate, mine construction, operations, exploration and evaluation work. No share options remain outstanding. SUMMARISED STATEMENT OF CASH FLOWS YEAR ENDED 30 JUNE 2013
US$M 2012
US$M
Net cash inflow/(outflow) from operating activities 194.5 (125.8) Net cash outflow from investing activities (46.2) (82.2) Net cash (outflow)/inflow from financing activities (181.5) 201.5 Net decrease in cash and cash equivalents (33.2) (6.5) Cash and cash equivalents at the beginning of financial year 112.1 117.4 Effects of exchange rate changes on cash and cash equivalents (0.8) 1.2 Cash and cash equivalents at the end of the financial year 78.1 112.1 Net Cash Inflow from Operating Activities was US$194.5M in 2013 (2012: net cash outflow US$125.8M), primarily due to receipts from customers of US$400.0M (2012: US$313.9M) and receipt of the long-term off-take agreement funds of US$200.0M (2012: Nil). This was partially offset by payments to suppliers and employees of US$364.8M (2012: US$401.1M). The LHM and KM operations generated US$86.8M in cash in 2013 before investment in working capital required to support higher production levels and payments for administration, marketing and site non-production costs of US$33.9M. The remaining expenditure was US$1.4M for exploration (2012: US$2.5M) and net interest paid of US$41.4M (2012: US$36.6M). Net Cash Outflow from Investing Activities was US$46.2M in 2013 and is due primarily to plant and equipment acquisitions of US$30.6M, predominantly the new tailings facility at LHM, and additionally capitalised exploration expenditure of US$16.5M. Exploration expenditure in foreseeable periods will be lower. The net cash outflow of US$82.2M in 2012 was due primarily to the Stage 3 expansion at LHM and capitalised exploration expenditure of US$12.1M. Net Cash Outflow from Financing Activities of US$181.5M in 2013 is mainly attributable to the repayment of the US$134M remaining on the US$325M convertible bonds issued on 11 March 2008, repayment of project financing for KM of US$29.9M and LHM of US$17.0M. The net inflow in 2012 of US$201.5M was attributable to the US$139.0M net proceeds from the drawdown of LHM Stage 3 project finance facilities, net funds raised of US$77.1M from the issue of the US$274M convertible bond net of the repayment of the US$191M convertible bonds, which has been partially offset by the full repayment of the outstanding balance of US$24.8M of the LHM Stage 1 project finance facility, US$22.5M repayment of the LHM Stage 3 project finance facility and US$29.9M repayment from the KM project finance facility, as well as net proceeds received from the 2011 share placement of US$62.6M Effect of Exchange Rate Changes on cash balances is a loss of US$0.8M for 2013. F
or p
erso
nal u
se o
nly
41
MANAGEMENT DISCUSSION AND ANALYSIS FINANCIAL REVIEW (continued)
294605_9
LIQUIDITY AND CAPITAL RESOURCES The Group’s principal source of liquidity as at 30 June 2013 was cash of US$78.1M (30 June 2012: US$112.1M). Any cash available to be invested is held with Australian banks with a minimum AA- Standard & Poor’s credit rating over a range of maturities. Of this, US$75.6M is held in US dollars. The Group’s principal sources of cash for the year ended 30 June 2013 were uranium sales receipts of US$400.0M and proceeds from the off-take agreement with EdF of US$200.0M. The amount outstanding at 31 March 2013 on the LHM project finance facilities was US$101.5M and for the KM project finance facility, US$68.1M. The Group’s consolidated financial statements have been prepared on a going concern basis, which contemplates the continuity of normal business activities and the realisation of assets and the settlement of liabilities in the ordinary course of business. During the year ended 30 June 2013, the Group incurred net losses after tax attributable to the members of US$420.9M (2012: US$172.8M) and had net cash outflow of US$33.2M (2012: outflow US$6.5M). At balance date the Group had a net working capital surplus of US$193.0M (30 June 2012: US$137.7M) including cash on hand of US$78.1M (30 June 2012: US$112.1M). Included within this cash on hand is US$25.7M (30 June 2012: US$26.2M) which is restricted for use in respect of the LHM and KM project finance facilities. Repayment obligations, during the year ended 30 June 2014, in respect of interest bearing loans and borrowings are summarised as follows: Secured bank loans principal repayments of US$65.7M for LHM and KM project financing; and
Interest payments of US$31.7M for LHM and KM project financing and convertible bonds. In addition, in arriving at its position in relation to going concern, the Directors have given consideration to the following: Intention to sell a minority equity position in Langer Heinrich Mine in Namibia;
The Group has a history of refinancing some of its debt; and
The Group has a history of successful equity capital raisings.
On 2 August 2013, the Company announced that it had completed a private placement to institutional and accredited investors of 125.6M ordinary shares raising A$88M/US$80.7M. The following is a summary of the Group’s outstanding commitments as at 30 June 2013: Payments due by period
Total
US$M
Less than 1 yr
US$M
1 to 5yrs
US$M
5yrs+ orUnknown
US$M Tenements 31.6 1.0 6.0 24.6 Operating leases 3.6 1.4 2.2 - Other 52.5 50.5 2.0 - Oobagooma acquisition costs 0.4 0.4 - - Manyingee acquisition costs 0.7 - - 0.7 Total commitments 88.8 53.3 10.2 25.3 In relation to the Manyingee Uranium Project, the acquisition terms provide for a payment of A$0.75M (US$0.68M) by the Company to the vendors when all project development approvals are obtained. The Group has no other material off balance sheet arrangements.
For
per
sona
l use
onl
y
42
MANAGEMENT DISCUSSION AND ANALYSIS FINANCIAL REVIEW (continued)
294605_9
OUTSTANDING SHARE INFORMATION As at 29 August 2013 Paladin had 962,765,979 fully paid ordinary shares issued. The following table sets out the fully paid ordinary shares and those issuable under the Company Employee Performance Share Rights Plan and in relation to the Convertible Bonds: As at 29 August 2013 Number Ordinary shares 962,765,979 Issuable under Employee Performance Share Rights Plan 3,237,045 Issuable in relation to the US$300 million Convertible Bonds 55,524,708 Issuable in relation to the US$274 million Convertible Bonds 129,919,393
Total 1,151,447,125 CRITICAL ACCOUNTING ESTIMATES The preparation of the Financial Report requires management to make estimates and assumptions that affect the reported amount of assets and liabilities and disclosure of contingent assets and liabilities at the date of the financial statements and the reported amount of revenues and expenses during the reporting period. Significant areas requiring the use of management estimates relate to the determination of the following: carrying value or impairment of inventories, financial investments, property, plant and equipment, intangibles, mineral properties and deferred tax assets; carrying value of rehabilitation, mine closure, sales contracts provisions and deferred tax liabilities; and the calculation of share-based payments. Refer to Note 3(d). FINANCIAL INSTRUMENTS At 30 June 2013, the Group has exposure to interest rate risk, which is the risk that the Group’s financial position will be adversely affected by movements in interest rates that will increase the cost of floating rate project finance debt or opportunity losses that may arise on fixed rate convertible bonds in a falling interest rate environment. Interest rate risk on cash and short-term deposits is not considered to be a material risk due to the historically low US dollar interest rates of these financial instruments. The Group has no significant monetary foreign currency assets and liabilities apart from Namibian Dollar and Malawi Kwacha cash, receivables, payables and provisions and Australian dollar cash, payables and Canadian payables. The Group currently does not engage in any hedging or derivative transactions to manage uranium price movements, interest rate or foreign currency risks. The Group’s credit risk is the risk that a contracting entity will not complete its obligation under a financial instrument that will result in a financial loss to the Group. The carrying amount of financial assets represents the maximum credit exposure. The Group trades only with recognised, credit worthy third parties. In addition, receivable balances are monitored on an ongoing basis with the result that the Group’s exposure to bad debts is not material. The Group’s treasury function is responsible for the Group’s capital management, including management of the long-term debt and cash as part of the capital structure. This involves the use of corporate forecasting models which enable analysis of the Group’s financial position including cash flow forecasts to determine the future capital management requirements. To ensure sufficient funding for operational expenditure and growth activities, a range of assumptions are modelled so as to provide the flexibility in determining the Group’s optimal future capital structure. OTHER RISKS AND UNCERTAINTIES Risk Factors The Group is subject to other risks that are outlined in the Annual Information Form 51-102F2 which is available on SEDAR at sedar.com
For
per
sona
l use
onl
y
43
MANAGEMENT DISCUSSION AND ANALYSIS FINANCIAL REVIEW (continued)
294605_9
TRANSACTIONS WITH RELATED PARTIES During the year ended 30 June 2013 no payments were made to Director related entities. Directors of the Company receive compensation based on their personal contracts. DISCLOSURE CONTROLS The Company has applied its Disclosure Control Policy to the preparation of the Consolidated Financial Report for the year ended 30 June 2013, associated Management Discussion and Analysis and Report to Shareholders. An evaluation of the Company’s disclosure controls and procedures used has been undertaken and concluded that the disclosure controls and procedures were effective. INTERNAL CONTROLS The Company has designed appropriate Internal Controls Over Financial Reporting (ICFR) and ensured that these were in place for the year ended 30 June 2013. An evaluation of the design of ICFR has concluded that it is adequate to prevent a material misstatement of the Company’s Consolidated Financial Report as at 30 June 2013. During the year the Company continued to have an internal audit function externally contracted to Deloitte Touche Tohmatsu. Internal audit reports and follow-up reviews were completed during the year and the Company continues to address their recommendations. The resultant changes to the internal controls over financial reporting have improved and will continue to improve the Company’s framework of internal control in relation to financial reporting. SUBSEQUENT EVENTS Strategic Initiative Update On 1 August 2013, the Company advised that it had terminated negotiations with the lead party, and all other parties, for the sale of a minority interest in the Langer Heinrich Mine. In the view of the Board, the current depressed uranium price has meant that it is unlikely that a price that appropriately reflects the strategic value of the asset will be achieved and accordingly proceeding at this time would be detrimental to long-term shareholder value. Although there remains interest in the asset, Paladin believes that the current weakness in the spot uranium price (US$35.50/lb) should not overly influence the valuation of a flagship asset such as Langer Heinrich. Specifically, Langer Heinrich: has a +20 years minelife; is a modern technologically advanced operation; is operating in a country that is politically stable; and is currently operating consistently at 5.2Mlb pa with further expansion capacity.
Paladin strongly believes it can generate greater value to its shareholders through postponing the sales process for Langer Heinrich until there is a more a favourable uranium price environment. More generally, Paladin believes that the current low uranium price compromises the capacity for supply to reach clearly stated global demand growth targets. It is generally recognised in the industry that the process for recovery of supply growth can only reasonably start when a sustainable US$70/lb threshold for uranium is reached and Paladin supports this long-term price expectation. In this context, the Langer Heinrich Mine remains a highly valuable and strategically important operation for Paladin. Successful Institutional Placement of Shares to raise A$88M / C$81M On 2 August 2013, the Company announced that it had completed the bookbuild for a private placement to institutional and accredited investors of 125.6M ordinary shares (representing 15% of Paladin’s existing issued capital) raising gross proceeds of approximately A$88M / C$81M.
For
per
sona
l use
onl
y
44
MANAGEMENT DISCUSSION AND ANALYSIS FINANCIAL REVIEW (continued)
294605_9
The placement was priced at A$0.70 (C$0.65) per share which represented a 30% discount to Paladin’s last closing price on the ASX. The new shares rank equally with existing shares. Settlement of the new shares issued under the placement occurred on the ASX and the TSX on Monday 12 August 2013 (in each region). Allotment of the new shares issued under the placement occurred on Tuesday 13 August 2013 (in each region). UBS AG, Australia Branch acted as Global Lead Placing Agent to the placement. Adjustment of the Conversion Price of Convertible Bonds On 15 August 2013, the Company announced an adjustment of the Conversion Price in connection to the US$300M convertible bonds due 4 November 2015 and the US$274M convertible bonds due 30 April 2017 (together, the “Bonds”). Pursuant to the terms of the Bonds the prevailing Conversion Price is subject to adjustment where any new issue of shares is at less than 95% of the Current Market Price. Following the completion of the Placement on 12 August 2013, the Conversion Prices have been adjusted as follows: Convertible bonds due 2015: US$5.403 (previously US$5.608)
Convertible bonds due 2017: US$2.109 (previously US$2.19)
For
per
sona
l use
onl
y
45
SUSTAINABLE DEVELOPMENT
294605_8
Paladin is committed to the goal of sustainable development, commonly defined as “to meet the needs of the present without compromising the ability of future generations to meet their own needs.” Paladin applies and adheres to the established and recognised principles of sustainable development for all of its activities across the world. The commitment to sustainable development is also reflected in Paladin’s corporate values. Paladin aims to achieve a balance between the economic, environmental and social needs in all phases of its projects and considers its employees, community and all other stakeholders for this achievement. These components are intertwined in Paladin’s sustainable development programme. To deliver on the Company’s commitment to sustainable development, Paladin has a Sustainability Committee whose role is to provide the Board with an overview of Paladin’s performance in the areas of health, safety, environment, social responsibility and sustainable development, and to offer advice and recommendations where significant sustainability-related issues arise. The Sustainability Committee comprises three members: the Chairman of Paladin’s Board, Paladin’s Managing Director/CEO and non-executive independent Board member who is also the Chairman of the Sustainability Committee. Corporate Sustainability Reporting During the year, Paladin produced its first Sustainability Report for the FY2012, which can be found on the Company’s website www.paladinenergy.com.au. Paladin is continuing the data collection process from LHM and KM for input into the FY2013 Sustainability Report (the 2013 Sustainability Report). The basis for the data collected is on meeting the reporting guidelines of the Global Reporting Initiative (GRI) Framework applying G 3.1 parameters as the GRI G4 update was only released in May 2013. The GRI Sustainability Reporting Guidelines provide principles and guidance on defining report content. The four principles applied are: Materiality
Stakeholder Inclusiveness
Sustainability Context
Completeness
The Materiality principle is defined as topics and indicators that reflect the organisations potential significant economic, environmental and social impacts or that would substantively influence the assessments and decisions of stakeholders. Prior to public reporting, Paladin conducted an internal materiality test on the GRI G 3.1 aspects and indicators to determine the topics of most significance to the Company. The materiality test process involved workshops with technical personnel and management, the Company Secretary, Chairman and a Board Director to provide a broad Company perspective of significance of the various indicators. In May 2013, the materiality assessment was reviewed by the same team to determine if any amendments are required to the ranking of indicators, or changes to the indicators selected to be reported. The GRI categories comprise the broad groups of Economic, Environment and Social with the Social sub-categories of Human Rights, Labour Practices and Product Responsibility. Each of these categories and sub-categories have aspects and performance indicators on which to report. Paladin’s focus is on those indicators that are considered material to the Company. The information and data collected from LHM and KM will be assessed and then reported in Paladin’s 2013 Sustainability Report. The report is web based and will be placed on the Paladin website for public access. To allow sufficient time for data collection, assessment and reporting for the FY2013 period the report is expected to be available on the website towards the end of CY2013. The following discussion provides an overview of Paladin’s environmental management. More detail on environmental performance, specific management and quantitative data will be provided in the 2013 Sustainability Report.
For
per
sona
l use
onl
y
46
SUSTAINABLE DEVELOPMENT (continued)
294605_9
ENVIRONMENT Our Commitment Paladin is committed to ensuring that effective environmental management is planned and undertaken for all aspects of its operations. The approach to environmental management is guided by Paladin’s Environmental Policy, which promotes a standard of excellence for environmental performance across its operations. The key points of the Policy include: compliance with applicable environmental legislation;
developing standards, systems and plans to identify, assess and manage environmental risk;
implementing and assigning accountabilities for the standards, guidelines and procedures;
striving to achieve continuous improvement in environmental performance;
communicating environmental responsibility to employees and contractors;
effective consultation with stakeholders;
inspections and audits of environmental performance; and
reporting on environmental performance.
In addition to Paladin’s Environmental Policy, LHM and KM each have Environmental Policies applied at the sites that include, as a minimum, consideration of the above points. Paladin has established Corporate Sustainable Development Standards for all of its operational subsidiaries. Operational compliance with Paladin’s Standards forms part of the Corporate Environmental Audit Programme. Environmental Management System Within the Paladin Environmental Management System (EMS) Standard, each operating site is required to develop and implement an EMS that is consistent with the requirements of ISO14001:2004. LHM initialy obtained EMS certification in 2009 and was recertified in 2012. KM is continuing in the development of an EMS for its operations. Operational Environmental Management Plans (EMP) for both LHM and KM have been submitted to and reviewed by the Namibian and Malawian Governments, as well as to other stakeholders and international financial lending institutions as part of the project financing agreement conditions. The Operational EMPs are regularly updated and revised as part of the sites’ continual improvement process. Environment Regulatory Reporting Both LHM and KM prepare various environmental reports for the Namibian and Malawi Governments, respectively. The frequency of regulatory reporting for LHM is bi-annual for general environmental reports and annual for aspects such as water. Regulatory environmental reporting at KM is conducted on a quarterly and annual basis. The regulatory reports include raw monitoring data reports, specific aspect reviews, general environmental reports summarising the environmental activities undertaken on the site, analyses of the monitoring data collected and assessment of trends for the reporting period.
For
per
sona
l use
onl
y
47
SUSTAINABLE DEVELOPMENT (continued)
294605_9
Inspection and Audit Programme The Paladin Environmental Audit Standard requires sites to establish and implement environmental inspection and audit programmes to ensure that the environmental performance of the operations is reviewed, audited and reported to the Board. Internal and external environmental audits are undertaken to ensure that there is not only compliance with regulatory and Paladin requirements but also with the World Bank Equator Principles and other industry standards, in particular those specified for the uranium industry. Inspections and audits were undertaken for both the LHM and KM operations during the reporting period with the findings documented and actions developed to rectify and manage the issues identified. Energy Energy requirements at Paladin’s operations are principally in the form of fuel or electricity generation. Electricity at LHM is purchased from the Namibian grid which can be supplemented, if necessary, with power generated from the on-site power plant. Power for operations at KM is currently generated by a diesel-fuelled power station. The Company and ESCOM (Electricity Supply Corporation of Malawi) are entering the implementation phase of a project to connect KM to the national grid and hence reduce the reliance on diesel at the site. Fuel usage at both sites for vehicles comprises diesel and minor amounts of petrol. Emulsion is used at both sites as the explosive for blasting. The volume of the fuels used during the reporting period is being collated and will be reported in the 2013 Sustainability Report. Water Paladin applies a Standard for Water Use and Water Quality at its operations to ensure that there is efficient, safe and sustainable use of water and that water resources and ecosystems around its sites are protected. Paladin’s operations have water management strategies, detailed flow diagrams, working water balances, and have implemented water management measures to ensure that water management objectives are achieved. The reuse and recycling of water is maximised as much as possible at Paladin’s operations. Water aspects as per the GRI indicator requirements will be presented in the 2013 Sustainability Report. Both LHM and KM are managed as non-discharge sites under normal operating conditions. A comprehensive surface and groundwater monitoring programme has been implemented at each site. Water level measurements, water abstraction and samples are routinely recorded and/or collected according to a monitoring schedule designed to meet regulatory requirements. Data are regularly assessed and compared to baseline and upstream sampling points to determine any impacts of operations on local water resources and to ensure licenced limits/guidelines are not exceeded. All water monitoring data are collated in an Annual Water Report that consolidates and summarises the key water aspects across all Paladin’s exploration projects and operations. Land Use and Biodiversity Land use and understanding land values are important components of sustainable development. Prior to construction activities, studies are conducted to determine land use and land values of the area proposed for disturbance. Relevant baseline studies are conducted to determine the biodiversity, ecological, social and cultural heritage values of the area. Land clearing approval processes are in place at all Paladin sites with the aim of minimising the area of disturbance, and ensuring areas are surveyed to assess impacts prior to clearing. Paladin’s objective is to conserve biodiversity by obtaining knowledge of the ecosystems within the regions in which the Company operates and to ensure that impacts on biodiversity are minimised and managed. Extensive biodiversity studies have been conducted in the area of LHM, which is located in the Namib-Naukluft National Park, to establish biodiversity composition, structure and processes. Baseline biological studies were conducted in the area of KM, which prior to mining was extensively modified by agricultural and burning practices to allow subsidence farming. Aquatic invertebrate monitoring is undertaken to assess the health of the rivers, located in the area of KM.
For
per
sona
l use
onl
y
48
SUSTAINABLE DEVELOPMENT (continued)
294605_9
Rehabilitation The objective of rehabilitation is to return disturbed land to a stable, self-sustaining landform that is compatible with the surrounding environment and has similar land use and ecological values as existed prior to the commencement of operations. Progressive rehabilitation of disturbed areas is undertaken at all of Paladin’s exploration sites and mining operations, where practicable. Rehabilitation Plans are developed and implemented at the sites to ensure disturbed areas are rehabilitated appropriately and in a timely manner. Air Emissions Paladin has an Air Quality Standard in place with the intent to ensure that air pollutant emissions generated by any of Paladin’s activities are identified, impacts assessed and management measures established and implemented. The common air pollutants generated by Paladin activities which have the potential to impact on human health and/or the environment include; particulate matter (dust), sulphur oxides (SOX); carbon oxides (CO and CO2); and nitrogen oxides (NOx). Dust generation during exploration activities and at the mine sites is suppressed to enable a safe working environment and to minimise impacts on the environment and surrounding communities. This together with the progressive rehabilitation of disturbed areas minimises dust generation and the associated impacts. Dust level monitoring and dust collection is undertaken at both the LHM and KM sites. The dust levels and sample analyses results for the reporting period are collated in Environmental Reports and submitted to their respective Governments. SOx emissions are generated at the operations by the burning of fuel for heating and power generation, and also from the on-site production of sulphuric acid at KM. The SOx emissions from the acid plant stack are monitored as are the environmental ground level concentrations. Monitoring data are analysed and the results reported in the Environmental Reports submitted to the Government. The principal direct greenhouse gas emissions from Paladin’s operations are those from fuel burning for power generation, boilers, burners, emulsions for explosives and automotive exhausts. The key indirect greenhouse gas emission relate to the energy purchased from the Namibian electricity grid to power the LHM operations. Greenhouse gas emission data are collected from the operating sites that will be calculated as Carbon Dioxide (CO2) equivalent emissions. Paladin’s current Australian activities are confined to exploration and the Corporate Perth office. Initial estimations of diesel consumption and purchased electricity in Australia indicate that Paladin does not meet threshold levels to require registration and reporting in Australia under the National Greenhouse Emissions Reporting Act (NGER) 2007. Waste Rock Large quantities of waste rock must be removed to allow access to the uranium ore at both LHM and KM and this waste rock is placed into dumps. Waste rock dump location, design and placement are important to the Company in terms of environmental considerations and cost. The main objectives for the final landform of the dumps is to be stable, blend in with the surrounding landscape and be capable of supporting a self-sustaining ecosystem. Studies have been conducted at both mine sites to determine the best locations for the waste rock dumps, taking haulage costs and environmental aspects into consideration. The design of the dumps and the placement of waste rock also consider other factors such as the physical and geochemical properties of the material placed in the dumps. F
or p
erso
nal u
se o
nly
49
SUSTAINABLE DEVELOPMENT (continued)
294605_9
Tailings Tailings management continues to be a high priority at Paladin’s operational sites. Paladin applies measures to ensure that its tailings storage facilities (TSF) are appropriately designed, operated and managed according to acceptable standards. Specialist TSF engineers have designed the TSFs at both LHM and KM and defined the operational practice and management to ensure that the tailings are managed in an acceptable manner, and any potential environmental impacts from the tailings and TSF are minimised. Internationally recognised independent uranium tailings experts conduct peer reviews of the design, construction and operations of the TSF’s and continue to provide an ongoing external review role. Non-Mineral Waste Non-mineral waste includes typical general wastes, sewage and some water that may be considered hazardous. The LHM and KM operations both have waste management programmes and procedures in place with the aim at applying the principles of reduce, reuse and recycle wherever possible. At LHM domestic solid wastes are separated into recyclable and non-recyclable. Recyclable domestic waste is delivered to off site recycling depots and the non-recyclables are taken to the municipal landfill sites. Facilities for the recycling of waste materials in Malawi are very limited as are suitable off site waste disposal locations. The majority of the waste materials generated at KM require on-site disposal so the wastes are classified and separated into their types and directed to appropriate on site waste disposal sites. Sewerage treatment plants are installed at both mine sites to treat sewage which is then directed to process water pond at LHM and the TSF at KM. Waste oils are collected by licensed contractors in both Namibia and Malawi and taken off site for recycling or disposal. Environmental Incidents A standardised Paladin Incident Reporting Procedure is in place to ensure there is consistency across the business in terms of incident classification and reporting. There were no significant environmental incidents reported during the reporting period. Statistics and information on incidents occurring during the reporting period will be included in the 2013 Sustainability Report. Closure Mine closure planning is a key component of Paladin’s commitment to Sustainable Development. A Closure Standard is in place for all of Paladin’s developing and operational sites. The intent of the Standard is to ensure that Paladin’s sites are left in a safe and stable manner and that environmental and social impacts are minimised so that tenements can be relinquished without future liability to the Company, government or the community. LHM has a Draft Mine Closure Plan in place which is in the process of being reviewed and updated to reflect current and future mine plans. The closure planning process at KM progressed during the reporting period with a Closure Risk Assessment conducted, the Draft Closure Strategy reviewed and the preparation of a Draft Mine Closure Plan.
For
per
sona
l use
onl
y
50
SUSTAINABLE DEVELOPMENT (continued)
294605_9
CORPORATE SOCIAL RESPONSIBILITY Paladin exists to create value for its shareholders. In pursuit of this goal, the Company recognises that measurement of corporate success encompasses economic, environmental and social values. Paladin stakeholders expect their Company to be a good corporate citizen with fair and beneficial business practices; operating to the highest ethical standards; contributing to the growth and prosperity of host countries and responding positively to community needs. Paladin’s approach to Corporate Social Responsibility (CSR) – as with its commitment to sustainability – involves:
Top-level support of the Board of Directors and Managing Director/CEO.
Adherence to principles enunciated in Corporate Policy and Procedures.
Programmes aligned with host country Millennium Development Goals.
Personnel dedicated to achieving CSR objectives.
Compliance with recognised international codes of conduct.
Acknowledgement of voluntary standards.
Reporting in accordance with the Global Reporting Initiative.
Paladin seeks to achieve these objectives by example, both through its own actions and by its active participation in industry and community-based organisations that foster and promote these values and aspirations. Below is a summary of the organisations in which the Company participates.
Paladin played an instrumental role in establishing the Australia-Africa Mining Industry Group (AAMIG) – an industry body that promotes best practice in CSR among Australian mining companies active in Africa. Paladin supports AAMIG in promoting best practice in CSR in Africa and is seeking to ensure compliance in its own endeavours.
Paladin has committed to the principles contained in Enduring Value – the Australian Minerals Industry Framework for Sustainable Development. This commitment is aligned to the 10 Sustainable Development Principles of the International Council on Mining and Metals.
Paladin supports the Extractive Industries Transparency Initiative (EITI) and has registered as an EITI Supporting Company. The EITI is a global initiative to improve governance in resource-rich countries through the verification and full publication of company payments and government revenues from oil, gas and mining. In line with Paladin's commitment to combat corruption and bribery as well as to respecting human rights, its corporate values of honesty and integrity, and as a contributor to the local economies of host countries, Paladin endorses the principles and criteria of the EITI. Taxes paid by Paladin to the Malawian and Namibian governments are presented in the Company's Sustainability Report.
Paladin also upholds the Voluntary Principles on Security and Human Rights, complies with the Equator Principles and has strengthened its internal compliance regime in relation to anti-bribery and corruption issues. Whilst not a signatory, Paladin also supports the ten principles of the UN Global Compact.
Paladin’s CSR programmes are developed, managed and assessed in compliance with the Group’s Community Relations Policy.
Paladin contributes significantly to those economies in its countries of operation through a variety of government taxes. These are detailed below for both Malawi and Namibia, where the Group’s mines are located.
For
per
sona
l use
onl
y
51
SUSTAINABLE DEVELOPMENT (continued)
294605_9
Human Rights
Paladin is committed to respecting human rights and fundamental freedoms. The Company’s overall approach to human rights issues is reflected in its Human Rights Policy, which can be found on the Paladin website.
The aim of the Human Rights Policy is to provide the overarching framework for the business in respecting human rights. The Board reviews this regularly to ensure that it is current and that the requirements of the Policy reflect Paladin’s commitment to human rights principles.
For
per
sona
l use
onl
y
52
SUSTAINABLE DEVELOPMENT (continued)
294605_9
Industry Participation
As a leading participant in the global uranium sector, Paladin plays an active and responsible role in public policy development, both corporately in Australia and through Group subsidiary companies in their respective constituencies.
The Company is a participating member of the Australian Uranium Association (AUA) and, as such, is committed to abide by and implement the terms of the AUA Industry Code of Practice. Along with the Code, the Group observes the AUA’s Charter and Principles of Uranium Stewardship, which provide a guide to doing business ethically, responsibly and safely. Together, the Code, Charter and Stewardship Principles make up a vital standards framework for the uranium industry. The Company is also a member of the Minerals Council of Australia (MCA) which represents Australia’s exploration, mining and minerals processing industry, nationally and internationally, in its contribution to sustainable development and society. As a member, Paladin supports the Enduring Value principles as a framework for sustainable development. Senior management across the Group are actively involved in a number of industry and policy making organisations at both board and committee level. These include the AUA, MCA, Uranium Council of Australia, Advisory Group for IAEA, AAMIG and the Chamber of Mines and Energy of Namibia. In addition, Mr Greg Walker, General Manager - International Affairs, who is resident in Malawi, is Australia’s Honorary Consulate to Malawi. Mr Walker provides consular assistance to the growing Australian community in Malawi, as well as assisting the Australian Embassy in Harare to promote Australia’s political and commercial interests in Malawi. Paladin’s Lilongwe office serves as Australia’s Honorary Consulate in Malawi.
LHM was a founding member of the Swakopmund-based Uranium Institute in 2009. The Institute provides support and advice for industry members, operates a Uranium Information Centre and engages with the public and scientific community through hosting training and information events, meetings and workshops. The Institute’s aim is to improve the quality of heathcare, environment management and radiation safety in Namibia.
The Company supports the Uranium Institute financially, through the participation and commitment of LHM senior personnel and by providing internal auditing services to the Institute. LHM is an active member of the Institute’s Health, Environment and Radiation Safety and Security Committee, which addresses industry-related environmental health and radiation issues. LHM leads the Institute’s Water Committee and actively supports its radiation training programme by providing lecturers, instrumentation and on-site training.
Paladin also undertook the following activities during the year:
Sponsorship of and participation in the UK-Malawi Trade and Investment Forum held in London, United Kingdom, in March 2013 during a state visit to the UK by Malawian President Dr. Joyce Banda and senior ministers of the Government of Malawi.
LHM continued to provide strong support for the third Namibian Mining Expo and Conference organised by the Chamber of Mines of Namibia in Windhoek in May. The 2013 Expo showcased achievements of Namibia’s mining industry and its contribution to Namibia’s economy and society, under the theme "Growing the Cake for Socio-Economic Prosperity." The 2013 Expo attracted more than 100 exhibitors and provided an important forum for interaction between industry leaders and stakeholders.
Stakeholder Interaction
Regular meetings are conducted with the stakeholder groups in countries where Paladin has interests. These interactions include regular and/or informal meetings with:
o Community groups; o Environmental groups; o Host nation government ministers and senior civil servants;
For
per
sona
l use
onl
y
53
SUSTAINABLE DEVELOPMENT (continued)
294605_9
o Indigenous groups; o Civil Society Organisations; and o Employees and their representative organisations.
International Initiatives
Malaria Treatment for Children
Paladin has continued to support to Suda Ltd (previously known as Eastland Medical Systems Limited) for Suda’s development of ArTiMist™, a sub-lingual (under the tongue) spray for the treatment of severe and complicated malaria in children. Suda has recently completed its Phase III trial of ArTiMist™ which was a comparative study against intravenous quinine. The report from the trial identified that ArTiMist™ was superior when compared to IV quinine. Approximately 95% of the patients treated with ArTiMist™ had parasite count reduced by more than 90% within 24 hours versus 40.6% of the patients treated with IV quinine. The majority of deaths from severe malaria in childhood are caused by the delayed administration of effective antimalarial treatment. There is a relentless deterioration in the clinical condition of a young child with malaria who fails to get effective treatment, with death ensuing in a matter of hours or days. Suda believes that ArTiMist™ has the potential to be an effective pre-referral medication and has the potential to significantly reduce child mortality and the adverse effects suffered by children, particularly within the first 24 hours of infection. Malawi
Paladin continues to fulfil its social development undertakings under the terms of the Kayelekera Mine Development Agreement with in excess of US$16M having been spent to date, across over 70 social development projects. The largest of those projects was the Garnet Halliday Karonga Water Supply Project, at a cost in excess of US$10M.
The Australian Government handbook on Social Responsibility in the Mining and Metals Sector in Developing Countries draws on examples of Australian leading practice in Corporate Social Responsibility in Africa. Paladin’s Social Management Plan for KM was selected as a case study in the handbook.
A social baseline study conducted as part of the Environmental Impact Assessment undertaken prior to the establishment of KM identified the town of Karonga and villages in the immediate vicinity of KM as areas most likely to be affected by the development of mining operations. Accordingly, Paladin’s CSR programmes focused on these areas, however the Company believes that it is very important to have a broader CSR footprint encompassing villages located along the M26 highway that provides access from Karonga to KM. These villages are remote and generally lacking in the most basic facilities. These communities have high volumes of freight transport passing through or in the vicinity of their villages; however, they did not benefit like those in the immediate areas of the mine site. Paladin adopted the concept of the “Corridor of Care” specifically to bring benefits to these isolated villages. Projects have included the construction of school classrooms, teacher housing (a major concern for village communities) and renovation and electrification of the Wiliro Clinic, which serves the area. Community Liaison
Paladin engages with communities via various forums including the:
Government Liaison Committee (GLC) – this is the peak forum between PAL and the central Government of Malawi;
Karonga District community, through monthly District Executive Committee (DEC) stakeholder’s meetings; and
For
per
sona
l use
onl
y
54
SUSTAINABLE DEVELOPMENT (continued)
294605_9
Kayelekera Village Elders – bi-weekly meeting are held with the Kayelekera Village Traditional Authority (village headman) and village elders to discuss social issues.
Projects undertaken during the year included:
Local Business Development Programme
A programme to promote local involvement, economic growth and business development in communities is in progress. Opportunities are being explored for skills transfer and technical advice from Kayelekera’s experienced workforce to local businesses. KM currently has several hospitality students gaining work experience in the camp kitchen.
Paladin also supports the UK-based MicroLoan Foundation in the Karonga region, which provides micro-loans to women’s groups for small scale co-operative business ventures. To date, around 23 groups involving over 300 women have completed training and received loans.
All small infrastructure projects outside the mine, and many inside, are now contracted out to tradesmen once employed and trained by KM and then assisted to set up businesses as private contractors.
Garnet Halliday Karonga Water Supply Project Upgrade
Paladin continues to provide technical support and assistance to the Northern Region Water Board (NRWB) in the maintenance of the plant. During the year Paladin completed a project to improve the reliability of the water supply to Karonga. This involved repositioning, re-laying and anchoring a total of 760m of pipeline on the lakebed, complete with a redesigned intake strainer system. Mota-Engil precast 92 concrete blocks to weight the pipeline. This involved weights of 2.5 tonnes per nine metres of pipe – which is three times the required anchoring weight for this type of pipeline. The Karonga Water Plant has experienced significantly improved pumping efficiency since the completion of this work.
Karonga Airport Improvements
In January 2013, Paladin and Puma Energy Ltd handed over two reconditioned Dennis fire engines to the Deputy Transport and Infrastructure Minister, Mrs Chimango Mughogho Gondwe, for use at Karonga International Airport. The fire engines, with a capacity of 1,800 litres, have upgraded Karonga’s safety rating to a Category 2 Airport. The Minister noted that the fire engines would enhance safety in Karonga District, as they would serve Karonga District Council, which does not have its own fire service. The fire engines were imported from the United Kingdom by Puma and Paladin. Paladin also constructed a drainage system around the runway to offset erosion problems and refurbished on-site office accommodation.
Community Health Care
Paladin continues to assist the local (Wiliro) government medical staff with meals and transport, in order for them to conduct the weekly general and monthly infants’ clinics in Kayelekera village, which serves 550 - 650 patients a month, alleviating the need for villagers to travel for treatment to Wiliro.
Land has been set aside for construction of a new health centre in the Kayelekera village and discussions are underway with the Minister of Health to agree an appropriate design and construction timetable.
Community Education
Paladin continues to produce education-through-story books covering a broad range of community focused subjects (see table below which lists the titles produced). These booklets are written by Paladin’s Social Development Officer, Robyn Nottingham, who is based in Malawi and are translated into three local languages and distributed to KM employees, students and the community.
For
per
sona
l use
onl
y
55
SUSTAINABLE DEVELOPMENT (continued)
294605_9
Book Title Subject
Alex's Scary Experience Management of fever/malaria
Safe! Prevention of HIV infection
Miriam Prevention of HIV infection
Raymond's Decision Alcohol abuse
Alfred's Money Wise use of wages
Henry Does Some Thinking Trash
What Will Happen? Delivery
How Many? Family Planning
Who Did It? Abuse of girls/women's issues
Three Boys and a Mystery Prevention of diarrhoea
Ella Helps Her Little Brother Prevention of dehydration
What Happened? Drugs
My Father Honesty
Anthony's Boozing Den Alcohol abuse
The Trap Stealing
Ben Bribery and Corruption
My Choice Prevention of HIV infection
Anna Oversomes Her Fear Leprosy
What Happened in the Garden? Management of cuts
Martin's Land Deforestation
Class Assignment Uses of water as medication
Amazing! Care of the newborn
The Big Scam Smoking
The Christmas Story Christmas story
The Football Game Management of a simple fracture
The Blue Bicycle Management of a scrape wound
Smile Dental health
Susi Goes Shopping Buying healthy food
A Good Plan Loans and debt
Sneeze Chest infections
Dingile (Uranium) Issues about uranium mining During the year, eight new books were produced, focusing on other health and lifestyle issues – dental health, management of cuts, scrape wounds and simple bone fractures, good nutrition, honesty, loans and debt, and bribery. These books have proven to be extremely popular. To date, a total of 31 titles have been produced with over 138,000 copies distributed covering a broad range of community focused subjects.
Flood Relief
In April 2013, the Company provided MWK5M in immediate flood relief to assist with food and temporary shelter following severe flooding north of Karonga. Exploration personnel and equipment were also made available to assist in relief efforts.
Educational Support
Support for education for children in Kayelekera and nearby villages is ongoing through donations to the schools towards wages for nine teachers. In August, Kayelekera primary’s badly damaged fence
For
per
sona
l use
onl
y
56
SUSTAINABLE DEVELOPMENT (continued)
294605_9
along the road was rebuilt, providing greater safety to the 580 children, and the landfill behind it aiding in control of soil erosion. Over 200 shrubs were provided and planted at both the primary and secondary schools, for aesthetics as much to provide a further barrier, and paint was supplied for the secondary school classrooms.
A number of employees at the mine are also assisted in ongoing studies as detailed in the Our People section.
Malaria Vector Control Programme
Paladin runs a mosquito control programme four times a year in Kayelekera Village. A baseline threat assessment survey was conducted in August 2007 by world-renowned consultant entomologist, Professor Richard Hunt, to assess the impact on the local mosquito population of commonly used insecticides. Insecticides used by the Government of Malawi in other regions of the country were selected and procured from local suppliers.
A Vector Control Programme team was recruited from Kayelekera Village and sent to Lilongwe for a five-day training course to World Health Organisation standards. Spraying details are reported annually to Karonga District Hospital and the District Health Office.
Construction of New Sere River Foot Bridge
Due to the high water levels after heavy rains, a footbridge was constructed over the Sere River in Kayelekera Village, in 2008 which was replaced in the past year.
Christmas School Distribution
Each December, Paladin celebrates Christmas in the villages around the mine with donations of exercise books and pens, snacks and a toy for each child attending the six schools in the immediate area. Approximately 1,900 school children received gifts.
HIV/AIDS Awareness and Health Campaigns
Paladin HIV/AIDS Awareness programmes continued in local communities. The very popular local Nyange Nyange drama team was funded and transported to visit 127 schools during the year, targeting key causes of HIV spread, being alcohol abuse and oversized families which exacerbate poverty and force girls into high-risk situations. Public HIV-awareness dramas were also held in three locations.
Namibia
LHUPL continued to play an active and leading role in the positive interface between the mining industry and community in Namibia, through its support for the Chamber of Mines and Energy of Namibia and the Chamber’s Uranium Institute and through Langer Heinrich’s own social development programme.
LHUPL recognises its social responsibility and has a strong commitment to supporting activities which benefit the coastal community and the development of Namibia in line with Namibia’s Millennium Development Goals and determined in consultation with community stakeholder groups. These initiatives respond primarily to Namibia’s most chronic problem, endemic unemployment, which is exacerbated by poor education results and substandard skill levels.
Mondesa Youth Opportunities (MYO)
LHUPL has been the principal sponsor of the MYO organisation since 2010. MYO provides educational assistance to improve English, mathematics and computer skills for students drawn from five schools in the disadvantaged areas of the Mondesa and DRC Townships in Swakopmund with 120 students currently enrolled in the programme. MYO’s objective is to encourage completion of secondary education as a precursor to further academic or vocational study.
For
per
sona
l use
onl
y
57
SUSTAINABLE DEVELOPMENT (continued)
294605_9
The programme focuses on educating the “whole child” and, in doing so, covers the academic, emotional, physical and cultural aspects of their life. Students receive a daily nutritious lunch and are also taken out on outings to enhance their knowledge of Namibia and increase their social skills.
National Mathematics Congress
Sponsorship of the National Mathematics Congress continued. The objective of the Congress is to improve the standard of mathematics education at primary and secondary levels across Namibia. Teachers, both primary and secondary, look forward to the National Mathematics Congress both as an opportunity to upgrade their mathematical and professional knowledge and skills, and as an event providing them with inspiration and motivation to face the ever increasing challenges in the classroom. The 8th Congress, held over 3 days in May 2013, had 215 attendees.
“The 2013 Congress focused on “Problem Solving” and it is hoped that the participants in this year’s Congress will take the first steps towards making a National Mathematics Competition in Namibia a reality,” said the project coordinator Ms. Magret Courtney-Clark.
Mathematics Support and Enrichment Programme This programme, developed by the founder of the National Mathematics Congress, focuses on the development of mathematical process skills such as problem solving, reasoning, communicating and making connections. It is aimed at secondary school learners who have the potential to excel in the more advanced levels offered at schools with 84 students participating during the past year. The programme, has, through the variety of activities, achieved its aims to: support able learners to reach their academic potential; develop mathematical problem solving and reasoning skills; and extend and enrich syllabus topics. The 2012 project yielded excellent results with many distinctions and all participants passing their mathematics subject.
Bursary Scheme
One of LHUPL’s strategies to develop Namibian skills has been to launch a full time bursary scheme. This was introduced in 2010 to provide opportunities for talented Namibians to develop their skills and competencies in readiness to occupy positions currently held by non-Namibians. To-date, this scheme has delivered good results, with two mining engineers (both women) and two geologists recently joining the Company.
The Apprentice Programme and NIMT support
LHUPL joined hands with the Namibian Institute of Mining and Technology (NIMT) in 2007 when LHUPL approached NIMT to offer their mechanical and electrical artisans the opportunity to undergo practical training at LHM. Since then, more than 200 students have undertaken their practical training at LHM and on completion of their studies, a number of the students have taken up employment at the mine. School Support Project LHUPL has budgeted to provide small scale project funding to state schools on the Swakopmund Coast, with the supply of text books for secondary school learners. Text books were handed over to the various schools in preparation for the 2012/2013 school years. This year however, on recommendation from the Ministry of Education, primary schools will be the beneficiaries - collaboration with the Ministry ensures the assistance supports the Namibian Government’s Vision 2030.
For
per
sona
l use
onl
y
58
SUSTAINABLE DEVELOPMENT (continued)
294605_9
Graduate Training Initiative This is focused on young Namibians with potential who have chosen to defy humble beginnings and to prepare themselves for professional life. These young graduates are now available in the market and mostly possess an eagerness and enthusiasm for their newly-found professions; however they lack one vital element: experience. The “10,000 hour rule”, for example, maintains that to truly master a skill, a person must put in 10,000 hours of deliberate practice. Langer Heinrich’s aim is to assist new graduates in getting the first number of hours of the required 10,000 hours under their belt and to be able to record this on their CVs. Nine recently-qualified graduates commenced with this programme and are being trained for 12 months, whilst ensuring that they acquire the necessary skill and experience for future employment. HIV/AIDS Programme
Langer Heinrich continues to be active with HIV/AIDS related activities through its Peer Educators. This year focused on educating employees about health issues and participating in fundraising events for the Namibia Cancer Association and HIV/AIDS charity groups. Blood donations clinics are run every three months for employees to participate in.
Other Community Initiatives
Langer Heinrich continues to support two feeding programmes for underprivileged children in Walvis Bay and Swakopmund (catering for between 600 and 700 children per day) in addition to supporting various small scale community projects and sporting activities during the year, reaffirming its commitment to the local community.
Australian Initiatives
In 2011, Paladin made a five-year financial commitment to the Hammond-Nisbet Geoscience Fund administered by the University of Western Australia (UWA). The fund supports the creation of an endowed professorship within UWA’s Centre for Exploration Targeting (CET). This research-intensive position will focus on mentoring new generations of geoscientists in interpretation of fieldwork and structural geophysics and in applying this understanding to mineral systems and exploration targeting.
Paladin also continued its involvement with the ASX Thomson Reuters Charity Foundation. Along with other companies listed on the S&P ASX 200 Index, Paladin contributed to the creation of a share portfolio which was auctioned off at a major charity fundraiser organised by the Foundation. Proceeds from the fundraiser go to a set of pre-determined charities, the main focus being medical research for children.
Canada
In Labrador, Aurora continued to hold biannual consultation sessions in the towns nearest the Michelin project area: Postville, Makkovik and Rigolet. Aurora also supported a variety of youth-focused projects including the Aurora Volleyball Tournaments in Postville and Makkovik, the Aboriginal Youth Career Fair, the Multi-cultural Youth Gathering and Labrador Winter Games teams.
Aurora also maintained its involvement with events of cultural importance to the Inuit of Labrador, supporting traditional dog team sled competitions in the region and seasonal community festivals.
It also became a partner in the Reclamation of Labrador Exploration Sites (ROLES) Project, an industry-led initiative to clean-up abandoned mineral exploration sites. The project is expected to take three years, progressing in phases: identification and inventory of abandoned exploration sites throughout Labrador (with input from community members), site assessment, and removal of waste materials at priority sites. ROLES works directly with local communities and companies and aims to provide opportunities for site rehabilitation training among these stakeholders. Aurora is providing in-
For
per
sona
l use
onl
y
59
SUSTAINABLE DEVELOPMENT (continued)
294605_9
kind support to this initiative in the form of counsel on project configuration, environmental management, and communications.
Employee Charitable Foundation, supported by Paladin
Friends and Employees of Paladin for African Children (FEPAC) is a charitable foundation established in 2008 by Paladin employees to fund social projects that are outside the scope of the Company’s CSR programmes. Paladin supports the involvement of its employees in FEPAC and donates 25c for every A$1 raised and also provides administrative support. To date, FEPAC has raised $765,000 through employee donations, an annual golf day and quiz night. The charity supports six projects in Malawi that assist orphaned children with educational needs and vocational training courses, such as brick laying, carpentry and tailoring. Currently 110 teenagers have completed these courses and have been provided with tools to enable them to earn money to support their younger siblings. These projects include a school for visually impaired and a school for deaf children. In connection with the latter, support is also provided to the ABC Hearing Clinic, an NGO operating in Lilongwe.
During the year, FEPAC financed construction of a second teacher’s house and a three-classroom block at the School for Deaf Children in Karonga, in co-operation with the Australian Government (AUSAID/DAP) which funded 50%. Two-classroom blocks were also constructed at two other government primary schools in the District.
As a follow-up to previous donations of exercise books and pens for school children in six schools near KM, FEPAC undertook to provide atlases, dictionaries and some textbooks, 36 small solar panel sets as an incentive for teachers to remain in remote locations and 206 soccer balls.
FEPAC also took on the sponsorship of drama and books in school. Drama is a traditional art and teaching form used to promote social messaging in Malawi. FEPAC sponsors the Nyange Nyange Drama Group who regularly perform dramas covering health and social issues to primary schools in the Karonga District.
The second annual Charity Golf Day was held in Namibia, organised by local employees, raising N$87,550. The funds were donated to Walvis Bay Kids Haven Children’s Home.
For
per
sona
l use
onl
y
60
SUSTAINABLE DEVELOPMENT (continued)
294605_9
OUR PEOPLE The Company has spent the past year focussing on stabilising its workforce in all key regions to ensure efficiencies are achieved wherever possible. Globalisation of human resources processes continues to be an ongoing focus with an emphasis on global integration and local adaptation.
In line with the strategy of consolidation as opposed to growth, only those positions that are deemed critical have been replaced when natural attrition occurred, leading to a slight reduction in headcount figures globally. Despite challenging market conditions (including ongoing skills shortages, productivity and wage pressures), Paladin remains focussed on attracting, retaining and motivating the best talent at all of its sites. As part of its retention strategy Paladin provides career development opportunities, learning and development options and competitive remuneration packages with data sourced from reputable global survey companies. Similar to previous years, there has been global transfer of skills and experience where appropriate, to foster development of personnel and knowledge retention. In ensuring that the right talent management foundations are in place, there has continued to be emphasis placed on employee relations, communication and learning. Following the success of the INVOCOM (Employee Involvement through Communication for Commitment and Innovation) methodology at Langer Heinrich, the same programme was launched at Kayelekera and has been a contributor to improved business performance through its model of organisational, operational and service excellence. Almost all staff members on site have completed a three day training programme focussed on understanding the concepts of culture and business to facilitate improved communication and understanding amongst a multicultural workforce. Senior staff members at Kayelekera have been involved in a 360° feedback programme which has been developed to improve their managerial skills and assist in improving performance across the Group. As in previous years, employees were supported to access a variety of training options including conferences, short training courses, seminars and post graduate university and professional studies. Amongst other training initiatives a St. John’s Ambulance workplace first aid course was delivered at head office and was well attended with the acquired skills useful both in and outside the workplace. The roll-out of training in the Company’s Anti-Bribery Committee compliance regime was a key focus during the year. Turnover for the Group is detailed in the following table. The average annual rate for large companies was 11.7% as reported in the Australian Institute of Management National Salary Survey 2012. The Australian based voluntary turnover sits at 18.5% (combined Head Office and Exploration) which reflects both Paladin’s programme of rationalisation as well as the challenges faced in the recruitment and retention of high quality mining professionals. Exit interviews are undertaken to further understand the causes of voluntary turnover with those who leave typically doing so to advance their careers or for personal reasons.
All of Paladin’s HR practices are fair and consistent to ensure that they are free from unlawful discrimination. Supporting a diverse workforce remains one of the cornerstones of Paladin’s strategy and the Company is committed to an equitable gender balance amongst its workforce. Further information on diversity can be found in the Corporate Governance Statement.
Australia (Head Office & Mount Isa)
The Australian headcount is currently 63, of which females represent 46%. Retention remains an ongoing challenge in the Australian context. The Australian voluntary turnover rate was 18.5%, a significant increase on last year’s rate; however, it is consistent with Paladin’s desire to contract headcount wherever possible to achieve efficiency aims. The Mount Isa office, in particular, has contracted substantially, going from 6 employees in July last year to 0.6 full time-equivalent in July of this year. This is consistent with a reduction in exploration expenditure for the immediate future and also a change in execution of future Mount Isa exploration programmes with a greater emphasis on campaign style programmes managed from the Perth office.
14 Perth based positions were made redundant during the year.
Paladin’s exploration group consists of 12 geologists, two geophysicists, three full time database administrators and one GIS co-ordinator supported by external contractors and consultants. Paladin has exploration teams located at both mine sites in Africa whose focus is near mine resource extension and regional resource development and a regional exploration team in Canada. In addition, an exploration team is based in the Perth office and is focussed on the Manyingee and Spinifex Well projects in Western Australia as well as supporting the Company’s projects worldwide.
Paladin has a strong track record in retaining geoscience professionals with the majority of staff having a minimum of three years’ tenure with the Company with a number employed directly after graduation from universities around the world. The Company supports development for exploration geologists through secondments to either the African or Canadian projects to gain experience in different geological terrains and cultures as well as mine site development. In order to retain and mentor the exploration group, the Company undertakes regular workshops, both regionally and globally, to update their knowledge in the latest techniques and processes. The Company also uses these workshops to transfer knowledge from expert professionals in various geoscience disciplines and to enable Company geologists to share their experiences with their colleagues. During the year a number of Company geoscientists gave presentations at various national and international conferences and technical meetings.
Malawi (Kayelekera Mine)
Employee numbers totalled 585 at year end, a reduction of 174 on the previous year. This was as a result of ongoing efficiency improvements throughout the period and the retrenchment of 106 employees in January 2013 following an exercise to identify redundant positions. In addition to the retrenchments, 25 expatriate contracts were not renewed at expiry. Long-term mining contractors totalled 212 at the end of the year.
Of this current total, 95 are expatriate staff, representing 16% of the workforce. A further three expatriates are seconded from the Perth head office to provide specialist services for part of the year. Amongst the expatriates, voluntary turnover has been reduced to 6%, a significant decrease from last year.
The Company reviewed salaries paid to Malawian National employees twice during the year with a view to offsetting the inflationary effects of the significant devaluation of the national currency during the year under review. The first of these increases in October 2012 amounted to 18% on basic salaries, followed in June 2013 by a further 11% increase, mirroring the inflation rate.
Training and development of Malawian Nationals continues to be a strategic focus of the mine. Progress in the development of Process Operator and Financial Officer skills has been especially
For
per
sona
l use
onl
y
62
SUSTAINABLE DEVELOPMENT (continued)
294605_9
gratifying and capacity development is also evident in the Environmental Management, Human Resources, Mining and Engineering departments.
PAL has a training framework that recognises and addresses its business goals by way of:
On the job training – provided by coaches and mentors.
In-house training – provided by skilled experts.
External training – provided by external vendors.
External studies – provided by educational institutions.
Against this backdrop, and in the context of rigorous efforts to contain expenditure at all levels, the focus for the past year has been on training and development on site - in a number of key aspects of the business and covering a large number of employees – as follows:
Personal Development Plans have been developed for 35 targeted ‘high-potential’ employees - with the objective of identifying individual training and development needs and to develop these employees into positions of greater responsibility and authority.
510 employees participated in Climate Creation* workshops facilitated by specialist external service providers.
25 employees attended training on the topic of Performance Management.
145 employees were trained in INVOCOMS* facilitation skills.
4 employees are currently on funded studies at external educational institutions.
84 employees participated in the training component of the Company’s Anti-Bribery and Corruption initiative, launched during the year. This training will continue to cover all employees in the year ahead.
*The creation of a “Prosperity Partnership”, designed to create a shared vision for the on-going success of the mine, commenced in July 2012 with a number of Climate Creation Workshops. In conjunction with these workshops (which were completed in May 2013), INVOCOMS Skills training workshops (aimed at improving the effectiveness and communication flow of meetings at all levels of the organisation) commenced in October 2012 and continued through June 2013.
Both of these initiatives have provided significant improvements to the employee relations environment on the mine and will be used as a basis for implementation of best-practice performance management systems and processes in the year ahead. The planned introduction of formal performance management processes will support development programmes through identifying employee strengths and areas for development. It is envisaged that targeted training initiatives and planned interventions to ensure that developmental targets can be met will result.
Paladin has addressed the social issues detrimentally affecting the lives of the employees and their families, through the culturally acceptable story-telling medium. The stories, created by Paladin staff, are in small illustrated books, and have been translated into the most common languages of the employees (ie, English, Chitumbuka and Chichewa) making them not only readily accessible but also very popular. In the past year, the three key social issues of lack of family planning, alcohol abuse and accumulation of debt have been tackled. A fourth book, about the pervasive practice of bribery has also been written, to reinforce the workshops that have been held to clarify the law and Company policy about bribery and corruption.
For
per
sona
l use
onl
y
63
SUSTAINABLE DEVELOPMENT (continued)
294605_9
Namibia (Langer Heinrich Mine)
Stability has been a feature of the past year with permanent employee numbers remaining static at 333 - a reflection of rationalisation through natural attrition. The average voluntary turnover rate is 7.5% with 25 permanent employees resigning during this review period. At the end of the year long-term contractor numbers totalled 787 which included 482 mining contractors. The past year saw the introduction of a working partnership between the representatives of the Mineworkers Union of Namibia and LHUPL management and employees, each exploring the parameters of this new relationship. Cumulative discordant views were addressed through National Union Leadership and Management sessions where methods of cooperation were explored, paving the way for the conclusion of a two-year agreement on increased wages and changed benefits, which has regard to the sustainable mining and business operations of LHM. In addition considerable progress was made on the Recognition and Procedural Agreement, which structures the social partnership between an employer and a representative trade union. Apart from the above, outstanding matters which were referred by the local branch of the Mineworker’s Union to the Office of the Prime Minister were concluded in favour of LHUPL, with the ministerial committee commending LHUPL as a fair employer and the mine being one of the best and safest mines in Namibia. It is anticipated that the outcomes of the above interventions will assist in resolving any potential future conflict between the social partners and avoiding interruptions to LHM business operations. LHUPL is compliant with all requirements of the Affirmative Action Act and has a consultative forum which is an integral part of its affirmative action strategy. Furthermore, LHUPL is committed to, and fully supports, the policy of equal opportunity employment and non-discrimination through its measurable Affirmative Action Plan. The Company remains committed to moving towards a workforce with an improved gender balance. Females make up 14.7% of the total number of permanent employees and are well represented amongst the professional roles (27% of the senior leadership team are female.) LHUPL currently has female employees represented in the following disciplines, amongst others: trainee mining engineer (2), metallurgist (2), geologist (4), chartered accountant (2), HR practitioner (2), environmental scientist (1), artisan (2), graduate trainee (5) and apprentice (8).
Filling some positions remains a challenge due to the on-going skills shortage in Namibia. LHUPL aims to retain its employees through offering internal study opportunities, paying market competitive salaries and other recognised retention strategies. Capacity development remains a priority and employees are given the opportunity to undertake internal and external training courses. Seven employees were awarded part-time bursaries this past year. The bursary scheme introduced for Namibians presently has six full-time students enrolled in the following courses: Metallurgy (1), Mining Engineering (3), Geology (post graduate) (2). A number of the graduates have taken up employment at LHM and are being developed internally, whilst two of the remaining bursary students (one a former employee) are expected to complete studies and commence employment in January 2014.
In addition to its bursary programme, LHUPL has introduced a graduate programme which provides 11 graduate positions: geologist (4), accountant (2), metallurgist (2), chemistry PhD (1), lab technician (1), business administration (1).
The relationship which currently exists between the Namibian Institute of Mining Technology, LHUPL and the Ministry of Education has proven to be beneficial to all stakeholders over the years and will continue to be maintained to ensure that students are accommodated for practical “hands on” training. In collaboration with NIMT, 41 students are currently provided with work integrated learning placements as part of their coursework and it will assist their attaining a skilled trade qualification. It is envisaged that LHM will retain a number of the bursary and graduate students.
Employee wellness remains an ongoing feature of the LHUPL employee engagement programme as the health and well-being of all employees is integral to corporate success. The occupational health administrator coordinates efforts, reviews new programme initiatives and manages existing programmes. The HIV/AIDS peer educators team’s activities continued over this review period and peer educators continue to provide counselling and assistance to employees on the issue of HIV/AIDS and other areas where assistance may be required.
For
per
sona
l use
onl
y
64
CORPORATE GOVERNANCE STATEMENT
294605_8
CORPORATE GOVERNANCE FRAMEWORK The Board of Directors of Paladin Energy Ltd is responsible for the corporate governance of the Group. Paladin has adopted systems of control and accountability as the basis for the administration of corporate governance. This Corporate Governance Statement outlines the key principles and practices of the Company which, taken as a whole, is the system of governance. Shareholders are reminded that Paladin operates with a dual listing in Australia on the ASX and in Canada on the Toronto Stock Exchange (TSX). In formulating the governance framework, the regulatory requirements in both Australia and Canada have been taken into account. The Company has complied with each of the Eight Corporate Governance Principles and the corresponding Recommendations as published by the ASX Corporate Governance Council. Further the Company also complies with the Ontario Securities Commission’s corporate governance requirements as set out in National Instrument 58-101. The Company reviews and amends its corporate governance policies as appropriate to reflect the growth of the Company, current legislation and good practice. The Company’s website (www.paladinenergy.com.au) includes copies or summaries of key corporate governance policy documents. RELATIONSHIP WITH SHAREHOLDERS The Company places a high priority on communications with, and accountability to, shareholders. The Board recognises that shareholders, as the ultimate owners of the Company, are entitled to receive timely and relevant high quality information about their investment. Similarly, prospective investors should be able to make an informed decision when considering the purchase of shares in Paladin. To safeguard the effective dissemination of information, a Continuous Disclosure & Communication Policy is in place. This reinforces the Company’s commitment to its continuous disclosure obligations imposed by law. Information will be communicated to shareholders by: ensuring that published financial and other statutory reports are prepared in accordance with
applicable laws and industry best practice;
ensuring the disclosure of full and timely information about the Company’s activities in accordance with the general and continuous disclosure principles in the ASX Listing Rules, the Corporations Act in Australia and all relevant legislation in Canada;
providing detailed reports from the Chairman, the Managing Director/CEO and other senior executives at the Annual General Meeting (AGM);
placing all material information released to the market (including notices of meeting and explanatory materials) on the Company’s website as soon as practical following release;
placing the Company’s market announcements and financial data for the preceding seven years on its website;
providing the Annual Report in a “user friendly” electronic format on its website; and
providing quarterly conference calls incorporating Q&A together with investor updates.
In addition, the website includes a facility to allow interested parties to subscribe to receive, electronically, public releases and other relevant material concerning the Company. Shareholders are encouraged to attend AGMs and ask questions of Directors, senior management and the Company’s external auditors, who are required to be in attendance. In the event that
For
per
sona
l use
onl
y
65
CORPORATE GOVERNANCE STATEMENT (continued)
294605_9
shareholders are unable to attend meetings, they are encouraged to lodge proxies signifying their approval or otherwise of the business to be considered. Shareholders are able to directly lodge their votes online via the Company’s website and the Computershare (the Company’s share registry) voting platform. BOARD OF DIRECTORS Role of the Board The Board guides and monitors the business of Paladin on behalf of shareholders, by whom they are elected and to whom they are accountable. The Board is responsible for setting corporate direction, defining policies and monitoring the business of the Company, to ensure it is conducted appropriately and in the best interests of shareholders. The role of the Board is to oversee and guide the management of the Company with the aim of protecting and enhancing the interests of its shareholders, taking into account the interests of other stakeholders including employees, customers, suppliers and the wider community. The Board operates under a Charter and has a written Code of Conduct (Code) which establishes guidelines for its conduct. The purpose of the Code is to ensure that Directors act honestly, responsibly, legally and ethically and in the best interests of the Company. The Board is responsible for setting the strategic direction and establishing goals for management and the monitoring of the achievements against these goals. The Board evaluates the performance of senior executives and is also responsible for CEO succession planning. Composition of the Board The Board comprises five Non-executive Directors, including the Chairman and one Executive Director, being the Managing Director/CEO. The names of the Directors, both in office at the date of this report and those who held the position during the past year, are set out in the Directors’ Report. This information includes their status as Non-executive, executive or independent, their qualifications and experience and length of service. The structure of the Board has evolved over time to reflect the changing needs of the Company to ensure an appropriate mix of skills and experience are available to oversee the growth of Paladin to its full potential. Skill sets represented at Board level include managerial, technical, financial, corporate, legal and commercial. Particularly, members have a broad range of experience and expertise in the uranium business. Director Independence Directors are expected to bring independent views and judgement to the Board’s deliberations. All of the Non-executive Directors, including the Chairman, are considered by the Board to be independent. In considering whether a Director is independent, the Board has regard to the independence criteria set out in the ASX Corporate Governance Council’s Corporate Governance Principles and Recommendations and the Corporate Governance Guidelines developed by the Ontario Securities Commission pursuant to National Policy 58-201 and other facts, information and circumstances that the Board considers relevant. The Board assesses the independence of new Directors prior to appointment and reviews the independence of all Directors as appropriate. Meetings of the Board The Board meets formally face to face at least four times a year (each over a three day period). Video conferencing facilities provide greater ease of communications and meetings via this medium are held at a six week intervals between face to face meetings. Additional ad-hoc meetings are held as required. Members of senior management attend and make presentations to the Board covering all
For
per
sona
l use
onl
y
66
CORPORATE GOVERNANCE STATEMENT (continued)
294605_9
aspects of the Company’s operations. This provides an excellent opportunity for dialogue and networking, with management from all operations present. Non-executive Directors meet together without the Managing Director/CEO and management being present, prior to each of the four principal Board meetings. The entire Board is required (as stated in their Letters of Appointment) to attend the AGM of the Company and all attended the 2012 AGM. The Board holds an annual strategic planning session with management at which the Company’s strategic plans for each operating activity and the Group as a whole are presented. This is held as part of the budget review process. The Managing Director/CEO encourages full access to executive managers by the Board to ensure transparency at a senior management level. Non-executive Directors are encouraged to visit the Company’s operations annually and these visits provide the Non-executive Directors with unlimited access to all site personnel. Retirement and Re-election The Constitution of the Company requires one third of the Directors, other than the Managing Director, to retire from office at each AGM. Directors who have been appointed by the Board are required to retire from office at the next AGM and are not taken into account in determining the number of Directors to retire by rotation at that AGM. Directors cannot hold office for a period in excess of three years or later than the third AGM following their appointment without submitting themselves for re-election. Retiring Directors are eligible for re-election by shareholders. Rick Crabb and Philip Baily will seek re-election at the 2013 AGM, following their retirement by rotation. The Board does not believe that any Director has served on the Board for a period which could, or be perceived to, materially interfere with his ability to act in the best interests of the Company. In reaching this conclusion, the Board has noted that each of R Crabb (the Chairman) and J Borshoff (the Managing Director/CEO) will have each served on the Board for 20 years. Notwithstanding their period of service, the Board concluded that both Directors retain independence of character and judgement and continue to make outstanding contributions at Board level. Both bring their unique skills to the Board and participate in robust constructive debate. The Board considers that Mr Borshoff’s uranium experience and knowledge of the nuclear industry and Mr Crabb’s international resource law experience remains valuable at Board level. The Board further agrees that time in office should only be considered from 2004, as the period prior to 2004 the Company was a junior explorer. It is also noted that the Company did not enter the ASX/S&P 200 until June 2005. Nomination and Appointment of New Directors If it is necessary to appoint a new Director to fill a vacancy on the Board or to complement the existing Board, a wide and diverse potential base of possible candidates is considered and external consultants are engaged to assist in the selection process, if required. The Board assesses the qualifications of the proposed new Director against a range of criteria including background, experience, professional skills, personal qualities, the potential for the candidate’s skills to augment the existing Board and the candidate’s availability to commit to the Board’s activities. If these criteria are met and the Board appoints the candidate as a Director, that Director must retire at the next AGM and will be eligible for re-election by shareholders at that AGM. New Directors appointed to the Board are invited to participate in an induction programme which includes provision of comprehensive written material regarding the Company such as: information on the financial, strategic and operational position of the Company;
a comprehensive letter of appointment which sets out the Company’s expectations on
acceptance of the position;
a written statement which sets out the duties, rights and responsibilities they undertake on becoming a Director together with material detailing the operations, policies and practices of the Company; and
For
per
sona
l use
onl
y
67
CORPORATE GOVERNANCE STATEMENT (continued)
294605_9
access to previous Board papers together with recent Annual Reports and interim financial statements.
Furthermore, new Directors are invited to attend briefing sessions with the Managing Director/CEO and key members of the senior management team where they may ask questions and direct any queries they may have to the Chairman and/or the Managing Director/CEO or obtain any other briefings they feel necessary from the Chairman and/or the Managing Director/CEO. They are encouraged to attend site visits in liaison with the Managing Director/CEO, at appropriate times. Directors agree to participate in continuous improvement programmes from time to time, as considered appropriate. Evaluation of Board Performance Improvement in Board processes and effectiveness is a continuing objective and the primary purpose of Board evaluation is to identify ways to improve performance. The Chairman is responsible for conducting an annual review of the Board performance. An evaluation of the performance of the Board has been carried out. This process involved completion of individual questionnaires focused on process, structure, effectiveness and contributions and addresses the performance of each Director individually. Responses to the questionnaire were collated and discussed by the Board in an open forum and recommendations for improvement considered.
Knowledge, Skills and Experience To assist Directors to maintain an appropriate level of knowledge, skill and experience in the operations of the Company, Directors have the opportunity to undertake site visits to familiarise themselves with the Company’s operations. Directors are also provided with papers, presentations and briefings on the Company’s operations and on matters which may affect the Company. These are provided in addition to Board papers and are designed to assist the Directors to gain relevant and timely information to assist in their decision making process. The Company has implemented a secure electronic information repository to facilitate access to past and present Board documentation and other relevant reference material. Directors are encouraged to undertake continuing education relevant to the discharge of their obligations as Directors of the Company. Subject to prior approval by the Company Secretary, the reasonable cost of such education is met by the Company. Position Descriptions The Board has developed and adopted written position descriptions for the Non-executive Chairman of the Board, the Chairman of each Board Committee, the Managing Director/CEO and the Company Secretary. These delineate the role and responsibility of each position and provide clarity on the expectations for those individuals occupying these key positions within the Company. Conflicts of Interest The Code of Conduct for Directors, a copy of which is available on the Company’s website, sets out the procedure to be followed if there is, or may be, a conflict between the personal or other interests of a Director and the business of the Company. A Director with an actual or potential conflict of interest in relation to a matter before the Board does not receive the Board papers relating to that matter and when the matter comes before the Board for discussion, the Director withdraws from the meeting for the period the matter is considered and takes no part in the discussions or decision-making process. Minutes reporting on matters in which a Director is considered to have a conflict of interest are not provided to that Director, however, the Director is given notice of the nature of the matter for discussions and, as much as practicable, of the general nature of the discussion or decision reached.
For
per
sona
l use
onl
y
68
CORPORATE GOVERNANCE STATEMENT (continued)
294605_9
Remuneration Details of the remuneration policies and practices of the Company and the remuneration paid to the Directors (Executive and Non-executive) and senior executives are set out in the Remuneration Report included in the Directors’ Report. Shareholders will be invited to consider and to approve the Remuneration Report at the AGM in November 2013. In relation to the Non-executive Directors, there are no termination or retirement benefits other than those contained in statutory superannuation plans. Independent Advice The Board and its Committees may seek advice from independent experts whenever it is considered appropriate. With the consent of the Chairman, individual Directors may seek independent professional advice, at the expense of the Company, on any matter connected with the discharge of their responsibilities. No Director availed himself of this right during the course of the year.
BOARD COMMITTEES The Board has established Audit, Nomination, Remuneration, and Sustainability Committees which assist in the discharge of the Board’s responsibilities. In addition to a review by the Board, each committee reviews its performance and Charter on an annual basis. Board approved charters set out the terms of reference and rules governing these Committees. Audit Committee The Audit Committee assists the Board in discharging its responsibilities to ensure that the Company complies with appropriate and effective accounting, auditing, internal control and compliance and reporting practices in accordance with the Audit Committee Charter. The Audit Committee Charter is reviewed annually by the Board and no changes were made to the charter during the financial year. The role of the Audit Committee is to: monitor the integrity of the financial statements of the Company, reviewing significant financial
reporting judgments;
review the Company’s internal financial control system and, unless expressly addressed by a separate risk committee or by the Board itself, risk management systems;
monitor and review the effectiveness of the Company’s internal audit function; monitor and review the external audit function including matters concerning appointment and
remuneration, independence and non-audit services; and perform such other functions as assigned by law, the Company's constitution, or the Board. The Audit Committee comprises three members, all of whom are independent Non-executive Directors. The current members of the Audit Committee are: Donald Shumka – Committee Chairman
Non-executive, Independent Director
Sean Llewelyn Non-executive, Independent Director
Peter Donkin
Non-executive, Independent Director
For
per
sona
l use
onl
y
69
CORPORATE GOVERNANCE STATEMENT (continued)
294605_9
The Audit Committee meets at least once a quarter and at any other time requested by a Board member, Company Secretary or external auditor. The external auditors attend each quarterly meeting and on other occasions where circumstances warrant. At the discretion of the Chairman, having regard to the nature of the agenda, relevant members of management may be invited to attend meetings. The number of meetings of the Audit Committee during the reporting period and the names on the attendance record is set out in the Directors’ Report. The Audit Committee carries out periodic self-evaluation of its effectiveness and performance. The Chairman of the Board includes an evaluation of the Audit Committee’s effectiveness and performance within his overall Board evaluation. The external auditors are Ernst & Young who were appointed as the Company’s auditors in June 2005. In November 2008, the audit partner was changed as part of the partner rotation process. The Corporations Act 2001 requires a five year mandatory auditor rotation period for listed companies. The Corporations Legislation Amendment (Audit Enhancement) Act 2012 passed in June 2012 introduced more flexibility on Lead Audit Partner rotation to allow for listed companies to extend the auditor rotation period for a Lead Audit Partner for up to two years (extended from five years to seven years) where such an extension is consistent with maintaining the quality of the audit provided. After due consideration and in accordance with section 324DAB of the Corporations Act 2001 the Audit Committee was satisfied that the extension of tenure of the Lead Audit Partner Mr Greg Meyerowitz for a further two years would safeguard the quality of the audit provided to the Group and this would not give rise to a conflict of interest situation. As such Mr Meyerowitz’s tenure as the Lead Audit Partner for the Paladin Group was extended by a further period of two successive financial years commencing 1 July 2013, subject to Ernst & Young continuing to act as the Group’s auditor. The external auditors meet with the Audit Committee without management present at each meeting. Nomination Committee The responsibilities of the Nomination Committee include: reviewing the size and composition of the Board and making recommendations to the Board on
any appropriate changes;
developing and planning for identifying, assessing and enhancing Director competencies; making recommendations on the appointment and removal of Directors; evaluating Board performance so that individual and collective performance is regularly and
fairly assessed; and providing new Directors with an induction into the Company and provide all Directors with
access to ongoing education relevant to their position. Sean Llewelyn chairs the Nomination Committee. The Board considers that given the importance of Board composition, it is appropriate that all members of the Board are members of the Nomination Committee. The number of meetings of the Nomination Committee during the reporting period and the names on the attendance record is set out in the Directors’ Report. The Chairman of the Board includes an evaluation of the Nomination Committee’s effectiveness and performance within his overall Board evaluation.
For
per
sona
l use
onl
y
70
CORPORATE GOVERNANCE STATEMENT (continued)
294605_9
Remuneration Committee The role of the Committee, in accordance with the Remuneration Committee Charter, is to assist the Board with respect to remuneration by reviewing and making appropriate recommendations on: remuneration packages of executive Directors, Non-executive Directors and senior executives;
and
employee incentive and equity based plans including the appropriateness of performance hurdles and total payments proposed.
The ASX Listing Rules and the Constitution require that the maximum aggregate amount of remuneration to be allocated among the Non-executive Directors be approved by the shareholders in a general meeting. In proposing the maximum amount for consideration by shareholders, and in determining the allocation, the Remuneration Committee will take into account the time demands made on Directors given the increasing complexity of the Paladin Group and such factors as fees paid to Non-executive Directors in comparable Australian companies. The remuneration paid to Directors and senior executives is shown in the Directors’ Report. The Remuneration Committee comprises three members, all of whom are independent Directors. Sean Llewelyn is the Chairman of the Remuneration Committee. The current members of the Remuneration Committee are: Sean Llewelyn – Committee Chairman
The number of meetings of the Remuneration Committee during the reporting period and the names on the attendance record is set out in the Directors’ Report. The Chairman of the Board includes an evaluation of the Remuneration Committee’s effectiveness and performance within his overall Board evaluation. Sustainability Committee The role of the Sustainability Committee is to provide the Board with an overview of Paladin’s performance in the areas of health, safety, environment, social responsibility and sustainability and to provide the Board with advice and recommendations where relevant significant incidents occur. The responsibilities of the Committee are to: periodically review Paladin’s policies and guidelines in the area of radiation, health, safety,
environment, social responsibility and sustainability to ensure they continue to reflect the latest international standards;
monitor Paladin’s performance and the effectiveness of the implementation of the relevant guidelines and policies;
receive and consider reports on significant accidents, environmental incidents, community
concerns and breaches of Policy or system failure;
receive and consider any major relevant internal or consultant reports;
For
per
sona
l use
onl
y
71
CORPORATE GOVERNANCE STATEMENT (continued)
294605_9
receive and consider relevant internal audit reports;
review relevant external audit reports and consider their independence and effectiveness;
obtain assurances that Paladin’s operations are in compliance with all relevant legislation;
refer matters of concern to the Board as appropriate; and
exercise such other powers and perform such other duties and responsibilities as are incidental to the purposes, duties and responsibilities of the Committee pursuant to the Charter and as may be delegated by the Board to the Committee from time to time.
The Sustainability Committee comprises three members, the majority of whom are independent Non-executive Directors. The current members of the Sustainability Committee are:- Philip Baily – Committee Chairman
The Sustainability Committee meets at least twice a year, with further meetings as required. At the discretion of the Chairperson, having regard to the nature of the agenda, relevant members of management and external consultants may be invited to attend meetings. The number of meetings of the Sustainability Committee during the reporting period and the names on the attendance record is set out in the Directors’ Report. The Chairman of the Board includes an evaluation of the Sustainability Committee’s effectiveness and performance within his overall Board evaluation. FINANCIAL REPORTING CEO and CFO Certification In accordance with the Corporations Act 2001, ASX Corporate Governance Principle 4 (Safeguard Integrity in Financial Reporting) and Canadian Securities Law, relevant declarations, statements and certifications have been provided by the Managing Director/CEO and the Chief Financial Officer in relation to the Company’s 30 June 2013 Annual Report, including financial statements. DISCLOSURE CONTROLS Paladin is committed to ensuring that shareholders and the market are provided with full and timely information and that all stakeholders have equal and timely access to material information concerning the Company. The Company understands and respects that timely disclosure of price sensitive information is central to the efficient operation of the ASX’s and Toronto Stock Exchange’s securities market and has adopted a Continuous Disclosure & Communication Policy with underlying procedures covering public announcements, the prevention of selective or inadvertent disclosure, conduct of investor and analysts briefings, and media communications. This Policy reflects the commitment of the Directors and management to promoting consistent disclosure practices aimed at accurate, timely and broadly disseminated disclosure of material information to the market. The Company has formed a Disclosure Control Committee which has responsibility for overseeing and co-ordinating disclosure of all public
For
per
sona
l use
onl
y
72
CORPORATE GOVERNANCE STATEMENT (continued)
294605_9
information. Members of this Committee are the Managing Director/CEO, Company Secretary and Chief Financial Officer. RISK MANAGEMENT The Company has established policies on risk oversight and management and has a risk management and internal control system to manage the Company’s material business risks. The Company has developed its risk management policy in line with the implementation of the risk management system and a risk management framework. The Company’s Risk Management Policy is to identify, assess, evaluate, monitor and mitigate risks which are considered unacceptable to the Company. Operational business controls have been identified and are in place to ensure unwanted threats to the business are managed. Paladin has also developed the business environment for managers and senior personnel to assess risks and make sound business decisions. Whilst all personnel have a responsibility to identify and report to management risks which may materially affect the Company, the Managing Director/CEO has the overall responsibility for the management of risk in the Company. The Managing Director/CEO is assisted by the heads of operational business units who “champion” risks within the business unit. Paladin has adopted the Australian and New Zealand Standard ISO 31000:2009 - “Risk Management” in managing the risk management process. The risk management system is designed and implemented by the Managing Director/CEO, with assistance from senior executives, and is subject to the review of the Board of Directors. A report is provided annually to the Board of Directors detailing the management process in relation to the Group’s material business risks. The Company maintains a Risk Register, which sets out all of the enterprise risks that have been identified and includes an assessment of the risk (risks analysed and evaluated), and treatment plans to mitigate risks. The risk register has been compiled and is subject to regular review by the Managing Director/CEO and senior management to ensure adequate risk control measures have been identified. An operational risk assessment system is in place at the Langer Heinrich and Kayelekera operations, which is continuously reviewed and updated. Paladin is committed to continual improvement of the risk management process and procedures to ensure the highest return to shareholders and stakeholders. The Company has developed a Crisis and Emergency Management System with individual site plans for LHM and KM. The Company also conducts scenario-based exercises to practise crisis and emergency response. ENVIRONMENT The Company promotes a standard of excellence for environmental performance across its operations. The Company seeks to prevent, minimise, mitigate and remediate any adverse impacts of its operations on the environment and strives to achieve continuous improvement in environmental performance. The Company has an Environmental Policy that endorses compliance with all applicable environmental legislation as a minimum, development and implementation of Environmental Standards and an Environmental Management System, the assessment and management of environmental risks, continuous improvement in environmental performance, ensuring that its employees and contractors are aware of their environmental responsibilities, effective stakeholder consultation in relation to the Company’s operations and proposed projects, and undertaking regular audits and reviews and reporting on environmental performance. HEALTH AND SAFETY The safety, health and wellbeing of employees, contractors and the community are of core value to Paladin’s operations. A healthy workforce contributes to business success and the Company’s aim is for zero injuries. The Company encourages safe behaviour by employees and contractors, establishes a mindset that injuries are preventable, provides safety education and training, and
For
per
sona
l use
onl
y
73
CORPORATE GOVERNANCE STATEMENT (continued)
294605_9
conducts safety risk assessments. The safety and health performance of Paladin is measured through internal and external internationally recognised auditing and reporting processes. During the year external health and safety audits were carried out at LHM and KM. SECURITIES OWNERSHIP AND DEALINGS
The Company has a Policy for Trading in Company Securities which is binding on all Directors and employees. As well as the overriding prohibition, which relates to all Directors and employees, against dealing in the Company’s securities when a person is in possession of inside information the Policy also details additional restrictions for a group of Restricted Employees. This group consists of all Directors and officers and other key personnel as nominated by the Chairman and Company Secretary and is reviewed on a regular basis to take into account changes in personnel. Prescribed ‘blackout’ periods are included in the Policy during which Restricted Employees will be prohibited from dealing in the Company’s securities. Additionally, Restricted Employees are at all times (irrespective of ‘blackout’ periods) required to complete an application form to gain the written acknowledgement of either the Chairman, Managing Director/CEO or the Company Secretary before they deal in the Company’s securities. The Company’s Policy also prohibits hedging of options granted under share options plans. This relates to both vested and unvested options. Prohibited hedging practices include put/call arrangements over “in money” options to hedge against a future drop in share price. The Board considers such hedging to be against the spirit of a share option plan and inconsistent with shareholder objectives. The Company uses an online compliance training module to assist in monitoring understanding of this Policy. Training is completed on a bi-annual basis with new employees completing the training and assessment as part of the induction process. CODES OF CONDUCT The Board has approved a Code of Conduct for Directors (incorporating underlying Guidelines for the Interpretation of Principles) together with a Code of Business Conduct and Ethics, which applies to all Directors, officers and employees including those employed by subsidiaries, in all countries where Paladin does business. A copy of the Code is available on the Company’s website. These Codes demonstrate and codify Paladin’s commitment to appropriate and ethical corporate practices. Compliance with the Codes will also assist the Company to effectively manage its operating risks and meet its legal and compliance obligations, as well as enhancing Paladin’s corporate reputation. The principles outlined in this document are intended to: establish a minimum global standard of conduct by which all Paladin employees are expected to
abide; protect the business interests of Paladin, its employees and customers; maintain Paladin’s reputation for integrity; and facilitate compliance by Paladin employees with applicable legal and regulatory obligations. The Code of Business Conduct and Ethics addresses honesty and integrity, following the law, conflicts of interest, confidentiality, protection of Company assets, dealing with public officials, responsibility for international operations, employment practices, record keeping and community relations. The Board has appointed the Company Secretary as the Company’s compliance officer in the case of employees, and the Chairman of the Audit Committee in the case of Directors and officers, as the person responsible for receiving reports of breaches of the Code and this is the mechanism by which compliance with the Code is monitored.
For
per
sona
l use
onl
y
74
CORPORATE GOVERNANCE STATEMENT (continued)
294605_9
COMMUNITY RELATIONS POLICY Paladin believes that mining and mineral processing activity can play a central role in sustainable community development by acting as a catalyst for positive economic and social change. When operating in overseas jurisdictions, Paladin acknowledges the importance of understanding that it is operating in a “visitor” capacity in the country of interest and must engage with due respect in all interactions. Paladin aims to achieve a balance between the economic, environmental and social needs in all phases of its projects by: adhering to the laws and regulations of host countries;
respecting and responding to local customs, traditions and cultures, unless these are at
variance with the Company’s policies and standards;
contributing to local economic development of communities;
being open and transparent in all communications and dealings with communities and responding in a timely fashion to any community-based grievances;
investing in projects that are of mutual benefit to the Company and the community;
ensuring that any resettlement that cannot be avoided is undertaken in compliance with local laws and such that resettled parties are constructively engaged and fairly treated with the principles of free prior informed consent and consultation;
embracing sound principles of local procurement and employment that contributes to local economic development;
encouraging, where practical, suppliers and contractors to adopt the same or similar policies, standards and practices; and
undertaking activities in a manner that is conducive to ensuring that the local operating company is, and remains, a responsible member of the community.
HUMAN RIGHTS POLICY Paladin is committed to respect for human rights and fundamental freedoms. The aim of the Human Rights Policy is to provide the overarching framework for the business in respecting human rights.
Paladin commits to uphold the human rights’ principles outlined in the International Bill of Rights, which includes the Universal Declaration of Human Rights, the International Covenant on Economic, Social and Cultural Rights and the International Covenant on Civil and Political Rights. Additionally, Paladin respects the International Labor Organisation’s Core Conventions. Human rights are fundamental principles of personal dignity and universal equality. Respect for human rights fosters social progress, better standards of life and larger freedom for individuals. WHISTLEBLOWER POLICY The Board has also approved a Whistleblower Policy which documents commitment to maintaining an open working environment in which employees and contractors are able to report instances of unethical, unlawful or undesirable conduct without fear of intimidation or reprisal. The purpose of the Whistleblower Policy is to: help detect and address unacceptable conduct;
For
per
sona
l use
onl
y
75
CORPORATE GOVERNANCE STATEMENT (continued)
294605_9
help provide employees and contractors with a supportive working environment in which they feel able to raise issues of legitimate concern to them and to the Company; and
help protect people who report unacceptable conduct in good faith. To assist in the understanding of this Policy by the local Malawian workforce due to language and cultural differences, a storybook has been written and translated into the local language dealing with the issues of fraud and corruption and whistleblowing. This has been distributed to all local employees. In addition, the local acting troupe has been employed in presenting small plays to the workforce on these subjects. Both mediums have been extremely well received and effective in presenting the message. PRIVACY POLICY The Company has a firm commitment to protecting the privacy of any personal information that it collects and holds and recognises its obligations under the existing privacy legislation. It has adopted a Privacy Policy which provides details on the collection and use of personal information, circumstances under which it can be disclosed, management and security of personal information and how it can be accessed. DIVERSITY POLICY The Board has approved a Diversity Policy which documents the Company’s commitment to workplace diversity and recognises the benefits arising from the recruitment, development and retention of a talented, diverse and motivated workforce. Diversity within the Company means all the things that make individuals different to one another, including, but not limited to, gender, ethnicity, religion, culture, language, disability and age. It involves a commitment to equality and treating one another with respect. Responsibility for review of all matters contained within the Diversity Policy rests with the Board as a whole and is reflected accordingly in its Charter. The ASX Corporate Governance Council’s Principles and Recommendations requires the Company to set ‘measurable objectives’ for achieving gender diversity and to report against them on an annual basis. A number of objectives were put in place since the Board approved the Diversity Policy and the Board will continually review these objectives and update them as necessary. In respect to gender diversity specifically, 14% (as for 2012) of the total workforce globally are female. This statistic is somewhat skewed due to the cultural and educational challenges faced with increasing the female component of the workforce in Malawi at KM, which is also the largest division of the Group with a total of 585 employees. Here, females represent 9% (as for 2012) compared to 46% (an increase from 42% in 2012) with Australian based employees. Interestingly, the percentage of female employees has remained relatively static, given the retrenchments undertaken across the Group during the year. Details across the Group are included in the table set out in the “Our People” section on page 60. At a senior management level, females are represented by 15% in Australia, 9% at KM and 27% at LHM. At mine site level at Kayelekera female expatriates hold 5% of the supervisory roles and female nationals hold 14%. At Langer Heinrich, female nationals hold 16% of such roles. Measurable Objectives
Objective Outcome Review Diversity Policy annually. Reviewed and remained unchanged. Undertake an annual gender pay audit to ensure equity in remuneration practices.
This was undertaken as part of the annual salary review process although increases not granted due to economic conditions (with the exception of local national mine site workers).
Report annual data across the Group on diversity in the workforce.
Commenced in 2012 and ongoing.
For
per
sona
l use
onl
y
76
CORPORATE GOVERNANCE STATEMENT (continued)
294605_9
Encourage training and development to assist in furthering career goals.
123 females participated in educational initiatives during the year.
Develop and implement flexible working arrangements to support employees’ personal or family commitments whilst continuing in employment.
The Company provides employees with flexible working arrangements and paid parental leave together with a financial incentive paid on return to work. Females participated in flexible work arrangements group wide.
When the Board next recruits for an independent non-executive director, at least one woman must be included in the list of potential candidates.
Ongoing.
Further information on diversity within the Company can be found in the Our People section of this annual report. ANTI-BRIBERY AND CORRUPTION COMPLIANCE Paladin does not operate in any country rated an extreme risk for corruption in the latest Transparency International Global Corruption Index – Australia and Canada are in the top quartile and rank 7th and 9th respectively (out of 174 countries surveyed); Namibia is in the second quartile and ranks 58th; Malawi and Niger are in the third quartile, ranked 88th and 113th respectively. Paladin opposes corruption and honours the OECD Convention on Combating Bribery of Foreign Public Officials in International Business Transactions (OECD Convention). Paladin is committed to conducting its business in accordance with applicable laws, rules and regulations, and the highest standards of business ethics, and to full and accurate disclosure in compliance with applicable laws, rules and regulations. The Company operates under a Code of Business Conduct and Ethics and a Code of Conduct for its Directors. An Anti-Bribery and Corruption (ABC) Compliance Guide provides practical advice on ethical business conduct for Paladin Directors, employees and third parties. A Whistleblower Policy and procedure are also in place to facilitate disclosure of any alleged corrupt practices. The Company has established a Compliance Committee. The Committee has been trained by external legal counsel, expert in the field. The Committee operates under a Charter, its role being to oversee Paladin’s anti-bribery and corruption compliance (as documented in Paladin’s Anti-Bribery and Corruption Compliance Guide) and address employee or representative’s concerns. The roll-out of unified anti-bribery and corruption training across the Group began during the year with around 80% of head office staff now trained. At LHM, all management have been trained together with a further 26 of middle management and a cross section of other employees. All employees also received a personal copy of the localised guide to the ABC regime. KM has trained 39 expatriate managers and 61 Malawian managers in addition to the local programme detailed below. Local mine site workers at KM operating below the supervisor level have received training through a number of mediums – story books (each worker received a personal copy) and posters on the subject written in their local language, together with performances by the local drama group. The story book was produced in four local languages in addition to English and was distributed not only to all local staff but to various government departments and the community both in the surrounding area and in Lilongwe, the capital. Paladin also engages with significant suppliers and contractors in regard to its stance on Anti-Bribery and Corruption and ensures the matter is specifically addressed with contracting parties. During the year, 5 employees were terminated due to fraud and corruption issues. Both LHM and KM operations have been independently assessed for risks related to corruption by a specialist fraud and corruption analyst from Australia and relevant corruption risks have been identified and included in the Corporate Risk Assessment Register. Any changes to the above Codes and Policies are considered by the Board for approval.
The Directors present their report on the Group consisting of Paladin Energy Ltd (Company) and the entities (Group) it controlled at the end of, or during, the year ended 30 June 2013. DIRECTORS The following persons were Directors of Paladin Energy Ltd and were in office for this entire period: Mr Rick Wayne Crabb B. Juris (Hons), LLB, MBA, FAICD (Non-executive Chairman) Age 56
Mr Crabb holds degrees of Bachelor of Jurisprudence (Honours), Bachelor of Laws and Master of Business Administration from the University of Western Australia. He practised as a solicitor from 1980 to 2004 specialising in mining, corporate and commercial law and advised in relation to numerous project developments in Australia and Africa. Mr Crabb now focuses on his public company directorships and investments. He has been involved as a director and strategic shareholder in a number of successful public companies. He is also the non-executive chairman of Ashburton Minerals Ltd (since 1999), Golden Rim Resources Ltd (since 2001) and Otto Energy Ltd (since 2004). Mr Crabb is a councillor on the Western Australian Division of the Australian Institute of Company Directors.
Mr Crabb was appointed to the Paladin Board on 8 February 1994 and as Chairman on 27 March 2003.
Special Responsibilities Chairman of the Board Member of Remuneration Committee from 1 June 2005 Member of Nomination Committee from 1 June 2005 Member of Sustainability Committee from 25 November 2010 Mr John Borshoff B.Sc., F.AusIMM, FAICD (Managing Director/Chief Executive Officer) Age 68
Mr Borshoff is a geologist who has been involved in the Australian and African exploration and mining industry for over 30 years. Mr Borshoff worked for International Nickel and Canadian Superior Mining before joining a German mining group, Uranerz from 1976 to 1991. He became Chief Geologist/Exploration Manager during the period 1981-1986 and served as its chief executive from 1987 to mid-1991 when the German parent of Uranerz made the decision to close its Australian operations. The primary focus of the Uranerz Group was the search and development of uranium with the company operating extensively throughout Australia, North America and Africa.
Mr Borshoff has extensive knowledge of the uranium industry and experience in company management and strategic planning. He serves on a number of industry organisations including the Board of the Minerals Council of Australia and the Board of the Australian Uranium Association of which he is the chairman of its Code of Practice working committee and a member of its Executive Committee.
Mr Borshoff founded Paladin and was appointed to the Paladin Board on 24 September 1993. Special Responsibilities Managing Director/Chief Executive Officer Member of Nomination Committee from 1 June 2005 Member of Sustainability Committee from 25 November 2010 Mr Sean Reveille Llewelyn LL.B (Non-executive Director) Age 65
Mr Llewelyn originally qualified, and practised, as a solicitor in Australia and then re-qualified in England. He has subsequently worked in the finance and merchant banking industries for more than 20 years in Australia, the UK, the United States and South Africa. His considerable finance experience has been in derivatives (a founder, President and CEO of Capital Market Technology Inc.), structured finance and early stage investment relating to the metal markets. He has been involved with the uranium industry for many years and has a comprehensive understanding of the uranium market.
Mr Llewelyn was the instigator and driving a force in the formation of Nufcor International Ltd, a major uranium marketing company, initially jointly owned between Anglo Gold and First Rand International.
Mr Llewelyn was appointed to the Paladin Board on 12 April 2005.
Special Responsibilities Member of Audit Committee from 12 April 2005 Chairman of Remuneration Committee from 26 November 2008 (member from 1 June 2005) Chairman of Nomination Committee from 26 November 2008 (member from 1 June 2005) Mr Donald Shumka B.A., MBA (Non-executive Director) Age 71
Mr Shumka is a Vancouver based Corporate Director with more than 40 years’ experience in financial roles. From 2004 to 2011, he was President and Managing Director of Walden Management, a consulting firm specialising in natural resources. From 1989 to 2004, he was Managing Director, Investment Banking with CIBC World Markets and Raymond James Ltd. Prior to 1989, Mr Shumka was Vice President, Finance and Chief Financial Officer of West Fraser Timber Co. Ltd., one of Canada’s largest forest products companies. He holds a Bachelor of Arts Degree in Economics from the University of British Columbia and a Master of Business Administration Degree from Harvard University. Mr Shumka is also a director of Eldorado Gold Corp. (since May 2005), Alterra Energy Corp. (since March 2008), Lumina Copper Corp. (since January 2009) and Anfield Nickel Corp. (since December 2010).
Mr Shumka was appointed to the Paladin Board on 9 July 2007. Special Responsibilities Chairman of Audit Committee from 9 July 2007 Member of Remuneration Committee from 10 August 2007 Member of Nomination Committee from 10 August 2007
Mr Peter Mark Donkin BEc, LLB., F Fin, MAICD (Non-executive Director) Age 56
Mr Donkin has over 30 years’ experience in finance, including 20 years arranging finance in the mining sector. He was previously the Managing Director of the Mining Finance Division of Société Générale in Australia, having worked for that bank for 21 years in both their Sydney and London offices. Prior to that he was with the corporate and international banking division of the Royal Bank of Canada. His experience has involved arranging transactions for mining companies, both in Australia and internationally in a wide variety of financial products, including project finance, corporate finance, acquisition finance, export finance and early stage investment capital. Mr Donkin holds a Bachelor of Economics degree and a Bachelor of Law degree from the University of Sydney. He is a director of Allegiance Coal Ltd (since 2010) and was previously a director of Sphere Minerals Ltd (from March 2010 to November 2010) and Carbine Tungsten Ltd (from February to April 2013).
Mr Donkin was appointed to the Paladin Board on 1 July 2010.
Special Responsibilities Member of Audit Committee from 25 November 2010
Mr Philip Baily BSc, MSc (Non-executive Director) Age 69
Mr Baily is a metallurgist with more than 40 years’ experience in the mining industry, including some 11 years in the uranium sector. Throughout his career, he has been involved in the design, construction, commissioning and operation of mineral processing plants including two uranium plants. Project locations have varied from the deserts of Australia to the tropics of Papua New Guinea and the high altitudes of Argentina. He has extensive experience, at senior management level, in the evaluation of projects from grass roots development to the acquisition of advanced projects and operating companies. These projects have been located throughout the world, many in developing countries and environmentally sensitive areas. Mr Baily holds a Bachelor of Science and a Master of Science degree in Metallurgy from the University of NSW.
Mr Baily was appointed to the Paladin Board on 1 October 2010.
Special Responsibilities Chairman of Sustainability Committee from 25 November 2010
COMPANY SECRETARY AND EXECUTIVE GENERAL MANAGER - CORPORATE SERVICES Ms Gillian Swaby Age 53 B.Bus, FCIS, FAICD Ms Swaby has been involved in financial and corporate administration for listed companies, as both Director and Company Secretary covering a broad range of industry sectors, for over 30 years. Ms Swaby has extensive experience in the area of secretarial practice, corporate governance, management accounting and corporate and financial management. In addition to her role as Group Company Secretary, the divisions of human resources, legal and corporate social responsibility also fall under her management in the role of EGM- Corporate Services. Ms Swaby is past Chair of the Western Australian Council of Chartered Secretaries of Australia, a former Director on their National Board and a lecturer for the Securities Institute of Australia. Ms Swaby is the principal of a corporate consulting company and was a member of the Paladin Board for a period of 10 years. She is a director of Australia-Africa Mining Industry Group (AAMIG). BOARD AND COMMITTEE MEETINGS The number of Directors’ meetings and meetings of committees held in the period each Director held office during the financial year, and the number of meetings attended by each Director were: Board of
Directors
Audit Committee
Remuneration Committee
Sustainability Committee
Name
Number attended
Number eligible
to attend
Number attended
Number eligible
to attend
Number attended
Number eligible
to attend
Number attended
Number eligible
to attend Mr Rick Crabb 12 12 - - 2 2 3 3 Mr John Borshoff 12 12 - - - - 3 3 Mr Sean Llewelyn 12 12 4 4 2 2 - - Mr Donald Shumka 11 12 4 4 2 2 - - Mr Peter Donkin 12 12 4 4 - - - - Mr Philip Baily 12 12 - - - - 3 3 Of the above Board meetings, 4 were face to face with the remainder held via electronic means. The Board meeting schedule also includes a scheduled conference call mid quarter between the face to face meetings. 12 Board meetings were held. By way of reference, an independent survey by CRA Plan Manager Pty Ltd states the average number of board meetings is 12 for small companies and around 20 for larger companies. INTERESTS IN THE SECURITIES OF THE COMPANY As at the date of this report, the interests of the Directors in the securities of Paladin Energy Ltd were: Director Paladin Shares Share rights (issued under
the Paladin Employee Plan)Mr John Borshoff 16,027,394 150,000*
500,000** Mr Rick Crabb 5,181,528 Nil Mr Sean Llewelyn 100,000 Nil Mr Donald Shumka 200,000 Nil Mr Peter Donkin 15,000 NilMr Philip Baily 12,000 Nil * due to vest on 26 March 2014 subject to performance conditions ** due to vest on 5 November 2013 subject to performance conditions RESIGNATION, ELECTION AND CONTINUATION IN OFFICE OF DIRECTORS In accordance with the Constitution of the Company, Mr Rick Crabb and Mr Philip Baily will seek re-election at the 2013 Annual General Meeting, following their retirement by rotation.
PRINCIPAL ACTIVITY The principal activity of the Group was the development and operation of uranium mines in Africa, together with global exploration and evaluation activities in Africa, Australia and Canada. REVIEW AND RESULTS OF OPERATIONS A detailed operational and financial review of the Group is set out on pages 14 to 44 of this report under the section entitled Management Discussion and Analysis. The Group’s loss after tax for the year is US$ 420.9M (2012: US$172.8M) representing an increase of 144% from the previous year. DIVIDENDS No dividend has been paid during the financial year and no dividend is recommended for the current year. SIGNIFICANT CHANGES IN THE STATE OF AFFAIRS There were no significant changes in the state of affairs of the Group during the financial year not otherwise dealt with in this report. SIGNIFICANT EVENTS AFTER THE BALANCE SHEET DATE Other than disclosed below, since the end of the year, the Directors are not aware of any other matter or circumstance not otherwise dealt with in this report, that has significantly or may significantly affect the operations of the Group, the results of those operations or the state of affairs of the Group in subsequent years with the exception of the following, the financial effects of which have not been provided for in the 30 June 2013 Financial Report: Strategic Initiative Update On 1 August 2013, the Company advised that it had terminated negotiations with the lead party, and all other parties, for the sale of a minority interest in the Langer Heinrich Mine. In the view of the Board, the current depressed uranium price has meant that it is unlikely that a price that appropriately reflects the strategic value of the asset will be achieved and accordingly proceeding at this time would be detrimental to long-term shareholder value. Although there remains interest in the asset, Paladin believes that the current weakness in the spot uranium price (US$35.50/lb) should not overly influence the valuation of a flagship asset such as Langer Heinrich. Specifically, Langer Heinrich: has a +20 years minelife; is a modern technologically advanced operation; is operating in a country that is politically stable; and is currently operating consistently at 5.2Mlb pa with further expansion capacity. Paladin strongly believes it can generate greater value to its shareholders through postponing the sales process for Langer Heinrich until there is a more a favourable uranium price environment. More generally, Paladin believes that the current low uranium price compromises the capacity for supply to reach clearly stated global demand growth targets. It is generally recognised in the industry that the process for recovery of supply growth can only reasonably start when a sustainable US$70/lb threshold for uranium is reached and Paladin supports this long-term price expectation. In this context, the Langer Heinrich Mine remains a highly valuable and strategically important operation for Paladin.
Successful Institutional Placement of Shares to raise A$88M / C$81M On 2 August 2013, the Company announced that it had completed the book-build for a private placement to institutional and accredited investors of 125.6M ordinary shares (representing 15% of Paladin’s existing issued capital) raising gross proceeds of approximately A$88M / C$81M. The placement was priced at A$0.70 (C$0.65) per share which represented a 30% discount to Paladin’s last closing price on ASX. The new shares rank equally with existing shares. Settlement of the new shares issued under the placement occurred on the ASX and the TSX on Monday 12 August 2013 (in each region). Allotment of the new shares issued under the placement occurred on Tuesday 13 August 2013 (in each region). UBS AG, Australia Branch acted as Global Lead Placing Agent to the placement. Adjustment of the Conversion Price of Convertible Bonds On 15 August 2013, the Company announced an adjustment of the Conversion Price in connection to the US$300M convertible bonds due 4 November 2015 and the US$274M convertible bonds due 30 April 2017 (together, the “Bonds”). Pursuant to the terms of the Bonds the prevailing Conversion Price is subject to adjustment where any new issue of shares is at less than 95% of the Current Market Price. Following the completion of the Placement on 12 August 2013, the Conversion Prices have been adjusted as follows: Convertible bonds due 2015: US$5.403 (previously US$5.608) Convertible bonds due 2017: US$2.109 (previously US$2.19) LIKELY DEVELOPMENTS Likely developments in the operations of the Group constituted by the Company and the entities it controls from time to time are set out under the section entitled Management, Discussion and Analysis. ENVIRONMENTAL REGULATIONS The Group is subject to significant environmental regulation in respect to its exploration, evaluation, development and operational activities for uranium projects under the laws of the countries in which its activities are conducted. The Group currently has mining and processing operations in Namibia and Malawi, and exploration projects in Africa, Australia, Niger and Labrador. The Group’s Policy is to comply with all applicable environmental laws and regulations in the countries in which it conducts business. Specific environmental regulations, approvals and licences for the exploration, development and operation are applied to the activities conducted at each site. In addition many other international and industry standards are also applied to the Group’s activities, including those specified for the global uranium industry. These environmental laws, regulations and standards relate to environmental factors such as radiation, water, flora, fauna, air quality, noise, waste management and pollution control. The Directors are not aware of any environmental matters which would have a significant adverse effect on the Group. REMUNERATION FOR THE YEAR AT A GLANCE Details of the remuneration received by the Key Management Personnel prepared in accordance with statutory requirements and accounting standards are detailed further in the Remuneration Report.
The disclosure below aims to provide an overall picture of the group-wide remuneration platform and not simply focus on Key Management Personnel. The strategies outlined for Executive remuneration apply across the Group. This extends to the consideration of relevant short-term and long-term incentives. Given the difficulties being currently experienced in attracting and retaining quality staff in the global resource sector and, more particularly, in the much narrower uranium sector, the focus is on policies to assist in attraction, motivation and retention of staff across the Group. This does, however, have to be balanced by the prevailing financial and economic conditions being experienced by the Company at the time and the priorities on allocation of cash resources. The remuneration strategy for the past year reflects the focus on maintaining Group cash reserves given the continuing downturn in uranium prices. .
REMUNERATION FOR THE YEAR AT A GLANCE (continued) The Managing Director/CEO voluntarily reduced his salary by 25% from 1 December 2011 to 30
November 2012 (which he later extended to the end of his current contract, 26 November 2013) setting the tone for the cost rationalisation programme undertaken across the Group.
There were no salary increases across the Group given the continuing poor uranium prices, with the exception of local employees at the Kayelekera Mine and Langer Heinrich Mine. Given the economic state of Malawi and the significant devaluation of the kwacha, increases of 18% and 11% was given in October 2012 and June 2013 respectively, reflecting CPI adjustments. Local workers in Namibia were given a 10% increase with effect from 1 January 2013, reflecting local CPI adjustments.
No cash bonuses were paid this year as a result of continuing poor uranium prices against US$404,000 for the prior year.
No share rights were granted during the year apart from 50,000 granted, but not yet issued, to the new CFO appointed in July 2012 as a sign on bonus.
A total of 1,717,000 share rights vested during the year (0.21% of issued capital).
There was no increase in Non-executive Directors’ remuneration during the year.
Long-term incentives on issue at balance date comprise:
o 3,358,957 share rights representing 0.40% of the issued capital.
o All of the outstanding options on issue were cancelled during the year due to the performance conditions not being met. No further options will be issued under those plans.
Executive Remuneration – cash value of earnings realised In keeping with the Company’s practice since 2011, the tables below set out the cash value of earnings realised, by the Managing Director/CEO and other executives considered to represent Key Management Personnel for 2013 and 2012 and the intrinsic value of share-based payments that vested to the executives during the period. This is in addition and different to the disclosures required by the Corporations Act and Accounting Standards, particularly in relation to share rights. As a general principle, the Accounting Standards require a value to be placed on share rights based on probabilistic calculations at the time of grant which are reflected in the remuneration report even if ultimately the share rights do not vest because performance hurdles are not met. By contrast this table discloses the intrinsic value of share rights, which represents only those share rights which actual vest and result in shares issued to a KMP. The intrinsic value is the Company’s closing share price on the date of vesting. The Company believes that this additional information is useful to investors as recognised by the 2009 Productivity Commission Inquiry Report ‘Executive Remuneration in Australia’. The Commission recommended that remuneration reports should include actual levels of remuneration received by the individuals named in the report in order to increase its usefulness to investors.
The cash value of earnings realised include cash salary and fees, superannuation, cash bonuses and other benefits received in cash during the year and the intrinsic value of long-term incentives vesting during the 2013 year. The tables do not include the accounting value for share rights granted in the current and prior years, as this value may or may not be realised as they are dependent on the achievement of certain performance hurdles. The accounting value of other long-term benefits which were not received in cash during the year have also been excluded. All cash remuneration is paid in Australian dollars to those parties listed below (with the exception of Mr D Garrow who is paid in US$) therefore the tables are presented in both A$ and US$ being the functional and presentation currency. The detailed schedules of remuneration presented later in this report are presented in US$.
Refer to the Compensation of Key Management Personnel table later in the Remuneration Report for audited information required in accordance with the Corporations Act 2001 and its regulations. Exchange rate used is average for year US$1 = A$0.97471. (1) Value of share rights granted on 26 March 2010 and vesting on 26 March 2013 at a market price of A$0.985. (2) Value of share rights granted on 26 March 2010 and vesting on 1 September 2012 at a market price of A$1.295. (3) Value of share rights granted on 5 November 2010 and vesting on 1 September 2012 at a market price of A$1.295. (4) Value of share rights granted on 15 February 2011 and vesting on 15 February 2013 at a market price of A$1.21. (5) Value of share rights granted on 2 April 2012 and vesting on 1 September 2012 at a market price
of A$1.295. (6) Fees for services paid to a company of which Ms Gillian Swaby is a director and shareholder. Ms
Swaby was appointed acting Chief Financial Officer during the interim period after Mr Garry Korte resigned with effect from 24 May 2012 and Mr Alan Rule assumed the position on 23 July 2012.
(7) Living away from home allowance. (8) Mr Alan Rule commenced on 23 July 2012. 2012 (A$’000) / (US$’000)
Exchange rate used is average for year US$1 = A$0.96971. (1) Value of share rights granted on 26 March 2010 and vesting on 1 September 2011 at a market price of A$2.03. (2) Value of share rights granted on 5 November 2010 and vesting on 1 September 2011 at a market price of A$2.03. (3) Value of share rights granted on 15 February 2011 and vesting on 15 February 2012 at a market price of A$1.665. (4) Other represents accrued annual leave (140 days) and accrued long service leave (80 days) paid out. (5) Fees for services paid to a company of which Ms Gillian Swaby is a director and shareholder. Ms
Swaby was appointed acting Chief Financial Officer during the interim period after Mr Garry Korte resigned with effect from 24 May 2012 and Mr Alan Rule assumed the position on 23 July 2012.
(6) Mr Garry Korte resigned with effect from 24 May 2012. (7) Living away from home allowance.
This Remuneration Report outlines the Director and executive remuneration arrangements of the Company and the Group in accordance with the requirements of the Corporations Act 2001 (Cth) and its Regulations. For the purposes of this report, Key Management Personnel of the Group are defined as those persons having authority and responsibility for planning, directing and controlling the major activities of the Group, directly or indirectly, including any Director whether executive or otherwise of the parent company. Key Management Personnel comprise:
Mr Rick Crabb, Non-executive Chairman Mr John Borshoff, Managing Director/CEO Mr Sean Llewellyn, Non-executive Director Mr Donald Shumka, Non-executive Director Mr Philip Baily, Non-executive Director Mr Peter Donkin, Non-executive Director Ms Gillian Swaby, Company Secretary and Executive General Manager – Corporate Services Mr Alan Rule, Chief Financial Officer (Commenced 23 July 2012) Mr Dustin Garrow, Executive General Manager - Marketing Mr Mark Chalmers, Executive General Manager – Production
For the purposes of this report, the term ‘Executive’ encompasses the Managing Director/CEO, senior executives, managers and company secretary of the Parent and the Group.
REMUNERATION APPROVAL PROCESS
The Remuneration Committee is charged with assisting the Board by reviewing and making appropriate recommendations on remuneration packages for the Managing Director/CEO, Non-executive Directors and senior executives. In addition, it makes recommendations on long-term incentive plans and associated performance hurdles together with the quantum of grants made, taking into account both the individual’s and the Company’s performance.
The Remuneration Committee, chaired by Mr Sean Llewelyn, held two meetings during the year. Messrs Crabb and Shumka are also Committee members. The Managing Director/CEO is invited to attend those meetings which consider the remuneration strategy of the Group and recommendations in relation to senior executives.
Having regard to the recommendations made by the Managing Director/CEO, the Committee approves the quantum of the short-term incentive bonus pool and the total number of the long-term incentive grants to be made and recommends the same for approval by the Board. Individual awards are then determined by the Managing Director/CEO in conjunction with senior management, as appropriate. The remuneration for the Managing Director/CEO is determined by the Remuneration Committee.
Any salary reviews and bonus payments are effective from 1 January in the year.
KEY ELEMENTS OF KEY MANAGEMENT PERSONNEL/EXECUTIVE REMUNERATION STRATEGY
The overall focus of Paladin’s remuneration strategy is to:
attract and retain talented, qualified and effective Executives;
motivate short and long-term performance and reward past performance;
provide competitive and fair reward;
be flexible and responsive in line with market expectations;
align Executive interests with those of the Company’s shareholders; and
comply with applicable legal requirements and appropriate standards of governance.
This strategy applies group wide for all employees. Information in relation to the compensation on Non-executive Directors is detailed later in this Remuneration Report.
REMUNERATION REPORT (Audited) (continued) KEY ELEMENTS OF KEY MANAGEMENT PERSONNEL/EXECUTIVE REMUNERATION STRATEGY (continued)
The overall level of compensation takes into account the Company’s earnings and growth in shareholder wealth of the Company together with the achievement of strategic goals. Consideration of the Company’s earnings will be more relevant as the Company matures from its development and consolidation phase to profitability. The Board is cognisant of general shareholder concern that long-term equity-based remuneration be linked to Company performance and growth in shareholder value. The share rights plan addresses this with performance conditions including reference to Earnings per Share (EPS), Total Shareholder Return (TSR) and Market Price conditions. These conditions apply to share rights currently on issue and these performance conditions will be reviewed to determine the appropriateness to the business prior to any further issues.
The table below compares the earnings per share to the closing share price for the Company's five most recently completed financial years. 30 June 2009 30 June 2010 30 June 2011 30 June 2012 30 June 2013EPS US$(0.78) US$(0.08) US$(0.11) US$(0.21) US$(0.49) Share Price A$4.93 A$3.59 A$2.52 A$1.25 A$0.88 The remuneration structure for the Key Management Personnel/Executives has three elements:
fixed remuneration; short-term variable remuneration; and long-term incentives.
Fixed Remuneration Annual base salary determined as at 1 January each year
The ‘not at risk’ cash component which may include certain salary sacrifice packaging.
Statutory superannuation contributions
Statutory % of base salary.
Expatriate benefits Executives who fulfill their roles as an expatriate may receive benefits including relocation costs, health insurance, housing and car allowances, educational fees and tax advisory services.
Foreign assignment allowance An additional % of base salary is payable in relation to foreign assignments being 15% for Malawi and 10% for Namibia.
Rewards Executives for performance over a short period, being the year ending 31 December. Bonuses are awarded at the same time as the salary reviews. Assessment is based on the individual’s performance and contribution to team and Company performance.
Long-term incentive, granted under the Rights Plan
Award determined in the September quarter of each year, based on individual performance and contribution to team and Company performance. Vesting dependent on creation of shareholder value over a three year period, together with a retention element.
Fixed Remuneration
This is reviewed annually with consideration given to both the Company and the individual’s performance and effectiveness. As competition in the global resource sector continues to grow, and given an even narrower sector of uranium expertise, a key to attracting and retaining talent is to maintain relevant and globally competitive remuneration packages. Market data focused on the mining industry is analysed with a focus on maintaining parity or above with companies of similar complexity and size operating in the resources sector and becoming an employer of choice. The Company did not engage remuneration consultants, however it subscribes to a number of remuneration surveys and reports including Boardroom Remuneration Review (Connect 4),), The Resource Report and the Top 500 Report (CRA Plan Managers Pty Ltd) and the AIM National Salary Survey (Australian Institute of Management). The Company also takes into consideration the annual publication, Executive and Board Remuneration Report produced by Ernst & Young.
There were no salary increases across the Group given the continuing poor uranium prices, with the exception of local employees at the Kayelekera Mine and Langer Heinrich Mine. Given the economic state of Malawi and the significant devaluation of the kwacha, increases of 18% and 11% was given in October 2012 and June 2013 respectively, reflecting CPI adjustments. Local workers in Namibia were given a 10% increase with effect from 1 January 2013, reflecting local CPI adjustments.
COMPONENTS OF KEY MANAGEMENT PERSONNEL/EXECUTIVE REMUNERATION (continued)
Fixed Remuneration (continued)
Mr John Borshoff is referred to as both Managing Director/CEO to clarify the understanding of his position in both North America and Australia, given Paladin’s stock exchange listings in each jurisdiction.
Managing Director/CEO
There was no increase in the fixed remuneration (inclusive of superannuation) of A$2,044,224 (US$2,097,264). Base salary was voluntarily reduced by 25% to A$1,533,600 (US$1,573,391) from 1 December 2011 to 30 November 2012 (which he later extended to the end of his current contract, 26 November 2013). The remuneration level reflects the extensive knowledge and experience Mr John Borshoff has in the uranium sector gained over the past 40 years, as a recognised global authority. Expertise at this level is in extremely limited supply, particularly given the period of over 20 years of non activity in the uranium sector and the very small number of uranium producers worldwide. His knowledge and expertise of the sector have been key to the growth and acquisition strategy of the Company and integral to its development from a junior explorer to a uranium producer with two operating mines. In addition, his contract provides for payment of a benefit on retirement or early termination by the Company, other than for gross misconduct, equal to one years average base salary for the two years immediately preceding the termination date. This benefit reflects approximately 20 years of service to the Company by John Borshoff, being the founder in 1993. As a comparison to retirement benefits generally seen in the North American markets (in which the Company is listed and a market from which executive staff are sourced), this benefit is not considered excessive by the Board. This benefit was approved by shareholders on 9 November 2005 at a time when retirement benefits generally were set at a much higher threshold. A new contract is currently being negotiated. Variable Remuneration
Short-term Incentives
The Company provides short-term incentives comprising a cash bonus to Executives of up to 30% of base salary. The bonus is entirely discretionary with the goal of focusing attention on short-term strategic and financial objectives. The amount is dependent on the Company’s performance in its stated objectives and the individual’s performance, together with the individual’s position and level of responsibility. In respect of the 2012 calendar year, no bonuses were paid having regard to continuing poor uranium prices and the priority of cost reduction and cash conservation with the uranium industry continuing to experience difficult times. This compared to the 2011 calendar year, where a total of A$404,421 (US$417,054), ((2010 : A$1,009,000 (US$1,040,517)), was paid across the Group, rewarding only those personnel who had demonstrated exceptional performance and contribution given the poor uranium prices and delays in the ramp-up of KM at that time.
This component is an “at risk” component of overall remuneration designed to encourage exceptional performance whilst adhering to the Company values. Specific targets for individuals have not been set due to the philosophy of achieving a common goal for the Company, however, the following measures are taken into account where these are applicable to the Key Management Personnel and individual Executives and have been selected to align their interests to those of shareholders:
(a) health, safety and environmental performance; (b) production performance; (c) project development performance; (d) additional uranium resources delineated; (e) performance of the Company in meeting its various other objectives; (f) financial performance of the Company; and (g) such other matters determined by the Remuneration Committee in its discretion. The above must, however, be viewed in the context of the operating environment and the priorities in terms of the allocation of cash.
COMPONENTS OF KEY MANAGEMENT PERSONNEL/EXECUTIVE REMUNERATION (continued)
Variable Remuneration (continued)
Managing Director/CEO A bonus of up to 100% of base salary can be achieved under the terms of his contract, having consideration to outcomes achieved during the year, to be determined by the Remuneration Committee. For the calendar year 2012 no bonus was awarded in line with the philosophy applying to all staff referred to earlier. No bonus was paid the previous year given the similar economic circumstances at that time. Matters to be considered as key outcomes for the CY2013 when considering payment of a bonus to J Borshoff fall within the following parameters which the Board considers best capture the essential elements for increasing shareholder returns: Factor Indicative
Weighting 1 Production and financial performance meeting or exceeding expectations.
35%
2 Sustainability matters achieving expectations.
10%
3 Successful outcome of strategic initiatives in accordance with strategy. 40% 4 Organisational factors meeting expectations.
5%
5 Other factors at the discretion of the Remuneration Committee
10%
The Remuneration Committee may, in its discretion, vary the weighting to account for unusual/unexpected events or outcomes during the year. Any bonus payable, relating to the 2013 calendar year, would be paid out in CY2014.
Long-term Incentives
The Company believes that encouraging its employees to become shareholders is the best way of aligning their interests with those of its shareholders. In 2009, the Company has implemented an Employee Performance Share Rights Plan (the Rights Plan) together with a Contractor Performance Share Rights Plan (the Contractor Rights Plan). These plans are referred to jointly as the Rights Plans and were reaffirmed by shareholders at the 2012 Annual General Meeting.
As a consequence of adopting the Rights Plans, no further grants have been made under the previous Executive Share Option Plan (EXSOP) with the last option grant made on 24 June 2009. It was determined that this plan had a number of limitations and did not provide an appropriate incentive.
All of the outstanding options under the EXSOP were cancelled during the year due to failing to meet the vesting conditions.
The Rights Plans are long-term incentive plans aimed at advancing the interests of the Company by creating a stronger link between employee performance and reward and increasing shareholder value by enabling participants to have a greater involvement with, and share in the future growth and profitability of the Company. They are an important tool to assist in attracting and retaining talented people.
Share rights are granted under the plan for no consideration. Share rights are rights to receive fully paid ordinary shares in the capital of the Company (Shares) in the future if certain individual and/or corporate performance metrics (Performance Conditions) are met in the measurement period.
The number of share rights able to be issued under the Plans is limited to 5% of the issued capital. The 5% limit includes incentive grants under all plans made in the previous 5 years (with certain exclusions under the Australian corporate legislation). This percentage now stands at 0.076%.
COMPONENTS OF KEY MANAGEMENT PERSONNEL/EXECUTIVE REMUNERATION (continued)
Variable Remuneration (continued)
Long-term Incentives (continued)
The Board is cognisant of general shareholder concern that long-term equity-based rewards should be linked to the achievement by the Company of a performance condition. Share rights granted under the Rights Plan are subject to certain vesting and performance conditions as determined by the Board from time to time. The Company does not offer any loan facilities to assist in the purchase of shares by employees.
Vesting and Performance Conditions
The share rights on issue from prior year grants are subject to a range of vesting and performance conditions:
Proportion of share rights to which performance hurdle applies
Vesting and Performance Conditions
10% Time based – must remain in employ for 1 year from date of grant
15% Time based – must remain in employ for 2 years from date of grant
25% Time based – must remain in employ for 3 years from date of grant
20% Total Shareholder Return (TSR) relative to mining companies in ASX S&P 200 Index
30% Market Price Performance (MPP) measuring the increase in share price over the period
Managing Director/CEO
The share rights issued to the Managing Director/CEO have different vesting hurdles to reflect the “at risk” nature of 100% of this component of his remuneration and provide a direct link between Managing Director/CEO reward and shareholder return, and provide a clear line of sight between Managing Director/CEO performance and Company performance. No share rights were granted to Mr J Borshoff during the years ended 30 June 2012 and 2013. During the year ended 30 June 2013 150,000 share rights vested in accordance with their vesting conditions (the EPS measure, as detailed later in this report). The initial measurement of the TSR performance condition attached to the remaining 150,000 share rights due to vest during the year was calculated. Mr Borshoff elected to have these share rights retested at the end of year four in accordance with the terms of the Rights Plan.
The performance conditions of all share rights granted to Managing Director/CEO are:
Proportion of share rights to which performance hurdle applies
Performance measure
50% Total Shareholder Return (TSR) relative to mining companies in ASX S&P 200 Index*
50% Earnings Per Share (EPS) Measuring the increase in earnings over the period
*The initial measurement date of the share rights subject to the relative TSR condition is at the end of year three, calculated from the date of grant. At the end of year three, Mr John Borshoff can either: accept the vesting outcome achieved; or
COMPONENTS OF KEY MANAGEMENT PERSONNEL/EXECUTIVE REMUNERATION (continued)
Vesting and Performance Conditions (continued)
Managing Director/CEO (continued)
elect to have his share rights retested at the end of year four (in which case the same vesting schedule applies but the retest period covers the entire four year period from the date the share rights were granted).
He is not permitted to “double dip”, so by electing to have his share rights retested at the end of year four he forfeits any entitlement to share rights which otherwise would have vested at the end of year three. All share rights subject to the relative TSR condition will expire at the end of year four.
The Remuneration Committee allows one retest to reflect the volatile nature of the industry. The way in which the retest is applied maintains alignment with shareholder interests.
Why were these vesting conditions selected?
The Board considered the measures reflected an appropriate balance in terms of alignment between comparative shareholder return and individual reward, a market based performance measure and the encouragement of long-term retention. A review is currently underway to consider whether the various performance conditions, other than time based vesting, are the most appropriate for the Group. It is likely that, in future, performance measures related more to internal hurdles that support the Group’s strategic objectives may be adopted.
Details of the various vesting and performance conditions follow:
Time-based Vesting 50% of the share rights will vest based on the participant continuing to be employed with the Group. These are staggered over time and this condition is designed to assist in long-term retention of staff. Such benefits also assist in recruitment of suitably qualified personnel in a market place where both mining, and more particularly uranium experience, are in particularly short supply. Paladin competes in the global recruitment market and must offer competitive benefits to be successful and attract quality candidates. The available talent pool with uranium expertise is both small and internationally focussed and competition is high for quality personnel. Costs for replacement of personnel and the hidden costs of disruption to the business can be substantial. This vesting criteria does not apply to the Managing Director/CEO.
Total Shareholder Return (TSR) Except for the MD/CEO, 20% of the share rights will vest based on the Company’s TSR relative to the TSRs of a peer group of companies. This measure represents the change in the Company’s share price over the measurement period, plus dividends (if any) notionally reinvested in the Company’s shares, expressed as a percentage of the opening value. The peer group will comprise of mining companies in the S&P/ASX 200 Index as at the date of the offer, excluding steel companies and any companies that pay a dividend during any year of the performance period. Mining companies are companies under the Global Industry Classification Standard (GICS) sub-industries: Oil & Gas – Coal & Consumable Fuels (10102050), Metals & Mining – Aluminium (15104010), Metals & Mining – Diversified Metals & Mining (15104020), Metals & Mining – Gold (15104030), Metals & Mining – Precious Metals & Minerals (15104040) and Metals & Mining – Steel (15104050). The limited number of uranium development and production companies globally presents difficulties in determining a suitable peer group. It was therefore decided that, as the primary listing is on the ASX and the majority of share trading takes place in that market, the peer group set out above is the most appropriate. This also reflects the Group’s competitors for capital and talent. Relative TSR is independent of market conditions and is considered a more relevant measure of management performance in terms of value delivered to shareholders over the medium to long-term.
50% of the share rights granted to the Managing Director/CEO will vest based on the Company’s Relative TSR to the TSRs of a peer group of companies as described above. The base and stretch targets for the TSR performance condition are as follows:
COMPONENTS OF KEY MANAGEMENT PERSONNEL/EXECUTIVE REMUNERATION (continued)
Vesting and Performance Conditions (continued)
Relative TSR percentile ranking Percentage of share rights that may vest if the relative TSR performance condition is met
Less than 50th percentile at 50th percentile Greater than the 50th percentile but less than the 75th percentile At 75th percentile or greater
0% of the share rights subject to the TSR condition 50% of the share rights subject to the TSR condition Pro-rated vesting between 51% and 99% of the share rights subject to the TSR condition 100% of the share rights subject to the TSR condition
Market Price Performance (MPP) 30% of the share rights are subject to MPP vesting condition which measures the increase in share price of the Company. Share rights will vest if, at the end of the measurement period, the share price of the Company is 25% above the market price at the date of the offer. As part of the mix of performance conditions this provides a market based performance measure. The base price for each grant is detailed in the table on the following page.
This does not apply to the Managing Director/CEO. Earnings Per Share (EPS) EPS is determined by dividing the operating profit or loss attributable to members of Paladin Group by the weighted average number of ordinary shares outstanding during the financial year. Prior to 1 July 2013, in the event that EPS is negative (representing a loss per share) a reduction of the loss per share is, for this purpose, treated as a growth in EPS. This was due to the development phase the Company was in and the importance of the CEO leading the Company into positive earnings growth. However in respect of any share rights issued after 1 July 2013, only EPS growth measured to a positive number will be applicable. Growth in EPS will be measured by comparing the EPS in the base year (being the full financial year ending prior to the date of grant) and the measurement year. EPS has been chosen as a performance condition because it provides a clear line of sight between Managing Director/CEO performance and Company performance. It is also a generally recognised and understood measure of performance.
50% of the share rights granted to the Managing Director/CEO will vest based on the Company’s EPS.
The base and stretch targets for the share rights subject to the EPS conditions are as follows: Compound growth in EPS over the performance period
Percentage of share rights that may vest if the EPS hurdle is met
Less than 10% pa At 10% pa More than 10% pa but less than 20% pa At 20% pa or greater
0% of the share rights subject to the EPS condition 50% of the share rights subject to the EPS condition Pro rated vesting between 51% and 99% of the share rights subject to the EPS condition 100% of the share rights subject to the EPS condition
Shares Acquired Under the Rights Plan Shares to be allocated to participants on vesting are currently issued from equity. No consideration is paid on the vesting of the share rights and resultant shares carry full dividend and voting rights. Change of Control All share rights will vest on a change of control event. The Remuneration Committee considers that this is appropriate given that shareholders (or a majority thereof) would have collectively elected to accept a change of control event. Moreover the number of share rights relative to total issued shares is very insignificant (0.40%) and thus are not considered a disincentive to a potential bidder.
REMUNERATION REPORT (Audited) (continued) COMPONENTS OF KEY MANAGEMENT PERSONNEL/EXECUTIVE REMUNERATION (continued) Cessation of Employment Under the Rights Plan, employees’ share rights will be cancelled on cessation of employment, unless special circumstances exist such as retirement, total and permanent disability, redundancy or death. Contractors will have their share rights cancelled, other than on death at which point the contractor’s legal representative will be entitled to receive them. Balance of share rights at 30 June 2013 Date rights granted
Vesting date Vesting performance conditions Number
26 March 2010 26 March 2014 TSR 150,000(1) 5 November 2010 5 November 2013 TSR 250,000(1) 5 November 2010 5 November 2013 EPS 250,000(1) 5 November 2010 1 September 2013 Time based 366,947 5 November 2010 1 September 2013 TSR 293,560 5 November 2010 1 September 2013 Market price (base price A$3.62) 440,340 15 February 2011 15 February 2014 Time based 125,650(2) 2 April 2012 1 September 2013 Time based 235,410 2 April 2012 31 December 2013 Time based 20,000 2 April 2012 1 September 2014 Time based 442,350 2 April 2012 1 September 2014 TSR 313,880 2 April 2012 1 September 2014 Market price (base price A$1.94) 470,820 Total 3,358,957(1) Managing Director/CEO grant
(2) Issued pursuant to retention programme, vesting time based only in order to retain quality personnel.
In summary, this balance represents 0.40% of the issued capital whilst the proportion of time based share rights represents 0.14%. Hedging of Incentive Grants Prohibited The Company’s policy prohibits hedging of equity compensation grants. Prohibited hedging practices include put/call arrangements over “in money” options to hedge against a future drop in share price. The Board considers such hedging to be against the spirit of such remuneration and inconsistent with shareholder objectives. Method of Valuation of Long-Term Incentives Refer to Note 26(g) and Note 26(k) of the financial statements to see the key inputs used for valuation of the long-term incentives. Retention Programme As a component of the strategy for retention of key personnel, certain executives and staff participate in a retention bonus programme. Participation extends to a limited number of selected individuals that have been identified as possessing the requisite skills, expertise and experience in the uranium sector and those with specialist corporate and commercial skills that the Company requires to achieve its aggressive goals over coming years. This initiative is driven by a desire to retain the intellectual properly pool considered necessary to ensure the continued success of the Company. The programme entitles the participants to receive a cash award at the end of the three year retention period. In the event employment is terminated for any of retirement, disablement, redundancy or death, after the first anniversary one third will be payable and after the second anniversary two thirds will be payable. The cash award varies between 50% and 100% of the average annual salary over the 3 year period. The first grant under this programme was on 1 July 2010 (payment date 1 July 2013) with a second on 1 January 2012 (payment date 1 January 2015). No proportion of these bonuses vested or were paid in the financial year ended 30 June 2013 (30 June 2012: US$Nil).
REMUNERATION REPORT (Audited) (continued) COMPONENTS OF KEY MANAGEMENT PERSONNEL/EXECUTIVE REMUNERATION (continued) Retention Programme (continued) In addition, from time to time, the Board will make specific grants of share rights subject only to time vesting as part of the Company’s retention strategy for key individuals. This has proved to be an important tool when seeking to fill senior management roles. KEY ELEMENTS OF NON-EXECUTIVE DIRECTOR REMUNERATION STRATEGY The focus of the remuneration strategy is to: Attract and retain talented and dedicated directors.
Remunerate appropriately to reflect the:
o size of the Company;
o the nature of its operations;
o the time commitment required; and
o the responsibility the Directors carry.
COMPONENTS OF NON-EXECUTIVE DIRECTOR REMUNERATION
In accordance with corporate governance principles, Non-executive Directors are remunerated solely by way of fees and statutory superannuation. The aggregate annual remuneration permitted to be paid to Non-executive Directors is A$1.2M (US$1.2M) as approved by shareholders at the 2008 AGM. Fees paid for the year to 30 June 2013 total A$1,024,400 (US$1,050,979). A number of independent surveys looking at companies from a market capitalisation, (A$1bn - $3bn) perspective show Non-executive Director’s fees from A$156,000 (62.5th percentile) to A$194,000 (90th percentile). In relation to Non-executive Chairman, the analysis ranges from A$322,000 (50th percentile) to A$391,000 (90th percentile). The median Audit Committee Chair fee is A$38,000.
Remuneration Component Elements Details(per annum)
Base Fee Must be contained within aggregate limit
Chairman A$338,000 (US$346,770)
Non-executive Director A$166,400 (US$170,307)
Committee Fees* Paid to the Chairman of the Audit Committee
A$21,000 (US$21,545)
Superannuation Statutory contributions are included in the fees set out above
Statutory % of fees
* This is the only fee paid to any committee member. All other duties are remunerated as part of the base fee.
REMUNERATION REPORT (Audited) (continued) COMPONENTS OF NON-EXECUTIVE DIRECTOR REMUNERATION (continued)
The following graph is provided to give a clearer understanding of the Non-executive Directors’ remuneration.
Other Fees/Benefits
In addition, the Company’s Constitution provides for additional compensation to be paid if any of the Directors are called upon to perform extra services or make any special exertions on behalf of the Company or the business of the Company. The Company may compensate such Director in accordance with such services or exertions, and such compensation may be either in addition to or in substitution for the Directors’ fees referred to above. No additional fees were paid during the year, other than the Directors’ fees disclosed.
Non-executive Directors are also entitled to be reimbursed for reasonable expenses incurred whilst engaged on Company business. There is no entitlement to compensation on termination of non-executive directorships. Non-executive Directors do not earn retirement benefits (other than the statutory superannuation) and are not entitled to any form of performance linked remuneration. Rotation of Directors Mr Rick Crabb and Mr Philip Baily will retire by rotation and seek re-election at the 2013 Annual General Meeting.
pa
For
per
sona
l use
onl
y
95
DIRECTORS' REPORT (continued)
294605_9
REMUNERATION REPORT (audited) (continued) Compensation of Key Management Personnel for the year ended 30 June 2013 of the Group
The compensation table has been presented in US$, the Company’s functional and presentation currency. The A$ value has also been shown as this is considered to be the most relevant comparator between years, given that in 2012 more than 85% of
KMP’s contracts for services were denominated in A$ and this eliminates the effects of fluctuations in the US$ and A$ exchange rate. Exchange rate used is average for year US$ 1 = A$0.97471
(1) This is the amount required to be accrued in 2013 for the payment at a future date (as yet undetermined) of a retirement benefit to Mr Borshoff under the terms of his Services Contract..
(2) Other represents fees paid for services to a company of which Ms Gillian Swaby is a director and shareholder.
(3) Mr Alan Rule commenced 23 July 2012.
(4) Living away from home allowance.
* A reconciliation of this figure in A$ follows to enable a clearer understanding of how this number is calculated.
For
per
sona
l use
onl
y
96
DIRECTORS' REPORT (continued)
294605_9
REMUNERATION REPORT (audited) (continued) Reconciliation of Share-Based Payment Compensation of Key Management Personnel for the year ended 30 June 2013 of the Group.
Share Rights granted 26 March 2010 (vesting 2010 to 2013)
Share Rightsgranted 5 November
2010 (vesting 2011 to 2013)
Share Rightsgranted 15 February 2011
(vesting 2012 to 2014)
Share Rightsgranted 2 April 2012
(vesting 2012 to 2014)
TotalShare-Based
Payment
A$’000 US$’000 A$’000 US$’000 A$’000 US$’000 A$’000 US$’000 A$’000 US$’000 Directors Mr John Borshoff 242 249 570 585 - - - - 812 834 Subtotal 242 249 570 585 - - - - 812 834 Executives Ms Gillian Swaby 27 28 59 61 379(1) 389(1) 37 38 502 516Mr Alan Rule - - - - - - - - - - Mr Dustin Garrow 30 31 79 81 - - 41 42 150 154 Mr Mark Chalmers - - - - - - 88(2) 91(2) 88 91 Subtotal 57 59 138 142 379 389 166 171 740 761 TOTAL 299 308 708 727 379 389 166 171 1,552 1,595 It should be noted that time or performance vesting conditions are attached to all of the share rights referred to above. These are detailed elsewhere in this report.
Exchange rate used as the average for year US$1 = A$0.97471
(1) Issued pursuant to retention programme, vesting time based only in order to retain quality personnel.
(2) Includes A$37,000 relating to 50,000 time-based shares negotiated as a sign-on bonus to assist in attracting quality personnel.
For
per
sona
l use
onl
y
97
DIRECTORS' REPORT (continued)
294605_9
REMUNERATION REPORT (audited) (continued) Compensation of Key Management Personnel for the year ended 30 June 2012 of the Group
The compensation table has been presented in US$, the Company’s functional and presentation currency. The A$ value has also been shown as this is considered to be the most relevant comparator between years, given that in 2011 more than 90% of
KMP’s contracts for services were denominated in A$ and this eliminates the effects of fluctuations in the US$ and A$ exchange rate. Exchange rate used is average for year US$ 1 = A$0.96971
(1) Other represents accrued annual leave (140 days) and accrued long service leave (80 days) paid out.
(2) This is the present value of the amount required to be accrued in 2012 for the payment at a future date (as yet undetermined) of a retirement benefit to Mr Borshoff under the terms of his Services Contract.
(3) Other represents fees paid for services to a company of which Ms Gillian Swaby is a director and shareholder
(4) Mr Garry Korte – resigned 24 May 2012.
(5) Includes a credit of US$150,000 relating to share rights forfeited upon resignation.
(6) Living away from home allowance.
* A reconciliation of this figure in A$ follows to enable a clearer understanding of how this number is calculated.
For
per
sona
l use
onl
y
98
DIRECTORS' REPORT (continued)
294605_9
REMUNERATION REPORT (audited) (continued) Reconciliation of Share-Based Payment Compensation of Key Management Personnel for the year ended 30 June 2012 of the Group.
Share Rights granted 26 March 2010 (vesting 2010 to 2013)
Share Rights granted 5 November 2010
(vesting 2011 to 2013)
Share Rights granted 15 February 2011
(vesting 2012 to 2014)
Share Rights granted 2 April 2012
(vesting 2012 to 2014)
Total Share-Based
Payment A$’000 US$’000 A$’000 US$’000 A$’000 US$’000 A$’000 US$’000 A$’000 US$’000 Directors Mr John Borshoff 297 306 570 588 - - - - 867 894 Subtotal 297 306 570 588 - - - - 867 894 Executives Ms Gillian Swaby 173 178 83 86 856(1) 883(1) 14 15 1,126 1,162 Mr Garry Korte (97) (100) (38) (39) - - - - (135)(2) (139)(2) Mr Dustin Garrow 192 198 111 114 - - 16 16 319 328 Mr Mark Chalmers - - - - - - 29(3) 30(3) 29 30 Subtotal 268 276 156 161 856 883 59 61 1,339 1,381 TOTAL 565 582 726 749 856 883 59 61 2,206 2,275 It should be noted that time or performance vesting conditions are attached to all of the share rights referred to above. These are detailed elsewhere in this report.
Exchange rate used as the average for year US$1 = A$0.96971
(1) Issued pursuant to retention programme, vesting time based only.
(2) Includes a credit of A$146,000 relating to share rights forfeited upon resignation.
(3) Includes A$9,000 relating to 50,000 time-based shares negotiated as a sign-on bonus to assist in attracting quality personnel.
REMUNERATION REPORT (audited) (continued) CONTRACTS FOR SERVICES Remuneration and other terms of employment for the Key Management Personnel are normally formalised in contracts for services. All contracts with Key Management Personnel may be terminated early by either party providing between 3 to 6 months written notice or providing payments in lieu of the notice period (based on fixed component of remuneration). On termination notice by the Company, any rights that have vested, or that will vest during the notice period, will be released. Rights that have not yet vested will be forfeited. Mr John Borshoff, Managing Director/CEO Term of agreement – 4 years commencing 27 November 2009. Base salary, inclusive of superannuation, A$2,044,244. Base salary was voluntarily reduced by 25% to A$1,533,600 from 1 December 2011 to 30 June 2013, and further extended by him to the end of his current contract, 26 November 2013. 3 months long service leave after 5 years continual service. Payment of a benefit on retirement or early termination by the Company, other than for gross misconduct, equal to one year’s average base salary for the 2 years immediately preceding the termination date. A new contract is currently being negotiated. Ms Gillian Swaby, Company Secretary and Executive General Manager – Corporate Services Fees are paid in the ordinary course of business for services to a company of which Ms Gillian Swaby is a director and shareholder. Consultancy agreement with no fixed term. Annual fee A$567,000. Notice period 3 months. No termination benefit is specified in the agreement. Retention bonus – 100%. Mr Alan Rule, Chief Financial Officer (Commenced 23 July 2012) Term of agreement – no fixed term. Base salary, inclusive of superannuation of A$500,000. No termination benefit is specified in the agreement. Notice period 6 months. Retention bonus – 100%. 50,000 time-based share rights negotiated as a sign-on bonus to assist in attracting quality personnel. These will be issued at the time of the next issue of Company Performance Shares Rights. Mr Dustin Garrow, Executive General Manager - Marketing Term of agreement – no fixed term. Base salary, of US$683,385. No termination benefit is specified in the agreement. Notice period 6 months. Retention bonus – 100%. Mr Mark Chalmers, Executive General Manager – Production Term of Agreement – no fixed term. Base salary, inclusive of superannuation of A$514,500. No termination benefit is specified. Notice period 3 months Retention bonus – 100%. Remuneration for all parties referred to above includes provision of an annual discretionary bonus and initial and ongoing discretionary participation in the Company’s long-term incentive plans.
Share Rights Vested as Shares - Key Management Personnel (Group) 30 June 2013 Vested as shares Directors Mr John Borshoff 150,000 Executives Ms Gillian Swaby 167,833 Mr Dustin Garrow 68,000 Mr Mark Chalmers 7,500 Total 393,333
End of audited Remuneration Report SHARE RIGHTS The outstanding balance of share rights at the date of this report are as follows: Date rights granted
Vesting date Vesting performance conditions Number
26 March 2010 26 March 2014 TSR 150,000(1) 5 November 2010 5 November 2013 TSR 250,000(1) 5 November 2010 5 November 2013 EPS 250,000(1) 5 November 2010 1 September 2013 Time based 348,960 5 November 2010 1 September 2013 TSR 279,170 5 November 2010 1 September 2013 Market price (base price A$3.62) 418,755 15 February 2011 15 February 2014 Time based 125,650(2) 2 April 2012 1 September 2013 Time based 224,085 2 April 2012 31 December 2013 Time based 20,000 2 April 2012 1 September 2014 Time based 423,475 2 April 2012 1 September 2014 TSR 298,780 2 April 2012 1 September 2014 Market price (base price A$1.94) 448,170 Total 3,237,045
(1) Managing Director/CEO grant
(2) Issued pursuant to retention programme, vesting time based only in order to retain quality personnel.
1,717,850 shares were issued on the vesting of share rights during the year ended 30 June 2013. 4,217,329 options were cancelled having failed to achieve performance conditions. DIRECTORS’ INDEMNITIES During the year the Company has incurred premiums to insure the Directors and/or officers for liabilities incurred as costs and expenses that may be incurred in defending civil or criminal proceedings that may be brought against the officers in their capacity as officers of the Company and or its controlled entities. Under the terms and conditions of the insurance contract, the nature of liabilities insured against and the premium paid cannot be disclosed.
ROUNDING
The amounts contained in this report, the Financial Report and the Management, Discussion and Analysis have been rounded to the nearest US$100,000 (where rounding is applicable) under the option available to the Company under ASIC Class Order 98/0100. The Company is an entity to which the Class Order applies. AUDITOR
Ernst & Young were appointed auditors for the Company on 21 June 2005, which was approved by shareholders at the 2005 Annual General Meeting on 9 November 2005.
AUDITOR INDEPENDENCE AND NON-AUDIT SERVICES The Directors received the following declaration from the auditor of Paladin Energy Ltd.
NON-AUDIT SERVICES The following non-audit and assurance services were provided by the Company’s auditor, Ernst & Young. The Directors are satisfied that the provision of non-audit and assurance services is compatible with the general standard of independence for auditors imposed by the Corporations Act. The nature and scope of each type of non-audit and assurance service provided means that auditor independence was not compromised. Ernst & Young received or are due to receive the following amounts for the provision of non-audit services: US$’000Tax compliance services 114International tax consulting 180 Tax advice on mergers and acquisitions 48 Other tax advice 169 Total 511
Signed in accordance with a resolution of the Directors.
Mr John Borshoff Managing Director/CEO Perth, Western Australia 29 August 2013
For
per
sona
l use
onl
y
102
PALADIN ENERGY LTD AND CONTROLLED ENTITIES FINANCIAL REPORT
FOR THE YEAR ENDED 30 JUNE 2013 __________________________________________________________________________________
294605_9
CONTENTS OF THE FINANCIAL REPORT
Note Title Page Number ___________________________________________________________________________________ CONSOLIDATED INCOME STATEMENT ........................................................................................ 104
CONSOLIDATED STATEMENT OF COMPREHENSIVE INCOME .................................................. 105
CONSOLIDATED STATEMENT OF FINANCIAL POSITION ............................................................ 106
CONSOLIDATED STATEMENT OF CHANGES IN EQUITY ............................................................ 107
CONSOLIDATED STATEMENT OF CASH FLOWS ......................................................................... 108
NOTE 1. CORPORATE INFORMATION ........................................................................ 109
PALADIN ENERGY LTD AND CONTROLLED ENTITIES FINANCIAL REPORT
FOR THE YEAR ENDED 30 JUNE 2013 __________________________________________________________________________________
294605_9
NOTE 27. INTERESTS IN JOINTLY CONTROLLED ASSETS ........................................ 181
NOTE 28. EVENTS AFTER THE BALANCE DATE .......................................................... 181
NOTE 29. EARNINGS PER SHARE ................................................................................. 183
NOTE 30. PARENT ENTITY INFORMATION ................................................................... 184
For
per
sona
l use
onl
y
104
PALADIN ENERGY LTD AND CONTROLLED ENTITIES CONSOLIDATED INCOME STATEMENT
FOR THE YEAR ENDED 30 JUNE 2013 __________________________________________________________________________________
294605_9
Notes 2013
US$M 2012 US$M
Revenue Revenue 5(a) 411.5 367.4Cost of sales 5(b) (355.6) (304.5) Impairment – inventory and stores and consumables (30.9) (39.0) Gross profit 25.0 23.9 Other income 5(c) 3.0 2.6 Exploration and evaluation expenses 13 (1.4) (2.5) Administration, marketing and non-production costs 5(d) (39.5) (47.0) Other expenses 5(e) (308.9) (199.8) Loss before interest and tax (321.8) (222.8) Finance costs 5(f) (63.8) (56.7) Net loss before income tax (385.6) (279.5) Income tax (expense)/benefit 6(a) (88.4) 78.7 Net loss after tax (474.0) (200.8) Attributable to: Non-controlling interests (53.1) (28.0) Members of the parent (420.9) (172.8) Net loss after tax (474.0) (200.8) Loss per share (US cents) Loss after tax from operations attributable to ordinary equity holders of the Company – basic and diluted (US cents) 29 (49.1) (20.2) The above Consolidated Income Statement should be read in conjunction with the accompanying notes.
For
per
sona
l use
onl
y
105
PALADIN ENERGY LTD AND CONTROLLED ENTITIES CONSOLIDATED STATEMENT OF COMPREHENSIVE INCOME
FOR THE YEAR ENDED 30 JUNE 2013 __________________________________________________________________________________
294605_9
Notes 2013 US$M
2012 US$M
Net loss after tax from operations (474.0) (200.8) Other comprehensive income Items that may be subsequently reclassified to profit or loss: Transfer of realised gains to other income on disposal of available-for-sale financial assets (1.2) - Net loss on available-for-sale financial assets (5.3) (25.8) Transfer of impairment loss on available-for-sale financial assets to income statement 5.0 8.0 Foreign currency translation (67.8) (40.7) Income tax on items of other comprehensive income 0.1 3.3 Items that will not be subsequently reclassified to profit or loss: Foreign currency translation attributable to non- controlling interests (7.9) (3.3) Other comprehensive loss for the year, net of tax (77.1) (58.5) Total comprehensive loss for the year (551.1) (259.3) Total comprehensive loss attributable to: Non-controlling interests (61.0) (31.3) Members of the parent (490.1) (228.0) (551.1) (259.3) The above Consolidated Statement of Comprehensive Income should be read in conjunction with the accompanying notes.
For
per
sona
l use
onl
y
106
PALADIN ENERGY LTD AND CONTROLLED ENTITIES CONSOLIDATED STATEMENT OF FINANCIAL POSITION
AS AT 30 JUNE 2013 __________________________________________________________________________________
294605_9
Notes 2013 US$M
2012 US$M
ASSETS Current assets Cash and cash equivalents 7 78.1 112.1 Trade and other receivables 8 78.3 82.8Prepayments 9.2 10.2 Inventories 9 158.8 186.5 TOTAL CURRENT ASSETS 324.4 391.6 Non current assets Trade and other receivables 8 0.1 0.1 Inventories 9 141.4 114.2 Other financial assets 10 10.3 15.5 Property, plant and equipment 11 301.0 491.7 Mine development 12 42.8 88.3 Exploration and evaluation expenditure 13 1,004.9 1,143.2 Deferred tax asset 6(d) - 85.0 Intangible assets 14 12.8 18.1 TOTAL NON CURRENT ASSETS 1,513.3 1,956.1 TOTAL ASSETS 1,837.7 2,347.7 LIABILITIES Current liabilities Trade and other payables 15 57.9 67.1Interest bearing loans and borrowings 16 63.6 183.4 Provisions 17 9.9 3.4 TOTAL CURRENT LIABILITIES 131.4 253.9 Non current liabilities Interest bearing loans and borrowings 16 614.2 655.1 Deferred tax liabilities 6(d) 186.9 203.5 Provisions 17 57.0 40.4 Unearned revenue 18 200.0 - TOTAL NON CURRENT LIABILITIES 1,058.1 899.0 TOTAL LIABILITIES 1,189.5 1,152.9 NET ASSETS 648.2 1,194.8 EQUITY Contributed equity 19(a) 1,845.7 1,839.2 Reserves 19(c) 106.6 177.8 Accumulated losses (1,295.5) (874.6) Parent interests 656.8 1,142.4 Non-controlling interests (8.6) 52.4 TOTAL EQUITY 648.2 1,194.8 The above Consolidated Statement of Financial Position should be read in conjunction with the accompanying notes.
For
per
sona
l use
onl
y
107
PALADIN ENERGY LTD AND CONTROLLED ENTITIES CONSOLIDATED STATEMENT OF CHANGES IN EQUITY
FOR THE YEAR ENDED 30 JUNE 2013
294605_9
Contributed Equity US$M
Available -for-Sale Reserve
US$M
Share-Based
Payments Reserve
US$M
Convertible Bond Non-
Distrib-utable
Reserve US$M
Foreign Currency
Revaluation Reserve US$M
Premium on
Acquisition Reserve US$M
Option Application
Reserve US$M
Consol-idated
ReserveUS$M
Accumu-lated
Losses US$M
Attributable to Owners
of the Parent US$M
Non-Controlling
Interests US$M
Total US$M
Balance at 1 July 2011 1,768.1 11.7 49.5 60.4 68.8 14.9 0.1 (0.2) (701.8) 1,271.5 83.7 1,355.2 Loss for the period - - - - - - - - (172.8) (172.8) (28.0) (200.8) Other comprehensive loss - (14.5) - - (40.7) - - - - (55.2) (3.3) (58.5) Total comprehensive loss for the year net of tax - (14.5) - - (40.7) - - - (172.8) (228.0) (31.3) (259.3) Share-based payment - - 7.4 - - - - - - 7.4 - 7.4 Vesting performance rights 4.7 - (4.7) - - - - - - - - - contributions of equity, net of transaction costs 66.4 - - - - - - - - 66.4 - 66.4 Convertible bonds – equity component, net of tax and transaction costs - - - 27.9 - - - - - 27.9 - 27.9 Convertible bonds – buyback - - - (2.8) - - - - - (2.8) - (2.8) Balance at 30 June 2012 1,839.2 (2.8) 52.2 85.5 28.1 14.9 0.1 (0.2) (874.6) 1,142.4 52.4 1,194.8 Balance at 1 July 2012 1,839.2 (2.8) 52.2 85.5 28.1 14.9 0.1 (0.2) (874.6) 1,142.4 52.4 1,194.8 Loss for the period - - - - - - - - (420.9) (420.9) (53.1) (474.0) Other comprehensive loss - (1.4) - - (67.8) - - - - (69.2) (7.9) (77.1) Total comprehensive loss for the year net of tax - (1.4) - - (67.8) - - - (420.9) (490.1) (61.0) (551.1) Share-based payment - - 4.5 - - - - - - 4.5 - 4.5 Vesting performance rights 6.5 - (6.5) - - - - - - - - - Balance at 30 June 2013 1,845.7 (4.2) 50.2 85.5 (39.7) 14.9 0.1 (0.2) (1,295.5) 656.8 (8.6) 648.2 The above Consolidated Statement of Changes in Equity should be read in conjunction with the accompanying notes.
For
per
sona
l use
onl
y
108
PALADIN ENERGY LTD AND CONTROLLED ENTITIES
CONSOLIDATED STATEMENT OF CASH FLOWS
FOR THE YEAR ENDED 30 JUNE 2013 __________________________________________________________________________________
294605_9
Notes 2013 US$M
2012 US$M
CASH FLOWS FROM OPERATING ACTIVITIES Receipts from customers 400.0 313.9 Payments to suppliers and employees (364.8) (401.1) Interest received 1.0 1.4Proceeds from long-term off-take agreement 200.0 - Interest paid (42.4) (38.0) Exploration and evaluation expenditure (1.4) (2.5)Other income 2.1 0.5 NET CASH INFLOW/(OUTFLOW) FROM OPERATING ACTIVITIES 7(a) 194.5 (125.8) CASH FLOWS FROM INVESTING ACTIVITIES Capitalised exploration expenditure (16.5) (12.1) Payments for property, plant and equipment (30.6) (70.1) Payments for available-for-sale investments (1.4) - Proceeds from sale of property, plant & equipment 0.4 - Proceeds from sale of investments 1.9 - NET CASH OUTFLOW FROM INVESTING ACTIVITIES (46.2) (82.2) CASH FLOWS FROM FINANCING ACTIVITIES Proceeds from convertible bonds - 274.0 Repayment of convertible bonds (134.0) (191.0) Convertible bond finance costs (0.4) (5.9) Share placement - 64.7 Equity fundraising costs - (2.1) Project finance facility establishment costs (0.2) (2.0) Repayment of borrowings (46.9) (77.2) Proceeds from borrowings - 141.0 NET CASH (OUTFLOW)/INFLOW FROM FINANCING ACTIVITIES (181.5) 201.5 NET DECREASE IN CASH AND CASH EQUIVALENTS (33.2) (6.5) Cash and cash equivalents at the beginning of the financial year 112.1 117.4 Effects of exchange rate changes on cash and cash equivalents (0.8) 1.2 CASH AND CASH EQUIVALENTS AT THE END OF THE FINANCIAL YEAR 7 78.1 112.1 The above Consolidated Statement of Cash Flows should be read in conjunction with the accompanying notes. F
or p
erso
nal u
se o
nly
109
PALADIN ENERGY LTD AND CONTROLLED ENTITIES NOTES TO THE CONSOLIDATED FINANCIAL STATEMENTS (continued)
FOR THE YEAR ENDED 30 JUNE 2013 __________________________________________________________________________________
294605_9
NOTE 1. CORPORATE INFORMATION
The Financial Report of Paladin for the year ended 30 June 2013 was authorised for issue in accordance with a resolution of the Directors on 23 August 2013. Paladin is a company limited by shares incorporated and domiciled in Australia whose shares are publicly traded on the ASX with additional listings on the Toronto Stock Exchange in Canada as well as Munich, Berlin, Stuttgart and Frankfurt Stock Exchanges in Europe; and the Namibian Stock Exchange in Africa. The nature of the operations and principal activities of the Group are described in the Management Discussion and Analysis on pages 14 to 44. NOTE 2. GOING CONCERN The Group’s consolidated financial statements have been prepared on a going concern basis which contemplates the continuity of normal business activities and the realisation of assets and the settlement of liabilities in the ordinary course of business.
During the year ended 30 June 2013, the Group incurred net losses after tax attributable to the members of US$420.9M (2012: US$172.8M) and had net cash outflow of US$33.2M (2012: US$6.5M). At balance date the Group had a net working capital surplus of US$193.0M (2012: US$137.7M) including cash on hand of US$78.1M (2012: US$112.1M). Included within this cash on hand is US$25.7M (2012: US$26.2M) which is restricted for use in respect of the LHM and KM project finance facilities.
Repayment obligations, during the year ending 30 June 2014, in respect of interest bearing loans and borrowings are summarised as follows:
Secured bank loans principal repayments of US$65.7M for LHM and KM project financing; and
Interest payments of US$31.7M for LHM and KM project financing and convertible bonds.
In addition, in arriving at its position in relation to going concern, the Directors have given consideration to the following:
intention to sell a minority equity position in Langer Heinrich Mine in Namibia;
the Group has a history of refinancing some of its debt; and
the Group has a history of successful equity capital raisings.
On 2 August 2013, the Company announced that it had completed a private placement to institutional and accredited investors of 125.6M ordinary shares raising A$88M/US$80.7M.
For
per
sona
l use
onl
y
110
PALADIN ENERGY LTD AND CONTROLLED ENTITIES NOTES TO THE CONSOLIDATED FINANCIAL STATEMENTS (continued)
FOR THE YEAR ENDED 30 JUNE 2013 __________________________________________________________________________________
294605_9
NOTE 3. SUMMARY OF SIGNIFICANT ACCOUNTING POLICIES (a) Basis of Preparation and Statement of Compliance The Financial Report is a general purpose Financial Report, which has been prepared in accordance with the requirements of the Corporations Act 2001, Australian Accounting Standards and other authoritative pronouncements of the Australian Accounting Standards Board. The Financial Report complies with International Financial Reporting Standards as issued by the International Accounting Standards Board. The Financial Report has also been prepared on a historical cost basis, except for available-for-sale investments, which have been measured at fair value. Where necessary, comparatives have been reclassified and repositioned for consistency with current year disclosures. For the purposes of preparing the consolidated financial statements, the Company is a for-profit entity. In addition to these Australian requirements further information has been included in the Consolidated Financial Statements for the year ended 30 June 2013 in order to comply with applicable Canadian securities law, as the Company is listed on the Toronto Stock Exchange. The Financial Report is presented in US dollars and all values are rounded to the nearest hundred thousand dollars (US$100,000) unless otherwise stated under the option available to the Company under Australian Securities and Investments Commission (ASIC) Class Order 98/100. The Company is an entity to which the class order applies. Apart from changes in accounting policies noted below, the accounting policies adopted are consistent with those disclosed in the Financial Report for the year ended 30 June 2012. (b) New accounting Standards and Interpretations (i) Changes in accounting policy and disclosures The Group has adopted all new and amended Australian Accounting Standards and AASB interpretations effective from 1 July 2012, including: Reference Title AASB 2011-9 Amendments to Australian Accounting Standards -Presentation of Other Comprehensive Income
[AASB 1, 5, 7, 101, 112, 120, 121, 132, 133, 134, 1039 & 1049] This standard requires entities to group items presented in other comprehensive income on the basis of whether they might be reclassified subsequently to profit or loss and those that will not.
The new and amended Standards and Interpretations had no impact on the financial position or performance of the Group.
For
per
sona
l use
onl
y
111
PALADIN ENERGY LTD AND CONTROLLED ENTITIES NOTES TO THE CONSOLIDATED FINANCIAL STATEMENTS (continued)
FOR THE YEAR ENDED 30 JUNE 2013 __________________________________________________________________________________
294605_9
NOTE 3. SUMMARY OF SIGNIFICANT ACCOUNTING POLICIES (continued) (b) New accounting Standards and Interpretations (continued) (ii) Accounting Standards and Interpretations issued but not yet effective The following Australian Accounting Standards that have recently been issued or amended but are not yet effective and have not been applied by the Group for the annual reporting period ending 30 June 2013, outlined in the table below: Reference Title Summary Application
Date of Standard*
Application Date for Group*
AASB 10
Consolidated Financial Statements
AASB 10 establishes a new control model that applies to all entities. It replaces parts of AASB 127 Consolidated and Separate Financial Statements dealing with the accounting for consolidated financial statements and UIG-112 Consolidation - Special Purpose Entities. The new control model broadens the situations when an entity is considered to be controlled by another entity and includes new guidance for applying the model to specific situations, including when acting as a manager may give control, the impact of potential voting rights and when holding less than a majority voting rights may give control. Consequential amendments were also made to this and other standards via AASB 2011-7 and AASB 2012-10.
1 January 2013
1 July 2013
AASB 11
Joint Arrangements
AASB 11 replaces AASB 131 Interests in Joint Ventures and UIG-113 Jointly- controlled Entities - Non-monetary Contributions by Ventures. AASB 11 uses the principle of control in AASB 10 to define joint control, and therefore the determination of whether joint control exists may change. In addition it removes the option to account for jointly controlled entities (JCEs) using proportionate consolidation. Instead, accounting for a joint arrangement is dependent on the nature of the rights and obligations arising from the arrangement. Joint operations that give the venturers a right to the underlying assets and obligations themselves is accounted for by recognising the share of those assets and obligations. Joint ventures that give the venturers a right to the net assets is accounted for using the equity method. Consequential amendments were also made to this and other standards via AASB 2011-7, AASB 2010-10 and amendments to AASB 128.
1 January 2013
1 July 2013
AASB 12
Disclosure of Interests in Other Entities
AASB 12 includes all disclosures relating to an entity's interests in subsidiaries, joint arrangements, associates and structured entities. New disclosures have been introduced about the judgments made by management to determine whether control exists, and to require summarised information about joint arrangements, associates, structured entities and subsidiaries with non-controlling interests.
1 January 2013
1 July 2013
For
per
sona
l use
onl
y
112
PALADIN ENERGY LTD AND CONTROLLED ENTITIES NOTES TO THE CONSOLIDATED FINANCIAL STATEMENTS (continued)
FOR THE YEAR ENDED 30 JUNE 2013 __________________________________________________________________________________
294605_9
NOTE 3. SUMMARY OF SIGNIFICANT ACCOUNTING POLICIES (continued) (b) New accounting Standards and Interpretations (continued) (ii) Accounting Standards and Interpretations issued but not yet effective (continued) Reference Title Summary Application
Date of Standard*
Application Date for Group*
AASB 13
Fair Value Measurement
AASB 13 establishes a single source of guidance for determining the fair value of assets and liabilities. AASB 13 does not change when an entity is required to use fair value, but rather, provides guidance on how to determine fair value when fair value is required or permitted. Application of this definition may result in different fair values being determined for the relevant assets. AASB 13 also expands the disclosure requirements for all assets or liabilities carried at fair value. This includes information about the assumptions made and the qualitative impact of those assumptions on the fair value determined. Consequential amendments were also made to other standards via AASB 2011-8.
1 January 2013
1 July 2013
Interpretation 20
Stripping Costs in the Production Phase of a Surface Mine
This interpretation applies to stripping costs incurred during the production phase of a surface mine. Production stripping costs are to be capitalised as part of an asset, if an entity can demonstrate that it is probable future economic benefits will be realised, the costs can be reliably measured and the entity can identify the component of an ore body for which access has been improved. This asset is to be called the "stripping activity asset". The stripping activity asset shall be depreciated or amortised on a systematic basis, over the expected useful life of the identified component of the ore body that becomes more accessible as a result of the stripping activity. The units of production method shall be applied unless another method is more appropriate. Consequential amendments were also made to other standards via AASB 2011-12.
1 January 2013
1 July 2013
For
per
sona
l use
onl
y
113
PALADIN ENERGY LTD AND CONTROLLED ENTITIES NOTES TO THE CONSOLIDATED FINANCIAL STATEMENTS (continued)
FOR THE YEAR ENDED 30 JUNE 2013 __________________________________________________________________________________
294605_9
NOTE 3. SUMMARY OF SIGNIFICANT ACCOUNTING POLICIES (continued) (b) New accounting Standards and Interpretations (continued) (ii) Accounting Standards and Interpretations issued but not yet effective (continued) Reference Title Summary Application
Date of Standard*
Application Date for Group*
AASB 2012-2
Amendments to Australian Accounting Standards - Disclosures - Offsetting Financial Assets and Financial Liabilities
AASB 2012-2 principally amends AASB 7 Financial Instruments: Disclosures to require disclosure of the effect or potential effect of netting arrangements. This includes rights of set-off associated with the entity's recognised financial assets and liabilities on the entity's financial position, when the offsetting criteria of AASB 132 are not all met.
1 January 2013
1 July 2013
AASB 2012-5
Amendments to Australian Accounting Standards arising from Annual Improvements 2009-2011 Cycle
AASB 2012-5 makes amendments resulting from the 2009-2011 Annual Improvements Cycle. The standard addresses a range of improvements, including the following: Repeat application of AASB 1 is permitted (AASB 1). Clarification of the comparative information
requirements when an entity provides a third balance sheet (AASB 101 Presentation of Financial Statements).
1 January 2013
1 July 2013
AASB 2012-9
Amendment to AASB 1048 arising from the withdrawal of Australian Interpretation 1039
AASB 2012-9 amends AASB 1048 Interpretation of Standards to evidence the withdrawal of Australian Interpretation 1039 Substantive Enactment of Major Tax Bills in Australia.
1 January 2013
1 July 2013
AASB 2011-4
Amendments to Australian Accounting Standards to Remove Individual Key Management Personnel Disclosure Requirements [AASB 124]
This amendment deletes from AASB 124 individual key management personnel disclosure requirements for disclosing entities that are not companies. It also removes the individual KMP disclosure requirements for all disclosing entities in relation to equity holdings, loans and other related party transactions.
1 July 2013**
1 July 2013
AASB 1053
Application of Tiers of Australian Accounting Standards
This standard establishes a differential financial reporting framework consisting of two tiers of reporting requirements for preparing general purpose financial statements: (a) Tier 1: Australian Accounting Standards. (b) Tier 2: Australian Accounting Standards – Reduced Disclosure Requirements. Tier 2 comprises the recognition, measurement and presentation requirements of Tier 1 and substantially reduced disclosures corresponding to those requirements. The following entities apply Tier 1 requirements in preparing general purpose financial statements: (a) For-profit entities in the private sector that have public accountability (as defined in this standard). (b) The Australian Government and State, Territory and Local governments. The following entities apply either Tier 2 or Tier 1 requirements in preparing general purpose financial statements: (a) For-profit private sector entities that do not have public accountability. (b) All not-for-profit private sector entities. (c) Public sector entities other than the Australian Government and State, Territory and Local governments. Consequential amendments to other standards to implement the regime were introduced by AASB 2010-2, 2011-2, 2011-6, 2011-11, 2012-1, 2012-7 and 2012-11.
1 July 2013
1 July 2013
For
per
sona
l use
onl
y
114
PALADIN ENERGY LTD AND CONTROLLED ENTITIES NOTES TO THE CONSOLIDATED FINANCIAL STATEMENTS (continued)
FOR THE YEAR ENDED 30 JUNE 2013 __________________________________________________________________________________
294605_9
NOTE 3. SUMMARY OF SIGNIFICANT ACCOUNTING POLICIES (continued) (b) New accounting Standards and Interpretations (continued) (ii) Accounting Standards and Interpretations issued but not yet effective (continued) Reference Title Summary Application
Date of Standard*
Application Date for Group*
AASB 2012-3
Amendments to Australian Accounting Standards - Offsetting Financial Assets and Financial Liabilities
AASB 2012-3 adds application guidance to AASB 132 Financial Instruments: Presentation to address inconsistencies identified in applying some of the offsetting criteria of AASB 132, including clarifying the meaning of "currently has a legally enforceable right of set-off" and that some gross settlement systems may be considered equivalent to net settlement.
1 January 2014 1 July 2014
Interpretation 21
Levies^
This Interpretation confirms that a liability to pay a levy is only recognised when the activity that triggers the payment occurs. Applying the going concern assumption does not create a constructive obligation.
1 January 2014 1 July 2014
AASB 9
Financial Instruments
AASB 9 includes requirements for the classification and measurement of financial assets. It was further amended by AASB 2010-7 to reflect amendments to the accounting for financial liabilities. These requirements improve and simplify the approach for classification and measurement of financial assets compared with the requirements of AASB 139. The main changes are described below: (a) Financial assets that are debt instruments will be classified based on (1) the objective of the entity's business model for managing the financial assets; (2) the characteristics of the contractual cash flows. (b) Allows an irrevocable election on initial recognition to present gains and losses on investments in equity instruments that are not held for trading in other comprehensive income. Dividends in respect of these investments that are a return on investment can be recognised in profit or loss and there is no impairment or recycling on disposal of the instrument. (c) Financial assets can be designated and measured at fair value through profit or loss at initial recognition if doing so eliminates or significantly reduces a measurement or recognition inconsistency that would arise from measuring assets or liabilities, or recognising the gains and losses on them, on different bases. (d) Where the fair value option is used for financial liabilities the change in fair value is to be accounted for as follows: The change attributable to changes in credit risk are
presented in other comprehensive income (OCI). The remaining change is presented in profit or loss. If this approach creates or enlarges an accounting mismatch in the profit or loss, the effect of the changes in credit risk are also presented in profit or loss.
1 January 2015 1 July 2015
For
per
sona
l use
onl
y
115
PALADIN ENERGY LTD AND CONTROLLED ENTITIES NOTES TO THE CONSOLIDATED FINANCIAL STATEMENTS (continued)
FOR THE YEAR ENDED 30 JUNE 2013 __________________________________________________________________________________
294605_9
NOTE 3. SUMMARY OF SIGNIFICANT ACCOUNTING POLICIES (continued) (b) New accounting Standards and Interpretations (continued) (ii) Accounting Standards and Interpretations issued but not yet effective (continued) Reference Title Summary Application
Date of Standard*
Application Date for Group*
AASB 9 (continued)
Financial Instruments (continued)
Further amendments were made by AASB 2012-6 which amends the mandatory effective date to annual reporting periods beginning on or after 1 January 2015. AASB 2012-6 also modifies the relief from restating prior periods by amending AASB 7 to require additional disclosures on transition to AASB 9 in some circumstances. Consequential amendments were also made to other standards as a result of AASB 9, introduced by AASB 2009-11 and superseded by AASB 2010-7 and 2010-10.
* Designates the beginning of the applicable annual reporting period unless otherwise stated. ^ The AASB have not yet issued the Australian equivalent of this Interpretation. The potential effect of these Standards is yet to be fully determined. For Standards and Interpretations effective from 1 July 2013, it is not expected that the new Standards and Interpretations will significantly affect the Group’s financial performance. As at the application date of Interpretation 20, the Group did not have any assets in relation to stripping costs incurred during the production phase of a mine.
For
per
sona
l use
onl
y
116
PALADIN ENERGY LTD AND CONTROLLED ENTITIES NOTES TO THE CONSOLIDATED FINANCIAL STATEMENTS (continued)
FOR THE YEAR ENDED 30 JUNE 2013 __________________________________________________________________________________
294605_9
NOTE 3. SUMMARY OF SIGNIFICANT ACCOUNTING POLICIES (continued) (c) Basis of Consolidation The consolidated financial statements comprise the financial statements of Paladin Energy Ltd and its subsidiaries as at and for the period ended 30 June each year (the Group). Interests in associates are equity accounted and are not part of the consolidated Group. Subsidiaries are all those entities over which the Group has the power to govern the financial and operating policies so as to obtain benefits from their activities. The existence and effect of potential voting rights that are currently exercisable or convertible are considered when assessing whether a group controls another entity. The financial statements of the subsidiaries are prepared for the same reporting period as the parent company, using consistent accounting policies. In preparing the consolidated financial statements, all intercompany balances and transactions, income and expenses and profit and losses resulting from intra-group transactions have been eliminated in full. Subsidiaries are fully consolidated from the date on which control is obtained by the Group and cease to be consolidated from the date on which control is transferred out of the Group. The acquisition of subsidiaries is accounted for using the acquisition method of accounting. The acquisition method of accounting involves recognising at acquisition date, separately from goodwill, the identifiable assets acquired, the liabilities assumed and any non-controlling interest in the acquiree. The identifiable assets acquired and the liabilities assumed are measured at their acquisition date fair values (refer to Note 3(j)). The difference between the above items and the fair value of the consideration (including the fair value of any pre-existing investment in the acquiree) is goodwill or a discount on acquisition. A change in the ownership interest of a subsidiary that does not result in a loss of control, is accounted for as an equity transaction. Non-controlling interests are allocated their share of net profit after tax in the statement of comprehensive income and are presented within equity in the consolidated statement of financial position, separately from the equity of the owners of the parent. Losses are attributed to the non-controlling interest even if that results in a deficit balance. If the Group loses control over a subsidiary, it: Derecognises the assets (including goodwill) and liabilities of the subsidiary; Derecognises the carrying amount of any non-controlling interest; Derecognises the cumulative translation differences, recorded in equity; Recognises the fair value of the consideration received; Recognises the fair value of any investment retained; Recognises any surplus or deficit in profit or loss and; and Reclassifies the parent’s share of components previously recognised in other comprehensive
income to profit or loss. F
or p
erso
nal u
se o
nly
117
PALADIN ENERGY LTD AND CONTROLLED ENTITIES NOTES TO THE CONSOLIDATED FINANCIAL STATEMENTS (continued)
FOR THE YEAR ENDED 30 JUNE 2013 __________________________________________________________________________________
294605_9
NOTE 3. SUMMARY OF SIGNIFICANT ACCOUNTING POLICIES (continued) (d) Significant Accounting Judgements, Estimates and Assumptions The carrying amounts of certain assets and liabilities are often determined based on estimates and assumptions of future events. The key estimates and assumptions that have a significant risk of causing a material adjustment to the carrying amounts of certain assets and liabilities within the next annual reporting period are: (i) Net Realisable Value of Inventories The Group reviews the carrying value of inventories regularly to ensure that their cost does not exceed net realisable value. In determining net realisable value various factors are taken into account including sales prices and costs to complete inventories to their final form. (ii) Impairment of Property, Plant and Equipment; Mine Development and Intangibles Property, plant and equipment; mine development and intangibles are tested for impairment whenever events or changes in circumstances indicate that the carrying value may not be recoverable. The Group conducts an internal review of asset values at each reporting date, which is used as a source of information to assess for any indicators of impairment. Factors, such as changes in uranium prices, production performance and mining and processing costs are monitored to assess for indicators of impairment. If any indication of impairment exists, an estimate of the asset’s recoverable amount is calculated. An impairment loss is recognised for the amount by which the asset’s carrying amount exceeds its recoverable amount. Recoverable amount is the higher of an asset’s fair value less costs to sell and value in use. For the purposes of assessing impairment, assets are grouped at the lowest levels for which there are separately identifiable cash inflows that are largely independent of the cash inflows from other assets or groups of assets (cash-generating units). (iii) Available-for-Sale Financial Assets and Financial Assets Held for Trading The Group measures the fair value of available-for-sale financial assets by reference to the fair value of the equity instruments at the date at which they are valued. The fair value of the unlisted securities is determined using valuation techniques. Such techniques include using recent arm’s length market transactions, net asset values and by an external valuer using the Black-Scholes valuation model.
(iv) Carrying Value of Exploration and Evaluation Expenditure The Group reviews the carrying value of exploration and evaluation expenditure at each reporting date. This requires judgement as to the status of the individual projects and their future economic value. (v) Deferred Tax Assets and Liabilities The Group is subject to income taxes in Australia and jurisdictions where it has foreign operations. Significant judgement is required in determining deferred tax assets and liabilities. There are many transactions and calculations for which the ultimate tax determination is uncertain during the ordinary course of business. The carrying amount of deferred income tax assets is reviewed at each reporting date and reduced to the extent that it is no longer probable that sufficient taxable profit will be available to allow all or part of the deferred income tax asset to be utilised. Unrecognised deferred income tax assets are reassessed at each reporting date and are recognised to the extent that it has become probable that future taxable profit will allow the deferred tax asset to be recovered.
For
per
sona
l use
onl
y
118
PALADIN ENERGY LTD AND CONTROLLED ENTITIES NOTES TO THE CONSOLIDATED FINANCIAL STATEMENTS (continued)
FOR THE YEAR ENDED 30 JUNE 2013 __________________________________________________________________________________
294605_9
NOTE 3. SUMMARY OF SIGNIFICANT ACCOUNTING POLICIES (continued)
(d) Significant Accounting Judgements, Estimates and Assumptions (continued)
(vi) Rehabilitation Provision The value of this provision represents the discounted value of the present obligation to rehabilitate the mine and to restore, dismantle and close the mine. The discounted value reflects a combination of management’s assessment of the cost of performing the work required, the timing of the cash flows and the discount rate. A change in any, or a combination, of the three key assumptions (estimated cash flows, discount rates or inflation rates), used to determine the provision could have a material impact to the carrying value of the provision. (vii) Share-Based Payment Transactions The Group measures the cost of equity-settled transactions with employees by reference to the fair value of the equity instruments at the date at which they are granted. The fair value is determined by an external valuer using either the Black-Scholes valuation model or Monte-Carlo simulation model as appropriate, using assumptions detailed in Note 26. (viii) Proved and Probable Reserves The Group uses the concept of a life of mine as an accounting value to determine such things as depreciation rates and the appropriate period to discount mine closure provisions. In determining life of mine the proved and probable reserves measured in accordance with the 2004 edition of the JORC Code specific to a mine are taken into account which by their very nature require judgements, estimates and assumptions. (ix) Production Start Date The Group assesses the stage of each mine under construction to determine when a mine moves into the production stage. The criteria used to assess the start date are determined based on the unique nature of each mine construction project, such as the complexity of a plant and its location. The Group considers various relevant criteria to assess when the mine and the processing plant is substantially complete, ready for its intended use. At this time, any costs capitalised to ‘construction work in progress’ are reclassified to ‘mine development’ and ‘property, plant and equipment’. Some of the criteria will include, but are not limited, to the following:
availability of the plant completion of a reasonable period of testing of the mine plant and equipment ability to produce metal in saleable form (within specifications) ability to sustain ongoing production of metal at commercial rates of production When a mine construction project moves into the production stage, the capitalisation of certain mine construction costs ceases and costs are either regarded as inventory or expensed, except for costs that qualify for capitalisation relating to mine asset additions or improvements, mine development or mineable reserve development. It is also at this point that depreciation / amortisation commences.
For
per
sona
l use
onl
y
119
PALADIN ENERGY LTD AND CONTROLLED ENTITIES NOTES TO THE CONSOLIDATED FINANCIAL STATEMENTS (continued)
FOR THE YEAR ENDED 30 JUNE 2013 __________________________________________________________________________________
294605_9
NOTE 3. SUMMARY OF SIGNIFICANT ACCOUNTING POLICIES (continued) (e) Segment Reporting An operating segment is a component of an entity that engages in business activities from which it may earn revenue and incur expenses (including revenues and expenses relating to transactions with other components of the same entity), whose operating results are regularly reviewed by the Group’s executive management team (the chief operating decision makers) to make decisions about resources to be allocated to the segment and assess its performance and for which discrete financial information is available. This includes start-up operations which are yet to earn revenues. Management will also consider other factors in determining operating segments such as the existence of a line manager and the level of segment information presented to the executive management team. Operating segments have been identified based on the information provided to the chief operating decision makers, being the executive management team. Operating segments that meet the quantitative criteria as prescribed by AASB 8 are reported separately. However, an operating segment that does not meet the quantitative criteria is still reported separately where information about the segment would be useful to users of the financial statements. The Company has identified its operating segments to be Exploration, Namibia and Malawi on the basis of the nature of activity and geographical location and different regulatory environments. (f) Foreign Currency Translation (i) Functional and Presentation Currency
Items included in the Financial Statements of each of the Group's entities are measured using the currency of the primary economic environment in which the entity operates ('the functional currency'). The Consolidated Financial Statements are presented in United States dollars (US dollars), which is the Company’s functional and presentation currency.
(ii) Transactions and Balances Foreign currency transactions are converted into the functional currency using the exchange rates prevailing at the dates of the transactions. Foreign exchange gains and losses resulting from the settlement of such transactions and from the translation at year-end exchange rates of monetary assets and liabilities denominated in foreign currencies are recognised in the Income Statement. Translation differences on available-for-sale financial assets are included in the available-for-sale reserve. (iii) Group Companies
Some Group entities have a functional currency of US dollars which is consistent with the Group’s presentational currency. For all other Group entities the functional currency has been translated into US dollars for presentation purposes. Assets and liabilities are translated using exchange rates prevailing at the balance sheet date; revenues and expenses are translated using average exchange rates prevailing for the income statement year; and equity transactions are translated at exchange rates prevailing at the dates of transactions. The resulting difference from translation is recognised in a foreign currency translation reserve. Upon the sale of a subsidiary the FCTR attributable to the parent is recycled to the Income Statement. The following material operating subsidiaries have a US dollar functional currency:
Paladin Finance Pty Ltd
Paladin (Africa) Limited
Langer Heinrich Uranium (Pty) Ltd
Paladin Nuclear Ltd
Indo Energy Ltd
For
per
sona
l use
onl
y
120
PALADIN ENERGY LTD AND CONTROLLED ENTITIES NOTES TO THE CONSOLIDATED FINANCIAL STATEMENTS (continued)
FOR THE YEAR ENDED 30 JUNE 2013 __________________________________________________________________________________
294605_9
NOTE 3. SUMMARY OF SIGNIFICANT ACCOUNTING POLICIES (continued) (f) Foreign Currency Translation (continued) (iii) Group Companies (continued) The following material operating subsidiaries have an Australian dollar functional currency: Northern Territory Uranium Pty Ltd
The following material operating subsidiaries have a Canadian dollar functional currency:
Aurora Energy Ltd
Michelin Uranium Ltd
Paladin Canada Holdings (NL) Ltd
Paladin Canada Investments (NL) Ltd (g) Revenue Recognition Revenue is measured at the fair value of the consideration received or receivable. Amounts disclosed as revenue are net of duties and taxes paid. Revenue is recognised for the major business activities as follows: (i) Sale of Uranium Revenue from sale of uranium is recognised when risk and reward of ownership pass which is when title of the product passes from the Group pursuant to an enforceable contract, when selling prices are known or can be reasonably estimated and when the product is in a form that requires no further treatment by the Group. (ii) Interest Revenue Interest revenue from investments in cash is recognised in the Income Statement as interest accrues using the effective interest method. This is a method of calculating the amortised cost of a financial asset and allocating the interest income over the relevant period using the effective interest rate, which is the rate that exactly discounts estimated future cash receipts through the expected life of the financial asset to the net carrying amount of the financial asset. (iii) Unearned Revenue Revenue from the long-term off-take agreement is a payment for future product to be delivered. Advance customer payments are unearned revenues at the time of receipt. When the product is delivered to the customer the unearned revenue will be released to the Income Statement on an undiscounted basis.
For
per
sona
l use
onl
y
121
PALADIN ENERGY LTD AND CONTROLLED ENTITIES NOTES TO THE CONSOLIDATED FINANCIAL STATEMENTS (continued)
FOR THE YEAR ENDED 30 JUNE 2013 __________________________________________________________________________________
294605_9
NOTE 3. SUMMARY OF SIGNIFICANT ACCOUNTING POLICIES (continued) (h) Income Tax The income tax expense or benefit for the period is the tax payable on the current period's taxable income based on the income tax rate for each jurisdiction adjusted by changes in deferred tax assets and liabilities attributable to temporary differences between the tax bases of assets and liabilities and their carrying amounts in the Financial Statements, and to unused tax losses. Deferred tax assets and liabilities are recognised for temporary differences at the tax rates expected to apply when the assets are recovered or liabilities are settled, based on those tax rates which are enacted or substantively enacted for each jurisdiction. The relevant tax rates are applied to the cumulative amounts of deductible and taxable temporary differences to measure the deferred tax asset or liability. An exception is made for certain temporary differences arising from the initial recognition of an asset or a liability. No deferred tax asset or liability is recognised in relation to these temporary differences if they arose in a transaction, other than a business combination, that at the time of the transaction did not affect either accounting profit or taxable profit or loss. Deferred tax assets are recognised for deductible temporary differences and unused tax losses only if it is probable that future taxable amounts will be available to utilise those temporary differences and losses. Deferred tax liabilities and assets are not recognised for temporary differences between the carrying amount and tax bases of investments in controlled entities where the Parent Entity is able to control the timing of the reversal of the temporary differences and it is probable that the differences will not reverse in the foreseeable future. Current and deferred tax balances attributable to amounts recognised directly in equity are also recognised directly in equity. Deferred tax assets and liabilities are offset only if a legally enforceable right exists to set off current tax assets against current tax liabilities and the deferred tax assets and liabilities relate to the same taxable entity and the same taxation authority. Paladin and all its wholly-owned Australian resident entities are part of a tax-consolidated group under Australian tax law. (i) Leases The determination of whether an arrangement is or contains a lease is based on the substance of the arrangement and requires an assessment of whether the fulfilment of the arrangement is dependent on the use of a specific asset or assets and the arrangement conveys a right to use the asset. Leases in which a significant portion of the risks and rewards of ownership are retained by the lessor are classified as operating leases. Incentives received on entering into operating leases are recognised as liabilities. Lease payments are allocated between rental expense and reduction of the lease incentive liability on a straight line basis over the period of the lease. (j) Business Combinations Business combinations are accounted for using the acquisition method. The consideration transferred in a business combination shall be measured at fair value, which shall be calculated as the sum of the acquisition-date fair values of the assets transferred by the acquirer, the liabilities incurred by the acquirer to former owners of the acquiree and the equity issued by the acquirer, and the amount of any non-controlling interest in the acquiree. For each business combination, the acquirer measures the non-controlling interest in the acquiree either at fair value or at the proportionate share of the acquiree’s identifiable net assets. Acquisition-related costs are expensed as incurred. Prior to 1 July 2009 the purchase method of accounting was used to account for business combinations.
For
per
sona
l use
onl
y
122
PALADIN ENERGY LTD AND CONTROLLED ENTITIES NOTES TO THE CONSOLIDATED FINANCIAL STATEMENTS (continued)
FOR THE YEAR ENDED 30 JUNE 2013 __________________________________________________________________________________
294605_9
NOTE 3. SUMMARY OF SIGNIFICANT ACCOUNTING POLICIES (continued) (j) Business Combinations (continued) When the Group acquires a business, it assesses the financial assets and liabilities assumed for appropriate classification and designation in accordance with the contractual terms, economic conditions, the Group’s operating or accounting policies and other pertinent conditions as at the acquisition date. This includes the separation of embedded derivatives in host contracts by the acquiree. If the business combination is achieved in stages, the acquisition date fair value of the acquirer’s previously held equity interest in the acquiree is remeasured at fair value as at the acquisition date through profit or loss. Any contingent consideration to be transferred by the acquirer will be recognised at fair value at the acquisition date. Subsequent changes to the fair value of the contingent consideration which is deemed to be an asset or liability will be recognised in accordance with AASB 139 either in profit or loss or in other comprehensive income. If the contingent consideration is classified as equity, it shall not be remeasured. (k) Impairment of Assets Assets that have an indefinite useful life are not subject to amortisation and are tested annually for impairment. Assets that are subject to amortisation are reviewed for impairment whenever events or changes in circumstances indicate that the carrying amount may not be recoverable. An impairment loss is recognised for the amount by which the asset's carrying amount exceeds its recoverable amount. The recoverable amount is the higher of an asset's fair value less costs to sell and value in use. In assessing value in use, the estimated future cash flows are discounted to their present value using a pre-tax discount rate that reflects current market assessments of the time value of money and the risks specific to the asset. For the purposes of assessing impairment, assets are grouped at the lowest levels for which there are separately identifiable cash flows (cash generating units). (l) Cash and Cash Equivalents Cash and cash equivalents includes cash on hand, deposits held at call with financial institutions, other short-term, highly liquid investments with original maturities of three months or less that are readily convertible to known amounts of cash and which are subject to an insignificant risk of changes in value, and bank overdrafts. (m) Trade and Other Receivables Trade receivables, which generally have 30 day terms, are recognised initially at fair value and subsequently measured at amortised cost using the effective interest method, less an allowance for any uncollectible amounts. Collectability of trade receivables is reviewed on an ongoing basis. Debts that are known to be uncollectible are written off when identified. An allowance for doubtful debts is raised when there is objective evidence that the group will not be able to collect the debt. Financial difficulties of the debtor, default payments or debts more than 60 days overdue are considered objective evidence of impairment. (n) Inventories Consumable stores inventory are valued at the lower of cost and net realisable value using the weighted average cost method, after appropriate allowances for redundant and slow moving items. Finished goods and work in progress inventory are valued at the lower of cost and net realisable value using the weighted average cost method. Cost is derived on an absorption costing basis including both fixed and variable production costs and attributable overheads incurred up to the delivery point where legal title to the product passes. No accounting value is attributed to stockpiles containing ore at less than the cut-off grade.
For
per
sona
l use
onl
y
123
PALADIN ENERGY LTD AND CONTROLLED ENTITIES NOTES TO THE CONSOLIDATED FINANCIAL STATEMENTS (continued)
FOR THE YEAR ENDED 30 JUNE 2013 __________________________________________________________________________________
294605_9
NOTE 3. SUMMARY OF SIGNIFICANT ACCOUNTING POLICIES (continued) (n) Inventories (continued) Any inventory produced during the development phase is initially recognised at its deemed cost, being net realisable value and deducted from capitalised development costs. The costs of production include labour costs, materials and contractor expenses which are directly attributable to the extraction and processing of ore (including any recognised expense of stripping costs); the depreciation of property, plant and equipment used in the extraction and processing of ore; and production overheads. Inventory held for trading by Paladin Energy Ltd and Paladin Nuclear Ltd, the Group’s marketing entity, is valued at the lower of actual cost and net realisable value, using a blend of spot and forecast prices. (o) Investments and Other Financial Assets The Group classifies its investments and other financial assets in the following categories: loans and receivables, held-to-maturity investments, available-for-sale financial assets and financial assets held for trading. The classification depends on the purpose for which the investments were acquired. Management determines the classification of its investments at initial recognition.
Classification (i) Loans and Receivables Loans and receivables are non-derivative financial assets with fixed or determinable payments that are not quoted in an active market. They arise when the Group provides money, goods or services directly to a debtor with no intention of selling the receivable. They are included in current assets, except for those with maturities greater than 12 months after the balance sheet date which are classified as non current assets. Loans and receivables are included in receivables in the Statement of Financial Position. Loans and receivables are carried at amortised cost using the effective interest method. (ii) Held-to-Maturity Investments Held-to-maturity investments are non-derivative financial assets with fixed or determinable payments and fixed maturities that the Group's management has the positive intention and ability to hold to maturity. Held-to-maturity investments are carried at amortised cost using the effective interest method. (iii) Available-for-Sale Financial Assets Available-for-sale financial assets, comprising principally marketable equity securities, are non-derivatives that are either designated in this category or not classified in any of the other categories. They are included in non current assets unless management intends to dispose of the investment within 12 months of the balance date. Purchases and sales of investments are recognised on trade-date which is the date on which the Group commits to purchase or sell the asset. Investments are initially recognised at fair value plus transaction costs. Financial assets are de-recognised when the rights to receive cash flows from the financial assets have expired or have been transferred and the Group has transferred substantially all the risks and rewards of ownership. Available-for-sale financial assets are subsequently carried at fair value. Unrealised gains and losses which arise from changes in the fair value of non monetary securities classified as available-for-sale are recognised in other comprehensive income. When securities classified as available-for-sale are sold or impaired, the accumulated fair value adjustments are included in the Income Statement as gains and losses from investment securities.
For
per
sona
l use
onl
y
124
PALADIN ENERGY LTD AND CONTROLLED ENTITIES NOTES TO THE CONSOLIDATED FINANCIAL STATEMENTS (continued)
FOR THE YEAR ENDED 30 JUNE 2013 __________________________________________________________________________________
294605_9
NOTE 3. SUMMARY OF SIGNIFICANT ACCOUNTING POLICIES (continued) (o) Investments and Other Financial Assets (continued) (iv) Financial Assets Held for Trading Financial assets are classified as held for trading if they are derivative instruments or acquired for the purpose of selling in the near term. Gains or losses on investments held for trading are recognised in the Statement of Comprehensive Income. (v) Fair value of Financial Instruments The fair values of quoted investments are based on current bid prices. If the market for a financial asset or liability is not active (and for unlisted securities), the Group establishes fair value by using valuation techniques. These include reference to the fair values of recent arm's length transactions, involving the same instruments or other instruments that are substantially the same, discounted cash flow analysis, and option pricing models refined to reflect the issuer's specific circumstances. The nominal value less estimated adjustments of trade receivables and payables are assumed to approximate their fair values. (vi) Impairment of Financial Instruments The Group assesses at each balance date whether there is objective evidence that a financial asset or group of financial assets is impaired. In the case of equity securities classified as available-for-sale, a significant or prolonged decline in the fair value of a security below its cost is considered in determining whether the security is impaired. If any such evidence exists for available-for-sale financial assets, the cumulative loss which is measured as the difference between the acquisition cost and the current fair value, less any impairment loss on that financial asset previously recognised in profit and loss is removed from equity and recognised in the Income Statement. Any subsequent increase in value is recognised in equity. (p) Interests in Jointly Controlled Assets The Group has interests in joint ventures that are jointly controlled assets. A joint venture is a contractual arrangement whereby two or more parties undertake an economic activity that is subject to joint control. A jointly controlled asset involves use of assets and other resources of the venturers rather than establishment of a separate entity. The Group recognises its interest in jointly controlled assets by recognising its interest in the assets and the liabilities of the joint venture. The Group also recognises the expenses that it incurs and its share of the income that it earns from the sale of goods or services by jointly controlled assets. (q) Property, Plant and Equipment All property, plant and equipment are stated at historical cost less accumulated depreciation and impairment losses. Historical cost includes expenditure that is directly attributable to the acquisition of the items. Subsequent costs are included in the asset's carrying amount or recognised as a separate asset, as appropriate, only when it is probable that future economic benefits associated with the item will flow to the Group and the cost of the item can be measured reliably. All other repairs and maintenance are charged to the Income Statement during the financial period in which they are incurred. Property, plant and equipment costs include both the costs associated with construction of equipment associated with establishment of an operating mine, and the estimated costs of dismantling and removing the asset and restoring the site on which it is located. Land is not depreciated. Depreciation on other assets is calculated using either the unit of production basis or the straight line method to allocate their cost amount, net of their residual values, over their estimated useful lives, as follows:
For
per
sona
l use
onl
y
125
PALADIN ENERGY LTD AND CONTROLLED ENTITIES NOTES TO THE CONSOLIDATED FINANCIAL STATEMENTS (continued)
FOR THE YEAR ENDED 30 JUNE 2013 __________________________________________________________________________________
294605_9
NOTE 3. SUMMARY OF SIGNIFICANT ACCOUNTING POLICIES (continued) (q) Property, Plant and Equipment (continued)
Buildings 20 years
Databases 10 years
Plant and equipment 2-6 years
Leasehold improvements 7 years
Mine plant and equipment lesser of life of asset and unit of production basis An asset's carrying amount is written down immediately to its recoverable amount if the asset's carrying amount is greater than its estimated recoverable amount. Gains and losses on disposals are determined by comparing proceeds with carrying amounts. These are included in the Income Statement. When revalued assets are sold, it is Group policy to transfer the amounts included in other reserves in respect of those assets to retained earnings. (r) Mine Development Pre-production costs are deferred as development costs until such time as the asset is capable of being operated in a manner intended by management. Post-production costs are recognised as a cost of production. Overburden cost is capitalised and depreciated on a units of production basis. Stripping costs are recognised as a production cost as incurred. (s) Exploration and Evaluation Expenditure Exploration and evaluation expenditure related to areas of interest is capitalised and carried forward to the extent that: (i) rights to tenure of the area of interest are current; and
(ii) costs are expected to be recouped through successful development and exploitation of the area
of interest or alternatively by its sale. Exploration and evaluation expenditure is allocated separately to specific areas of interest. Such expenditure comprises net direct costs and an appropriate portion of related overhead expenditure directly related to activities in the area of interest. Costs related to the acquisition of properties that contain Mineral Resources are allocated separately to specific areas of interest. If costs are not expected to be recouped through successful development and exploitation of the area of interest or alternatively by sale, costs are expensed in the period in which they are incurred. Exploration and evaluation expenditure that is capitalised is included as part of cash flows from investing activities whereas exploration and evaluation expenditure that is expensed is included as part of cash flows from operating activities. When a decision to proceed to development is made the exploration and evaluation capitalised to that area is transferred to mine development. All costs subsequently incurred to develop a mine prior to the start of mining operations within the area of interest are capitalised and carried at cost. These costs include expenditure incurred to develop new ore bodies within the area of interest, to define further mineralisation in existing areas of interest, to expand the capacity of a mine and to maintain production.
For
per
sona
l use
onl
y
126
PALADIN ENERGY LTD AND CONTROLLED ENTITIES NOTES TO THE CONSOLIDATED FINANCIAL STATEMENTS (continued)
FOR THE YEAR ENDED 30 JUNE 2013 __________________________________________________________________________________
294605_9
NOTE 3. SUMMARY OF SIGNIFICANT ACCOUNTING POLICIES (continued) (s) Exploration and Evaluation Expenditure (continued) Capitalised amounts for an area of interest may be written down to its recoverable amount if the area of interest’s carrying amount is greater than its estimated recoverable amount. (t) Intangibles
Intangible assets acquired separately or in a business combination are initially measured at cost. The cost of an intangible asset acquired in a business combination is its fair value as at the date of acquisition. Following initial recognition, intangible assets are carried at cost less any accumulated amortisation and any accumulated impairment losses. Internally generated intangible assets, excluding capitalised development costs, are not capitalised and expenditure is recognised in the Income Statement in the year in which the expenditure is incurred. The useful lives of intangible assets are assessed to be either finite or indefinite. Intangible assets with finite lives are amortised over the useful life and tested for impairment whenever there is an indication that the intangible asset may be impaired. The amortisation period and the amortisation method for an intangible asset with a finite useful life are reviewed at least at each financial year-end. Changes in the expected useful life or the expected pattern of consumption of future economic benefits embodied in the asset are accounted for prospectively by changing the amortisation period or method, as appropriate, which is a change in accounting estimate. The amortisation expense on the intangible assets with finite lives is recognised in profit or loss in the expense category consistent with the function of the intangible asset. Intangible assets with indefinite useful lives are tested for impairment annually either individually or at the cash-generating unit level. Such intangibles are not amortised. The useful life of an intangible asset with an indefinite life is reviewed each reporting period to determine whether indefinite life assessment continues to be supportable. If not, the change in the useful life assessment from indefinite to finite is accounted for as a change in an accounting estimate and is thus accounted for on a prospective basis. A summary of the policies applied to the Group’s intangible assets is as follows: Right to use water and power supply Useful lives Life of mine Amortisation method used Amortised over the life of the mine on a unit of production basis Impairment testing Annually and more frequently when an indication of impairment
exists. The amortisation method is reviewed at each financial year-end.
The rights to use water and power supply have been granted for a minimum of 17 years from April 2007 by the relevant utilities with the option of renewal without significant cost at the end of this period. Kayelekera Mining Lease Useful lives Finite Amortisation method used Amortised over the life of the mine on a straight-line basis. Impairment testing Annually and more frequently when an indication of impairment
exists. The amortisation method is reviewed at each financial year-end.
For
per
sona
l use
onl
y
127
PALADIN ENERGY LTD AND CONTROLLED ENTITIES NOTES TO THE CONSOLIDATED FINANCIAL STATEMENTS (continued)
FOR THE YEAR ENDED 30 JUNE 2013 __________________________________________________________________________________
294605_9
NOTE 3. SUMMARY OF SIGNIFICANT ACCOUNTING POLICIES (continued) (t) Intangibles (continued) Gains or losses arising from derecognition of an intangible asset are measured as the difference between the net disposal proceeds and the carrying amount of the asset and are recognised in the Statement of Comprehensive Income when the asset is derecognised. (u) Trade and Other Payables
Trade payables and other payables are carried at amortised cost and represent liabilities for goods and services provided to the Group prior to the end of the financial year that are unpaid and arise when the Group becomes obliged to make future payments in respect of the purchase of these goods and services. The amounts are unsecured and are usually paid within 30 days of recognition. (v) Interest Bearing Loans and Borrowings Bank loan borrowings are initially recognised at fair value, net of transaction costs incurred. Bank loan borrowings are subsequently measured at amortised cost. Any difference between the proceeds (net of transaction costs) and the redemption amount is recognised in the Income Statement over the period of the borrowings using the effective interest method. The component of convertible bonds that exhibits characteristics of debt is recognised as a liability in the Statement of Financial Position, net of transaction costs. On issue of convertible bonds, the fair value of the liability component is determined using a market rate for an equivalent non-convertible bond and this amount is carried as a liability on the amortised cost basis until extinguished on conversion or redemption. The increase in the liability due to the passage of time is recognised as a finance cost. The remainder of the proceeds is allocated to the equity component and is recognised in shareholders’ equity. The carrying amount of the equity component is not remeasured in subsequent years. Borrowings are classified as current liabilities unless the Group has an unconditional right to defer settlement of the liability for at least 12 months after the balance sheet date. (w) Borrowing Costs Borrowing costs incurred for the construction of any qualifying asset are capitalised during the period of time that is required to complete and prepare the asset for its intended use or sale. Other borrowing costs are expensed as incurred including the unwinding of discounts related to mine closure provisions. The capitalisation rate used to determine the amount of borrowing costs to be capitalised is the weighted average interest rate applicable to the entity's outstanding borrowings during the year. (x) Employee Benefits (i) Wages and Salaries, Annual Leave and Sick Leave Liabilities for wages and salaries, including non-monetary benefits, annual leave and accumulating sick leave due to be settled within 12 months of the reporting date are recognised as a current liability in respect of employees' services up to the reporting date and are measured at the amounts expected to be paid when the liabilities are settled. Liabilities for non-accumulating sick leave are recognised when the leave is taken and measured at the rates paid or payable. (ii) Long Service Leave
The liability for long service leave is recognised in the provision for employee benefits and measured as the present value of expected future payments to be made in respect of services provided by employees up to the reporting date. Consideration is given to expected future wage and salary levels, experience of employee departures and periods of service. Expected future payments are discounted using market yields at the reporting date on national government bonds with terms to maturity and currency that match, as closely as possible, the estimated future cash outflows.
For
per
sona
l use
onl
y
128
PALADIN ENERGY LTD AND CONTROLLED ENTITIES NOTES TO THE CONSOLIDATED FINANCIAL STATEMENTS (continued)
FOR THE YEAR ENDED 30 JUNE 2013 __________________________________________________________________________________
294605_9
NOTE 3. SUMMARY OF SIGNIFICANT ACCOUNTING POLICIES (continued) (x) Employee Benefits (continued) (iii) Long-Term Incentive Plan The liability for the retention programme is recognised in the provision for employee benefits as the present value of expected future payments to be made in respect of the retention bonus programme. Consideration is given to expected future salary levels and experience of employee departures. Expected future payments are discounted using market yields at the reporting date on national government bonds with terms of maturity and currency that match, as closely as possible, the estimated future cash outflows. Projected unit credit method has been used to calculate the provision. (iv) Share-Based Payments Share-based compensation benefits were provided to employees via the Paladin Executive Share Option Plan (EXSOP). Following the implementation of the Employee Performance Share Rights Plan and the Contractor Performance Share Rights Plan (Rights Plans) detailed in Note 26, no further options will be granted pursuant to the EXSOP. The fair value of options granted under both the EXSOP and rights under the Rights Plans are recognised as an employee benefit expense with a corresponding increase in equity. The fair value is measured at grant date and recognised over the period during which the employees become unconditionally entitled to the options or rights. The fair value of options and rights at grant date is independently determined using the Black-Scholes valuation model that takes into account the exercise price, the term of the option or right, the vesting and performance criteria, the impact of dilution, the non-tradeable nature of the option or right, the share price at grant date and expected price volatility of the underlying share, the expected dividend yield and the risk-free interest rate for the term of the option. The Monte-Carlo model is used to model the future value of the Company’s shares and the movement of the comparator companies’ Total Shareholder Return (TSR) on the various vesting dates associated with vesting requirements of the options. The rights with a non-market based performance condition (time based and EPS) were valued using a Black-Scholes valuation model. The rights that contained a market based performance condition (TSR and market price) were valued using a Monte-Carlo simulation model. Non-market vesting conditions are included in assumptions about the number of options or rights that are expected to become exercisable or granted. At each balance date, the entity revises its estimate of the number of options and rights that are expected to become exercisable. The employee benefit expense recognised each period takes into account the most recent estimate. Upon the exercise of options or the grant of rights, the balance of the share-based payments reserve relating to those options is transferred to share capital. The Group measures the cost of equity-settled transactions with other parties by reference to the fair value of the goods or services received. Where the fair value of the goods or services cannot be reliably determined, or where the goods or services cannot be identified, the Group measures the cost of the transaction by reference to the fair value of the equity instruments granted.
For
per
sona
l use
onl
y
129
PALADIN ENERGY LTD AND CONTROLLED ENTITIES NOTES TO THE CONSOLIDATED FINANCIAL STATEMENTS (continued)
FOR THE YEAR ENDED 30 JUNE 2013 __________________________________________________________________________________
294605_9
NOTE 3. SUMMARY OF SIGNIFICANT ACCOUNTING POLICIES (continued) (y) Mine Closure and Rehabilitation Mine closure and restoration costs include the costs of dismantling and demolition of infrastructure or decommissioning, the removal of residual material and the remediation of disturbed areas specific to the infrastructure. Mine closure costs are provided for in the accounting period when the obligation arising from the related disturbance occurs, whether this occurs during the mine development or during the production phase, based on the net present value of estimated future costs. As the value of the provision for mine closure represents the discounted value of the present obligation to restore, dismantle and close the mine, the increase in this provision due to the passage of time is recognised as a finance cost. The discount rate used is a pre-tax rate that reflects the current market assessment of the time value of money and the risks specific to the liability. Provision is made for rehabilitation work when the obligation arises and this is recognised as a cost of production or development. The rehabilitation costs, provided for are the present value of the estimated costs to restore operating locations. The value of the provision represents the discounted value of the current estimate to restore and the discount rate used is the pre-tax rate that reflects the current market assessments of the time value of money and the risks specific to the liability. (z) Onerous Contracts A provision for onerous contracts is recognised when the expected benefits to be derived by the Group from a contract are lower than the unavoidable cost of meeting the obligations under the contract. The provision is stated at the present value of the future net cash outflows expected to be incurred in respect of the contract. (aa) Contributed Equity Ordinary shares are classified as equity. Incremental costs directly attributable to the issue of new shares or options are shown in equity as a deduction, net of tax, from the proceeds. (ab) Earnings Per Share (i) Basic Earnings Per Share Basic earnings per share are calculated by dividing the profit attributable to equity holders of the Company by the weighted average number of ordinary shares outstanding during the period. (ii) Diluted Earnings Per Share Diluted earnings per share adjusts the figures used in the determination of basic earnings per share to take into account the after income tax effect associated with dilutive potential ordinary shares and the weighted average number of shares assumed to have been issued for no consideration in relation to dilutive potential ordinary shares.
For
per
sona
l use
onl
y
130
PALADIN ENERGY LTD AND CONTROLLED ENTITIES NOTES TO THE CONSOLIDATED FINANCIAL STATEMENTS (continued)
FOR THE YEAR ENDED 30 JUNE 2013 __________________________________________________________________________________
294605_9
NOTE 4. SEGMENT INFORMATION Identification of Reportable Segments The Company has identified its operating segments to be Exploration, Namibia and Malawi, on the basis of the nature of the activity and geographical location and different regulatory environments. The main segment activity in Namibia and Malawi is the production and sale of uranium from the mines located in these geographic regions. The Exploration segment is focused on developing exploration and evaluation projects in Australia, Niger and Canada. Unallocated portion covers the Company’s sales and marketing, treasury, corporate and administration. Discrete financial information about each of these operating segments is reported to the Group’s executive management team (chief operating decision makers) on at least a monthly basis. The accounting policies used by the Group in reporting segments internally are the same as those contained in Note 3 to the accounts and in the prior period. Inter-entity sales are priced with reference to the spot rate. Corporate charges comprise non-segmental expenses such as corporate office expenses. A proportion of the corporate charges are allocated to Namibia and Malawi on the basis of timesheet allocations with the balance remaining in Unallocated. The following items are not allocated to segments as they are not considered part of the core operations of any segment:
Interest revenue
Non project finance interest and borrowing expense
Unallocated corporate and labour costs
The Group’s customers are major utilities and other entities located mainly in USA, Australia, China, Taiwan and UK. These revenues are attributed to the geographic location of the mines being the reporting segments Namibia and Malawi.
For
per
sona
l use
onl
y
131
PALADIN ENERGY LTD AND CONTROLLED ENTITIES NOTES TO THE CONSOLIDATED FINANCIAL STATEMENTS (continued)
FOR THE YEAR ENDED 30 JUNE 2013 __________________________________________________________________________________
294605_9
NOTE 4. SEGMENT INFORMATION (continued) The following tables present revenue, expenditure and asset information regarding operating segments for the years ended 30 June 2013 and 30 June 2012. Year ended 30 June 2013
Exploration US$M
Namibia US$M
Malawi US$M
Unallocated US$M
ConsolidatedUS$M
Sales to external customers - 265.4 143.0 - 408.4 Other revenue - - 1.9 1.2 3.1 Inter segment sales - 9.9 4.9 - 14.8 Total segment revenue - 275.3 149.8 1.2 426.3 Elimination of inter segment sales - (9.9) (4.9) - (14.8) Total consolidated revenue - 265.4 144.9 1.2 411.5 Cost of goods sold - (214.8) (140.8) - (355.6) Impairment of inventory - - (30.9) - (30.9) Gross Profit/(Loss) - 50.6 (26.8) 1.2 25.0 Other expenses (0.7) (1.3) (12.2) (27.6) (41.8) Impairment of asset (62.1) - (237.9) (5.0) (305.0) Segment (loss)/profit before income tax and finance costs
(62.8)
49.3
(276.9)
(31.4)
(321.8)
Finance costs - (7.1) (6.4) (50.3) (63.8) (Loss)/profit before income tax (62.8) 42.2 (283.3) (81.7) (385.6) Income tax benefit/(expense) 0.2 (1.4) (85.0) (2.2) (88.4) (Loss)/profit after income tax (62.6) 40.8 (368.3) (83.9) (474.0) At 30 June 2013
Segment assets/total assets 1,009.3 639.1 140.2 49.1 1,837.7 Australia
US$M Canada
US$M Malawi US$M
Namibia US$M
Other US$M
Consolidated US$M
Non current assets by country* 757.3 262.4 - 483.2 0.1 1,503.0 In 2013, the two most significant customers equated on a proportionate basis to 25% (US$101.0M Namibia, Malawi) and 18% (US$71.5M Namibia) of the Group’s total sales revenue.
For
per
sona
l use
onl
y
132
PALADIN ENERGY LTD AND CONTROLLED ENTITIES NOTES TO THE CONSOLIDATED FINANCIAL STATEMENTS (continued)
FOR THE YEAR ENDED 30 JUNE 2013 __________________________________________________________________________________
294605_9
NOTE 4. SEGMENT INFORMATION (continued)
Year ended 30 June 2012
Exploration US$M
Namibia US$M
Malawi US$M
Unallocated US$M
ConsolidatedUS$M
Sales to external customers - 239.2 126.6 - 365.8 Other revenue - - - 1.6 1.6 Inter segment sales - 15.1 - - 15.1 Total segment revenue - 254.3 126.6 1.6 382.5 Elimination of inter segment sales - (15.1) - - (15.1) Total consolidated revenue - 239.2 126.6 1.6 367.4 Cost of goods sold - (172.6) (129.1) - (301.7) Impairment of inventory - - (39.0) - (39.0) Gross Profit/(Loss) - 66.6 (41.5) 1.6 26.7 Other expenses (1.3) (6.2) (23.1) (32.9) (63.5) Impairment of asset - - (178.0) (8.0) (186.0) Segment (loss)/profit before income tax and finance costs
(1.3)
60.4
(242.6)
(39.3)
(222.8)
Finance costs - (7.8) (7.5) (41.4) (56.7) (Loss)/profit before income tax (1.3) 52.6 (250.1) (80.7) (279.5) Income tax benefit/(expense) 0.4 (4.2) 65.2 17.3 78.7 (Loss)/profit after income tax (0.9) 48.4 (184.9) (63.4) (200.8) At 30 June 2012
Non current assets by country* 863.4 260.0 233.5 461.9 36.8 1,855.6 In 2012, the two most significant customers equated on a proportionate basis to 22% (US$79.9M Namibia, Malawi) and 11% (US$41.0M Namibia, Malawi) of the Group’s total sales revenue. * Excluding deferred tax assets and financial instruments.
For
per
sona
l use
onl
y
133
PALADIN ENERGY LTD AND CONTROLLED ENTITIES NOTES TO THE CONSOLIDATED FINANCIAL STATEMENTS (continued)
FOR THE YEAR ENDED 30 JUNE 2013 __________________________________________________________________________________
294605_9
NOTE 5. REVENUES AND EXPENSES 2013
US$M 2012 US$M
(a) Revenue Sale of uranium 408.4 365.8 Interest income from non-related parties 0.9 1.4 Other revenue 2.2 0.2 Total 411.5 367.4 (b) Cost of Sales Production costs before depreciation and amortisation (305.8) (256.7) Depreciation and amortisation (56.7) (49.3) Impairment loss reversed on sale of inventory 32.2 23.4 Product distribution costs (12.9) (11.6) Royalties (12.4) (10.3) Total (355.6) (304.5) (c) Other Income Foreign exchange gain (net) 1.4 1.4 Profit on convertible bond buyback - 1.2 Gain on disposal of available for sale investments 1.6 - Total 3.0 2.6 (d) Administration, Marketing and Non-Production Costs Corporate and marketing (21.9) (21.0) Restructure costs (0.3) - Mine sites (LHM & KM) (8.5) (10.9) Canadian operations (0.4) (2.5) Non-cash – share-based payments (3.9) (6.9) Non-cash - depreciation (1.9) (2.1) LHM Stage 4 expansion study (1.1) (3.6) KM research and development (1.5) - Total (39.5) (47.0) (e) Other Expenses Impairment of exploration assets (62.1) - Impairment for available for sale financial assets (5.0) (8.0)KM fixed costs during plant shutdown (3.7) (9.7) Impairment of asset (1) (237.9) (178.0) KM Slope remediation (2) (0.2) (3.3) KM medical expenses (3) - (0.8) Total (308.9) (199.8) (1) The continued deterioration of the uranium price has resulted in a reduction of the carrying value
to the recoverable amount of US$Nil of the KM assets from US$237.9M resulting in an impairment charge of US$237.9M (2012: US$178.0M).
(2) Slope remediation expenditure expensed prior to the outcome of the insurance claim. Claim settled in June 2013 with proceeds reflected in ‘other income’.
(3) KM medical expenditure expensed pending the outcome of an insurance claim currently with the underwriter.
For
per
sona
l use
onl
y
134
PALADIN ENERGY LTD AND CONTROLLED ENTITIES NOTES TO THE CONSOLIDATED FINANCIAL STATEMENTS (continued)
FOR THE YEAR ENDED 30 JUNE 2013 __________________________________________________________________________________
294605_9
NOTE 5. REVENUES AND EXPENSES (continued) 2013
US$M 2012 US$M
(f) Finance Costs Interest expense (40.7) (36.4) Accretion relating to convertible bonds (non-cash) (17.7) (12.9) Mine closure provision discount interest expense (2.1) (1.8) Facility costs (3.3) (5.6) Total (63.8) (56.7) Total depreciation and amortisation expense for the year included in the Consolidated Income Statement is US$52.1M (2012: US$51.4M).
For
per
sona
l use
onl
y
135
PALADIN ENERGY LTD AND CONTROLLED ENTITIES NOTES TO THE CONSOLIDATED FINANCIAL STATEMENTS (continued)
FOR THE YEAR ENDED 30 JUNE 2013 __________________________________________________________________________________
294605_9
NOTE 6. INCOME TAX 2013
US$M 2012 US$M
(a) Income Tax Benefit/(Expense) Current income tax Current income tax benefit/(expense) 1.3 (0.1) Deferred income tax Related to the origination and reversal of temporary differences (7.2) 59.7 De-recognising of Malawi deferred tax assets (82.3) - Tax benefits previously not recognised now recognised 0.2 11.9 Adjustments relating to prior period (0.4) 7.2
Income tax (expense)/benefit reported in the Income Statement
(88.4)
78.7
(b) Amounts Charged or Credited Directly to Equity Deferred income tax related to items charged or credited directly to equity: Unrealised loss on available-for-sale investments - 3.3 Convertible bonds - (13.3) Changes in foreign exchange 17.7 5.6 Other and prior period 2.3 4.9 Income tax benefit reported in equity
20.0
0.5
(c) Numerical Reconciliation of Income Tax Benefit to Prima Facie Tax Payable
Loss before income tax expense 385.6 279.5 Tax at the Australian tax rate of 30% (2012 – 30%)
115.7
83.8
Tax effect of amounts which are not deductible/ (taxable) in calculating taxable income:
Share-based payments (1.2) (1.8) Convertible bonds (0.1) - Permanent foreign exchange differences 48.4 114.9 Other expenditure not allowable (0.9) (1.5) 161.9 195.4 Difference in overseas tax rates (6.6) (9.5) Under/over prior year adjustment 5.8 7.2 Losses not recognised/(derecognised) (105.4) (1.7) Other foreign exchange differences (119.0) (111.3) Other (25.1) (1.4) Income tax (expense)/benefit reported in the Income Statement
(88.4)
78.7
F
or p
erso
nal u
se o
nly
136
PALADIN ENERGY LTD AND CONTROLLED ENTITIES NOTES TO THE CONSOLIDATED FINANCIAL STATEMENTS (continued)
FOR THE YEAR ENDED 30 JUNE 2013 __________________________________________________________________________________
294605_9
NOTE 6. INCOME TAX (continued) 2013
US$M 2012 US$M
(d) Deferred Income Tax Deferred tax liabilities Accelerated prepayment deduction for tax purposes 0.6 0.9 Accelerated depreciation for tax purposes 116.6 157.8 Exploration expenditure 22.2 23.7 Recognition of acquired exploration expenditure 157.5 175.2 Capitalised interest 1.3 6.1 Convertible bond 15.1 20.5
Gross deferred tax liabilities 313.3 384.2Set off of deferred tax assets (126.4) (180.7) Net deferred tax liabilities 186.9 203.5 Deferred tax assets Revenue losses available for offset against future taxable income (67.8) (167.5) Equity raising costs (1.7) (1.8) Provisions for employee benefits (0.7) (0.5) Inventory 2.4 (1.8) Available for sale securities (11.6) (9.2) Accruals (11.5) (5.2) Foreign currency balances (32.3) (13.4) Interest bearing liabilities (3.0) (66.0) Other (0.2) (0.3) Gross deferred tax assets (126.4) (265.7) Set off against deferred tax liabilities 126.4 180.7 Net deferred tax assets recognised - (85.0) The net deferred tax assets recognised are in respect of revenue losses expected to be offset against future taxable income.
For
per
sona
l use
onl
y
137
PALADIN ENERGY LTD AND CONTROLLED ENTITIES NOTES TO THE CONSOLIDATED FINANCIAL STATEMENTS (continued)
FOR THE YEAR ENDED 30 JUNE 2013 __________________________________________________________________________________
294605_9
NOTE 6. INCOME TAX (continued) 2013
US$M 2012 US$M
(e) Tax Losses Australian unused tax losses for which no deferred tax asset has been recognised (278.8) (208.7) Other unused tax losses for which no deferred tax asset has been recognised(1) (253.0) (6.2) Total unused tax losses for which no deferred tax asset has been recognised (531.8) (214.9) Potential tax benefit at the Australian tax rate of 30% (159.6) (64.5) (1) Includes US$5.3M losses in Canada with expiry dates commencing in 2032 This benefit for tax losses will only be obtained if:
(i) the Consolidated Entities derive future assessable income of a nature and of an amount sufficient to enable the benefit from the deductions for the losses to be realised;
(ii) the Consolidated Entities continue to comply with the conditions for deductibility imposed by tax legislation; and
(iii) no changes in tax legislation adversely affect the Consolidated Entities in realising the benefit from the deductions for the losses.
For
per
sona
l use
onl
y
138
PALADIN ENERGY LTD AND CONTROLLED ENTITIES NOTES TO THE CONSOLIDATED FINANCIAL STATEMENTS (continued)
FOR THE YEAR ENDED 30 JUNE 2013 __________________________________________________________________________________
294605_9
NOTE 7. CASH AND CASH EQUIVALENTS 2013
US$M 2012 US$M
Cash at bank and on hand 9.8 21.8 Short-term bank deposits 68.3 90.3 Total cash and cash equivalents 78.1 112.1
Total cash and cash equivalents includes US$25.7M (2012: US$26.2M) restricted for use in respect of the LHM and KM project finance facilities (refer to Note 16). Cash at bank earns interest at floating rates based on daily bank deposit rates. Short-term deposits are made for varying periods depending on the immediate cash requirements of the Group, and earn interest at the respective short-term deposit rates. (a) Reconciliation of Net Loss After Tax to Net Cash Flows Used in Operating Activities Net loss (474.0) (200.8) Adjustments for Depreciation and amortisation 52.1 51.4 Gain recognised on re-measurement to fair value - (1.2) Gain on disposal of investments (1.6) - Net exchange differences (3.5) (1.7) Share-based payments 4.2 7.2 Non-cash financing costs 22.1 20.4 Inventory impairment and obsolescence expense 30.9 39.0 Asset impairment 237.9 178.0 Available-for-sale asset impairment 5.0 8.0 Interest capitalised as property, plant and equipment - (3.3) Exploration impairment 62.1 - Changes in assets and liabilities Decrease in prepayments 1.0 5.5 Increase in trade and other receivables (4.1) (61.9) Increase/(decrease) in trade and other payables 0.4 (0.8) Increase in provisions 4.2 1.5 Increase in unearned revenues 200.0 - Increase in inventories (30.4) (88.4) Increase/(decrease) in deferred tax liabilities 3.2 (16.7) Decrease/(increase) in deferred tax assets 85.0 (62.0) Net cash flows provided by/(used in) operating activities 194.5 (125.8)
For
per
sona
l use
onl
y
139
PALADIN ENERGY LTD AND CONTROLLED ENTITIES NOTES TO THE CONSOLIDATED FINANCIAL STATEMENTS (continued)
FOR THE YEAR ENDED 30 JUNE 2013 __________________________________________________________________________________
294605_9
NOTE 8. TRADE AND OTHER RECEIVABLES
Notes 2013
US$M 2012 US$M
Current Trade receivables (a) 60.4 52.0 GST and VAT (b) 13.5 22.9 Sundry debtors 4.4 7.9 Total current receivables 78.3 82.8 (a) Trade receivables are non-interest bearing and are generally on 30 day terms. Carrying value
approximates fair value due to the short-term nature of the receivables. An allowance for doubtful debts is made when there is objective evidence that a trade receivable is impaired. No allowance has been recognised for the current year or the previous year.
(b) GST and VAT debtor relates to Australia, Namibia, Malawi, Netherlands and Canada. Non Current Sundry debtors 0.1 0.1 Total non current receivables 0.1 0.1
For
per
sona
l use
onl
y
140
PALADIN ENERGY LTD AND CONTROLLED ENTITIES NOTES TO THE CONSOLIDATED FINANCIAL STATEMENTS (continued)
FOR THE YEAR ENDED 30 JUNE 2013 __________________________________________________________________________________
294605_9
NOTE 9. INVENTORIES
2013
US$M 2012 US$M
Current Stores and consumables (at cost) 33.5 39.4 Stockpiles (at cost) 2.0 0.4 Stockpiles (at net realisable value) - 4.2 Work-in-progress (at cost) 2.3 2.2 Work-in-progress (at net realisable value) 11.4 11.3 Finished goods (at cost) 57.5 72.2 Finished goods (at net realisable value) 52.1 56.8 Total current inventories at the lower of cost and net realisable value 158.8 186.5 (a) Inventory Expense
Inventories sold recognised as an expense for the year ended 30 June 2013 totalled US$351.4M (2012: US$301.7M) for the Group as part of cost of goods sold. (b) Impairment of Inventory Expense
During 2013 inventory held at KM was reduced to net realisable value resulting in an impairment loss of US$22.1M (2012: US$31.9M) for the year, recognised in cost of sales. (c) Stores and Consumables Obsolescence Expense
During 2013 stores and consumables held at KM were reduced by US$Nil (2012: US$3.3M) due to obsolescence. This resulted in an obsolescence expense recognised in cost of sales. Non Current Stockpiles (at cost) 141.4 112.3 Stockpiles (at net realisable value) - 1.9 Total non current inventories at the lower of cost and net realisable value 141.4 114.2 Stockpiles at LHM and KM that are unlikely to be processed within 12 months of the balance date.
(a) Impairment of Inventory Expense
During 2013 inventory held at KM was reduced to net realisable value resulting in an impairment loss of US$8.8M (2012: US$3.8) for the year, recognised in cost of sales.
For
per
sona
l use
onl
y
141
PALADIN ENERGY LTD AND CONTROLLED ENTITIES NOTES TO THE CONSOLIDATED FINANCIAL STATEMENTS (continued)
FOR THE YEAR ENDED 30 JUNE 2013 __________________________________________________________________________________
294605_9
NOTE 10. OTHER FINANCIAL ASSETS
2013
US$M 2012 US$M
Non Current Available-for-sale financial assets 10.3 15.5 Total non current other financial assets 10.3 15.5
Available-for-Sale Financial Assets
The Group has an investment in DYL and at 30 June 2013 held 304,400,275 (2012: 224,934,461) fully paid ordinary shares. The holding of these fully paid ordinary shares represents a 19.5% interest at 30 June 2013 (2012: 19.9%) of the ordinary shares of DYL, a uranium explorer listed on ASX. The market value of the shares in DYL at 30 June 2013 is A$10.0M (US$9.2M) (2012: A$10.3M / US$10.5M) based on a share price of 3.3 Australian cents per share (2012: 4.6 Australian cents). In July 2012 the Group increased its interest in DYL from 19.9% to 23.4% following a non-renounceable entitlement issue by DYL which was partially underwritten by Paladin. For the quarter ended 30 September 2012, DYL was categorised as an investment in associate. During the quarter ended 31 December 2012 DYL issued shares which reduced the Group’s interest to 19.1%. As a consequence DYL ceased to be categorised as an investment in associate. The net accounting impact of this transaction was not material to the Group. On 14 March 2013 the remaining sub underwriting loan was converted into 7,201,993 shares which increased the Group’s interest to 19.5%. The Group also holds minor investments in other companies.
For
per
sona
l use
onl
y
142
PALADIN ENERGY LTD AND CONTROLLED ENTITIES NOTES TO THE CONSOLIDATED FINANCIAL STATEMENTS (continued)
FOR THE YEAR ENDED 30 JUNE 2013 __________________________________________________________________________________
294605_9
NOTE 11. PROPERTY, PLANT AND EQUIPMENT
2013
US$M 2012 US$M
Plant and equipment – at cost 704.8 700.6 Less accumulated depreciation and impairment (414.5) (223.1) Net carrying value plant and equipment 290.3 477.5 Land and buildings - at cost 11.4 11.4 Less accumulated depreciation (2.2) (1.8) Net carrying value land and buildings 9.2 9.6 Construction work in progress – at cost 4.3 5.3 Less impairment (2.8) (0.7) Net carrying value construction work in progress 1.5 4.6 Net carrying value property, plant and equipment 301.0 491.7 Property, Plant and Equipment Pledged as Security for Liabilities Refer to Note 16 for information on property, plant and equipment pledged as security. The continued deterioration of the uranium price has resulted in a reduction of the carrying value of KM to the recoverable amount of US$Nil resulting in an impairment loss of US$237.9M (2012: US$178.0M) which represents the write-down of KM assets including plant and equipment, construction work in progress, mine development (Note 12) and intangible assets (Note 14) to recoverable amount which is based on value in use. The individual recoverable amounts of the KM assets were assessed and were considered to be negligible. In determining the value in use the cash flows were discounted at a rate of 10.5% on a pre-tax basis, US$45/lb pricing was used and specific committed targeted cost optimisations were included. The value in use of the KM assets is highly sensitive to pricing. An increase in the uranium spot price in future periods may result in reversal of some or all of the impairment charge recognised.
For
per
sona
l use
onl
y
143
PALADIN ENERGY LTD AND CONTROLLED ENTITIES NOTES TO THE CONSOLIDATED FINANCIAL STATEMENTS (continued)
FOR THE YEAR ENDED 30 JUNE 2013 __________________________________________________________________________________
294605_9
NOTE 11. PROPERTY, PLANT AND EQUIPMENT (continued)
Reconciliations Reconciliations of the carrying amounts of each class of property, plant and equipment at the beginning and end of the year are set out below: Total
US$M
Plant and
EquipmentUS$M
Land and
Building US$M
Construction Work in
Progress US$M
2013 Net carrying value at start of year 491.7 477.5 9.6 4.6 Additions 34.4 24.9 - 9.5 Depreciation and amortisation expense (37.1) (36.7) (0.4) - Impairment of assets (186.2) (184.1) - (2.1) Reclassification of assets - 8.8 0.8 (9.6) Reclassification to mine development (0.9) - - (0.9) Disposal of assets (0.5) (0.1) (0.4) - Foreign currency translation (0.4) - (0.4) - Net carrying value at end of year 301.0 290.3 9.2 1.5 2012 Net carrying value at start of year 630.1 486.0 9.9 134.2 Additions 60.0 13.0 0.1 46.9 Depreciation and amortisation expense (41.8) (41.5) (0.3) - Impairment of assets (132.2) (131.5) - (0.7) Reclassification of assets - 175.7 0.1 (175.8) Reclassification to mine development (1) (23.3) (23.3) - - Reclassification to exploration (0.8) (0.8) - - Disposal of assets (0.1) (0.1) - - Foreign currency translation (0.2) - (0.2) - Net carrying value at end of year 491.7 477.5 9.6 4.6 (1)Tailings Dam at LHM transferred from plant & equipment to mine development of US$23.3M
For
per
sona
l use
onl
y
144
PALADIN ENERGY LTD AND CONTROLLED ENTITIES NOTES TO THE CONSOLIDATED FINANCIAL STATEMENTS (continued)
FOR THE YEAR ENDED 30 JUNE 2013 __________________________________________________________________________________
294605_9
NOTE 12. MINE DEVELOPMENT
2013
US$M 2012 US$M
Mine development – at cost 185.1 167.7 Less accumulated depreciation and impairment(1) (142.3) (79.4) Net carrying value – mine development 42.8 88.3 Net carrying value at start of year 88.3 106.6 Additions 13.9 11.1 Depreciation and amortisation expense (14.9) (14.5) Effects in changes of underlying assumptions & discount rates 2.3 3.6 Reclassification from exploration - 0.1 Reclassification from property, plant and equipment(2) 0.8 23.3 Impairment (47.6) (41.9) Net carrying value at end of year 42.8 88.3 (1)Refer to Note 11 for details of impairment. (2)Tailings Dam at LHM transferred from plant & equipment to mine development of US$23.3M. Canadian securities law requires the following description of the Group’s interests in mineral property tenements: Langer Heinrich Mine (Namibia) - Paladin 100%
LHM consists of one mining licence – ML 140 - covering 4,375 hectares in the Namib Naukluft Desert 180km west of Windhoek, the capital of Namibia, and 80km east of the major seaport of Walvis Bay. The licence was granted on 26 July 2005 for a 25 year term expiring on 25 August 2030. Rights conferred by the licence include the right to mine and sell base and rare metals and nuclear fuel groups of minerals and to carry out prospecting operations. The project was purchased from Acclaim Uranium NL in August 2002. LHM is owned through a wholly owned Namibian entity, LHUPL. Construction of the processing plant was commenced in late 2005 with staged commissioning being completed in December 2006. Following an extended ramp-up phase the plant and mine achieved nameplate production in 2007. Construction of the Stage 2 expansion to 3.7Mlb pa commenced in CY2008 and design capacity was reached in December 2009. The plant consistently operated at the 3.7Mlb pa rate from the beginning of CY2010. Construction of the Stage 3 expansion to 5.2Mlb commenced at the beginning of CY2010 and was completed at 31 March 2012. Commercial production was declared from 1 April 2012. The plant has achieved Stage 3 design and further optimisation work will continue. LHUPL also holds an exclusive prospecting licence, EPL 3500, covering 30km2 to the west of the mining licence. LHUPL has applied to convert this prospecting licence into a mining licence. Kayelekera Mine (Malawi) - Paladin 85%
KM consists of one mining licence - ML 152 - covering 5,550 hectares in northern Malawi 440km north of Lilongwe, the capital of Malawi, and 52km west, by road of the provincial town of Karonga on the shore of Lake Malawi. The licence was granted on 2 April 2007 for a 15 year term expiring on 1 April 2022. Rights conferred by the licence include the exclusive right to mine and sell uranium and associated minerals. The Group acquired its interest in the Kayelekera project in February 1998 when it entered into a joint venture with Balmain Resources Pty Ltd, a private company based in Perth, Western Australia. In 2000 the Group increased its interest in the Kayelekera project to 90% and in July 2005 acquired the remaining 10% interest held by Balmain Resources Pty Ltd. Paladin’s interest in KM is held through a Malawian entity, PAL, in which the Government of Malawi has a 15% interest.
For
per
sona
l use
onl
y
145
PALADIN ENERGY LTD AND CONTROLLED ENTITIES NOTES TO THE CONSOLIDATED FINANCIAL STATEMENTS (continued)
FOR THE YEAR ENDED 30 JUNE 2013 __________________________________________________________________________________
294605_9
NOTE 12. MINE DEVELOPMENT (continued) A Development Agreement was entered into between the Government of Malawi and PAL in which the Government of Malawi received a 15% interest in PAL. Subsequent to the Development Agreement and the acceptance of the project’s Environmental Impact Assessment the Government of Malawi granted the mining licence covering the project area to PAL. Construction of the plant was commenced in 2007 and the mine was officially opened in April 2009. The processing facility achieved commercial production at the end of June 2010. Additional resource definition drilling has been carried out to the west of the current pit design to confirm the final pit limits. Applications for renewal of four exclusive prospecting licences in northern Malawi covering 916km2 surrounding and to the south of the KM mining licence have been lodged. An additional EPL has been applied for to the north adjacent to the Tanzanian border. NOTE 13. EXPLORATION AND EVALUATION EXPENDITURE Canadian securities law requires the following description of the Group’s interests in mineral property tenements: Michelin Project (Canada) - Paladin 100% On 1 February 2011 the Company completed the acquisition of the uranium assets of Aurora Energy Resources Inc. (Aurora) from Fronteer Gold Inc. The project covers approximately 81,200ha. Included in the total are 28 map staked licences and 6 quarry licences. An additional 4 map staked licences were staked along a proposed infrastructure corridor from the settlement of North West River. All licences are held in the name of Aurora. All licences are in good standing. The Labrador Inuit Land Claims agreement was ratified by the Inuit in May 2004 leading to the formation of the Inuit Government on 1 December 2005. The agreement created two categories of land: the Labrador Inuit Settlement Area (LISA) and Labrador Inuit Lands (LIL). A significant portion of the project area is covered by LISA lands. During 2008 the Nunatsiavut Government imposed a 3 year moratorium on mining uranium on properties located within the LISA, effective initially until the 31 March 2011. In December 2011, the Nunatsiavut Government voted to lift the three year moratorium of the mining, development and production of uranium on Labrador Inuit land. In March 2012, the Government enacted an amendment to the Labrador Inuit Lands Act, finally lifting that moratorium. The project area has a 2% net sales royalty from uranium production and a 2% net smelter return (NSR) on base and precious metals payable to Altius Resources Inc. Exploration commenced in the project area in the mid 1950’s. By 1980, British Newfoundland Exploration Limited (Brinex) had completed geological mapping, 290 core holes at the Michelin deposit, an exploration adit approximately 580m in length and a mineral resource estimation. Brinex ceded its exploration concession in 1980 but held mining leases over a number of deposits in the area until 1994. Work undertaken in 2003-2005 by the Fronteer – Altius Alliance commenced with a re-evaluation of the area for Cu-Au-U targets. The Alliance subsequently acquired a number of mineral licences. The uranium interests in the licences were transferred to Aurora in 2005. Fronteer completed a number of exploration programmes between 2005 and 2008 which culminated with mineral resource estimations in 2007 with an update in 2008. The Company re-commenced active exploration during the northern summer season in 2012. F
or p
erso
nal u
se o
nly
146
PALADIN ENERGY LTD AND CONTROLLED ENTITIES NOTES TO THE CONSOLIDATED FINANCIAL STATEMENTS (continued)
FOR THE YEAR ENDED 30 JUNE 2013 __________________________________________________________________________________
This project has been impaired to US$Nil due to the cessation of exploration activities as a consequence of increased political risk.
Following the completion of the takeover of NGM in December 2010 the Company took possession of the wholly owned British Virgin Islands company, Indo Energy Ltd. Indo Energy Ltd holds 3 exploration concessions in the Tim Mersoi basin, Tagait 4 (TAG4), Tolouk 1 (TOU1) and Terzemazour 1 (TER1), initially covering an area of 1,480km2. The concessions are located approximately 30km to the north and north west of the township of Agadez in northern Niger. Prior to acquisition, NGM had completed a mineral resource estimation conforming to the JORC (2004) guidelines for the Takardeit deposit in the central portion of concession TER1. The concessions were originally granted on the 21 May 2007 for a period of 3 years, however in view of the political and security situation then prevailing in the country, in June 2010 the concessions were given a 27 month extension of the permits until December 2012. After the 2011 drilling programme was evaluated in July/August 2011, a 15,000m follow-up drilling programme was developed which was planned to start in November 2011. This, however, has been delayed indefinitely.
By the end of 2012 licences TAG4, TOU1 and TER1 were halved due to statutory requirements for renewal and were subsequently re-granted for another three years. The western half of TAG4 was re-applied for as a new concession, Ekazan 1 (EKA1) with the grant of the concession pending. The concessions are located in the Tim Mersoi Basin and are prospective for sandstone type uranium mineralisation in Carboniferous, Permian and Jurassic sediments. The basin has historically produced in excess of 280Mlb U3O8 from two Areva mines (Somair and Cominak) and a third mine Imouraren is under construction. Due to the security situation caused by Al-Qaeda activities, especially in the northern desert region where the project is located, no experienced expatriate personnel from the Company are permitted to visit the project site or directly supervise the exploration effort. On-ground exploration and mapping has been carried out with guidance from Perth head office, by local personnel. Manyingee Uranium Project (Australia) - Paladin 100%
The Manyingee Uranium Project consists of three granted mining leases – M08/86, M08/87 and M08/88 - covering 1,307 hectares in the north-west of Western Australia, 1,100km north of Perth, the state capital and 90km south of the township of Onslow on the north-west coast. The Group purchased the Manyingee Uranium Project in 1998 from Afmeco Mining and Exploration Pty Ltd (AFMEX), a subsidiary company of Cogema of France. Under the terms (as amended) of the purchase agreement a final payment of A$0.75M is payable to AFMEX when all development approvals have been obtained. Royalties of 2.5% for the first 2,000t of uranium oxide and 1.5% for the following 2,000t of uranium oxide are also payable to AFMEX and associated companies which formerly held interests in the project. The three mining leases were granted on 18 May 1989 for a 21-year term to 17 May 2010. The leases have now been renewed for a further 21-year term to 17 May 2031. Rights conferred by the three mining leases include the exclusive right to explore and mine minerals, subject to environmental and other approvals. The interest in Manyingee is held through the wholly owned entity, PEM. Following the lifting of the ban on uranium mining in Western Australia in late 2008 exploration planning has been undertaken with the intention of undertaking a drilling programme. By the end of 2011 the Company’s Programme of Works was approved by the Western Australian Department of Mines and Energy. After completing archaeological clearance of the proposed work areas in April 2012, the Company commenced a drilling programme in August 2012. Data from this programme will be included in an application for approval of a Field Leach Trial expected to be lodged in the second half of CY2013.
For
per
sona
l use
onl
y
147
PALADIN ENERGY LTD AND CONTROLLED ENTITIES NOTES TO THE CONSOLIDATED FINANCIAL STATEMENTS (continued)
FOR THE YEAR ENDED 30 JUNE 2013 __________________________________________________________________________________
The Oobagooma Project, beneficially held 100% by Paladin through its wholly owned subsidiary Paladin Energy Minerals NL, is located in the West Kimberley region of Western Australia, 1,900km north-north-east of Perth and 75km north-east of the regional centre of Derby. The project comprises long-standing applications for exploration licences covering approximately 452km². In 1998 Paladin acquired a call option in relation to the purchase of Oobagooma from Afmeco Mining and Exploration Pty Ltd, which at the time was a subsidiary of AREVA Resources Australia Pty Ltd (AREVA Australia) . This arrangement was recently varied so that Paladin Energy Minerals NL is now the applicant and will, upon the anticipated grant, hold the exploration licence directly. Recent changes to the Mining Act 1978 (WA) now permit the grant of tenements within the Yampi Sound Defence Training Area and Paladin Energy Minerals holds a first ranking application. In accordance with the revised terms of the agreement with AREVA Australia, Paladin has paid $375,000 to AREVA Australia with a further $375,000 to be paid on final grant of the tenement. Paladin has also granted to AREVA Australia a 1% royalty from total sales generated from the sale of product, which is consistent with the previous agreement that has been replaced. The exploration licence application is situated on freehold land owned by the Commonwealth Government and used by the military for training purposes. Consent of the Commonwealth Government and the Department of Defence will be required for access to the project area. Negotiations with the relevant Government bodies were initiated in the first half of 2010. Government and Defence representatives have indicated their support for the Oobagooma Project.
Valhalla North Uranium Project (Australia) - Paladin 100%
The Valhalla North Uranium Project consists of two granted exploration permits – Exploration Permit for Minerals 12572 (EPM 12572) and EPM 16006 - covering 457km2 to the north of Mount Isa in north-western Queensland. The Group acquired the Valhalla North Uranium Project following the successful takeover of Fusion in February 2009. EPM 12572 was granted on 11 January 2006 and EPM 16006 was granted on 26 March 2008, each for a period of five years with the potential to be renewed for further five year periods. The renewal of EPM 12572 for a further period of five years has been lodged and is awaiting grant. The area was investigated during the 1950’s and resulted in the discovery of the Duke and Batman deposits, with limited mining of surface high grade mineralisation being undertaken with subsequent treatment at the Mary Kathleen mine. During the 1970’s the area was explored by both Queensland Mines Limited and Agip Australia Pty Ltd. Prior to the completion of the takeover, Fusion announced Mineral Resources conforming to the JORC guidelines on two deposits, Duke Batman and Honeypot. Drilling at the Duke Batman deposit did not extend the mineralisation but identified a high grade core to the mineralisation and significantly added to the geological understanding of the deposit.
For
per
sona
l use
onl
y
148
PALADIN ENERGY LTD AND CONTROLLED ENTITIES NOTES TO THE CONSOLIDATED FINANCIAL STATEMENTS (continued)
FOR THE YEAR ENDED 30 JUNE 2013 __________________________________________________________________________________
294605_9
NOTE 13. EXPLORATION AND EVALUATION EXPENDITURE (continued) Bigrlyi Uranium Project (Australia) - Paladin 41.71% This project has been impaired to a carrying value of US$10 due to a decision to reduce the amount spent and planned studies on this project until the uranium price increases.
The Bigrlyi Uranium Project lies in the Northern Territory of Australia approximately 320km north-west of Alice Springs and is comprised of ten exploration retention licences (ERLs 46-55) covering 1,214 hectares. These tenements were originally granted in 1983 and have been subject to five yearly renewals since 1988. The project is now a joint venture between Energy Metals Limited 53.29%, Southern Cross Exploration NL 5.00% and Northern Territory Uranium Pty Ltd 41.71% (100% owned by Paladin) with Energy Metals Limited being operator and manager. The Bigrlyi uranium deposit was originally discovered by Agip Australia Pty Ltd in the mid 1970’s before being transferred to Central Pacific Minerals NL in the early 1980’s. The deposit was subject to extensive drilling between 1974 and 1982 with Ore Reserve studies carried out during the 1980’s and 1990’s. During 2005/2006 a drilling campaign was undertaken by the Joint Venture partners which resulted in an initial JORC Resource. Resource definition drilling is ongoing at the project and an Initial Scoping Study was released in November 2007 and an Updated Scoping Study released in July 2008. Resource updates were released in April and July 2009 with additional drilling completed in late 2009 and 2010. In June 2011 an increased Indicated and Inferred Mineral Resource totalling 21.1Mlb U3O8 at a cut-off grade of 500ppm was announced. In the second half of 2011, Energy Metals Limited carried out infill and resource extension drilling followed by detailed geological mapping early in 2012. Extensive validation of all existing data has been undertaken and is being used to generate an updated geological model. Isa Uranium Joint Venture (Australia) - Paladin 91.04%
The IUJV in Northern Queensland is a 50:50 joint venture between SRA (Paladin 82.08% effective ownership) and MIU (Paladin 100% ownership) with SRA being the operator and manager. The IUJV covers two defined blocks of land totalling 27km2 containing the Valhalla and Skal uranium deposits. Paladin’s effective equity in the IUJV was increased from 50% to 91.03% following the acquisition of 81.9% of Summit in 2007. The current ownership of Summit is 82.08%. Valhalla Uranium Deposit (Australia) - Paladin 91.04%
The Valhalla Uranium Deposit is situated on EPM 17514 granted in January 2010 for a five year term to 5 January 2015. The Valhalla Uranium Deposit is located approximately 40km north of Mount Isa and straddles the Barkly Highway. The ground was previously worked on by Mount Isa Mines Limited and Queensland Mines Limited from the mid 1950’s to the early 1970’s. Queensland Mines Limited, in particular, conducted extensive exploration over the Valhalla ground between 1968 and 1972 including the estimation of resources and reserves. Queensland Mines Limited allowed the tenement to lapse in 1991 and the ground was subsequently acquired by SRA in 1992, with EPM 9221 being granted in 1993. During 2008 resource definition drilling was commenced to enable completion of a detailed scoping study. As a result of the scoping study additional resource drilling was undertaken with the updating of the Mineral Resource being announced in October 2010. Geotechnical and metallurgical studies are ongoing. Odin Uranium Deposit - (Australia) – Paladin 91.04%
The Odin Uranium Deposit is located 1km north of Valhalla at EPL 17514. The deposit is essentially ‘blind’ with little or no surface expression and its discovery is a result of an extensive regional prospectivity mapping exercise undertaken by the Company since 2009. Following a number of drilling programmes in 2009, 2010 and 2011 an Indicated and Inferred category Mineral Resource has now been estimated.
For
per
sona
l use
onl
y
149
PALADIN ENERGY LTD AND CONTROLLED ENTITIES NOTES TO THE CONSOLIDATED FINANCIAL STATEMENTS (continued)
FOR THE YEAR ENDED 30 JUNE 2013 __________________________________________________________________________________
294605_9
NOTE 13. EXPLORATION AND EVALUATION EXPENDITURE (continued) Skal Uranium Deposit (Australia) - Paladin 91.04%
The Skal Uranium Deposit is situated on EPM 17519, granted in January 2010 for a five year term to 5 January 2015. The Skal Uranium Deposit is located approximately 8km south-east of the Valhalla Uranium Deposit and 32km north of Mount Isa. The ground was previously held by SRA as EPM 14048 granted in 2005. Skal was originally discovered by Mount Isa Mines Limited in the mid 1950’s and was subject to mapping and drilling at that time. Queensland Mines Limited acquired the project in the 1960’s and conducted further drilling resulting in an estimation of a resource for the project. The deposit is situated on EPM 14048 and the IUJV re-commenced drilling in 2005. An initial JORC compliant resource estimate was completed in mid-2008, with an updated resource reported in early 2009. Additional resource definition drilling was undertaken in 2009 and followed up with a resource update in October 2009. Resource definition drilling was completed on all the individual mineralised zones in late 2011 and an updated mineral resource estimate was released in March 2012. Summit Resources Ltd (Australia) - Paladin 82.08%
Paladin acquired an 81.9% interest in Summit as a result of a takeover bid which closed on 1 June 2007. SRA, which is a wholly owned subsidiary of Summit, holds a large number of exploration tenements surrounding and to the north of Mount Isa in Northern Queensland. Other than the Andersons, Bikini and Watta Projects, for which JORC Inferred Mineral Resource estimates have been completed, limited exploration activities have taken place on these tenements in recent years and as such they are not considered material to Paladin at this point in time. Following the completion of regional drilling programmes in 2010 and 2011 the Mineral Resources at Andersons, Bikini and Watta have been updated along with a maiden Mineral Resource estimates for the Mirrioola and Warwai deposits. Angela and Pamela Projects (Australia) - Paladin 100%
This project has been impaired to US$Nil due to a decision to reduce the amount spent and planned studies on this project until the uranium price increases.
In early 2008, the Northern Territory Government advised that the Angela Project Joint Venture (Paladin 50% and Cameco Australia Pty Ltd 50%) had been selected to explore the Angela and Pamela uranium deposits located near Alice Springs in the Northern Territory. Exploration Licence 25758 covering 3,767 hectares was granted on 3 October 2008 for a six year term with the potential for further renewal. Exploration and resource definition drilling was planned. Drilling programmes were completed in 2009 and 2010 and these are being evaluated to determine the future direction of the project. A successful mud rotary drilling trial was undertaken in early 2011 which is now expected to reduce overall drilling costs and improve drilling rates. An initial Mineral Resource estimate has now been completed and reported. Paladin assumed the management of the project in September 2011. In late June 2013 Paladin became the sole owner of the Angela project following the completion of an agreement to purchase the 50% interest previously held by Cameco Australia Pty Ltd. Following the completion of the transaction, 100% of the resource is now attributable to Paladin Energy Ltd. Other Mineral Property Interests
The Group holds various other mineral property interests, however, these are not considered material and as a result no further disclosure of mineral property tenement information has been included in the consolidated financial statements. Environmental Contingency
The Group’s exploration, evaluation, development and operation activities are subject to various national, federal, provincial and local laws and regulations governing the protection of the environment. These laws and regulations are continually changing and generally becoming more restrictive. The Group has made, and expects to make in the future, expenditures to comply with such laws and regulations. The impact, if any, of future legislative or regulatory changes cannot be determined.
For
per
sona
l use
onl
y
150
PALADIN ENERGY LTD AND CONTROLLED ENTITIES NOTES TO THE CONDENSED CONSOLIDATED FINANCIAL STATEMENTS (continued)
FOR THE YEAR ENDED 30 JUNE 2013
EXPRESSED IN US DOLLARS
294605_9
NOTE 13. EXPLORATION AND EVALUATION EXPENDITURE (continued) The following table details the expenditures on interests in mineral properties by area of interest for the year ended 30 June 2013:
PALADIN ENERGY LTD AND CONTROLLED ENTITIES NOTES TO THE CONDENSED CONSOLIDATED FINANCIAL STATEMENTS (continued)
FOR THE YEAR ENDED 30 JUNE 2013
EXPRESSED IN US DOLLARS
294605_9
NOTE 13. EXPLORATION AND EVALUATION EXPENDITURE (continued) The following table details the expenditures on interests in mineral properties by area of interest for the year ended 30 June 2012:
Balance 30 June 2012 639.4 152.5 11.9 7.4 30.7 36.8 - - 259.7 4.8 1,143.2 (1) Summit has a 50% interest in the Valhalla/Skal Projects with the other 50% interest held by the Paladin Group. As a consequence of the takeover of the
Summit Group, the above table now reflects 100% of the Valhalla/Skal Projects with the non-controlling interest reflected on the face of the Statement of Financial Position.
.
For
per
sona
l use
onl
y
152
PALADIN ENERGY LTD AND CONTROLLED ENTITIES NOTES TO THE CONSOLIDATED FINANCIAL STATEMENTS (continued)
FOR THE YEAR ENDED 30 JUNE 2013 __________________________________________________________________________________
294605_9
NOTE 14. INTANGIBLE ASSETS
2013
US$M 2012 US$M
At 30 June Intangible assets – at cost 27.8 27.8Less accumulated depreciation and impairment(1) (15.0) (9.7) Net carrying value – intangible assets 12.8 18.1 (1)Refer to Note 11 for details of impairment. Amortisation of US$1.1M (2012: US$1.2M) is included in cost of sales in the Income Statement. Movements in Intangible Assets
Movements in each group of intangible asset during the financial year are set out below: Right
to Supply of Power
US$M
Right to Supply of Water
US$M
Kayelekera Mining Lease US$M
Total
US$M 2013 Net carrying value at 1 July 2012 4.0 9.4 4.7 18.1 Amortisation expense (0.2) (0.4) (0.5) (1.1) Impairment - - (4.2) (4.2) Net carrying value at 30 June 2013 3.8 9.0 - 12.8 2012 Net carrying value at 1 July 2011 4.1 9.8 9.2 23.1 Amortisation expense (0.1) (0.4) (0.7) (1.2) Impairment - - (3.8) (3.8) Net carrying value at 30 June 2012 4.0 9.4 4.7 18.1
For
per
sona
l use
onl
y
153
PALADIN ENERGY LTD AND CONTROLLED ENTITIES NOTES TO THE CONSOLIDATED FINANCIAL STATEMENTS (continued)
FOR THE YEAR ENDED 30 JUNE 2013 __________________________________________________________________________________
294605_9
NOTE 14. INTANGIBLE ASSETS (continued) (c) Description of the Group’s Intangible Assets
(i) Right to supply of power
LHUPL has entered into a contract with NamPower in Namibia for the right to access power at LHM. In order to obtain this right, the power line connection to the mine was funded by LHM. However, ownership of the power line rests with NamPower. The amount funded is being amortised on a unit of production basis. (ii) Right to supply of water
LHUPL has entered into a contract with NamWater in Namibia for the right to access water at LHM. In order to obtain this right, the water pipeline connection to the mine was funded by LHM. However, ownership of the pipeline rests with NamWater. The amount funded is being amortised on a unit of production basis. (iii) Kayelekera Mining Lease
In exchange for the Mining Lease, PEM and PAL have entered into a Development Agreement with the Government of Malawi for the development of the Garnet Halliday Karonga Water Supply Project and other social development projects. In terms of the Development Agreement PAL has spent US$10M on agreed community infrastructure projects. This amount was recognised as an intangible asset and was being amortised over the life of the mine estimated to be 9 years on a straight-line basis. This intangible asset has been impaired to US$Nil, refer to Note 11 for details of impairment. NOTE 15. TRADE AND OTHER PAYABLES
2013
US$M 2012 US$M
Current Trade and other payables 57.9 67.1 Total current payables 57.9 67.1 Trade payables are non-interest bearing and are normally settled on 30 day terms.
For
per
sona
l use
onl
y
154
PALADIN ENERGY LTD AND CONTROLLED ENTITIES NOTES TO THE CONSOLIDATED FINANCIAL STATEMENTS (continued)
FOR THE YEAR ENDED 30 JUNE 2013 __________________________________________________________________________________
294605_9
NOTE 16. INTEREST BEARING LOANS AND BORROWINGS
Maturity2013
US$M 2012 US$M
Current Secured bank loans 63.6 51.0 Unsecured convertible bonds(1) - 132.4 Total current interest bearing loans and borrowings 63.6 183.4 Non Current Unsecured convertible bonds(2) 2015 276.0 267.0 Unsecured convertible bonds(3) 2017 236.6 229.0 Secured bank loan amortised to 2015 37.0 65.3 Secured bank loan amortised to 2017 64.6 93.8 Total non current interest bearing loans and borrowings 614.2 655.1 The above figures include transaction costs which offset the balance in accordance with the requirements of Accounting Standards. Fair value disclosures
Details of the fair value of the Group’s interest bearing liabilities are set out in Note 20(g). Unsecured convertible bonds (1) On 11 March 2008, the Company issued US$325M in convertible bonds with a coupon rate of
5.0% (underlying effective interest rate of 7.13%), maturity 11 March 2013 and a conversion price of US$6.52 for Company shares. On 29 May 2012, pursuant to its tender offer the Company repurchased and cancelled US$191M bonds. At 11 March 2013 the remaining outstanding amount of US$134M was repaid.
(2)
On the 5 November 2010, the Company issued US$300M in convertible bonds with a coupon rate of 3.625%, (underlying effective interest rate of 7.47%) maturing on 5 November 2015 with a conversion price of US$5.61, for Company shares.
(3)
On 30 April 2012, the Company issued US$274M in convertible bonds with a coupon rate of 6% (underlying effective interest rate of 10.68%) maturing on 30 April 2017 with a conversion price of US$2.19 for Company shares.
Pursuant to the terms of the Bonds the prevailing Conversion Price is subject to adjustment where any new issue of shares is at less than 95% of the Current Market Price. Following the completion of the Placement on 12 August 2013, the Conversion Prices have been adjusted as follows: Convertible bonds due 2015: US$5.403 (previously US$5.608)
Convertible bonds due 2017: US$2.109 (previously US$2.19) In disclosing the convertible bonds in the Consolidated Financial Statements, the Company has accounted for them in accordance with Australian Accounting Standards. Under these standards the convertible bonds consist of both a liability (underlying debt) and equity component (conversion rights into Company shares).
For
per
sona
l use
onl
y
155
PALADIN ENERGY LTD AND CONTROLLED ENTITIES NOTES TO THE CONSOLIDATED FINANCIAL STATEMENTS (continued)
FOR THE YEAR ENDED 30 JUNE 2013 __________________________________________________________________________________
294605_9
NOTE 16. INTEREST BEARING LOANS AND BORROWINGS (continued) Secured bank loans Kayelekera Mine, Malawi - US$167M Project Finance Facility On 30 March 2009, the Group entered into a project financing facility of US$167M for the construction of KM. The project finance consists of a six year project finance facility of US$145M, a standby cost overrun facility of US$12M and a performance bond facility of US$10M. The facilities were provided by Société Générale Corporate and Investment Banking (as inter-creditor agent and commercial lender), Nedbank Capital a division of Nedbank Limited (ECIC lender) and Standard Bank Limited (as ECIC facility agent and lender). The facilities are secured over the assets of Paladin (Africa) Ltd. The completion test was satisfied on 25 March 2013. Post the completion test date, the commercial bank tranche bears interest at the London Interbank Offered Rate (“LIBOR”) plus 2.5%. The ECIC tranche bears interest at LIBOR plus 2.5% whilst the cost overrun facility bears interest at LIBOR plus 3.5%. The facilities are repayable on a four monthly basis over the term of the loan. The Company has provided a guarantee as part of the facilities. At 30 June 2013 US$68.1M (30 June 2012: US$98.0M) was outstanding under the KM project finance facility. A total of US$29.9M will be repaid in the 12 months to 30 June 2014. Langer Heinrich Mine, Namibia - US$141M Stage 3 Project Finance Facility On 26 August 2011 the Group entered into a project financing facility of US$141M for the construction of Stage 3 of LHM. The facility consists of a six-year US$135M project financing facility and a US$6M cost overrun facility. The facility was provided by Société Générale (as Agent), Nedbank Capital, Standard Bank Plc, Barclays Capital (the investment banking division of Barclays Bank PLC) and Rand Merchant Bank, a division of FirstRand Bank Limited. The facility was fully drawn down during the December 2011 quarter. The completion test was satisfied on 25 January 2013. Post the completion test date, the facility bears interest at the LIBOR plus 3.25%. The facilities are repayable on a six monthly basis over the term of the loan. The facilities are secured with fixed and floating charges over the assets of LHUPL and its immediate holding companies. At 30 June 2013 US$101.5M (30 June 2012: US$118.5M) was outstanding under the LHM Stage 3 project finance facility. A total of US$35.7M will be repaid in the 12 months to 30 June 2014. Transaction costs relating to the establishment of the facilities have been included as part of interest bearing loans and borrowings. Borrowing costs capitalised during the year as part of the LHM Stage 3 expansion US$0.1M (2012: US$3.3M).
For
per
sona
l use
onl
y
156
PALADIN ENERGY LTD AND CONTROLLED ENTITIES NOTES TO THE CONSOLIDATED FINANCIAL STATEMENTS (continued)
FOR THE YEAR ENDED 30 JUNE 2013 __________________________________________________________________________________
294605_9
NOTE 16. INTEREST BEARING LOANS AND BORROWINGS (continued) Financing facilities available At reporting date, the following financing facilities had been negotiated and were available:
2013
US$M 2012 US$M
Total facilities: Unsecured convertible bonds 574.0 708.0 Secured bank loans 169.6 216.5 743.6 924.5 Facilities used at reporting date: Unsecured convertible bonds 574.0 708.0 Secured bank loans 169.6 216.5 743.6 924.5 Facilities unused at reporting date: Unsecured convertible bonds - - Secured bank loans - - Assets pledged as security - - The carrying amounts of assets pledged as security for current and non current interest bearing liabilities (secured bank loans) are: Current Floating charge Cash and cash equivalents 53.3 54.0 Trade and other receivables 76.1 74.1 Inventories 158.8 191.6 Total current assets pledged as security 288.2 319.7 Non Current Inventories 141.4 118.0 Property, plant and equipment 289.6 454.4 Mine development 42.8 88.3 Deferred tax asset - 38.3 Intangible assets 12.8 18.1 Total non current assets pledged as security 486.6 717.1 Total assets pledged as security 774.8 1,036.8
Assets pledged include both LHM and KM.
For
per
sona
l use
onl
y
157
PALADIN ENERGY LTD AND CONTROLLED ENTITIES NOTES TO THE CONSOLIDATED FINANCIAL STATEMENTS (continued)
FOR THE YEAR ENDED 30 JUNE 2013 __________________________________________________________________________________
294605_9
NOTE 17. PROVISIONS
Note 2013
US$M 2012 US$M
Current Employee benefits 24 9.9 3.4 Total current provisions 9.9 3.4 Non Current Employee benefits 24 3.0 6.5 Rehabilitation provision 52.3 31.9 Demobilisation provision 1.7 2.0 Total non current provisions 57.0 40.4 For a description of the nature and timing of cash flows associated with the above provisions, refer to section (b) of this note. (a) Movements in Provisions
Movements in each class of provision during the financial year, excluding provisions relating to employee benefits, are set out below: Demobilisation
US$M Rehabilitation
US$M Total US$M
At 1 July 2012 2.0 31.9 33.9 Arising during the year 0.2 22.1(1) 22.3 Effects of changes in discount rates (0.1) 2.4 2.3 Foreign currency movements (0.4) (4.1) (4.5) At 30 June 2013 1.7 52.3 54.0 2013 Current - - - Non current 1.7 52.3 54.0 1.7 52.3 54.0 2012 Current - - - Non current 2.0 31.9 33.9 2.0 31.9 33.9 (1) The rehabilitation provision for KM was increased during the period as a result of additional remediation costs considered necessary to comply with national and international standards.
For
per
sona
l use
onl
y
158
PALADIN ENERGY LTD AND CONTROLLED ENTITIES NOTES TO THE CONSOLIDATED FINANCIAL STATEMENTS (continued)
FOR THE YEAR ENDED 30 JUNE 2013 __________________________________________________________________________________
294605_9
NOTE 17. PROVISIONS (continued) (b) Nature and Timing of Provisions (i) Rehabilitation
A provision for rehabilitation and mine closure has been recorded in relation to LHM and KM. A provision is made for rehabilitation work when the obligation arises and this is recognised as a cost of production or development as appropriate. Additionally the provision includes the costs of dismantling and demolition of infrastructure or decommissioning, the removal of residual material and the remediation of disturbed areas specific to the infrastructure to a state acceptable to various authorities. The provision is estimated using the assumption that remediation will not take place until 3 to 20 years’ time. (ii) Employee benefits
Refer to Note 24. (iii) Demobilisation
A provision for demobilisation has been recorded in relation to LHM for the costs of demobilising the mining contractor. NOTE 18. UNEARNED REVENUE
2013 2012 US$M US$M
Non Current Unearned revenue 200.0 - Total unearned revenue 200.0 -
Total prepayment of US$200M under a six year off-take agreement with EdF, a major electricity generator and distribution company in France, to deliver a total of 13.73Mlb U3O8 in the period from 2019 to 2024. Uranium delivered under the off-take agreement will be sold to EdF at market prices prevailing at the time of delivery bounded by escalating floor and ceiling prices. To secure the Company’s obligation to deliver product representing the prepayment amount, EdF holds security over 60.1% of the Group’s Michelin project in Canada. The percentage of Michelin secured will be reduced by joint agreement as the value of that project is enhanced by the Group’s ongoing work. The Michelin security can also be replaced by other appropriate security if required.
NOTE 19. CONTRIBUTED EQUITY AND RESERVES (a) Issued and Paid Up Capital Number of Shares 2013
2012
2013 US$M
2012US$M
Ordinary shares Issued and fully paid 837,187,808 835,645,290 1,845.7 1,839.2 Effective 1 July 1998, the Corporations legislation in place abolished the concepts of authorised capital and par value shares. Accordingly, the Company does not have authorised capital or par value in respect of its issued shares. Fully paid ordinary shares carry one vote per share and carry the right to dividends.
For
per
sona
l use
onl
y
159
PALADIN ENERGY LTD AND CONTROLLED ENTITIES NOTES TO THE CONSOLIDATED FINANCIAL STATEMENTS (continued)
FOR THE YEAR ENDED 30 JUNE 2013 __________________________________________________________________________________
294605_9
NOTE 19. CONTRIBUTED EQUITY AND RESERVES (continued)
(b) Movements in Ordinary Shares On Issue
Date Number of Shares Issue Price
A$
Exchange Rate
US$: A$
Total
US$M Balance 30 June 2011 777,698,217 1,768.1 September 2011 Rights vested 827,515 - - - October 2011 Share placement 56,866,232 1.20 1.04459 65.3 October 2011 Rights vested 37,500 - - - November 2011 Rights vested 54,600 - - - January 2012 Rights vested 1,980 - - - February 2012 Rights vested 159,246 - - - Transfer from share-
based payments reserves
4.7
Tax effect on prior period 3.2 Transaction costs (2.1) Balance 30 June 2012 835,645,290(1) 1,839.2
(1) Includes 217,566 shares held by Paladin Employee Plan Pty Ltd. Balance 30 June 2012 835,645,290(1) 1,839.2 September 2012 Rights vested 1,180,361 - - - February 2012 Rights vested 143,635 - - - March 2013 Rights vested 218,522 - - - Transfer from share-
based payments reserves
6.5 Balance 30 June 2013 837,187,808(1) 1,845.7 (1) Includes 43,134 shares held by Paladin Employee Plan Pty Ltd.
For
per
sona
l use
onl
y
160
PALADIN ENERGY LTD AND CONTROLLED ENTITIES NOTES TO THE CONSOLIDATED FINANCIAL STATEMENTS (continued)
FOR THE YEAR ENDED 30 JUNE 2013 _____________________________________________________________________________________________________________________________
294605_9
NOTE 19. CONTRIBUTED EQUITY AND RESERVES (continued) (c) Reserves
Consolidation
reserve
US$M
Listed option
application reserve US$M
Share-based
payments reserve US$M
Available -for-sale reserve
US$M
Foreign currency
translation reserve US$M
Convertible bond non-
distributable reserve US$M
Premium on acquisition
reserve
US$M
Total
US$M
At 1 July 2011 (0.2) 0.1 49.5 11.7 68.8 60.4 14.9 205.2 Net unrealised movement on available-for-sale investments
-
-
-
(25.8)
-
-
-
(25.8)
Share-based payments - - 2.7 - - - - 2.7 Foreign currency translation - - - - (40.7) - - (40.7) Income tax - - - 3.3 - - - 3.3 Transfer of impairment loss to income Statement
-
-
-
8.0
-
-
-
8.0
Convertible bonds, equity component net of tax and transaction costs
At 30 June 2012 (0.2) 0.1 52.2 (2.8) 28.1 85.5 14.9 177.8 Net unrealised movement on available-for-sale investments
-
-
(5.3)
-
-
-
(5.3)
Share-based payments - - (2.0) - - - - (2.0) Foreign currency translation - - - - (67.8) - - (67.8) Income tax - - - 0.1 - - - 0.1 Transfer of impairment loss to income Statement
-
-
-
5.0
-
-
-
5.0
Transfer realised gains to other income - - -
(1.2) -
- - (1.2)
At 30 June 2013 (0.2) 0.1 50.2 (4.2) (39.7) 85.5 14.9 106.6
For
per
sona
l use
onl
y
161
PALADIN ENERGY LTD AND CONTROLLED ENTITIES NOTES TO THE CONSOLIDATED FINANCIAL STATEMENTS (continued)
FOR THE YEAR ENDED 30 JUNE 2013 __________________________________________________________________________________
294605_9
NOTE 19. CONTRIBUTED EQUITY AND RESERVES (continued) Nature and Purpose of Reserves Consolidation reserve
This reserve recognises the difference between the fair value of the 15% interest in PAL allotted to the Government of Malawi, at the net present value of the Kayelekera Project on the date the Development Agreement was signed (22 February 2007), and the non-controlling interest share of the net assets of PAL. Listed option application reserve
This reserve consists of proceeds from the issue of listed options, net of expenses of issue. These listed options expired unexercised and no restriction exists for the distribution of this reserve. Share-based payments reserve
This reserve is used to record the value of equity benefits provided to Directors, employees and consultants as part of their remuneration. Refer to Note 26 for further details on share-based payments. Available-for-sale reserve
This reserve records the fair value changes on the available-for-sale financial assets as set out in Note 10. Foreign currency translation reserve
This reserve is used to record exchange differences arising on translation of the group entities that do not have a functional currency of US dollars and have been translated into US dollars for presentation purposes, as described in Note 3(f). Convertible bond non-distributable reserve
This reserve records the equity portion of the convertible bonds issued as described in Note 16. Acquisition reserve
This reserve represents the premium paid on the acquisition of a non-controlling interest in Summit.
For
per
sona
l use
onl
y
162
PALADIN ENERGY LTD AND CONTROLLED ENTITIES NOTES TO THE CONSOLIDATED FINANCIAL STATEMENTS (continued)
FOR THE YEAR ENDED 30 JUNE 2013 __________________________________________________________________________________
The Group’s management of financial risk is aimed at ensuring net cash flows are sufficient to:
meet all its financial commitments; and
maintain the capacity to fund corporate growth activities
The Group monitors its forecast financial position on a regular basis. Market, liquidity and credit risk (including foreign exchange, commodity price and interest rate risk) arise in the normal course of the Group’s business. These risks are managed under Board approved directives which underpin treasury practices and processes. The Group’s principal financial instruments comprise interest bearing debt, cash and short-term deposits and available for sale financial assets. Other financial instruments include trade receivables and trade payables, which arise directly from operations. The Group’s forecast financial risk position with respect to key financial objectives and compliance with treasury practice is regularly reported to the Board. (b) Market Risk
(i) Foreign Exchange Risk
The Group operates internationally and is exposed to foreign exchange risk arising from various currency exposures. Foreign exchange risk arises from future commitments, assets and liabilities that are denominated in a currency that is not the functional currency of the relevant Group company. The Group’s borrowings and deposits are largely denominated in US dollars. Currently there are no foreign exchange hedge programmes in place. However, the Group treasury function manages the purchase of foreign currency to meet operational requirements.
For
per
sona
l use
onl
y
163
PALADIN ENERGY LTD AND CONTROLLED ENTITIES NOTES TO THE CONSOLIDATED FINANCIAL STATEMENTS (continued)
FOR THE YEAR ENDED 30 JUNE 2013 __________________________________________________________________________________
The financial instruments exposed to movements in the Australian dollar are as follows:
2013
US$M 2012 US$M
Financial assets Cash and cash equivalents 0.4 4.0 Trade and other receivables 0.2 1.3 Available-for-sale financial assets 7.4 7.7 8.0 13.0 Financial liabilities Trade and other payables (10.4) (8.5) Net exposure (2.4) 4.5 The financial instruments exposed to movements in the Namibian dollar are as follows:
2013
US$M 2012 US$M
Financial assets Cash and cash equivalents 1.0 0.8 Trade and other receivables 15.1 25.0 16.1 25.8 Financial liabilities Trade and other payables (23.0) (23.4) Net exposure (6.9) 2.4 The following table summarises the sensitivity of financial instruments held at balance date to movements in the exchange rate of the Australian dollar to the US dollar and the Namibian dollar to the US dollar, with all other variables held constant. The 5% sensitivity is based on reasonably possible changes, over a financial year, using the observed range of actual historical rates for the preceding five year period. IMPACT ON PROFIT/LOSS IMPACT ON EQUITY 2013
Interest rate risk is the risk that the Group’s financial position will be adversely affected by movements in interest rates that will increase the cost of floating rate debt or opportunity losses that may arise on fixed rate borrowings in a falling interest rate environment. Interest rate risk on cash and short-term deposits is not considered to be a material risk due to the short-term nature of these financial instruments. The Group’s main interest rate risk arises from long-term debt. Floating rate debt exposes the Group to cash flow interest rate risk and fixed rate debt exposes the Group to fair value interest rate risk. All other financial assets and liabilities in the form of receivables, investments in shares, payables and provisions, are non interest bearing. The Group currently does not engage in any hedging or derivative transactions to manage interest rate risk. The floating rate financial instruments exposed to interest rates movements are as follows:
2013 US$M
2012 US$M
Financial assets Cash and cash equivalents 68.3 90.3 Financial liabilities Interest-bearing liabilities (169.6) (216.5) Net exposure (101.3) (126.2)
The following table summarises the cash flow sensitivity of cash and cash equivalent financial instruments held at balance sheet date following a movement in LIBOR, with all other variables held constant. The sensitivity is based on reasonably possible changes over a financial year, using the observed range of actual historical rates for the preceding five year period. IMPACT ON PROFIT/LOSS
(iii) Market Price Risk Price risk is the risk that the Group's financial position will be adversely affected by movements in the market value of its available-for-sale financial assets. The financial instruments exposed to movements in market value are as follows: 2013
US$M 2012 US$M
Financial assets Other financial assets 10.3 15.5
The following table summarises the sensitivity of financial instruments held at balance date to movements in the market price of available-for-sale financial instruments, with all other variables held constant. The 25% sensitivity is based on reasonable possible changes, over a financial year, using the observed range of actual historical prices for 2013 and 2012. IMPACT ON EQUITY
The liquidity position of the Group is managed to ensure sufficient liquid funds are available to meet the Group’s financial commitments in a timely and cost effective manner. The Group treasury function continually reviews the Group’s liquidity position including cash flow forecasts to determine the forecast liquidity position and maintain appropriate liquidity levels. Sensitivity analysis is conducted on a range of pricing and market assumptions to ensure the Group has the ability to meet repayment commitments. This enables the Group to manage cash flows on a long-term basis and provides the flexibility to pursue a range of funding alternatives if necessary. Note 16 details the repayment obligations in respect of the amount of the facilities. F
or p
erso
nal u
se o
nly
166
PALADIN ENERGY LTD AND CONTROLLED ENTITIES NOTES TO THE CONSOLIDATED FINANCIAL STATEMENTS (continued)
FOR THE YEAR ENDED 30 JUNE 2013 __________________________________________________________________________________
294605_9
NOTE 20. FINANCIAL INSTRUMENTS (continued) (c) Liquidity Risk (continued) The maturity analysis of payables at the reporting date was as follows: Payables maturity analysis
2013
Total
US$M
>1 year
US$M
1-2 years
US$M
2-3 years
US$M
>3 years
US$M
Trade and other payables 57.9 57.9 - - - Loans and borrowings 743.6 65.7 62.0 323.8 292.1 Interest payable 103.7 31.7 30.7 23.8 17.5 Total payables 905.2 155.3 92.7 347.6 309.6 2012
Total
US$M
>1 year
US$M
1-2 years
US$M
2-3 years
US$M
>3 years
US$M
Trade and other payables 67.1 67.1 - - - Loans and borrowings 924.5 187.1 53.7 62.0 621.7 Interest payable 143.2 40.5 32.1 30.4 40.2 Total payables 1,134.8 294.7 85.8 92.4 661.9 (d) Credit Risk Credit risk is the risk that a contracting entity will not complete its obligation under a financial instrument that will result in a financial loss to the Group. The carrying amount of financial assets represents the maximum credit exposure. The Group trades only with recognised, credit worthy third parties. In addition, receivable balances are monitored on an ongoing basis with the result that the Group’s exposure to bad debts is not significant. The maximum exposure to credit risk at the reporting date was as follows:
2013 US$M
2012 US$M
Current Cash and cash equivalents* 78.1 112.1 Trade receivables 60.3 52.0 Other receivables – other entities 17.9 30.8 156.3 194.9 Non Current Other receivables – other entities 0.1 0.1 Total 156.4 195.0 * The Group’s maximum deposit with a single financial institution represents 57% (2012: 34%) of cash and cash equivalents.
For
per
sona
l use
onl
y
167
PALADIN ENERGY LTD AND CONTROLLED ENTITIES NOTES TO THE CONSOLIDATED FINANCIAL STATEMENTS (continued)
FOR THE YEAR ENDED 30 JUNE 2013 __________________________________________________________________________________
294605_9
NOTE 20. FINANCIAL INSTRUMENTS (continued) (d) Credit Risk (continued) The ageing of receivables at the reporting date was as follows: Receivables ageing analysis
Trade receivables 52.0 52.0 - - - Other receivables 30.9 30.8 0.1 - - Total receivables 82.9 82.8 0.1 - - No receivables are past due or impaired. (e) Financial Instruments Measured at Fair Value
The Group uses various methods in estimating the fair value of a financial instrument. The methods comprise: Level 1 – the fair value is calculated using quoted prices in active markets. Level 2 – the fair value is estimated using inputs other than quoted prices included in Level 1 that are observable for the asset or liability, either directly (as prices) or indirectly (derived from prices). Level 3 – the fair value is estimated using inputs for the asset or liability that are not based on observable market data. The fair value of the financial instruments as well as the methods used to estimate the fair value are summarised in the table below:
Year ended 30 June 2013 Year ended 30 June 2012 Quoted
PALADIN ENERGY LTD AND CONTROLLED ENTITIES NOTES TO THE CONSOLIDATED FINANCIAL STATEMENTS (continued)
FOR THE YEAR ENDED 30 JUNE 2013 __________________________________________________________________________________
294605_9
NOTE 20. FINANCIAL INSTRUMENTS (continued) (e) Fair Value of Financial Instruments Measured at Fair Value (continued)
Quoted market price represents the fair value determined based on quoted prices on active markets as at the reporting date without any deduction for transaction costs. The fair value of the listed equity investments are based on quoted market prices. For financial instruments not quoted in active markets, the Group uses valuation techniques such as present value techniques, comparison to similar instruments for which market observable prices exist and other relevant models used by market participants. These valuation techniques use both observable and unobservable market inputs. The fair value of unlisted debt and equity securities, as well as other investments that do not have an active market, are based on latest private share placement price before 30 June 2013. Reconciliation for Level 3 Fair Value Movements
2013
US$M 2012 US$M
Opening balance 1.5 1.0 Other comprehensive income (1.5) 0.6 Additions - - Disposals - (0.1) Closing balance - 1.5 Total gain or loss stated in the table above for assets held at the end of the period (1.5) 0.6 (f) Capital Management
When managing capital, management’s objective is to ensure adequate cash resources to meet the Company’s commitments are maintained, as well as to maintain optimal returns to shareholders through ensuring the lowest cost of capital available to the entity. The Company utilises a combination of debt, equity and convertible bonds to provide the cash resources required. Management reviews the capital structure from time to time as appropriate. The Group treasury function is responsible for the Group’s capital management, including management of the long-term debt and cash as part of the capital structure. This involves the use of corporate forecasting models which enable analysis of the Group’s financial position including cash flow forecasts to determine the future capital management requirements. To ensure sufficient funding for operational expenditure and growth activities, a range of assumptions are modelled so as to provide the flexibility in determining the Group’s optimal future capital structure. Group treasury monitors gearing and compliances with various contractual financial covenants. The Company’s project finance facility is subject to various financial undertakings including a negative pledge, debt service coverage ratio, loan life coverage ratio and project life coverage ratio. At the time of reporting, the Company was in compliance with all of the facility’s financial undertakings.
For
per
sona
l use
onl
y
169
PALADIN ENERGY LTD AND CONTROLLED ENTITIES NOTES TO THE CONSOLIDATED FINANCIAL STATEMENTS (continued)
FOR THE YEAR ENDED 30 JUNE 2013 __________________________________________________________________________________
294605_9
NOTE 20. FINANCIAL INSTRUMENTS (continued) (f) Capital Management (continued)
2013 US$M
2012 US$M
Total borrowings 677.8 838.5 Less cash and cash equivalents (78.1) (112.1) Net debt 599.7 726.4 Total equity 648.2 1,194.8 Total Capital 1,247.9 1,921.2 Gearing Ratio 48% 38%
(g) Fair Value of Financial Assets and Financial Liabilities Carried at Amortised Cost
The fair value representing the mark to market of a financial asset or a financial liability is the amount at which the asset could be exchanged or liability settled in a current transaction between willing parties after allowing for transaction costs. The fair values of cash and cash equivalents, trade and other receivables and trade and other payables approximate to their carrying values, as a result of their short maturity or because they carry floating rates of interest. The fair value of the debt component of the convertible bonds has been determined using a valuation technique based on the quoted market price of the convertible bonds. All financial assets and liabilities where the fair value does not approximate to the carrying value are as follows: 2013
Uranium is not traded in any significant volume on global commodity exchanges. The Group has customer sales contracts in place for delivery over the period 2013 to 2024. The contracted selling price is determined by a formula which references common industry published prices for spot and term contracts and is subject to an escalating floor price and also escalating ceiling prices.
For
per
sona
l use
onl
y
170
PALADIN ENERGY LTD AND CONTROLLED ENTITIES NOTES TO THE CONSOLIDATED FINANCIAL STATEMENTS (continued)
FOR THE YEAR ENDED 30 JUNE 2013 __________________________________________________________________________________
Mr Rick Crabb Chairman (Non-executive) Mr John Borshoff Managing Director/CEO Mr Sean Llewelyn Director (Non-executive) Mr Donald Shumka Director (Non-executive) Mr Peter Donkin Director (Non-executive) Mr Philip Baily Director (Non-executive) (ii) Executives
Ms Gillian Swaby Company Secretary and Executive General Manager – Corporate Services Mr Dustin Garrow Executive General Manager – Marketing Mr Mark Chalmers Executive General manager – Production Mr Alan Rule Chief Financial Officer (commenced 23 July 2012) (b) Compensation of Key Management Personnel: Compensation by Category
2013
US$’000 2012 US$’000
Short-term employee benefits 4,850 6,917 Post employment benefits 169 945 Long-term benefits 903 606 Share-based payment 1,594 2,275 7,516 10,743 The average exchange rate used for the year to 30 June 2013 to translate the Australian dollar remuneration to Key Management Personnel was, US$1 = A$0.97471 (2012 US$1 = A$0.96971).
For
per
sona
l use
onl
y
171
PALADIN ENERGY LTD AND CONTROLLED ENTITIES NOTES TO THE CONSOLIDATED FINANCIAL STATEMENTS (continued)
FOR THE YEAR ENDED 30 JUNE 2013 __________________________________________________________________________________
294605_9
NOTE 21. KEY MANAGEMENT PERSONNEL (continued)
(c) Option Holdings of Key Management Personnel (Group) 30 June 2013
01 Jul 12
Granted as
remuneration
Options
exercised
Net change other (1)
30 Jun 13
Vested/
exercisable
Not vested/ not
exercisable Directors Mr John Borshoff 657,000 - - (657,000) - - - Executives Ms Gillian Swaby 136,018 - - (136,018) - - - Mr Dustin Garrow 139,915 - - (139,915) - - - Total 932,933 - - (932,933) - - - No other Key Management Personnel held options during the year ended 30 June 2013. (1) All outstanding options expired on 18 April 2013. These options were out of the money and had no intrinsic value at expiration date. 30 June 2012
01 Jul 11
Granted as
remuneration
Options
exercised
Net change other (1)
30 Jun 12
Vested/
exercisable
Not vested/ not
exercisable Directors Mr John Borshoff 1,250,000 - - (593,000) 657,000 657,000 - Executives Ms Gillian Swaby 258,785 - - (122,767) 136,018 136,018 - Mr Dustin Garrow 266,199 - - (126,284) 139,915 139,915 - Total 1,774,984 - - (842,051) 932,933 932,933 - No other Key Management Personnel held options during the year ended 30 June 2012. (1) Options that could no longer vest were cancelled on 29 June 2012. These options were out of the money and had no intrinsic value at cancellation date. (d) Share Rights Holdings of Key Management Personnel (Group) 30 June 2013
01 Jul 12
Granted as remuneration
Vested as shares
Lapsed (1)
30 Jun 13
Directors Mr John Borshoff 800,000 - (150,000) - 650,000 Executives Ms Gillian Swaby 460,667 - (167,833) (90,000) 202,834 Mr Dustin Garrow 282,000 - (68,000) (100,000) 114,000 Mr Mark Chalmers 125,000 - (7,500) - 117,500 Total 1,667,667 - (393,333) (190,000) 1,084,334 No other Key Management Personnel held share rights during the year ended 30 June 2013. (1) Lapsed as performance conditions were not met. 30 June 2012 01 Jul 11
Granted as remuneration
Vested as shares
Forfeited 30 Jun 12
Directors Mr John Borshoff 800,000 - - - 800,000 Executives Ms Gillian Swaby 547,000 55,000 (141,333) - 460,667 Mr Garry Korte 131,000 - (18,500) (112,500)(1) - Mr Dustin Garrow 260,000 60,000 (38,000) - 282,000 Mr Mark Chalmers - 125,000 - - 125,000 Total 1,738,000 240,000 (197,833) (112,500) 1,667,667 No other Key Management Personnel held share rights during the year ended 30 June 2012. (1) Mr Garry Korte resigned on 24 May 2012 and his outstanding share rights were forfeited.
For
per
sona
l use
onl
y
172
PALADIN ENERGY LTD AND CONTROLLED ENTITIES NOTES TO THE CONSOLIDATED FINANCIAL STATEMENTS (continued)
FOR THE YEAR ENDED 30 JUNE 2013 __________________________________________________________________________________
Directors Mr Rick Crabb 4,881,528 - - 300,000 5,181,528Mr John Borshoff 21,877,394 - 150,000 (6,000,000) 16,027,394Mr Sean Llewelyn 100,000 - - - 100,000Mr Donald Shumka 200,000 - - - 200,000Mr Peter Donkin 15,000 - - - 15,000Mr Philip Baily 12,000 - - - 12,000 Executives Ms Gillian Swaby 118,333 - 167,833 - 286,166Mr Mark Chalmers - - 7,500 - 7,500Mr Dustin Garrow - - 68,000 (68,000) - Total 27,204,255 - 393,333 (5,768,000) 21,829,588 No other Key Management Personnel held shares during the year ended 30 June 2013.
30 June 2012
Balance 01 Jul 11
On Exercise of Options
On Vesting of Rights
Net Change Other
Balance 30 June 12
Directors Mr Rick Crabb 4,881,528 - - - 4,881,528Mr John Borshoff 21,877,394 - - - 21,877,394Mr Sean Llewelyn 100,000 - - - 100,000Mr Donald Shumka 200,000 - - - 200,000Mr Peter Donkin 15,000 - - - 15,000Mr Philip Baily 12,000 - - - 12,000 Executives Ms Gillian Swaby 3,586,655 - 141,333 (3,609,655) 118,333Mr Garry Korte(1) 9,000 - 18,500 (27,500) -Mr Dustin Garrow - - 38,000 (38,000) - Total 30,681,577 - 197,833 (3,675,155) 27,204,255 No other Key Management Personnel held shares during the year ended 30 June 2012. (1) Mr Garry Korte resigned on 24 May 2012. No longer required to disclose shareholdings. All equity transactions with Key Management Personnel other than those arising from the exercise of remuneration options have been entered into under terms and conditions no more favourable than those the Group would have adopted if dealing at arm’s length. F
or p
erso
nal u
se o
nly
173
PALADIN ENERGY LTD AND CONTROLLED ENTITIES NOTES TO THE CONSOLIDATED FINANCIAL STATEMENTS (continued)
FOR THE YEAR ENDED 30 JUNE 2013 __________________________________________________________________________________
294605_9
NOTE 21. KEY MANAGEMENT PERSONNEL (continued) (f) Other Transactions and Balances with Key Management Personnel Fees paid in the normal course of business in 2013 for corporate services totalling US$582,000 (2012: US$571,000) were paid/payable (balance outstanding at 30 June 2013 and included in trade creditors US$Nil (2012: US$Nil)) to a company of which Ms Gillian Swaby is a director and shareholder. All amounts are excluding GST.
NOTE 22. AUDITORS’ REMUNERATION The auditor of the Paladin Energy Ltd Group is Ernst & Young.
2013
US$’000 2012 US$’000
Amounts received or due and receivable by Ernst & Young (Australia) for:
Audit or review of the financial report of the consolidated Group 563 658
Other services 23 146(1) Taxation services:
Tax compliance services 101 81 International tax consulting 40 406 Tax advice on mergers and acquisitions 48 67 Other tax advice 139 31 Sub-total 914 1,389
(1) $121,000 relates to services performed in relation to the issue of Convertible Bonds. Amounts received or due and receivable by related practices of Ernst & Young (Australia) for:
Audit or review of the financial report of subsidiaries and audit related services 188 231
Taxation services: Tax compliance services 13 40 International tax consulting 140 139 Other 30 17 Sub-total 371 427
The level of non-audit related fees was driven by the tax compliance requirements of multiple jurisdictions and by the specialist advice requirements of potential acquisitions and group restructures. Whilst always striving to meet the highest corporate governance standards, Paladin is also cognisant of the need to retain the value of the best available specialist advice. Paladin engaged Ernst & Young because of their specialised experience in both Africa and the mining sector and Ernst & Young’s detailed understanding of the Paladin Group. In terms of the Company’s Corporate Governance Policy all non-audit services are reviewed and approved by the Audit Committee prior to commencement to ensure that they do not adversely affect the integrity and objectivity of the auditor and that the nature of the services provided does not compromise the Code of Ethics for Professional Accountants APES 110 issued by the Accounting Professional and Ethical Standards Board. All non-audit services provided by Ernst & Young were allowable services that received the sign off of the audit partner confirming that, in his professional opinion, they do not in any way impair the independence of the firm. Where any service might be perceived to be subjective, Ernst & Young policy requires approval by the Oceania Independence and Conflicts Leader.
For
per
sona
l use
onl
y
174
PALADIN ENERGY LTD AND CONTROLLED ENTITIES NOTES TO THE CONSOLIDATED FINANCIAL STATEMENTS (continued)
FOR THE YEAR ENDED 30 JUNE 2013 __________________________________________________________________________________
294605_9
NOTE 23. COMMITMENTS AND CONTINGENCIES There were no outstanding commitments or contingencies, which are not disclosed in the Financial Report of the Group as at 30 June 2013 other than: Note
2013
US$M 2012 US$M
(a) Tenements Commitments for tenements contracted for at the reporting date but not recognised as liabilities, payable: Within one year 1.0 5.4 Later than one year but not later than 5 years 6.0 4.8 More than 5 years 24.6 26.6 Total tenements commitment 31.6 36.8 These include commitments relating to tenement lease rentals and the minimum expenditure requirements of the Namibian, Malawian, Canadian, Western Australian, South Australian, Northern Territorian and Queensland Mines Departments attaching to the tenements and are subject to re-negotiation upon expiry of the exploration leases or when application for a mining licence is made. These are necessary in order to maintain the tenements in which the Group and other parties are involved. All parties are committed to meet the conditions under which the tenements were granted in accordance with the relevant mining legislation in Namibia, Malawi, Australia and Canada.
2013
US$M 2012 US$M
(b) Mine Construction Commitments Commitments for mine construction contracted for at the reporting date but not recognised as liabilities, payable: Within one year - 1.5 Later than one year but not later than 5 years - - More than 5 years - - Total mine construction - 1.5 (c) Operating Lease Commitments
The Group has entered into various property leases relating to rental of offices and residential accommodation. These non-cancellable leases have remaining terms of between 1 month and 7 years. All leases include a clause to enable upward revision of rental charge on an annual basis according to prevailing market conditions.
Future minimum rentals payable under non-cancellable operating leases as at 30 June are as follows:
2013
US$M 2012 US$M
Within one year 1.4 1.4 Later than one year but not later than 5 years 2.2 3.8 More than 5 years - - Total operating lease commitment 3.6 5.2
For
per
sona
l use
onl
y
175
PALADIN ENERGY LTD AND CONTROLLED ENTITIES NOTES TO THE CONSOLIDATED FINANCIAL STATEMENTS (continued)
FOR THE YEAR ENDED 30 JUNE 2013 __________________________________________________________________________________
294605_9
NOTE 23. COMMITMENTS AND CONTINGENCIES (continued) (d) Other Commitments
Commitments for mining, transport and reagents contracted for at the reporting date but not recognised as liabilities, payable:
2013
US$M 2012 US$M
Within one year 50.5 33.0 Later than one year but not later than 5 years 2.0 2.5 More than 5 years - - Total other commitment 52.5 35.5 (e) Acquisition Costs In 1998 Paladin acquired a call option in relation to the purchase of Oobagooma from Afmeco Mining and Exploration Pty Ltd, which at the time was a subsidiary of AREVA Resources Australia Pty Ltd (AREVA Australia). This arrangement was recently varied so that Paladin Energy Minerals NL is now the applicant and will, upon the anticipated grant, hold the exploration licence directly. Recent changes to the Mining Act 1978 (WA) now permit the grant of tenements within the Yampi Sound Defence Training Area and Paladin Energy Minerals holds a first ranking application. In accordance with the revised terms of the agreement with AREVA Australia, Paladin has paid $375,000 to AREVA Australia with a further $375,000 to be paid on final grant of the tenement. In relation to the Manyingee Uranium Project, the re-negotiated acquisition terms provide for a payment of A$0.75M (US$0.68M) (2012: A$0.75M (US$0.68M)) by the Group to the vendors when all project development approvals are obtained. (f) Bank Guarantees As at 30 June 2013 the Group has outstanding US$959,302 (A$1,050,387) (2012: US$889,944 / A$876,016) as a current guarantee provided by a bank for the corporate office lease, a US$219,193 (A$240,005) (2012: US$270,960 / A$266,719) guarantee for tenements and a US$10M (2012: US$10M) KM environmental performance guarantee. (g) Contingent Liability A dispute has arisen between a Group company and a contractor in relation to the contract for the Stage 3 expansion at LHM. The contractor is seeking payment of the disputed sum of US$32M. The Group denies the claim and will vigorously defend it. The Group is also counterclaiming damages from the contractor and cross-claiming from another contractor. The precise quantum of the counter-claim and cross claim has not yet been established but is expected to exceed the contractor’s claim. NOTE 24. EMPLOYEE BENEFITS
2013
US$M 2012 US$M
Provision for annual leave and long service leave aggregate employment benefit liabilities 12.9 9.9 Employee Benefits Expense Wages and salaries 68.1 72.3 Defined contribution superannuation 3.4 4.4 Share-based payments 5.0 8.7Other employee benefits 4.6 5.3 Total employee benefits expense 81.1 90.7
For
per
sona
l use
onl
y
176
PALADIN ENERGY LTD AND CONTROLLED ENTITIES NOTES TO THE CONSOLIDATED FINANCIAL STATEMENTS (continued)
FOR THE YEAR ENDED 30 JUNE 2013 __________________________________________________________________________________
294605_9
NOTE 24. EMPLOYEE BENEFITS (continued) Superannuation The Company contributes to employees’ superannuation plans in accordance with the requirements of Occupational Superannuation Legislation. Contributions by the Company represent a defined percentage of each employee's salary. Employee contributions are voluntary. Executive Share Option Plan and Employee Performance Share Rights Plan
Details of the Executive Share Option Plan and Employee Performance Share Rights Plan for the Company are disclosed in Note 26. NOTE 25. RELATED PARTIES Key Management Personnel
Details relating to Key Management Personnel can be found at Note 21. NOTE 26. SHARE-BASED PAYMENT PLANS
2013
US$M 2012 US$M
Share-based payment expense 3.9 6.9 The share-based payment plans are described below. (a) Types of Share-Based Payment Plans Executive Share Option Plan (EXSOP)
On 21 November 2006, the EXSOP was approved by shareholders at the Company’s Annual General Meeting. The number of shares that may be issued under the EXSOP must not exceed 5% of the total number of shares on issue. Share options are granted to employees under the EXSOP which is designed to create a stronger link between increasing shareholder value and employee reward. Under the EXSOP, the exercise price of the options is set at the market price of the shares on the date of grant and performance is measured by comparing the Company’s TSR (share price appreciation plus dividends reinvested) with a group of peer companies. The Company’s performance will be measured over three years from the date of grant. To the extent that maximum performance is not achieved under the performance condition, performance will be retested every six months following the first three years until the end of the fourth year. In assessing whether the TSR hurdle for each grant has been met, the Group receives independent data from an external advisor, who provides both the Group’s TSR growth from the commencement of each grant and that of the pre-selected peer group. The peer group chosen for comparison is the resource companies in the S&P/ASX200 Index at the date of grant. This peer group reflects the Group’s competitors for capital and talent. The Group’s performance against the hurdle is determined according to Paladin’s ranking against the peer group TSR growth over the performance period: when Paladin is ranked over the 75th percentile, 100% of the share options will vest; for rankings above the 50th and below the 75th percentile, the percentage of options to vest will be
pro-rata between 50% and 100%; when Paladin is ranked at the 50th percentile, 50% of the share options will vest; and when Paladin is ranked below the 50th percentile the share options will not vest. When a participant ceases employment prior to the vesting of their share options, the share options are forfeited unless cessation of employment is due to termination initiated by the Group other than for misconduct or death. In the event of a change of control all the awards will vest and may be exercised by the participant.
For
per
sona
l use
onl
y
177
PALADIN ENERGY LTD AND CONTROLLED ENTITIES NOTES TO THE CONSOLIDATED FINANCIAL STATEMENTS (continued)
FOR THE YEAR ENDED 30 JUNE 2013 __________________________________________________________________________________
294605_9
NOTE 26. SHARE-BASED PAYMENT PLANS (continued) Types of Share-Based Payment Plans (continued) Executive Share Option Plan (EXSOP) (continued) The contractual life of each option granted is five years. There are no cash settlement alternatives. Following the adoption of the Rights Plan referred to below, no further grants will be made under the EXSOP. The last grant under this Plan was made on 24 June 2009. All outstanding options expired on 18 April 2013. Employee Performance Share Rights Plan
The Employee Performance Share Rights Plan (Rights Plan) was approved by shareholders on 25 November 2009. The Rights Plan replaces the EXSOP and no further options will be granted under the EXSOP. The Rights Plan is a long-term incentive plan aimed at advancing the interests of the Company by creating a stronger link between employee performance and reward and increasing shareholder value by enabling participants to have a greater involvement with, and share in the future growth and profitability of the Company. It is an important tool to assist in attracting and retaining talented people.
Share Rights are granted under the plan for no consideration. Share Rights are rights to receive fully paid ordinary shares in the capital of the Company (Shares) in the future if certain individual and/or corporate performance metrics (Performance Conditions) are met in the measurement period. The Board is cognisant of general shareholder concern that long-term equity based reward for staff should be linked to the achievement by the Company of a performance condition. Share Rights granted under the Rights Plan are subject to performance conditions as determined by the Board from time to time. The Share Rights issued are subject to a combination of Performance Conditions:- Time-based Performance conditions which prescribe a period of time that the employee must
stay employed by the Company prior to automatic vesting.
The Total Shareholder Return (TSR) measure which represents the change in the Company’s Share price over the relevant period, plus dividends (if any) notionally reinvested in the Company’s Shares, expressed as a percentage of the opening value. The TSR of the Company from the date of the offer to the measurement date will be compared with the TSR of all mining companies in the ASX S&P 200 Index for the same period excluding, for such time as Paladin does not pay a dividend, all companies that paid a dividend during any year of the measurement period. The number of Share Rights that vest depends on the TSR percentile ranking of the Company, as set out below:
Relative TSR Percentile Ranking Percentage of share rights that may vest if the relative TSR performance condition is met
Less than 50th percentile 0% of the Share Rights subject to the TSR condition
at 50th percentile 50% of the Share Rights subject to the TSR condition
Greater than the 50th percentile but less Pro-rated vesting between 51% and 99% of the than the 75th percentile Share Rights subject to the TSR condition
At 75th percentile or greater 100% of the Share Rights subject to the TSR condition
For
per
sona
l use
onl
y
178
PALADIN ENERGY LTD AND CONTROLLED ENTITIES NOTES TO THE CONSOLIDATED FINANCIAL STATEMENTS (continued)
FOR THE YEAR ENDED 30 JUNE 2013 __________________________________________________________________________________
Employee Performance Share Rights Plan (continued) The Market Price Performance condition measures the increase in share price of the
Company. Share Rights subject to the Market Price Performance Condition will vest if, at the end of the measurement period, the Share price of the Company is 25% above the market price as at the date of the offer.
The Earnings Per Share (EPS) Performance condition, which is determined by dividing the
operating profit attributable to members of the Paladin Group by the weighted average number of Ordinary Shares outstanding during the financial year. Growth in EPS will be measured by comparing the EPS in the base year and the measurement year.
Vesting will only occur if the Company achieves average compound growth in EPS of at least 10% pa over the three year performance period, calculated from the date of the grant of the Share Rights.
The vesting schedule of the Share Rights subject to the EPS conditions is as follows:
Average compound growth EPS Percentage of share rights that may vest if the over the performance period EPS condition is met Less than 10% pa 0% of the Share Rights subject to the EPS condition At 10% pa 50% of the Share Rights subject to the EPS condition More than 10% pa but less than 20% pa Pro-rated vesting between 51% and 99% of the Share
Rights subject to the EPS condition At 20% pa or greater 100% of the Share Rights subject to the EPS condition
When a participant ceases employment prior to the vesting of their Share Rights, the Share Rights lapse unless cessation of employment is due to retirement, total and permanent disablement, redundancy or death. In the event of a change of control all the Share Rights will vest.
Contractor Performance Share Rights Plan The Company has also implemented a plan to reward a small number of key individual contractors, who provide similar services to employees. This plan and the Rights Plan applicable to employees, as detailed above, differ only in respect of the class of individuals who are eligible for participation. This Plan was approved by shareholders on 25 November 2009. (b) Summaries of Options Granted Under EXSOP
The following table illustrates the number (No.) and weighted average exercise prices (WAEP) of and movements in share options issued during the year: 2013
No. 2013
WAEP A$
2012 No.
2012 WAEP
A$ Outstanding at the beginning of the year 4,217,329 4.20 8,231,791 4.36 Forfeited during the year (97,031) 4.50 (972,716) 4.50 Expired during the year (4,120,298) 4.19 (3,041,746)(1) 4.53 Outstanding at the end of the year - - 4,217,329 4.20 Exercisable at the end of the year - - 3,467,329 4.56 (1) Options that can no longer vest were cancelled on 29 June 2012.
For
per
sona
l use
onl
y
179
PALADIN ENERGY LTD AND CONTROLLED ENTITIES NOTES TO THE CONSOLIDATED FINANCIAL STATEMENTS (continued)
FOR THE YEAR ENDED 30 JUNE 2013 __________________________________________________________________________________
294605_9
NOTE 26. SHARE-BASED PAYMENT PLANS (continued) (c) Summaries of Performance Share Rights Granted Under the Rights Plans
The following table illustrates the number (No.) of and movements in share rights issued during the year: 2013
No. 2012 No.
Outstanding at the beginning of the year 6,885,882 6,947,337 Granted during the year(1) - 1,980,400 Forfeited during the year (1,809,075) (928,580) Vested during the year(2) (1,717,850) (1,113,275) Outstanding at the end of the year 3,358,957 6,885,882 (1) No rights granted under the Contractor Performance Share Rights Plan (2012: 145,000). (2) The weighted average share price at the vesting date is A$1.21 (2012: A$1.93). The outstanding balance as at 30 June 2013 is represented by: Date rights granted Vesting date Vesting Performance Conditions Number 26 March 2010 26 March 2014 Relative total shareholder return 150,0005 November 2010 5 November 2013 Earnings per share 250,000 5 November 2010 5 November 2013 Relative total shareholder return 250,000 5 November 2010 1 September 2013 Time based 366,947 5 November 2010 1 September 2013 Relative total shareholder return 293,560 5 November 2010 1 September 2013 Market price 440,340 15 February 2011 15 February 2014 Time based 125,650 2 April 2012 1 September 2013 Time based 235,410 2 April 2012 31 December 2013 Time based 20,000 2 April 2012 1 September 2014 Time based 442,350 2 April 2012 1 September 2014 Relative total shareholder return 313,880 2 April 2012 1 September 2014 Market price 470,820
Total 3,358,957
Please refer to Outstanding Share Information table in the Management Discussion & Analysis for movements since the year end.
For
per
sona
l use
onl
y
180
PALADIN ENERGY LTD AND CONTROLLED ENTITIES NOTES TO THE CONSOLIDATED FINANCIAL STATEMENTS (continued)
FOR THE YEAR ENDED 30 JUNE 2013 __________________________________________________________________________________
294605_9
NOTE 26. SHARE-BASED PAYMENT PLANS (continued) (d) Weighted Average Remaining Contractual Life
The weighted average remaining contractual life for the share rights outstanding as at 30 June 2013 is 0.7 years (2012: 1.0 years). (e) Weighted Average Fair Value
The weighted average fair value of share rights granted during the year was N/A (2012: A$1.47). (f) Rights Pricing Model
The fair value of the equity-settled share rights granted under the plan is estimated as at the date of grant using either the Black-Scholes valuation model for rights with non-market based performance conditions (time based and EPS) or the Monte-Carlo simulation model for rights that contained a market based performance condition (TSR and market price). The following table lists the inputs to the model used for the years ended 30 June 2013 and 30 June 2012. 2013 2012 Dividend yield (%) N/A NilExpected volatility (%) N/A 53%Risk-free interest rate (%) N/A 3.57%Expected life of right (years) N/A 0.4 – 2.4 yearsClosing share price at grant date (A$) N/A A$1.80 The expected volatility was determined using an historical sample of 1 year’s historic data.
For
per
sona
l use
onl
y
181
PALADIN ENERGY LTD AND CONTROLLED ENTITIES NOTES TO THE CONSOLIDATED FINANCIAL STATEMENTS (continued)
FOR THE YEAR ENDED 30 JUNE 2013 __________________________________________________________________________________
The Bigrlyi Joint Venture is involved in the identification of and exploration for uranium resources in the Northern Territory, Australia. The joint venture is between Energy Metals Ltd 53.29%, Southern Cross Exploration NL 5.0% and Northern Territory Uranium Pty Ltd (NTU) 41.71% (NTU is 100% owned by Paladin) with Energy Metals Ltd as manager and operator of the joint venture. Other Joint Ventures
The Group also has a number of other interests in joint ventures to explore for uranium and other minerals. The Group’s share of expenditure in respect of these exploration activities is expensed in accordance with the accounting policy stated in Note 3(s) and no revenue is generated. The Group’s share of the assets and liabilities in respect of these joint ventures is not material.
(b) Assets Utilised in the Bigrlyi Joint Venture
The Group’s share of the assets utilised in these jointly controlled assets, which are included in the Consolidated Financial Statements, is as follows:
2013
US$M 2012 US$M
Non Current Assets Exploration and evaluation expenditure(1) 10.0 37.6 Total assets 10.0 37.6 The interest of NTU in the Bigrlyi Joint Venture was acquired on 7 September 2006 and includes the allocation of the acquisition value.
(1) The 2012 figure includes US$6.8m which relates to the interest in PNT in the Angela Project joint venture which is now 100% owned. (c) Commitments Relating to the Joint Venture
2013 US$M
2012 US$M
Share of tenement commitments (Note 23(a)) 0.1 1.5 (d) Impairment
Assets employed in the jointly controlled assets were impaired by US$17.9M during the year (2012: US$Nil).
NOTE 28. EVENTS AFTER THE BALANCE DATE Other than disclosed below, since the end of the financial year, the Directors are not aware of any other matter or circumstance not otherwise dealt with in this report, that has significantly or may significantly affect the operations of the Group, the results of those operations or the state of affairs of the Group in subsequent years with the exception of the following, the financial effects of which have not been provided for in the 30 June 2013 Financial Report: Strategic Initiative Update On 1 August 2013, the Company advised that it had terminated negotiations with the lead party, and all other parties, for the sale of a minority interest in the Langer Heinrich Mine. In the view of the Board, the current depressed uranium price has meant that it is unlikely that a price that appropriately reflects the strategic value of the asset will be achieved and accordingly proceeding at this time would be detrimental to long-term shareholder value.
For
per
sona
l use
onl
y
182
PALADIN ENERGY LTD AND CONTROLLED ENTITIES NOTES TO THE CONSOLIDATED FINANCIAL STATEMENTS (continued)
FOR THE YEAR ENDED 30 JUNE 2013 __________________________________________________________________________________
294605_9
NOTE 28. EVENTS AFTER THE BALANCE SHEET (continued) Strategic Initiative Update (continued) Although there remains interest in the asset, Paladin believes that the current weakness in the spot uranium price (US$35.50/lb) should not overly influence the valuation of a flagship asset such as Langer Heinrich. Specifically, Langer Heinrich: has a +20 years minelife; is a modern technologically advanced operation; is operating in a country that is politically stable; and is currently operating above nameplate capacity with further expansion capacity. Paladin strongly believes it can generate greater value to its shareholders through postponing the sales process for Langer Heinrich until there is a more a favourable uranium price environment. More generally, Paladin believes that the current low uranium price compromises the capacity for supply to reach clearly stated global demand growth targets. It is generally recognised in the industry that the process for recovery of supply growth can only reasonably start when a sustainable US$70/lb threshold for uranium is reached and Paladin supports this long-term price expectation. In this context, the Langer Heinrich Mine remains a highly valuable and strategically important operation for Paladin. Successful Institutional Placement of Shares to raise A$88M / C$81M On 2 August 2013, the Company announced that it had completed the bookbuild for a private placement to institutional and accredited investors of 125.6M ordinary shares (representing 15% of Paladin’s existing issued capital) raising gross proceeds of approximately A$88M / C$81M. The placement was priced at A$0.70 (C$0.65) per share which represented a 30% discount to Paladin’s last closing price on the ASX. The new shares rank equally with existing shares. Settlement of the new shares issued under the placement occurred on the ASX and the TSX on Monday 12 August 2013 (in each region). Allotment of the new shares issued under the placement occurred on Tuesday 13 August 2013 (in each region). UBS AG, Australia Branch acted as Global Lead Placing Agent to the placement. Adjustment of the Conversion Price of Convertible Bonds On 15 August 2013, the Company announced an adjustment of the Conversion Price in connection to the US$300M convertible bonds due 4 November 2015 and the US$274M convertible bonds due 30 April 2017 (together, the “Bonds”). Pursuant to the terms of the Bonds the prevailing Conversion Price is subject to adjustment where any new issue of shares is at less than 95% of the Current Market Price. Following the completion of the Placement on 12 August 2013, the Conversion Prices have been adjusted as follows: Convertible bonds due 2015: US$5.403 (previously US$5.608)
Convertible bonds due 2017: US$2.109 (previously US$2.19) F
or p
erso
nal u
se o
nly
183
PALADIN ENERGY LTD AND CONTROLLED ENTITIES NOTES TO THE CONSOLIDATED FINANCIAL STATEMENTS (continued)
FOR THE YEAR ENDED 30 JUNE 2013 __________________________________________________________________________________
294605_9
NOTE 29. EARNINGS PER SHARE (i) Basic Earnings Per Share Basic earnings per share are calculated by dividing the profit attributable to equity holders of the Company by the weighted average number of ordinary shares outstanding during the period. (ii) Diluted Earnings Per Share Diluted earnings per share adjusts the figures used in the determination of basic earnings per share to take into account the after income tax effect associated with dilutive potential ordinary shares and the weighted average number of shares assumed to have been issued for no consideration in relation to dilutive potential ordinary shares. Diluted earnings per share is the same as basic earnings per share in 2013 and 2012 as the Group is in a loss position. The following reflects the income and share data used in the basic and diluted earnings per share computations:
2013
US$M 2012
US$M Net loss attributable to ordinary equity holders of the Parent from continuing operations (420.9) (172.8)
2013 Number of Shares
2012 Number of Shares
Weighted average number of ordinary shares for basic and diluted earnings per share 858,113,521 835,645,290 Total number of securities not included in weighted average calculation due to their antidilutive nature in the current period, that could potentially dilute basic earnings per share in the future 181,968,119 210,255,068 The per share calculations for the current and comparative periods have been adjusted to reflect the bonus element of the private share placement disclosed in Note 28. The adjustment factor applied was 1.04.
For
per
sona
l use
onl
y
184
PALADIN ENERGY LTD AND CONTROLLED ENTITIES NOTES TO THE CONSOLIDATED FINANCIAL STATEMENTS (continued)
FOR THE YEAR ENDED 30 JUNE 2013 __________________________________________________________________________________
294605_9
NOTE 30. PARENT ENTITY INFORMATION
2013
US$M 2012 US$M
(a) Information Relating to Paladin Energy Ltd Current assets 85.1 158.1 Total assets 1,387.0 1,740.3 Current liabilities 11.8 142.0 Total liabilities 755.1 671.7 Issued capital 1,845.7 1,839.2 Retained earnings (1,349.6) (908.8) Option application reserve 0.1 0.1 Share-based payments reserve 50.2 52.2 Available-for-sale investment revaluation reserve - 0.4 Convertible bond non distributable reserve 85.5 85.5 Total shareholders’ equity 631.9 1,068.6 Net loss after tax from operations (440.8) (174.4) Total comprehensive loss (441.3) (180.9) (b) Details of Any Guarantees Entered Into by the Parent in Relation to the Debts of its
Subsidiaries As part of the Project Finance Facility for the construction of KM, Paladin has provided a guarantee for the loan outstanding to the lenders. (c) Details of Any Contingent Liabilities of the Parent Entity Paladin has provided the following guarantees:
i. Guarantee of US$20.3M for the LHM Environmental Trust Fund. (d) Details of Any Contractual Commitments by the Parent Entity for the Acquisition of
Property, Plant and Equipment There are no contractual commitments by the parent entity for the acquisition of property, plant and equipment as at reporting date. (e) Tax Consolidation Paladin and its 100% owned Australian resident subsidiaries formed a tax consolidated group (the Group) with effect from 1 July 2003. Paladin is the head entity of the Group. Members of the Group have entered into a tax sharing agreement that provides that the head entity will be liable for all taxes payable by the Group from the consolidation date. The parties have agreed to apportion the head entity’s taxation liability within the Group based on each contributing member’s share of the Group’s taxable income and losses. F
or p
erso
nal u
se o
nly
185
PALADIN ENERGY LTD AND CONTROLLED ENTITIES NOTES TO THE CONSOLIDATED FINANCIAL STATEMENTS (continued)
FOR THE YEAR ENDED 30 JUNE 2013 __________________________________________________________________________________
294605_9
NOTE 30. PARENT ENTITY INFORMATION (continued) (f) Investments in Material Controlled Entities NAME INCORPORATION
INVESTMENT COUNTRY OF PERCENTAGE
INTEREST HELD 2013
% 2012 %
Paladin Finance Pty Ltd Australia 100 100 Paladin Energy Minerals NL Australia 100 100 PEM Malawi Pty Ltd Australia 100 100 Eden Creek Pty Ltd Australia 100 100 Paladin (Africa) Limited Malawi 85 85 Kayelekera Holdings SA Switzerland 100 100 Paladin Netherlands BV Netherlands 100 100 Paladin Netherlands Holdings Cooperatief U.A. Netherlands 100 100 Langer Heinrich Mauritius Holdings Ltd Mauritius 100 100 Langer Heinrich Uranium (Pty) Ltd Namibia 100 100 Valhalla Uranium Pty Ltd Australia 100 100 Northern Territory Uranium Pty Ltd Australia 100 100 Mount Isa Uranium Pty Ltd Australia 100 100 Paladin Nuclear Ltd Australia 100 100 Summit Resources Ltd Australia 82 82 Summit Resources (Aust) Pty Ltd Australia 82 82 Pacific Mines Pty Ltd Australia 82 82 Paladin NT Pty Ltd Australia 100 100 Fusion Resources Pty Ltd Australia 100 100 NGM Resources Pty Ltd Australia 100 100 Indo Energy Ltd B.V.I. 100 100 Paladin Energy Canada Ltd Canada 100 100 Michelin Uranium Ltd Canada 100 100 Paladin Canada Investment (NL) Ltd Canada 100 100 Paladin Canada Holdings (NL) Ltd Canada 100 100 Aurora Energy Ltd Canada 100 100 All investments comprise ordinary shares and all shares held are unquoted, with the exception of Summit’s shares which are quoted on the ASX and Paladin Netherlands Holdings Cooperatief U.A. which issues membership equity.
In accordance with a resolution of the Directors of Paladin Energy Ltd, I state that: In the opinion of the Directors:
(a) the financial statements and notes of Paladin Energy Ltd are in accordance with the Corporations
Act 2001, including:
(i) giving a true and fair view of the consolidated entity’s financial position as at 30 June 2013 and of its performance for the year ended on that date; and
(ii) complying with Australian Accounting Standards (including the Australian Accounting Interpretations) and the Corporations Regulations 2001;
(b) the financial statements and notes also comply with International Financial Reporting Standards as
disclosed in note 3(a);
(c) there are reasonable grounds to believe that the Company will be able to pay its debts as and when they become due and payable; and
(d) this declaration has been made after receiving the declarations required to be made to the
Directors in accordance with section 295A of the Corporations Act 2001 for the financial year ending 30 June 2013.
On behalf of the Board
Mr John Borshoff Managing Director/CEO Perth, Western Australia 29 August 2013
For
per
sona
l use
onl
y
A member firm of Ernst & Young Global Limited Liability limited by a scheme approved under Professional Standards Legislation
GHM:MM:PALADIN:016
Ernst & Young 11 Mounts Bay Road Perth WA 6000 Australia GPO Box M939 Perth WA 6843
Independent auditor's report to the members of Paladin Energy Ltd
Report on the financial report
We have audited the accompanying financial report of Paladin Energy Ltd, which comprises the consolidated statement of financial position as at 30 June 2013 and 30 June 2012, the consolidated statement of comprehensive income, the consolidated statement of changes in equity and the consolidated statement of cash flows for each of the years then ended, notes comprising a summary of significant accounting policies and other explanatory information, and the directors' declaration of the consolidated entity comprising the company and the entities it controlled at the year's end or from time to time during the financial years.
Directors' responsibility for the financial report
The directors of the company are responsible for the preparation of the financial report that gives a true and fair view in accordance with Australian Accounting Standards and the Corporations Act 2001 and for such internal controls as the directors determine are necessary to enable the preparation of the financial report that is free from material misstatement, whether due to fraud or error. In Note 3, the directors also state, in accordance with Accounting Standard AASB 101 Presentation of Financial Statements, that the financial statements comply with International Financial Reporting Standards.
Auditor's responsibility
Our responsibility is to express an opinion on the financial report based on our audit. We conducted our audit in accordance with Australian Auditing Standards. Those standards require that we comply with relevant ethical requirements relating to audit engagements and plan and perform the audit to obtain reasonable assurance about whether the financial report is free from material misstatement.
An audit involves performing procedures to obtain audit evidence about the amounts and disclosures in the financial report. The procedures selected depend on the auditor's judgment, including the assessment of the risks of material misstatement of the financial report, whether due to fraud or error. In making those risk assessments, the auditor considers internal controls relevant to the entity's preparation and fair presentation of the financial report in order to design audit procedures that are appropriate in the circumstances, but not for the purpose of expressing an opinion on the effectiveness of the entity's internal controls. An audit also includes evaluating the appropriateness of accounting policies used and the reasonableness of accounting estimates made by the directors, as well as evaluating the overall presentation of the financial report.
We believe that the audit evidence we have obtained is sufficient and appropriate to provide a basis for our audit opinion.
Independence
In conducting our audit we have complied with the independence requirements of the Corporations Act 2001. We have given to the directors of the company a written Auditor’s Independence Declaration, a copy of which is included in the directors’ report.
For
per
sona
l use
onl
y
A member firm of Ernst & Young Global Limited Liability limited by a scheme approved under Professional Standards Legislation
GHM:MM:PALADIN:016
Opinion
In our opinion:
a. the financial report of Paladin Energy Ltd is in accordance with the Corporations Act 2001, including:
i giving a true and fair view of the consolidated entity's financial position as at 30 June 2013 and 30 June 2012 and of its performance for each of the years ended on those dates; and
ii complying with Australian Accounting Standards and the Corporations Regulations 2001; and
b. the financial report also complies with International Financial Reporting Standards as disclosed in Note 3.
Report on the remuneration report
We have audited the Remuneration Report included in the directors' report for the year ended 30 June 2013. The directors of the company are responsible for the preparation and presentation of the Remuneration Report in accordance with section 300A of the Corporations Act 2001. Our responsibility is to express an opinion on the Remuneration Report, based on our audit conducted in accordance with Australian Auditing Standards.
Opinion
In our opinion, the Remuneration Report of Paladin Energy Ltd for the year ended 30 June 2013, complies with section 300A of the Corporations Act 2001.
Ernst & Young
G H Meyerowitz Partner Perth 29 August 2013
For
per
sona
l use
onl
y
189
ADDITIONAL INFORMATION __________________________________________________________________________________
Tenements held (continued) Operators Paladin Equity Note (direct and indirect)
EME Energy Metals Limited 0% FSN Fusion Resources Pty Ltd 100% LHU Langer Heinrich Uranium (Pty) Limited 100% MIU Mount Isa Uranium Pty Ltd 100% AML Aston Metals (Qld) Limited 0% NTU Northern Territory Uranium Pty Ltd 100% PAC Pacific Mines Pty Ltd 100% PAL Paladin (Africa) Ltd 100% 1 PEM Paladin Energy Minerals NL 100% SRA Summit Resources (Aust) Pty Ltd 82.08% 2 AUR Aurora Energy Ltd 100% IEL Indo Energy Ltd 100% PDN Paladin Energy Ltd Notes
1. Paladin holds 85% equity in Paladin (Africa) Limited (“PAL”) with 15% equity having been issued to the Government of Malawi pursuant to the terms of the Development Agreement for KM between the Government of Malawi, PAL and Paladin Energy Minerals NL.
2. Paladin’s interest in these tenements is held by virtue of Paladin’s 82.08% equity holding in Summit
Resources Limited which in turn holds 100% equity interest in Summit Resources (Aust) Pty Ltd (“SRA”) and Pacific Mines Pty Ltd.
3. The Vallhalla and Skal uranium deposits lie within the Isa North tenement block within defined blocks of
land (17km2 and 10km2 respectively) subject to the Isa Uranium Joint Venture between SRA (50% and Operator) and Mount Isa Uranium Pty Ltd (50%).
4. Aston Metals (Qld) Limited earned 80% equity in the Western Isa Joint Venture tenements through
expenditure of A$8M within three years of commencement (10 December 2007). SRA and Pacific Mines Pty Ltd have retained up to 20% equity in each of these tenements. Aston Metals (Qld) Limited were formally known as MM Mining (Qld) Limited.
Tenement Types
EL Exploration Licence (Australia) EPL Exclusive Prospecting Licence (Africa) EPM Exploration Permit for Minerals (Australia) ERL Exploration Retention Licence (Australia) MC Mineral Claim (Australia) ML Mining Lease (Australia) MLI Mining Licence (Africa) MLC Mineral Licence (Newfoundland/Labrador) (A) Pending Application
A$ Australian dollars bcm bank cubic metres BFS Bankable Feasibility Study CCD Counter Current Decantation DFS Definitive Feasibility Study DIFR disabling incident frequency rate ft feet g gram g/m3 grams per cubic metre g/t grams per tonne hr hours ISO International Organisation for
Standardisation ISR in situ recovery JORC Joint Ore Reserves Committee K thousand kg kilogram kg/t kilogram per tonne km kilometres KM Kayelekera Mine km2 square kilometres kW kilowatts lb pounds LHM Langer Heinrich Mine LHUPL Langer Heinrich Uranium (Pty) Ltd LTI lost time injury LTIFR lost time injury frequency rate M million Mlb million pounds
m metres Ma million years MIK Multiple Indicator Kriging mm millimetres MMI Mobile Metal Ion mSv millisiverts Mtpa million tonnes per annum NI National Instrument NOSA National Occupational Safety Association NPV net present value OK Ordinary Kriging pa per annum PAL Paladin (Africa) Limited PFS Pre-feasibility study ppb parts per billion ppm parts per million QAQC Quality assurance and quality control QC quality control RC reverse circulation RIP resin-in-pulp t tonnes t/m3 tonnes per cubic metre tpa tonnes per annum tph tonnes per hour U uranium U3O8 Uranium Oxide US$ US dollars w:o waste to ore ratio
31 October 2013 September Quarterly Activities Report (ASX)
14 November 2013 September Quarterly Financial Statements including MD&A (TSX)
15 November 2013 Conference Call and Investor Update (proposed date)
21 November 2013 Annual General Meeting to be held in Perth, Western Australia
2014
31 January 2014 December Quarterly Activities Report (ASX)
13 February 2014 Half Yearly Financial Statements incorporating December Quarter and MD&A (Appendix 4D - ASX)
14 February 2014 Conference Call and Investor Update (proposed date)
30 April 2014 March Quarterly Activities Report (ASX)
15 May 2014 March Quarterly Financial Statements including MD&A (TSX)
16 May 2014 Conference Call and Investor Update (proposed date)
31 July 2014 June Quarterly Activities Report (ASX)
28 August 2014 Audited Annual Financial Statements for the year ended 30 June 2013 including MD&A (ASX/TSX) & (Appendix 4E - ASX)
29 August 2014 Conference Call and Investor Update (proposed date)
29 September 2014 Annual Information Form (TSX)
31 October 2014 September Quarterly Activities Report (ASX)
13 November 2014 September Quarterly Financial Statements including MD&A (TSX)
14 November 2014 Conference Call and Investor Update (proposed date)
20 November 2014 Annual General Meeting to be held in Perth, Western Australia
Please note the lodgement dates are deadlines and reports may be released early.
For
per
sona
l use
onl
y
194
CORPORATE DIRECTORY
294605_9
Directors Non-executive Chairman Mr Rick Crabb Managing Director/CEO Mr John Borshoff Non-executive Directors Mr Sean Llewelyn Mr Donald Shumka Mr Peter Donkin Mr Philip Baily Registered Office Level 4, 502 Hay Street Subiaco Western Australia 6008 Telephone: (+61 8) 9381 4366 Facsimile: (+61 8) 9381 4978 Email: [email protected] Web: www.paladinenergy.com.au Share Registries Australia Computershare Investor Services Pty Ltd Level 2, 45 St Georges Terrace Perth Western Australia 6000 Telephone: (+61 8) 9323 2000 Facsimile: (+61 8) 9323 2033 Canada Computershare Investor Services Inc. 100 University Avenue, 8th Floor Toronto, Ontario M5J 2Y1 Telephone: 1 800 564 6253 (within North America) or (+1) 514 982 7555 Facsimile: (+1) 416 263 9394 or 1 888 453 0330 (within North America) Paladin Energy Ltd is a company limited by shares, incorporated and domiciled in Australia. Its registered office and principal place of business is: Paladin Energy Ltd Level 4, 502 Hay Street SUBIACO WA 6008 Through the use of the internet, we have ensured that our corporate reporting is timely, complete, and available globally at minimum cost to the Company. All press releases, financial statements and other information are available on our website www.paladinenergy.com.au.
Investor Relations Australia – Corporate Office Mr Andrew Mirco Level 4, 502 Hay Street Subiaco Western Australia 6008 (PO Box 201, Subiaco, 6904) Telephone: (+61 8) 9381 4366 Facsimile: (+61 8) 9381 4978 Email: [email protected] North America Mr Greg Taylor Oakville, ON Canada Telephone: (+1) 905 337 7673 Mobile: (+1) 416 605 5120 Facsimile: (+1) 905 844 6532 Email: [email protected] Auditors Ernst & Young 11 Mounts Bay Road Perth Western Australia 6000 Stock Exchange Listings Australian Securities Exchange and Toronto Stock Exchange Code: PDN Munich, Berlin, Stuttgart and Frankfurt Stock Exchanges Code: PUR Namibian Stock Exchange Code: NM-PDN