35
2011 M-Commerce Audit Summary Internet Retailer 500 Q3 2011
| Date post: | 14-Jul-2015 |
| Category: |
Technology |
| Upload: | e-commerce-news |
| View: | 737 times |
| Download: | 1 times |

2011 M-Commerce Audit Summary Internet Retailer 500Q3 2011

© 2011 Acquity Group, LLC | Confidential & Proprietary | www.acquitygroup.com |
ACQUITY GROUP OVERVIEW
22

3
1 Top 5 independent digital agency – 2010 & 2011, Advertising Age
Who We Are
Acquity Group is a leading digital strategy, experience design, and online technology services firm.
» Headquartered in Chicago with 12 offices globally
» Over 475 experienced business, design, marketing and technology professionals
» We have been a trusted partner to more than 600 clients on thousands of projects
» One of the top five independent digital agencies in the country1

4
Partnering With The World’s Leading Brands
Acquity Group has worked with more than 600 clients over our ten year history, and is currently engaged with over 70 on a variety of initiatives.
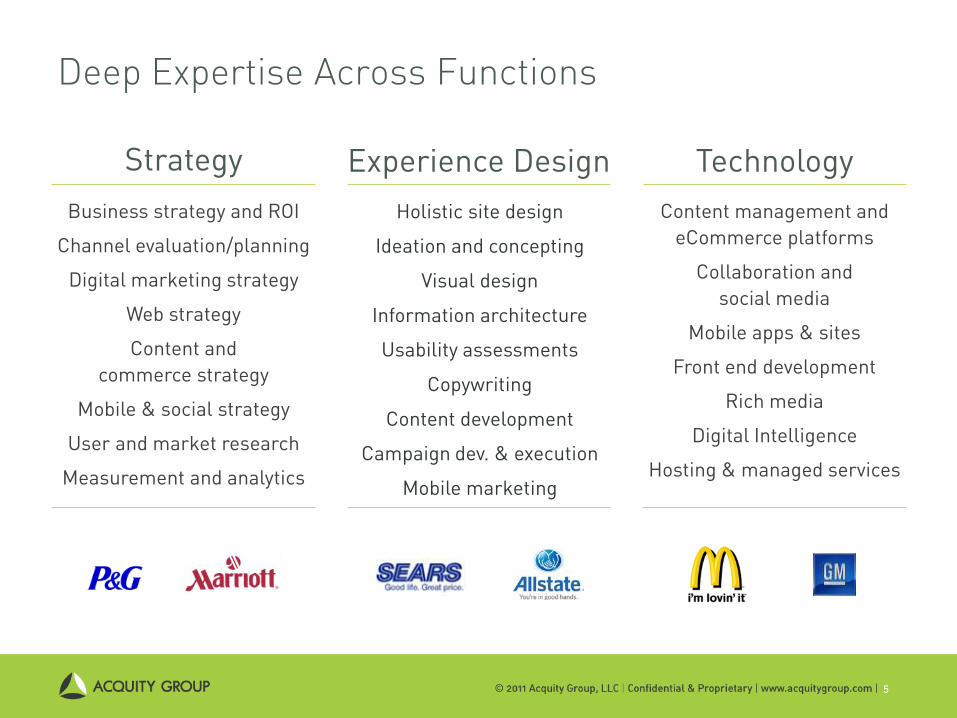
Experience DesignHolistic site design
Ideation and concepting
Visual design
Information architecture
Usability assessments
Copywriting
Content development
Campaign dev. & execution
Mobile marketing
Content management and eCommerce platforms
Collaboration andsocial media
Mobile apps & sites
Front end development
Rich media
Digital Intelligence
Hosting & managed services
TechnologyBusiness strategy and ROI
Channel evaluation/planning
Digital marketing strategy
Web strategy
Content andcommerce strategy
Mobile & social strategy
User and market research
Measurement and analytics
Strategy
Deep Expertise Across Functions
5

© 2011 Acquity Group, LLC | Confidential & Proprietary | www.acquitygroup.com |
M-COMMERCE AUDIT OVERVIEW
66

7
The Mobile Commerce Audit. What is it?
Acquity Group performs an annual Mobile Commerce Audit in conjunction with Internet Retailer’s Top 500 and EU Top 300 guides to identify companies and industries on the leading edge of mobile initiatives, both in the US and the EU.
» Analysis of the top 500 online retailers
» Executed annually since 2009
» Also in conjunction with Internet Retailer, we perform a separate, detailed assessment of 375+ retailers, ticket sellers and travel/hospitality organizations active in the mobile channel to understand what tactics are being used: the Mobile Commerce Data Book.

2011 M-Commerce Audit: Candidate Identification
8
Selecting the pool of candidates…
» We start with the full list of 500 top online retailers, as ranked by Internet Retailer
» Multiple brands for one company were only considered in cases where two brands had significantly different desktop websites
» For companies who feature both retail and non-retail sites for their brand, only the retail sites were considered
» The final pool of candidates totaled 535 sites
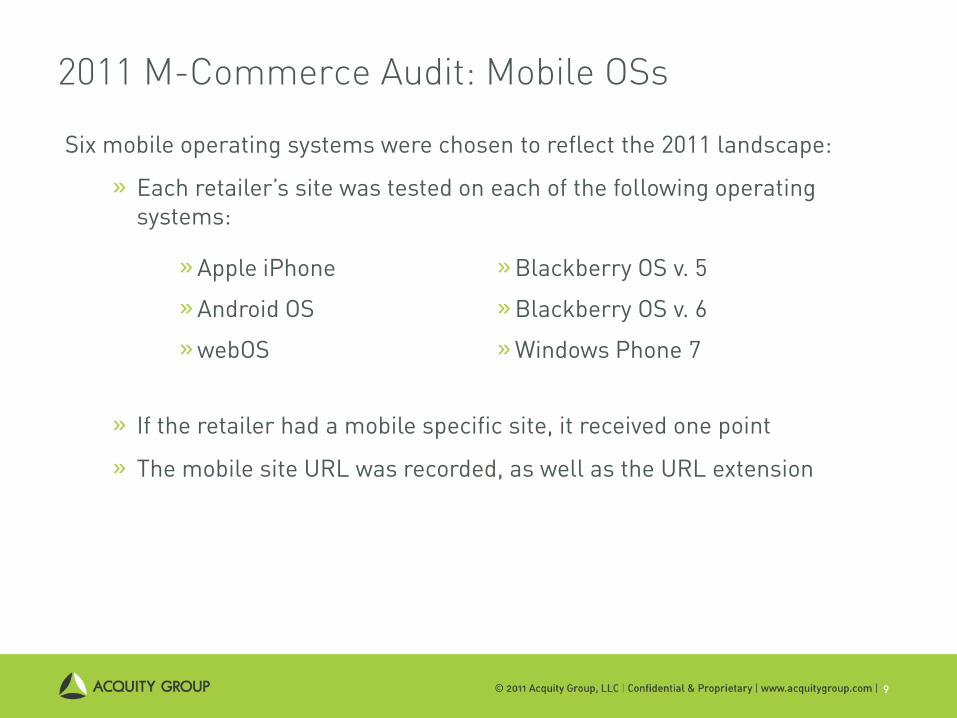
2011 M-Commerce Audit: Mobile OSs
9
Six mobile operating systems were chosen to reflect the 2011 landscape:
» Each retailer’s site was tested on each of the following operating systems:
» If the retailer had a mobile specific site, it received one point
» The mobile site URL was recorded, as well as the URL extension
» Apple iPhone
» Android OS
» webOS
» Blackberry OS v. 5
» Blackberry OS v. 6
» Windows Phone 7
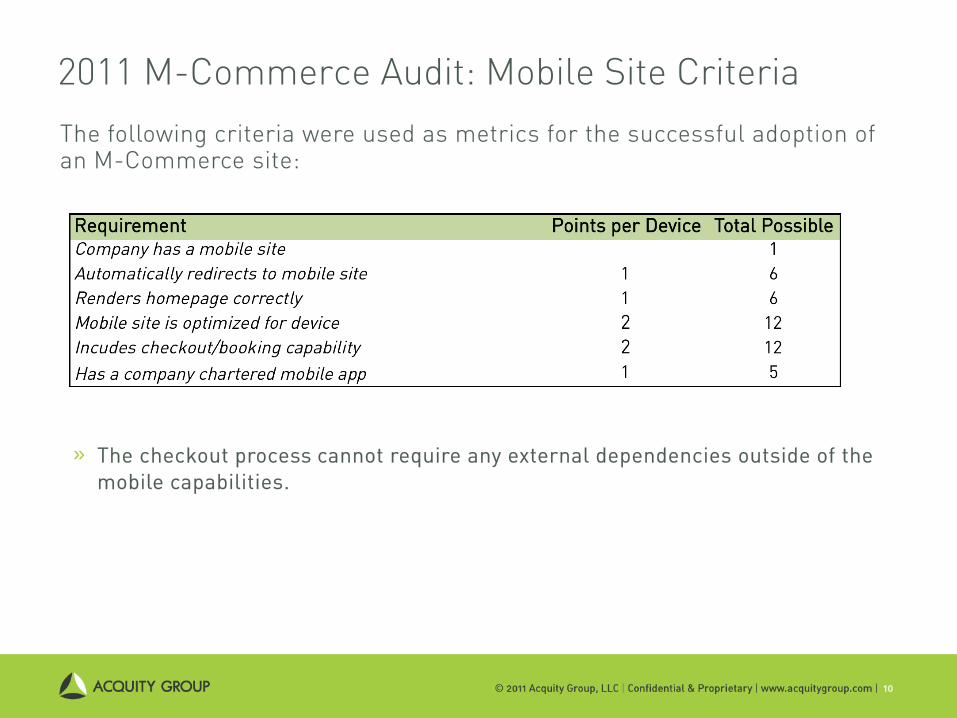
2011 M-Commerce Audit: Mobile Site Criteria
10
The following criteria were used as metrics for the successful adoption of an M-Commerce site:
» The checkout process cannot require any external dependencies outside of the mobile capabilities.

2011 M-Commerce Audit: App Availability
11
Testing process and scoring of mobile apps…
» Mobile Applications for each of the top 500 retailers were searched for at each of the following stores:
» Apple iTunes App Store» Google’s Android Marketplace» Blackberry App World» Palm’s App Catalog for webOS» Windows Mobile Marketplace
» Third party apps were not counted

2011 M-Commerce Audit: Final Ranking
12
» The final score for each site was calculated as the sum of both the Mobile Device Detection score and the Mobile Applications score (total of 42 points).
» Each site that registered at least one point was ranked by their final score.
» If sites had a common score, they were then ordered by their composite score breakdown: a site’s Mobile Device Detection score was given priority over their Mobile Applications score
» If sites still had a common score, they were then ordered by the following:
Devices supported > Mobile apps offered > Mobile Site Score > Redirect Score > Site Rendering Score > Optimization Score > Checkout/Booking Score » If sites still had a common score, they were finally ordered by their Top
500 rank awarded by Internet Retailer.

© 2011 Acquity Group, LLC | Confidential & Proprietary | www.acquitygroup.com |
M-COMMERCE AUDIT HIGHLIGHTS
1313

Annual Comparison
14
12% of sites compatible with mobile browsers
11% of sites optimized for iPhone
7% had downloadable apps
2010 37% of sites compatible with mobile browsers
9% of sites optimized for iPhone
26% had downloadable apps
2011

Interesting Numbers
37% of companies have a mobile website
That’s a 210% increase over last year
23% featured a downloadable iPhone app
There was a 278% increase in the number of retailers with a mobile app
18% of companies had both a mobile site and a downloadable app
26% of sites rendered properly on all six mobile devices
Of mobile-compatible sites, 21% followed the m. subdomain standard
15

The Top 10
16

Notable Findings
17
Key Finding Conclusion
While 23% of companies featured a downloadable iPhone app, very few had Blackberry or webOS apps. Android, with 20% growth over last year, had the highest rate of growth.
There were massive gains in both the number of top retailers with a mobile site (37%, a 210% increase) and the number with a mobile app (26%, a 278% increase).
Even though the overall number of sites didn’t change from our 2010 analysis, the ticket industry showed the highest percentage-changes, with the largest growth in site redirection and checkout abilities.
In the ticket industry, differentiation and market share is related to value-added services, including mobile capabilities. Simply put, a company in this industry cannot maintain a competitive edge without offering ticket purchase & management on mobiles devices.
2011 was the year that mobile truly took hold – and took off. Although there is still tremendous room for growth, retailers have accepted mobile as a key platform for growth and customer engagement.
Retailers are following the general industry trend to the two top smartphone platforms in the US: iOS and Android. Any mobile applications on the other platforms seemed to be supplementary.

Mobile App Presence
18
23%
10%
3%0%
3%
% have iPhone app
% have Android app
% have Windows Phone
7 app
% have WebOS app
% have Blackberry app
Mobile App Adoption in 2011

© 2011 Acquity Group, LLC | Confidential & Proprietary | www.acquitygroup.com |
M-COMMERCE AUDIT INDUSTRY DETAILS
1919
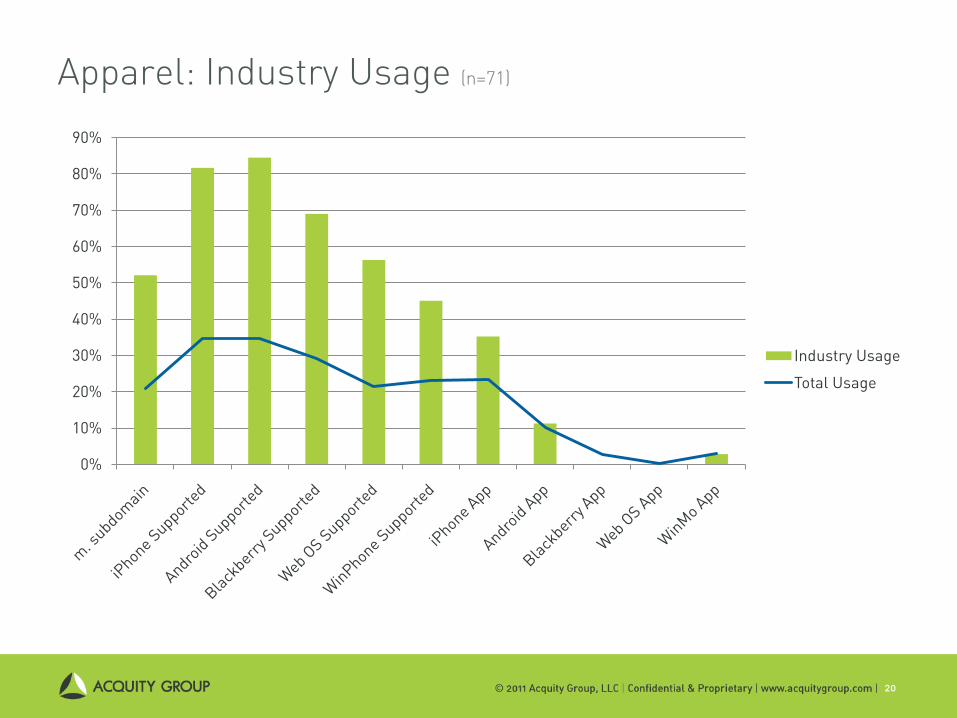
Apparel: Industry Usage (n=71)
20
0%
10%
20%
30%
40%
50%
60%
70%
80%
90%
Industry Usage
Total Usage

Books/Music/Video: Industry Usage (n=20)
21
0%
10%
20%
30%
40%
50%
60%
70%
Industry Usage
Total Usage

Computer/Electronics: Industry Usage (n=23)
22
0%
10%
20%
30%
40%
50%
60%
70%
80%
90%
Industry Usage
Total Usage

Food/Drug: Industry Usage (n=16)
23
0%
10%
20%
30%
40%
50%
60%
70%
Industry Usage
Total Usage

Flowers/Gifts: Industry Usage (n=3)
24
0%
20%
40%
60%
80%
100%
120%
Industry Usage
Total Usage

Health/Beauty: Industry Usage (n=10)
25
0%
10%
20%
30%
40%
50%
60%
70%
80%
Industry Usage
Total Usage

Hardware/Home Improvement: Industry Usage (n=11)
26
0%
20%
40%
60%
80%
100%
120%
Industry Usage
Total Usage

Housewares/Home Furnishings: Industry Usage (n=10)
27
0%
10%
20%
30%
40%
50%
60%
Industry Usage
Total Usage

Jewelry: Industry Usage (n=6)
28
0%
20%
40%
60%
80%
100%
120%
Industry Usage
Total Usage
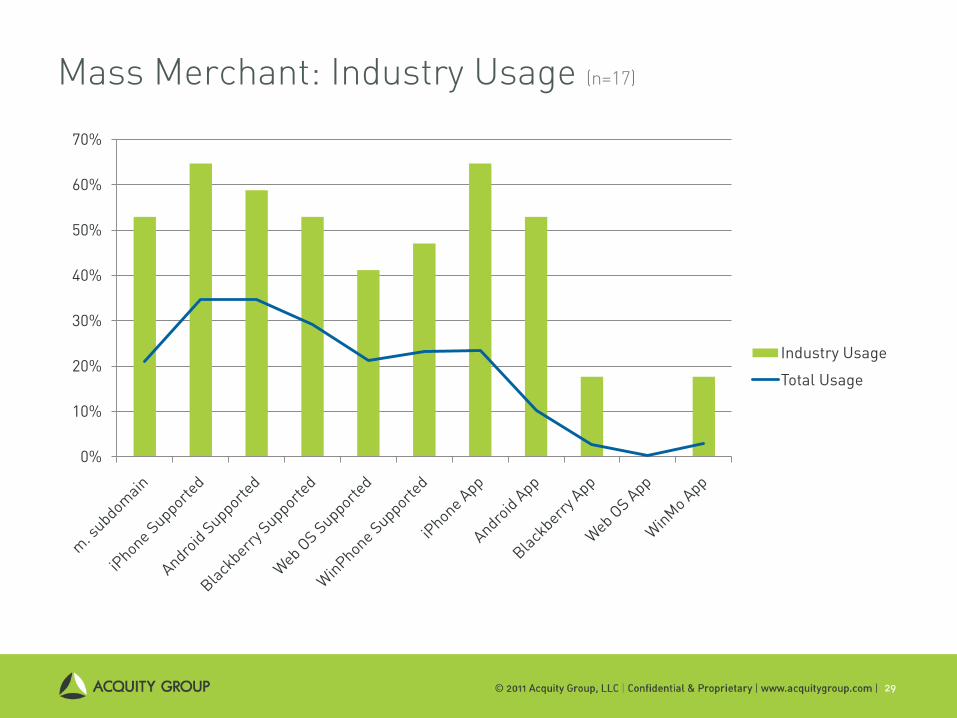
Mass Merchant: Industry Usage (n=17)
29
0%
10%
20%
30%
40%
50%
60%
70%
Industry Usage
Total Usage

Office Supplies: Industry Usage (n=6)
30
0%
10%
20%
30%
40%
50%
60%
70%
80%
90%
Industry Usage
Total Usage

Shoes: Industry Usage (n=13)
31
0%
10%
20%
30%
40%
50%
60%
70%
80%
90%
Industry Usage
Total Usage
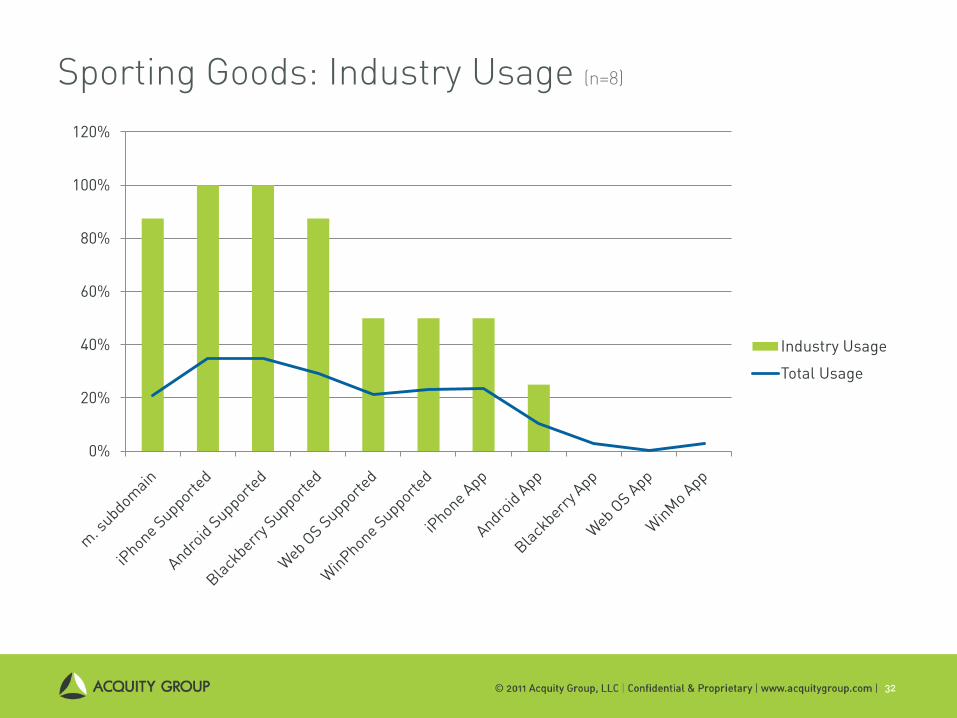
Sporting Goods: Industry Usage (n=8)
32
0%
20%
40%
60%
80%
100%
120%
Industry Usage
Total Usage
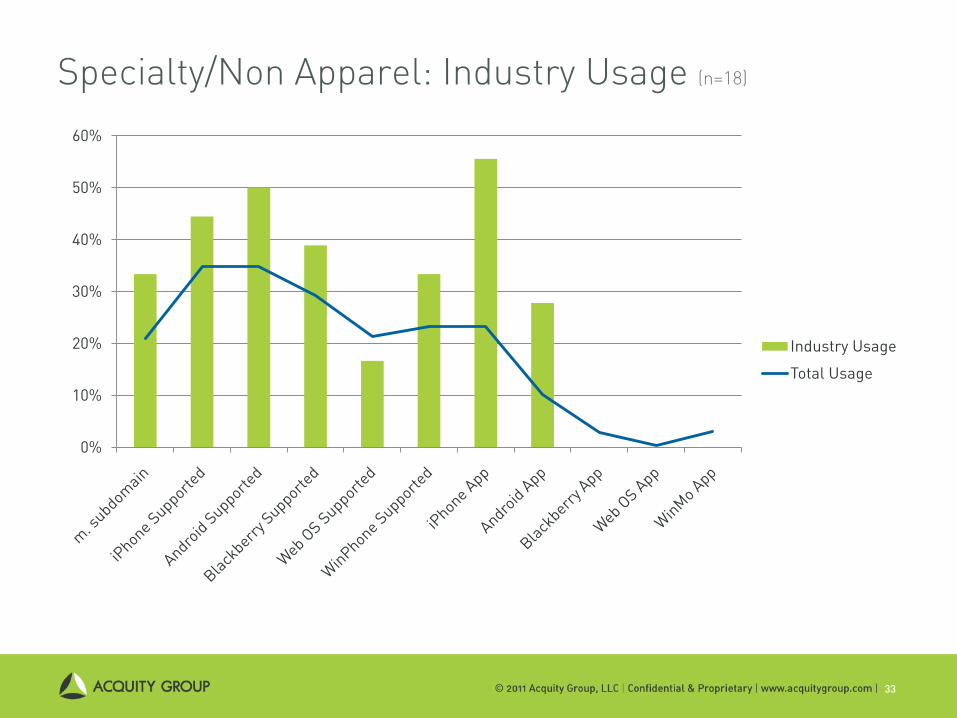
Specialty/Non Apparel: Industry Usage (n=18)
33
0%
10%
20%
30%
40%
50%
60%
Industry Usage
Total Usage

Toys/Hobbies: Industry Usage (n=24)
34
0%
10%
20%
30%
40%
50%
60%
70%
Industry Usage
Total Usage

Tom Nawara – VP, Digital Strategy & Design(312) 427-2058 | [email protected]
Matt Schmeltz – EVP Sales & Marketing(312) 427-2040 | [email protected]


![SALES OFFICES - Waters Corporation · 2015-01-22 · [ COURSE CATALOG – EUROPE 2015-2016 ] Waters, The Science of What’s Possible,ACQUITY, ACQUITY UltraPerformance LC, ACQUITY](https://static.documents.pub/doc/80x56/5f95d93fd4c3ba248e0b8277/sales-offices-waters-corporation-2015-01-22-course-catalog-a-europe-2015-2016.jpg)


