ACT 330 Sec: 03
Submitted By: Mega Mind Submitted To: Mrs. Nabila Nisha
Sourov Agarwal 113 0699 030 Mohammed Naeem 113 0512 030
Hussain Nabiul Mannan 141 1679 030 Khorsed Alam Prince 141 1765 030
MegaMind Page | 1
Letter of Transmittal
7th
August 2015
Mrs. Nabila Nisha
Lecturer,
Dept. of Accounting & Finanace (BBA)
North South University, Dhaka, Bangladesh.
Subject: Permission for submitting the Group Project Report
Dear Madam,
It is indeed a great pleasure to have the opportunity to submit the report. We have prepared
this report in accordance with the instructions given by you. You provided us
four Pharmaceuticals & Chemicals companies, which are Kohinoor Chemicals, Beximco
Pharma, Abbott Laboratories, Pharmstandard. We did accounting analysis and financial
analysis of those four companies and we think that, working on this topic was very interesting
and we have explored something remarkable through our report. This report is to describe our
observation, learning and recommendation based on the knowledge and the experiences
gained during the course under your supervision. This report has provided us learning
opportunity and compares theoretical knowledge with practical situations.
We hope that, you would be kind enough to accept our report and bless us.
Sourov Agarewal
Mohammed Naeem
Hussain Nabiul Mannan
Khorsed Alam Prince
MegaMind Page | 2
Abstract
The purpose of this project is to enhance our understanding of US GAAP, IFRS and BFRS
Financial statements and Analysis techniques for computation. We have got the chance to
apply all the knowledge that we have gathered from our class and tried to apply it to the best
of our knowledge. Firstly, we focused on doing accounting analysis for all four of our
selected companies. Then we analyzed on the financial stance of the companies. Besides that,
we have also interpreted and compared the ratios between the companies. We have observed
that despite operating in the same industry, there are many discrepancies in them, which is
why we have realized the need for international convergence.
The success of this project depended on the contribution of all the group members & their
thoughtful guidance and suggestions in an effort to provide a useful and reliable report
MegaMind Page | 3
Table of Contents
Introduction: Company Overview ......................................... 4-5
Appendix A .............................................................................. 6-7
Appendix B .................................................................................. 8
Appendix C ............................................................................ 9–12
Appendix C-1.1 ......................................................................... 9
Appendix C-1.2 ....................................................................... 10
Appendix C-1.3 ....................................................................... 11
Appendix C-1.4 ....................................................................... 12
Appendix D: Ratio analysis Table 1 ........................................ 13
Interpretations of Appendix D ........................................... 14–17
Appendix E: Ratio analysis Table 2 ........................................ 18
Interpretations of Appendix E ........................................... 19–22
Appendix F: Ratio analysis Table 3 ......................................... 23
Interpretations of Appendix F .......................................... 24– 27
MegaMind Page | 4
Introduction: Company Overview
Kohinoor Chemical Company (Bangladesh) Limited is popularly known by the legendary
beauty product under the brand "Tibet". For more than half a century Tibet has made its mark
in the hearts of millions. Kohinoor are the pioneer amongst the soap, cosmetics and toiletries
manufacturing industries of Bangladesh, producing highly value-added products with quality
in the center of focus. Kohinoor care for the customers and are determined to count extra
mileage to meet their daily needs. Kohinoor believe that it is the quality that has kept Tibet
going and growing for 55 years.
Beximco Pharmaceuticals Ltd (Beximco Pharma) is an emerging generic drug player
committed to providing access to affordable medicines. Company’s state-of-the-art
manufacturing facilities have been accredited by the regulatory authorities of USA, Australia,
European Union, Canada, and Brazil, among others, and it currently focuses on building
presence in many emerging and developed markets around the world. Beximco Pharma is
consistently building upon its portfolio and currently producing more than 500 products
encompassing broad therapeutic categories and the Company has created strong
differentiation by offering a range of high-tech, specialized products which are difficult to
imitate.
MegaMind Page | 5
Abbott Laboratories is an American pharmaceuticals and health care products company. It
has 72,000 employees and operates in over 130 countries. The company headquarters are in
Abbott Park, North Chicago, Illinois. The company was founded by Chicago physician
Wallace Calvin Abbott in 1888. In 1985, the company developed the first HIV blood-
screening test. The company's drug portfolio includes Humira, a drug for rheumatoid arthritis,
psoriatic arthritis, ankylosing spondylitis, Crohn's disease, moderate to severe chronic
psoriasis and juvenile idiopathic arthritis; Norvir, a treatment for HIV; Depakote, an
anticonvulsant drug; and Synthroid, a synthetic thyroid hormone. Abbott also has a broad
range of medical devices, diagnostics and immunoassay products as well as nutritional
products, including Ensure, a line of meal replacement shakes; and EAS, the largest producer
of performance-based nutritional supplements. The company's in-vitro diagnostics business
performs immunoassays and blood screening.
Pharmstandard is the leading Russian pharmaceutical company, it is headquartered in
Dolgoprudny. Pharmstandard portfolio includes over 200 products used in the treatment of
diabetes, growth hormone deficiency, cardiovascular diseases, gastroenterological and
neurological disorders, infectious diseases, cancer, etc. Over 90 products offered by
Pharmstandard are included in the List of Vital Pharmaceutical Products. The company has
six manufacturing facilities located in Moscow, Ufa, Nizhny Novgorod, Kursk, Tomsk and
Tyumen.
MegaMind Page | 6
Appendix A: Event Exhibit
Company Significant Transactions
Kohinoor Chemicals 1. Interest income has been separated on
the basis of accrual method.
2. Effect of inflation was not considered
in preparing the financial statements.
3. In 2013 they spent extra entertainment
expenditures.
4. No donations & subscriptions were
made this year.
5. No sales promotion expenses are
included.
6. Did not have liveries and uniform
expense.
Beximco Pharma 1. Office equipment not considered this
year.
2. Land, building and plant & machinery
was revalued using Current Cost
Method.
3. Bonus share issued in 2013 was only
10% of bonus shared issued in 2012
4. Prepaid expenses and Overseas
Liaison Office expenses acquired this
year.
5. Short term borrowings from AB Bank
and Noor Islamic Bank
Abbott Laboratories 1. Research-based proprietary
pharmaceuticals business is
discontinued.
2. Time to consolidate foreign
subsidiaries accounts has been
changed.
MegaMind Page | 7
3. Acquired 100 percent of IDEV
Technologies, net of debt, for $310
million, in cash.
4. Recorded goodwill of approximately
$274 million in 2013 related to the
acquisitions of IDEV Technologies
and OptiMedica.
5. Foreign subsidiaries enter into foreign
currency forward exchange contracts
to manage exposures to changes in
foreign exchange rates for anticipated
intercompany purchases by those
subsidiaries whose functional
currencies are not the U.S. dollar.
Pharmstandard 1. Adopted to new accounting policies
(IFRS 10, IFRS 11, IFRS 12, IFRS
13, IAS 19)
2. Accusation of Bever Pharmaceutical
Pte Ltd.
3. Acquired 11% of non-controlling
interests in Donelle Company
Limited.
4. OTCpharm was registered and its
shares were proportionally distributed
among the shareholders of the
Company.
5. Acquired Pharmstandard International
S.A.
6. Provided unsecured US$ denominated
short-term loan to Augment.
MegaMind Page | 8
Appendix B: Estimates Exhibit
Kohinoor
Chemicals
Beximco Pharma Abbott
Laboratories
Pharmstandard
Accrued expenses Depreciation Sales rebates Inflation rate
Income taxes Inventory valuation Income taxes Intangible assets
valuation
Depreciation Accrued expenses Pension Income Taxes
Inflation rate Selling price of
Inventories
Intangible assets
valuation
Leases
Payable valuation of
intangible assets
Allowance for
doubtful accounts
receivable
Deferred liability for
gratuity
Litigation Impairment
Derivative financial
instruments
Inventories to net
realizable value
Inventory Useful life of
property, plant and
equipment
Accounts receivable
exposures
Leases
MegaMind Page | 9
Appendix C 1.1: Comparison Exhibit
Accounting Policy IFRS Company:
Pharmstandard
U.S Company:
Abbott (GAAP)
Comment
Inventory
Valuation
Inventories are
recorded at the lower
of cost and net
realizable value. Cost
is determined on a
first in, first out basis.
Inventories are stated
at the lower of cost
(first-in, first-out
basis)
Same method for
valuation of
inventory. This is
because there are not
many differences
between the GAAP
and IFRS standards.
Property, Plant &
Equipment
straight-line basis straight-line basis Similar method. And
that is acceptable
because this method
is used by many
companies.
Cash Flow
Presentation
Indirect Indirect Same method by both
companies
Revenue
Recognition
Accrued basis -
Revenue is
recognized before
cash is received
Accrued basis -
Revenue is
recognized before
cash is received
Both company uses
cash basis for
revenue
reorganization.
Goodwill it is recorded using
impairment
Initially, fair value of
net assets. After
initial recognition, it
is recorded using
impairment.
In case of goodwill
both companies later
use impairment
however initially
Abbott uses fair
market value of net
asset but
Pharmstandard is not
given.
Other intangible
assets
Initially, fair value of
net assets. After
initial recognition, it
is recorded using
impairment.
Initially, fair value of
net assets. After
initial recognition, it
is recorded using
impairment.
Similar method to
record other
intangible assets.
MegaMind Page | 10
Appendix C 1.2
Accounting Policy Local Company:
kohinoor
U.S Company:
Abbott (GAAP)
Comment
Inventory Valuation ----- Inventories are stated
at the lower of cost
(first-in, first-out
basis)
We cannot compare
because not enough
data available.
Property, Plant &
Equipment
straight-line basis straight-line basis Similar method. And
that is acceptable
because this method
is used by many
companies.
Cash Flow
Presentation
Indirect Indirect Same method by
both companies
Revenue
Recognition
------- Accrued basis -
Revenue is
recognized before
cash is received
We cannot compare
because not enough
data available.
Goodwill Impairment Initially, fair value of
net assets. After
initial recognition, it
is recorded using
impairment.
In case of goodwill
both companies later
use impairment
however initially
Abbott uses fair
market value of net
asset but kohinoor
uses impairment all
the way.
Other intangible
assets
------- Initially, fair value of
net assets. After
initial recognition, it
is recorded using
impairment.
We cannot compare
because not enough
data available.
MegaMind Page | 11
Appendix C 1.3
Accounting Policy Local Company:
kohinoor
IFRS Company:
Pharmstandard
Comment
Inventory Valuation ----- Inventories are
recorded at the lower
of cost and net
realizable value. Cost
is determined on a
first in, first out basis.
We cannot compare
because not enough
data available.
Property, Plant &
Equipment
straight-line basis straight-line basis Similar method. And
that is acceptable
because this method is
used by many
companies.
Cash Flow
Presentation
Indirect Indirect Same method by both
companies
Revenue Recognition ------- Accrued basis -
Revenue is recognized
before cash is
received
We cannot compare
because not enough
data available.
Goodwill Impairment it is recorded using
impairment
In case of goodwill
both companies use
impairment.
Other intangible
assets
------- Initially, fair value of
net assets. After initial
recognition, it is
recorded using
impairment.
We cannot compare
because not enough
data available.
MegaMind Page | 12
Appendix C 1.4
Accounting Policy Local Company:
kohinoor
Industry
Benchmark:
Beximco
Comment
Inventory Valuation ----- Inventories are
recorded at the lower
of cost and net
realizable value. Cost
is determined on a
first in, first out basis.
We cannot compare
because not enough
data available.
Property, Plant &
Equipment
straight-line basis straight-line basis Similar method. And
that is acceptable
because this method is
used by many
companies.
Cash Flow
Presentation
Indirect Indirect Same method by both
companies
Revenue Recognition ------- Accrued basis -
Revenue is recognized
before cash is
received
We cannot compare
because not enough
data available.
Goodwill Impairment it is recorded using
impairment
In case of goodwill
both companies use
impairment.
Other intangible
assets
------- it is recorded using
impairment.
We cannot compare
because not enough
data available.
MegaMind Page | 13
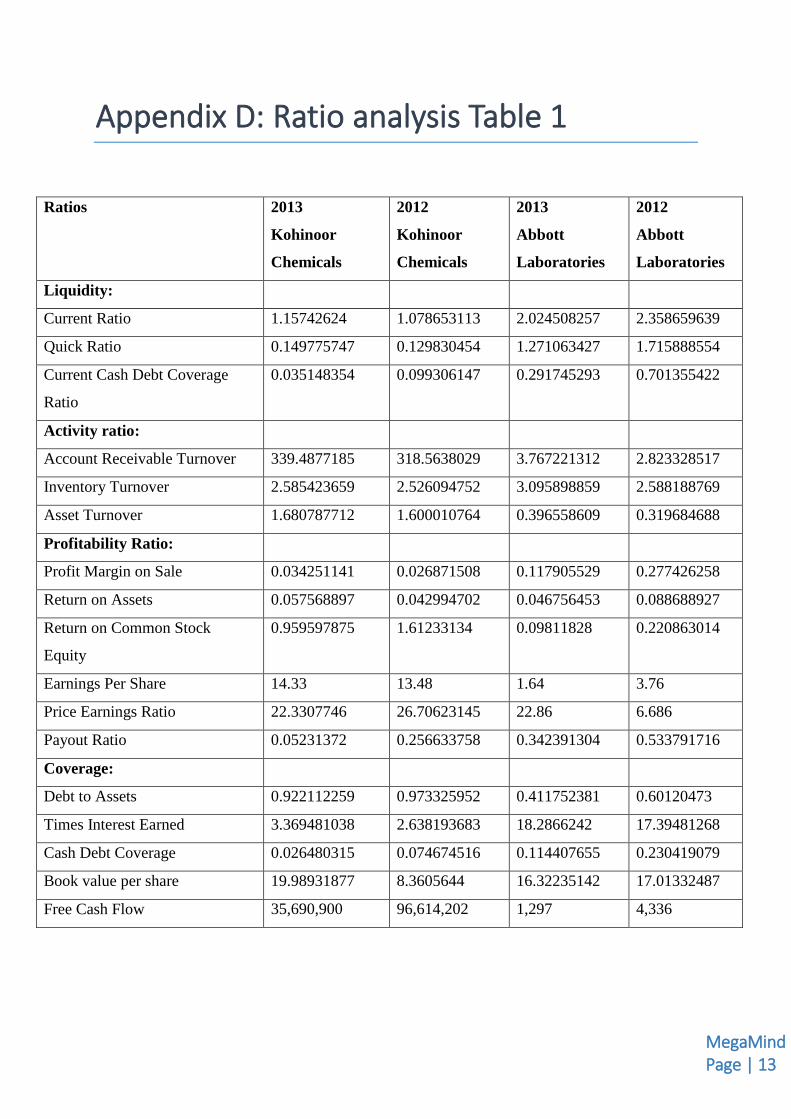
Appendix D: Ratio analysis Table 1
Ratios 2013
Kohinoor
Chemicals
2012
Kohinoor
Chemicals
2013
Abbott
Laboratories
2012
Abbott
Laboratories
Liquidity:
Current Ratio 1.15742624 1.078653113 2.024508257 2.358659639
Quick Ratio 0.149775747 0.129830454 1.271063427 1.715888554
Current Cash Debt Coverage
Ratio
0.035148354 0.099306147 0.291745293 0.701355422
Activity ratio:
Account Receivable Turnover 339.4877185 318.5638029 3.767221312 2.823328517
Inventory Turnover 2.585423659 2.526094752 3.095898859 2.588188769
Asset Turnover 1.680787712 1.600010764 0.396558609 0.319684688
Profitability Ratio:
Profit Margin on Sale 0.034251141 0.026871508 0.117905529 0.277426258
Return on Assets 0.057568897 0.042994702 0.046756453 0.088688927
Return on Common Stock
Equity
0.959597875 1.61233134 0.09811828 0.220863014
Earnings Per Share 14.33 13.48 1.64 3.76
Price Earnings Ratio 22.3307746 26.70623145 22.86 6.686
Payout Ratio 0.05231372 0.256633758 0.342391304 0.533791716
Coverage:
Debt to Assets 0.922112259 0.973325952 0.411752381 0.60120473
Times Interest Earned 3.369481038 2.638193683 18.2866242 17.39481268
Cash Debt Coverage 0.026480315 0.074674516 0.114407655 0.230419079
Book value per share 19.98931877 8.3605644 16.32235142 17.01332487
Free Cash Flow 35,690,900 96,614,202 1,297 4,336
MegaMind Page | 14
Interpretations of Appendix D:
Liquidity ratios:
2012
Liquidity Ratio measures the company’s short term ability to pay its maturing obligations.
The current ratio of Kohinoor Chemicals is 1.07:1, which should be at least (2:1), so, the
company is not in a good position. On the other hand, the current ratio of Abbott Laboratories
is 2.36:1, which seems that the company is in a good position compared to Kohinoor
chemicals. A case can be made against them for not utilizing more of their liquid asset to
obtain further investments. The quick ratio of Kohinoor Chemicals is 0.13:1, which should
have been at least (1:1). On the other hand, Abbott Laboratories has a quick ratio of 1.72:1,
which is above Kohinoor Chemicals. So, Abbott should try to get more investment with their
available most liquid assets. Cash Debt Coverage ratio shows how much debt can be
recovered through cash flows from operation. Abbott Laboratories (0.70:1) is in very good
position compared to Kohinoor chemicals (0.099:1).
2013
The current ratio of Kohinoor Chemicals has increased to 1.16:1 which is a good sign but it
should try to reach to industry benchmark. For Abbott, it has fallen to 2.02:1 which shows
that it is utilizing current assets more properly to obtain investment. It’s good for Kohinoor
chemicals that its quick ratio has increased to 0.15:1 and it should try to reach to benchmark.
On the other hand the quick ratio of Abbott has dropped to 1.27:1. So, it is utilizing its liquid
assets in a proper way. The Current Cash Debt Coverage Ratio for both the companies has
dropped. For Kohinoor Chemicals, it has dropped to 0.035 and for Abbott Laboratories, it has
dropped to 0.29.
MegaMind Page | 15
From our analysis above, we can state that Abbott Laboratories is in a very good position
compared to Kohinoor Chemicals in terms of liquidity.
Activity Ratios:
2012
Activity ratios are the measure of how effectively the company uses its assets to generate
sales. The accounting receivable turnover of Kohinoor chemicals is 319 times which is much
higher than that of Abbott Laboratories of only 2.82 times. So, it takes less time for Kohinoor
chemicals to collect account receivable than Abbott Laboratories. When it comes inventory
turnover, two companies are much similar. For Kohinoor Chemicals it is 2.53, whereas it is
2.59 for Abbott Laboratories. Asset Turnover for Kohinoor Chemicals is 1.6 times and for
Abbott Laboratories, it is only 0.32. Which implies that Kohinoor chemicals utilizes its assets
more effectively than Abbott Laboratories.
2013
The accounting receivable turnover of Kohinoor chemicals has increased to 339.48 and for
Abbott it has increased to 3.77. Inventory turnover for both the companies has increased. For
Kohinoor, it is now 2.59 times. And for Abbot it is 3.09. But Abbott can sale its inventory
more quickly than Kohinoor. Asset turnover has also increased for both the companies.
From our analysis above, we are seeing that Kohinoor Chemicals is in a better position than
Abbott Laboratories in terms of activity.
Profitability Ratios:
2012
It is a measure of the degree of success or failure of a given company for a given period of
time to generate profit. The profit Margin on Sale of Kohinoor Chemicals is 2.69%. Whereas,
it is 27.7% for Abbott. It implies that the profit garnered form Sales is higher for Abbott
MegaMind Page | 16
Laboratories. Return on Assets is also higher for Abbott. So, profit garnered form asset is
higher for Abbott Lab. But Return on Common Stock Equity is higher for Kohinoor than
Abbot so profit garnered form equity is higher for Kohinoor Chemicals. On the other payout
ratio and Price Earnings Ratio is higher for Abbot than Kohinoor. Which means Abbott pays
higher portion of its income as cash dividend than Kohinoor chemical does.
2013
Profit Margin on Sale, Return on Assets have increased for Kohinoor chemicals, but have
decreased for Abbott Lab. Earning Per Share for Kohinoor has also increased to tk. 14.33, but
has decreased for Abbott to $1.64. On the other hand Payout Ratio and Return on Common
Stock Equity for both the companies has decreased.
So, we are seeing that Kohinoor Chemicals performs better than Abbott Laboratories in terms
of profitability.
Coverage Ratios:
2012
It’s a measure of the degree of protection for long term creditors and investors. The Debt to
Assets ratio for Kohinoor Chemicals is higher than Abbott Lab. Kohinoor has 97% debt
against its assets where Abbott has 60% debt against its assets. Kohinoor Chemicals has the
ability to pay interest for 2.64 times where Abbott Lab. Can pay 17.4 times. Cash Debt
Coverage and Book value per share are also higher for Abbott Lab than Kohinoor Chemicals.
2013
Debt to Assets ratio has fallen for both the companies, but it is still less for Abbott Lab than
Kohinoor Chemicals. Times Interest Earned ratio for both the companies has increased, but
the value is much greater for Abbott than Kohinoor. Cash Debt Coverage for Kohinoor has
MegaMind Page | 17
fallen to 2.65% and for Abbott to 11.4%. Book value per share has increased for Kohinoor
but decreased for Abbott.
So, we are seeing that Abbott Laboratories performs better than Kohinoor Chemicals in terms
of Coverage Ratios.
MegaMind Page | 18
Appendix E: Ratio analysis Table 2
Ratios 2013
Kohinoor
Chemicals
2012
Kohinoor
Chemicals
2013
Pharmstandard
2012
Pharmstandard
Liquidity:
Current Ratio 1.15742624 1.078653113 1.4756387 2.841606658
Quick Ratio 0.149775747 0.129830454 1.238849258 2.172708454
Current Cash Debt Coverage
Ratio
0.035148354 0.099306147 0.585373704 0.828262955
Activity ratio:
Account Receivable Turnover 339.4877185 318.5638029 2.866657644 3.377381028
Inventory Turnover 2.585423659 2.526094752 4.082586708 3.794624203
Asset Turnover 1.680787712 1.600010764 0.966230478 0.956090526
Profitability Ratio:
Profit Margin on Sale 0.034251141 0.026871508 0.213757819 0.195590609
Return on Assets 0.057568897 0.042994702 0.20653932 0.187002328
Return on Common Stock
Equity
0.959597875 1.61233134 0.36216804 0.29076623
Earnings Per Share 14.33 13.48 340.914865 276.6940039
Price Earnings Ratio 22.3307746 26.70623145 3.048046463 2.667064223
Payout Ratio 0.05231372 0.256633758 0.001966247 No Cash
Dividend
Coverage:
Debt to Assets 0.922112259 0.973325952 0.535608616 0.261655307
Times Interest Earned 3.369481038 2.638193683 126.5036405 369.6178807
Cash Debt Coverage 0.026480315 0.074674516 0.570459592 0.776320057
Book value per share 19.98931877 8.3605644 0.731054302 0.994020814
Free Cash Flow 35,690,900 96,614,202 13,509,233 10,790,812
MegaMind Page | 19
Interpretations of Appendix E:
Liquidity:
2012
The current ratio of Pharmstandard (2.84:1) is higher than that of Kohinoor chemicals
(1.08:1), but it doesn’t necessarily mean that it is in a better position than Kohinoor
Chemicals. Rather it implies that Pharmstanderd doesn’t utilize its current assets properly.
The quick ratio of Kohinoor Chemicals (0.13) is far below than that of Pharmstandard
(2.17:1) and Kohinoor should try to raise it. On the other hand, Pharmstandard should try to
utilize its highly liquid assets properly. Current Cash Debt Coverage Ratio of Kohinoor
Chemicals (0.099) is also far below than that of Pharmstandard (0.83). So, pharmstandard can
recover most of its current debt by its cash flow from operation.
2013
The current ratio of Kohinoor Chemicals has increased to 1.16:1, but for Pharmstandard it has
decreased to 1.47:1 and it’s still better than Kohinoor Chemicals. It implies that
Pharmstandard is trying to utilize its current assets effectively. The quick ratio of Kohinoor
Chemical has also increased, but for Pharmstandard it has fallen because it is trying to utilize
its current assets properly. Current Cash Debt Coverage Ratio for both the companies has
fallen, but pharmstandard is in a better position.
From our analysis above, we can state that Pharmstandard is in a better position than
Kohinoor Chemicals in liquidity for both the year.
MegaMind Page | 20
Activity Ratios:
2012
Account Receivable Turnover of Kohinoor Chemicals is higher than Pharmstandard’s. So,
Kohinoor has higher ability to collect account receivable. Inventory Turnover ratio of
Pharmstandard (3.79) is higher than Kohinoor Chemical’s (2.53). So, the inventory needed to
support a given level of sales is better for Pharmstandard. Asset Turnover ratio of Kohinoor
(1.6) is also higher than Pharmstandard’s (0.96). So, Kohinoor can generate more sales using
its assets than Pharmstandard. So, in 2012 Kohinoor Chemicals is in better position in this
regards.
2013
Account Receivable Turnover for Kohinoor Chemicals has improved but reduced for
Pharmstandard. Inventory Turnover has increased for both the companies in a small amount,
but the increase is more for Pharmstandard. Asset Turnover for Kohinoor has improved but
has remain almost the same for Pharmstandard. So in 2013, Kohinoor Chemicals in in a
better position.
Profitability Ratios:
2012
Pharmstandard can generate more income from its sale than Kohinoor Chemicals which is
measured by Profit Margin on Sale. Return on Assets of Pharmstandard (0.187) is also
higher than Kohinoor Chemicals (0.043). Which means Pharmstandard can utilize its assets
more effectively. The EPS of Kohinoor is far below compared to Pharmstandard. The payout
ratio of Kohinoor Chemicals is 0.26, whereas Pharmstandard offers no cash dividend in 2012.
On the other hand, Return on Common Stock Equity and Price Earnings Ratio are higher for
Kohinoor. So, Pharmstandard is more profitable in 2012
MegaMind Page | 21
2013
Profit Margin on Sale for both the companies has increased in a small amount. The ROA and
EPS have also increased for both the companies. But the increase in EPS is very higher for
Pharmstandard than Kohinoor Chemicals. Payout Ratio has decreased for Kohinoor and
Pharmstandard has started offering cash dividend. Return on Common Stock Equity has
decreased for Kohinoor but increased for Pharmstandard. On the other hand, Price Earnings
Ratio has increased for Kohinoor but decreased for Pharmstandard. So, Pharmstandard is
more profitable than Kohinoor Chemicals in 2013
Coverage Ratios:
2012
Debt to Assets ratio is higher for Kohinoor than for Pharmstandard, which means Kohinoor
Chemicals generates more of its assets through creditors than pharmstandard does which is
risky for Kohinoor. On the other hand, Pharmstandard is not properly using its ability to take
more debt. But Times Interest Earned ratio of Kohinoor is less than Pharmstandard. So,
Kohinoor has less ability to pay interest than pharmstandard. On the other hand, Cash Debt
Coverage of Kohinoor (0.07) is far below than Pharmstandard (0.78). And Book value per
share is higher for Kohinoor. So, Pharmstandard is in a better position than Kohinoor
Chemicals in this regard in 2012.
2013
The portion of assets that has been generated from creditors (Debt to Assets) has decreased
for Kohinoor but increased for pharmstandard which means it is properly using its ability to
take debt from creditors. Times Interest Earned that measures the company’s ability to pay
interest has improved for Kohinoor but reduced for Pharmstandard but it is still very much
higher for Pharmstandard. Cash Debt Coverage ratio for both the companies has reduced.
MegaMind Page | 22
And Kohinoor Chemicals is in a very risky situation. Overall, Pharmstandard is in a better
position than Kohinoor Chemicals.
MegaMind Page | 23
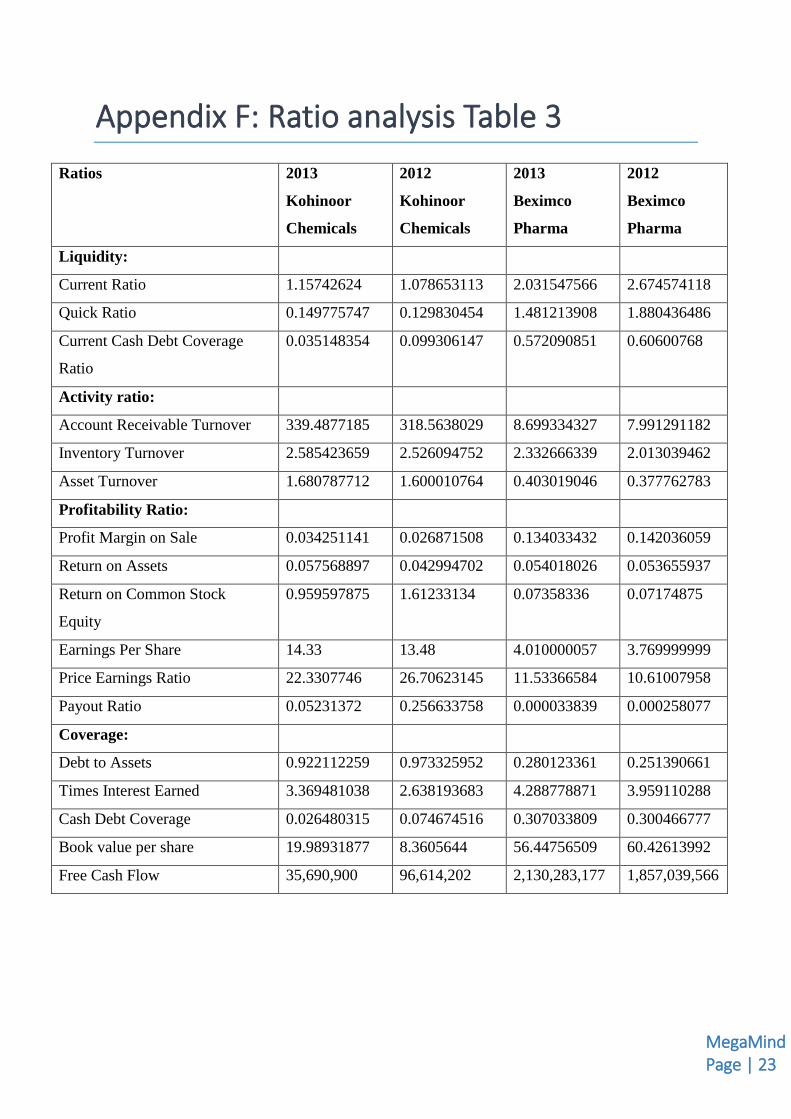
Appendix F: Ratio analysis Table 3
Ratios 2013
Kohinoor
Chemicals
2012
Kohinoor
Chemicals
2013
Beximco
Pharma
2012
Beximco
Pharma
Liquidity:
Current Ratio 1.15742624 1.078653113 2.031547566 2.674574118
Quick Ratio 0.149775747 0.129830454 1.481213908 1.880436486
Current Cash Debt Coverage
Ratio
0.035148354 0.099306147 0.572090851 0.60600768
Activity ratio:
Account Receivable Turnover 339.4877185 318.5638029 8.699334327 7.991291182
Inventory Turnover 2.585423659 2.526094752 2.332666339 2.013039462
Asset Turnover 1.680787712 1.600010764 0.403019046 0.377762783
Profitability Ratio:
Profit Margin on Sale 0.034251141 0.026871508 0.134033432 0.142036059
Return on Assets 0.057568897 0.042994702 0.054018026 0.053655937
Return on Common Stock
Equity
0.959597875 1.61233134 0.07358336 0.07174875
Earnings Per Share 14.33 13.48 4.010000057 3.769999999
Price Earnings Ratio 22.3307746 26.70623145 11.53366584 10.61007958
Payout Ratio 0.05231372 0.256633758 0.000033839 0.000258077
Coverage:
Debt to Assets 0.922112259 0.973325952 0.280123361 0.251390661
Times Interest Earned 3.369481038 2.638193683 4.288778871 3.959110288
Cash Debt Coverage 0.026480315 0.074674516 0.307033809 0.300466777
Book value per share 19.98931877 8.3605644 56.44756509 60.42613992
Free Cash Flow 35,690,900 96,614,202 2,130,283,177 1,857,039,566
MegaMind Page | 24
Interpretations of Appendix F:
Liquidity:
2012
The current ratio of Kohinoor Chemicals is 1.08:1 and Beximco Pharma is 2.67. So, Beximco
is in a better position than Kohinoor Chemicals. It also implies that Beximco doesn’t utilize
its current assets properly to obtain investment. The quick ratio of Kohinoor Chemicals
(0.13:1) is far below than that of Beximco Pharma (1.88:1). So, Kohinoor should try to
improve this and Beximco should utilize its current assets properly. Current Cash Debt
Coverage Ratio of Kohinoor Chemicals (0.099) is also far below than that of Beximco
Pharma (0.61). So, Beximco can recover most of its current debt by its cash flow from
operation that Kohinoor can’t do.
2013
The current ratio of Kohinoor Chemicals has increased to 1.16:1, but for Beximco Pharma it
has decreased to 2.03:1 and it’s still better than Kohinoor Chemicals. It implies that Beximco
is trying to utilize its current assets effectively. The quick ratio of Kohinoor Chemical has
also increased to 0.15:1, but for Beximco it has fallen to 1.48:1 because it is trying to utilize
its liquid assets properly. Current Cash Debt Coverage Ratio for both the companies has
fallen, but Beximco is in a better position.
So, from our analysis above, we can state that Beximco is in a better position than Kohinoor
Chemicals in liquidity for both the year.
MegaMind Page | 25
Activity:
2012
Account Receivable Turnover of Kohinoor Chemicals (318.56) is higher than that of
Beximco Pharma (7.99). So, Kohinoor has higher ability to collect account receivable than
Beximco. Inventory Turnover ratio of Kohinoor Chemicals (2.53) is higher than Baximco
(2.01). So, the inventory needed to support a given level of sales is better for Kohinoor
Chemicals. Asset Turnover ratio of Kohinoor (1.6) is also higher than Baximco (0.38) So,
Kohinoor can generate more sales using its assets than Beximco. Whereas Beximco can’t
utilize its assets efficiently to generate sales. So, in 2012 Kohinoor Chemicals is in better
position in this regards.
2013
Account Receivable Turnover for both the companies have improved. But Kohinoor
Chemicals is in a better position. Inventory Turnover has increased for both the companies.
Asset Turnover for both the companies has also improved. It means the ability of companies’
assets to generate sales has increased. Overall, Kohinoor Chemical is in a better position in
2013.
Profitability
2012
Beximco can generate far more income from its sale than Kohinoor Chemicals which is
measured by Profit Margin on Sale. Return on Assets of Beximco (0.054) is also higher than
Kohinoor Chemicals (0.043). Which means Beximco can utilize its assets more effectively to
generate income. Return on Common Stock Equity of Kohinoor (1.35) is higher than
Beximco (0.08). So, Kohinoor can generate more income by effectively using its equity.
Earnings Per Share of Kohinoor (13.48) is also higher than Beximco (3.77). Payout Ratio of
MegaMind Page | 26
Kohinoor is far more than Beximco. But Price Earnings Ratio is higher for Beximco. It’s hard
to take decision about which company is more profitable in this year.
2013
Profit Margin on Sale has increased for Kohinoor Chemicals by a small amount but has
reduced for Beximco. And it is still higher for Beximco. Return on Assets has increased for
Kohinoor but remain the same for Beximco. Return on Common Stock Equity has improved
for Kohinoor but almost the same for Beximco. EPS for both the companies has increased.
On the other hand, Payout Ratio has decreased for both. Price Earnings Ratio has increased
for Kohinoor but decreased for Beximco but it is still far higher for Beximco. So, Kohinoor
Chemicals is in a better position in 2013.
Coverage:
2012
Debt to Assets ratio is higher for Kohinoor than for Beximco, which means Kohinoor
Chemicals generates more of its assets through creditors than Beximco does which is risky
for Kohinoor Chemicals. On the other hand, Beximco is not properly using its ability to take
more debt. But Times Interest Earned ratio of Kohinoor is less than Beximco. So, Kohinoor
has less ability to pay interest than Beximco. On the other hand, Cash Debt Coverage of
Kohinoor (0.07) are far below than Beximco (0.30). And Book value per share is also higher
for Beximco than Kohinoor. So, Beximco is in a better position than Kohinoor Chemicals in
this regard in 2012.
2013
The portion of assets that has been generated from creditors (Debt to Assets) has decreased
for Kohinoor but increased for Beximco which means it is properly using its ability to take
debt from creditors. Times Interest Earned that measures the company’s ability to pay interest
has improved for both the companies. Cash Debt Coverage ratio has reduced for Kohinoor
MegaMind Page | 27
Chemicals but slightly increased for Beximco. And Kohinoor Chemicals is in a very risky
situation. Overall, Beximco is in a better position than Kohinoor Chemicals in 2013.