158
BUDGET STATEMENTS 2018-19 for Environment, Planning and Sustainable Development Directorate

BUDGET STATEMENTS
2018-19
for
Environment, Planning and Sustainable Development Directorate

This page deliberately left blank
2018-19 Budget Statements 2 Environment, Planning and Sustainable Development Directorate

ContentsENVIRONMENT, PLANNING AND SUSTAINABLE DEVELOPMENT DIRECTORATE......................1
Purpose................................................................................................................................ 1
2018-19 Priorities.................................................................................................................2
Estimated Employment Level...............................................................................................6
Strategic Objectives and Indicators......................................................................................6
Output Classes....................................................................................................................12
Accountability Indicators....................................................................................................18
Changes to Appropriation..................................................................................................26
Summary of 2018-19 Infrastructure Program....................................................................33
Financial Statements – Controlled......................................................................................35
Financial Statements – Territorial......................................................................................44
CITY RENEWAL AUTHORITY – STATEMENT OF INTENT...........................................................56
CITY RENEWAL AUTHORITY....................................................................................................57
Purpose.............................................................................................................................. 57
Nature and scope of activities............................................................................................58
2018-19 Priorities...............................................................................................................60
Estimated Employment Level and Employment Profile.....................................................62
Key performance indicators for 2018-19 to 2021-2022.....................................................63
Changes to Appropriation..................................................................................................68
Monitoring and Reporting..................................................................................................70
Financial arrangements......................................................................................................71
Financial Statements..........................................................................................................72
SUBURBAN LAND AGENCY – STATEMENT OF INTENT...........................................................79
SUBURBAN LAND AGENCY.....................................................................................................80
Purpose.............................................................................................................................. 80
2018-19 Budget Statements 3 Environment, Planning and Sustainable Development Directorate

Nature and scope of activities............................................................................................80
Risks................................................................................................................................... 83
Priorities and Strategies for 2018-19 to 2021-22...............................................................84
Estimated Employment Level and Employment Profile.....................................................87
Key performance indicators for 2018-19 to 2021-2022.....................................................88
Assessment of performance against 2017-18 objectives...................................................91
Monitoring and Reporting..................................................................................................93
Financial arrangements......................................................................................................94
Financial Statements..........................................................................................................95
2018-19 Budget Statements 4 Environment, Planning and Sustainable Development Directorate

ENVIRONMENT, PLANNING AND SUSTAINABLE DEVELOPMENT DIRECTORATE
PurposeThe Environment, Planning and Sustainable Development Directorate (the Directorate) promotes the orderly growth of our city, strengthens the Territory’s response to climate change, provides an integrated planning and land use system that contributes to the sustainable development and future of the ACT and manages the Territory’s parks and reserves.
The Directorate’s aim is to ‘Shape Canberra’s Future’ by providing advice for Government consideration and developing and implementing targeted policies and programs that plan for a compact and connected city; promote liveability, prosperity, productivity and sustainability; and address environment protection.
Areas of focus include climate change mitigation and adaptation, nature conservation and enhancement, heritage, efficient and reliable water and energy services, building safety, quality urban design, and sustainable and integrated spatial planning, policy and delivery.
The Directorate provides operational and strategic management of water catchments, the forestry estate, and parks and reserves across the ACT including Tidbinbilla Nature Reserve, Namadgi National Park and Canberra Nature Park.
The Directorate is responsible for land strategy, policy and planning, including preparation of the four-year Indicative Land Release Program. The program sets out the Government’s intended program for land release and seeks to facilitate housing diversity, provide affordable housing, and stimulate economic activity by meeting the demand for land in the Territory and supporting a competitive land development and construction market.
The Directorate has a strong focus on urban renewal as a mechanism to drive economic activity, improving the liveability of our city, building on the character of our community and delivering sustainable development. This focus is demonstrated in a variety of Government-wide service delivery programs, such as the delivery of the Public Housing Renewal Program, Asset Recycling Initiative and Loose-fill Asbestos Insulation Eradication Scheme.
2018-19 Budget Statements 5 Environment, Planning and Sustainable Development Directorate

2018-19 PrioritiesPriorities to be pursued by the Environment, Planning and Sustainable Development Directorate in 2018-19 include:
Planning and Building
refresh the ACT Planning Strategy to include a range of strategic planning initiatives related to:
- addressing housing choice and affordability; infrastructure initiatives; community engagement; planning for future urban areas; celebrating and enhancing the character and structure of our city; changing demographics and household structures; changing retail and employment patterns; integrated planning; and creating a sustainable Canberra.
continue work on the Housing Choices project to improve the availability of a range of housing options in residential areas;
support the Government’s long-term land release program, with a focus on housing affordability and accessible communities;
finalise the Northbourne Avenue City and Gateway Planning Study;
finalise the two remaining master plans - Curtin and Kippax;
participate in, and lead components of, regional planning in partnership with NSW Government agencies;
continue to deliver city-wide urban land and transport policies that underpin planning for the future urban growth and land supply;
provide leadership in place making through current projects and policies with a focus on people, climate-wise design, living infrastructure and the public realm as cities become more compact and dense;
review the existing planning system to deliver greater clarity;
work with industry to enhance the eDevelopment platform;
assess development proposals, including lease variations in accordance with the Territory Plan;
maintain and administer the Territory Plan as the statutory framework for land use and development in the ACT in accordance with the National Capital Plan;
continue to implement the Improving the ACT Building Regulatory System reforms, including establishing a risk-based building auditing system for building certifiers approving, inspecting and certifying building work in the Territory;
2018-19 Budget Statements 6 Environment, Planning and Sustainable Development Directorate

finalise the review of the ACT’s scheme for disclosing energy efficiency ratings for sale or lease of residential properties; and
complete work on the regulatory impact assessment of potential minimum energy efficiency standards and other options for improving the energy efficiency of rental properties in the Territory.
Environment
continue to develop, review and implement legislation, policies and standards to protect the natural and built environment and enhance liveability;
complete public consultation on a new Biosecurity Bill for the ACT and progress the development of the Bill to an advanced draft;
improve water quality in the ACT’s waterways through improved catchment management and governance arrangements and implementing the Commonwealth/ACT Healthy Waterways project;
continue to implement the ACT Nature Conservation Strategy and the ACT Water Strategy, Striking the Balance.
work with the ACT Natural Resource Management Council, community, governments, landholders, industry, the local Aboriginal community, and scientific and research organisations to improve our natural resources;
reduce the ACT’s vulnerability to bushfire by managing fuel loads through stock grazing, mowing, prescribed burning and other measures in strategic areas, being sure to balance the impact on the environment;
in the Tidbinbilla Nature Reserve:
- deliver planning and construction work on a new brush-tailed rock wallaby breeding enclosure;
- partner with tertiary organisations to better utilise existing research and vet facilities; and
- explore partnering opportunities with eco-tourism providers to better highlight the area’s natural beauty to visitors.
in the Namadgi National Park and the Murrumbidgee River Corridor:
- contribute to the 50th anniversary celebrations of the Apollo moon landings, focusing on the role of the Namadgi National Park space observatories;
- continue to manage the restoration of the Lower Cotter Catchment; and
- explore options for the development of eco-tourism opportunities.
2018-19 Budget Statements 7 Environment, Planning and Sustainable Development Directorate
in the Canberra Nature Park:
- continue to support ParkCare and other volunteer groups to deliver rehabilitation works throughout the Canberra Nature Park;
- work with the Woodlands and Wetlands Trust to complete the extension of the Mulligans Flat Woodland Sanctuary and commence work to eradicate feral animals from inside the extended sanctuary; and
- continue with work to establish the Molonglo River Park and manage new offset areas.
support the ACT Heritage Council and the Government to recognise, register, conserve, promote and celebrate the ACT’s places and objects of historic, Aboriginal and natural heritage significance; and
work nationally and across jurisdictional boundaries to achieve better outcomes for the environment and community of the ACT and region.
Climate Change and Sustainability
deliver a climate change policy and action plan on the city’s pathway to zero-net emissions by 2045;
deliver on the ACT’s Transition to Zero Emissions Vehicles Action Plan 2018–2021;
support the deployment of large-scale renewable energy generation to meet the ACT’s 100 per cent renewable electricity by 2020 target;
deliver the Government’s Next Generation Battery Storage program to reduce network infrastructure costs and support the transition to a high penetration renewable electricity grid;
administer the Renewable Energy Innovation Fund and programs to realise the Government’s vision for the ACT as an internationally recognised centre for renewable energy innovation and investment, diversifying the economy and creating new export industries;
administer and assist industry to implement the Energy Efficiency (Cost of Living) Improvement Scheme with a focus on reducing energy costs for small business and low-income households;
provide policy leadership and practical support to directorates in working towards carbon neutrality in the Government’s operations and service delivery by 2020;
develop and implement actions under an ACT Climate Change Adaptation Strategy and Implementation Plan;
2018-19 Budget Statements 8 Environment, Planning and Sustainable Development Directorate
help achieve the Government’s climate change mitigation, waste reduction and renewable energy targets through Actsmart programs delivered to schools, businesses and households; and
continue community engagement on climate change through workshops, public events and social media platforms to ensure the Canberra community is included as a key part of Canberra’s climate change actions.
Land Strategy and Urban Renewal
develop the Government’s land release program in accordance with the ACT Planning Strategy Refresh;
continue to develop the Government’s affordable housing and building policy;
work with the private sector to support the operation of a competitive land development and construction market;
plan and deliver a range of initiatives that support urban growth and change in accordance with Government policies and priorities;
deliver the ACT Government’s program of eradicating loose-fill asbestos insulation from Canberra homes under the Loose-fill Asbestos Insulation Eradication Scheme (Scheme) and engage across jurisdictional boundaries, and nationally, to guide Government, industry and community in the safe and effective practices developed under the Scheme;
deliver the National Partnership Agreement on Asset Recycling;
oversee the replacement of 1,288 outdated public housing units with properties that meet contemporary building and energy efficiency standards;
assist the Community Services Directorate to deliver components of Housing ACT’s long term asset management program;
provide support to the City Renewal Authority for the redevelopment of the City and Northbourne Avenue corridor;
deliver urban renewal programs in areas outside the City Renewal Authority boundary;
undertake project identification, establishment and preliminary planning for future urban land releases to be undertaken by the Territory through the Suburban Land Agency;
coordinate appropriate land sales processes to facilitate urban renewal outcomes;
investigate, trial and promote urban renewal initiatives that provide innovation, sustainability, liveability and design quality, such as the Demonstration Housing project; and
prepare and undertake due diligence investigations on Territory land identified for future development in urban areas.
2018-19 Budget Statements 9 Environment, Planning and Sustainable Development Directorate

Estimated Employment Level
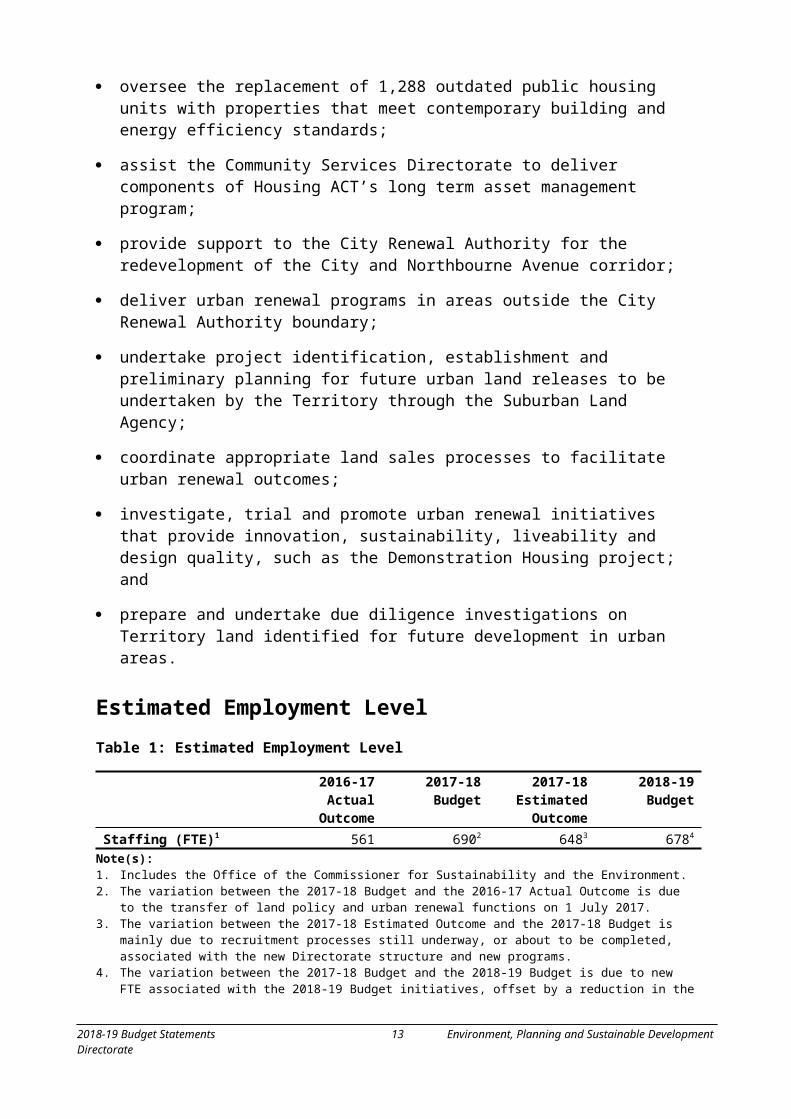
Table 1: Estimated Employment Level
2016-17Actual
Outcome
2017-18Budget
2017-18Estimated Outcome
2018-19Budget
Staffing (FTE)1 561 6902 6483 6784
Note(s):1. Includes the Office of the Commissioner for Sustainability and the Environment.2. The variation between the 2017-18 Budget and the 2016-17 Actual Outcome is due to the transfer of land policy and
urban renewal functions on 1 July 2017.3. The variation between the 2017-18 Estimated Outcome and the 2017-18 Budget is mainly due to recruitment
processes still underway, or about to be completed, associated with the new Directorate structure and new programs.4. The variation between the 2017-18 Budget and the 2018-19 Budget is due to new FTE associated with the 2018-19
Budget initiatives, offset by a reduction in the size of the Asbestos Response Taskforce, settlement of staffing numbers and associated functions with the Suburban Land Agency and the transfer of transport planning staff to Transport Canberra and City Services.
Strategic Objectives and Indicators
Strategic Objective 1
A planning, building and leasehold system that contributes to a sustainable Canberra and economic prosperity by delivering quality spatial, urban design, integrated transport and development outcomes, and that rewards design excellence and innovation.
This objective will be achieved through the implementation of the goals underpinning the ACT Planning Strategy, the Transport for Canberra and AP2 Climate Change Strategy policies.
The Directorate will:
prepare planning and land use management strategies that integrate with transport planning, shape the growth of the City, enhance the community’s lifestyle and balance environmental objectives;
review the ACT Planning Strategy to support the Government’s commitments to zero carbon emissions by 2045, urban renewal and light rail concurrent with the transport and climate change strategy reviews;
manage urban renewal strategies with a focus on integration around commercial centres and transport infrastructure and having regard to evolving community attitudes. Initiatives include:
- completing the master plan program for centres to provide direction for future change and growth including sustainable design outcomes;
- finalise the City and Gateway Design Framework;
- examining community facility planning to establish future policy positions;
2018-19 Budget Statements 10 Environment, Planning and Sustainable Development Directorate
- ensuring Territory Plan land uses reflect the broad structure of the ACT Planning Strategy including a review of the locations of medium and higher density residential zones and future urban areas; and
- reviewing the Territory Plan as necessary to reflect outcomes of strategic land use and transport plans and policies.
continue to implement the outcomes of the review of the Building Act 2004, including the Improving the ACT Building Regulatory System reform program;
develop and implement policies that improve the sustainability and resilience of the natural and built environment;
administer a transparent and accountable leasehold and planning approvals system that underpins the Territory’s economy;
maintain and enhance an efficient spatial mapping and property description system;
increase community and industry education to foster understanding of strategies and policies;
continue to work with surrounding local government areas and the NSW Government to develop and deliver regional planning strategies for the Canberra region; and
continue to participate in national forums to provide analysis and input to infrastructure policy nationally and in the ACT.
Strategic Indicator 1.1: Develop, engage on and implement city-wide urban land policies, strategies and plans that underpin planning for the future urban growth, land supply, and major infrastructure in a coordinated way across Government.1
Strategic Indicator 1.2: Implement the Improving the ACT Building Regulatory System reforms.2
Note(s):1. Revised Strategic Indicator. The word ‘transport’ has been taken out of the indicator as the transport planning
function was transferred from the Directorate to Transport Canberra and City Services on 1 July 2017.2. New Strategic Indicator.
2018-19 Budget Statements 11 Environment, Planning and Sustainable Development Directorate

Strategic Objective 2
Together with community protect and enhance Canberra’s built, natural and cultural environment providing nature based experiences and solutions to improve Canberra’s liveability.
The Directorate will continue to enhance and protect the built, natural and cultural environment through strategies, plans, research, programs and management of our parks, reserves and waterways, including through strong collaboration and partnerships with community, volunteers, business and other land managers and research institutions.
This will include exploring and supporting cost-effective ways to enhance Canberra’s liveability through:
- sustainable water use through demand management and water sensitive urban design;
- nature-based experiences (tourism, health, education, recreation);
- private public partnerships; and
- community activation.
The Directorate will continue to promote knowledge sharing and implementation of contemporary, best practice environmental standards.
The Directorate will:
partner with Traditional Custodians to proactively manage ACT’s natural and cultural environment, to enhance our global reputation as the bush capital;
support the development of State of the Environment reporting;
increase community awareness and involvement in protecting and conserving the ACT’s natural resources including by supporting ParkCare and other volunteer groups;
work with our partners, such as the Woodlands and Wetlands Trust, to deliver innovative conservation outcomes for endangered species;
administer a multi-agency governance model for water management in the ACT and region;
build knowledge and implement practices that protect and manage the ACT’s biodiversity;
enhance the policy framework to protect the quality of the ACT’s environment;
implement the ACT’s environment strategies and plans – Nature Conservation Strategy 2013-2023, Water Strategy ‘Striking the Balance’ 2014–44, ACT and Region Catchment Strategy 2016-46 and Action Plans;
2018-19 Budget Statements 12 Environment, Planning and Sustainable Development Directorate
work with the Commonwealth and other states/territory to develop and implement national environmental and water reforms;
implement innovative water sensitive urban design systems;
continue to provide administrative support to the ACT Heritage Council to ensure the continued recognition, registration and conservation of the ACT’s heritage places and objects; and
continue to administer the annual funding and delivery of the ACT Heritage Grants Program, the Canberra and Region Heritage Festival and Capital Works projects as they relate to the conservation of the ACT’s heritage places and objects.
Strategic Indicator 2.1: Submit two Water Resource Plans (one surface and one groundwater) for accreditation by the Commonwealth Minister for Agriculture and Water in early 2019 under the Murray Darling Basin Plan.1
Strategic Indicator 2.2: Deliver the ACT Healthy Waterways infrastructure; research; monitoring and behaviour change projects by 30 June 2019 as agreed with the Commonwealth.
Strategic Indicator 2.3: Monitor implementation of the Nature Conservation Strategy and Action Plans.2
Note(s):1. New Strategic Indicator. Supports the implementation of the Murray Darling Basin Plan.2. New Strategic Indicator. Supports development and implementation of sustainability policies including biodiversity
conservation.
Strategic Objective 3
Deliver balanced and effective legislation and policies for optimal land use outcomes, healthy, safe, diverse and affordable development, and effective and sustainable environmental management.
This objective will be achieved through continuous review and enhancement of the legislation and policy administered by the Directorate and associated regulations to deliver an effective regulatory and policy framework.
The Directorate will:
continually improve policies and supporting systems for consistent and timely decisions;
enhance regulatory frameworks to deliver high standards and safe outcomes for the community and business;
work with industry and business to develop and implement policies and guidelines to protect the quality of our environment and enhance liveability;
develop innovative legislation, policies, systems and processes to streamline the way we provide high quality outcomes for the community;
2018-19 Budget Statements 13 Environment, Planning and Sustainable Development Directorate
complete public consultation on a new Biosecurity Bill for the ACT and progress the development of the Bill to an advanced draft; and
complete amendments to the Stock Act 2005 and the Animal Diseases Act 2005.
Strategic Indicator 3.1: Continuous review of regulatory policies and systems and supporting the effective application and coordination of planning, environment protection, heritage, and nature conservation.1
Strategic Indicator 3.2: Report annually on the effectiveness of National Environment Protection Measures made under the National Environment Protection Council Act 1994.2
Note(s):1. Revised Strategic Indicator. The delivery of building and construction policies are captured under the stand-alone
Strategic Indicator 1.2.2. New Strategic Indicator.
Strategic Objective 4
Leading the Community Towards Making Canberra a Net Zero Carbon Emitter
The Government’s vision for Canberra is to set the benchmark for world cities in zero emissions and sustainability. The Directorate works across Government, the business sector and the broader community to achieve ambitious greenhouse gas emission reductions.
The Directorate will raise awareness of climate change through engaging with the community and building partnerships in mitigation and adaptation.
The Directorate will:
secure business and community understanding and endorsement on climate change action with support from the ACT’s Climate Change Council;
support the deployment of large scale renewable energy generation to meet the ACT’s 100 per cent renewable electricity and greenhouse gas reduction targets;
support and facilitate the growth of the renewable energy industry as part of a vibrant clean economy, built around Canberra’s existing competitive advantages and knowledge based economy;
support increased energy efficiency in homes, businesses, schools and other parts of the built environment;
contribute to the security and affordability of our energy supplies;
promote an understanding of climate science implications for the ACT within and beyond the ACT Government, and guide adaptation strategies to increase the Territory’s resilience in the face of the unavoidable impacts of climate change;
provide a guiding influence to other parts of Government to deliver carbon neutral Government operations; and
2018-19 Budget Statements 14 Environment, Planning and Sustainable Development Directorate
support the community to understand their own emissions and how to mitigate those emissions through participation in Actsmart programs for businesses, schools and households.
Strategic Indicator 4.1: Implement policies to achieve the ACT Government’s target of net zero carbon emissions in the ACT by 2045, and in Government operations from 2020.1
Strategic Indicator 4.2: Growth in renewable electricity generation.
Note(s):1. Revised Strategic Indicator. The target for net zero carbon emissions in the ACT has changed from 2050 to 2045.
Strategic Objective 5
Improve the liveability of our cities and build on the character of our communities through strategic and sustainable land release and urban renewal programs.
Development of a land release program and strategic urban project initiatives that implement actions in the ACT Planning Strategy Refresh and that contribute to the Government’s financial, social and environmental objectives.
The Directorate will:
deliver urban renewal by assessing, planning, activating and releasing land in strategic locations in accordance with Canberra: a Statement of Ambition, the ACT Indicative Land Release Program and other applicable Government policy and direction;
contribute to housing diversity, housing affordability and housing choice;
facilitate land supply and assist with policies to stimulate economic activity in the residential, commercial/mixed use, industrial and community sectors;
deliver policies that support a competitive land development and construction market;
provide information to the development market on Territory land sales and releases through responsible due diligence investigations that identify and reduce risk and improve certainty on land sales and developments;
achieve responsible returns from the sale of unleased Territory land; and
continue to engage across jurisdictional boundaries, and nationally, to guide Government, industry and community in the safe and effective practices developed under the Loose-fill Asbestos Insulation Eradication Scheme.
Strategic Indicator 5.1: Delivery of the Government’s urban renewal programs through the ACT Indicative Land Release Program, public housing renewal and Loose-fill Asbestos Insulation Eradication Scheme.1
Strategic Indicator 5.2: Assets recycled in line with the Commonwealth Government’s Asset Recycling Initiative (ARI) and subsequent public housing renewal in line with the ACT Government’s Public Housing Renewal Program.1
2018-19 Budget Statements 15 Environment, Planning and Sustainable Development Directorate

Strategic Indicator 5.3: Work with the community and industry stakeholders to identify approaches for delivery of housing demonstration projects that promote best practice .1
Note(s):1. New Strategic Indicator.
Output Classes
Output Class 1: Planning1
Table 2 Output Class 1: Planning
2017-18 2018-19Estimated Outcome Budget
$'000 $'000
Total Cost2 29,682 32,308Controlled Recurrent Payments 25,306 27,319
Note(s):1. Heritage has moved from Output 1: Planning to Output 2: Environment.2. Total cost includes depreciation and amortisation of $0.110 million in 2017-18 and $0.151 million in 2018-19. Total
cost is also supplemented by own source revenue of $2.703 million in 2017-18 and $2.704 million in 2018-19.
Output 1.1: Planning Delivery
Facilitate and manage growth and change within the ACT through development assessment and leasehold management, with the overarching objective of promoting and facilitating economically productive, sustainable, attractive, safe and well-designed urban and rural environments in the ACT.
Table 3: Output 1.1: Planning Delivery2017-18 2018-19
Estimated Outcome Budget$'000 $'000
Total Cost1 18,289 17,472Controlled Recurrent Payments 14,353 12,949
Note(s):1. Total cost is supplemented by own source revenue of $2.703 million in 2017-18 and $2.704 million in 2018-19.
2018-19 Budget Statements 16 Environment, Planning and Sustainable Development Directorate

Output 1.2: Planning and Building Policy1
Provision of high quality professional services in strategic land planning; administering the Territory Plan; planning for land release; developing policies for high quality urban design; and policies for buildings, building services, equipment and appliances, and the building and construction industry.
Table 4: Output 1.2: Planning and Building Policy2017-18 2018-19
Estimated Outcome Budget$'000 $'000
Total Cost 11,393 14,836Controlled Recurrent Payments 10,953 14,370
Note(s):1. This output was previously called Planning Policy. The name has been changed to reflect the addition of Building
Policy, which was transferred from Output 1.1 Planning Delivery.
Output Class 2: Environment1
Table 5: Output Class 2: Environment
2017-18 2018-19Estimated Outcome Budget
$'000 $'000
Total Cost2 59,808 63,430Controlled Recurrent Payments 47,276 52,562
Note(s):1. Heritage has moved from Output Class 1: Planning to Output Class 2: Environment. Climate Change and Sustainability
has moved from Output Class 2: Environment to Output Class 3: Climate Change and Sustainability. 2. Total cost includes depreciation and amortisation of $2.788 million in 2017-18 and $2.844 million in 2018-19. Total
cost is also supplemented by revenue from the Commonwealth Government and sales from forestry harvesting.
Output 2.1: Environment
Help protect the ACT’s natural environment through:
the implementation of programs responding to natural resource management;
manage, review and implement legislation/action and plans to help protect land and species;
sustainable use of water, including through implementation of Striking the Balance, the ACT’s Water Strategy;
establish and support an ACT and region catchment management governance framework;
administer the annual funding of the ACT Environment Grants Program;
promotion and involvement of the community in caring for the ACT’s natural environment; and
2018-19 Budget Statements 17 Environment, Planning and Sustainable Development Directorate

develop, review and implement legislation, policies and standards to protect the natural and built environment.
Table 6: Output 2.1: Environment
2017-18 2018-19Estimated Outcome Budget
$'000 $'000
Total Cost1 15,203 17,028Controlled Recurrent Payments 11,393 13,508
Note(s):1. Total cost includes depreciation and amortisation and is supplemented by revenue from the Commonwealth for
environmental programs.
Output 2.2: Conservation and Land Management1
Planning and management of the ACT’s parks, reserves, unleased public land and plantations, including associated community infrastructure. The land manager role includes management of land for recreational use; conservation management; including management of national parks, nature reserves; fire management; and pest and weed control as well as the management of the Territory’s softwood plantation and oversight of rural production areas.
Table 7: Output 2.2: Conservation and Land Management2017-18 2018-19
Estimated Outcome Budget$'000 $'000
Total Cost2 42,478 44,223Controlled Recurrent Payments 33,908 36,993
Note(s):1. This output was previously Output 2.3.2. Total cost includes depreciation and amortisation is also supplemented by sales from forestry harvesting.
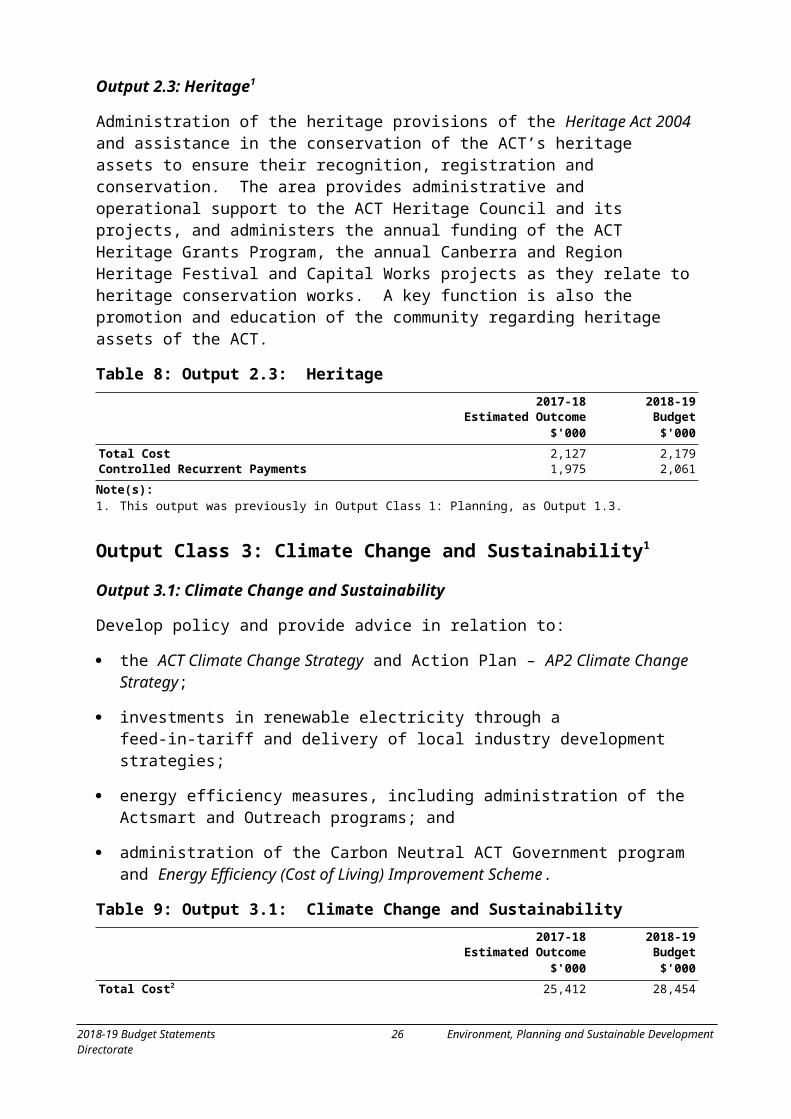
Output 2.3: Heritage1
Administration of the heritage provisions of the Heritage Act 2004 and assistance in the conservation of the ACT’s heritage assets to ensure their recognition, registration and conservation. The area provides administrative and operational support to the ACT Heritage Council and its projects, and administers the annual funding of the ACT Heritage Grants Program, the annual Canberra and Region Heritage Festival and Capital Works projects as they relate to heritage conservation works. A key function is also the promotion and education of the community regarding heritage assets of the ACT.
Table 8: Output 2.3: Heritage2017-18 2018-19
Estimated Outcome Budget$'000 $'000
Total Cost 2,127 2,179Controlled Recurrent Payments 1,975 2,061
Note(s):1. This output was previously in Output Class 1: Planning, as Output 1.3.
2018-19 Budget Statements 18 Environment, Planning and Sustainable Development Directorate
Output Class 3: Climate Change and Sustainability1
Output 3.1: Climate Change and Sustainability
Develop policy and provide advice in relation to:
the ACT Climate Change Strategy and Action Plan – AP2 Climate Change Strategy;
investments in renewable electricity through a feed-in-tariff and delivery of local industry development strategies;
energy efficiency measures, including administration of the Actsmart and Outreach programs; and
administration of the Carbon Neutral ACT Government program and Energy Efficiency (Cost of Living) Improvement Scheme.
Table 9: Output 3.1: Climate Change and Sustainability2017-18 2018-19
Estimated Outcome Budget$'000 $'000
Total Cost2 25,412 28,454Controlled Recurrent Payments 11,354 12,563
Note(s):1. This is a new Output Class. Previously Climate Change and Sustainability was within Output Class 2: Environment, as
Output 2.2.2. Total cost is supplemented by revenue from the Energy Efficiency (Cost of Living) Improvement Scheme of
$4.633 million in 2017-18 and $3.950 million in 2018-19. Total cost is also supplemented by revenue from the Renewable Energy Innovation Fund and Next Generation Battery Storage of $8.369 million in 2017-18 and $10.180 million in 2018-19.
Output Class 4: Land Strategy and Urban Renewal1
Table 10: Output Class 4: Land Strategy and Urban Renewal
2017-18 2018-19Estimated Outcome Budget
$'000 $'000
Total Cost 18,664 22,195Controlled Recurrent Payments 18,052 21,606
Note(s):1. This output class was previously called Land Policy and Renewal. The Public Housing Renewal Taskforce has been
moved to Output Class 6.
2018-19 Budget Statements 19 Environment, Planning and Sustainable Development Directorate

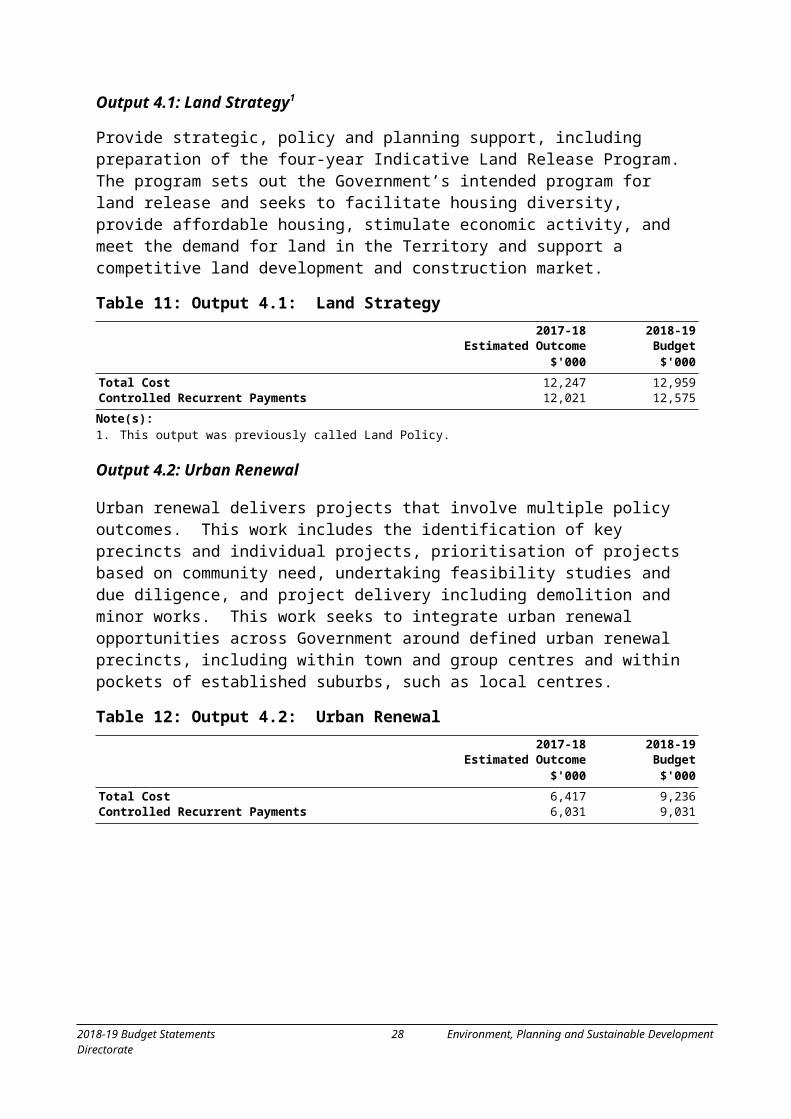
Output 4.1: Land Strategy1
Provide strategic, policy and planning support, including preparation of the four-year Indicative Land Release Program. The program sets out the Government’s intended program for land release and seeks to facilitate housing diversity, provide affordable housing, stimulate economic activity, and meet the demand for land in the Territory and support a competitive land development and construction market.
Table 11: Output 4.1: Land Strategy2017-18 2018-19
Estimated Outcome Budget$'000 $'000
Total Cost 12,247 12,959Controlled Recurrent Payments 12,021 12,575
Note(s):1. This output was previously called Land Policy.
Output 4.2: Urban Renewal
Urban renewal delivers projects that involve multiple policy outcomes. This work includes the identification of key precincts and individual projects, prioritisation of projects based on community need, undertaking feasibility studies and due diligence, and project delivery including demolition and minor works. This work seeks to integrate urban renewal opportunities across Government around defined urban renewal precincts, including within town and group centres and within pockets of established suburbs, such as local centres.
Table 12: Output 4.2: Urban Renewal2017-18 2018-19
Estimated Outcome Budget$'000 $'000
Total Cost 6,417 9,236Controlled Recurrent Payments 6,031 9,031
2018-19 Budget Statements 20 Environment, Planning and Sustainable Development Directorate

Output Class 5: Loose Fill Asbestos Insulation Eradication1
Output 5.1: Loose-fill Asbestos Insulation Eradication Scheme
The Asbestos Response Taskforce delivers the Loose-fill Asbestos Insulation Eradication Scheme safely, compassionately and efficiently. It provides support and advice to affected homeowners, the Canberra community, industry and Government.
Table 13: Output 5.1: Loose-fill Asbestos Insulation Eradication Scheme2017-18 2018-19
Estimated Outcome Budget$'000 $'000
Total Cost2 68,438 36,444Controlled Recurrent Payments 14,935 10,200
Note(s):1. This output class was previously Output Class 3.2. Total cost includes the transfer of the net profit on land sales back to the Government.
Output Class 6: Public Housing Renewal Taskforce1
Output 6.1: Public Housing Renewal Taskforce
The Public Housing Renewal Taskforce is delivering 1,288 replacement public housing dwellings that will better meet the needs of tenants, now and into the future, as part of the ACT Government’s public housing renewal program. This program supports the renewal of Canberra’s urban areas as the Public Housing Renewal Taskforce works with Urban Renewal, the City Renewal Authority and Housing ACT, to support the sale of older multi-unit public housing properties that are no longer fit for purpose.
Table 14: Output 6.1: Public Housing Renewal Taskforce2017-18 2018-19
Estimated Outcome Budget$'000 $'000
Total Cost2 41,716 26,947Controlled Recurrent Payments 41,680 8,829
Note(s):1. This is a new output class. Previously the Public Housing Renewal Taskforce was included in Output Class 4.2.2. Total cost in 2018-19 includes the cost of land and transfer back to Government of the net profit on sale of land.
2018-19 Budget Statements 21 Environment, Planning and Sustainable Development Directorate

Output Class EBT: Office of the Commissioner for Sustainability and the Environment
Output EBT 1: Office of the Commissioner for Sustainability and the Environment
Publication of the State of the Environment Report, investigation of complaints by Ministerial direction, or where a Territory agency’s actions may have a substantial impact on the environment.
Table 15: Output EBT 1: Office of the Commissioner for Sustainability and the Environment
2017-18 2018-19Estimated Outcome Budget
$'000 $'000
Total Cost 1,542 1,670Payment for Expenses on Behalf of the Territory 1,535 1,668
Accountability Indicators
Output Class 1: Planning
Output 1.1: Planning Delivery
Table 16: Accountability Indicators Output 1.1
2017-18Targets
2017-18Estimated Outcome
2018-19Targets
a. Development application processing times:- average processing times in working days 45 561 45- median processing times in working days 30 421 30
b. Percentage of development application decisions made within statutory deadlines
75% 68%1 75%
c. Percentage of development applications appeals resolved by mediation in relation to development proposals
35% 68% 35%
d. Percentage of ACT Civil and Administrative Tribunal (ACAT) decisions which uphold the Directorate’s original decision
85% 85% 85%
Note(s):1. The variance from the 2017-18 Targets to the 2017-18 Estimated Outcome is mainly due to the substantial increase in
the number of development applications received. A large number of the development applications were complex, being in town centres and along Northbourne Avenue, which take longer due to the range of assessment issues and the required resolutions of entity advice relating to infrastructure and utility services.
2018-19 Budget Statements 22 Environment, Planning and Sustainable Development Directorate

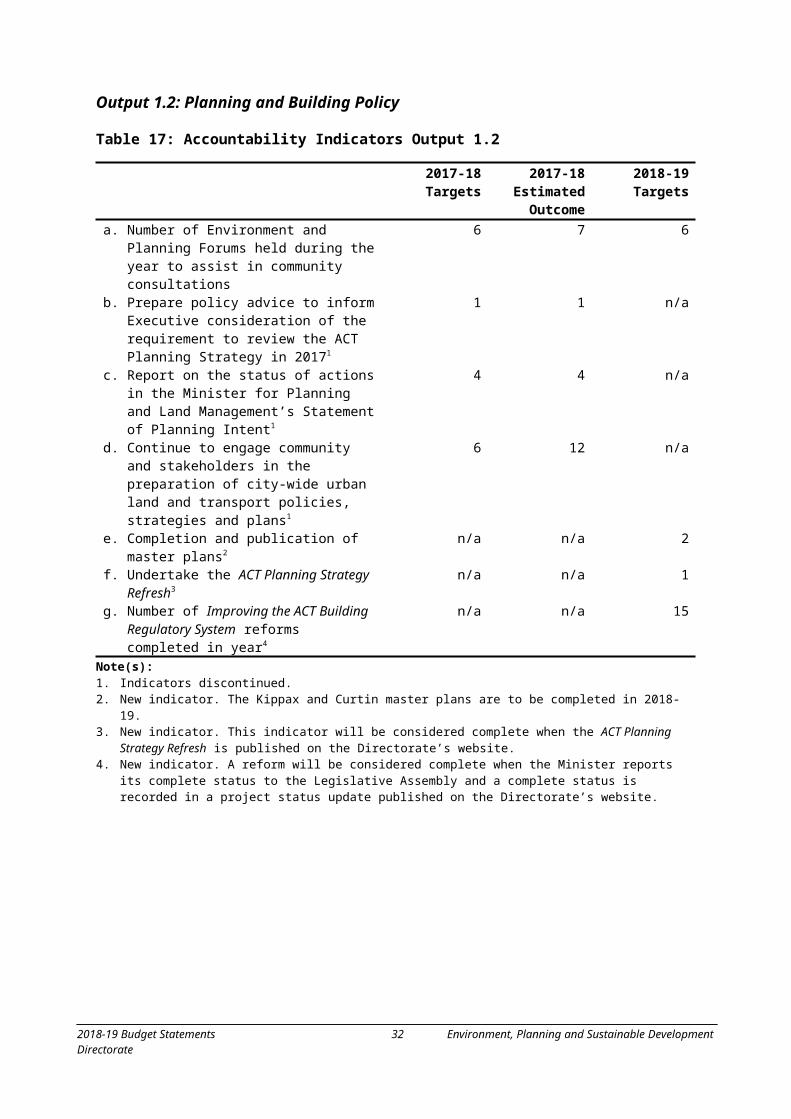
Output 1.2: Planning and Building Policy
Table 17: Accountability Indicators Output 1.2
2017-18Targets
2017-18Estimated Outcome
2018-19Targets
a. Number of Environment and Planning Forums held during the year to assist in community consultations
6 7 6
b. Prepare policy advice to inform Executive consideration of the requirement to review the ACT Planning Strategy in 20171
1 1 n/a
c. Report on the status of actions in the Minister for Planning and Land Management’s Statement of Planning Intent1
4 4 n/a
d. Continue to engage community and stakeholders in the preparation of city-wide urban land and transport policies, strategies and plans1
6 12 n/a
e. Completion and publication of master plans2 n/a n/a 2f. Undertake the ACT Planning Strategy Refresh3 n/a n/a 1g. Number of Improving the ACT Building
Regulatory System reforms completed in year4
n/a n/a 15
Note(s):1. Indicators discontinued.2. New indicator. The Kippax and Curtin master plans are to be completed in 2018-19.3. New indicator. This indicator will be considered complete when the ACT Planning Strategy Refresh is published on the
Directorate’s website.4. New indicator. A reform will be considered complete when the Minister reports its complete status to the Legislative
Assembly and a complete status is recorded in a project status update published on the Directorate’s website.
2018-19 Budget Statements 23 Environment, Planning and Sustainable Development Directorate

Output Class 2: Environment
Output 2.1: Environment
Table 18: Accountability Indicators Output 2.1
2017-18Targets
2017-18Estimated Outcome
2018-19Targets
a. Submit twice yearly progress reports to the Commonwealth for the National Landcare Program1
2 2 1
b. Prepare and submit National Environment Protection Measure jurisdictional reports to the National Environment Protection Council within agreed timeframe
Sep 2017 Oct 2017 Sep 2018
c. Response from the Conservator of Flora and Fauna on development applications issued within statutory timeframes2
90% 95% n/a
d. Prepare a public report on the implementation of the ACT Water Strategy
Dec 2017 Jun 2018 Jun 2019
e. Submit ACT Healthy Waterways project milestone reports to the Commonwealth in accordance with the Commonwealth agreement3
2 2 4
f. Implementation report on the 2015-17 Biodiversity Research and Monitoring Program finalised by December 20174
100% 100% n/a
g. The conservator of Flora and Fauna to finalise Action Plans for matters listed under the Nature Conservation Act 2014, within 6 months following public consultation
100% 11%5 100%
h. Implementation report on the Nature Conservation Strategy 2013-23 to be publicly released by March 20196
n/a n/a Mar 2019
i. Prepare a public report annually on the Conservators actions to protect ACT flora and fauna6
n/a n/a 1
Note(s):1. The 2018-19 Target is one due to the completion of the current Commonwealth program. The final 2017-18 report will
be submitted in 2018-19. The new agreement is currently in negotiation.2. Indicator discontinued as the response times are dependent on information provided by external parties.3. The 2018-19 Target has increased to four to align with the number of milestone reports required under the
Commonwealth agreement.4. Indicator discontinued as the report was completed in 2017-18.5. The Grasslands Strategy, which consisted of 8 Action Plans, was completed within 7 months. The Action Plans took
longer due to extra time to respond to public consultation feedback prior to finalisation.6. New indicator.
2018-19 Budget Statements 24 Environment, Planning and Sustainable Development Directorate

Output 2.2: Conservation and Land Management
Table 19: Accountability Indicators Output 2.2
2017-18Targets
2017-18Estimated Outcome
2018-19Targets
a. Customer satisfaction with the Management of protected areas (Tidbinbilla Nature Reserve, Namadgi National Park and Canberra Nature Park)
90% 90% 90%
b. Implement fuel management activities – grazing – as identified under the approved Bushfire Operational Plan (BOP)
100% 100% 100%
c. Implement fuel management activities – physical removal – as identified under the approved Bushfire Operational Plan (BOP)
100% 100% 100%
d. Implement fuel management activities – slashing – as identified under the approved Bushfire Operational Plan (BOP)
100% 100% 100%
e. Implement fuel management activities – burning – as identified under the approved Bushfire Operational Plan (BOP)
100% 100%1 100%
f. Implement access activities – as identified under the approved Bushfire Operational Plan (BOP)
100% 100% 100%
Note(s):1. The Directorate anticipates the 100 per cent target will be met, however burning is subject to appropriate weather
conditions.
Output 2.3: Heritage
Table 20: Accountability Indicators Output 2.3
2017-18Targets
2017-18Estimated Outcome
2018-19Targets
a. Notification on the legislation register of Heritage Council decisions within 5 working days of the decision
100% 100% 100%
b. Development application advice issued within 15 working days of referral by the ACT Land and Planning Authority
95% 88% 90%1
c. Decisions about heritage registrations by the ACT Heritage Council made within statutory timeframes2
100% 100% 100%
Note(s):1. The 2018-19 target is based on actual time to assess development applications including consultation and
clarifications.2. This indicator relates to the timeframe imposed on the ACT Heritage Council to make a decision on final registrations
under the Heritage Act 2004.
2018-19 Budget Statements 25 Environment, Planning and Sustainable Development Directorate
Output Class 3: Climate Change and Sustainability
Output 3.1: Climate Change and Sustainability
Table 21: Accountability Indicators Output 3.1
2017-18Targets
2017-18Estimated Outcome
2018-19Targets
a. Oversee the actions of the ACT Climate Change Strategy and Action Plan – AP2:- publish an annual inventory1 Dec 2017 Nov 2017 n/a- publish an annual report on emissions targets1
Dec 2017 Nov 2017 n/a
b. Increase in the number of businesses or offices assisted to improve energy and water efficiency, reduce waste and increase recycling2
10% 7% n/a
c. Estimated total electricity saved from Carbon Neutral Government Fund projects
10,000MWh 9,724MWh 10,000MWh
d. Number of households assisted by the Household Low Income Program
1,000 1,200 1,200
e. Number of businesses supported by energy, water and waste programs3
n/a n/a 750
f. Oversee the actions of the ACT’s Climate Strategy to a Net Zero Emissions Territory: - publish an annual greenhouse gas inventory for the ACT4
- publish an annual report on actions to achieve the ACT Government’s target of net zero carbon emissions in the ACT by 2045 and in Government operations by 20204
n/a
n/a
n/a
n/a
Dec 2018
Dec 2018
Note(s):1. Indicator discontinued and replaced with indicator 3.1(f).2. Indicator discontinued and replaced with indicator 3.1(e).3. New indicator which replaces 3.1(b). 4. New indicator which replaces 3.1(a). The indicator was changed to reflect new program names.
2018-19 Budget Statements 26 Environment, Planning and Sustainable Development Directorate

Output Class 4: Land Strategy and Urban Renewal
Output 4.1: Land Strategy
Table 22: Accountability Indicators Output 4.1
2017-18Targets
2017-18Estimated Outcome
2018-19Targets
a. 4 year Indicative Land Release Program published1
1 1 1
b. Publish the annual affordable, community and public housing targets2
n/a n/a 1
Note(s):1. This accountability indicator covers publication of the 2018-19 to 2021-22 Indicative Land Release Program.2. New indicator. This indicator will be considered complete when the targets are notified on the ACT Legislation
website.
Output 4.2: Urban Renewal
Table 23: Accountability Indicators Output 4.2
2017-18Targets
2017-18Estimated Outcome
2018-19Targets
a. Asset Recycling Initiative1 100% 100% n/ab. Asset Recycling Initiative – number of
settlements to be finalised of the eight remaining sites by 2018-19 to enable claim of the 15% Commonwealth Bonus2
n/a n/a 100%
Note(s):1. Indicator discontinued as this measured the percentage of ARI sites for which sales strategies have been established
and endorsed, which is now completed. 2. New indicator.
2018-19 Budget Statements 27 Environment, Planning and Sustainable Development Directorate
Output Class 5: Loose Fill Asbestos Insulation Eradication
Output 5.1: Loose-fill Asbestos Insulation Eradication Scheme
Table 24: Accountability Indicators Output 5.1
2017-18Targets
2017-18Estimated Outcome
2018-19Targets
Community Engagement and Advice:a. Undertake a program to provide advice and
support to residents of properties affected by loose fill asbestos insulation1
1 1 n/a
b. Conduct and/or attend Community Forums/Meetings on loose fill asbestos insulation (e.g. health, management, demolition and personal support)1
3 3 n/a
c. Undertake an awareness program to inform the broader community about the demolition and sales activities of the Scheme1
1 1 n/a
Buy-Back and Demolition Program:d. Continue to facilitate settlement of the
surrender of properties under the Buyback program2
1 1 n/a
e. Purchase affected dwellings3 n/a n/a 1f. Demolish affected dwellings 222 187 21g. Deregister affected properties post
demolition and soil validation178 255 27
Sales Program:h. Sale of remediated and deregistered blocks 395 395 221
Note(s):1. Indicators discontinued as the Scheme has moved into the final phase of operations.2. Indicator discontinued and replaced with indicator 5.1(e).3. New indicator which replaces indicator 5.1(d).
Output Class 6: Public Housing Renewal Taskforce
Output 6.1: Public Housing Renewal Taskforce
Table 25: Accountability Indicators Output 6.1
2017-18Amended
Targets1
2017-18Estimated Outcome
2018-19Targets
a. Public Housing Renewal Program Contracts1 320 414 78b. Public Housing Renewal Program Delivery2 260 314 464
Note(s):1. The 2017-18 Targets were amended during the year via a Section 19D instrument under the Financial Management
Act 1996.2. This accountability indicator covers the delivery of the ACT Government’s Public Housing Renewal Program and
measures the number of replacement dwellings covered by new contracts in the target year. This includes dwellings covered by purchasing contracts and dwellings covered by construction contracts.
2018-19 Budget Statements 28 Environment, Planning and Sustainable Development Directorate

3. This indicator covers the delivery of the ACT Government’s Public Housing Renewal Program and measures the number of replacement dwellings completed and transferred to Housing ACT in the target year.
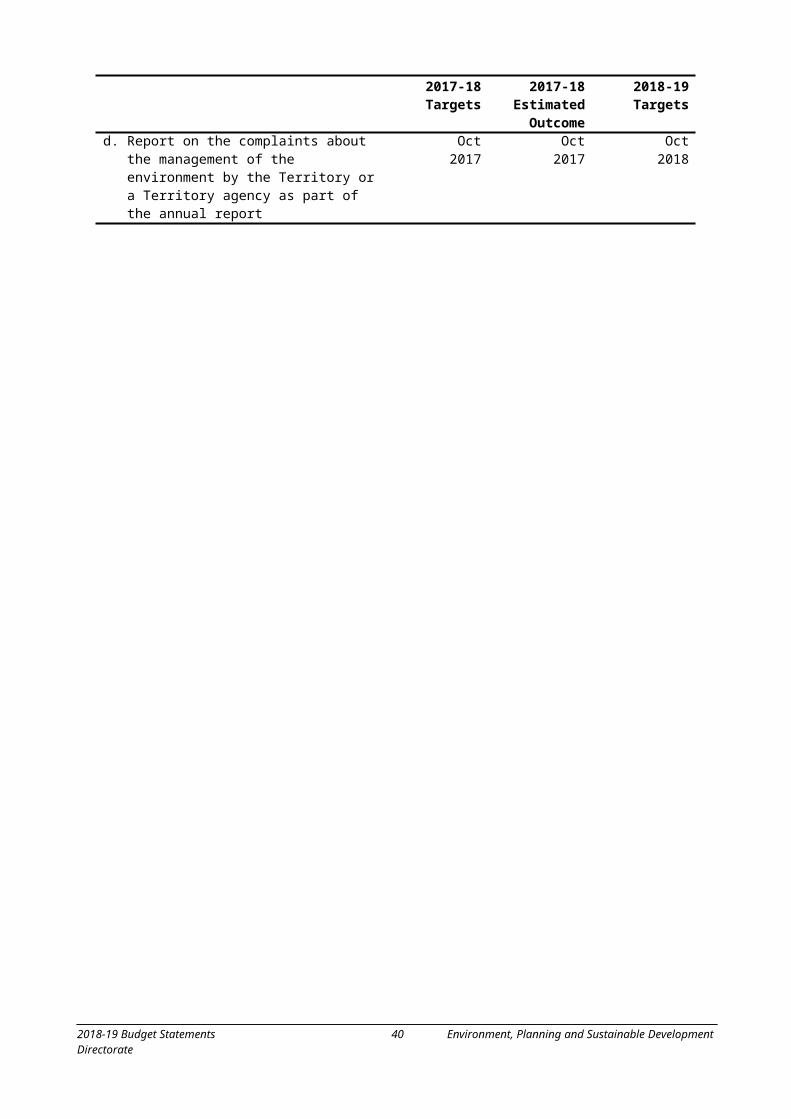
Output Class EBT: Office of the Commissioner for Sustainability and the Environment
Output EBT 1: Office of the Commissioner for Sustainability and the Environment
Table 26: Accountability Indicators Output EBT 1
2017-18Targets
2017-18Estimated Outcome
2018-19Targets
a. Report on the uptake of recommendations on the ACT State of the Environment and special reports as part of the annual report
Oct 2017 Oct 2017 Oct 2018
a. Undertake Ministerial initiated investigations in accordance with the Minister’s direction
100% 100% 100%
b. Undertake Commissioner initiated investigations in accordance with the Terms of Reference
100% 100% 100%
c. Undertake complaints generated investigations in accordance with the Terms of Reference
100% 100% 100%
d. Report on the complaints about the management of the environment by the Territory or a Territory agency as part of the annual report
Oct 2017 Oct 2017 Oct 2018
2018-19 Budget Statements 29 Environment, Planning and Sustainable Development Directorate

Changes to Appropriation
Table 27: Changes to appropriation – Controlled Recurrent Payments
2017-18 Estimated Outcome
$'000
2018-19 Budget
$'000
2019-20 Estimate
$'000
2020-21 Estimate
$'000
2021-22 Estimate
$'000
2017-18 Budget 157,379 119,020 122,547 118,321 118,996
2nd AppropriationBetter support when it matters – Housing Innovation Fund 500 0 0 0 0
FMA Section 16B Rollovers from 2016-17Actsmart Programs 40 0 0 0 0Better Public Housing – New public housing properties 353 0 0 0 0Canberra Urban and Regional Futures 62 0 0 0 0Caring for our Country Complementary Investment 84 0 0 0 0Caring for our Environment – Kangaroo population research
and control367 0 0 0 0
Commonwealth Grant – Established Weed and Pest Management
34 0 0 0 0
Digital Canberra – Upgrade of the ACT Government spatial data management system
159 0 0 0 0
Greenfields Planning for Affordable Housing (Early Planning) 58 0 0 0 0Implementing Water Reform in the Murray-Darling Basin 640 0 0 0 0Improving Our Suburbs – New Molonglo Valley infrastructure 250 0 0 0 0Infill Development Infrastructure Studies (Feasibility) 59 0 0 0 0Loose-fill Asbestos Insulation Eradication Scheme 622 0 0 0 0Master Planning Program – Group Centres, Transport
Corridors and Rural Villages172 0 0 0 0
Molonglo Valley – Implementation of Commitments in the NES Plan
80 0 0 0 0
Securing Electricity Supply in the ACT – Second supply network 62 0 0 0 0Supporting Aboriginal and Torres Strait Islander Peoples –
Kickstarting careers by connecting to culture75 0 0 0 0
Upper Murrumbidgee Waterwatch Program 74 0 0 0 0Urban Renewal Program – Better Public Housing – Allawah
Court25 0 0 0 0
Urban Renewal Program – Better Public Housing – Karuah 24 0 0 0 0Urban Renewal Program – Better Public Housing – Owen Flats 21 0 0 0 0Urban Renewal Program – Better Public Housing - Red Hill
housing precinct592 0 0 0 0
2018-19 Budget Policy DecisionsBetter Government:
Better telecommunication licensing 0 142 0 0 0Carbon Neutral ACT Government Program improvements 0 814 0 0 0Engineer Registration Scheme – early planning 0 35 407 0 0
Keeping our growing city moving:Antill Street Sewer – design works 0 184 0 0 0National Capital City Design Review Panel 0 248 250 252 244
More jobs for our growing city:Aboriginal and Torres Strait Islander Arts Officer –
Contribution to CMTEDD0 -6 -7 -7 -8
Protecting the Murrumbidgee River Corridor 0 75 0 0 0Supporting a sustainable community 0 661 0 0 0
2018-19 Budget Statements 30 Environment, Planning and Sustainable Development Directorate

Urban renewal in Kenny – early planning 0 300 250 0 0
Table 27: Changes to appropriation – Controlled Recurrent Payments (continued)
2017-18 Estimated Outcome
$'000
2018-19 Budget
$'000
2019-20 Estimate
$'000
2020-21 Estimate
$'000
2021-22 Estimate
$'000
More services for our suburbs:Aerial imagery for better planning 0 410 400 420 56Better public places 0 100 0 0 0Cleaning up carp 0 153 156 160 0Due diligence for urban renewal 0 1,499 0 0 0Ecotourism Woodlands Learning Centre 0 200 0 0 0Equestrian infrastructure 0 0 250 0 0Establishing the Molonglo River Reserve 0 0 19 37 62Healthier catchments through better water management 0 120 0 0 0Improved conservation management 0 91 221 260 277Protecting local catchments 0 352 0 0 0Protecting Mulligans Flat Woodland Sanctuary from pests 0 255 189 154 0Protecting native species 0 300 900 950 975Sullivans Creek Flood Management Plan 0 150 0 0 0Urban renewal in Dickson 0 1,006 0 0 0
More support for families and the vulnerable:Innovation in housing choices 0 300 350 125 0Innovation to boost affordable housing 0 500 0 0 0
2018-19 Budget Technical AdjustmentsCessation – University of Canberra – Support for Student
Accommodation Projects0 0 0 -794 -814
Comcare Premium Reduction -305 0 0 0 0Commonwealth Grant - Established Pest and Weed
Management-21 -21 0 0 0
General Savings -424 -3,415 -926 -947 -858Revised Funding Profile – Better services in your community –
Community participation in net zero emissions-9 9 0 0 0
Revised Funding Profile – Better services in your community – Implementation of ACT Climate Change Adaptation Strategy
-350 100 250 0 0
Revised Funding Profile – Better services in your community – Improving sustainability through innovative financing
-50 50 0 0 0
Revised Funding Profile – Better services in your community – Managing native wildlife
-198 198 0 0 0
Revised Funding Profile – Better services in your community – Reviewing the ACT energy rating disclosure scheme
-200 200 0 0 0
Revised Funding Profile – Better support when it matters – Housing Innovation Fund
-500 500 0 0 0
Revised Funding Profile – Better support when it matters – Public Housing Renewal – New and better properties
-507 -1,288 1,795 0 0
Revised Funding Profile – Building a better city – Building Regulation Reform
-225 225 0 0 0
Revised Funding Profile – Building a better city – Bindubi Street extension – Early planning
-295 195 100 0 0
Revised Funding Profile – Building a better city – Building audits
-1,000 600 400 0 0
Revised Funding Profile – Building a better city – Molonglo East-West arterial road – Early planning
-198 -2 200 0 0
Revised Funding Profile – Building a better city - William Hovell Drive upgrade – Early planning
-100 100 0 0 0
Revised Funding Profile – Caring for our Country Complimentary Investment
-250 250 0 0 0
2018-19 Budget Statements 31 Environment, Planning and Sustainable Development Directorate
Revised Funding Profile – Implementing Water Reform in the Murray-Darling Basin
-400 400 0 0 0
Table 27: Changes to appropriation – Controlled Recurrent Payments (continued)
2017-18 Estimated Outcome
$'000
2018-19 Budget
$'000
2019-20 Estimate
$'000
2020-21 Estimate
$'000
2021-22 Estimate
$'000
Revised Funding Profile - Loose-fill Asbestos Eradication Scheme
-55 3,843 2,361 -4,974 -13,537
Revised Funding Profile – Molonglo Valley – Implementation of Commitments in the NES Plan
-89 89 0 0 0
Revised Funding Profile – More and better jobs – Ensuring sustainable commercial development
-325 125 200 0 0
Revised Funding Profile – Progressing Actions on Climate Change
-100 100 0 0 0
Revised Funding Profile - Supporting Aboriginal and Torres Strait Islander Peoples – Kickstarting careers by connecting to culture
-55 55 0 0 0
Revised Funding Profile – Threatened Species Conservation -350 350 0 0 0Revised Indexation Parameters 0 0 0 0 1,996Revised Superannuation Guarantee Rate 0 93 191 385 349Revised Superannuation Parameters -98 41 199 413 1,095Revised Wage Parameters 0 707 1,661 2,602 3,377Transfer – Australian Building Code Board membership
contribution from CMTEDD0 120 120 120 120
Transfer – Better Services – Weston Creek and Stromlo swimming pool and leisure centre to CMTEDD
0 0 -1,050 -1,050 -1,076
Transfer – More and better jobs – New Canberra Theatre (Early Planning) (formerly City to the Lake – New Canberra Theatre (Feasibility)) to CMTEDD
-100 0 0 0 0
Transfer – Strategy and Program Design from CMTEDD 3,075 3,129 3,185 3,240 3,298Transfer – Transport Planning to TCCS 0 -583 -594 -603 -611
2018-19 Budget 158,603 133,079 134,024 119,064 113,941
2018-19 Budget Statements 32 Environment, Planning and Sustainable Development Directorate

Table 28: Changes to appropriation – Expenses on Behalf of the Territory
2017-18 Estimated Outcome
$'000
2018-19 Budget
$'000
2019-20 Estimate
$'000
2020-21 Estimate
$'000
2021-22 Estimate
$'000
2017-18 Budget 2,367 2,004 2,044 2,083 2,083
FMA Section 16B Rollovers from 2016-17Environmental Grants 22 0 0 0 0Heritage Grants 299 0 0 0 0Office of the Commissioner for Sustainability and the
Environment (Operations)110 0 0 0 0
2018-19 Budget Technical AdjustmentsRevised Funding Profile – Commissioner for Sustainability and
the Environment (Operations)-410 200 210 0 0
Revised Funding Profile – Environmental Grants 15 2 8 -5 -20Revised Indexation Parameters 0 0 0 0 -137Revised Superannuation Guarantee Rate 0 2 4 9 9Revised Superannuation Parameters -7 -9 -11 -12 -12Revised Wage Parameters 0 10 24 38 52
2018-19 Budget 2,396 2,209 2,279 2,113 1,975
2018-19 Budget Statements 33 Environment, Planning and Sustainable Development Directorate
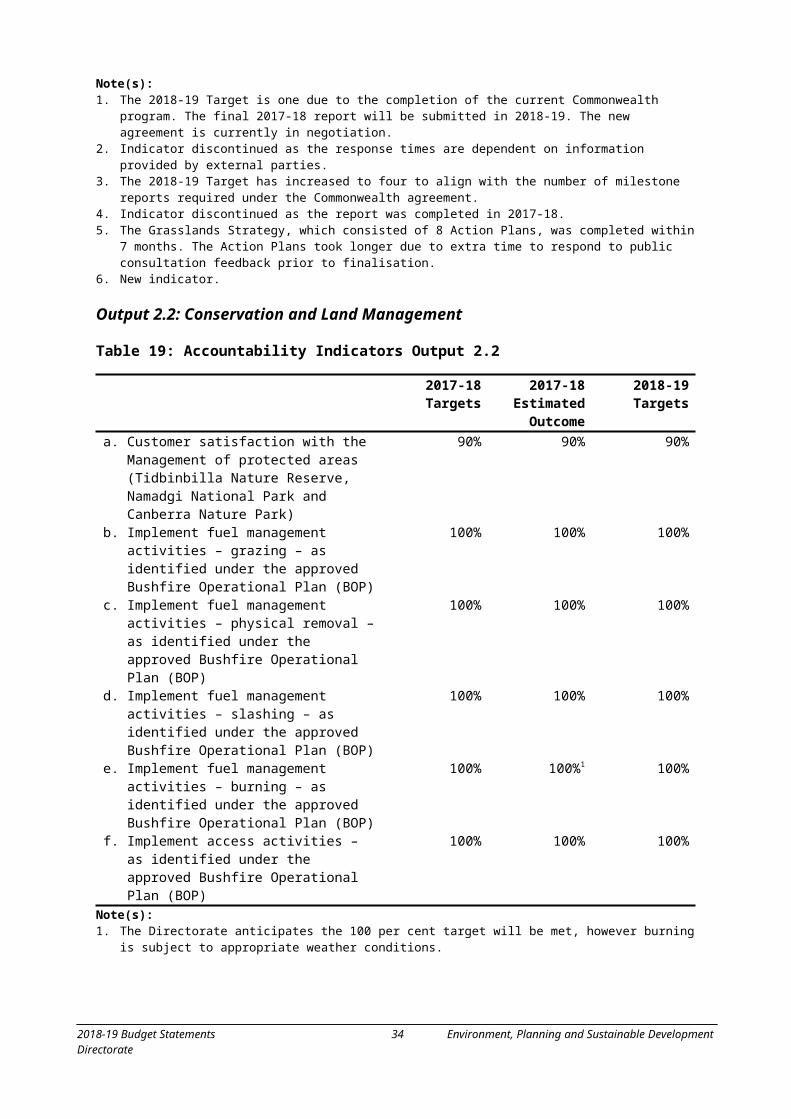
Table 29: Changes to appropriation – Capital Injections, Controlled
2017-18 Estimated Outcome
$'000
2018-19 Budget
$'000
2019-20 Estimate
$'000
2020-21 Estimate
$'000
2021-22 Estimate
$'000
2017-18 Budget 327,040 126,183 14,669 24,361 24,361
FMA Section 16B Rollovers from 2016-17Better Infrastructure Fund 471 0 0 0 0Better Public Housing – New public housing properties 16,183 0 0 0 0Carbon Neutral Government 2,094 0 0 0 0Caring for our Environment – Establishing the Molonglo River
Reserve Stage 3142 0 0 0 0
Caring for our Environment – Improving species and habitat protection
141 0 0 0 0
Caring for our Environment – Tharwa fish habitat improvement
63 0 0 0 0
Digital Canberra – New digital radio communication system 30 0 0 0 0Enhancement of eDevelopment Interface 313 0 0 0 0Enhancing the Protection of Endangered Species and Habitat 784 0 0 0 0Environmental Offsets – Gungahlin (EPIC) 120 0 0 0 0Environmental Offsets – Lawson South 55 0 0 0 0Loose-fill Asbestos Insulation Eradication Scheme 3,805 0 0 0 0Molonglo Valley – Implementation of Commitments in the NES
Plan – Stage 2477 0 0 0 0
Strategic Bushfire Management Plan 524 0 0 0 0Urban Renewal Program – Better Public Housing – Allawah
Court-1,027 0 0 0 0
Urban Renewal Program – Better Public Housing – Karuah 728 0 0 0 0Urban Renewal Program – Better Public Housing – Red Hill
housing precinct-80 0 0 0 0
Woden Valley Stormwater Retardation Basins (Design) 3 0 0 0 0
2018-19 Budget Policy DecisionsBetter services in your community – Red Hill Nature Reserve –
Landfill Remediation0 305 0 0 0
More jobs for our growing city:Commemorating the 50th anniversary of the first moon
landing0 391 0 0 0
More electric vehicle charging1 0 0 0 0 0Protecting the Murrumbidgee River Corridor 0 100 0 0 0
More services for our suburbs:Best of Canberra mountain bike experience – Design 0 74 300 0 0Establishing the Molonglo River Reserve 0 1,044 800 834 504Improved conservation management 50 232 65 0 0
2018-19 Budget Technical AdjustmentsBetter Infrastructure Fund Indexation 0 0 0 0 26Commonwealth Grant – Sustainable Rural Water Use and
Infrastructure Program-4,000 4,000 0 0 0
Reduction - Better Infrastructure Fund 0 -470 0 0 0Revised Funding Profile – Better Infrastructure Fund 0 235 0 0 0Revised Funding Profile – Better Public Housing – New public
housing properties-69,024 1,000 68,024 0 0
Revised Funding Profile – Better services in your community – Improving our capacity to fight bushfires
-800 800 0 0 0
2018-19 Budget Statements 34 Environment, Planning and Sustainable Development Directorate

2018-19 Budget Statements 35 Environment, Planning and Sustainable Development Directorate

Table 29: Changes to appropriation – Capital Injections, Controlled (continued)
2017-18 Estimated Outcome
$'000
2018-19 Budget
$'000
2019-20 Estimate
$'000
2020-21 Estimate
$'000
2021-22 Estimate
$'000
Revised Funding Profile –Better support when it matters – Public Housing Renewal –New and better properties
-4,037 29 4,008 0 0
Revised Funding Profile – Better support when it matters – Public Housing Renewal – Taskforce operations
-395 309 85 0 0
Revised Funding Profile – Caring for our Environment – Establishing the Molonglo River Reserve Stage 3
-150 150 0 0 0
Revised Funding Profile – Caring for our Environment – Water Quality Improvement – Contributions to the ACT Healthy Waterways Project
-1,300 1,300 0 0 0
Revised Funding Profile – Digital Canberra – New digital radio communication system
-270 270 0 0 0
Revised Funding Profile – Enhancing the Protection of Endangered Species and Habitat
-1,200 1,200 0 0 0
Revised Funding Profile – Improving Our City – Woden bus interchange improvements
-150 150 0 0 0
Revised Funding Profile - Loose-fill Asbestos Eradication Scheme
-28,021 11,131 14,235 1,330 -21,651
Revised Funding Profile – Molonglo Valley – Implementation of Commitments in the NES Plan – Stage 2
-200 200 0 0 0
Revised Funding Profile – More and better jobs — Ensuring continuity of the Spatial Data Management System
-600 300 300 0 0
Revised Funding Profile – Red Hill Nature Reserve Remediation (Finalisation and Design)
-90 90 0 0 0
Revised Funding Profile – Support for Building Industry – eDevelopment Renovation Project
-1,600 1,000 600 0 0
Revised Funding Profile – Urban Renewal Program – Better Public Housing – Karuah
-5,000 2,000 3,000 0 0
Revised Funding Profile – Urban Renewal Program – Better Public Housing – Red Hill housing precinct
-1,189 1,189 0 0 0
Revised Wage Parameters 0 303 0 0 0Savings – Better Infrastructure Fund 0 -97 -97 -97 -97Savings – Urban Renewal Program – Better Public Housing –
Allawah Court-9,617 0 0 0 0
Transfer – Building a better city – New Civic pool (formerly City to the Lake – New Civic Pool) to CRA
-400 0 0 0 0
Transfer – Building a better city – West Basin infrastructure (formerly Urban Renewal Program – City to the Lake – West Basin infrastructure) to CRA
-7,500 0 0 0 0
Transfer - Carbon Neutral Government - Capital Injection to Controlled Recurrent Payments
0 -507 0 0 0
Transfer – Urban Renewal Program – Civic and Braddon public realm improvements to CRA
-1,050 0 0 0 0
2018-19 Budget 215,323 152,911 105,989 26,428 3,143Note(s):1. The initiative ‘More jobs for our growing city – More electric vehicle charging’ will be funded from existing resources.
2018-19 Budget Statements 36 Environment, Planning and Sustainable Development Directorate
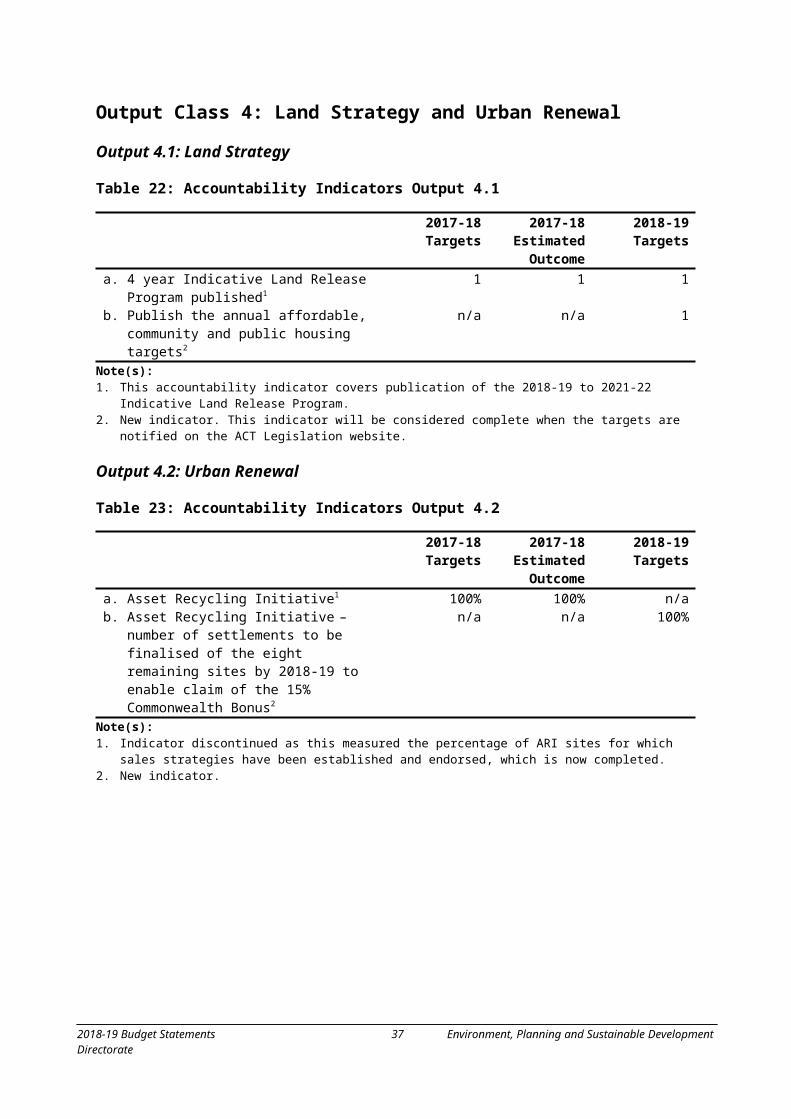
Table 30: Changes to appropriation – Capital Injections, Territorial
2017-18 Estimated Outcome
$'000
2018-19 Budget
$'000
2019-20 Estimate
$'000
2020-21 Estimate
$'000
2021-22 Estimate
$'000
2017-18 Budget 0 0 0 0 0
2018-19 Budget Technical AdjustmentsRevised Wage Parameters 0 4 0 0 0
2018-19 Budget 0 4 0 0 0
2018-19 Budget Statements 37 Environment, Planning and Sustainable Development Directorate

Summary of 2018-19 Infrastructure Program
Table 31: 2018-19 Environment, Planning and Sustainable Development Directorate Infrastructure Program
Project 2018-19$'000
2019-20$'000
2020-21$'000
2021-22$'000
Four YearInvestment
$'000
PhysicalCompletion
Date
CAPITAL WORKS PROGRAM
Work In ProgressACT Healthy Waterways Project
(Commonwealth funded)17,171 0 0 0 17,171 Jun-19
Better Public Housing – New public housing properties
81,019 68,024 0 0 149,043 Jun-19
Better services in your community — Improving our capacity to fight bushfires
2,289 430 0 0 2,719 Jun-20
Better services in your community — Jarramlee Nature Reserve — Protecting our nature reserves
200 0 0 0 200 Jun-19
Better support when it matters — Public Housing Renewal — New and better properties
20,153 4,008 0 0 24,161 Jun-19
Better support when it matters — Public Housing Renewal — Taskforce operations
1,623 85 0 0 1,708 Jun-19
Building a better city – Bindubi Street extension – Early planning
195 100 0 0 295 Jun-20
Building a better city — Molonglo East-West arterial road — Early planning
98 200 0 0 298 Jun-20
Building a better city – William Hovell Drive upgrade – Early planning
200 0 0 0 200 Feb-19
Caring for our Environment – Establishing the Molonglo River Reserve Stage 3
408 0 0 0 408 Jun-19
Caring for our Environment – Improving species and habitat protection
857 257 72 72 1,258 Jun-22
Caring for our Environment – Water Quality Improvement – Contributions to the ACT Healthy Waterways Project
2,600 0 0 0 2,600 Jun-19
Digital Canberra - New digital radio communication system
270 0 0 0 270 Aug-18
Enhancing the Protection of Endangered Species and Habitat
1,819 0 0 0 1,819 Jun-19
Environmental Offsets – Lawson South 197 0 0 0 197 Jun-19Improving Our City – Woden bus
interchange improvements150 0 0 0 150 Jul-18
Molonglo Valley – Implementation of Commitments in the NES Plan
89 0 0 0 89 Jun-19
Molonglo Valley – Implementation of Commitments in the NES Plan – Stage 2
200 0 0 0 200 Jun-19
More and better jobs — Ensuring continuity of the Spatial Data Management System
532 300 0 0 832 Jun-20
2018-19 Budget Statements 38 Environment, Planning and Sustainable Development Directorate

Red Hill Nature Reserve Remediation (Finalisation and Design)
90 0 0 0 90 Jun-19
Table 31: 2018-19 Environment, Planning and Sustainable Development Directorate Infrastructure Program (continued)
Project 2018-19$'000
2019-20$'000
2020-21$'000
2021-22$'000
Four YearInvestment
$'000
PhysicalCompletion
Date
Securing Electricity Supply in the ACT – Second supply network
275 0 0 0 275 Jun-19
Support for Building Industry – eDevelopment Renovation Project
1,000 600 0 0 1,600 Sep-19
Urban Renewal Program – Better Public Housing – Karuah
2,000 3,000 0 0 5,000 Mar-17
Urban Renewal Program – Better Public Housing – Red Hill housing precinct
1,189 0 0 0 1,189 Mar-17
Total Work In Progress 134,624 77,004 72 72 211,772
New WorkBetter services in your community – Red
Hill Nature Reserve – Landfill remediation
305 0 0 0 305 Jun-19
More jobs for our growing city:Commemorating the 50th anniversary
of the first moon landing391 0 0 0 391 Jun-19
More electric vehicle charging 456 0 0 0 456 Jun-19Protecting the Murrumbidgee River
Corridor100 0 0 0 100 Jun-19
Urban renewal in Kenny – early planning
300 250 0 0 550 Jun-20
More services for our suburbs:Best of Canberra mountain bike
experience – Design74 300 0 0 374 Jun-20
Establishing the Molonglo River Reserve
1,044 800 834 504 3,182 Jun-22
Improved conservation management 232 65 0 0 297 Jun-21Sullivans Creek Flood Management
Plan150 0 0 0 150 Jun-19
Total New Capital 3,052 1,415 834 504 5,805
Better Infrastructure FundHeritage Conservation 83 158 162 166 569 Jun-19Land Release Infrastructure 302 310 318 326 1,256 Jun-19Parks and Conservation 380 557 571 585 2,093 Jun-19
Total Better Infrastructure Fund 765 1,025 1,051 1,077 3,918
2018-19 Budget Statements 39 Environment, Planning and Sustainable Development Directorate
Financial Statements – Controlled
Table 32: Environment, Planning and Sustainable Development Directorate: Operating Statement
2017-18 Budget
$'000
2017-18 Estimated Outcome
$'000
2018-19 Budget
$'000
Var%
2019-20 Estimate
$'000
2020-21 Estimate
$'000
2021-22 Estimate
$'000
Income
Revenue157,379 Controlled Recurrent
Payments158,603 133,079 -16 134,024 119,064 113,941
53,731 Land Revenue 62,091 31,272 -50 2,956 3,543 028 Taxes, Fees and Fines 28 29 4 29 29 30
9,177 User Charges 13,674 31,288 129 10,905 10,352 9,674329 Interest 882 440 -50 148 91 92
2,267 Resources Received Free of Charge
2,267 2,358 4 2,452 2,550 2,613
21,147 Other Revenue 100,985 2,364 -98 1,753 2,230 571
244,058 Total Revenue 338,530 200,830 -41 152,267 137,859 126,921
Gains2 Other Gains 0 0 - 0 0 0
2 Total Gains 0 0 - 0 0 0
244,060 Total Income 338,530 200,830 -41 152,267 137,859 126,921
Expenses 64,119 Employee Expenses 64,641 65,651 2 65,472 65,032 62,531
9,175 Superannuation Expenses 9,070 9,616 6 9,781 10,093 10,313101,982 Supplies and Services 97,055 68,180 -30 55,849 51,656 49,194
3,023 Depreciation and Amortisation
3,023 3,123 3 3,492 3,572 3,584
4,395 Grants and Purchased Services
8,253 10,508 27 9,470 8,557 3,088
86 Cost of Goods Sold 206 13,506 # 207 207 2083,456 Other Expenses 6,226 6,894 11 6,499 7,285 2,519
45,419 Transfer Expenses 55,246 32,300 -42 2,541 3,113 0
231,655 Total Expenses 243,720 209,778 -14 153,311 149,515 131,437
12,405 Operating Result 94,810 -8,948 -109 -1,044 -11,656 -4,516
12,405 Total Comprehensive Income
94,810 -8,948 -109 -1,044 -11,656 -4,516
2018-19 Budget Statements 40 Environment, Planning and Sustainable Development Directorate

Table 33: Environment, Planning and Sustainable Development Directorate: Balance Sheet
Budgetat
30/6/18 $'000
2017-18 Estimated Outcome
$'000
Budgetat
30/6/19 $'000
Var%
Estimateat
30/6/20 $'000
Estimateat
30/6/21 $'000
Estimateat
30/6/22 $'000
Current Assets39,845 Cash and Cash Equivalents 90,018 103,834 15 104,474 106,640 100,204
3,404 Receivables 5,219 5,139 -2 4,922 5,168 5,26951 Inventories 75 75 - 75 75 75
81,115 Assets Held for Sale 95,273 7,901 -92 5,112 0 0329 Other Assets 290 145 -50 145 0 0
124,744 Total Current Assets 190,875 117,094 -39 114,728 111,883 105,548
Non Current Assets6,380 Receivables 6,921 5,774 -17 4,975 4,344 3,713
291,243 Property, Plant and Equipment
298,021 286,616 -4 290,887 287,801 285,855
38,196 Intangible Assets 103,984 106,637 3 105,919 105,201 104,483147,769 Capital Works in Progress 94,721 48,065 -49 102,438 103,347 104,034
26,514 Other Assets 29,917 29,917 - 29,917 29,917 29,917
510,102 Total Non Current Assets 533,564 477,009 -11 534,136 530,610 528,002
634,846 TOTAL ASSETS 724,439 594,103 -18 648,864 642,493 633,550
Current Liabilities3,876 Payables 22,923 23,021 .. 23,119 23,217 23,315
22,237 Employee Benefits 20,953 21,803 4 23,011 24,271 25,56329,698 Other Provisions 21,988 31,550 43 10,778 15,428 6,427
847 Other Liabilities 2,767 2,753 -1 2,739 2,725 2,711
56,658 Total Current Liabilities 68,631 79,127 15 59,647 65,641 58,016
Non Current Liabilities1,161 Employee Benefits 1,007 1,053 5 1,109 1,166 1,223
15,654 Other Provisions 30,340 17,091 -44 14,756 0 0
16,815 Total Non Current Liabilities 31,347 18,144 -42 15,865 1,166 1,223
73,473 TOTAL LIABILITIES 99,978 97,271 -3 75,512 66,807 59,239
561,373 NET ASSETS 624,461 496,832 -20 573,352 575,686 574,311
REPRESENTED BY FUNDS EMPLOYED
434,393 Accumulated Funds 492,533 364,904 -26 441,424 443,758 442,383126,980 Asset Revaluation Surplus 131,928 131,928 - 131,928 131,928 131,928
561,373 TOTAL FUNDS EMPLOYED 624,461 496,832 -20 573,352 575,686 574,311
2018-19 Budget Statements 41 Environment, Planning and Sustainable Development Directorate

Table 34: Environment, Planning and Sustainable Development Directorate: Statement of Changes in Equity
Budgetat
30/6/18 $'000
2017-18 Estimated Outcome
$'000
Budgetat
30/6/19 $'000
Var%
Estimateat
30/6/20 $'000
Estimateat
30/6/21 $'000
Estimateat
30/6/22 $'000
Opening Equity404,742 Opening Accumulated Funds 446,079 492,533 10 364,904 441,424 443,758126,980 Opening Asset Revaluation
Reserve131,928 131,928 - 131,928 131,928 131,928
531,722 Balance at the Start of the Reporting Period
578,007 624,461 8 496,832 573,352 575,686
Comprehensive Income12,405 Operating Result - Including
Economic Flows94,810 -8,948 -109 -1,044 -11,656 -4,516
12,405 Total Comprehensive Income
94,810 -8,948 -109 -1,044 -11,656 -4,516
Transactions Involving Owners Affecting Accumulated Funds327,040 Capital Injections 215,323 152,911 -29 105,989 26,428 3,143
-194,659 Capital Distributions to Government
-194,659 -105,388 46 -12,594 -12,436 0
-115,135 Inc/Dec in Net Assets due to Admin Restructure
-69,020 -166,204 -141 -15,831 -2 -2
17,246 Total Transactions Involving Owners Affecting Accumulated Funds
-48,356 -118,681 -145 77,564 13,990 3,141
Closing Equity434,393 Closing Accumulated Funds 492,533 364,904 -26 441,424 443,758 442,383126,980 Closing Asset Revaluation
Reserve131,928 131,928 - 131,928 131,928 131,928
561,373 Balance at the end of the Reporting Period
624,461 496,832 -20 573,352 575,686 574,311
2018-19 Budget Statements 42 Environment, Planning and Sustainable Development Directorate

Table 35: Environment, Planning and Sustainable Development Directorate: Cash Flow Statement
2017-18 Budget
$'000
2017-18 Estimated Outcome
$'000
2018-19 Budget
$'000
Var %
2019-20 Estimate
$'000
2020-21 Estimate
$'000
2021-22 Estimate
$'000
CASH FLOWS FROM OPERATING ACTIVITIESReceipts
157,379 Controlled Recurrent Payments
158,603 133,079 -16 134,024 119,064 113,941
28 Taxes, Fees and Fines 28 29 4 29 29 309,539 User Charges 14,036 31,650 125 11,267 10,714 10,036
329 Interest Received 882 440 -50 148 91 9223,250 Other 24,788 4,467 -82 3,856 4,333 2,674
190,525 Operating Receipts 198,337 169,665 -14 149,324 134,231 126,773
Payments63,185 Employee 63,169 64,716 2 64,167 63,920 61,387
9,178 Superannuation 9,032 9,620 7 9,785 10,150 10,370100,991 Supplies and Services 96,064 67,117 -30 54,717 50,450 47,925
4,420 Grants and Purchased Services
8,278 10,533 27 9,495 8,582 3,113
45,419 Transfer of Territory Receipts to the ACT Government
55,246 32,300 -42 2,541 3,113 0
86 Related to Cost of Goods Sold 206 206 - 207 207 2084,561 Other 7,331 7,979 9 7,564 8,350 12,254
227,840 Operating Payments 239,326 192,471 -20 148,476 144,772 135,257
-37,315 NET CASH INFLOW/(OUTFLOW) FROM OPERATING ACTIVITIES
-40,989 -22,806 44 848 -10,541 -8,484
CASH FLOWS FROM INVESTING ACTIVITIESReceipts
248,396 Proceeds from Sale of Property, Plant and Equipment
256,750 136,660 -47 15,550 15,979 0
1,550 Repayment of Loan Principal 1,550 1,664 7 1,827 1,478 1,478249,946 Investing Receipts 258,300 138,324 -46 17,377 17,457 1,478
Payments258,863 Purchase of Property, Plant
and Equipment169,268 136,677 -19 78,894 1,957 1,653
66,806 Purchase of Land and Intangibles
49,787 12,135 -76 31,166 15,865 0
920 Loans Provided (Loans Receivable)
3,550 413 -88 920 920 920
326,589 Investing Payments 222,605 149,225 -33 110,980 18,742 2,573
-76,643 NET CASH INFLOW/(OUTFLOW) FROM INVESTING ACTIVITIES
35,695 -10,901 -131 -93,603 -1,285 -1,095
2018-19 Budget Statements 43 Environment, Planning and Sustainable Development Directorate

Table 35: Environment, Planning and Sustainable Development Directorate: Cash Flow Statement (continued)
2017-18 Budget
$'000
2017-18 Estimated Outcome
$'000
2018-19 Budget
$'000
Var %
2019-20 Estimate
$'000
2020-21 Estimate
$'000
2021-22 Estimate
$'000
CASH FLOWS FROM FINANCING ACTIVITIESReceipts
327,040 Capital Injections 215,323 152,911 -29 105,989 26,428 3,1430 Receipts of Transferred Cash
Balances10,572 0 -100 0 0 0
327,040 Financing Receipts 225,895 152,911 -32 105,989 26,428 3,143
Payments194,659 Distributions to Government 194,659 105,388 -46 12,594 12,436 0194,659 Financing Payments 194,659 105,388 -46 12,594 12,436 0
132,381 NET CASH INFLOW/(OUTFLOW) FROM FINANCING ACTIVITIES
31,236 47,523 52 93,395 13,992 3,143
18,423 NET INCREASE/(DECREASE) IN CASH AND CASH EQUIVALENTS
25,942 13,816 -47 640 2,166 -6,436
21,422 CASH AT THE BEGINNING OF REPORTING PERIOD
64,076 90,018 40 103,834 104,474 106,640
39,845 CASH AT THE END OF REPORTING PERIOD
90,018 103,834 15 104,474 106,640 100,204
2018-19 Budget Statements 44 Environment, Planning and Sustainable Development Directorate

Notes to the Controlled Budget Statements
Significant variations are as follows:
Operating Statement
controlled recurrent payments:
- the decrease of $25.524 million (16 per cent) in the 2018-19 Budget from the 2017-18 estimated outcome is mainly due to the funding required for the Public Housing Renewal Taskforce decreasing as the program moves away from demolition and into construction ($31.069 million), partially offset by new initiatives ($5.219 million).
land revenue:
- the increase of $8.360 million in the 2017-18 estimated outcome from the original budget is due to an increase in the projected sale price of remediated land under the loose-fill asbestos insulation eradication scheme.
- the decrease of $30.819 million in the 2018-19 Budget from the 2017-18 estimated outcome is due to the decrease in the number of sales of remediated land under the loose-fill asbestos insulation eradication scheme as the program nears completion.
user charges:
- the increase of $4.497 million in the 2017-18 estimated outcome from the original budget is mainly due to a change in the way forestry harvesting sales are recorded. The sales proceeds are now shown as gross, not net of expenditure.
- the increase of $17.614 million in the 2018-19 Budget from the 2017-18 estimated outcome is mainly due to the sale proceeds of dwellings to the market by the Public Housing Renewal Taskforce.
other revenue:
- the increase of $79.838 million in the 2017-18 estimated outcome from the original budget is mainly due to the collection of additional Large Scale Generation Certificates surrendered by large scale generators of electricity under the Renewable Energy Target Scheme.
- the decrease of $98.621 million in the 2018-19 Budget from the 2017-18 estimated outcome is mainly due to the Large Scale Generation Certificates not showing in the Directorate’s statements in 2018-19. The 2018-19 Budget has been included in the whole of government statements.
2018-19 Budget Statements 45 Environment, Planning and Sustainable Development Directorate

supplies and services:
- the decrease of $28.875 million in the 2018-19 Budget from the 2017-18 estimated outcome is due to the funding required for the Public Housing Taskforce decreasing as the program moves away from demolition and into construction ($31.069 million).
grants and purchased services:
- the increase of $3.858 million in the 2017-18 estimated outcome from the original budget is mainly due to an increase in grants provided under the Next Generation Battery Storage program.
- the increase of $2.255 million in the 2018-19 Budget from the 2017-18 estimated outcome is mainly due to an increase in grants provided under the Next Generation Battery Storage program.
cost of goods sold:
- the increase of $13.300 million in the 2018-19 Budget from the 2017-18 estimated outcome is mainly due to the cost of the dwellings to be sold by the Public Housing Renewal Taskforce.
other expenses:
- the increase of $2.770 million in the 2017-18 estimated outcome from the original budget is mainly due to a change in classification from supplies and services to other for expenses associated with agent fees and financial assistance payments under the loose-fill asbestos insulation eradication scheme.
transfer expenses:
- the increase of $9.827 million in the 2017-18 estimated outcome from the original budget is due to an increase in sales under the loose-fill asbestos insulation eradication scheme being paid back to Government.
- the decrease of $22.946 million in the 2018-19 Budget from the 2017-18 estimated outcome is due to a decrease in sales under the loose-fill asbestos insulation eradication scheme being paid back to Government.
2018-19 Budget Statements 46 Environment, Planning and Sustainable Development Directorate

Balance Sheet
cash and equivalents:
- the increase of $50.173 million in the 2017-18 estimated outcome from the original budget is mainly due to the cash received from the Renewable Energy Innovation Fund, the Commonwealth’s ACT Healthy Waterways program and the additional money available under the Carbon Neutral Government loan.
- the increase of $13.816 million in the 2018-19 Budget from the 2017-18 estimated outcome is mainly due to the cash received from the Renewable Energy Innovation Fund and the additional money available from repayments to the Directorate under the Carbon Neutral Government loan.
current and non-current receivables:
- the increase of $2.356 million in the 2017-18 estimated outcome from the original budget is mainly due to new Carbon Neutral Government loans.
- the decrease of $1.227 million in the 2018-19 Budget from the 2017-18 estimated outcome is mainly due to the repayments received against existing Carbon Neutral Government loans.
assets held for sale:
- the increase of $14.158 million in the 2017-18 estimated outcome from the original budget is due to the higher number of blocks held for sale under the loose-fill asbestos insulation eradication scheme.
- the decrease of $87.372 million in the 2018-19 Budget from the 2017-18 estimated outcome is due to a lower number of blocks held following sale of land under the loose-fill asbestos insulation eradication scheme as the program nears completion.
intangible assets:
- the increase of $65.788 million in the 2017-18 estimated outcome from the original budget is due to the additional Large Scale Generation Certificates received as part of the Renewable Energy Target Scheme.
capital works in progress:
- the decrease of $53.048 million in the 2017-18 estimated outcome from the original budget is mainly due to the delays in completion of capital works associated with the Public Housing Renewal Taskforce.
- the decrease of $46.656 million in the 2018-19 Budget from the 2017-18 estimated outcome is mainly due to delays in financial completion of capital works associated with the Public Housing Renewal Taskforce.
2018-19 Budget Statements 47 Environment, Planning and Sustainable Development Directorate

other assets:
- the increase of $3.403 million in the 2017-18 estimated outcome from the original budget is due to the revaluation of biological assets completed in July 2018.
payables:
- the increase of $19.047 million in the 2017-18 estimated outcome from the original budget is mainly due to the flow-on effects of the 2016-17 financial results.
current and non-current other provisions:
- the increase of $6.976 million in the 2017-18 estimated outcome from the original budget relates to the increase in the value of the provisions associated with the loose-fill asbestos insulation eradication scheme.
- the decrease of $3.687 million in the 2018-19 Budget from the 2017-18 estimated outcome is mainly due to a decrease in the value of the provisions associated with the loose-fill asbestos insulation eradication scheme as property remediation is completed.
other liabilities:
- the increase of $1.920 million in the 2017-18 estimated outcome from the original budget is due to an increase in sales deposits held under the loose-fill asbestos insulation eradication scheme at the end of the financial year.
Statement of Changes in Equity
capital injections:
- the decrease of $111.717 million in the 2017-18 estimated outcome from the original budget is mainly due to the delays in completion of capital works associated with the Public Housing Renewal Taskforce.
- the decrease of $62.412 million in the 2018-19 Budget from the 2017-18 estimated outcome is mainly due to delays in financial completion of capital works associated with the Public Housing Renewal Taskforce.
Cash Flow Statement
Variations in the Statement are explained in the notes above.
2018-19 Budget Statements 48 Environment, Planning and Sustainable Development Directorate

Financial Statements – Territorial
Table 36: Environment, Planning and Sustainable Development Directorate: Statement of Income and Expenses on behalf of the Territory
2017-18 Budget
$'000
2017-18 Estimated Outcome
$'000
2018-19 Budget
$'000
Var%
2019-20 Estimate
$'000
2020-21 Estimate
$'000
2021-22 Estimate
$'000
Revenue2,367 Payment for Expenses on
Behalf of the Territory2,396 2,209 -8 2,279 2,113 1,975
31,091 Taxes, Fees and Fines 15,981 29,150 82 33,289 33,350 34,16120,638 Land Revenue 23,469 52,171 122 43,157 56,876 60,831
796 Interest 1,176 2,847 142 1,929 3,194 3,8210 Other Revenue 3,140 0 -100 0 0 0
54,892 Total Revenue 46,162 86,377 87 80,654 95,533 100,788
Expenses 829 Employee Expenses 836 854 2 876 900 922105 Superannuation Expenses 98 102 4 107 115 118908 Supplies and Services 608 714 17 737 539 551525 Grants and Purchased
Services861 541 -37 561 562 561
4,547 Other Expenses 4,633 3,950 -15 1,400 900 047,978 Transfer Expenses 39,133 80,218 105 76,975 92,520 98,638
54,892 Total Expenses 46,169 86,379 87 80,656 95,536 100,790
0 Operating Result -7 -2 71 -2 -3 -2
0 Total Comprehensive Income
-7 -2 71 -2 -3 -2
2018-19 Budget Statements 49 Environment, Planning and Sustainable Development Directorate

Table 37: Environment, Planning and Sustainable Development Directorate: Statement of Assets and Liabilities on behalf of the Territory
Budgetat
30/6/18 $'000
2017-18 Estimated Outcome
$'000
Budgetat
30/6/19 $'000
Var%
Estimateat
30/6/20 $'000
Estimateat
30/6/21 $'000
Estimateat
30/6/22 $'000
Current Assets3,587 Cash and Cash Equivalents 1,888 1,855 -2 1,822 1,789 1,756
93,599 Receivables 73,808 79,347 8 85,116 90,885 96,654133 Inventories 133 133 - 133 133 133
97,319 Total Current Assets 75,829 81,335 7 87,071 92,807 98,543
Non Current Assets1,403 Receivables 1,111 1,217 10 1,323 1,429 1,535
90,232 Property, Plant and Equipment
76,061 76,061 - 76,061 76,061 76,061
91,635 Total Non Current Assets 77,172 77,278 .. 77,384 77,490 77,596
188,954 TOTAL ASSETS 153,001 158,613 4 164,455 170,297 176,139
Current Liabilities95,507 Payables 74,012 79,503 7 85,224 90,945 96,666
104 Employee Benefits 160 163 2 170 178 1851,039 Other Liabilities 1,172 1,177 .. 1,182 1,187 1,192
96,650 Total Current Liabilities 75,344 80,843 7 86,576 92,310 98,043
Non Current Liabilities222 Payables 111 222 100 333 444 555
14 Employee Benefits 3 3 - 3 3 31,189 Other Liabilities 1,005 1,005 - 1,005 1,005 1,005
1,425 Total Non Current Liabilities 1,119 1,230 10 1,341 1,452 1,563
98,075 TOTAL LIABILITIES 76,463 82,073 7 87,917 93,762 99,606
90,879 NET ASSETS 76,538 76,540 .. 76,538 76,535 76,533
REPRESENTED BY FUNDS EMPLOYED
34,210 Accumulated Funds 34,041 34,043 .. 34,041 34,038 34,03656,669 Asset Revaluation Surplus 42,497 42,497 - 42,497 42,497 42,497
90,879 TOTAL FUNDS EMPLOYED 76,538 76,540 .. 76,538 76,535 76,533
2018-19 Budget Statements 50 Environment, Planning and Sustainable Development Directorate

Table 38: Environment, Planning and Sustainable Development Directorate: Statement of Changes in Equity on behalf of the Territory
Budgetat
30/6/18 $'000
2017-18 Estimated Outcome
$'000
Budgetat
30/6/19 $'000
Var%
Estimateat
30/6/20 $'000
Estimateat
30/6/21 $'000
Estimateat
30/6/22 $'000
Opening Equity34,210 Opening Accumulated Funds 34,048 34,041 .. 34,043 34,041 34,03856,669 Opening Asset Revaluation
Reserve42,497 42,497 - 42,497 42,497 42,497
90,879 Balance at the Start of the Reporting Period
76,545 76,538 .. 76,540 76,538 76,535
Comprehensive Income0 Operating Result - Including
Economic Flows-7 -2 71 -2 -3 -2
0 Total Comprehensive Income
-7 -2 71 -2 -3 -2
Transactions Involving Owners Affecting Accumulated Funds0 Capital Injections 0 4 # 0 0 0
0 Total Transactions Involving Owners Affecting Accumulated Funds
0 4 # 0 0 0
Closing Equity34,210 Closing Accumulated Funds 34,041 34,043 .. 34,041 34,038 34,03656,669 Closing Asset Revaluation
Reserve42,497 42,497 - 42,497 42,497 42,497
90,879 Balance at the end of the Reporting Period
76,538 76,540 .. 76,538 76,535 76,533
2018-19 Budget Statements 51 Environment, Planning and Sustainable Development Directorate

Table 39: Environment, Planning and Sustainable Development Directorate: Cash Flow Statement on behalf of the Territory
2017-18 Budget
$'000
2017-18 Estimated Outcome
$'000
2018-19 Budget
$'000
Var %
2019-20 Estimate
$'000
2020-21 Estimate
$'000
2021-22 Estimate
$'000
CASH FLOWS FROM OPERATING ACTIVITIESReceipts
2,367 Payment for Expenses on Behalf of the Territory
2,396 2,209 -8 2,279 2,113 1,975
31,091 Taxes, Fees and Fines 15,981 29,150 82 33,289 33,350 34,161796 Interest Received 1,176 2,847 142 1,929 3,194 3,821
15,806 Land Sales 22,587 47,204 109 37,724 51,627 55,1055,004 Other 8,144 5,139 -37 5,278 5,421 5,579
55,064 Operating Receipts 50,284 86,549 72 80,499 95,705 100,641
Payments829 Employee 829 856 3 874 897 920105 Superannuation 98 102 4 107 115 118
1,108 Supplies and Services 808 914 13 937 739 751525 Grants and Purchased
Services861 541 -37 561 562 561
47,978 Transfer of Territory Receipts to the ACT Government
43,083 80,218 86 76,648 92,520 98,319
4,552 Other 4,638 3,955 -15 1,405 905 555,097 Operating Payments 50,317 86,586 72 80,532 95,738 100,674
-33 NET CASH INFLOW/(OUTFLOW) FROM OPERATING ACTIVITIES
-33 -37 -12 -33 -33 -33
CASH FLOWS FROM FINANCING ACTIVITIESReceipts
0 Capital Injections 0 4 # 0 0 00 Financing Receipts 0 4 # 0 0 0
0 NET CASH INFLOW/(OUTFLOW) FROM FINANCING ACTIVITIES
0 4 # 0 0 0
-33 NET INCREASE/(DECREASE) IN CASH AND CASH EQUIVALENTS
-33 -33 - -33 -33 -33
3,620 CASH AT THE BEGINNING OF REPORTING PERIOD
1,921 1,888 -2 1,855 1,822 1,789
3,587 CASH AT THE END OF REPORTING PERIOD
1,888 1,855 -2 1,822 1,789 1,756
2018-19 Budget Statements 52 Environment, Planning and Sustainable Development Directorate

Notes to the Territorial Budget Statements
Significant variations are as follows:
Statement of Income and Expenses on behalf of the Territory
taxes, fees and fines:
- the decrease of $15.110 million in the 2017-18 estimated outcome from the original budget is mainly due to a decrease in the estimate for lease variation charge.
- the increase of $13.169 million in the 2018-19 Budget from the 2017-18 estimated outcome is mainly due to an increase in the estimate for lease variation charge.
land revenue:
- the increase of $2.831 million in the 2017-18 estimated outcome from the original budget is mainly due to timings in the land release program.
- the increase of $28.702 million in the 2018-19 Budget from the 2017-18 estimated outcome is mainly due to timings in the land release program.
interest revenue:
- the increase of $1.671 million in the 2018-19 Budget from the 2017-18 estimated outcome is mainly due to timings in the land release program.
other revenue:
- the increase of $3.140 million in the 2017-18 estimated outcome from the original budget is due to the land rent payouts received that were not budgeted.
- the decrease of $3.140 million in the 2018-19 Budget from the 2017-18 estimated outcome is due to the once off impact of the land rent payouts in the 2017-18 financial year.
transfer expenses: variations in these expenses reflect the variations in revenues described above.
Statement of Assets and Liabilities on behalf of the Territory
cash and equivalents:
- the decrease of $1.699 million in the 2017-18 estimated outcome from the original budget is mainly due to the flow-on effects of the 2016-17 financial results.
current and non-current receivables:
- the decrease of $20.083 million in the 2017-18 estimated outcome from the original budget is mainly due to the timing of receipts for the sale of land under the land release program to the Suburban Land Agency and the City Renewal Authority.
2018-19 Budget Statements 53 Environment, Planning and Sustainable Development Directorate
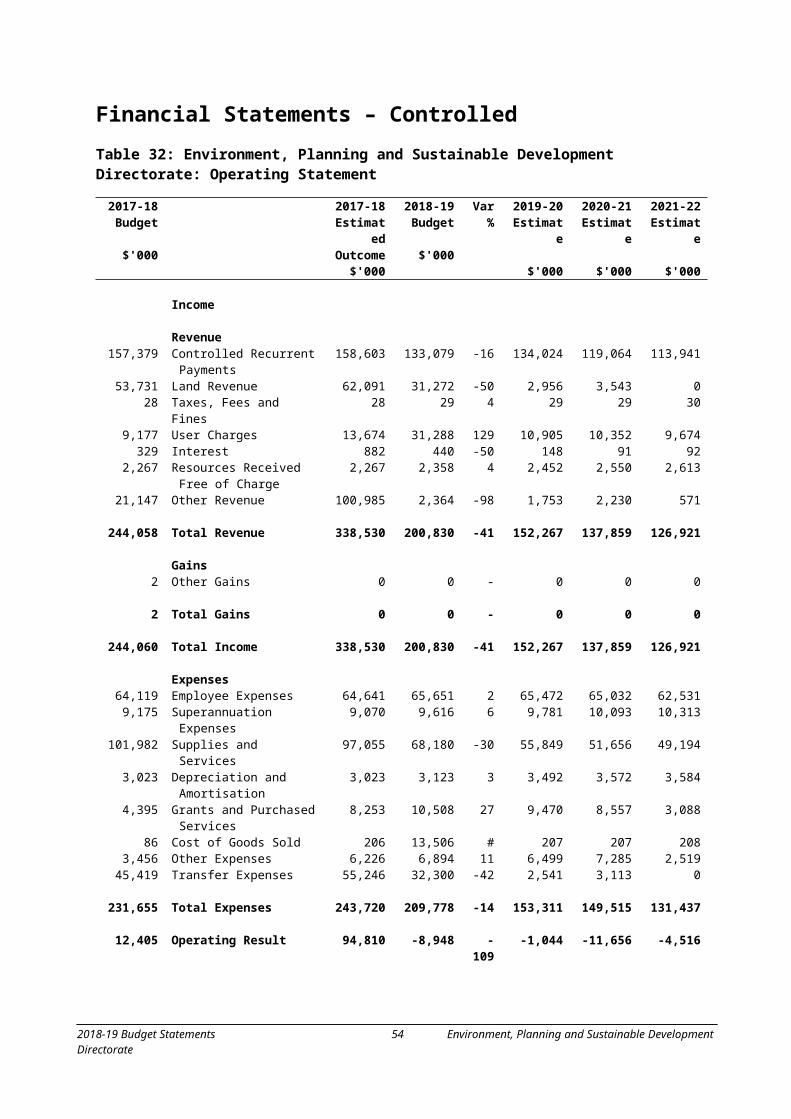
property, plant and equipment:
- the decrease of $14.171 million in the 2017-18 estimated outcome from the original budget is mainly due to the revaluation of land as a result of a change in the 10-year Government bond rate.
current and non-current payables:
- the decrease of $21.606 million in the 2017-18 estimated outcome from the original budget is mainly due to the timing of payments back to Government for land revenue.
- the increase of $5.602 million in the 2018-19 Budget from the 2017-18 estimated outcome is mainly due to the timing of payments back to Government for land revenue.
Statement of Changes in Equity and Cash Flow Statement
Variations in the Statement are explained in the notes above.
2018-19 Budget Statements 54 Environment, Planning and Sustainable Development Directorate

Table 40: Output Class 1: Planning Operating Statement
2017-18 Budget
$'000
2017-18 Estimated Outcome
$'000
2018-19 Budget
$'000
Var%
2019-20 Estimate
$'000
2020-21 Estimate
$'000
2021-22 Estimate
$'000
Revenue27,831 Controlled Recurrent
Payments25,306 27,319 8 27,013 24,812 25,441
2,501 User Charges 2,703 2,704 .. 2,797 2,916 3,0281,270 Resources Received Free of
Charge1,220 1,266 4 1,317 1,371 1,405
10 Other Revenue 198 70 -65 70 70 10
31,612 Total Revenue 29,427 31,359 7 31,197 29,169 29,884
Expenses 17,681 Employee Expenses 16,308 17,777 9 18,075 17,180 17,662
2,732 Superannuation Expenses 2,670 2,875 8 2,928 2,936 3,19813,467 Supplies and Services 9,931 11,137 12 10,360 9,416 9,227
447 Depreciation and Amortisation
110 151 37 538 544 552
50 Other Expenses 663 368 -44 330 341 353
34,377 Total Expenses 29,682 32,308 9 32,231 30,417 30,992
-2,765 Operating Result -255 -949 -272 -1,034 -1,248 -1,108
2018-19 Budget Statements 55 Environment, Planning and Sustainable Development Directorate
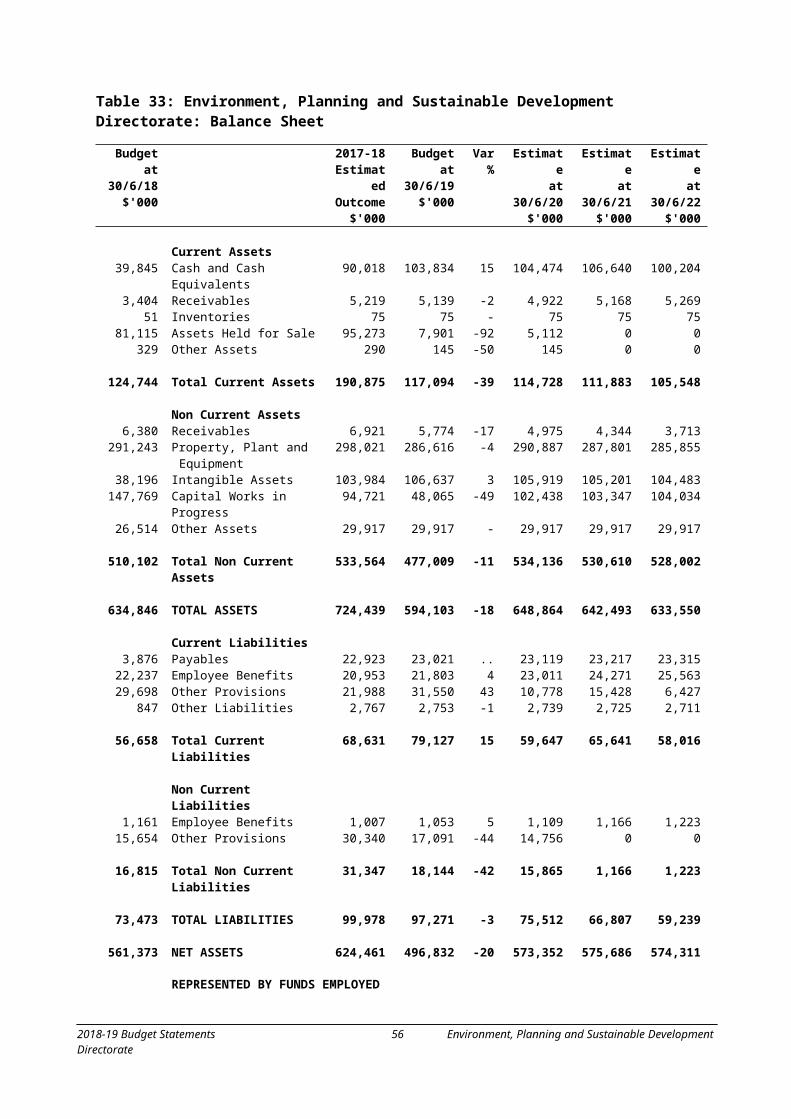
Table 41: Output Class 2: Environment Operating Statement
2017-18 Budget1
$'000
2017-18 Estimated Outcome
$'000
2018-19 Budget
$'000
Var%
2019-20 Estimate
$'000
2020-21 Estimate
$'000
2021-22 Estimate
$'000
Revenue58,232 Controlled Recurrent
Payments47,276 52,562 11 52,266 53,255 54,874
28 Taxes, Fees and Fines 28 29 4 29 29 306,676 User Charges 6,338 6,634 5 6,708 6,536 6,646
329 Interest 882 440 -50 148 91 92997 Resources Received Free of
Charge449 467 4 485 503 516
21,137 Other Revenue 1,577 364 -77 36 513 561
87,399 Total Revenue 56,550 60,496 7 59,672 60,927 62,719
Expenses 31,556 Employee Expenses 26,258 26,887 2 27,486 27,894 27,842
4,734 Superannuation Expenses 4,023 4,182 4 4,375 4,596 5,03934,350 Supplies and Services 24,938 28,227 13 27,349 28,005 28,570
2,540 Depreciation and Amortisation
2,788 2,844 2 2,826 2,905 2,962
1,963 Grants and Purchased Services
1,039 393 -62 211 217 223
86 Cost of Goods Sold 206 206 - 207 207 2081,692 Other Expenses 556 691 24 590 554 571
76,921 Total Expenses 59,808 63,430 6 63,044 64,378 65,415
10,478 Operating Result -3,258 -2,934 10 -3,372 -3,451 -2,696
Note(s):1. The 2017-18 Budget included Climate Change and Sustainability. From the 2017-18 Estimated Outcome it is shown in
Output Class 3: Climate Change and Sustainability.
2018-19 Budget Statements 56 Environment, Planning and Sustainable Development Directorate

Table 42: Output Class 3: Climate Change and Sustainability Operating Statement
2017-18 Budget1
$'000
2017-18 Estimated Outcome
$'000
2018-19 Budget
$'000
Var%
2019-20 Estimate
$'000
2020-21 Estimate
$'000
2021-22 Estimate
$'000
Revenue0 Controlled Recurrent
Payments11,354 12,563 11 13,804 13,547 14,673
0 User Charges 4,633 3,950 -15 1,400 900 00 Resources Received Free of
Charge598 625 5 650 676 692
0 Other Revenue 99,210 1,930 -98 1,647 1,647 0
0 Total Revenue 115,795 19,068 -84 17,501 16,770 15,365
Expenses 0 Employee Expenses 7,361 8,182 11 7,536 7,637 7,0410 Superannuation Expenses 905 991 10 923 954 1,0030 Supplies and Services 11,641 10,855 -7 8,499 7,143 5,4210 Depreciation and
Amortisation37 38 3 38 39 42
0 Grants and Purchased Services
4,041 6,909 71 6,019 5,878 400
0 Other Expenses 1,427 1,479 4 1,482 1,528 1,572
0 Total Expenses 25,412 28,454 12 24,497 23,179 15,479
0 Operating Result 90,383 -9,386 -110 -6,996 -6,409 -114
Note(s):1. This is a new Output Class. The 2017-18 Budget for Climate Change and Sustainability was included in Output Class 2:
Environment.
2018-19 Budget Statements 57 Environment, Planning and Sustainable Development Directorate

Table 43: Output Class 4: Land Strategy and Urban Renewal Operating Statement
2017-18 Budget1
$'000
2017-18 Estimated Outcome
$'000
2018-19 Budget
$'000
Var%
2019-20 Estimate
$'000
2020-21 Estimate
$'000
2021-22 Estimate
$'000
Revenue56,945 Controlled Recurrent
Payments18,052 21,606 20 19,439 18,748 18,953
56,945 Total Revenue 18,052 21,606 20 19,439 18,748 18,953
Expenses 8,509 Employee Expenses 9,059 9,297 3 9,554 9,791 9,9861,076 Superannuation Expenses 896 927 3 964 1,021 1,073
45,300 Supplies and Services 5,488 8,716 59 6,251 6,095 5,9760 Depreciation and
Amortisation27 28 4 28 28 28
2,432 Grants and Purchased Services
3,173 3,206 1 3,240 2,462 2,465
39 Other Expenses 21 21 - 22 22 23
57,356 Total Expenses 18,664 22,195 19 20,059 19,419 19,551
-411 Operating Result -612 -589 4 -620 -671 -598
Note(s):1. The 2017-18 Budget included the Public Housing Renewal Taskforce. From the 2017-18 Estimated Outcome it is
shown in Output Class 6: Public Housing Renewal Taskforce.
2018-19 Budget Statements 58 Environment, Planning and Sustainable Development Directorate

Table 44: Output Class 5: Loose Fill Asbestos Insulation Eradication Operating Statement
2017-18 Budget
$'000
2017-18 Estimated Outcome
$'000
2018-19 Budget
$'000
Var%
2019-20 Estimate
$'000
2020-21 Estimate
$'000
2021-22 Estimate
$'000
Revenue14,371 Controlled Recurrent
Payments14,935 10,200 -32 18,855 8,702 0
53,731 Land Revenue 62,091 31,272 -50 2,956 3,543 0
68,102 Total Revenue 77,026 41,472 -46 21,811 12,245 0
Gains2 Other Gains 0 0 - 0 0 0
2 Total Gains 0 0 - 0 0 0
68,104 Total Income 77,026 41,472 -46 21,811 12,245 0
Expenses 6,373 Employee Expenses 4,493 2,453 -45 2,492 2,530 0
633 Superannuation Expenses 433 506 17 491 586 08,865 Supplies and Services 4,708 1,550 -67 1,181 997 0
36 Depreciation and Amortisation
54 55 2 55 56 0
1,675 Other Expenses 3,504 4,280 22 4,020 4,840 045,419 Transfer Expenses 55,246 27,600 -50 2,541 3,113 0
63,001 Total Expenses 68,438 36,444 -47 10,780 12,122 0
5,103 Operating Result 8,588 5,028 -41 11,031 123 0
2018-19 Budget Statements 59 Environment, Planning and Sustainable Development Directorate

Table 45: Output Class 6: Public Housing Renewal Taskforce Operating Statement
2017-18 Budget1
$'000
2017-18 Estimated Outcome
$'000
2018-19 Budget
$'000
Var%
2019-20 Estimate
$'000
2020-21 Estimate
$'000
2021-22 Estimate
$'000
Revenue0 Controlled Recurrent
Payments41,680 8,829 -79 2,647 0 0
0 User Charges 0 18,000 # 0 0 0
0 Total Revenue 41,680 26,829 -36 2,647 0 0
Expenses 0 Employee Expenses 1,162 1,055 -9 329 0 00 Superannuation Expenses 143 135 -6 100 0 00 Supplies and Services 40,349 7,695 -81 2,209 0 00 Depreciation and
Amortisation7 7 - 7 0 0
0 Cost of Goods Sold 0 13,300 # 0 0 00 Other Expenses 55 55 - 55 0 00 Transfer Expenses 0 4,700 # 0 0 0
0 Total Expenses 41,716 26,947 -35 2,700 0 0
0 Operating Result -36 -118 -228 -53 0 0
Note(s):1. This is a new Output Class. The 2017-18 Budget for the Public Housing Renewal Taskforce was included in Output
Class 4: Land Strategy and Urban Renewal.
2018-19 Budget Statements 60 Environment, Planning and Sustainable Development Directorate

CITY RENEWAL AUTHORITY – STATEMENT OF INTENT
The City Renewal Authority is a Territory Authority established under the City Renewal Authority and Suburban Land Agency Act 2017.
The City Renewal Authority was established to play the crucial role of co-ordinating and implementing world-class urban renewal within the City Renewal Precinct. The establishment of the City Renewal Authority ensures that as Canberra grows, its city centre and immediate surrounds will further evolve into a thriving precinct with well-designed buildings and public spaces that improve activity, connectivity and sustainability.
This Statement of Intent for 2018-19 has been prepared in accordance with Section 61 of the Financial Management Act 1996.
The responsible Minister, Andrew Barr MLA, was consulted during the preparation of the Statement of Intent. The Statement of Intent, which focuses on the 2018-19 Budget year, has been developed in the context of a four year forward planning horizon to be incorporated, as far as practicable, into the City Renewal Authority strategic and business planning processes.
The City Renewal Authority 2018-19 Statement of Intent has been agreed between:
2018-19 Budget Statements 61 City Renewal Authority

CITY RENEWAL AUTHORITY
Purpose
The City Renewal Authority (the Authority) is established under Section 7 of the City Renewal Authority and Suburban Land Agency Act 2017 (the Act), and regulated by Parts 8 and 9 of the Financial Management Act 1996, Section 50 of the Planning and Development Act 2007 and the Public Sector Management Act 1994, to lead, manage, facilitate and undertake urban renewal projects in declared urban renewal precincts.
Working with the community, the Authority recognises that the places that define our city are for its citizens to live in, enjoy and to support a quality of life Canberrans expect and deserve. The objects of the Authority are set out in Section 8 of the Act and include:
the encouragement and promotion of a vibrant city through the delivery of design-led, people-focussed urban renewal;
the encouragement and promotion of social and environmental sustainability; and
operational effectiveness, delivering value for money using sound risk practices.
The functions of the Authority are set out in Section 9 of the Act and include:
carrying out urban renewal;
buying and selling leases of land on behalf of the Territory;
making arrangements for the public service or another entity to carry out development or works;
supporting public and private sector investment and participation in urban renewal;
managing orderly urban renewal, including holding, managing and selling land and other property;
supporting cooperation between the Authority, the community, and relevant entities;
supporting high quality design, planning and delivery of sustainable urban renewal;
meeting housing targets determined under Section 65 of the Act that relate to affordable, community and public housing;
supporting statutory greenhouse gas emissions targets and delivering environmentally sustainable development;
following and supporting whole of government strategies; and
any other function given to the Authority under the Act or another Territory law.
2018-19 Budget Statements 62 City Renewal Authority
The Authority must exercise its functions in a way that is consistent with its Statement of Operational Intent (as required by Section 9 of the Act).
With the approval of the Minister and the Treasurer, the Authority may exercise its functions through subsidiaries, joint ventures or trusts, or by holding shares in, or other securities of, corporations.
Nature and scope of activities
The Authority is charged with shaping the growth of the central parts of Canberra to make it a great place to live, explore and enjoy.
We are doing this by leading the transformation of the City Renewal Precinct, which spans Dickson, Northbourne Avenue, Haig Park, the city centre and West Basin.
In partnership with the community, private-sector and other government agencies, we will create a vibrant and vital city heart through the delivery of design-led, people focused urban renewal with a commitment to social and environmental sustainability.
We will work with the community, business and government to create new buildings and places within the precinct that are of exemplary design quality, excite interest and participation and stimulate new investment.
We will activate the precinct with events, interventions and attractions that bring people into the city and enliven the experience for residents, workers and visitors.
Our success will be measured by:
a revitalised city precinct that is economically prosperous, sustainable and liveable;
a diverse, active and engaged residential population that has a strong sense of community; and
the take-up of economic and business opportunities for new enterprises, start-ups and the creative sector.
Government’s Expectations
The Chief Minister wrote to the Chair of the Authority on 3 August 2017 outlining the Government’s vision for Canberra, and set out the Government’s requirements and priorities for the financial year 2017-18 via a Statement of Expectations. Subject to a further Statement of Expectations from the Government for the financial year 2018-19, the Authority will continue its work on the following initiatives:
the achievement of the Government’s ongoing commitment to good public-sector governance, and the effective management of significant land resources under the stewardship of the Authority;
2018-19 Budget Statements 63 City Renewal Authority

the implementation of urban renewal projects in the City Renewal Precinct, specifically:
- Haig Park - Working in consultation with Transport Canberra and City Services to finalise and implement the Haig Park Action Plan;
- West Basin - Planning and development to enable the commencement of stage two;
- implementing short-term renewal works to enliven the City Bus Interchange acknowledging longer term opportunities to integrate a revitalised transport interchange as part of catalytic renewal efforts in the city centre;
- proactive engagement with building owners in the City Renewal Precinct to ensure delivery of cohesive renewal and maintenance works - act as key liaison between ACT Government and owners of the iconic Sydney and Melbourne Buildings to encourage and support revitalisation of these significant heritage sites;
- engagement with Transport Canberra and City Services to ensure the continued delivery and upgrade of Northbourne Avenue verges to enable safe pedestrian movement and connection to services and facilities along the gateway to Canberra;
- continuation of planning and renewal works to establish Dickson as a key community and transport hub connecting the city to surrounding northern suburbs;
- developing and implementing clear place propositions and action plans for the city, Braddon and Dickson to guide place making interventions aimed at enlivening these important centres;
- complete the business case and place plan for the redevelopment of the Civic and Cultural precinct;
- continue to support the renewal effort and principles established by the City and Gateway Urban Design Framework;
- actively participate in negotiations with University of New South Wales regarding the establishment of a new university campus in the city; and
- completing the sale of Asset Recycling Initiative sites within the City Renewal Precinct.
actively contributing to the liveability and vitality of the city centre, through:
- planning and delivery of a diverse range of events, capital works upgrades, public realm and amenity improvements and stakeholder partnerships, including:
- testing and trialling public space through events and interventions;
- partnering with local event providers and businesses;
- testing regulatory barriers to events and innovation;
- leading the market by demonstrating event styles and locations; and
2018-19 Budget Statements 64 City Renewal Authority
- facilitating events and activities in public spaces, including laneways.
- effectively manage the City Centre Marketing and Improvements Levy (CCMIL) to activate and improve the city centre; and
- identifying opportunities for large scale festivals or seasonal events to enliven the City Centre and support the development of the Territory’s event sector.
establishing and maintaining positive working relationships, through:
- consulting and establishing productive working relationships with key stakeholders, including all levels of Government and other relevant bodies and organisations;
- engaging openly and meaningfully with the local community to inform both the design and delivery of works within declared precincts; and
- promoting cooperation, collaboration and coherent urban renewal with other key entities including the National Capital Authority (NCA) and the Suburban Land Agency (SLA).
establishing and maintaining positive relationships with other ACT Government Directorates and agencies.
2018-19 Priorities
In response to the Government’s Statement of Expectations, the Board of the City Renewal Authority presented to the Chief Minister the Authority’s Statement of Operational Intent for 2017-18. The Statement of Operational Intent represented the Authority’s aspirations in its first year of operation, and specifically responded to each element of the Government’s Statement of Expectations.
Continuing on from the Statement of Operational Intent for 2017-18, the Authority will in 2018-19 deliver the following project-related outcomes:
City Renewal Precinct Place Plan - deliver a Place Plan for the revitalisation of the City Renewal Precinct, which will be people-focussed with quality urban environment at its heart;
Haig Park – finalise the Haig Park Action Plan and implementation strategy;
West Basin Precinct – undertake a review of the West Basin project to reaffirm the planning principles and economic analysis that underpin the development of the precinct. Completion of stage two design, obtain NCA works approval and commence construction of stage two;
City Bus Interchange – begin intermediate improvements to the City Bus Interchange and its important functional interrelationship with the Light Rail Network, and plan for longer term opportunities to integrate a revitalised transport interchange as part of catalytic renewal efforts in the city centre;
2018-19 Budget Statements 65 City Renewal Authority

Sydney and Melbourne Buildings – develop a strategy and associated implementation plan for the revitalisation of the Sydney and Melbourne buildings and surrounding public realm;
Northbourne Avenue – set guidelines and standards that will ensure the landscape environment along Northbourne Avenue is befitting the primary gateway to the National Capital. Undertake stage one verge improvement works of Northbourne Avenue in the city and Dickson;
Dickson Group Centre – identify opportunities for future development and renewal in the Dickson Group Centre;
Braddon Village – identify and implement opportunities for place making and renewal in Braddon;
Civic and Cultural Centre – complete the business case and place plan for the redevelopment of the Civic and Cultural precinct;
City and Gateway Urban Design Framework – continue to support the renewal effort and principles established by the City and Gateway Urban Design Framework;
Asset Recycling Initiative – progress land sales within the City Renewal Precinct associated with the Asset Recycling Initiative;
City Activation – develop a comprehensive program of place making and activation for the public spaces of the City Renewal Precinct, and partner with local businesses and the creative sector to support the cultural capital of the city centre; and
Future Land Sales – prepare for future sales of land within the City Renewal Precinct in accordance with the ACT Government’s Indicative Land Release Program.
During 2018-19, the Authority will also commence implementation of a long-term strategic renewal program that sets the Authority’s future direction.
2018-19 Budget Statements 66 City Renewal Authority
Estimated Employment Level and Employment Profile
Table 1: Estimated Employment Level
2016-17Actual
Outcome
2017-18Budget
2017-18Estimated Outcome
2018-19Budget
Staffing (FTE) 01 20 262 253
Note(s):1. There were no employees prior to the City Renewal Authority being established on 1 July 2017 as a result of the City
Renewal Authority and Suburban Land Agency Act 2017. 2. The increase of six FTE from the 2017-18 Budget is due to:
a. the employment of additional personnel (five) associated with the implementation of initiative Building a better city – City Renewal Authority – Operational funding (funded in the 2017-18 Budget Review); and
b. the employment of additional personnel on a temporary basis (one) funded by initiative Building a better city – City Renewal Authority – Initial works package.
3. The FTE decrease of one from the 2017-18 estimated outcome is due to the exclusion from the Budget of the additional temporary personnel funded from initiative Building a better city – City Renewal Authority – Initial works package.
Table 2: 2018-19 Employment Profile
Classification Male Female TotalExecutive 3 0 3INFRMS3 1 1 2INFR4/5 1 3 4SOGA/B 3 2 5SOGC 2 2 4ASO6 1 1 2ASO5 1 3 4ASO4 0 1 1Total 12 13 25
2018-19 Budget Statements 67 City Renewal Authority

Key performance indicators for 2018-19 to 2021-2022
Financial Measures
Table 3: Key performance indicators
2018-19 2019-20 2020-21 2021-22
Land Sales Revenue ($ million) 0.000 14.130 32.710 32.710Gross Profit Margin on Land Sales (%)1 0.00% 40.39% 39.75% 39.75%Appropriated Capital Works Expenditure (million)
18.118
22.508 5.888 0.000
Gross Profit Margin = (lease sales - cost of goods sold including duty) / lease salesNote(s):1. The profit margins of the City Renewal Authority are used for internal purposes to provide comparatives across
projects and time periods. These margins are not comparable with private industry and should be considered in context with the following:
a. In general, the Government enters the land development process at an earlier stage than private developers as it has responsibility for planning activities which can impact on zoning and lease conditions on the land. The uplift in the value of land attributable to these activities is recognised by the City Renewal Authority and forms part of the Authority’s return to Government.
b. The Government invests in significant infrastructure within and around City Renewal Authority development projects however these costs are often incurred by other Government agencies and therefore do not impact on the Authority’s profit margins.
c. The City Renewal Authority relies on independent market valuations to inform land sales prices.
2018-19 Budget Statements 68 City Renewal Authority

Non-Financial Measures
The Authority’s non-financial performance will be assessed against the Governments’ Statement of Expectations, including:
projects implemented city centre vitality effective governance risk management
The indicators of success for each measure are described in Table 4 below.
Table 4: Key performance indicators (non-financial)
Projects IndicatorTarget2018-19
City Renewal Precinct Place Plan Plan complete with budget proposals. Quarter Three
Haig Park Action Plan complete and implementation underway. Quarter Four
West Basin Precinct West Basin review complete. Quarter Three
West Basin Precinct Commence construction of stage two waterfront. Quarter Four
Sydney and Melbourne Buildings Sydney and Melbourne Building Precinct renewal strategy and associated implementation plan. Quarter Four
Northbourne Avenue Master Plan complete and renewal works underway. Quarter Three
Dickson Group Centre Place Plan complete and place activation renewal underway. Quarter Four
Braddon Village Place Plan complete and place activation renewal underway. Quarter Four
Civic and Cultural Centre Business Plan and Place Plan underway. Quarter Four
City and Gateway Urban Design Framework
Support the implementation of the City and Gateway Urban Design Framework. Ongoing
Asset Recycling Initiative Asset sales complete. Quarter Four
City Activation Implementation of Place Activation Program. Ongoing
City Centre Marketing and Improvements Levy (CCMIL) Implementation of CCMIL place making initiatives. Ongoing
Effective Governance Indicator Target
2018-19 Budget Statements 69 City Renewal Authority
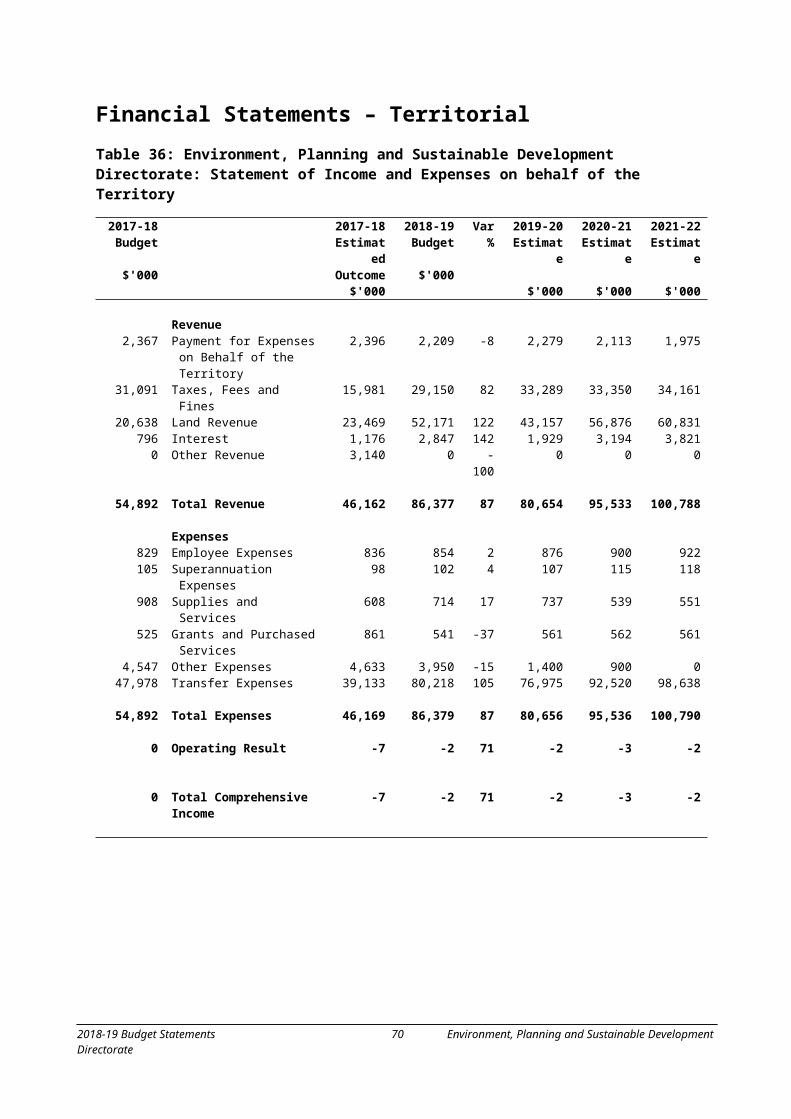
2018-19
Authority policies and procedures
The Board has no breaches of its statutory and fiduciary obligations, however (recognising that breaches may occur) any breaches not within the ACT Government tolerances are referred to either the Police or other appropriate authorities.
Up to 30 June 2019
The Board and staff have no breaches of ACT Government administration and governance requirements, however (recognising that breaches may occur) any breaches not within the ACT Government tolerances are referred to appropriate investigation authorities.
Risk Management IndicatorTarget2018-19
Internal and external audit of financial management and business systems.
Unqualified audit reports. Up to 30 June 2019
Service Agreements
All actions or inactions relating to the City Renewal Authority Service Agreements with ACT Government entities are within the tolerances specified in the relevant Agreement, or otherwise within ACT Government tolerances.
Up to 30 June 2019
Risk Framework and Register Framework and Register monitored and updated by the Audit and Risk Committee.
Up to 30 June 2019
Workplace Health and Safety (WHS)
No breaches of WHS-related legislated or policy requirements.
Up to 30 June 2019
2018-19 Budget Statements 70 City Renewal Authority

Assessment of non-financial performance against 2017-18 objectives
The Authority’s achievement against its non-financial objectives set for 2017-18 are in Table 5 below.
Table 5: Assessment of non-financial performance against 2017-18 objectives
Projects Indicator Result for 2017-18
City Renewal Precinct Plan submitted to Government.
A City Renewal Precinct implementation program has been formulated and submitted for approval.
Haig Park Master Plan completed. The Master Plan has been completed.
West Basin Precinct Stage two commenced. Stage two design has commenced.
City Bus Interchange Extension plan implemented.
The Authority has engaged with Transport Canberra and City Services to support its implementation of the extension plan for the Interchange.
Sydney and Melbourne Buildings Revitalisation plan implemented.
Formulation of a revitalisation plan is underway. Construction of waste enclosures has commenced.
Northbourne Avenue Guidelines implemented.
The Authority has supported the Environment, Planning and Sustainable Development Directorate in the formulation and consultation of the City and Gateway Draft Urban Design Framework. The Authority has commissioned a landscape master plan.
Dickson Group Centre Revitalisation project agreed.Development of a Place Plan and implementation is underway in consultation with Dickson traders.
Asset Recycling Initiative (ARI) Land sales program met. Land sales have been undertaken in
accordance with the ARI program.
City Activation Program fully implemented.
The program has been partially implemented, and a three-year place activation strategy is being developed.
Integrated City Centre Revitalisation Program
Approved year one program fully implemented.
The year one program has been implemented.
2018-19 Budget Statements 71 City Renewal Authority

Projects (continued) Indicator Result for 2017-18
New Events New opportunities identified and supported by Events ACT.
New events have been implemented in the period and supported by Events ACT, including ‘Christmas in Glebe Park’, ‘Enlighten in the City’, and the ‘Winter Festival’.
Effective Governance Indicator Result for 2017-18
Authority policies and procedures
The Board has no breaches of its statutory and fiduciary obligations, however (recognising that breaches may occur) any breaches are either referred to the Police or other appropriate authorities, or are within ACT Government tolerances.
There have been no known breaches as at 17 May 2018.The Board and staff have no breaches
of ACT Government administration and governance requirements, however (recognising that breaches may occur) any breaches are either referred to the appropriate investigation authorities, or are within ACT Government tolerances.
Risk Management Indicator Result for 2017-18
Internal and external audit of financial management and business systems.
Unqualified audit reports.There have been no audits conducted in the period 1 July 2017 – 17 May 2018.
Service Agreements
All actions or inactions relating to the City Renewal Authority Service Agreements with ACT Government entities are within the tolerances specified in the relevant Agreement, or otherwise within ACT Government tolerances.
There have been no such issues as at 17 May 2018.
Risk Framework and Register
Framework and Register approved, implemented and monitored by the Audit and Risk Committee.
On track for completion by 30 June 2018.
Workplace Health and Safety (WHS)
No breaches of WHS-related legislated or policy requirements.
There have been no known breaches as at 17 May 2018.
2018-19 Budget Statements 72 City Renewal Authority

Changes to Appropriation
Table 6: Changes to appropriation – Controlled Recurrent Payments
2017-18 Estimated Outcome
$'000
2018-19 Budget
$'000
2019-20 Estimate
$'000
2020-21 Estimate
$'000
2021-22 Estimate
$'000
2017-18 Budget 4,758 4,334 4,406 553 553
2nd AppropriationBuilding a better city – City Renewal Authority – Operational
funding2,472 2,209 2,251 0 0
FMA Section 16B Rollovers from 2016-17Urban Renewal for Civic - Creating a vibrant city centre 22 0 0 0 0
2018-19 Budget Policy DecisionsMore jobs for our growing city - City Renewal Precinct
activation projects0 850 1,200 0 0
2018-19 Budget Technical AdjustmentsComcare Premium Reduction -4 0 0 0 0Revised Funding Profile – Building a better city – City Renewal
Authority – Initial works package-561 561 0 0 0
Revised Indexation Parameters 0 0 0 0 8Revised Superannuation Parameters 0 6 -1 67 72Revised Wage Parameters 0 53 124 0 0Transfer – Capital Injections to Controlled Recurrent Payments
- Building a better city - City Renewal Authority - Initial works package
800 0 0 0 0
2018-19 Budget 7,487 8,013 7,980 620 633
2018-19 Budget Statements 73 City Renewal Authority

Table 7: Changes to appropriation – Capital Injections
2017-18 Estimated Outcome
$'000
2018-19 Budget
$'000
2019-20 Estimate
$'000
2020-21 Estimate
$'000
2021-22 Estimate
$'000
2017-18 Budget 9,500 15,000 14,888 0 0
2nd AppropriationBuilding a better city – City Renewal Authority – City precinct improvements
2,750 4,200 550 0 0
FMA Section 16B Rollovers from 2016-17Building a better city – West Basin infrastructure 37 0 0 0 0Building a better city – West Basin Public Waterfront 372 0 0 0 0Urban Renewal Program – Civic and Braddon public realm
improvements-78 0 0 0 0
2018-19 Budget Policy DecisionsMore jobs for our growing city - City Renewal Precinct
activation projects0 2,750 1,458 0 0
2018-19 Budget Technical AdjustmentsRevised Wage Parameters 0 18 0 0 0Revised Funding Profile – Building a better city – City Renewal
Authority – Canberra's lakeside0 -11,500 5,612 5,888 0
Revised Funding Profile - Building a better city - City Renewal Authority - Canberra's lakeside (formerly Building a better city - City Renewal Authority - City to the Lake)
-6,500 6,500 0 0 0
Revised Funding Profile – Building a better city – City Renewal Authority – Initial works package
-950 950 0 0 0
Revised Funding Profile – Building a better city – New Civic pool
-200 200 0 0 0
Transfer – Building a better city – New Civic pool to CMTEDD -200 0 0 0 0Transfer – Building a better city – New Civic pool from EPSDD
(formerly City to the Lake – New Civic Pool)400 0 0 0 0
Transfer – Building a better city – West Basin infrastructure from EPSDD (formerly Urban Renewal Program – City to the Lake – West Basin infrastructure)
7,500 0 0 0 0
Transfer – Capital Injections to Controlled Recurrent Payments - Building a better city - City Renewal Authority - Initial works package
-800 0 0 0 0
Transfer – Urban Renewal Program – Civic and Braddon public realm improvements from EPSDD
1,050 0 0 0 0
2018-19 Budget 12,881 18,118 22,508 5,888 0
2018-19 Budget Statements 74 City Renewal Authority
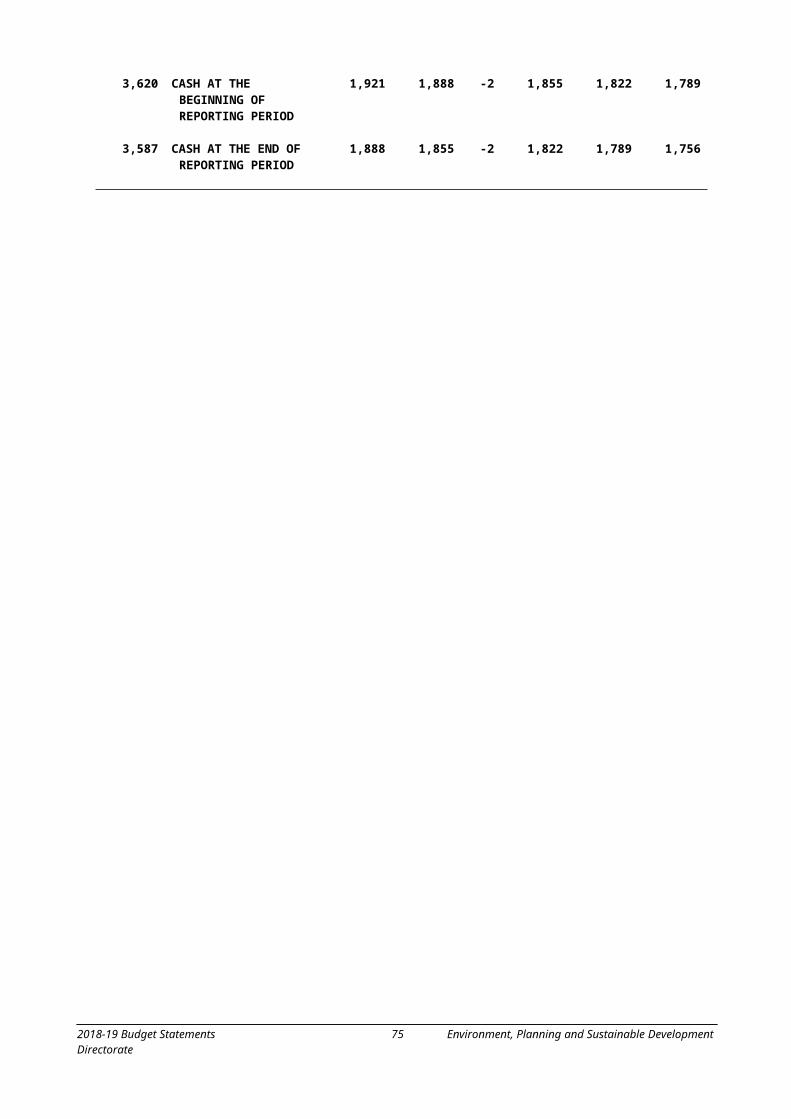
Monitoring and ReportingThe Authority will meet its reporting requirements as described below.
Monthly Reporting
To meet whole of government reporting requirements on a monthly basis, the Authority will ensure the timely availability of the financial statements to the Treasurer through the Chief Minister, Treasury and Economic Development Directorate (CMTEDD). The statements will be in the prescribed form and required detail, for the previous calendar month. These will be provided by the due dates set by Treasury.
Operating Statement;
Balance Sheet; and
Cash Flow Statement.
Quarterly Reporting
As required by Section 13 of the Act, the Authority will provide to the Minister after the end of a quarter a report which details any land acquisition by the Authority during the quarter.
Annual Reporting
To comply with the Financial Management Act 1996 and to enable whole of government reporting requirements to be met, the Authority will provide the following information to the Auditor-General and CMTEDD by the dates set by Treasury:
certified financial statements;
Statement of Performance;
management discussion and analysis;
a full and accurate set of audited financial records for the preceding financial year in the form requested; and
consolidation packs relating to the annual financial statements, draft and final.
As required by Section 14 of the Act, the Authority will prepare an annual report under the Annual Reports (Government Agencies) Act 2004, including:
any Statement of Expectations and Statement of Operational Intent in effect during the reporting year;
a report on the extent to which the Statement of Operational Intent in effect during the reporting year was met during the reporting year; and
if the Statement of Operational Intent was not met in whole or in part during the reporting year - give reasons why the Statement of Operational Intent was not met.
2018-19 Budget Statements 75 City Renewal Authority
Ministerial and Directorate Reporting
The Authority will provide timely, accurate and coordinated advice to Government, including the Minister, on significant issues in its core area of business, including (but not limited to):
matters for which the Government is likely to be accountable in the Legislative Assembly;
important operational or budgetary issues, including management of its responsibilities under the Work Health and Safety Act 2011;
the Authority’s achievement of set housing targets; and
matters related to its internal governance, including compliance with the Government’s framework for management of risk.
Financial arrangementsBudgeted financial statements for the 2018-19 Budget year, as well as forward estimates for the three financial years appear below. These general purpose financial statements, have been prepared in accordance with the ACT’s Model Financial Statements and include:
Operating Statement;
Balance Sheet;
Statement of Changes in Equity; and
Cash Flow Statement.
2018-19 Budget Statements 76 City Renewal Authority

Financial Statements
Table 8: City Renewal Authority: Operating Statement
2017-18 Budget
$'000
2017-18 Estimated Outcome
$'000
2018-19 Budget
$'000
Var%
2019-20 Estimate
$'000
2020-21 Estimate
$'000
2021-22 Estimate
$'000
Income
Revenue4,758 Controlled Recurrent Payments 7,487 8,013 7 7,980 620 633
432 Land Revenue 1,819 0 -100 14,130 32,710 32,7100 User Charges 63 63 - 63 63 630 Interest 184 222 21 118 60 44
1,764 Resources Received Free of Charge
1,926 1,792 -7 1,821 1,850 1,872
0 Other Revenue 1,964 1,967 .. 1,970 1,973 1,976
6,954 Total Revenue 13,443 12,057 -10 26,082 37,276 37,298
Expenses 3,038 Employee Expenses 3,886 3,996 3 4,138 4,221 4,320
389 Superannuation Expenses 460 488 6 509 523 5373,133 Supplies and Services 6,493 6,921 7 6,972 7,131 7,518
0 Depreciation and Amortisation 135 622 361 662 912 2,158182 Grants and Purchased Services 629 638 1 647 657 667250 Cost of Goods Sold 610 750 23 8,423 19,176 19,176
0 Borrowing Costs 0 0 - 0 681 6810 Other Expenses 162 0 -100 0 533 533
6,992 Total Expenses 12,375 13,415 8 21,351 33,834 35,590
-38 Operating Result from Ordinary Activities
1 1,068 -1,358 -227 4,731 3,442 1,708
-11 Income Tax Equivalent 320 0 -100 1,419 1,033 512
-27 Operating Result 748 -1,358 -282 3,312 2,409 1,196
-27 Total Comprehensive Income 748 -1,358 -282 3,312 2,409 1,196
Note(s):1. The negative operating result in 2018-19 Budget is predominantly attributable to:
a. $0.622 million depreciation expense - This is a non-cash expense related to capital projects transferred to the Authority in 2017-18; and
b. $0.750 million non-capital land development costs - Early design, feasibility and consulting costs which cannot be capitalised and are attributable to future city land releases. These costs are funded from $9.034 million cash balance transferred from the former Land Development Agency (LDA) at the establishment of the Authority.
2018-19 Budget Statements 77 City Renewal Authority

Table 9: City Renewal Authority: Balance Sheet
Budgetat
30/6/18 $'000
2017-18 Estimated Outcome
$'000
Budgetat
30/6/19 $'000
Var%
Estimateat
30/6/20 $'000
Estimateat
30/6/21 $'000
Estimateat
30/6/22 $'000
Current Assets7,834 Cash and Cash Equivalents 9,950 8,082 -19 3,848 4,058 299
11,715 Inventories 10,486 11,626 11 19,685 19,306 17,9279,500 Capital Works in Progress 4,000 22,100 453 43,408 45,096 16,208
29,049 Total Current Assets 24,436 41,808 71 66,941 68,460 34,434
Non Current Assets5,966 Inventories 5,966 5,966 - 5,966 5,966 5,966
0 Property, Plant and Equipment
1,004 19,373 # 19,911 26,699 61,929
0 Capital Works in Progress 18,991 0 -100 0 0 0
5,966 Total Non Current Assets 25,961 25,339 -2 25,877 32,665 67,895
35,015 TOTAL ASSETS 50,397 67,147 33 92,818 101,125 102,329
Current Liabilities603 Employee Benefits 636 626 -2 636 646 654188 Other Liabilities 159 159 - 0 0 0
791 Total Current Liabilities 795 785 -1 636 646 654
Non Current Liabilities26 Employee Benefits 26 26 - 26 26 26
0 Other Liabilities 748 748 - 2,702 5,111 6,307
26 Total Non Current Liabilities 774 774 - 2,728 5,137 6,333
817 TOTAL LIABILITIES 1,569 1,559 -1 3,364 5,783 6,987
34,198 NET ASSETS 48,828 65,588 34 89,454 95,342 95,342
REPRESENTED BY FUNDS EMPLOYED
34,198 Accumulated Funds 48,828 65,588 34 89,454 95,342 95,342
34,198 TOTAL FUNDS EMPLOYED 48,828 65,588 34 89,454 95,342 95,342
2018-19 Budget Statements 78 City Renewal Authority

Table 10: City Renewal Authority: Statement of Changes in Equity
Budgetat
30/6/18 $'000
2017-18 Estimated Outcome
$'000
Budgetat
30/6/19 $'000
Var%
Estimateat
30/6/20 $'000
Estimateat
30/6/21 $'000
Estimateat
30/6/22 $'000
Opening Equity
0 Opening Accumulated Funds 0 48,828 # 65,588 89,454 95,342
0 Balance at the Start of the Reporting Period
0 48,828 # 65,588 89,454 95,342
Comprehensive Income-27 Operating Result - Including
Economic Flows748 -1,358 -282 3,312 2,409 1,196
-27 Total Comprehensive Income
748 -1,358 -282 3,312 2,409 1,196
0 Total Movement in Reserves 0 0 - 0 0 0
Transactions Involving Owners Affecting Accumulated Funds9,500 Capital Injections 12,881 18,118 41 22,508 5,888 0
24,698 Inc/Dec in Net Assets due to Admin Restructure
35,947 0 -100 0 0 0
27 Dividend Approved -748 0 100 -1,954 -2,409 -1,196
34,225 Total Transactions Involving Owners Affecting Accumulated Funds
48,080 18,118 -62 20,554 3,479 -1,196
Closing Equity34,198 Closing Accumulated Funds 48,828 65,588 34 89,454 95,342 95,342
34,198 Balance at the end of the Reporting Period
48,828 65,588 34 89,454 95,342 95,342
2018-19 Budget Statements 79 City Renewal Authority

Table 11: City Renewal Authority: Cash Flow Statement
2017-18 Budget
$'000
2017-18 Estimated Outcome
$'000
2018-19 Budget
$'000
Var %
2019-20 Estimate
$'000
2020-21 Estimate
$'000
2021-22 Estimate
$'000
CASH FLOWS FROM OPERATING ACTIVITIESReceipts
4,758 Controlled Recurrent Payments
7,487 8,013 7 7,980 620 633
0 User Charges 63 63 - 63 63 630 Interest Received 184 222 21 118 60 44
432 Land Sales 1,819 0 -100 13,971 32,710 32,7100 Other 1,964 1,967 .. 1,970 1,973 1,976
5,190 Operating Receipts 11,517 10,265 -11 24,102 35,426 35,426
Payments3,038 Employee 3,855 4,004 4 4,128 4,211 4,312
389 Superannuation 458 490 7 509 523 5371,369 Supplies and Services 4,729 5,129 8 5,151 5,281 5,646
182 Grants and Purchased Services
629 638 1 647 657 667
0 Borrowing Costs 0 0 - 0 681 681-11 Income Tax Equivalent
Payments320 0 -100 1,418 1,034 513
1,479 Related to Cost of Goods Sold 610 1,890 210 16,483 18,796 17,7960 Other 0 0 - 0 533 533
6,446 Operating Payments 10,601 12,151 15 28,336 31,716 30,685
-1,256 NET CASH INFLOW/(OUTFLOW) FROM OPERATING ACTIVITIES
916 -1,886 -306 -4,234 3,710 4,741
CASH FLOWS FROM INVESTING ACTIVITIESReceipts
Payments9,500 Purchase of Property, Plant
and Equipment12,881 18,100 41 22,508 9,388 8,500
9,500 Investing Payments 12,881 18,100 41 22,508 9,388 8,500
-9,500 NET CASH INFLOW/(OUTFLOW) FROM INVESTING ACTIVITIES
-12,881 -18,100 -41 -22,508 -9,388 -8,500
2018-19 Budget Statements 80 City Renewal Authority

Table 11: City Renewal Authority: Cash Flow Statement (continued)
2017-18 Budget
$'000
2017-18 Estimated Outcome
$'000
2018-19 Budget
$'000
Var %
2019-20 Estimate
$'000
2020-21 Estimate
$'000
2021-22 Estimate
$'000
CASH FLOWS FROM FINANCING ACTIVITIESReceipts
9,500 Capital Injections 12,881 18,118 41 22,508 5,888 09,034 Receipts of Transferred Cash
Balances9,034 0 -100 0 0 0
18,534 Financing Receipts 21,915 18,118 -17 22,508 5,888 0
Payments-56 Payment of Dividend 0 0 - 0 0 0-56 Financing Payments 0 0 - 0 0 0
18,590 NET CASH INFLOW/(OUTFLOW) FROM FINANCING ACTIVITIES
21,915 18,118 -17 22,508 5,888 0
7,834 NET INCREASE/(DECREASE) IN CASH AND CASH EQUIVALENTS
9,950 -1,868 -119 -4,234 210 -3,759
0 CASH AT THE BEGINNING OF REPORTING PERIOD
0 9,950 # 8,082 3,848 4,058
7,834 CASH AT THE END OF REPORTING PERIOD
9,950 8,082 -19 3,848 4,058 299
2018-19 Budget Statements 81 City Renewal Authority

Notes to the Controlled Budget Statements
Significant variations are as follows:
Operating Statement
controlled recurrent payments:
- the increase of $2.729 million in the 2017-18 estimated outcome from the 2017-18 Budget is predominantly associated with the implementation of initiative Building a better city – City Renewal Authority – Operational funding which was funded in the 2017-18 Budget Review ($2.472 million).
land revenue:
- the increase of $1.387 million in the 2017-18 estimated outcome from the 2017-18 Budget is due to an increase in land sales revenue associated with air and subterranean rights sold for a city block during the year.
- the decrease of $1.819 million in the 2018-19 Budget from the 2017-18 estimated outcome is due to no forecast land sales in the 2018-19 year.
other revenue:
- the addition of $1.964 million in the 2017-18 estimated outcome from the 2017-18 Budget relates to the transfer of the CCMIL from EPSDD. The administration of the CCMIL has been transferred to the City Renewal Authority.
supplies and services:
- the increase of $3.360 million in the 2017-18 estimated outcome from the 2017-18 Budget is due primarily to the implementation of initiative Building a better city – City Renewal Authority – Operational funding which was funded in the 2017-18 Budget Review ($1.582 million) and expenditure associated with the CCMIL program ($1.964 million).
Balance Sheet
cash and cash equivalents:
- the increase of $2.116 million in the 2017-18 estimated outcome from the 2017-18 Budget is predominantly due to the increase in land sales revenue associated with the sale of air and subterranean rights on a city block.
- the decrease of $1.868 million in the 2018-19 Budget from the 2017-18 estimated outcome is associated with land development costs (early design, feasibility and consulting works) related to future city releases. These land development costs are funded through transferred cash balances ($9.034 million) from the former LDA.
2018-19 Budget Statements 82 City Renewal Authority

current and non-current inventories:
- the decrease of $1.229 million in the 2017-18 estimated outcome from the 2017-18 Budget is due to decreased land development costs anticipated to be incurred during the 2017-18 year.
- the increase of $1.140 million in the 2018-19 Budget from the 2017-18 estimated outcome is due to land development costs for future city releases expected to be incurred during the year.
current and non-current capital works in progress:
- the increase of $13.491 million in the 2017-18 estimated outcome from the 2017-18 Budget is largely due to the transfer of Capital Works in Progress balances ($10.110 million) to the City Renewal Authority from EPSDD. A further ($2.750 million) is associated with the implementation of initiative Building a better city – City Renewal Authority – City precinct improvements which was announced as part of the 2017-18 Budget Review.
property, plant and equipment:
- the increase of $1.004 million in the 2017-18 estimated outcome from the 2017-18 Budget is due to the transfer of fixed assets at written down value from the former LDA during the year.
- the increase of $18.369 million in the 2018-19 Budget from the 2017-18 estimated outcome is due to the capitalisation of non-current capital works in progress balances ($18.991 million) which is partially offset by accumulated depreciation ($0.622 million).
Statement of Changes in Equity and Cash Flow Statement
Variations in the Statement are explained in the notes above.
2018-19 Budget Statements 83 City Renewal Authority

SUBURBAN LAND AGENCY – STATEMENT OF INTENT
The Suburban Land Agency is a Territory Authority established under the City Renewal Authority and Suburban Land Agency Act 2017.
This Statement of Intent for 2018-19 has been prepared in accordance with Section 61 of the Financial Management Act 1996.
The responsible Minister, Ms Yvette Berry MLA was consulted during the preparation of the Statement of Intent.
The Statement of Intent, which focuses on the 2018-19 Budget year has been developed in the context of a four year forward planning horizon to be incorporated, as far as practicable, into the Suburban Land Agency’s strategic and business planning processes.
The Suburban Land Agency 2018-19 Statement of Intent has been agreed between:
2018-19 Budget Statements 84 Suburban Land Agency

SUBURBAN LAND AGENCY
PurposeThe Suburban Land Agency is a Territory Authority established under the City Renewal Authority and Suburban Land Agency Act 2017 to deliver the ACT Government’s desired suburban land development.
Our vision is to deliver:
‘Great places, where communities thrive’
The Suburban Land Agency’s objectives are to:
1. encourage and promote:
a. inclusive communities through the delivery of people-focussed neighbourhoods;
b. suburban development and urban renewal, other than in the City Renewal Precinct, that supports the following:
i. affordable living;
ii. a safe and healthy population;
iii. social inclusion;
iv. housing choice;
v. environmental sustainability;
c. growth and diversification of the Territory’s economy; and
2. operate effectively, in a way that delivers value for money, in accordance with sound risk management practices.
Nature and scope of activities
The Suburban Land Agency develops and releases government-owned land for residential, commercial, industrial and community purposes.
The Suburban Land Agency:
buys and sells leases of land on behalf of the Territory;
ensures a mixture of public and private housing in new suburbs;
increases the supply of affordable and community housing;
meets housing targets;
carries out development of land in a manner that is environmentally sustainable;
2018-19 Budget Statements 85 Suburban Land Agency
exercises its functions in a way that supports statutory greenhouse gas emissions targets and delivers environmentally sustainable development; and
follows and supports whole of government strategies.
The Suburban Land Agency works with other entities to encourage cohesive suburban development.
By acting in a trustworthy, responsible and professional way, the Suburban Land Agency will:
work efficiently and provide agreed returns to the Territory;
consider the long-term sustainability of the Territory in all key commercial decisions on greenfield land in the ACT;
encourage and support innovation to build a city for the future including transport, water supply, sustainable environments, connectivity and energy efficiency;
deliver the Government’s Indicative Land Release Program (further details of this can be found in Table 4); and
engage with the community in a clear, honest and professional way about the land development process and projects.
In balancing public sector and commercial priorities, the Suburban Land Agency will grow and maintain good relationships with the private sector and across the ACT Government.
Government’s Expectations
Correspondence updating the Minister’s expectations of the Suburban Land Agency was received on 19 April 2018. It reaffirmed the Government’s expectations as set out in the previous advice of 25 August 2017. Specific emphasis was included in the updated advice regarding better practice information management and governance, active participation in and contribution to land and housing planning, assisting others with the Suburban Land Agency’s experience and knowledge, and ensuring the Suburban Land Agency embodies the Government’s commitment to true gender equality.
ACT Government and Other Planning Strategies
The ACT Government in its Statement of Planning Intent 2015, sets out the key planning priorities for the ACT Government. These priorities remain unchanged. The statement aims to create a more compact and sustainable city that is inclusive, vibrant, connected, prosperous and environmentally responsible. It encourages quality design of public spaces to promote innovation and flexibility in the planning system and to effectively manage planning and design outcomes.
In its development of new estates, suburbs and communities, the Suburban Land Agency will provide support in recognising and responding to the community’s desire for:
compact and sustainable neighbourhoods;
collaboration between the public and private sectors;
2018-19 Budget Statements 86 Suburban Land Agency
housing choice and affordability;
improved quality of urban design in public spaces; and
showcasing sustainability and quality design in new developments and precincts.
The Suburban Land Agency complies with ACT Government and Commonwealth legislation, codes and policies in its operations and land development activities. Relevant planning strategies and codes are incorporated into all residential estates. These strategies, codes and other items include, but are not limited to, the:
Estate Development Code;
Crime Prevention through Environmental Design General Code;
Waterways: Water Sensitive Urban Design General Code;
Structure Plans, Concept Plans or Precinct Codes for the identified area;
Environmental Protection Act 1997;
Nature Conservation Strategy 2013-2023;
Heritage Act 2004 and Environment Protection and Biodiversity Conservation Act 1999 (Cwth);
Climate Change and Greenhouse Gas Reduction Act 2010;
ACT Climate Change Adaptation Strategy 2016;
Design Standards for Urban Infrastructure;
Active Travel Framework; and
Affordable housing targets set in accordance with the City Renewal Authority and Suburban Land Agency Act 2017 and the Affordable Housing Action Plan.
Land Supply
The ACT Government updates and publishes its indicative land release program each year. The Suburban Land Agency was consulted in the development of the 2018-19 to 2021-22 Indicative Land Release Program (Indicative Land Release Program).
The Indicative Land Release Program includes residential, commercial, industrial and community releases. It aims to meet market needs by providing a range of land choices that allow for a variety of housing types, and community and mixed use developments. The Indicative Land Release Program represents an important part of the ACT Government’s economic, social and environmental strategic planning framework.
The Indicative Land Release Program gives guidance on how the ACT Government intends to release land. This information can be useful for a range of people and organisations such as property developers, builders, homeowners, investors, community organisations, and business and industry sectors.
2018-19 Budget Statements 87 Suburban Land Agency
The Suburban Land Agency is responsible for managing the release of land for residential, commercial, industrial and community purposes specified under the program through:
releasing serviced sites from its own greenfield estates, urban renewal and infill locations;
partnering with others in joint venture developments;
releasing large areas of raw land directly to the private sector (englobo releases); and
giving feedback to the Environment, Planning and Sustainable Development Directorate (the Directorate) about the delivery of the Indicative Land Release Program, including any suggested refinements.
Risks
The Suburban Land Agency maintains a risk register that identifies risks under the following categories:
Strategic – ACT and Commonwealth Government policy, priorities and strategies; external conditions, activities and environment; and meeting community and government expectations.
Operational – Management of financial and non-financial targets, business and financial systems and processes, work health and safety, organisational and workforce planning, projects and land development, and effective governance.
Fraud and Corruption – Management of information including compliant records management, procedures, procurement, resources and contracts.
The risk priorities of the Suburban Land Agency are:
Safety – ensuring that work health and safety risk is identified, managed and actively monitored.
Effectiveness – striving to deliver quality outcomes the first time.
Efficiency – delivering value for money to the ACT community.
2018-19 Budget Statements 88 Suburban Land Agency
Priorities and Strategies for 2018-19 to 2021-22
The Suburban Land Agency has the following strategic priorities to support achievement of its purpose, manage risks and deliver on ACT Government policies and priorities for 2018-19 to 2021-22:
Culture
1) A trusted organisation, delivering in partnership with Government, industry and the community.
2) Values driven behaviour.
3) Engaged and empowered staff.
4) Staff embrace and model respect, accountability, probity and transparency in their work.
5) Meet the Government’s expectations at a strategic and operational level.
Business Improvement
6) Good governance.
7) Effective risk management.
8) Excellent work health and safety frameworks.
9) Integrated systems, tools and processes that present a consistent source of information.
10) Financially responsible operations that deliver value for money.
Community Needs
11) Solutions developed and implemented for the diverse range of community needs.
12) A mix of block sizes and locations for construction within our developments.
13) Placemaking and design excellence.
14) Developments that provide the community with good connections to employment hubs, transport, services and infrastructure.
Affordable Living
15) Affordable housing in well served areas.
16) Developments with low running and maintenance costs.
17) Suitable land supply.
Climate Adaptation
18) Biodiversity protected and enhanced in our developments.
19) Climate responsive design including water and energy sensitive communities.
20) Infrastructure that can be maintained within Government expectations and resources.
2018-19 Budget Statements 89 Suburban Land Agency

The Suburban Land Agency will initiate the following major activities to support achievement of its priorities for 2018-19 to 2021-22:
Culture
1) Strengthen a positive culture in the Suburban Land Agency through education, better communication and actively responding to concerns.
2) Ensure awareness within the Suburban Land Agency of the 2018 Staff Survey outcomes and action plan, and undertake a staff satisfaction survey by 2019.
3) Improve and implement risk and work health and safety frameworks.
4) Promote diversity within the Suburban Land Agency work place, which may include partnering with local universities and reviewing employment advertising strategies.
5) Finalise a Strategic Human Resources Plan for the Suburban Land Agency.
Business Improvement
6) Scope and implement a business improvement program with a focus on processes, systems and data.
7) Work with other areas of the ACT Government to improve whole of life urban infrastructure outcomes within the Suburban Land Agency’s estates and developments.
8) Collaborate and co-operate with other ACT and Commonwealth Government agencies to deliver and advise the ACT Government on key government priorities including land development, future areas of growth, housing, renewal, affordable housing, property market conditions and effective community building.
Community Needs
9) Establish an innovation capability designed to enhance outcomes in community needs, affordable living, inclusive communities and climate adaptation.
10) Engage and build strategic relationships with local communities, industry associations, special interest groups and the broader ACT community to make sure any relevant interests are identified and considered in land release activities.
11) Deliver community building and development programs to encourage resident involvement and connection to their local community.
12) Share the learnings of the Mingle program within the ACT Government and with other interested parties.
Affordable Living
13) Review Government initiatives and industry exemplar projects to determine the best approach for industry partnering, particularly in affordable living and climate adaptation.
14) Identify opportunities within the Indicative Land Release Program and with industry partners to create affordable housing and climate adaptation demonstration projects.
2018-19 Budget Statements 90 Suburban Land Agency

15) Facilitate and support the delivery of affordable housing including community and public housing.
Climate Adaptation
16) New Suburban Land Agency greenfield estates (>500 single residential dwellings) exhibit and promote initiatives focused on biodiversity, energy efficiency and sustainability.
17) Bushfire Management Plans will be developed, where applicable, as part of the Estate Development Planning process.
Key land developments for 2018-19 to 2021-22 include:
a) Ginninderry – Deliver stage one construction work providing an innovative housing affordability model.
b) Molonglo – Complete releases of land in Coombs and Wright; finalise development of the first stage in Whitlam; and release further commercial land.
c) Gungahlin – Continue development and release of land in Taylor and Jacka; and release commercial land in the Gungahlin Town Centre.
d) Industrial – Continue land release to meet market demand; and subject to finalisation of the Eastern Broadacre planning project, increase availability of land in Fyshwick and Symonston.
e) Urban – Continue development and release of urban development and Asset Recycling Initiative (ARI) sites identified in the Indicative Land Release Program.
2018-19 Budget Statements 91 Suburban Land Agency

Estimated Employment Level and Employment Profile
Table 1: Estimated Employment Level
2017-18Budget
2017-18EstimatedOutcome
2018-19Budget
Staffing (FTE) 77 851 922
Note(s):1. The 2017-18 estimated outcome includes a revised FTE establishment profile. This reflects the final outcome of the
agreed transfer of functions from the former Land Development Agency to the Environment, Planning and Sustainable Development Directorate, Suburban Land Agency and City Renewal Authority.
2. The staffing profile is unchanged between the 2018-19 Budget and the 2017-18 estimated outcome. It is expected that current vacancies will be filled in the 2018-19 financial year.
Table 2: 2018-19 Employment Profile
Classification Male Female Vacant TotalExecutive 5 0 0 5IM/S 3 5 0 0 5IM/S 1 1 1 0 2IO5 2 0 2 4IO4 6 2 1 9IO3 7 1 1 9IO2 0 2 0 2SOGA 1 2 1 4SOGB 4 4 3 11SOGC 3 13 2 18ASO6 2 5 1 8ASO5 0 7 1 8ASO4 1 3 2 6ASO3 0 0 1 1
Total 37 40 151 92Notes: 1. As at the end of March 2018, there were 15 vacant positions against a revised establishment of 92 FTE.
2018-19 Budget Statements 92 Suburban Land Agency
Key performance indicators for 2018-19 to 2021-2022
Financial Measures
The following table outlines the Suburban Land Agency’s performance measures for profitability and financial stability.
Table 3: Financial Measures
2017-18 Estimated Outcome
2018-19 Budget
2019-20 Estimate
2020-21 Estimate
2021-22 Estimate
Land Revenue (million) 8 $445 $701 $520 $638 $601 Operating Result from Ordinary Activities (before Tax) (million) $280 $328 $234 $276 $195
Operating Result (after Tax) (million) 8 $196 $230 $164 $193 $137 Total Return to Government (million)1, 8 $376 $503 $267 $322 $246 Return on Assets (%)2 53.6 64.7 45.0 52.6 45.2 Gross Profit Margin on Land Sales (%)3, 6, 7 85.5 70.8 54.3 51.3 41.2 Net Profit Margin (%)4, 6, 7 42.0 32.2 30.8 29.7 22.3 Inventory Turnover (%)5 25.1 66.0 62.8 85.0 141.9 Net Cash Inflows from Operating Activities (million) $207 $279 $75 $272 $266
Notes: 1. Total return to Government = operating result before tax + payments for land acquisitions + payroll tax + stamp duty
equivalents + land holding costs equivalents + capital distributions.2. Return on assets = (operating result before tax + borrowing costs) / average total assets for period.3. Gross profit margin = (land sales - cost of goods sold including duty) / land sales.
4. Net profit margin = operating result / total revenue.
5. Inventory turnover = cost of goods sold / average inventory.The high inventory turnover in 2021-22 is due to high cost of goods sold because the majority of settlements in the year are greenfield sites which require more construction work.
6. The profit margins of the Suburban Land Agency are used for internal purposes to provide comparatives across projects and time periods. These margins are not comparable with private industry, noting that the Government, through the Suburban Land Agency, enters into the land development process at an earlier stage than a private developer. Additionally, the Government invests in infrastructure within and around its developments with the cost incurred by other Government agencies and therefore not reflected in the Suburban Land Agency’s profit margins.
7. The higher profit margins in 2017-18 and 2018-19 are affected by the factors listed below. If adjusted, the gross profit margin in 2017-18 and 2018-19 would be 61.5% and 46.2% and net profit margins 35.2% and 25.5% respectively.
a. The accounting treatment for ARI land - the cost of ARI land is expensed in the period of custodianship transfer to the Suburban Land Agency and therefore is not considered in the calculation of gross profits.
b. A reduction in the attribution of cost of goods sold recognised in prior years.8. Higher land revenue, operating result and total return to government in 2018-19 is primarily due to an extensive asset
recycling program and the inclusion of the revenues and expenses from the West Belconnen joint venture.
2018-19 Budget Statements 93 Suburban Land Agency

Non-Financial Measures
The Suburban Land Agency’s non-financial performance will be measured by assessing:
the level of achievement against the targets for the release of residential, commercial, industrial and community land specified in the Government’s Indicative Land Release Program for 2018-19 as set out in Table 4 below; and
performance against the targets in Table 5.
Table 4: Key Performance Indicators (non-financial) – Land Release
Indicative Land Release Program – Suburban Land Agency sites1
Release Type 2018-19 Target
a. Residential, comprising: 4,060 dwellings
Detached blocks (includes compact & townhouse blocks) 1,396 dwellings
Multi-Unit 769 dwellings
ARI Detached blocks 0 dwellings
ARI Multi-Unit 1,895 dwellings
b. Mixed Use 34,346 m2
c. Commercial 1,559 m2
d. Industrial 20,000 m2
e. Community 87,520 m2
Affordable Housing Land Release Type (included in above totals) 532 dwellings
Affordable Purchase and Land Rent 472 dwellings
Public Housing 60 dwellings
Community Housing 0 dwellings
Note:1. Full Indicative Land Release Program is available at https://www.planning.act.gov.au/topics/land-release.2. For 2018-19, two sites have been identified in Scullin and Giralang for the community housing target. Both of these
sites are currently ACT Property Group sites identified for disposal and therefore do not appear in the 2018-19 to 2021-22 Indicative Land Release Program for release via the Suburban Land Agency.
2018-19 Budget Statements 94 Suburban Land Agency

Table 5: Key Performance Indicators (non-financial) – Non-Land Release
Indicator Strategic Priority Area1
2018-19 Target
1 Deliver stakeholder engagement activities as per the Stakeholder Engagement Plan
C Three activities
2 Work Health and Safety (Active Certification) audits completed BI 35 Audits
3 Maintain gender equality in Suburban Land Agency staffing BI Gender balance within 10%
4 Recruitment panels with 50% or greater female membership BI 100%
5 Maintain cultural diversity in Suburban Land Agency staffing BI 20% of staff identify as culturally and
linguistically diverse
6 Internal Audits engaged BI 6
7 User sessions on Suburban Land Agency Webpage CN 100,000
8 Increase followers of all Mingle social media pages CN Increase by 10%
9 Resident satisfaction with communities with an active Mingle program and with more than 200 completed homes: The Mingle Community Development Program has
made me feel more connected in my suburb? The Mingle Community Development Program has
made me feel more informed in my suburb?
BI75% of surveyed
occupants rated Agreed or above
75% of surveyed occupants rated Agreed
or above
10 Improvement in staff engagement measured by the annual staff satisfaction surveyImprovement in lowest three indicators from previous year’s survey
C 80% participation
20% average improvement
11 Reduction in Freedom of Information requests from members of the public
CN 10% on 2017-18
12 Completion of major organisational activities/projects BI 90%Note:1. CN – Community Needs; C – Culture; BI – Business Improvement.
2018-19 Budget Statements 95 Suburban Land Agency

Assessment of performance against 2017-18 objectivesThe Suburban Land Agency was established by the ACT Government on 1 July 2017. Establishment included formation of a new Board and appointment of a new Chief Executive Officer. In its first year of operation the Board and the Suburban Land Agency have focussed on ensuring that the organisation makes sound decisions, based on good information and communicates these effectively. The Suburban Land Agency’s performance against the objectives detailed in the City Renewal Authority and Suburban Land Agency Act 2017 are as follows:
Encourage and promote inclusive communities through the delivery of people-focussed neighbourhoods
The Suburban Land Agency coordinated a community development program known as ‘Mingle’ in new greenfield suburbs with an active program of events. The Mingle program supported development of new communities through the provision of information, community activities and created opportunities for members of the community to meet and socialise. In the first nine months of 2017-18 the Mingle program coordinated 57 community activities. The program also provided information through social media and regular newsletters. In May 2018 the Mingle program was nominated as a finalist for the Project Innovation award at the Property Council of Australia awards.
The Suburban Land Agency built positive and productive relationships with community and stakeholders. Through the Mingle program new stakeholder relationships were formed with a number of organisations and interest groups including Neighbourhood Watch, Molonglo River Catchment Group, University of Canberra, Relationships Australia, Conservation Council and Actsmart Sustainability.
The Suburban Land Agency has worked closely with industry associations and regulatory bodies to consult, inform and educate the construction industry about land development and working safely.
Suburban development that supports: affordable living; safe and healthy population; social inclusion; and housing choice
The Suburban Land Agency released residential, mixed use and community sites providing a range of land choices for a variety of housing types consistent with the 2017-18 Indicative Land Release Program.
The Suburban Land Agency has delivered on the Government’s priority of supporting affordable and community housing. It has worked closely with the Environment, Planning and Sustainable Development Directorate on identifying and delivering sites suitable for affordable, community and social housing. This included releases in: Wright, Coombs, Taylor, Gungahlin Town Centre and Greenway.
The Suburban Land Agency worked closely with key industry associations to educate and refine the affordable housing requirements to assist in the implementation of the Housing Affordability Policy.
2018-19 Budget Statements 96 Suburban Land Agency

Urban renewal, other than in an urban renewal precinct, and contributing to growth and diversification of the Territory’s economy
The Suburban Land Agency has developed and released land in greenfields and urban renewal locations across Canberra. Major construction works are underway or completed to allow for future land release in Greenway, Taylor, Coombs, Throsby and Wright.
Residential land was released for sale in Greenway, Coombs, Wright, Red Hill, Gungahlin Town Centre, Throsby, Moncrieff, Lawson and Taylor.
Commercial, Mixed Use, Industrial or Community land was released for sale in Hume, Macgregor, Gungahlin Town Centre, Belconnen, Red Hill, Ngunnawal, Lawson and Wright. In addition, the Suburban Land Agency has facilitated land releases in accordance with the ARI in Reid, Braddon and Turner on behalf of the City Renewal Authority.
In 2017-18 the Suburban Land Agency was recognised as an industry leader in marketing through receipt of a commendation in the UDIA NSW Awards for Excellence for the ‘On Northbourne’ campaign.
Social and environmental sustainability
The Suburban Land Agency worked closely with the community, industry associations and government agencies to ensure that Estate Development Plans and construction activities met legislative and community expectations on social and environmental sustainability.
The West Belconnen joint venture (Ginninderry) has a strong focus on achieving positive sustainability outcomes. The development holds a six star rating through the Green Building Council and in 2017-18 its environmental focus was recognised through industry awards and invitations to speak at industry forums.
The Mingle program promoted environmental sustainability in new communities. A partnership agreement has been entered into with Actsmart, who provided a series of workshops and information programs to support new residents when building and moving into their new homes. Other activities included a tree planting day, ‘Clean up Australia’ Day and promotion of the Molonglo River Corridor Plan of Management and Mulligans Flat Reserve.
Operate effectively, in a way that delivers value for money, in accordance with sound risk management practices
To ensure continued delivery of corporate and governance services within the new arrangements, the Suburban Land Agency finalised Service Level Agreements with the Environment, Planning and Sustainable Development Directorate and the City Renewal Authority for the provision of services and support in identified areas. The Suburban Land Agency has worked closely with the Directorate on reviewing and developing relevant policies, procedures and frameworks to ensure compliance and build on previous governance improvements.
2018-19 Budget Statements 97 Suburban Land Agency

Monitoring and Reporting
The Suburban Land Agency will report against the requirements of this Statement of Intent as well as the Chief Minister’s Annual Report Directions in the Suburban Land Agency Annual Report.
The Financial Management Act 1996 allows the Treasurer to receive financial and other statements from the Suburban Land Agency for a specific period, this includes annual and monthly reporting.
Monthly Reporting
To meet whole of government reporting requirements on a monthly basis, the Suburban Land Agency will ensure the timely availability of the financial statements to the Treasurer through the Chief Minister, Treasury and Economic Development Directorate. The statements will be in the below prescribed form and required detail, for the previous calendar month. These will be provided by the due dates set by Treasury.
Statement of Comprehensive Income;
Balance Sheet; and
Cash Flow Statement.
Annual Reporting
To comply with the Financial Management Act 1996 and to enable whole of government reporting requirements to be met, the Suburban Land Agency will provide the following information to the Auditor-General and the Chief Minister, Treasury and Economic Development Directorate by the dates set by Treasury:
certified financial statements;
Statement of Performance;
Management Discussion and Analysis;
a full and accurate set of audited financial records for the preceding financial year in the form requested; and
consolidation packs relating to the annual financial statements, draft and final.
Ministerial and Directorate Reporting
The Suburban Land Agency will provide timely, accurate and coordinated advice to Government, including the Minister, on its activities, responsibilities, significant issues and decisions of the Suburban Land Agency Board. This is in accordance with the City Renewal Authority and Suburban Land Agency Act 2017 (‘the Act’).
The Suburban Land Agency will provide a quarterly report to the Minister detailing:
its activities, initiatives or business operations undertaken in support of the objects of the Suburban Land Agency contained in Section 38 of the Act;
2018-19 Budget Statements 98 Suburban Land Agency
assurance statements that any sale of leases of land was consistent with Section 38 of the Act; and
land acquisitions in accordance with Section 43 of the Act.
The Suburban Land Agency will also report annually to the Minister on its achievements and progress with regards to gender diversity and cultural improvement activities.
Financial arrangementsThe Suburban Land Agency is a self-funded statutory authority which, in normal circumstances, requires no supplementary funding from the ACT Government.
Joint Venture
The ACT Government holds 60% equity in the West Belconnen joint arrangement. The Suburban Land Agency acts as the agent on behalf of the ACT Government.
The West Belconnen joint arrangement was established on 23 November 2016 as a joint venture and was presented in the 2017-18 Budget statements using the equity method. This method involved reporting the share of net returns against a single line item in the Statement of Comprehensive Income. The net investment in the joint venture was shown in the Balance Sheet.
For the 2018-19 Budget statements, the West Belconnen joint arrangement is classified as a joint operation in accordance with the accounting standards. The assets, liabilities, revenues and expenses of the joint operation are now proportionately consolidated with the Suburban Land Agency in the Statement of Comprehensive Income and the Balance Sheet.
For consistency, all references outside of this section of the Statement of Intent will apply the original nomenclature of the West Belconnen joint venture.
2018-19 Budget Statements 99 Suburban Land Agency

Financial Statements
Table 6: Suburban Land Agency: Operating Statement
2017-18 Budget
$'000
2017-18 Estimated Outcome
$'000
2018-19 Budget
$'000
Var%
2019-20 Estimate
$'000
2020-21 Estimate
$'000
2021-22 Estimate
$'000
Income
Revenue575,832 Land Revenue 445,461 700,646 57 519,527 638,453 600,936
392 User Charges 1,135 979 -14 1,006 1,023 1,0406,413 Interest 5,905 2,745 -54 2,117 968 9409,120 Resources Received Free of
Charge13,367 8,626 -35 8,765 8,906 9,129
484 Other Revenue 262 274 5 274 274 274
592,241 Total Revenue 466,130 713,270 53 531,689 649,624 612,319
592,241 Total Income 466,130 713,270 53 531,689 649,624 612,319
Expenses 12,040 Employee Expenses 8,463 12,972 53 13,454 14,182 14,505
1,534 Superannuation Expenses 1,425 1,609 13 1,654 1,696 1,74037,586 Supplies and Services 28,232 40,355 43 43,589 44,809 44,167
0 Depreciation and Amortisation
113 143 27 132 90 63
974 Grants and Purchased Services
152 153 1 154 155 157
156,513 Cost of Goods Sold 63,803 202,345 217 236,026 309,030 351,102611 Borrowing Costs 991 2,662 169 1,744 2,328 2,955
40,657 Other Expenses 83,063 124,839 50 1,317 1,759 2,232
249,915 Total Expenses 186,242 385,078 107 298,070 374,049 416,921
4,222 Share of Operating Profit from Joint Venture Accounted for using the Equity Method
0 0 - 0 0 0
346,548 Operating Result from Ordinary Activities
279,888 328,192 17 233,619 275,575 195,398
103,964 Income Tax Equivalent 83,967 98,458 17 70,085 82,672 58,619
242,584 Operating Result 195,921 229,734 17 163,534 192,903 136,779
Other Comprehensive Income
Items that will not be Reclassified Subsequently to Profit or Loss-3,362 Increase/(Decrease) in Asset
Revaluation Surplus-3,362 0 100 0 0 0
-3,362 Total Other Comprehensive Income
-3,362 0 100 0 0 0
239,222 Total Comprehensive 192,559 229,734 19 163,534 192,903 136,779
2018-19 Budget Statements 100 Suburban Land Agency

2017-18 Budget
$'000
2017-18 Estimated Outcome
$'000
2018-19 Budget
$'000
Var%
2019-20 Estimate
$'000
2020-21 Estimate
$'000
2021-22 Estimate
$'000Income
2018-19 Budget Statements 101 Suburban Land Agency

Table 7: Suburban Land Agency: Balance Sheet
Budgetat
30/6/18 $'000
2017-18 Estimated Outcome
$'000
Budgetat
30/6/19 $'000
Var%
Estimateat
30/6/20 $'000
Estimateat
30/6/21 $'000
Estimateat
30/6/22 $'000
Current Assets199,859 Cash and Cash Equivalents 143,548 58,989 -59 37,766 121,292 97,550
10,879 Receivables 10,841 7,383 -32 12,578 9,031 9,031267,536 Inventories 218,163 300,939 38 357,652 261,911 137,135
478,274 Total Current Assets 372,552 367,311 -1 407,996 392,234 243,716
Non Current Assets19,685 Receivables 41,834 54,911 31 31,660 25,988 25,98847,193 Investment - Joint Venture 0 0 - 0 0 046,844 Inventories 48,837 45,254 -7 47,742 59,580 36,28249,625 Property, Plant and
Equipment46,475 45,980 -1 45,887 46,403 47,015
602 Intangible Assets 104 65 -38 26 0 0
163,949 Total Non Current Assets 137,250 146,210 7 125,315 131,971 109,285
642,223 TOTAL ASSETS 509,802 513,521 1 533,311 524,205 353,001
Current Liabilities41,350 Payables 107,809 60,016 -44 60,016 60,016 60,016
2,523 Employee Benefits 3,276 4,280 31 5,302 6,350 7,42483,561 Other Provisions 22,298 18,840 -16 24,035 20,489 20,48931,027 Income Tax Payable 53,503 59,507 11 30,013 24,419 4,360
287,518 Other Liabilities 101,075 147,389 46 194,002 192,988 40,761
445,979 Total Current Liabilities 287,961 290,032 1 313,368 304,262 133,050
Non Current Liabilities115 Employee Benefits 201 201 - 201 201 209
69,004 Other Provisions 68,906 70,554 2 67,008 67,008 67,00827,717 Deferred Tax Liability 37,291 37,291 - 37,291 37,291 37,291
0 Other Liabilities 12,927 12,927 - 12,927 12,927 12,927
96,836 Total Non Current Liabilities 119,325 120,973 1 117,427 117,427 117,435
542,815 TOTAL LIABILITIES 407,286 411,005 1 430,795 421,689 250,485
99,408 NET ASSETS 102,516 102,516 - 102,516 102,516 102,516
REPRESENTED BY FUNDS EMPLOYED
102,770 Accumulated Funds 105,878 105,878 - 105,878 105,878 105,878-3,362 Asset Revaluation Surplus -3,362 -3,362 - -3,362 -3,362 -3,362
99,408 TOTAL FUNDS EMPLOYED 102,516 102,516 - 102,516 102,516 102,516
2018-19 Budget Statements 102 Suburban Land Agency

Table 8: Suburban Land Agency: Statement of Changes in Equity
Budgetat
30/6/18 $'000
2017-18 Estimated Outcome
$'000
Budgetat
30/6/19 $'000
Var%
Estimateat
30/6/20 $'000
Estimateat
30/6/21 $'000
Estimateat
30/6/22 $'000
Opening Equity
0 Opening Accumulated Funds -3,362 105,878 # 105,878 105,878 105,8780 Opening Asset Revaluation
Reserve3,362 -3,362 -200 -3,362 -3,362 -3,362
0 Balance at the Start of the Reporting Period
0 102,516 # 102,516 102,516 102,516
Comprehensive Income242,584 Operating Result - Including
Economic Flows195,921 229,734 17 163,534 192,903 136,779
-3,362 Inc/Dec in Asset Revaluation Reserve Surpluses
-3,362 0 100 0 0 0
239,222 Total Comprehensive Income
192,559 229,734 19 163,534 192,903 136,779
0 Transfer to/from Accumulated Funds
3,362 0 -100 0 0 0
0 Movement in Asset Revaluation Reserve
-3,362 0 100 0 0 0
0 Total Movement in Reserves 0 0 - 0 0 0
Transactions Involving Owners Affecting Accumulated Funds
-39,549 Capital Distributions to Government
-74,968 -122,386 -63 0 0 0
142,319 Inc/Dec in Net Assets due to Admin Restructure
143,555 122,386 -15 0 0 0
-242,584 Dividend Approved -158,630 -229,734 -45 -163,534 -192,903 -136,779
-139,814 Total Transactions Involving Owners Affecting Accumulated Funds
-90,043 -229,734 -155 -163,534 -192,903 -136,779
Closing Equity102,770 Closing Accumulated Funds 105,878 105,878 - 105,878 105,878 105,878
-3,362 Closing Asset Revaluation Reserve
-3,362 -3,362 - -3,362 -3,362 -3,362
99,408 Balance at the end of the Reporting Period
102,516 102,516 - 102,516 102,516 102,516
2018-19 Budget Statements 103 Suburban Land Agency
Table 9: Suburban Land Agency: Cash Flow Statement
2017-18 Budget
$'000
2017-18 Estimated Outcome
$'000
2018-19 Budget
$'000
Var %
2019-20 Estimate
$'000
2020-21 Estimate
$'000
2021-22 Estimate
$'000
CASH FLOWS FROM OPERATING ACTIVITIESReceipts
431 User Charges 1,135 979 -14 1,006 1,023 1,0404,315 Interest Received 5,432 1,575 -71 940 940 940
585,949 Land Sales 444,029 696,646 57 515,527 634,453 596,93639,423 Other 17,650 23,938 36 27,131 17,431 18,672
630,118 Operating Receipts 468,246 723,138 54 544,604 653,847 617,588
Payments12,040 Employee 9,119 11,968 31 12,432 13,134 13,431
1,534 Superannuation 1,425 1,609 13 1,654 1,696 1,74029,096 Supplies and Services 19,741 31,729 61 34,824 35,903 35,038
974 Grants and Purchased Services
152 153 1 154 155 157
611 Borrowing Costs 991 2,662 169 1,744 2,328 2,955103,647 Income Tax Equivalent
Payments78,568 92,454 18 99,579 88,265 78,676
187,450 Related to Cost of Goods Sold 124,794 277,538 122 291,227 221,128 199,02239,456 Other 26,199 25,675 -2 28,174 18,916 20,630
374,808 Operating Payments 260,989 443,788 70 469,788 381,525 351,649
255,310 NET CASH INFLOW/(OUTFLOW) FROM OPERATING ACTIVITIES
207,257 279,350 35 74,816 272,322 265,939
CASH FLOWS FROM INVESTING ACTIVITIESReceipts
12,868 Proceeds from Sale/Maturity of Investments
396 0 -100 0 0 0
0 Repayment of Loan Principal 0 8,563 # 29,646 5,700 012,868 Investing Receipts 396 8,563 # 29,646 5,700 0
Payments0 Purchase of Property, Plant
and Equipment12 51 325 0 579 675
20,000 Purchase of Land and Intangibles
7,892 0 -100 0 0 0
34,212 Purchase of Investments 0 0 - 0 0 00 Loans Provided (Loans
Receivable)4,105 18,821 358 8,764 0 0
54,212 Investing Payments 12,009 18,872 57 8,764 579 675
-41,344 NET CASH INFLOW/(OUTFLOW) FROM INVESTING ACTIVITIES
-11,613 -10,309 11 20,882 5,121 -675
CASH FLOWS FROM FINANCING ACTIVITIESReceipts
203,210 Receipts of Transferred Cash Balances
182,654 0 -100 0 0 0
203,210 Financing Receipts 182,654 0 -100 0 0 0
2018-19 Budget Statements 104 Suburban Land Agency

Table 9: Suburban Land Agency: Cash Flow Statement (continued)
2017-18 Budget
$'000
2017-18 Estimated Outcome
$'000
2018-19 Budget
$'000
Var %
2019-20 Estimate
$'000
2020-21 Estimate
$'000
2021-22 Estimate
$'000
Payments66,252 Distributions to Government 66,680 170,179 155 0 0 0
151,065 Payment of Dividend 168,070 183,421 9 116,921 193,917 289,006217,317 Financing Payments 234,750 353,600 51 116,921 193,917 289,006
-14,107 NET CASH INFLOW/(OUTFLOW) FROM FINANCING ACTIVITIES
-52,096 -353,600 -579 -116,921 -193,917 -289,006
199,859 NET INCREASE/(DECREASE) IN CASH AND CASH EQUIVALENTS
143,548 -84,559 -159 -21,223 83,526 -23,742
0 CASH AT THE BEGINNING OF REPORTING PERIOD
0 143,548 # 58,989 37,766 121,292
199,859 CASH AT THE END OF REPORTING PERIOD
143,548 58,989 -59 37,766 121,292 97,550
2018-19 Budget Statements 105 Suburban Land Agency

Notes to the Controlled Budget Statements
Significant variances are as follows:
Statement of Comprehensive Income
land revenue:
- the decrease of $130.371 million in the 2017-18 estimated outcome from the 2017-18 Budget is predominantly due to the delayed settlement of the Red Hill Precinct ARI sale and delayed Taylor and Throsby settlements; and
- the increase of $255.185 million in the 2018-19 Budget from the 2017-18 estimated outcome is predominantly due to the increase in ARI site settlements including the delayed settlement of the Red Hill Precinct from 2017-18 and the inclusion of West Belconnen joint venture sales. The land revenue attributable to the West Belconnen joint venture was included in the Share of Operating Profit from Joint Venture rather than Land Revenue in the 2017-18 Budget. This revenue is now proportionally consolidated with the Suburban Land Agency’s revenue in the 2018-19 Budget.
interest: the decrease of $3.160 million in the 2018-19 Budget from the 2017-18 estimated outcome is predominantly due to lower cash balances.
resources received free of charge:
- the increase of $4.247 million in the 2017-18 estimated outcome from the 2017-18 Budget is predominantly due to higher level of asset transfers from other Government agencies free of charge; and
- the decrease of $4.741 million in the 2018-19 Budget from the 2017-18 estimated outcome is predominately due to asset transfers from other Government agencies free of charge returning to normal levels.
employee expenses:
- the decrease of $3.577 million in the 2017-18 estimated outcome from the 2017-18 Budget is due to the capitalisation of project salaries, vacancies throughout the year and a one-off reduction (approximately $1.1 million) in leave provisions as a result of staff transferred to other agencies upon discontinuation of the former Land Development Agency; and
- the increase of $4.509 million in the 2018-19 Budget from the 2017-18 estimated outcome is due to an increase in the budgeted FTE in the 2018-19 financial year, effects of the 2017-18 one-off reduction in leave provisions as a result of staff transferred to other agencies and lower capitalisation of salaries than 2017-18.
2018-19 Budget Statements 106 Suburban Land Agency

supplies and services:
- the decrease of $9.354 million in the 2017-18 estimated outcome from the 2017-18 Budget is predominantly due to revisions in the timing of project related expenses, such as professional fees, sales and marketing, based on the outcome of cost estimate revisions and the delay of some settlements in 2017-18; and
- the increase of $12.123 million in the 2018-19 Budget from the 2017-18 estimated outcome is predominantly due to increased project related expenses resulting from higher land settlements in 2018-19 including those delayed from 2017-18.
cost of goods sold:
- the decrease of $92.710 million in the 2017-18 estimated outcome from the 2017-18 Budget reflects the lower land sales and cost estimate revisions; and
- the increase of $138.542 million in the 2018-19 Budget from the 2017-18 estimated outcome is predominantly due to higher land settlements and the proportionate consolidation of the West Belconnen joint venture’s Cost of Goods Sold.
other expenses:
- the increase of $42.406 million in the 2017-18 estimated outcome from the 2017-18 Budget is predominantly due to the write down of ARI sites transferred from other ACT Government agencies which were delayed from 2016-17 and an increased write down of one transferred ARI site; and
- the increase of $41.776 million in the 2018-19 Budget from the 2017-18 estimated outcome is predominantly due to the increase in the transfer of ARI sites from other ACT Government agencies.
share of operating result from joint venture: the decrease of $4.222 million in the 2017-18 estimated outcome from the 2017-18 Budget is due to the proportionate consolidation of the West Belconnen joint venture financials into the Suburban Land Agency's accounts rather than being accounted for in equity.
income tax equivalent:
- the decrease of $19.997 million in the 2017-18 estimated outcome from the 2017-18 Budget is due to the lower operating result; and
- the increase of $14.491 million in the 2018-19 Budget from the 2017-18 estimated outcome is due to the higher operating result.
2018-19 Budget Statements 107 Suburban Land Agency
Balance Sheet
cash and cash equivalents:
- the decrease of $56.311 million in the 2017-18 estimated outcome from the 2017-18 Budget is predominantly due to the payment of the balance of 2016-17 dividends in the 2017-18 financial year which was not envisaged to be paid in the 2017-18 Budget; and
- the decrease of $84.559 million in the 2018-19 Budget from the 2017-18 estimated outcome is predominantly due to increases in capitalised development costs, capital distribution payments and dividend payments.
current and non current receivables:
- the increase of $22.111 million in the 2017-18 estimated outcome from the 2017-18 Budget is predominantly due to higher infrastructure asset receivables recognised and loan receivable from the joint venture, previously budgeted in Investment - Joint Venture; and
- the increase of $9.619 million in the 2018-19 Budget from the 2017-18 estimated outcome is predominantly due to the loan receivable from the joint venture.
current and non current inventory:
- the decrease of $47.380 million in the 2017-18 estimated outcome from the 2017-18 Budget is predominantly due to a decrease in capitalised development expenses; and
- the increase of $79.193 million in the 2018-19 Budget from the 2017-18 estimated outcome is predominantly due to construction occurring in Taylor, Whitlam, North Wright and Kingston Foreshore with settlements scheduled in future years.
non current investments: the decrease of $47.193 million in the 2017-18 estimated outcome from the 2017-18 Budget is due to the proportionate consolidation of the West Belconnen joint venture financials into the Suburban Land Agency's accounts rather than being treated as Investment - Joint Venture.
current payables:
- the increase of $66.459 million in the 2017-18 estimated outcome from the 2017-18 Budget is predominantly due to an increase in capital distributions payable and reclassification and inclusion of the provision for land payments to the Environment, Planning and Sustainable Development Directorate which was included in Other Liabilities in the 2017-18 Budget; and
- the decrease of $47.793 million in the 2018-19 Budget from the 2017-18 estimated outcome is due to the payment of capital distributions to the Territory upon settlement of ARI sites.
2018-19 Budget Statements 108 Suburban Land Agency
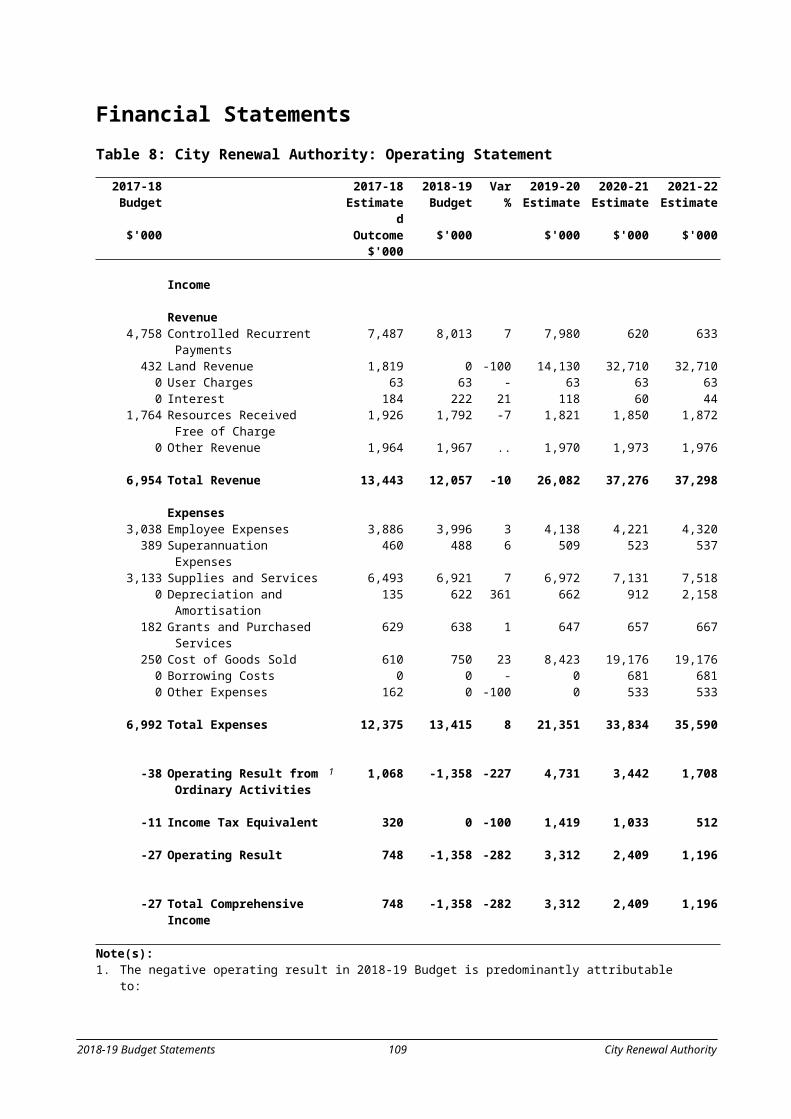
current and non current other provisions: the decrease of $61.361 million in the 2017-18 estimated outcome from the 2017-18 Budget is predominantly due to a decrease in the provision for project completion resulting from a review of project cost estimates.
income tax payable:
- the increase of $22.476 million in the 2017-18 estimated outcome from the 2017-18 Budget is predominantly due to a lower amount paid in income tax instalments during the year resulting in higher income tax remaining to be paid; and
- the increase of $6.004 million in the 2018-19 Budget from the 2017-18 estimated outcome is largely due a higher operating result.
deferred tax liability: the increase of $9.574 million in the 2017-18 estimated outcome from the 2017-18 Budget is due to an actual tax liability deferred at the end of the 2016-17 financial year which was unknown when the 2017-18 Budget was developed.
current and non current other liabilities:
- the decrease of $173.516 million in the 2017-18 estimated outcome from the 2017-18 Budget is predominantly due to the payment of the balance of 2016-17 dividends in the 2017-18 financial year and a lower operating result; and
- the increase of $46.314 million in the 2018-19 Budget from the 2017-18 estimated outcome is due to a higher operating result.
Statement of Cash Flow
Notes are not provided where significant variances are explained in the notes above.
interest received: the increase of $1.117 million in the 2017-18 estimated outcome from the 2017-18 Budget is predominantly due to interest received from purchasers on delayed settlements.
other receipts:
- the decrease of $21.773 million in the 2017-18 estimated outcome from the 2017-18 Budget is predominantly due to decreased GST collected on sales as a result of the delay of some settlements; and
- the increase of $6.288 million in the 2018-19 Budget from the 2017-18 estimated outcome is due to increased GST collected on sales as a result of higher land settlements.
other payments: the decrease of $13.257 million in the 2017-18 estimated outcome from the 2017-18 Budget is predominantly due to reduced GST payments as a result of lower taxable expenditure.
proceeds from sale/maturity of investments: the decrease of $12.472 million in the 2017-18 estimated outcome from the 2017-18 Budget is predominantly due to the
2018-19 Budget Statements 109 Suburban Land Agency

proportionate consolidation of the West Belconnen joint venture financials into the Suburban Land Agency's accounts rather than being accounted for in equity and recognising a net distribution from the joint venture.
repayment of loan principal: the increase of $8.563 million in the 2018-19 Budget from the 2017-18 estimated outcome is due to the repayment of the loan by the West Belconnen joint venture.
purchase of land and intangibles:
- the decrease of $12.108 million in the 2017-18 estimated outcome from the 2017-18 Budget is predominantly due to reduced rural land purchases than budgeted; and
- the decrease of $7.892 million in the 2018-19 Budget from the 2017-18 estimated outcome is due to decreased rural land purchases.
purchase of investments: the decrease of $34.212 million in the 2017-18 estimated outcome from the 2017-18 Budget is due to the proportionate consolidation of the West Belconnen joint venture financials into the Suburban Land Agency's accounts rather than being accounted for in equity.
loans provided (loans receivable): the increases of $4.105 million in the 2017-18 estimated outcome from the 2017-18 Budget and $14.716 million in the 2018-19 Budget from the 2017-18 estimated outcome are due to the loan provided to the West Belconnen joint venture.
receipts of transferred cash balances:
- the decrease of $20.556 million in the 2017-18 estimated outcome from the 2017-18 Budget is due to a lower level of cash transferred than budgeted from the former Land Development Agency; and
- the decrease of $182.654 million in the 2018-19 Budget from the 2017-18 estimated outcome is due to the one off transfer of cash from the former Land Development Agency when it ceased operating from 1 July 2017.
distributions to government: the increase of $103.499 million in the 2018-19 Budget from the 2017-18 estimated outcome is due to higher level of payments of capital distributions to the Territory on settlement of ARI sites.
payment of dividend:
- the increase of $17.005 million in the 2017-18 estimated outcome from the 2017-18 Budget is predominantly due to the higher payment of the 2016-17 balance of dividends owing; and
- the increase of $15.351 million in the 2018-19 Budget from the 2017-18 estimated outcome is due to an increase in the interim dividend payment.
Statement of Changes in Equity
Significant variances are explained in the notes above.
2018-19 Budget Statements 110 Suburban Land Agency


![Daft - Industry standard partnering agreement · INDUSTRY STANDARD PARTNERING AGREEMENT [ ] 2014 [CONTRACTOR] and [SUBCONTRACTOR] [Notes: 1. This Industry Standard Partnering Agreement,](https://static.documents.pub/doc/80x56/5bac0f7a09d3f24b638d0005/daft-industry-standard-partnering-agreement-industry-standard-partnering-agreement.jpg)


