Universidad Nacional de la Patagonia San Juan Bosco Comodoro Rivadavia – Argentina
Artículo de Investigación
Abstract
Recent advances in the conversion of carbohydrates from algae biomass into liquid biofuels, such as bioethanol, have demonstrated the potential of algae as a promising but relatively unexplored source of biofuels. Since the yield of conversion to ethanol is functional to the saccharification process, it is of vital importance to have an appropriate analytical method for the determination of reducing sugars obtained in said process. The aim of this work was to validate dinitrosalicylic acid method (DNS) for the determination of reducing sugars in seaweed Undaria pinnatifida by ultraviolet spectrophotometry. The validation plan included the evaluation of the following parameters: linearity, detection and quantification limits, accuracy, precision, selectivity and robustness. Linearity were verified in a range of 0.28 to 1.00 g/L (r = 0.993; R2 = 0.983; CVs of the response factors lower than 5 %). Detection and quantification limits were 0.004 and 0.012 g/L, respectively. In the accuracy study, over the range 0.30 to 0.90 g/L glucose concentration, high recoveries were reached (recovery average 97.741 %). Good results were obtained in the repeatability and precision studies (CV < 2 %). The selectivity study showed no interferences regarding the determination of reducing sugars when formaldehyde was used instead of algae extract. Method robustness was also verified, the analysis demonstrated that the method is robust to variations in the variables analyzed, except to the pH changes. This study demonstrated the DNS method was selective, linear, accurate and robust, although sensitive to the pH variations.
Keywords: validation; DNS method; reducing sugars; Undaria pinnatifida.
Resumen Recent advances in the conversion of carbohydrates from algae biomass into liquid biofuels, such as bioethanol, have demonstrated the potential of algae as a promising but relatively unexplored source of biofuels. Since the yield of conversion to ethanol is functional to the saccharification process, it is of vital importance to have an appropriate analytical method for the determination of reducing sugars obtained in said process. The aim of this work was to validate dinitrosalicylic acid method (DNS) for the determination of reducing sugars in seaweed Undaria pinnatifida by ultraviolet spectrophotometry. The validation plan included the evaluation of the following parameters: linearity, detection and quantification limits, accuracy, precision, selectivity and robustness. Linearity were verified in a range of 0.28 to 1.00 g/L (r = 0.993; R2 = 0.983; CVs of the response factors lower than 5%). Detection and quantification limits were 0.004 and 0.012 g/L, respectively. In the accuracy study, over the range 0.30 to 0.90 g/L glucose concentration, high recoveries were reached (recovery average 97.741%). Good results were obtained in the repeatability and precision studies (CV < 2%). The selectivity study showed no interferences regarding the determination of reducing sugars when formaldehyde was used instead of algae extract. Method robustness was also verified, the analysis demonstrated that the method is robust to variations in the variables analyzed, except to the pH changes.
1. Introduction As global energy demand continues rising and fossil
resources are depleted, biomass is emerging as one of the most important energy sources in the near future. The biomass provides a number of local environmental gains [1-3]. The thermochemical transformation of biomass generates gases, liquids and solid fuels. Among all the procedures used to transform biomass into useful product, liquefaction, pyrolysis and gasification are the most appropriate methods [4]. Biomass is a renewable energy resource providing transportation fuels such as biothanol or biodiesel [5, 6]. The benefits of biofuels over traditional fuels include greater energy security, reduced environmental impact, foreign exchange savings, and socioeconomic issues [7, 8].
Bioethanol has been considered an important substitute for replacing liquid fuels of fossil origin [9]; additionally, it finds application in diesel engines, as additive of the gasolines and in fuel cells. The technologies available for the production of first generation bioethanol, based on biomass used for food production, are accessible and widespread but the associated cost of raw materials is high: food price increase or shortages of them, reduction of agricultural biodiversity, erosion and soil contamination with fertilizers and pesticides [10-15]. The alternatives for the production of second generation bioethanol, lignocellulosic biomass, are not currently profitable options due of degrading the lignin associated with cellulose; despite they present advantages as the low cost of raw materials, minimal land use change, and avoidance of the competition between food and fuel. Given this situation, algae are presented as an alternative source of biomass for the production of third generation fuels.
They constitute a renewable and abundant resource, can produce carbohydrates, lipids and proteins in a short period of time, which can be transformed into biofuels; they lack lignocellulosic material, which facilitates the chemical and enzymatic pre-treatment to degrade these materials to fermentable sugars and their processing generates value-added co-products; have a higher rate of carbon dioxide fixation compared to terrestrial biomass, they may have greater potential for carbon dioxide remediation [16, 17].
Recent advances in the conversion of carbohydrates from algae biomass into liquid biofuels, such as bioethanol, have demonstrated the potential of algae as a promising but relatively unexplored source of biofuels [18]. The carbohydrate contents of seaweed are in a range of 30-70%. It depends on the species and culture conditions [19].
In the region of the Gulf San Jorge, Patagonia Argentina there are about 178 species of green, brown and red algae [20]; in particular, the kelp Undaria pinnatifida (Phaeophyceae) is an invasive brown seaweed, native to northeastern Asia, which was introduced in Argentina through international ships in the Golfo Nuevo region, and from there has been progressively extended along the Patagonian coast [21, 22] negatively impacting the biodiversity of marine
species. Through a manipulative experiment involving Undaria removal in 2001, was found that its presence is associated with a dramatic decrease in species richness and diversity of native seaweeds in Golfo Nuevo. Future prospects are worrisome, as, in addition to the negative impact from a biodiversity viewpoint, native commercial macroalgae and invertebrates might also be posh [23].
Carbohydrates in brown seaweed consist of alginate, laminaran, fucoidan and mannitol [24]. Carbohydrate content in U. pinnatifida is 52% carbohydrate including crude fiber as cellulose on dry solid basis [19].
The critical step in the conversion of this carbohydrates to ethanol involves the degradation of the polysaccharides to fermentable sugars in a process called saccharification. The goals of the research have focused on developing pre-treatments of the biomass in order to make this saccharification easier and thus achieve a higher yield in the process. The main objective of pre-treatment is to decrease the degree of crystallinity of the polysaccharide mesh that forms the cell wall and thus make them more susceptible to saccharification [25].
One study found that seaweed carbohydrates from all three classes of macroalgae (brown, red, and green) can be effectively hydrolyzed to monosaccharides by dilute H2SO4 treatment at high temperature [26]. Since the yield of conversion to ethanol is functional to the saccharification process, it is of vital importance to have an appropriate analytical method for the determination of reducing sugars obtained in said process. One of the most widespread analytical techniques for the quantification of reducing sugars is that developed by Sumner [27-29] with various co-worker and later modified by Miller [30].
With the passage of time and the dizzying development of technology, after almost 50 years, this technique has undergone some modifications, although in essence it remains the same. When applying old methodologies, it is advisable to carry out a retrospective validation of the method in order to demonstrate its suitability in the application in which it is intended to be used.
ISO 9000 [31] defines validation as the "confirmation, through the provision of objective evidence, that the requirements for a specific intended use or application have been fulfilled". The validation of an analytical method is a fundamental step to ensure that the method meets the requirements for the specific intended use or application and that the results delivered by that method are reliable. When the validation of a method is performed, it is sought to be able to determine on a statistical basis, that the method is suitable for the intended purposes.
In this sense, it is important for the process of validation to be assigned to a responsible person to perform this task. So that the validation is done in a methodical, orderly, traceable and reliable way to establish the scope of validation, it is essential:
Know the method to be validated and its applicability, i.e. the analyte, its concentration and the matrix (or matrices) in which it is desired to use.
175
Identify factors of influences that could change these parameters or performance characteristics.
Determine the limitations of the method. Since the dinitrosalicylic acid method (DNS) has been
used since the beginning for the determination of reducing sugars in foods, its validation is necessary in order to establish if this method is suitable for the matrix in which it is intended to apply: extracts of the seaweed Undaria pinnatifida. In this work, the dinitrosalicylic acid technique was validated for the determination of reducing sugars obtained in the extracts of U. pinnatifida algae by acid hydrolysis for later application in the production of bioethanol.
2. Materials and Methods
Chemicals: Sodium potassium tartrate and 3,5-dinitrosalicylic acid, Sigma-Aldrich S.p.a.; Sodium
hydroxide and Sulfuric acid 98%, Biopack of analytical reagent grade.
The DNS method is a colorimetric technique that consists of a redox reaction between the 3,5-dinitrosalicyclic acid and the reducing sugars present in the sample. The reducing power of these sugars comes from their carbonyl group, which can be oxidized to the carboxyl group by mild oxidizing agents, while the DNS (yellow) is reduced to 3-amino-5-nitrosalicylic acid (red-brown) which can be quantified by spectrophotometry at 540 nm, wavelength of maximum absorbance [30]. The intensity of the color is proportional to the concentration of sugars. The reaction is carried out in an alkaline medium. The Figure 1 shows the oxidation-reduction reaction mentioned.
The reagent is a solution formed by the following compounds: 3, 5-Dinitrosalicylic acid (2-hydroxy-3,5-dinitrobenzoic acid), which acts as an oxidant, Rochelle salt (sodium-potassium tartrate), which prevents the dissolution of oxygen in the reagent and sodium hydroxide to provide the medium required for the redox reaction to occur.
Preparation of DNS Reactive
1. Solution A: Dissolve 1.00 g of DNS in 20 mL of NaOH 2 M.
2. Solution B: Dissolve 30 g of sodium and potassium tartrate tetrahydrate in 50 mL of distilled water.
3. Stir until complete dissolution.
4. Solution A onto B.
5. Heat and mix to homogenize.
6. Complete the volume to 100 mL with distilled water.
7. Store in amber bottle at 4 °C.
To carry out the validation of the DNS method, the same was applied to standard glucose solutions and U. pinnatifida seaweed extracts. Glucose solutions of different concentrations were obtained by dilutions from a stock solution of 1 g/L. The algae extracts were obtained by hydrolysis of 1 g dry weight of U. pinnatifida seaweed in 50 mL of 0.25 N sulfuric acid in a thermostatted bath at 50 °C for 1 hour. For both glucose solutions and algae extracts, the procedure was the same:
1. In tubes of 10 mL, is placed 1 mL of algae extract and 1 mL of DNS reagent.
2. The pH was brought to pH 10.
3. The tubes are taken to a bath thermostatized at 100 °C, 5 minutes.
4. It is cooled to room temperature.
5. The volume is completed with 8 mL of distilled water.
6. It is homogenized and read at 540 nm in a spectrophotometer.
The reading is compared against a reagent blank solution, in which the algae extract is replaced by distilled water and steps 2 to 6 are repeated.
2.1 Validation of the analytical methodology
In order to determine the optimal operating wavelength, the absorption spectrum of a glucose solution of medium concentration was performed for wavelengths from 520 to 625 nm. The figure 2 shows the absorption spectrum obtained.
Figure 2. Absorption spectrum of glucose
176
The maximum absorption wavelength corresponded to 540 nm, coincident with Miller [30]. For the validation of the analytical methodology, the following parameters were studied: linearity, limit of detection, limit of quantification, accuracy, precision, selectivity and robustness. For linearity, the absorbance standard curve was constructed as a function of concentration, with glucose solutions of concentrations less than 1 g/L, and the correlation coefficient was calculated. Subsequently, the regression line was found and the validity of the linear model was verified through a hypothesis testing on the slope of the line and the y-intercept.
Detection and quantification limits were calculated as 3 and 10 times the standard deviation, respectively, of 9 reagents blank solution, according to Owen [32]. The accuracy of measurement expresses the proximity of a single result to a reference value [33]. The accuracy of the method was determined by the percentage of recovery, using the method of Addition of Standard Solution in triplicate: on an algae extract, whose content of reducing sugars was previously determined, solutions of glucose concentrations of 0.30, 0.60 and 0.90 g/L were added in equal amounts. The DNS method was applied to the algae extracts enriched and the percentage of recovery was calculated according to equation (1).
%𝑅 = 𝑀𝑎−𝑀𝑠
𝑎 (1)
Where:
% R: Percentage of recovery.
Ma : Initial concentration of algae extract with addition of standard.
Ms : Initial concentration of algae extract without addition of standard.
a : Concentration of the standard solution added.
ISO 5725 uses term “precision” to refer to the closeness of agreement between test results [33]. The precision was determined by repeatability tests (the same analyst performed 5 replicates of the same algae extract on the same day and on the same equipment) on three algae extracts of known concentrations. For each case the coefficient of variation was calculated.
The selectivity study was tested using formaldehyde as an interfering, instead of the carbonyl group present in the reducing sugars. The effect of the interfering in concentrations of 4, 2 and 1% on a solution of glucose of concentration 0.50 g/L, and on an extract of algae of concentration 0.28 g/L, were analyzed. "The robustness of an analytical procedure is a measure of its capacity to remain unaffected by small, but deliberate variations in method parameters and provides an indication of its reliability during normal usage" [34].
For the study of robustness of the methodology, the recommendations of Youden and Steiner [35] adopted later by Quatrochi and Plackett and Burman [36, 37], and published by Vander [38] were taken as references. According to Vander [38], for their statistical validity the study requires that the experimental design includes at least seven real factors, which are evaluated by means of the realization of eight independent experiments. For this, each variable is studied through a high and a low value.
The factors chosen for this test, were: reaction time, reagent volume (DNS), pH, cell volume, volume of algae extracts, operator, reaction water bath cooling; and for each one of them was established its minimum and maximum value. For each factor the difference between the average absorbance of the upper level of the effect (X) and the average absorbance of the lower level of the effect (x) was calculated. The greater the difference, X-x, the more influence this variable will have on the analytical method. The acceptance criterion was established as a function of the standard deviation of the
method (S); if (X - x) < √2 𝑆, the method was considered not to be sensitive to the variable observed [36].
3. Results and discussion
Linearity. The method demonstrated linearity in a range of 0.28 to 1.00 g/L. For the realization of the calibration curve, it worked with concentration values lower than 1 g/L. With the absorbance values obtained, the correlation coefficient (r = 0.993) was found to be statistically significant when performing a hypothesis testing with a significance level of 5%. Figure 3 shows the calibration curve for the determination of reducing sugars in extracts of U. pinnatifida seaweed by UV-Visible spectrophotometry.
Figure 3. Calibration curve for the determination of
reducing sugars in extracts of Undaria pinnatifida algae by UV-Visible spectrophotometry
Subsequently, the regression line between the absorbance values (y) and the concentrations (x) was found by minimizing the sum of the squares of the residuals so as to find the slope (m) and the y-intercept (b). The values obtained were m = 1.592 and b=-0.077 with a coefficient of determination (R2) of 0.983, which indicates that 98.32% of the variation in absorbance can be explained by variation in concentration. In this way the calibration curve is represented by y=1.592 x-0.077.
In order to verify the validity of the linear model in the range of concentrations studied, in addition to finding the coefficient of determination, a hypothesis testing was performed on the slope of the regression line and the y-intercept, it was verified that the coefficient of variation (CV) of the response factors (quotient between ycalculated and x) are less than 5%. It worked with the statistical variable Student´s t and a significance level of 5%, where tc = t8, 0.025 = 2.751. The calculated values were tb = -2.039 and tm = 23.04, for the y-intercept and the slope respectively; and the CV = 4.04. From them it is concluded that there is linearity
177
and that there is not sufficient evidence to suppose that the y-intercept is different from zero;
The standard errors (s) are sb = 0.038 and sm = 0.069 and considering a 95% confidence level results that the slope and the y-intercept true would be found in the interval (1.433, 1.752) and (-0.165, 0.010) respectively; of second interval it can be deduced that the y-intercept is close enough to zero. These acceptance criteria coincide with [39], who verifies the linearity, through the study of the same parameters.
Limits. The limit of detection (LOD) is the minimum concentration of analyte that can be detected and identified, but not necessarily quantified with a certain degree of certainty [40]. The limit of detection can be calculated from the equation (2).
Limit of detection, LOD = 3 * S = 0.004 (2)
Values above the LOD can be attributed to the presence of the analyte and the values below of
LOD are indicative of the absence of analyte in detectable amounts. The limit of quantification (LOQ) is strictly the lowest analyte concentration that can be quantified with an acceptable level of accuracy and precision [40]. The limit of quantification can be calculated from equation (3).
Limit of quantification, LOQ = 10 * S = 0.012 (3)
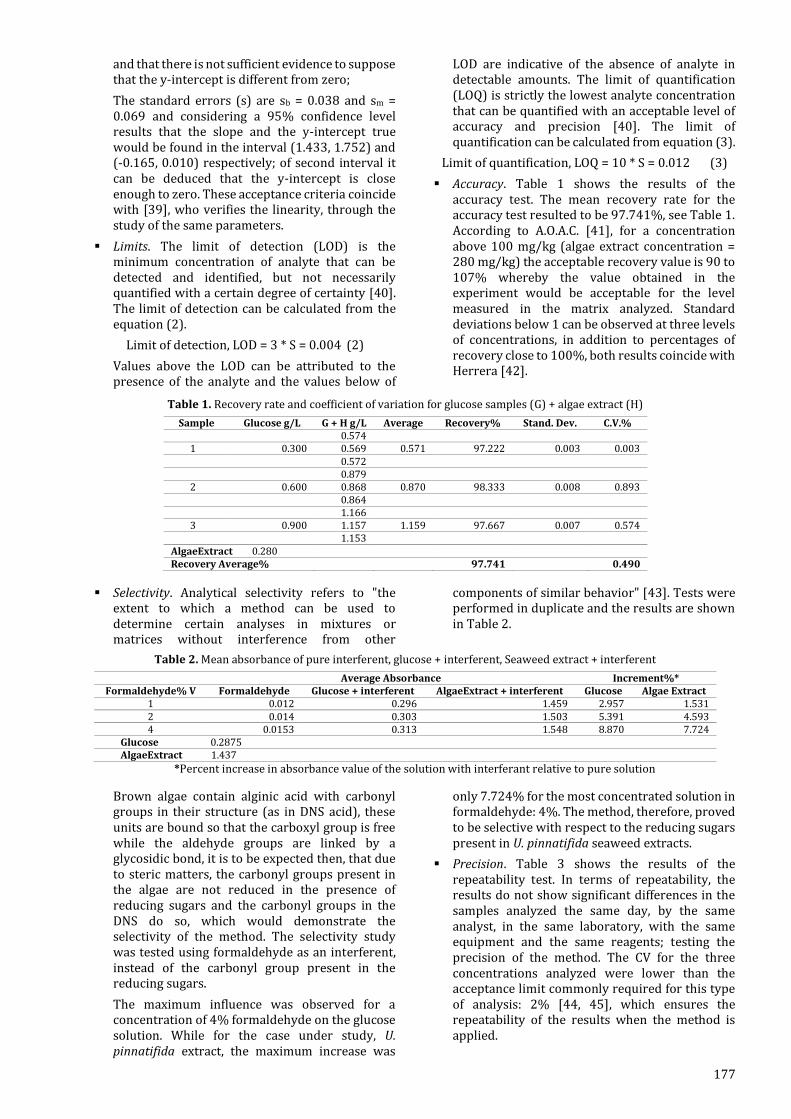
Accuracy. Table 1 shows the results of the accuracy test. The mean recovery rate for the accuracy test resulted to be 97.741%, see Table 1. According to A.O.A.C. [41], for a concentration above 100 mg/kg (algae extract concentration = 280 mg/kg) the acceptable recovery value is 90 to 107% whereby the value obtained in the experiment would be acceptable for the level measured in the matrix analyzed. Standard deviations below 1 can be observed at three levels of concentrations, in addition to percentages of recovery close to 100%, both results coincide with Herrera [42].
Table 1. Recovery rate and coefficient of variation for glucose samples (G) + algae extract (H)
Selectivity. Analytical selectivity refers to "the extent to which a method can be used to determine certain analyses in mixtures or matrices without interference from other
components of similar behavior" [43]. Tests were performed in duplicate and the results are shown in Table 2.
Table 2. Mean absorbance of pure interferent, glucose + interferent, Seaweed extract + interferent
Average Absorbance Increment%* Formaldehyde% V Formaldehyde Glucose + interferent AlgaeExtract + interferent Glucose Algae Extract
*Percent increase in absorbance value of the solution with interferant relative to pure solution
Brown algae contain alginic acid with carbonyl groups in their structure (as in DNS acid), these units are bound so that the carboxyl group is free while the aldehyde groups are linked by a glycosidic bond, it is to be expected then, that due to steric matters, the carbonyl groups present in the algae are not reduced in the presence of reducing sugars and the carbonyl groups in the DNS do so, which would demonstrate the selectivity of the method. The selectivity study was tested using formaldehyde as an interferent, instead of the carbonyl group present in the reducing sugars.
The maximum influence was observed for a concentration of 4% formaldehyde on the glucose solution. While for the case under study, U. pinnatifida extract, the maximum increase was
only 7.724% for the most concentrated solution in formaldehyde: 4%. The method, therefore, proved to be selective with respect to the reducing sugars present in U. pinnatifida seaweed extracts.
Precision. Table 3 shows the results of the repeatability test. In terms of repeatability, the results do not show significant differences in the samples analyzed the same day, by the same analyst, in the same laboratory, with the same equipment and the same reagents; testing the precision of the method. The CV for the three concentrations analyzed were lower than the acceptance limit commonly required for this type of analysis: 2% [44, 45], which ensures the repeatability of the results when the method is applied.
178
Table 3. Repeatability test results (n = 5)
Concent. Absorbance Average Stand. Dev. C.V.%
0.900
1.362
1.342 0.014 1.058 1.333 1.335 1.328 1.351
0.560
0.618
0.621 0.006 0.886 0.621 0.618 0.631 0.619
0.180
0.186
0.184 0.002 0.822 0.184 0.183 0.183 0.186
Robustness. Table 4 summarizes the factors that were taken into account for the robustness analysis and the maximum and minimum values of each. S = 0.031; Standard deviation of the mean
absorbance obtained in the 8 trials. Table 5 presents the values of the differences, in absolute value, for each factor.
Table 4. Average Absorbance for the Robustness Test of Youden and Steiner
Condition variable Tests
Reference* Max. Min. 1 2 3 4 5 6 7 8
1 10 5 10 10 10 10 5 5 5 5
2 2.5 1.5 2.5 2.5 1.5 1.5 2.5 2.5 1.5 1.5
3 10 5 10 5 10 5 10 5 10 5
4 15 10 25 25 10 10 10 10 25 25
5 2.5 1.5 2.5 1.5 2.5 1.5 1.5 2.5 1.5 2.5
6 M o M o o M M o o M
7 Yes No Yes No No Yes No Yes Yes No
Average Absorbance 0.016 0.001 0.002 0.056 0.089 0.002 0.028 0.023
*1. Reaction time; 2. DNS volume (mL); 3. pH; 4. Cell Volume; 5. Volume of Algae extract; 6. operator; 7. Cooling in water bath of the reaction
Table 5. Influence of variation of some parameters on the response
Reference High value Low value Average X Average x Dif. 1 10 5 0.019 0.035 0.017 2 2 1 0.027 0.027 0.000 3 10 5 0.034 0.081 0.047 4 25 10 0.068 0.037 0.031 5 2 1 0.011 0.043 0.033 6 M o 0.046 0.008 0.038 7 Si No 0.025 0.029 0.003
Those parameters, which presented a value for the
difference, (X - x) greater than √2 𝑆, according to equation (4), were considered critical [36].
√2 𝑆 = 1.414 x 0.031 = 0.044 (4)
It was concluded that the method is solid compared to the small variations made in the considered variables, except for the pH, a parameter in which special attention must be paid during the tests for the determination of reducing sugars. The variation generated by the pH is also detected by Herrera [42] in the validation of a spectrophotometric method.
4. Conclusions
The proposed analytical methodology for the
determination of reducing sugars in U. pinnatifida seaweed extracts by UV-Visible spectrophotometry, fulfilled the requirements to consider it validated, proving to be a specific, linear, accurate, precise and
robust method against possible variations in the conditions of the method except pH.
In this way the DNS method can be reliably used on the matrix in which it is intended to apply: extracts of algae U. pinnatifida for the production of bioethanol. It should be noted that one of the methods of saccharification is acid hydrolysis, which is why the extract obtained will have an acidic pH. When applying the DNS method, we must ensure an alkaline pH, but given that the robustness analysis proved to be sensitive to changes in pH, the same pH should be ensured for all experiments, so that the data are comparable.
References [1] Kecebas, A. & Alkan, M. (2009). Educational and
consciousness-raising movements for renewable energy in Turkey. Energy Educ. Sci. Technol. Part B 1, pp. 157–170.
[2] Dikmenli, M. (2010). Biology students’ conceptual structures regarding global warming. Energy Educ. Sci. Technol. Part B 2, pp. 21–38.
[3] Demirbas, A. (2010). Social, economic, environmental and policy aspects of biofuels. Energy Educ. Sci. Technol. Part B 2, pp. 75–109.
[4] Encinar J., Gonzalez J. & Gonzalez, J. (2000). Fixed-bed pyrolysis of Cynara cardunculus L. product yields and compositions. Fuel Process Technol. 68, pp. 209–222.
[5] Alvira, P. et al. (2010). Pretreatmet technologies for an efficient bioethanol production process based on enzymatic hydrolysis: a review. Bioresource Technol. 101, pp. 4851-4861.
[6] Chiaramonti, D. et al. (2012). Review of pretreatment processes for lignocellulosic ethanol production, and development of an innovative method. Biomass Bioeng. 46, pp. 25-35.
[7] Balat, H. (2009). Prospects of biofuels for a sustainable energy future: a critical assessment. Energy Educ. Sci. Technol. Part A 24, pp. 85–111.
[8] Kan, A. (2009). General characteristics of waste management: a review. Energy Educ. Sci. Technol. Part A 23, pp. 55–69.
[9] Dias, M. et al. (2009). Production of bioethanol and other bio-based materials from sugarcane bagasse: integration to conventional bioethanol production process. Chemical Engineering Research and Design 87(9), pp. 1206-1216.
[10] Subhadra, B. & Edwards, M. (2010). An integrated renewable energy park approach for algal biofuel production in United States. Energy Policy 38(9), pp. 4897-4902.
[11] Donner, S. & Kucharik, C. (2008). Corn-based ethanol production compromises goal of reducing nitrogen export by the Mississippi River. Proceedings of National Academy of Sciences of USA (pp. 4513-4518).
[12] Fargione, J. et al. (2008). Land clearing and the biofuel carbon debt. Science 319(5867), pp. 1235-1238.
[13] Hill, J. et al. (2009). Climate change and health costs of air emissions from biofuels and gasoline. Proceedings of the National Academy of Sciences of USA (pp. 2077-2082).
[14] Landis, D. et al. (2008). Increasing corn for biofuel production reduces biocontrol services in agricultural landscapes. Proceedings of the National Academy of Sciences of USA (pp. 20552–20557).
[15] Tilman, D., Hill, J. & Lehman, C. (2006). Carbon-negative biofuels from low-input high diversity grassland biomass. Science 314(5805), pp. 1598-1600.
[16] Gao, K. & McKinley, K. (1994). Use of macroalgae for marine biomass production and CO2 remediation: a review. J. Appl. Phycol. 6(1), pp. 45-60.
[17] Lee, K. et al. (2011). Improved galactose fermentation of Saccharomyces cerevisiae through inverse metabolic engineering. Biotechnol. Bioeng. 108(3), pp. 621-631.
[18] Wei, N., Quarterman, J. & Jin, Y. (2013). Marine macroalgae: an untapped resource for producing fuels and chemicals. Trends in Biotechnology 31(2), pp. 70-77.
[19] YuKyeong, C., Hyejin, K. & Sung, K. (2013). Bioethanol production from brown seaweed, Undaria pinnatifida, using NaCl acclimated yeast. Bioprocess and Biosyst. Eng. 36(6), pp. 713-719.
[20] Proyecto GEF. Proyecto corredores rurales y conservacion de la biodiversidad. Online [Oct 2016].
[21] Piriz, M. & Casas, G. (1994). Occurence of Undaria pinnatifida in Golfo Nuevo, Argentina. Applied Phycology Forum 10(4).
[22] Casas, G. & Piriz, M. (1996). Surveys of Undaria pinnatifida (Laminariales, Phaeophyta) in Golfo Nuevo, Argentina. Hydrobiologia 326/327, pp. 213-215.
[23] Casas, G., Scrosati, R. & Piriz, M. (2004). The invasive kelp Undaria pinnatifida (Phaeophyceae, Laminariales) reduces native seaweed diversity in Nuevo Gulf (Argentina). Biological Invasions 6(4), pp. 411-416.
[24] Dumitriu, S. (2004). Polysaccharides: Structural Diversity and Functional Versatility. USA: CRC Press.
[25] Briones, G. (2012). Producción de etanol a partir de la macroalga Ulva rígida. Tesis pregrado. Universidad de Chile.
[26] Jang, S. et al. (2012). Production of mono sugar from acid hydrolysis of seaweed. Afr. J. Biotechnol. 11(8), pp. 1953-1963.
[27] Summer, J. & Graham, V. (1921). Dinitrosalicylic acid: A reagent for estimation of sugar in normal and diabetic urine. J. Biol. Chem. 47, pp. 5-9.
[28] Summer J. & Noback C. (1924). The estimation of sugar in diabetic urine, usign dinitrosalicylic acid. J. Biol. Chem 62, pp. 287-290.
[29] Summer, J. & Graham, V. (1925). A more specific reagent for the determination of sugar in urine. J. Biol. Chem. 62, 393.
[30] Miller, G. (1959). Use of Dinitrosalicylic Acid Reagent for Determination of Reducing Sugar. Analytical Chemistry 31, pp. 426-428.
[31] ISO 9000 (2005). Quality management systems – Fundamentals and vocabulary. ISO Geneva.
[32] Owen, T. (2000). Fundamentos de la espectroscopía UV-visible moderna. Conceptos básicos. Agilent Tecnologies.
[33] ISO 5725 (1994). Accuracy (trueness and precision) of measurement methods and results. Part 6, ISO Geneva.
[34] ICH (1994). Validation of Analytical Procedures: Text and Methodology Q2(R1). Harmonised Tripartite Guideline
[35] Youden, W. & Steiner, E. (1975). Statistical manual of the Association of Official Analytical Chemists. USA: AOAC International.
[36] Quatrochi, O., Abelaira, S. & Laba, R. (1992). Introducción a la HPLC. Aplicación y práctica. Buenos Aires: Artes Gráficas Farro.
[37] Plackett, R. & Burman, J. (1946). The design of optimum multifactorial experiments. Biometrika 33(4), pp. 305-325.
[38] Vander, Y. et al. (2006). Guidance for Robustness/Ruggedness Tests in Method Validation. Universiteit Brussel, Begium.
[39] Suarez, R. et al. (2009). Validación de un método analítico para la determinación de magnesio eritrocitario. Avances en Química 4(2), pp. 53-62.
[40] IUPAC (1995). Nomenclature in evaluation of analytical methods, including detection and quantification capabilities. Pure & Appl. Chem. 67(10), pp. 1699-1723.
[41] AOAC (2010). Official Methods of Analysis of the Association of Official Analytical Chemists. UK: AOAC.
[42] Herrera, V. et al. (2008). Analytic method validation for the cuantification of quinolinical alkaloid in extracts from Galipea longiflora Krause Kallunki. Biofarbo 16, pp. 47-53.
[43] IUPAC (2001). Selectivity in analytical chemistry. Pure Appl. Chem. 73(8), pp. 1381-1386.
[44] Aefi (2001). Validación de métodos analíticos. Barcelona: Asociación Española de Farmacéuticos de la Industria.
[45] USP (2006). The United States Pharmacopeia. Rockville: The Pharmacopeia Convention Inc.