+ All Categories
Home > Documents > Actionable Data and Physician Engagement Drive … Actionable Data and Physician Engagement Drive...

Actionable Data and Physician Engagement Drive … Actionable Data and Physician Engagement Drive...

Date post: 12-Jun-2018
Category:
Upload: nguyenkien
View: 220 times
Download: 0 times
Share this document with a friend
38
1 Actionable Data and Physician Engagement Drive ACO Success Session #100, February 21, 2017 Christy Cawthon, University of Texas Southwestern Medical Center Sam Stearns, Verscend Technologies
Transcript

1

Actionable Data and Physician Engagement Drive ACO Success

Session #100, February 21, 2017

Christy Cawthon, University of Texas Southwestern Medical Center

Sam Stearns, Verscend Technologies

2

Sam Stearns, MS, MBA

Vice President, Analytic Consulting

Verscend Technologies

Speaker Introduction

Christy Cawthon

Manager, Decision Support

University of Texas Southwestern Medical Center

3

Conflict of Interest

Christy Cawthon, Manager, Decision Support

and

Sam Stearns, MS, MBA, Vice President, Analytic Consulting

Have no real or apparent conflicts of interest to report.

4

Agenda

• Overview of the UT Southwestern Accountable Care Network (UTSCAN)

• Launching UTSCAN: Three Key Challenges

• Pods: Scaling Accountable Care Through Physician Engagement

• Making Data Actionable Through Technology and Analytics

• Case Example: Home Health

• Results and Lessons Learned

5

Learning Objectives

• Classify steps used to develop the ACO technology platform and clinical

infrastructure

• Design the components of the population management teams used to

engage physicians

• Summarize the patient data and reporting metrics used to guide clinical

interventions

• Describe continuous process improvement techniques to develop

data-driven action plans

6

An Introduction of How Benefits Were Realized for the Value of Health ITBy enabling physician engagement with actionable data, Health IT has created several types of value at UTSW:

Increased Physician Satisfaction

Reduced Utilization

Enhanced Communication and Reporting

Improved Prevention and Chronic Care

Shared Savings

7

Overview of the UT Southwestern Accountable Care Network

8

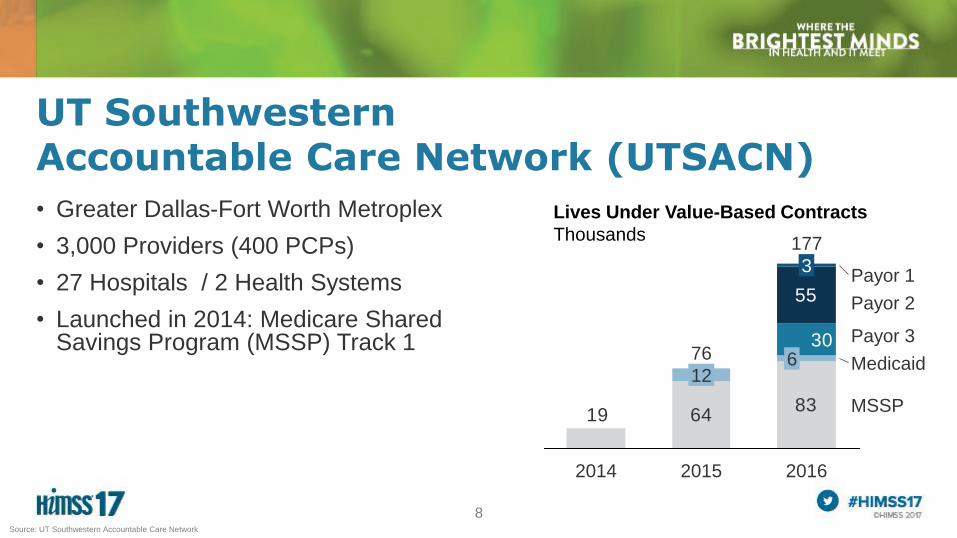
UT Southwestern Accountable Care Network (UTSACN)

• Greater Dallas-Fort Worth Metroplex

• 3,000 Providers (400 PCPs)

• 27 Hospitals / 2 Health Systems

• Launched in 2014: Medicare Shared Savings Program (MSSP) Track 1

6483

19

30

55

201620152014

MSSP

3

612

177

76Payor 3

Payor 1

Medicaid

Payor 2

Lives Under Value-Based Contracts

Thousands

Source: UT Southwestern Accountable Care Network

Our Service Area: Dallas / Fort Worth

© 2017 HIMSSSource: UT Southwestern Accountable Care Network

10

Launching UTSCAN: Three Key Challenges

11

Physician Engagement

“What is Accountable Care?”

Technology Gaps

“How do we organize complex data?”

Patient Education

“How will I be impacted?”

UTSACN faced three challenges at launch

12

Pods: Scaling Accountable Care Through Physician Engagement

Population Management Units: Pods

• 3,000 physicians organized in >45 Pods across the UTSW footprint

• Integrates multidisciplinaryclinical team

• Drives physician leadership and strong care coordination

• Meets monthly to:

– Share data

– Review reports

– Improve referral process

– Discuss best practices

© 2017 HIMSSSource: UT Southwestern Accountable Care Network

14

• Organized patient data

• Recruited strong physicians committed to accountable care

• Deployed analytics to identify patient needs and inform care

• Developed provider reports to support continuum of patient care

• Leveraged transparent provider scorecards for best practices

Educating and Engaging Physicians

15

Making Data Actionable Through Technology and Analytics

16

Three Complementary Data Sources

Paid Claims Data EMR Data ADT Data

• Predictive modeling

• Risk scores

• Spend by category

• Highest paid diagnosis

• Gaps in care

• 4 EMR vendors

• 100 disparate systems

• Vendor support

− Extraction

− Standardization

• Transitions of care

• Compiled internally

UTSCAP Compiled Data Repository

Claims data processing Predictive Risk Score Likelihood of ED / Hospitaliztion Actual Utilization (IP, ED, SNF,

HHA) UM Reporting

EMR ETL / Data Standardization Quality metric reporting (based on EMR data

only currently) Gaps in care (aligned with quality metrics) Patient automated outreach campaigns Point of care Gaps in Care reminders

Aggregate reporting for risk stratification / spend Patient identification for engagement based on risk /

utilization Patient cohort analysis by risk / spend (Care

coordination, DM registry, high utilization) Quality Reporting Individual provider / POD Reporting GPRO Reporting

Practice EMR(EPIC)

Practice EMR

Practice EMR

Paid Claims (CMS, Commercial)

Population Management Application

Predictive Modeling Application

Care Coordination Source Documentation

Point of Care Gaps ACO Metrics Reporting / Trending

Outreach Notifications

Integrating data across the enterprisePredictive Analytics

Application

EMR Data

Application

Compiled Data

Repository

Paid Claims

© 2017 HIMSSSource: UT Southwestern Accountable Care Network

Actionable Data to Engage Providers: Pod Report

Recommendations

to drive action:

• Share un-blinded

performance data

with providers

• Benchmark against

practice, Pod, ACO,

national

• Include both quality

and cost efficiency

Example: Monthly Cost and Utilization Report

© 2017 HIMSSSource: UT Southwestern Accountable Care Network, Verscend Technologies

Recommendations

to drive action:

• Extract and

standardize EMR data

• Share drill-down

reports on specific

gaps in care with

practices

• Group clinically-related

measures and provide

customized targets

Actionable Data to Engage Providers: Quality Measurement

Example: Provider Dashboard

© 2017 HIMSSSource: UT Southwestern Accountable Care Network

0%

20%

40%

60%

80%

100%

BMI: ACO16

Prev: ACO20 -

Mammo

Prev: ACO19 -

Colorectal

Prev: ACO13 - Falls

Prev: ACO21- Htn

Screening

Prev: ACO15 -

Pneumo

Prev: ACO17

Tobacco

Prev: ACO18

DepressionScr

Preventive

Your Performance

Expected

0%

20%

40%

60%

80%

100%

DM: ACO 27-HbA1c Poor

Control

DM: ACO 41 -Eye Exam

Composite

Diabetes

Your Performance

Expected

0%

10%

20%

30%

40%

50%

60%

70%

80%

90%

100%

CAD: ACO33

ACE/ARBThrpy

Depression:ACO 40 -

Remission

HTN: ACO28 - BPControl

IVD: ACO30 - Anti-

thrmbThrpy

Prev: ACO42 - Statin

HF: ACO 31Beta

Composite

Other Quality Measures

Your Performance Expected

Actionable Data to Engage Providers: Stratification to Improve Quality Performance

EMR & Claims Care Gaps High

Med

Low

Individual ID IPP Curr Attrib Last Name Chronic

Conditions

Al l

Measures

Fina l Alert

Fa ir Priori ty ACO 13

Fa l ls Alert

ACO 14

Flu Alert

XXXXXXXA Provider A 2016 Q3 Bene List Smith 1 1 Low

XXXXXXXA Provider B 2016 Q3 Bene List Smith 0 5 Low ACO 13 Falls Alert

XXXXXXXA Provider C 2016 Q3 Bene List Smith 1 4 Low ACO 13 Falls Alert

XXXXXXXA Provider D 2016 Q3 Bene List Smith 0 7 Low

XXXXXXXA Provider E 2016 Q3 Bene List Smith 2 2 Med

XXXXXXXA Provider F 2016 Q3 Bene List Smith 3 2 Low

XXXXXXXA Provider G 2016 Q3 Bene List Smith 0 3 Low ACO 14 Flu Alert

XXXXXXXA Provider H 2016 Q3 Bene List Smith 3 3 High

3+ Chronic plus 3+ Alerts

Other

2+ Chronic plus 2+ Alerts

Example: Patient-Level Care Gap Alerts

© 2017 HIMSSSource: UT Southwestern Accountable Care Network

Recommendations

to drive action:

• Quality improvement team stratifies patients

based on both quality and risk to help meet goals

Recommendations

to drive action:

• Tell a story with

multiple measures

• Compare risk-adjusted

performance

• Calculate “Efficiency”:

(Observed / Expected)

• Benchmark vs. market

and national norm

Actionable Data to Engage Providers: Cost Efficiency

Example: PCP Cost Efficiency Summary

© 2017 HIMSSSource: UT Southwestern Accountable Care Network, Verscend Technologies

Efficiency =Observed Value

Expected ValueExpected =

Relative Risk ×PopulationAverage

Actionable Data to Engage Providers: Trending Cost and Utilization Efficiency

0.85

0.90

0.95

1.00

1.05

1.10

1.15

1.20

1.25

Nov Dec Jan

Example: Efficiency Trend - Clinic A

Top Coded Cost Overall Admissions

Outpatient ER Outpatient Imaging

Recommendations

to drive action:

• In a fast growing population,

calculate efficiency vs.

national benchmarks:

─ Risk-adjustment

measures relative

performance

─ Provider efficiency is

often stable over time

─ Population shifts can

change benchmark

substantially

© 2017 HIMSSSource: UT Southwestern Accountable Care Network, Verscend Technologies

Leveraging Data to Engage Providers: Outreach to High Risk Patients

Recommendations

to drive action:

Engagement begins with provider awareness and allows for

collaboration between our care coordination team and the patient

• Identify high utilization • Identify high risk • Identify Impactability

IndividualAdmis

sionsTotal Paid

Re-

admis

sions

Office

Visits

ER

Visits

LOH LOED

RRS

Normalized

to Medicare

Predicted

Allowed

Amt

Prev

RRS

Care Coord

or CCM

Activity

Risk Status

% Delta

from

Previous

RRS

Patient A 1 $106,680 0 16 3 0.94 0.39 31.14 $129,963 28.85 CCM 2 - Moderate 8%

Patient B 2 $74,154 1 5 2 0.3 0.26 14.28 $59,605 15.79 NOS 1 - Impactful -10%

Patient C 2 $49,888 0 18 4 0.46 0.75 8.21 $76,863 7.56 P 2 - Moderate 9%

Patient D 1 $43,886 0 6 1 0.36 0.36 6.63 $62,169 6.71 CCM 1 - Impactful -1%

Patient E 0 $38,988 0 21 4 0.28 0.41 6.49 $60,913 6.74 NOS 1 - Impactful -4%

Patient F 3 $42,059 1 28 7 0.7 0.92 5.76 $54,005 5.66 CC 3 - More Impactful 2%

Patient G 1 $51,307 0 8 0 0.54 0.25 3.92 $36,799 5.18 CC 2 - Moderate -24%

Example: High Risk Patient Stratification

© 2017 HIMSSSource: UT Southwestern Accountable Care Network, Verscend Technologies

24

Case Example: Home Health

25

Leveraging Data: Home Health Utilization

• Improve Home Health Utilization in MSSP population

– MSSP Home Health Spend 2x national average, in Mid 2015

– 1,200 home health agencies (HHAs) servicing our patients

Opportunity

Underlying

Issue

• Physicians often sign CMS Home health certification form

(485) without thinking twice:

– Form is lengthy, complex, difficult to navigate

– Fear of angering patient / family if home care removed

– Probably not doing any harm, right?

26

Identifying High Value HHAs

20 Recommended HHAs

Geography

Quality

Cost Efficiency

ACO Analytics: Drill Down into Data

• Analyzed the data we had (Paid Claims)

• Created an efficiency score, based on actual

paid claims, risk adjusted

• Narrowed the list to 44 HH agencies with

>= 90% efficiency

• Cross-walked these to CMS STAR ratings

• Final network of 20 geographically dispersed,

high efficiency, high quality HH agencies

~1,200 HHAs in use

Source: UT Southwestern Accountable Care Network

27

Home Health Agency Efficiency Scoring, Risk Adjusted

Source: UT Southwestern Accountable Care Network, Verscend Technologies

Providers over the 80th Percentile in Risk adjusted Days

Home Health AgencyUnique

PatientsAvg RRS

HHA Total

Spend

Risk Adj

Avg Day

Risk Adj

Spend

Per

Patient

Risk Adj

Spend

Per Day

Percentile

for Risk

Adj Days

Percentile

for Risk Adj

Spend

Blended

Score

Grand Total 13,686 3.05 $88,067,148 35.40 $2,111 $20

HHA A 657 2.87 $2,376,036 16.81 $1,259 $26 92.5% 86.9% 89.7%

HHA B 441 3.27 $2,255,963 21.57 $1,564 $22 79.3% 76.3% 77.8%

HHA C 424 2.48 $1,572,273 12.41 $1,496 $49 98.5% 77.3% 87.9%

HHA D 397 3.48 $1,482,162 13.67 $1,072 $23 97.5% 93.5% 95.5%

HHA E 395 2.98 $2,059,461 20.45 $1,749 $29 83.4% 65.2% 74.3%

HHA F 362 3.21 $1,721,269 16.45 $1,480 $28 93.5% 78.8% 86.2%

HHA G 360 3.00 $1,697,858 18.31 $1,573 $29 89.9% 75.8% 82.9%

HHA H 307 3.14 $1,594,931 19.31 $1,656 $27 85.9% 71.3% 78.6%

28

Engaging Providers: Home Health Utilization

• Create PCP Buy-In

– Education on CMS requirements for Home Health

– ACO has fiscal responsibility to use CMS $$ wisely

– As PCP within the ACO, have a clinical responsibility to know why services are

being utilized, and a fiscal responsibility to ensue $$ are used appropriately

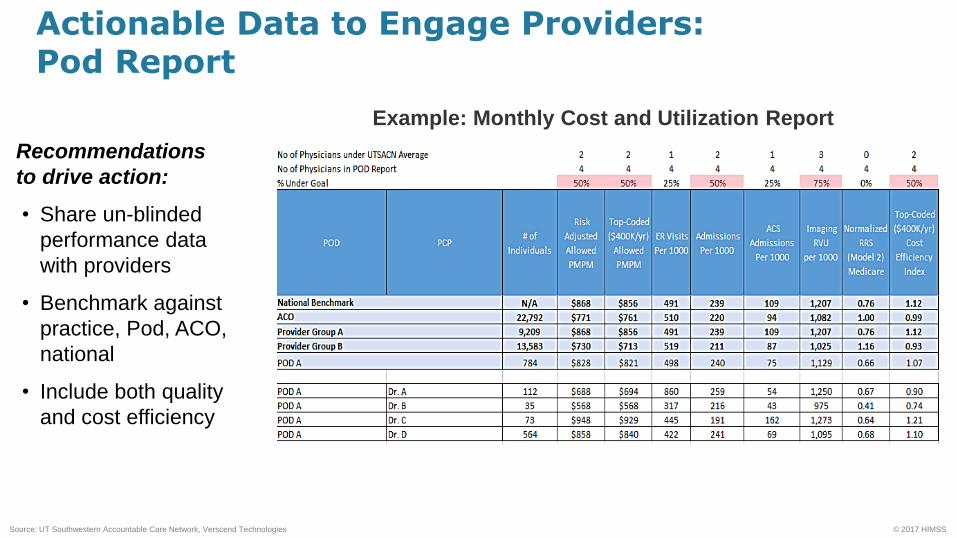
• Develop Provider Specific Reports

– Pod Meeting presentations (by Physician Reps)

– Faculty leadership / buy-in

– Provider notification of Care Coordination outreach related to HH utilization,

the presumptive “close”

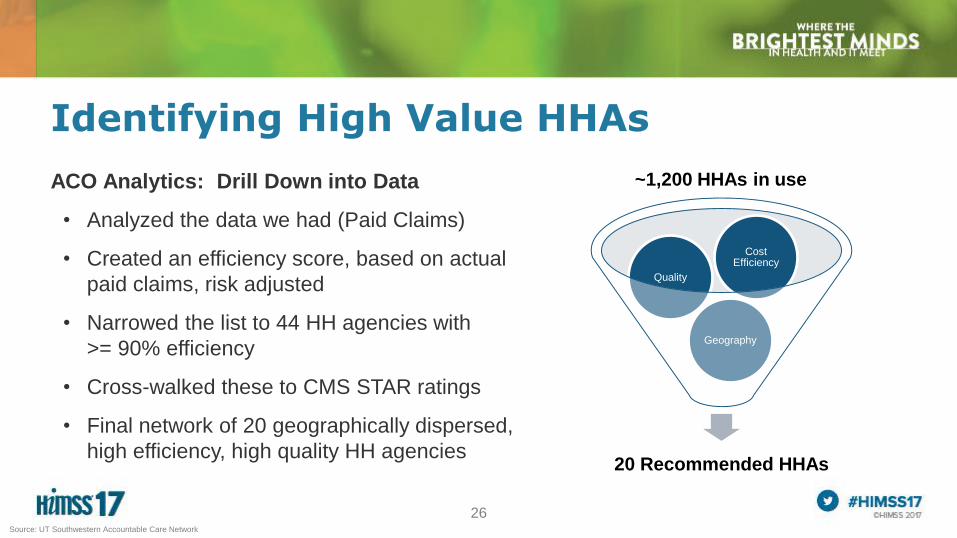
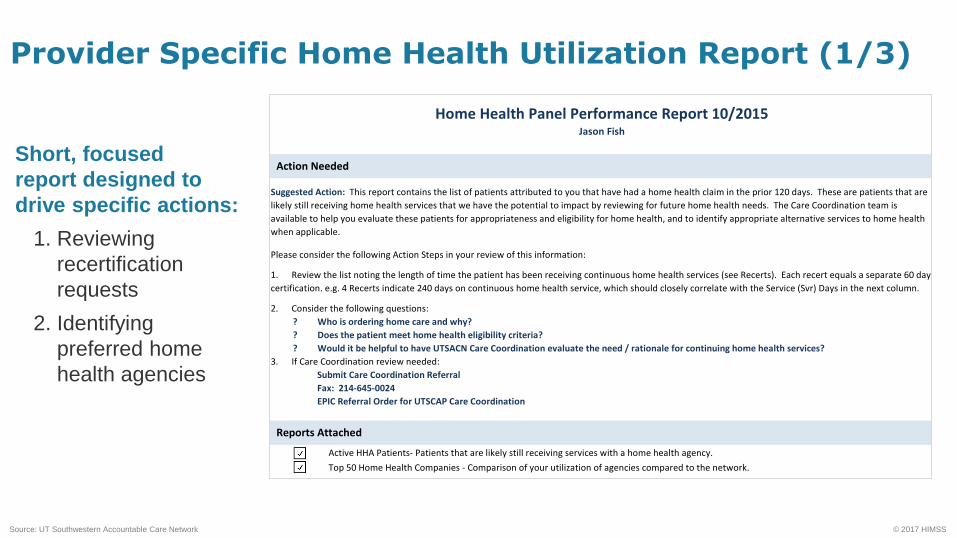
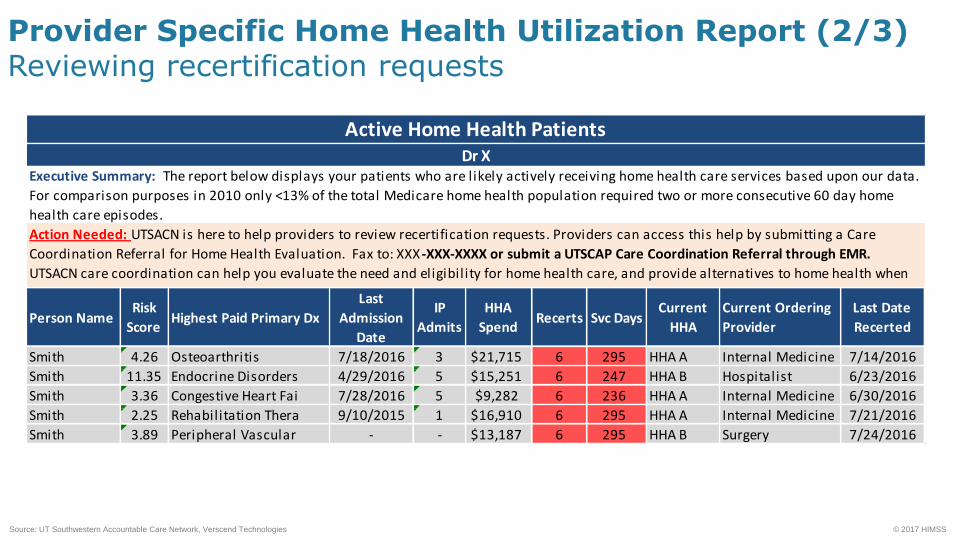
Provider Specific Home Health Utilization Report (1/3)

Short, focused

report designed to

drive specific actions:

1. Reviewing

recertification

requests

2. Identifying

preferred home

health agencies

Active HHA Patients- Patients that are likely still receiving services with a home health agency.

Top 50 Home Health Companies - Comparison of your utilization of agencies compared to the network.

Highest Paid Primary Dx - The highest paid primary diagnosis in the past twelve months

Relative Risk Score (RRS) - The calculated risk score of an individual in a given population

Last Admission Date - Date of the last inpatient admission

IP Admissions - Number of inpatient admissions in the last twelve months

HHA Spend - The total amount of spend for all home health services in the past twelve months

Recerts - Number of 60 days episodes during the past twelve months

HHA - Home Health Agency

Svc Days - Total number of service days on all home health services in the past twelve months

Current HHA - The most current home health agency based on service dates utilized by the patient

Initial Ordering Facility* - This field is calculated based on first home health visit within 15 days of inpatient admission and

first home health visit occurred during this timeframe.

Current Ordering Provider - The current attending provider on the home health claim based on service date

Last Date Recerted - The most current home health date of service in the past twelve months

Active Patient - Active patient is considered any patient that had home health claim in the last 3 months of this timeframe

Network Percentile Ranking* - This percentile is compared to all home health agencies in the UTSACN network. This score takes

into account the total spend and number of days per patient and adjusts the risk score of each agency for the entire ACO population.

Key Definitions

Home Health Panel Performance Report 10/2015Jason Fish

Action Needed

3. If Care Coordination review needed:

Submit Care Coordination Referral

Fax: 214-645-0024

EPIC Referral Order for UTSCAP Care Coordination

Reports Attached

Suggested Action: This report contains the list of patients attributed to you that have had a home health claim in the prior 120 days. These are patients that are

likely still receiving home health services that we have the potential to impact by reviewing for future home health needs. The Care Coordination team is

available to help you evaluate these patients for appropriateness and eligibility for home health, and to identify appropriate alternative services to home health

when applicable.

Please consider the following Action Steps in your review of this information:

1. Review the list noting the length of time the patient has been receiving continuous home health services (see Recerts). Each recert equals a separate 60 day

certification. e.g. 4 Recerts indicate 240 days on continuous home health service, which should closely correlate with the Service (Svr) Days in the next column.

2. Consider the following questions:

? Who is ordering home care and why?

? Does the patient meet home health eligibility criteria?

? Would it be helpful to have UTSACN Care Coordination evaluate the need / rationale for continuing home health services?

© 2017 HIMSSSource: UT Southwestern Accountable Care Network

Provider Specific Home Health Utilization Report (2/3)Reviewing recertification requests

Person NameRisk

ScoreHighest Paid Primary Dx

Last

Admission

Date

IP

Admits

HHA

SpendRecerts Svc Days

Current

HHA

Current Ordering

Provider

Last Date

Recerted

Smith 4.26 Osteoarthritis 7/18/2016 3 $21,715 6 295 HHA A Internal Medicine 7/14/2016

Smith 11.35 Endocrine Disorders 4/29/2016 5 $15,251 6 247 HHA B Hospitalist 6/23/2016

Smith 3.36 Congestive Heart Fai 7/28/2016 5 $9,282 6 236 HHA A Internal Medicine 6/30/2016

Smith 2.25 Rehabilitation Thera 9/10/2015 1 $16,910 6 295 HHA A Internal Medicine 7/21/2016

Smith 3.89 Peripheral Vascular - - $13,187 6 295 HHA B Surgery 7/24/2016

Active Home Health PatientsDr X

Executive Summary: The report below displays your patients who are likely actively receiving home health care services based upon our data.

For comparison purposes in 2010 only <13% of the total Medicare home health population required two or more consecutive 60 day home

health care episodes.

Action Needed: UTSACN is here to help providers to review recertification requests. Providers can access this help by submitting a Care

Coordination Referral for Home Health Evaluation. Fax to: XXX -XXX-XXXX or submit a UTSCAP Care Coordination Referral through EMR.

UTSACN care coordination can help you evaluate the need and eligibil ity for home health care, and provide alternatives to home health when

appropriate. Please also consider having the patient come to see you in your office to specifically review whether they stil l qualify for home

© 2017 HIMSSSource: UT Southwestern Accountable Care Network, Verscend Technologies

Provider Specific Home Health Utilization Report (3/3)Identifying preferred home health agencies

© 2017 HIMSSSource: UT Southwestern Accountable Care Network, Verscend Technologies

Home Health Agency Patients RRS HHA Spend Recerts Svc Days

Risk

Adjusted

Avg Spend

Per Patient

Risk

Adjusted

Avg Certs

Per

Patient

Risk

Adjusted

Avg Days

Per

Patient

Network

Percentile

Ranking*

HHA A 2 11.6 $122 1 10 $5 0.04 0.43 96%

HHA B 5 4.44 $15,705 10 409 $707 0.45 18.42 94%

HHA C 1 9.07 $669 1 7 $74 0.11 0.77 87%

HHA D 1 0.69 $3,818 1 21 $5,534 1.45 30.43 87%

HHA E 1 3.46 $5,526 1 55 $1,597 0.29 15.90 84%

HHA F 1 4.34 $2,698 1 0 $622 0.23 0.00 84%

HHA G 1 4.34 $4,226 2 79 $974 0.46 18.20 76%

HHA H 1 3.78 $4,171 1 22 $1,103 0.26 5.82 74%

HHA I 1 11.6 $2,764 1 16 $239 0.09 1.38 67%

HHA J 1 5.03 $1,988 1 0 $395 0.20 0.00 65% 80% or Greater

HHA K 2 3.08 $10,100 6 317 $1,640 0.97 51.46 25% Between 60% and 80%

HHA L 1 11.6 $4,562 2 98 $394 0.17 8.46 23% Less than 60%

HHA M 1 6.16 $1,390 1 0 $226 0.16 0.00 7%

HHA N 1 4.34 $409 1 15 $94 0.23 3.46 N/A

HHA O 1 2.55 $4,491 3 122 $1,761 1.18 47.84 N/A

HHA P 1 2.69 $4,761 2 55 $1,770 0.74 20.45 N/A

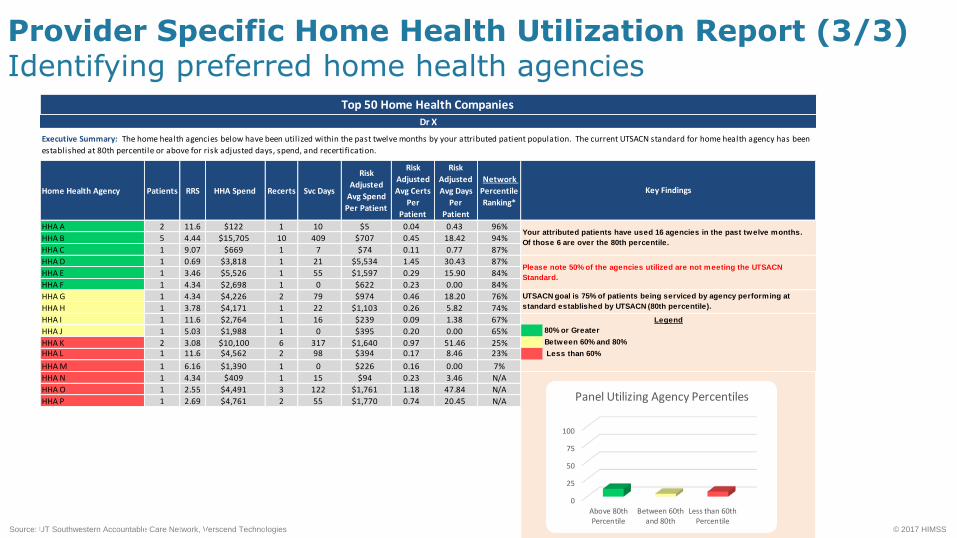
UTSACN goal is 75% of patients being serviced by agency performing at

standard established by UTSACN (80th percentile).

Legend

Your attributed patients have used 16 agencies in the past twelve months.

Of those 6 are over the 80th percentile.

Please note 50% of the agencies utilized are not meeting the UTSACN

Standard.

Executive Summary: The home health agencies below have been util ized within the past twelve months by your attributed patient population. The current UTSACN standard for home health agency has been

established at 80th percentile or above for risk adjusted days, spend, and recertification.

Key Findings

Top 50 Home Health Companies

Dr X

0

25

50

75

100

Above 80thPercentile

Between 60thand 80th

Less than 60thPercentile

Panel Utilizing Agency Percentiles

32

Engaging Providers: Home Health Utilization: Provide a Process

• Make it EASY for Providers / Practice Engagement

– Created Care Coordination Referral for Home Health Evaluation

Process was a Standing Order, unless otherwise requested by PCP

– Care Coordination Outreach to Home Health agency:

“If you anticipate recertifying patient again, please explain rationale”

–“Who is ordering physician, if not PCP? What is the clinical rationale for home care?”

– Notification that Care Coordination will provide oversight on behalf of PCP

– OPTION: Add PCP to Care Team for future 485 recerts (medical decision)

Requires Minimal Effort by PCP or PCP staff

33

Engaging Patients: Home Health Utilization: Provide a Process

• Outreach to Patients / Caregivers

– “What does HH staff do for you?

– “Is it helpful? “

– “Are you seeing improvement?”

– “What is your level of mobility?”

• Facilitate transition, as applicable and appropriate

– Other sources of support (transportation, companion services, custodial care)

Goal is NOT to eliminate Home Health Utilization

Goal is to make sure Home Health is being utilized

appropriately and with oversight

34

An Ongoing Process: Home Health Utilization: Next Steps

• Actively engage HH agencies in narrow network

– Active and frequent communication

– Regular meetings

– Bi-directional support (ACO – HHA, HHA – ACO)

• Continue to monitor agency efficiency and quality, along with communication and engagement, to remain in Narrow Network

• Evolution of reports

• Leverage additional data sources

• Continual provider education / engagement

35

Results and Lessons Learned

36

Summary: Value Realized from Health IT

Health IT

Value STEPS™ UTSCAN Results

Satisfaction • Pod structure improved physician buy-in and reduced effort

on PCP and staff

Treatment /

Clinical

• Achieved a 15% reduction in home healthcare costs

Electronic

Secure Data

• Monthly reports and Pod structure increased data sharing

and communication across 3,000 PCPs

Population

Management

• Improved ACO/HEDIS measures by 20% across

all populations

Savings • Generated $6M savings in year 1 and $30M in year two

Source: UT Southwestern Accountable Care Network

37

Lessons Learned

• Do not go in blind

• Implement technology analytics to understand metrics, and arm your physicians

• Define your strategy, and execute on it

• Build a partnership with your physicians

• Stay focused. Accountable care is a marathon, not a sprint

38

Questions

Christy Cawthon

Manager, Decision Support

University of Texas Southwestern

Medical Center

Sam Stearns, MS, MBA

Vice President, Analytic Consulting

Verscend Technologies


Recommended