Introduction Hepatic glycogen stores are reduced in concert with an increase in net hepatic glucose production in all forms of human diabetes studied to date (1–3). Net hepatic glu- cose output is determined by the balance between the entry of glucose into storage and utilization pathways on the one hand and synthesis of glucose from the gluco- neogenic and glycogenolytic pathways on the other. In non–insulin-dependent diabetes (NIDDM), the increase in hepatic glucose production occurs largely as a conse- quence of increased gluconeogenesis (1). However, the lower levels of liver glycogen in patients with NIDDM (1) indicate that the flux of glucose and gluconeogenic pre- cursors into glycogen is impaired. This metabolic per- turbation likely contributes to dysregulated hepatic glu- cose production in NIDDM and may be a site for therapeutic intervention. Our group uses adenovirus-mediated gene transfer to investigate the metabolic impact of specific genes in iso- lated cells and in whole animals (4). This approach has been applied for the study of genes that influence hepat- ic glucose disposal and production. For example, overex- pression of the catalytic subunit of glucose-6-phos- phatase (G6Pase) increases hepatic glucose production and lowers glycogen content (5), whereas overexpression of glucokinase has the opposite effect (6). The latter stud- ies suggest that maneuvers that increase the capacity of liver for glucose storage and utilization might be effective in lowering blood glucose in diabetes. In fact, hepatic overexpression of glucokinase largely normalizes glucose concentrations in streptozotocin-induced diabetic mice (7) and also significantly lowers glucose levels in ad libi- tum–fed normal rats and mice (6, 8). However, our work in normal rats demonstrates that levels of glucokinase overexpression sufficient for lowering of blood glucose have the undesired effect of increasing circulating con- centrations of FFAs and triglycerides (6). In the current study, we have investigated an alterna- tive method for enhancing hepatic glucose disposal that focuses on improving the capacity for glycogen synthe- sis in liver. This has involved adenovirus-mediated deliv- ery of protein targeting to glycogen (PTG), a member of the family of glycogen-targeting subunits of protein phosphatase-1 (PP-1). Glycogen-targeting subunits The Journal of Clinical Investigation | February 2000 | Volume 105 | Number 4 479 Activation of direct and indirect pathways of glycogen synthesis by hepatic overexpression of protein targeting to glycogen Robert M. O’Doherty, 1 Per B. Jensen, 1 Paul Anderson, 1 John G. Jones, 2 Hal K. Berman, 1 Denise Kearney, 1 and Christopher B. Newgard 1 1 Gifford Laboratories for Diabetes Research, Marjorie Touchstone Diabetes Center; Departments of Biochemistry and Internal Medicine; and 2 Mary Nell and Ralph B. Rogers Magnetic Resonance Center; University of Texas Southwestern Medical Center, Dallas, Texas 75235, USA Address correspondence to: Christopher B. Newgard, Gifford Laboratories for Diabetes Research, Room Y8.212, University of Texas Southwestern Medical Center, 5323 Harry Hines Boulevard, Dallas, Texas 75235, USA. Phone: (214) 648-2930; Fax: (214) 648-9191; E-mail: [email protected]. Robert O’Doherty’s current address is: University of Pittsburgh Medical Center, E1112 Biomedical Science Tower, Pittsburgh, Pennsylvania 15261, USA. Received for publication October 14, 1999, and accepted in revised form January 4, 2000. Glycogen-targeting subunits of protein phosphatase-1, such as protein targeting to glycogen (PTG), direct the phosphatase to the glycogen particle, where it stimulates glycogenesis. We have investigat- ed the metabolic impact of overexpressing PTG in liver of normal rats. After administration of PTG cDNA in a recombinant adenovirus, animals were fasted or allowed to continue feeding for 24 hours. Liver glycogen was nearly completely depleted in fasted control animals, whereas glycogen levels in fasted or fed PTG-overexpressing animals were 70% higher than in fed controls. Nevertheless, trans- genic animals regulated plasma glucose, triglycerides, FFAs, ketones, and insulin normally in the fast- ed and fed states. Fasted PTG-overexpressing animals receiving an oral bolus of [U- 13 C]glucose exhib- ited a large increase in hepatic glycogen content and a 70% increase in incorporation of [ 13 C]glucose into glycogen. However, incorporation of labeled glucose accounted for only a small portion of the glycogen synthesized in PTG-overexpressing animals, consistent with our earlier finding that PTG pro- motes glycogen synthesis from gluconeogenic precursors. We conclude that hepatic PTG overexpres- sion activates both direct and indirect pathways of glycogen synthesis. Because of its ability to enhance glucose storage without affecting other metabolic indicators, the glycogen-targeting subunit may prove valuable in controlling blood glucose levels in diabetes. J. Clin. Invest. 105:479–488 (2000).
Transcript
IntroductionHepatic glycogen stores are reduced in concert with anincrease in net hepatic glucose production in all forms ofhuman diabetes studied to date (1–3). Net hepatic glu-cose output is determined by the balance between theentry of glucose into storage and utilization pathways onthe one hand and synthesis of glucose from the gluco-neogenic and glycogenolytic pathways on the other. Innon–insulin-dependent diabetes (NIDDM), the increasein hepatic glucose production occurs largely as a conse-quence of increased gluconeogenesis (1). However, thelower levels of liver glycogen in patients with NIDDM (1)indicate that the flux of glucose and gluconeogenic pre-cursors into glycogen is impaired. This metabolic per-turbation likely contributes to dysregulated hepatic glu-cose production in NIDDM and may be a site fortherapeutic intervention.
Our group uses adenovirus-mediated gene transfer toinvestigate the metabolic impact of specific genes in iso-lated cells and in whole animals (4). This approach hasbeen applied for the study of genes that influence hepat-ic glucose disposal and production. For example, overex-
pression of the catalytic subunit of glucose-6-phos-phatase (G6Pase) increases hepatic glucose productionand lowers glycogen content (5), whereas overexpressionof glucokinase has the opposite effect (6). The latter stud-ies suggest that maneuvers that increase the capacity ofliver for glucose storage and utilization might be effectivein lowering blood glucose in diabetes. In fact, hepaticoverexpression of glucokinase largely normalizes glucoseconcentrations in streptozotocin-induced diabetic mice(7) and also significantly lowers glucose levels in ad libi-tum–fed normal rats and mice (6, 8). However, our workin normal rats demonstrates that levels of glucokinaseoverexpression sufficient for lowering of blood glucosehave the undesired effect of increasing circulating con-centrations of FFAs and triglycerides (6).
In the current study, we have investigated an alterna-tive method for enhancing hepatic glucose disposal thatfocuses on improving the capacity for glycogen synthe-sis in liver. This has involved adenovirus-mediated deliv-ery of protein targeting to glycogen (PTG), a member ofthe family of glycogen-targeting subunits of proteinphosphatase-1 (PP-1). Glycogen-targeting subunits
The Journal of Clinical Investigation | February 2000 | Volume 105 | Number 4 479
Activation of direct and indirect pathways of glycogen synthesis by hepatic overexpression of protein targeting to glycogen
Robert M. O’Doherty,1 Per B. Jensen,1 Paul Anderson,1 John G. Jones,2 Hal K. Berman,1
Denise Kearney,1 and Christopher B. Newgard1
1Gifford Laboratories for Diabetes Research, Marjorie Touchstone Diabetes Center; Departments of Biochemistry and Internal Medicine; and
2Mary Nell and Ralph B. Rogers Magnetic Resonance Center; University of Texas Southwestern Medical Center, Dallas, Texas 75235, USA
Address correspondence to: Christopher B. Newgard, Gifford Laboratories for Diabetes Research, Room Y8.212, University of Texas Southwestern Medical Center, 5323 Harry Hines Boulevard, Dallas, Texas 75235, USA. Phone: (214) 648-2930; Fax: (214) 648-9191; E-mail: [email protected].
Robert O’Doherty’s current address is: University of Pittsburgh Medical Center, E1112 Biomedical Science Tower, Pittsburgh,Pennsylvania 15261, USA.
Received for publication October 14, 1999, and accepted in revised form January 4, 2000.
Glycogen-targeting subunits of protein phosphatase-1, such as protein targeting to glycogen (PTG),direct the phosphatase to the glycogen particle, where it stimulates glycogenesis. We have investigat-ed the metabolic impact of overexpressing PTG in liver of normal rats. After administration of PTGcDNA in a recombinant adenovirus, animals were fasted or allowed to continue feeding for 24 hours.Liver glycogen was nearly completely depleted in fasted control animals, whereas glycogen levels infasted or fed PTG-overexpressing animals were 70% higher than in fed controls. Nevertheless, trans-genic animals regulated plasma glucose, triglycerides, FFAs, ketones, and insulin normally in the fast-ed and fed states. Fasted PTG-overexpressing animals receiving an oral bolus of [U-13C]glucose exhib-ited a large increase in hepatic glycogen content and a 70% increase in incorporation of [13C]glucoseinto glycogen. However, incorporation of labeled glucose accounted for only a small portion of theglycogen synthesized in PTG-overexpressing animals, consistent with our earlier finding that PTG pro-motes glycogen synthesis from gluconeogenic precursors. We conclude that hepatic PTG overexpres-sion activates both direct and indirect pathways of glycogen synthesis. Because of its ability to enhanceglucose storage without affecting other metabolic indicators, the glycogen-targeting subunit mayprove valuable in controlling blood glucose levels in diabetes.
J. Clin. Invest. 105:479–488 (2000).
bind to glycogen and to PP-1 and appear to facilitateregulation of enzymes of glycogen metabolism by thephosphatase (9–14). As found in this study and others(10–12, 15), at least 2 members of the glycogen-target-ing subunit gene family, PTG and GL, are expressed innormal liver. We have previously shown that overex-pression of PTG in normal hepatocytes causes a dra-matic enhancement in glycogen synthesis, in part viaincreasing the activity state of glycogen synthase (14).Conversely, streptozotocin-induced diabetes in rodentsis associated with a decline in glycogen content thatoccurs in concert with a reduction in glycogen-target-ing subunit expression in liver, without an effect on PP-1 levels, suggesting a key role for the former protein inregulation of hepatic glycogen metabolism (15). Thepurpose of the current study was to gain further under-standing of the regulatory potency of glycogen-target-ing subunits by evaluating the metabolic impact of PTGoverexpression in liver of normal rats.
MethodsAnimal maintenance and administration of recombinant aden-oviruses. All procedures were carried out in accordancewith animal care guidelines of the University of TexasSouthwestern Medical Center at Dallas and the Nation-al Research Council. Male Wistar rats (Charles River Lab-oratories, Wilmington, Massachusetts, USA) weighing200–250 g were housed on an 0900–2100 hour light cycleand were allowed free access to water and standard labo-ratory chow (Harlan Teklad Laboratory, Winfield, Iowa,USA; 65% carbohydrate, 11% fat, 24% protein) unless oth-erwise specified. The rats were housed under these con-ditions for 1 week before adenovirus administration.Recombinant adenoviruses containing the cDNAsencoding mouse PTG (AdCMV-PTG) (14) or β-galactosi-dase (AdCMV-βGAL) (16) were prepared, amplified, andpurified as described previously (17). Between 0.5 × 10¹²
and 1.0 × 10¹² recombinant adenovirus particles wereadministered via tail vein injection to rats anesthetizedwith a 50:5:1 mixture of ketamine (Avoco, Fort Dodge,Iowa, USA), Rompun (Avoco), and acepromazine (Haver,Shawnee, Kansas, USA), as described elsewhere (6, 18).After viral administration, animals were individuallycaged to allow monitoring of food intake and bodyweight before initiation of experiments.
Animal studies. Two experimental protocols were per-formed. In the first, animals were infused with either theAdCMV-PTG or AdCMV-βGAL viruses. Ninety hoursafter virus administration, animals were either fasted for24 hours or allowed to continue feeding ad libitum.Thereafter, all animals were anesthetized with Nembutal(50 µg/g body weight intraperitoneally; Abbott Labora-tories, North Chicago, Illinois, USA), blood samples weretaken, and liver and skeletal muscle were excised and rap-idly frozen in liquid nitrogen and stored at –70°C untilfurther analysis. In the second protocol, animals wereinfused with AdCMV-PTG or AdCMV-βGAL. Ninetyhours after virus administration, animals were fasted for24 hours with free access to water before administration
of a bolus of [U-13C]glucose (2 g/kg; enriched with[13C]glucose to 5%) by gavage (oral glucose tolerance test[OGTT]). Blood samples (approximately 20 µL/samplefrom the tail vein, except for a 200-µL sample at 180 min-utes to allow insulin assay) were collected immediatelybefore administration of the bolus and at 30, 60, 90, 120,150, and 180 minutes after the bolus to allow measure-ment of circulating glucose concentrations. Animals werekilled immediately after the 180-minute time point forcollection of liver, which was divided into 3 aliquots: 1 formeasurement of PTG mRNA, 1 for measurement ofglycogen content, and 1 for purification of glycogen toallow analysis of [13C]glucose incorporation (see later foranalytical procedures).
Measurement of expression of glycogen-targeting subunits in liverby semiquantitative multiplex RT-PCR. The procedure usedwas based on methods described previously by Jensen et al.(19). Total RNA was extracted from powdered liver tissueusing RNeasy spin columns (QIAGEN Inc., Valencia, Cal-ifornia, USA), following the manufacturer’s instructions.First-strand cDNA was prepared using 1 µg total RNA, theSuperscript RT kit, and random hexamer primers (GIBCOBRL, Gaithersburg, Maryland, USA), according to themanufacturer’s instructions. The cDNA was diluted 1:6 indistilled water, and PCR was carried out using 3 µL of thediluted cDNA and a PCR mix containing Taq DNA poly-merase (2.5 U) and buffer (Promega Corp., Madison, Wis-consin, USA), dNTP mix (final concentrations of 40 mMof each dNTP, except dCTP, which was present at 20 mM[GIBCO BRL]), and 1.25 µCi of [α-33P]-dCTP (2,000Ci/mmol; Du Pont NEN Research Products, Boston,Massachusetts, USA) in a 25-µL reaction volume, using aprotocol provided by Promega. For studies of glycogen-tar-geting subunit expression, 3 primer sets (5 pmol of eachprimer) were included in each reaction, 1 set specific formouse PTG, amplifying a 188-bp PCR fragment, the sec-ond set specific for rat GL, amplifying a 232-bp PCR frag-ment, and the third set specific for elongation factor–1α(EF-1α), amplifying a 201-bp PCR fragment, serving as theinternal standard (see Table 1 for primer sequences andaccession numbers). PCR conditions were an initial incu-bation at 95°C for 5–6 minutes, at which time the cDNAwas added to the hot PCR mix (“hotstart” procedure). Thiswas followed by 22 cycles of 94°C for 45 seconds, 55°C for45 seconds, and 72°C for 45 seconds. The final PCR reac-tions were mixed with 98% formamide denaturing loadingbuffer and separated on a 6% (wt/vol) polyacrylamide gel,containing 7 M urea. The gel was subsequently dried andexposed to a phosphorimager screen, and the resultingscan was analyzed using ImageQuant from MolecularDynamics (Sunnyvale, California, USA). Identical condi-tions and methods were used for studies of the expressionof the gluconeogenic enzymes G6Pase (catalytic subunit),pyruvate carboxylase, and phosphoenolpyruvate car-boxykinase, using primers shown in Table 1.
To be able to analyze specifically the expression ofendogenous rat PTG, it was necessary to clone a fragmentof its cDNA, as the rat PTG sequence is not known. Sev-eral primer sets to the mouse PTG sequence were gener-
480 The Journal of Clinical Investigation | February 2000 | Volume 105 | Number 4
ated. One primer set was found to ampli-fy rat PTG and resulted in the isolationand sequencing of a 334-bp fragment bystandard techniques. This fragment cor-responded to nucleotides 59–393 of themouse PTG sequence (12). By aligning themouse and rat PTG sequences, primer setsspecific for the endogenous (rat) andtransgene (mouse) forms of PTG wereidentified (Figure 1). These primer setswere chosen such that they amplifiedbands of different size (152 bp for rat PTGversus 188 bp for mouse PTG), enablingunequivocal identification and quantifi-cation of the products. Endogenous GL could be detect-ed at 22 cycles, but for quantitative analysis of endoge-nous GL and PTG in fasted and fed rats, multiplex-PCRwas performed using 24 cycles and the procedures alreadydescribed here. For studies of endogenous PTG and GL
expression done at 24 cycles, TATA box binding protein(TBP) was used as the internal standard, using primersthat amplify a 186-bp PCR fragment (Table 1).
The contribution of oral glucose to total glycogen synthesis ana-lyzed by nuclear magnetic resonance spectroscopy. [13C] nuclearmagnetic resonance (NMR) spectroscopy was used toquantify the excess 13C enrichment in the glucosyl unitsof glycogen after oral administration of 5%-enriched [U-13C6]glucose. Glycogen was purified from liver samples asdescribed previously (20). The ratio of excess 13C enrich-ment in glycogen to that of oral glucose was used todetermine the fraction of glycogen synthesized from oralglucose. A total of 30–50 mg of purified glycogen was dis-persed in 5 mL of 10 mM sodium acetate buffer [pH 4.5]containing 20 units of amyloglucosidase. The sample wasincubated at 55°C for 2 hours, resulting in completehydrolysis of glycogen to glucose. The protein was pre-cipitated by adding 0.5 mL of 70% perchloric acid, fol-lowed by centrifugation at 12,000 g, and adjustment ofthe pH of the supernatant to 7.0 with KOH. The insolu-ble potassium perchlorate was removed by centrifuga-tion, and the supernatant was lyophilized and redissolvedin 0.6 mL D2O for NMR analysis. Proton decoupled[13C]NMR spectra of extracts were obtained with a Vari-an Inova 14.1 T spectrometer (Palo Alto, California, USA)operating at 150.9 MHz and equipped with a 5-mmbroadband probe. Spectra were acquired with 2,000 scansas described previously (21), and the free-inductiondecays were processed with 0.5 Hz exponential multipli-cation before Fourier transformation. The areas of 13Cresonances were quantified by a curve-fitting program(NUTS; Acorn NMR, Fremont, California, USA). Excess13C enrichment of glucose was measured from the[13C]NMR spectrum of carbon 1 using the method ofBrainard et al. (22). The singlet resonance was assumedto reflect the natural abundance of 13C at 1.1% enrich-ment, and the multiplets arising from 13C-13C spin-spincoupling reflect the excess enrichment from [U-13C6]glu-cose and from [1,2-13C2] and [1,2,3-13C3]glucose. The par-tially labeled glucose molecules are generated from gly-
colysis of [U-13C6]glucose to [U-13C3] pyruvate followedby gluconeogenic incorporation of [U-13C3]pyruvate intoglycogen (23). Therefore, the [13C1]multiplet representsthe incorporation of oral [U-13C]glucose into hepaticglycogen by both direct and gluconeogenic pathways.Calculation of the amount of [13C]glucose incorporatedinto glycogen was made as follows: [13C]glucose incorpo-ration into glycogen = (area of 13C1-multiplet/area of13C1-singlet) × 0.011. The percentage of glycogen origi-nating from oral glucose (% total) was calculated as: %total = excess enrichment glycogen C1/excess enrichmentoral glucose C1. Finally, the absolute amount of glycogenoriginating from oral glucose was calculated as: % total ×mass of glycogen synthesized during the OGTT.
The Journal of Clinical Investigation | February 2000 | Volume 105 | Number 4 481
Figure 1Alignment of the partial cDNA sequences of rat and mouse PTG. Ver-tical lines between the 2 sequences indicate identical nucleotides,and horizontal lines indicate nonidentical nucleotides. The oligonu-cleotide pairs used for amplification of endogenous rat PTG areshown in bold in the rat PTG sequence with a single underline. Theoligonucleotide pairs used for amplification of the mouse PTG trans-gene are shown in bold in the mouse PTG sequence with a doubleunderline. The numbering indicates that nucleotide 1 of the rat PTGsequence (cloned in this study) corresponds to nucleotide 59 of thepublished mouse PTG sequence (12).
Table 1Sequences and accession numbers for oligonucleotide primers used for multiplex RT-PCR experiments in this study
rGL, rat GL; rPTG, rat PTG; mPTG, mouse PTG; PEPCK, phosphoenolpyruvate carboxykinase;PC, pyruvate carboxylase.
Plasma and tissue analysis. Plasma insulin levels weremeasured by RIA (Linco Research, St. Charles, Missouri,USA). Plasma triglycerides, FFAs, ketones, and lactatewere measured using kits (Sigma Chemical Co., St. Louis,Missouri, USA). Plasma glucose was measured using aHemoCue Glucose Analyzer (HemoCue AB, Angelholm,Sweden). Glycogen content was measured by an amy-loglucosidase-based assay, as described elsewhere (20).
Statistical analysis. Data are expressed as the mean ± SEM.Statistical significance was determined by unpaired Stu-dent’s t test using the statistics module of Microsoft Excel(version 5.0; Microsoft Corp., Redmond, Washington,USA). Statistical significance was assumed at P < 0.05.
ResultsExpression of glycogen-targeting subunits in rat liver. In the firstprotocol of this study, animals were infused with eitherthe AdCMV-PTG or AdCMV-βGAL viruses. Ninety hoursafter virus administration, animals were either fasted for24 hours or allowed to continue feeding ad libitum.Thereafter, blood samples were drawn and the animalswere sacrificed for collection of liver and muscle samples.The first goal of this study was to evaluate expression of
endogenous and exogenous genes encoding glycogen-tar-geting subunits of PP-1 in liver of fasted and fed rats. Thiswas accomplished by a multiplex RT-PCR strategy per-formed in 2 phases. In the first phase, we evaluated theexpression of the endogenous glycogen-targeting subunitgenes, based on previous reports of hepatic expression of2 members of the family, protein targeting to glycogen orPTG (11, 12) and GL (10, 15). The expression of these 2genes was measured semiquantitatively by simultaneousinclusion of oligonucleotide pairs specific for rat GL, ratPTG, and an internal standard, TBP. Because only thesequences of mouse (12) and human (11) PTG wereknown, it was first necessary for us to clone a fragment ofthe rat PTG cDNA in order to identify unequivocallyoligonucleotide primers that would be specific for theendogenous rat gene product. This was accomplished byRT-PCR, and an alignment of 334-bp fragments of the ratand mouse PTG sequences is presented in Figure 1. In thesecond phase, transgene expression was analyzed in RNAsamples from the same fasted and fed rats analyzed in thefirst phase by inclusion of oligonucleotide pairs specificfor mouse PTG (note that the AdCMV-PTG virus con-tains the cDNA encoding mouse PTG [14]) and, for stan-dardization, EF-1α. The primers for rat GL were alsoincluded in this study to allow comparison of transgeneexpression with the level of 1 of the endogenous glyco-gen-targeting subunit gene products.
Expression of the endogenous gene products is sum-marized in Figure 2. Fasted rats expressed both PTG andGL in liver, but PTG expression was 2.6 times higher thanGL, when the 2 signals were normalized to the same inter-nal standard. Analysis of liver samples from fed ratsrevealed a 50% increase in PTG expression and a 300%increase in GL expression relative to fasted animals. Therelative expression levels of PTG and GL and the changesthat occurred between fasted and fed states were notaffected by the type of adenovirus that was administered,proving that the oligonucleotides used to amplify ratPTG did not cross-react with mouse PTG. Based on thisfinding, data from all fasted and fed animals were pooledto produce the results shown in Figure 2.
Expression of the mouse PTG transgene is shown inFigure 3. Note that we have previously shown that admin-istration of recombinant viruses by systemic infusioninto rats results in preferential expression of transgenesin liver, with no detectable expression in muscle, pan-creas, brain, spleen, or adipose tissue, and very low levelsof expression in lung (5, 6). These findings are similar tothose reported for other rodent species (16). On the basisof these results, we have limited our analysis of transgeneexpression to liver in the current study.
Animals that received the AdCMV-βGAL virus (fastedand fed) contained only background signal at the posi-tion expected for the amplified mouse PTG-derived prod-uct (188 bp). Of the 8 fasted rats that received theAdCMV-PTG virus, 5 exhibited a strong increase in PTGmRNA levels (high expressers), whereas 3 had lower lev-els of expression (low expressers). Of the 12 fed rats thatreceived the AdCMV-PTG virus, 4 clearly overexpressed
482 The Journal of Clinical Investigation | February 2000 | Volume 105 | Number 4
Figure 2Expression of endogenous forms of glycogen-targeting subunits in liverof fasted and fed rats. Animals received either the AdCMV-βGAL orAdCMV-PTG adenoviruses. Ninety hours after viral administration,animals were either allowed to continue feeding ad libitum or werefasted for 24 hours. Multiplex RT-PCR was performed on liver RNAsamples from these animals to evaluate the levels of endogenous ratGL and rat PTG mRNA as function of fasting and feeding. Because thetype of virus infused had no impact on endogenous GL or PTG expres-sion, data from all fasted and fed animals were pooled. (a) Three rep-resentative samples for each group are displayed, showing amplifica-tion products for rat GL, rat PTG, and the internal standard, TBP. (b)Quantitative analysis of the ratios of PTG/TBP and GL/TBP signals (seesymbol legends in b) was performed on all samples by exposing gels toa phosphorimager screen and processing the resulting scan withImageQuant. Data represent the mean ± SEM for 13 fed and 9 fastedanimals. AThe PTG/TBP ratio in fasted animals was significantly high-er than the GL/TBP ratio in fasted animals (P < 0.001). BThe ratio ofPTG/TBP increased significantly in fed compared with fasted animals(P = 0.024). CThe ratio of GL/TBP increased significantly in fed com-pared with fasted animals (P < 0.001).
the gene (high expressers), and 8 contained low levels ofmouse PTG in liver (low expressers). Figure 3a shows 3representative PCR samples from each of the aforemen-tioned groups (fed and fasted AdCMV-βGAL–treated ani-mals, AdCMV-PTG–treated low expressers, and AdCMV-PTG–treated high expressers). Scanning of all samplesfrom each group revealed a mean increase in PTG/EF-1αsignal intensity of 39-fold in the 5 fasted high expressers,and 34-fold in the 4 fed high-expresser rats, relative to thebackground signal at the same position in samples fromfasted and fed AdCMV-βGAL–treated controls, respec-tively (Figure 3b). The fasted high expressers contained3.5 times more PTG signal than fasted low expressers,whereas the fed high expressers had 15.7 times more PTGsignal than fed low expressers. Finally, in the fed highexpressers, levels of PTG mRNA exceeded the levels ofendogenous GL by approximately 12.5-fold, indicatingthat the transgene was the dominant form of glycogen-targeting subunit present in high-expresser animals (datanot shown). The same pattern of PTG expression wasconfirmed by RNAse protection analysis on a subset ofthe RNA samples (data not shown).
Effects of PTG overexpression on liver glycogen in fasted andfed rats. We have previously reported that overexpressionof PTG in hepatocytes isolated from fasted rats causes alarge increase in glycogen accumulation, even when thesecells are cultured in the absence of glucose (14). We alsoshowed that activation of glycogenolysis by agents suchas forskolin and glucagon was impaired in PTG-overex-pressing hepatocytes (14). We therefore investigated theeffect of PTG overexpression on liver glycogen metabo-lism in fed and fasted rats.
As shown in Figure 4, AdCMV-βGAL–infused rats con-tained high levels of liver glycogen when allowed to feedad libitum (156 ± 15 µg glycogen per milligram of pro-tein), whereas liver glycogen was almost completelydepleted by fasting of this control group for 24 hours, theexpected pattern for normal animals (20). In sharp con-trast, animals with clear hepatic overexpression of PTG(high expressers) experienced no depletion of hepaticglycogen stores during fasting. Interestingly, fed and fast-
ed high overexpressers had nearly identical hepatic glyco-gen levels (257 ± 32 and 249 ± 35 µg glycogen per mil-ligram protein, respectively), these values being 70% high-er than in liver of fed control animals (P = 0.015). Theseeffects seemed to require a threshold of PTG overexpres-sion, as animals that were treated with AdCMV-PTG butthat were low expressers based on the analysis shown inFigure 3 experienced no increase in glycogen content inthe fed state and a modest increase in the fasted state rel-ative to AdCMV-βGAL controls. Muscle glycogen wasalso measured. Levels of 32.1 ± 2.1, 32.1 ± 1.5, and 37.3 ±3.5 µg glycogen per milligram of protein were measuredin high expressers, low expressers, and AdCMV-βGAL–treated fed rats, respectively, and 17.1, 21.5, and
The Journal of Clinical Investigation | February 2000 | Volume 105 | Number 4 483
Figure 3Expression of the mouse PTG transgene in liver, fasted/fed protocol. Ani-mals received either the AdCMV-βGAL or AdCMV-PTG adenoviruses.Ninety hours after viral administration, animals were either allowed tocontinue feeding ad libitum or were fasted for 24 hours. Multiplex RT-PCR was performed on liver RNA samples from these animals. Inspec-tion of the data revealed that AdCMV-PTG–treated animals could be seg-regated into high-expresser (high) and low-expresser (low) groups. (a)Three representative samples for each group are displayed, showingamplification products for the mouse PTG transgene and the internalstandard EF-1α. (b) Quantitative analysis of the ratio of PTG/EF-1α sig-nals was performed on all samples by exposing gels to a phosphorim-ager screen, and processing the resulting scan with ImageQuant. Datarepresent the mean ± SEM for the following number of samples: fed PTGhigh expressers, n = 4; fed PTG low expressers, n = 8; fed βGAL controls,n = 6; fasted PTG high expressers, n = 5; fasted PTG low expressers, n =3; fasted βGAL controls, n = 5. AValues were greater than in the βGALcontrol group (P < 0.001). BValues were greater in PTG high expressersthan in PTG low expressers (P < 0.001).
Figure 4Liver glycogen levels in fasted and ad libitum–fed rats. Animals weretreated as described in the legend to Figure 3, and liver samples wereused for measurement of glycogen content. Data represent the mean± SEM, and the experimental groups and the number of animals ineach group are as described in the legend to Figure 3. ALiver glycogenwas significantly higher in the PTG high expressers than in either thePTG low expressers or βGAL controls (P < 0.001). BLiver glycogenwas significantly higher in the fasted PTG low-expresser group thanin the fasted βGAL control group (P < 0.001).
19.7 µg/mg protein in high expressers, low expressers,and AdCMV-βGAL–fasted rats, respectively. These datademonstrate that PTG overexpression in liver was with-out effect on muscle glycogen metabolism and did notdivert glucose storage from the periphery to the liver.
PTG overexpression does not perturb homeostasis of key circu-lating fuels. We have previously shown that adenovirus-mediated overexpression of glucokinase in liver results inlowered blood glucose concentrations and increasedhepatic glycogen storage, but also undesired increases incirculating FFAs and triglycerides (TGs) (6). We thereforeinvestigated whether PTG overexpression caused anychanges in circulating metabolite and hormone levels inthe same fasted and fed animals analyzed in the forego-ing figures. As shown in Table 2, normal changes inserum variables were noted in PTG high expressers com-pared with either PTG low expressers or AdCMV-βGAL–infused control animals in response to fasting andfeeding. Thus, plasma glucose, TG, and insulin were low-ered in all groups of fasted animals, whereas FFA andketones were increased. Neither the type of virus admin-
istered nor the extent of PTG overexpression had any sig-nificant effect on these metabolic variables in either thefasted or fed states. Thus, PTG overexpression in liverenhances hepatic glucose clearance and storage withoutaffecting other key metabolic indicators.
OGTT in normal rats with adenovirus-mediated PTG overex-pression in liver. Although no obvious changes in blood glu-cose levels were detected in fasted or ad libitum–fed ratswith overexpressed PTG in liver (Table 2), the largeincrease in glycogen storage in these animals suggestedthat disposal of glucose during an OGTT might bealtered. To test this idea, normal rats received either theAdCMV-βGAL or AdCMV-PTG viruses by systemic infu-sion. After 90 hours of ad libitum feeding, the animalswere fasted for a period of 24 hours before administrationof a bolus of 13C-enriched glucose (2 g/kg; enriched with[13C]glucose to 5%) by gavage. At 180 minutes after theoral glucose bolus, animals were sacrificed for collectionof the liver, which was aliquoted into 3 portions: 1 foranalysis of PTG mRNA, 1 for analysis of glycogen content,and 1 for purification of liver glycogen to allow NMRanalysis of [13C]glucose incorporation into glycogen.
Levels of PTG RNA were analyzed in animals thatreceived the AdCMV-βGAL or AdCMV-PTG aden-oviruses using the multiplex RT-PCR assay. Animals thatreceived AdCMV-βGAL did not express the mouse PTGtransgene product. Similar to the first protocol, 9 (56%)of 16 animals treated with AdCMV-PTG showed clearevidence of expression of PTG RNA, whereas the other 7animals showed either no detectable overexpression ofthe transgene or a modest increase (representative sam-ples are shown in Figure 5a). Scanning of samples fromall animals in the OGTT study revealed 25-fold and 7-fold overexpression of PTG in high expressers relative tothe background signal in samples from AdCMV-βGAL–treated animals, and the low signal in AdCMV-PTG low expressers, respectively (Figure 5b). Based onthe findings of negligible metabolic effects of low levelsof PTG overexpression in the first protocol of this study,the AdCMV-βGAL–treated and AdCMV-PTG lowexpressers were pooled as the control group for the sec-ond protocol (OGTT). Because the samples analyzed inFigures 3 and 5 were amplified at the same time, run onthe same gel, and normalized against the same internalstandard (EF-1α), we can conclude that levels of PTGoverexpression were similar in the high-expresser groupsof fasted, fed, and OGTT animals.
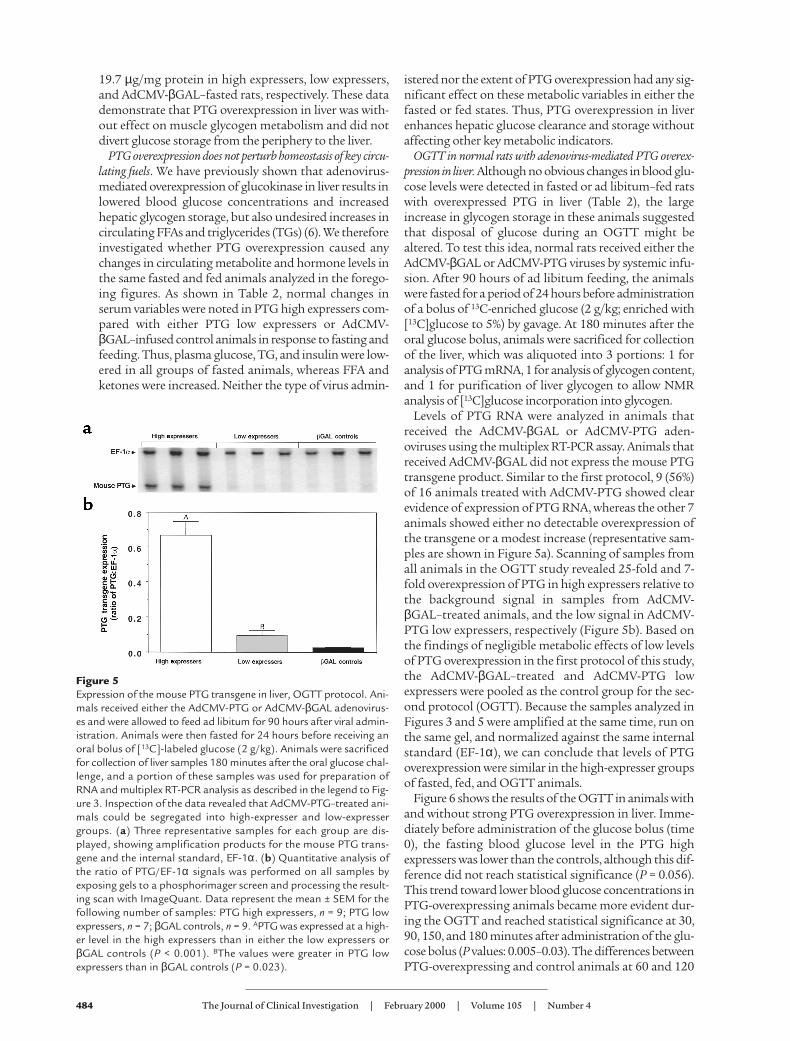
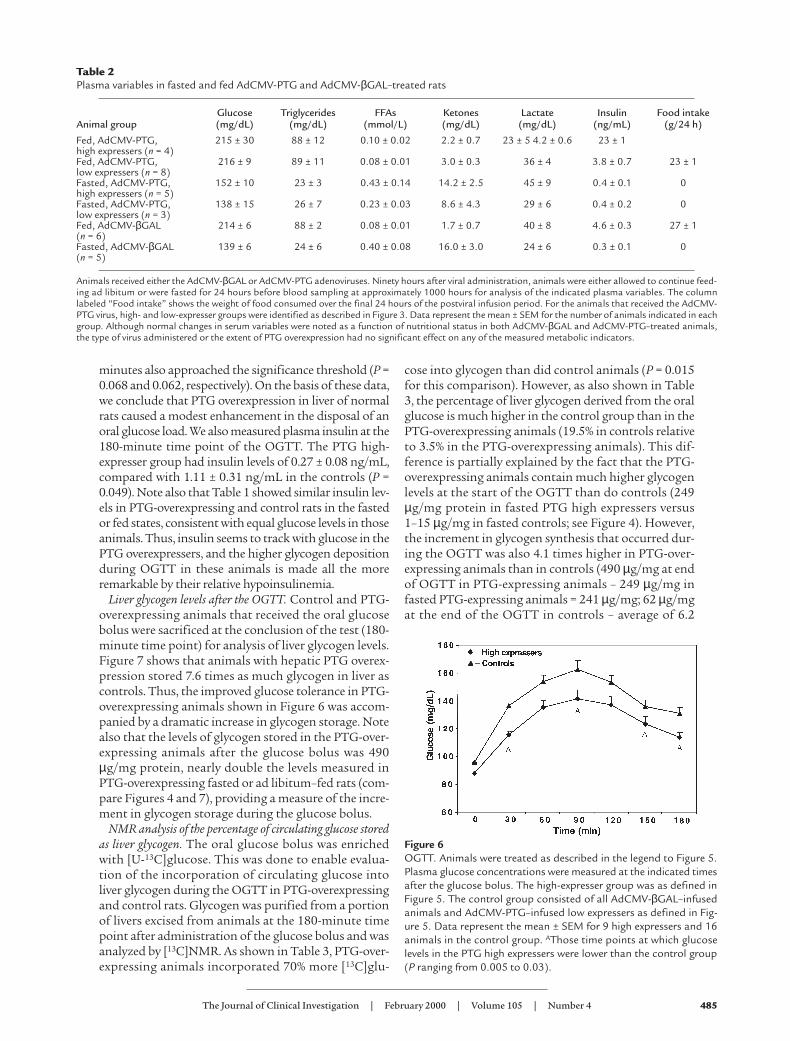
Figure 6 shows the results of the OGTT in animals withand without strong PTG overexpression in liver. Imme-diately before administration of the glucose bolus (time0), the fasting blood glucose level in the PTG highexpressers was lower than the controls, although this dif-ference did not reach statistical significance (P = 0.056).This trend toward lower blood glucose concentrations inPTG-overexpressing animals became more evident dur-ing the OGTT and reached statistical significance at 30,90, 150, and 180 minutes after administration of the glu-cose bolus (P values: 0.005–0.03). The differences betweenPTG-overexpressing and control animals at 60 and 120
484 The Journal of Clinical Investigation | February 2000 | Volume 105 | Number 4
Figure 5Expression of the mouse PTG transgene in liver, OGTT protocol. Ani-mals received either the AdCMV-PTG or AdCMV-βGAL adenovirus-es and were allowed to feed ad libitum for 90 hours after viral admin-istration. Animals were then fasted for 24 hours before receiving anoral bolus of [13C]-labeled glucose (2 g/kg). Animals were sacrificedfor collection of liver samples 180 minutes after the oral glucose chal-lenge, and a portion of these samples was used for preparation ofRNA and multiplex RT-PCR analysis as described in the legend to Fig-ure 3. Inspection of the data revealed that AdCMV-PTG–treated ani-mals could be segregated into high-expresser and low-expressergroups. (a) Three representative samples for each group are dis-played, showing amplification products for the mouse PTG trans-gene and the internal standard, EF-1α. (b) Quantitative analysis ofthe ratio of PTG/EF-1α signals was performed on all samples byexposing gels to a phosphorimager screen and processing the result-ing scan with ImageQuant. Data represent the mean ± SEM for thefollowing number of samples: PTG high expressers, n = 9; PTG lowexpressers, n = 7; βGAL controls, n = 9. APTG was expressed at a high-er level in the high expressers than in either the low expressers orβGAL controls (P < 0.001). BThe values were greater in PTG lowexpressers than in βGAL controls (P = 0.023).
minutes also approached the significance threshold (P =0.068 and 0.062, respectively). On the basis of these data,we conclude that PTG overexpression in liver of normalrats caused a modest enhancement in the disposal of anoral glucose load. We also measured plasma insulin at the180-minute time point of the OGTT. The PTG high-expresser group had insulin levels of 0.27 ± 0.08 ng/mL,compared with 1.11 ± 0.31 ng/mL in the controls (P =0.049). Note also that Table 1 showed similar insulin lev-els in PTG-overexpressing and control rats in the fastedor fed states, consistent with equal glucose levels in thoseanimals. Thus, insulin seems to track with glucose in thePTG overexpressers, and the higher glycogen depositionduring OGTT in these animals is made all the moreremarkable by their relative hypoinsulinemia.
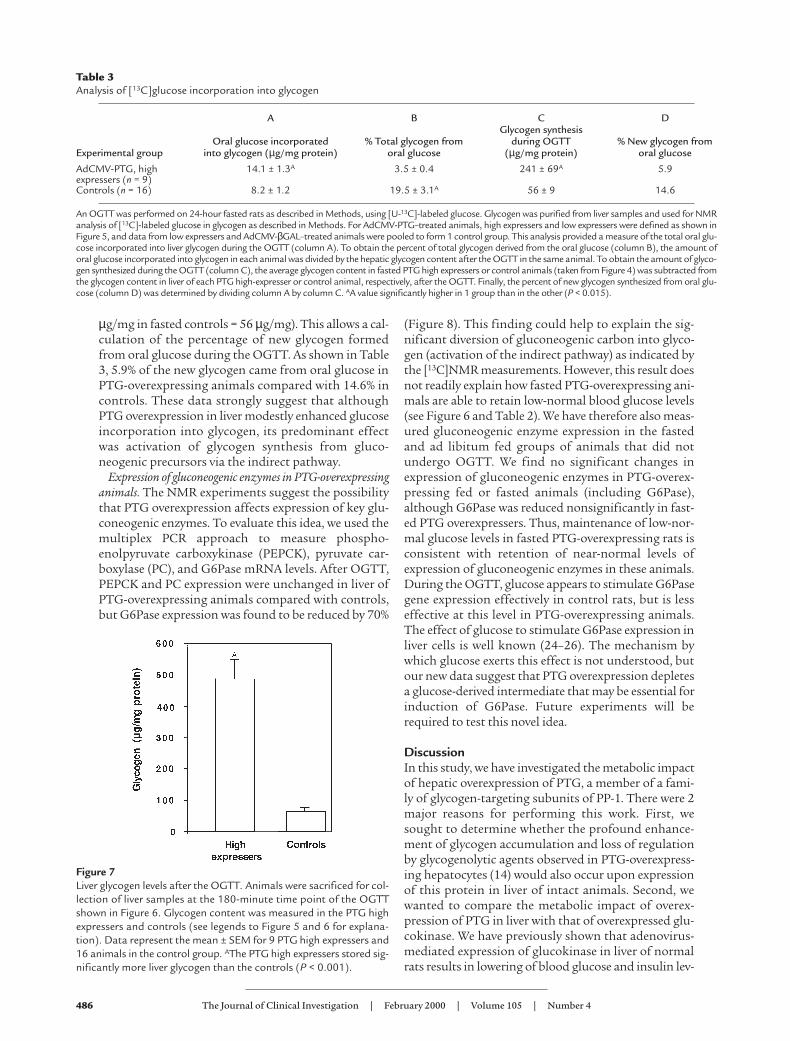
Liver glycogen levels after the OGTT. Control and PTG-overexpressing animals that received the oral glucosebolus were sacrificed at the conclusion of the test (180-minute time point) for analysis of liver glycogen levels.Figure 7 shows that animals with hepatic PTG overex-pression stored 7.6 times as much glycogen in liver ascontrols. Thus, the improved glucose tolerance in PTG-overexpressing animals shown in Figure 6 was accom-panied by a dramatic increase in glycogen storage. Notealso that the levels of glycogen stored in the PTG-over-expressing animals after the glucose bolus was 490µg/mg protein, nearly double the levels measured inPTG-overexpressing fasted or ad libitum–fed rats (com-pare Figures 4 and 7), providing a measure of the incre-ment in glycogen storage during the glucose bolus.
NMR analysis of the percentage of circulating glucose storedas liver glycogen. The oral glucose bolus was enrichedwith [U-13C]glucose. This was done to enable evalua-tion of the incorporation of circulating glucose intoliver glycogen during the OGTT in PTG-overexpressingand control rats. Glycogen was purified from a portionof livers excised from animals at the 180-minute timepoint after administration of the glucose bolus and wasanalyzed by [13C]NMR. As shown in Table 3, PTG-over-expressing animals incorporated 70% more [13C]glu-
cose into glycogen than did control animals (P = 0.015for this comparison). However, as also shown in Table3, the percentage of liver glycogen derived from the oralglucose is much higher in the control group than in thePTG-overexpressing animals (19.5% in controls relativeto 3.5% in the PTG-overexpressing animals). This dif-ference is partially explained by the fact that the PTG-overexpressing animals contain much higher glycogenlevels at the start of the OGTT than do controls (249µg/mg protein in fasted PTG high expressers versus1–15 µg/mg in fasted controls; see Figure 4). However,the increment in glycogen synthesis that occurred dur-ing the OGTT was also 4.1 times higher in PTG-over-expressing animals than in controls (490 µg/mg at endof OGTT in PTG-expressing animals – 249 µg/mg infasted PTG-expressing animals = 241 µg/mg; 62 µg/mgat the end of the OGTT in controls – average of 6.2
The Journal of Clinical Investigation | February 2000 | Volume 105 | Number 4 485
Figure 6OGTT. Animals were treated as described in the legend to Figure 5.Plasma glucose concentrations were measured at the indicated timesafter the glucose bolus. The high-expresser group was as defined inFigure 5. The control group consisted of all AdCMV-βGAL–infusedanimals and AdCMV-PTG–infused low expressers as defined in Fig-ure 5. Data represent the mean ± SEM for 9 high expressers and 16animals in the control group. AThose time points at which glucoselevels in the PTG high expressers were lower than the control group(P ranging from 0.005 to 0.03).
Table 2Plasma variables in fasted and fed AdCMV-PTG and AdCMV-βGAL–treated rats
Animals received either the AdCMV-βGAL or AdCMV-PTG adenoviruses. Ninety hours after viral administration, animals were either allowed to continue feed-ing ad libitum or were fasted for 24 hours before blood sampling at approximately 1000 hours for analysis of the indicated plasma variables. The columnlabeled “Food intake” shows the weight of food consumed over the final 24 hours of the postviral infusion period. For the animals that received the AdCMV-PTG virus, high- and low-expresser groups were identified as described in Figure 3. Data represent the mean ± SEM for the number of animals indicated in eachgroup. Although normal changes in serum variables were noted as a function of nutritional status in both AdCMV-βGAL and AdCMV-PTG–treated animals,the type of virus administered or the extent of PTG overexpression had no significant effect on any of the measured metabolic indicators.
µg/mg in fasted controls = 56 µg/mg). This allows a cal-culation of the percentage of new glycogen formedfrom oral glucose during the OGTT. As shown in Table3, 5.9% of the new glycogen came from oral glucose inPTG-overexpressing animals compared with 14.6% incontrols. These data strongly suggest that althoughPTG overexpression in liver modestly enhanced glucoseincorporation into glycogen, its predominant effectwas activation of glycogen synthesis from gluco-neogenic precursors via the indirect pathway.
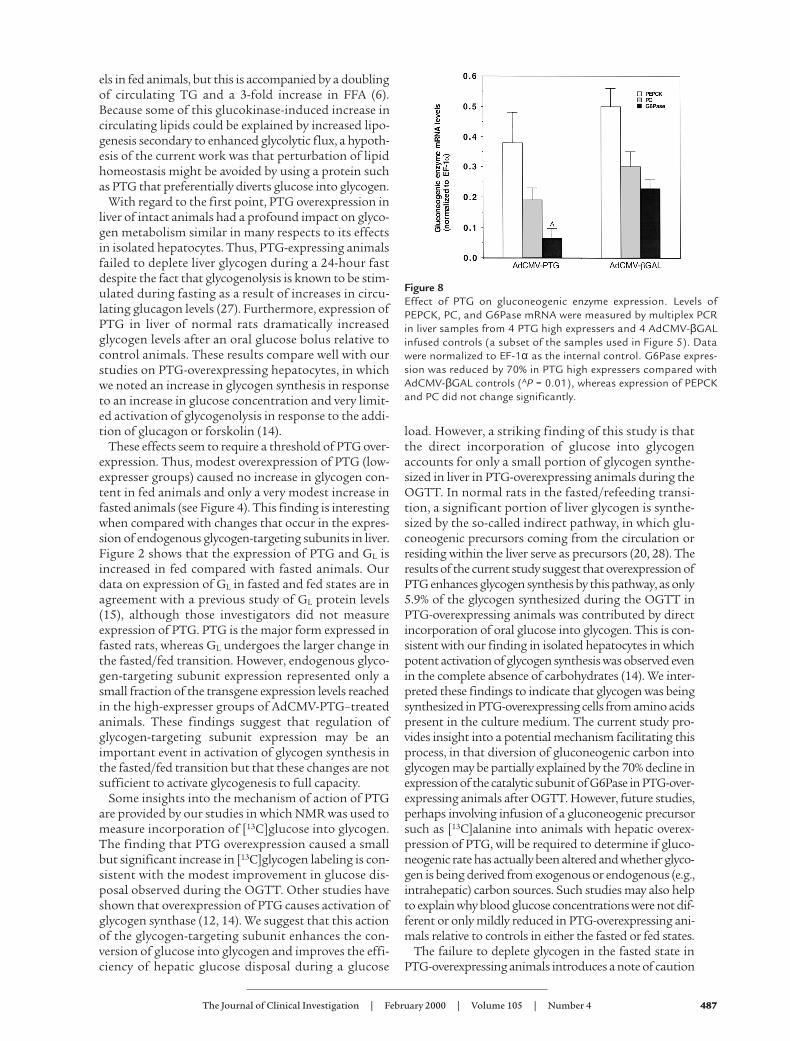
Expression of gluconeogenic enzymes in PTG-overexpressinganimals. The NMR experiments suggest the possibilitythat PTG overexpression affects expression of key glu-coneogenic enzymes. To evaluate this idea, we used themultiplex PCR approach to measure phospho-enolpyruvate carboxykinase (PEPCK), pyruvate car-boxylase (PC), and G6Pase mRNA levels. After OGTT,PEPCK and PC expression were unchanged in liver ofPTG-overexpressing animals compared with controls,but G6Pase expression was found to be reduced by 70%
(Figure 8). This finding could help to explain the sig-nificant diversion of gluconeogenic carbon into glyco-gen (activation of the indirect pathway) as indicated bythe [13C]NMR measurements. However, this result doesnot readily explain how fasted PTG-overexpressing ani-mals are able to retain low-normal blood glucose levels(see Figure 6 and Table 2). We have therefore also meas-ured gluconeogenic enzyme expression in the fastedand ad libitum fed groups of animals that did notundergo OGTT. We find no significant changes inexpression of gluconeogenic enzymes in PTG-overex-pressing fed or fasted animals (including G6Pase),although G6Pase was reduced nonsignificantly in fast-ed PTG overexpressers. Thus, maintenance of low-nor-mal glucose levels in fasted PTG-overexpressing rats isconsistent with retention of near-normal levels ofexpression of gluconeogenic enzymes in these animals.During the OGTT, glucose appears to stimulate G6Pasegene expression effectively in control rats, but is lesseffective at this level in PTG-overexpressing animals.The effect of glucose to stimulate G6Pase expression inliver cells is well known (24–26). The mechanism bywhich glucose exerts this effect is not understood, butour new data suggest that PTG overexpression depletesa glucose-derived intermediate that may be essential forinduction of G6Pase. Future experiments will berequired to test this novel idea.
DiscussionIn this study, we have investigated the metabolic impactof hepatic overexpression of PTG, a member of a fami-ly of glycogen-targeting subunits of PP-1. There were 2major reasons for performing this work. First, wesought to determine whether the profound enhance-ment of glycogen accumulation and loss of regulationby glycogenolytic agents observed in PTG-overexpress-ing hepatocytes (14) would also occur upon expressionof this protein in liver of intact animals. Second, wewanted to compare the metabolic impact of overex-pression of PTG in liver with that of overexpressed glu-cokinase. We have previously shown that adenovirus-mediated expression of glucokinase in liver of normalrats results in lowering of blood glucose and insulin lev-
486 The Journal of Clinical Investigation | February 2000 | Volume 105 | Number 4
Figure 7Liver glycogen levels after the OGTT. Animals were sacrificed for col-lection of liver samples at the 180-minute time point of the OGTTshown in Figure 6. Glycogen content was measured in the PTG highexpressers and controls (see legends to Figure 5 and 6 for explana-tion). Data represent the mean ± SEM for 9 PTG high expressers and16 animals in the control group. AThe PTG high expressers stored sig-nificantly more liver glycogen than the controls (P < 0.001).
Table 3Analysis of [13C]glucose incorporation into glycogen
A B C DGlycogen synthesis
Oral glucose incorporated % Total glycogen from during OGTT % New glycogen fromExperimental group into glycogen (µg/mg protein) oral glucose (µg/mg protein) oral glucose
An OGTT was performed on 24-hour fasted rats as described in Methods, using [U-13C]-labeled glucose. Glycogen was purified from liver samples and used for NMRanalysis of [13C]-labeled glucose in glycogen as described in Methods. For AdCMV-PTG–treated animals, high expressers and low expressers were defined as shown inFigure 5, and data from low expressers and AdCMV-βGAL–treated animals were pooled to form 1 control group. This analysis provided a measure of the total oral glu-cose incorporated into liver glycogen during the OGTT (column A). To obtain the percent of total glycogen derived from the oral glucose (column B), the amount oforal glucose incorporated into glycogen in each animal was divided by the hepatic glycogen content after the OGTT in the same animal. To obtain the amount of glyco-gen synthesized during the OGTT (column C), the average glycogen content in fasted PTG high expressers or control animals (taken from Figure 4) was subtracted fromthe glycogen content in liver of each PTG high-expresser or control animal, respectively, after the OGTT. Finally, the percent of new glycogen synthesized from oral glu-cose (column D) was determined by dividing column A by column C. AA value significantly higher in 1 group than in the other (P < 0.015).
els in fed animals, but this is accompanied by a doublingof circulating TG and a 3-fold increase in FFA (6).Because some of this glucokinase-induced increase incirculating lipids could be explained by increased lipo-genesis secondary to enhanced glycolytic flux, a hypoth-esis of the current work was that perturbation of lipidhomeostasis might be avoided by using a protein suchas PTG that preferentially diverts glucose into glycogen.
With regard to the first point, PTG overexpression inliver of intact animals had a profound impact on glyco-gen metabolism similar in many respects to its effectsin isolated hepatocytes. Thus, PTG-expressing animalsfailed to deplete liver glycogen during a 24-hour fastdespite the fact that glycogenolysis is known to be stim-ulated during fasting as a result of increases in circu-lating glucagon levels (27). Furthermore, expression ofPTG in liver of normal rats dramatically increasedglycogen levels after an oral glucose bolus relative tocontrol animals. These results compare well with ourstudies on PTG-overexpressing hepatocytes, in whichwe noted an increase in glycogen synthesis in responseto an increase in glucose concentration and very limit-ed activation of glycogenolysis in response to the addi-tion of glucagon or forskolin (14).
These effects seem to require a threshold of PTG over-expression. Thus, modest overexpression of PTG (low-expresser groups) caused no increase in glycogen con-tent in fed animals and only a very modest increase infasted animals (see Figure 4). This finding is interestingwhen compared with changes that occur in the expres-sion of endogenous glycogen-targeting subunits in liver.Figure 2 shows that the expression of PTG and GL isincreased in fed compared with fasted animals. Ourdata on expression of GL in fasted and fed states are inagreement with a previous study of GL protein levels(15), although those investigators did not measureexpression of PTG. PTG is the major form expressed infasted rats, whereas GL undergoes the larger change inthe fasted/fed transition. However, endogenous glyco-gen-targeting subunit expression represented only asmall fraction of the transgene expression levels reachedin the high-expresser groups of AdCMV-PTG–treatedanimals. These findings suggest that regulation ofglycogen-targeting subunit expression may be animportant event in activation of glycogen synthesis inthe fasted/fed transition but that these changes are notsufficient to activate glycogenesis to full capacity.
Some insights into the mechanism of action of PTGare provided by our studies in which NMR was used tomeasure incorporation of [13C]glucose into glycogen.The finding that PTG overexpression caused a smallbut significant increase in [13C]glycogen labeling is con-sistent with the modest improvement in glucose dis-posal observed during the OGTT. Other studies haveshown that overexpression of PTG causes activation ofglycogen synthase (12, 14). We suggest that this actionof the glycogen-targeting subunit enhances the con-version of glucose into glycogen and improves the effi-ciency of hepatic glucose disposal during a glucose
load. However, a striking finding of this study is thatthe direct incorporation of glucose into glycogenaccounts for only a small portion of glycogen synthe-sized in liver in PTG-overexpressing animals during theOGTT. In normal rats in the fasted/refeeding transi-tion, a significant portion of liver glycogen is synthe-sized by the so-called indirect pathway, in which glu-coneogenic precursors coming from the circulation orresiding within the liver serve as precursors (20, 28). Theresults of the current study suggest that overexpression ofPTG enhances glycogen synthesis by this pathway, as only5.9% of the glycogen synthesized during the OGTT inPTG-overexpressing animals was contributed by directincorporation of oral glucose into glycogen. This is con-sistent with our finding in isolated hepatocytes in whichpotent activation of glycogen synthesis was observed evenin the complete absence of carbohydrates (14). We inter-preted these findings to indicate that glycogen was beingsynthesized in PTG-overexpressing cells from amino acidspresent in the culture medium. The current study pro-vides insight into a potential mechanism facilitating thisprocess, in that diversion of gluconeogenic carbon intoglycogen may be partially explained by the 70% decline inexpression of the catalytic subunit of G6Pase in PTG-over-expressing animals after OGTT. However, future studies,perhaps involving infusion of a gluconeogenic precursorsuch as [13C]alanine into animals with hepatic overex-pression of PTG, will be required to determine if gluco-neogenic rate has actually been altered and whether glyco-gen is being derived from exogenous or endogenous (e.g.,intrahepatic) carbon sources. Such studies may also helpto explain why blood glucose concentrations were not dif-ferent or only mildly reduced in PTG-overexpressing ani-mals relative to controls in either the fasted or fed states.
The failure to deplete glycogen in the fasted state inPTG-overexpressing animals introduces a note of caution
The Journal of Clinical Investigation | February 2000 | Volume 105 | Number 4 487
Figure 8Effect of PTG on gluconeogenic enzyme expression. Levels ofPEPCK, PC, and G6Pase mRNA were measured by multiplex PCRin liver samples from 4 PTG high expressers and 4 AdCMV-βGALinfused controls (a subset of the samples used in Figure 5). Datawere normalized to EF-1α as the internal control. G6Pase expres-sion was reduced by 70% in PTG high expressers compared withAdCMV-βGAL controls (AP = 0.01), whereas expression of PEPCKand PC did not change significantly.
in terms of considering this protein as a therapeutic tar-get for increasing the efficiency of hepatic glucose dispos-al. For example, it is possible that hypoglycemic episodeswould occur with longer periods of fasting or bouts ofexercise in PTG-overexpressing animals. One potentialapproach to resolving this problem is to use anothermember of the glycogen-targeting subunit family that ismore responsive to changes in physiological states. Inaddition to PTG, which is expressed in a wide variety of tis-sues, other members of the glycogen-targeting subunitgene family include GL, which is expressed primarily inliver (10), and GM, which is expressed primarily in skeletalmuscle and heart (9, 13). GM is phosphorylated on serine-46 in response to insulin (referring to the human GM
sequence), and this appears to enhance the capacity of theGM-PP1 complex to dephosphorylate and activate glyco-gen synthase, whereas β-adrenergic agonists cause phos-phorylation of serine-65, resulting in dissociation andinactivation of the GM-PP1 complex (29). GL lacks serine-46, and although it contains a serine at position 65, itappears not to be regulated by a phosphorylation/dephos-phorylation mechanism but is instead allosterically regu-lated by binding to phosphorylase a (10). Neither the hor-monal or allosteric mechanisms appear to be operative inPTG (11, 12). Thus, further studies will be required to testthe idea that expression of GM or GL might provide thebenefit of improved glucose disposal in the postprandialstate, without inappropriate sequestration of glycogenduring fasting.
Encouragement for continuing this line of investigationcomes from consideration of the relative lack of impact ofPTG overexpression on steady-state levels of circulatingmetabolites and hormones (Table 2). In particular, incomparison to our previous report on the metabolicimpact of glucokinase overexpression in liver (6), PTGexpression improves glucose tolerance in normal ratswithout increasing circulating FFA or TG. Thus, thenotion that PTG, and potentially other members of theglycogen-targeting subunit gene family, can enhance glu-cose uptake by specifically diverting glucose into glycogenis supported by the studies described here. Better under-standing of the activities of different members of theglycogen-targeting subunit gene family will pave the wayfor future studies that test the utility of these moleculesfor lowering of blood glucose in diabetes.
AcknowledgmentsThe authors thank A.D. Sherry and R. Unger for criticalreview of the manuscript. The work was supported by agrant from the National Institutes of Health(P50H2598801 to C.B. Newgard).
1. Magnusson, I., Rothman, D.L., Katz, L.D., Shulman, R.G., and Shulman,G.I. 1992. Increased rate of gluconeogenesis in type II diabetes mellitus. A13C nuclear magnetic resonance study. J. Clin. Invest. 90:1323–1327.
2. Cline, G.W., Rothman, D.L., Magnusson, I., Katz, L.D., and Shulman, G.I.1994. 13C-nuclear magnetic resonance spectroscopy studies of hepatic glu-cose metabolism in normal subjects and subjects with insulin-dependentdiabetes. J. Clin. Invest. 94:2369–2376.
3. Velho, G., et al. 1996. Impaired hepatic glycogen synthesis in glucokinase-deficient (MODY-2) subjects. J. Clin. Invest. 98:1755–1761.
4. Antinozzi, P., Berman, H.K., O’Doherty, R.M., and Newgard, C.B. 1999.Metabolic engineering with adenoviral vectors. Annu. Rev. Nutr. 19:511–514.
5. Trinh, K., O’Doherty, R., Anderson, P., Lange, A.J., and Newgard, C.B. 1998.Perturbation of fuel homeostasis caused by overexpression of the glucose-6-phosphatase catalytic subunit in liver of normal rats. J. Biol. Chem.273:31615–31620.
6. O’Doherty, R.M., Lehman, D., Telemaque-Potts, S., and Newgard, C.B. 1999.Metabolic impact of glucokinase overexpression in liver: lowering of bloodglucose in fed rats is accompanied by hyperlipidemia. Diabetes.48:2022–2027.
7. Ferre, T., Pujol, A., Efren, R., Bosch, F., and Valera, A. 1996. Correction of dia-betic alterations by glucokinase. Proc. Natl. Acad. Sci. USA. 93:7225–7230.
8. Hariharan, N., et al. 1997. Expression of human hepatic glucokinase in trans-genic mice liver results in decreased glucose levels and reduced body weight.Diabetes. 46:11–16.
9. Tang, P.M., Bondor, J.M., Swiderek, K.M., and DePoali-Roach, A.P. 1991.Molecular cloning and expression of the regulatory (RG1) subunit of theglycogen-associated protein phosphatase. J. Biol. Chem. 266:15782–15789.
10. Doherty, M.J., Moorhead, G., Morrice, N., Cohen, P., and Cohen, P.T.W.1995. Amino acid sequence and expression of the hepatic glycogen-binding(GL)-subunit of protein phosphatase-1. FEBS Lett. 375:294–298.
11. Doherty, M.J., Young, P.R., and Cohen, P.T.W. 1996. Amino acid sequence ofa novel protein phosphatase 1 binding protein (R5) which is related to theliver- and muscle-specific glycogen binding subunits of protein phosphatase1. FEBS Lett. 399:339–343.
12. Printen, J.A., Brady, M.J., and Saltiel, A.R. 1997. PTG, a protein phosphatase1-binding protein with a role in glycogen metabolism. Science.275:1475–1478.
13. Armstrong, C.G., Browne, G.J., Cohen, P., and Cohen, P.T.W. 1997. P1R6, anovel member of the family of glycogen-targeting subunits of protein phos-phatase 1. FEBS Lett. 418:210–214.
14. Berman, H.K., O’Doherty, R.M., Anderson, P., and Newgard, C.B. 1998. Over-expression of protein targeting to glycogen (PTG) in rat hepatocytes causesprofound activation of glycogen synthesis independent of normal hormone-and substrate-mediated regulatory mechanisms. J. Biol. Chem.273:26421–26425.
15. Doherty, M.J., Cadefau, J., Stalmans, W., Bollen, M., and Cohen, P.T.W. 1998.Loss of the hepatic glycogen-binding subunit (GL) of protein phosphatase1 underlies deficient glycogen synthesis in insulin-dependent diabetic ratsand in adrenalectomized starved rats. Biochem. J. 333:253–257.
16. Herz, J., and Gerard, R.D. 1993. Adenovirus-mediated transfer of low densi-ty lipoprotein lipase receptor gene acutely accelerates cholesterol clearancein normal mice. Proc. Natl. Acad. Sci. USA. 90:2812–2816.
17. Becker, T., et al. 1994. Use of recombinant adenovirus for metabolic engi-neering. Methods Cell Biol. 43:161–189.
18. Buettner, R., Newgard, C.B., Rhodes, C.J., and O’Doherty, R.M. 2000. Cor-rection of diet-induced leptin and insulin resistance via moderate elevationof plasma leptin. Am. J. Physiol. In press.
19. Jensen, J., Serup, P., Karlsen, C., Nielsen, T.F., and Madsen, O.D. 1996. mRNAprofiling of rat islet tumors reveals Nkx 6.1 as a beta-cell-specific home-odomain transcription factor. J. Biol. Chem. 271:18749–18758.
20. Newgard, C.B., Hirsch, L., Foster, D.W., and McGarry, J.D. 1983. Studies onthe mechanism by which exogenous glucose is converted into liver glycogenin the rat: a direct or an indirect pathway? J. Biol. Chem. 258:8046–8052.
21. Jones, J.G., Carvalho, R.A., Franco, B., Sherry, A.D., and Malloy, C.R. 1998.Measurement of hepatic glucose output, Krebs cycle and gluconeogenicfluxes by NMR analysis of plasma glucose. Anal. Biochem. 263:39–45.
22. Brainard, J.R., Downey, R.S., Bier, D.M., and London, R.E. 1989. Use of mul-tiple 13C-labeling strategies and 13C NMR to detect low levels of exogenousmetabolites in the presence of large endogenous pool: measurement of glu-cose turnover in a human subject. Anal. Biochem. 176:307–312.
23. Katz, J., Lee, W.N.P., Wals, P.A., and Bergner, E.A. 1989. Studies of glycogensynthesis and the Krebs cycle by mass isotopomer analysis with [U-13C]glu-cose in rats. J. Biol. Chem. 264:12994–13001.
24. Liu, Z., Barrett, E.J., Dalkin, A.C., Zwart, A.D., and Chou, J.Y. 1994. Effect ofacute diabetes on rat hepatic glucose-6-phosphatase activity and its mes-senger RNA level. Biochem. Biophys. Res. Commun. 205:680–686.
25. Massillon, D., Barzilai, N., Chen, W., Hu, M., and Rossetti, L. 1996. Glucoseregulates in vivo glucose-6-phosphatase gene expression in the liver of dia-betic rats. J. Biol. Chem. 271:9871–9874.
26. Argaud, D., Kirby, T.L., Newgard, C.B., and Lange, A.J. 1997. Glucose stimu-lation of glucose-6-phosphatase gene expression in primary hepatocytes andFao hepatoma cells. Requirement for glucokinase expression. J. Biol. Chem.272:12854–12861.
27. Unger, R.H. 1981. The milieu interieur and the islets of Langerhans. Dia-betologia. 20:1–11.
28. McGarry, J.D., Kuwajima, M., Newgard, C.B., Foster, D.W., and Katz, J. 1986.From dietary glucose to liver glycogen: the full circle round. Annu. Rev. Nutr.7:51–73.
29. Dent, P., Lavoinne, A., Nakielny, S., Watt, P., and Cohen, P. 1990. The molec-ular mechanism by which insulin stimulates glycogen synthesis in mam-malian skeletal muscle. Nature. 348:302–308.
488 The Journal of Clinical Investigation | February 2000 | Volume 105 | Number 4