Active and Passive Biomechanical Measurements for Characterization and Stimulation of Biological Cells Von der Fakul¨ at f ¨ ur Physik und Geowissenschaften der Universit ¨ at Leipzig genehmigte DISSERTATION zur Erlangung des akademischen Grades doctor rerum naturalium Dr. rer. nat., vorgelegt von M. Sc. Markus Gyger geboren am 29.09.1980 in Oldenburg (Oldb.). Gutachter: Prof. Dr. J. A. K¨ as, Universit¨ at Leipzig Prof. Dr. M. Radmacher, Universit¨ at Bremen Tag der Verleihung: 16. September 2013
Transcript
Active and Passive BiomechanicalMeasurements for Characterizationand Stimulation of Biological Cells
Von der Fakulat fur Physik und Geowissenschaften
der Universitat Leipzig
genehmigte
D I S S E R T A T I O N
zur Erlangung des akademischen Grades
doctor rerum naturalium
Dr. rer. nat.,
vorgelegt
von M. Sc. Markus Gyger
geboren am 29.09.1980 in Oldenburg (Oldb.).
Gutachter: Prof. Dr. J. A. Kas, Universitat Leipzig
Prof. Dr. M. Radmacher, Universitat Bremen
Tag der Verleihung: 16. September 2013
Pour Nolu et Elias.
Bibliographische Beschreibung:
Gyger, MarkusActive and Passive Biomechanical Measurements forCharacterization and Stimulation of Biological CellsUniversitat Leipzig, Dissertation124 S., 257 Lit., 33 Abb., 1 Tab.
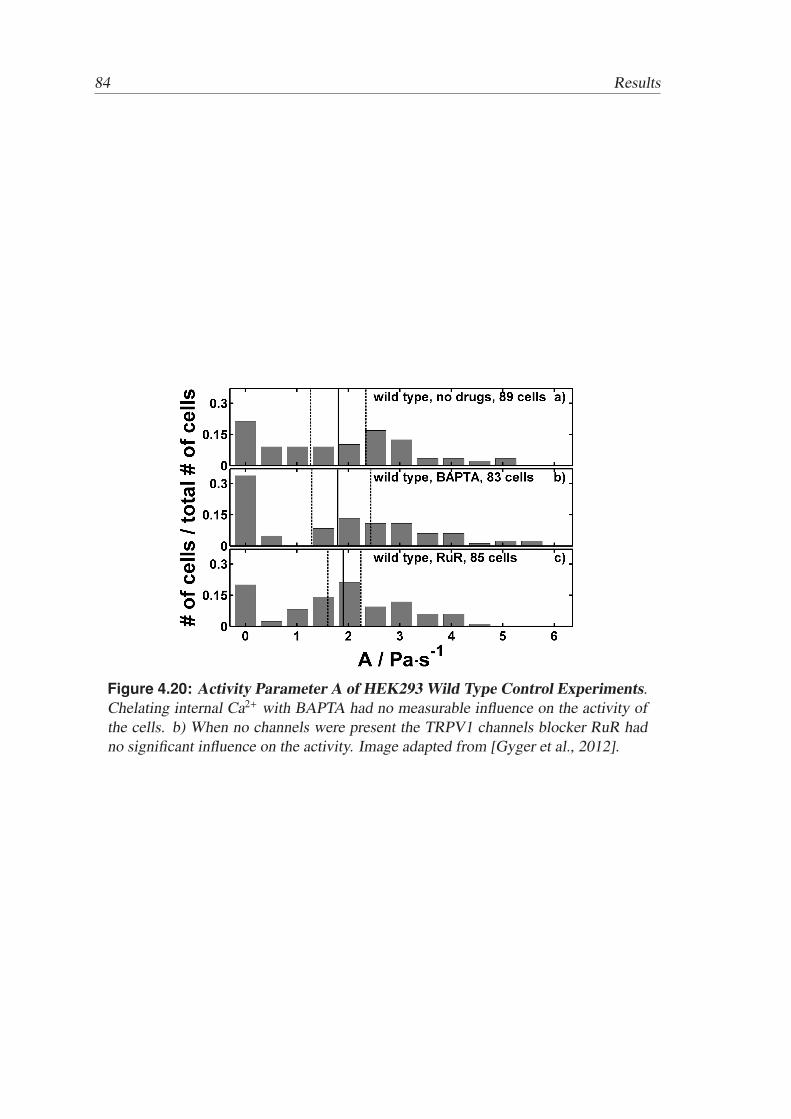
Referat:Aus physikalischer Sicht sind Zellen aktive weiche Materie, die sich durch standige Um-wandlung chemischer Energie in einem thermodynamischen Zustand fernab vom Gleich-gewicht befindet. In vielen physiologisch wichtigen Zusammenhangen mussen ZellenKrafte auf einer Langenskala ihrer eigenen Große generieren. Bisher ist diese Kraftent-wicklung meist adhasionsabhangigen Prozessen zugeschrieben worden. Die hier vorge-legte Arbeit zeigt erstmals, dass Zellkontraktionen unabhangig von Adhasionen in einzel-nen suspendierten Zellen auftreten konnen.
Die mechanischen Eigenschaften der Epitelzellline HEK293 wurde dazu mit Hilfe desOptical Stretchers, einer Zweistrahl-Laserfalle, gemessen. Um den Einfluss des wichtigensekundaren Botenstoffs Ca2+ auf Zellkontraktionen zu untersuchen, wurden Zellen ver-wendet, die mit dem temperaturabhangigen TRPV1-Ionenkanal transfiziert sind. Tempe-raturmessungen im Optical Stretcher und Fluoreszenzmessungen der Ca2+-Konzentrationzeigten, dass die Warmeentwicklung wahrend der Messung ausreicht, um einen massivenCa2+-Einstrom durch den Kanal auszulosen. Durch verschiedene Chemikalien konnen derKanal blockiert oder die Ca2+-Signalausbreitung in der Zelle beeinflusst werden, sodassdie HEK293-TRPV1-Zellen ein ideales Modellsystem fur die Untersuchung des Einflus-ses von Ca2+-Signalen auf die Biomechanik von suspendierten Einzelzellen darstellen.
Durch Integration von aktiven Kontraktionen in die fundamentale Materialgleichungfur linear-viscoelastische Stoffe konnte ein phanomenologisches mathematisches Modellentwickelt werden, das erlaubt, aktive Zellen zu identifizieren und die Kontraktionen zuquantifizieren. Mit Hilfe des Modells wurde festgestellt, dass in vielen Fallen auch dasDeformationsverhalten von Zellen, welches augenscheinlich durch passive Ausdehnungbeschrieben werden konnte, durch aktive Krafte der Zellen beeinflusst war. Es zeigte sichaußerdem, dass bei den gemessenen Zellen die Schiefe und die Mediane der Verformungs-verteilungen von der Aktivitat abhingen.
Die Ergebnisse dieser Dissertation zeigen, dass aktive Prozesse einen essentiellen Teilder Zellmechanik darstellen und dass Zellen unabhangig von Adhasionen kontrahierenkonnen. Das entwickelte phanomenologische mathematische Modell beruht nicht auf An-nahmen zu den krafterzeugenden Prozessen, sodass es fur die Untersuchung des Ein-flusses verschiedener Faktoren auf Zellkontraktionen verwendet werden kann. Insgesamtstellen die Ergebnisse und Methoden einen bedeutenden Beitrag zur Verbesserung dermechanischen Klassifizierung von Zellen dar und konnen somit helfen, zukunftige For-schung etwa auf dem breiten Feld des Zusammenhangs zwischen Krebsausbreitung undZellmechanik voranzutreiben.
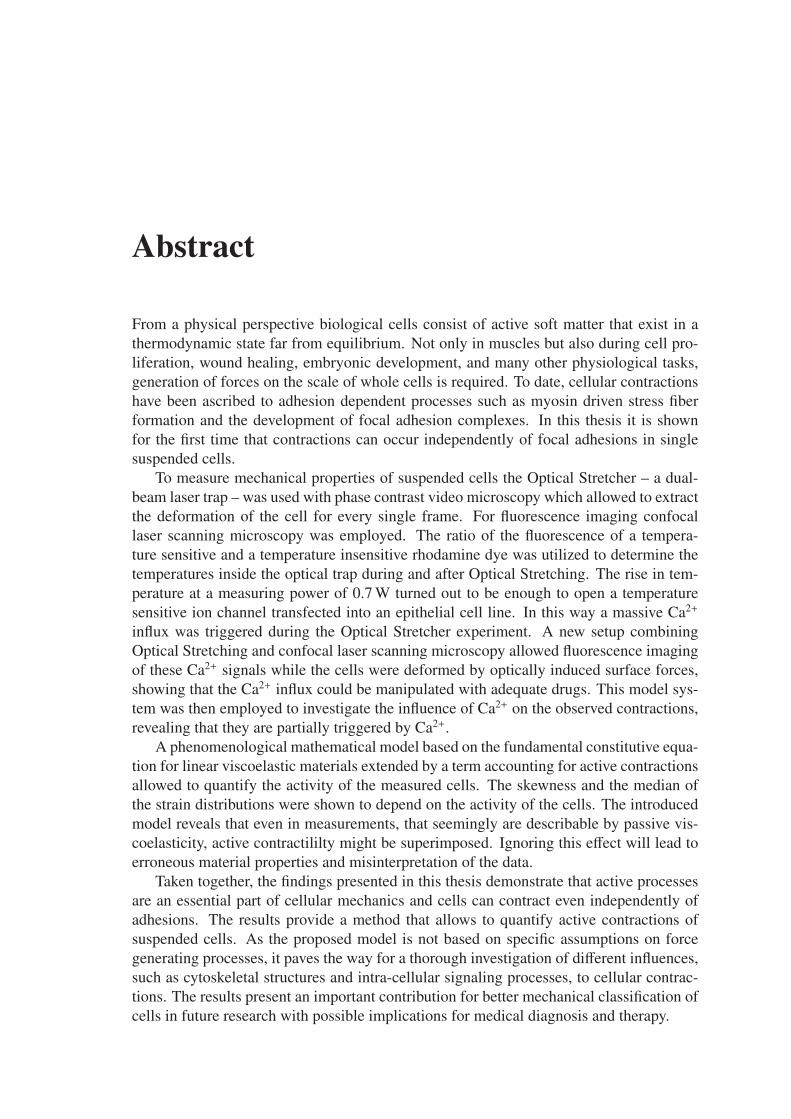
From a physical perspective biological cells consist of active soft matter that exist in athermodynamic state far from equilibrium. Not only in muscles but also during cell pro-liferation, wound healing, embryonic development, and many other physiological tasks,generation of forces on the scale of whole cells is required. To date, cellular contractionshave been ascribed to adhesion dependent processes such as myosin driven stress fiberformation and the development of focal adhesion complexes. In this thesis it is shownfor the first time that contractions can occur independently of focal adhesions in singlesuspended cells.
To measure mechanical properties of suspended cells the Optical Stretcher – a dual-beam laser trap – was used with phase contrast video microscopy which allowed to extractthe deformation of the cell for every single frame. For fluorescence imaging confocallaser scanning microscopy was employed. The ratio of the fluorescence of a tempera-ture sensitive and a temperature insensitive rhodamine dye was utilized to determine thetemperatures inside the optical trap during and after Optical Stretching. The rise in tem-perature at a measuring power of 0.7 W turned out to be enough to open a temperaturesensitive ion channel transfected into an epithelial cell line. In this way a massive Ca2+
influx was triggered during the Optical Stretcher experiment. A new setup combiningOptical Stretching and confocal laser scanning microscopy allowed fluorescence imagingof these Ca2+ signals while the cells were deformed by optically induced surface forces,showing that the Ca2+ influx could be manipulated with adequate drugs. This model sys-tem was then employed to investigate the influence of Ca2+ on the observed contractions,revealing that they are partially triggered by Ca2+.
A phenomenological mathematical model based on the fundamental constitutive equa-tion for linear viscoelastic materials extended by a term accounting for active contractionsallowed to quantify the activity of the measured cells. The skewness and the median ofthe strain distributions were shown to depend on the activity of the cells. The introducedmodel reveals that even in measurements, that seemingly are describable by passive vis-coelasticity, active contractililty might be superimposed. Ignoring this effect will lead toerroneous material properties and misinterpretation of the data.
Taken together, the findings presented in this thesis demonstrate that active processesare an essential part of cellular mechanics and cells can contract even independently ofadhesions. The results provide a method that allows to quantify active contractions ofsuspended cells. As the proposed model is not based on specific assumptions on forcegenerating processes, it paves the way for a thorough investigation of different influences,such as cytoskeletal structures and intra-cellular signaling processes, to cellular contrac-tions. The results present an important contribution for better mechanical classification ofcells in future research with possible implications for medical diagnosis and therapy.
4 Abstract
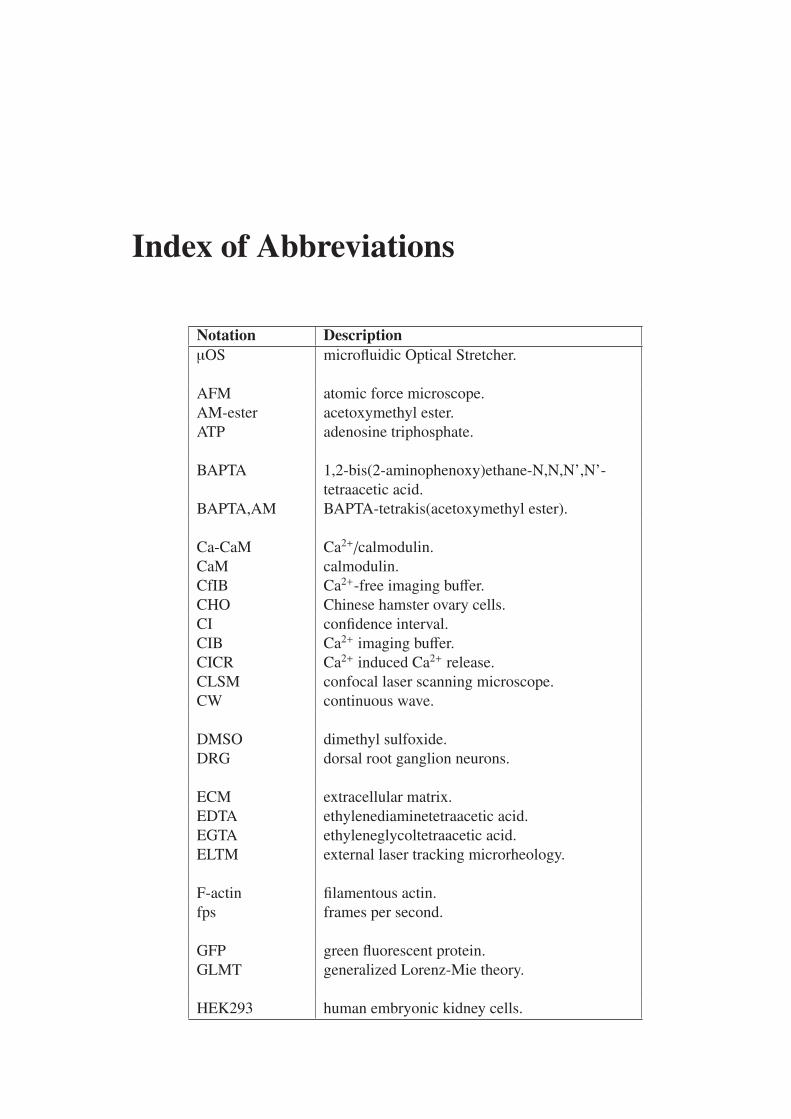
Index of Abbreviations
Notation Description
µOS microfluidic Optical Stretcher.
AFM atomic force microscope.AM-ester acetoxymethyl ester.ATP adenosine triphosphate.
family M member 7.TRPV1 transient receptor potential cation channel sub-
family vanilloid member 1.
UAR uniaxial rheometry.
VR1 vanilloid receptor 1, old name for TRPV1.
Index of Characters
Notation Description
A activity parameter.Br radial component of magnetic field.D0 diffusion coefficient.Er radial component of electric field.E energy.FG geometric factor, accounting for the geometry of
the trapped cell.Fsurface force acting on the cell surface.F F ≔ FG · σ0.G′′(ω) loss modulus.G′(ω) storage modulus.G(t) relaxation modulus.G∗(ω) complex shear modulus.G shear modulus.Imax maximal light intensity.J(t) creep compliance.P power.Q(t) relaxance of a material.R reflection coefficient.T temperature.Θ Heaviside step function.α α ∈ R, arbitrary factor.σ(s) Laplace transform of σ(t).β1,2 power-law exponents.ǫ permitivity of the medium.η viscosity.γi j strain tensor.γ strain.λ wave length of the laser light.〈A〉 time-averaged Maxwell stress tensor.S functional (e.g. of strain).p Wilcoxon rank sum test probability value.L Laplace transform.µm permeability of the medium.µ Poisson ratio.
8 INDEX OF CHARACTERS
Notation Description
ω angular frequency.φ angle to the beam axis.σ0 peak stress during Optical Stretching.σi j symmetric stress tensor.σ stress (scalar).τ past or historic time.0 mode field diameter. beam half width.E electric field.Fnet net force.Fgrad gradient force.Fscat scattering force.H magnetic field.σ stress (vector).eφ unit vector of the polar angle.eθ unit vector of the azimuth angle.er unit vector in radial direction.n unit normal vector.v velocity.I unit tensor.am m ∈ N, fit parameter related to stress.a radius of the particle.bn n ∈ N, fit parameter related to strain.c speed of light in vacuum.h estimated thickness of the actin cortex.kB Bolzmann constant.lp persistence length.ni refractive index of medium i.p1 momentum of incoming light (in medium n1).p2 momentum of transmitted light (in medium n2).pphoton momentum of a photon.pr momentum transfer due to reflection.p momentum.q q > 0, q ∈ R, integration constant.r2 correlation parameter providing information
about the quality of the fit.r0 outer radius of elastic thick shell, outer radius of
the cell.r1 inner radius of elastic thick shell.s complex variable in the Laplace transform plane.t0 start time of stretching power application.t1 end time of stretching power application.t time.v velocity.w radial deformation of the cell.
Index of Characters 9
Notation Description
z0 Rayleigh length.z optical path length.
10 Index of of Characters
Chapter 1
Introduction
A soft material that is driven out of equilibrium by local dissipation of energy is calledactive soft matter [Marchetti et al., 2012]. Nature provides a large variety of such systemswith dimensions reaching from molecular-sized processes propelled by Brownian motor-like mechanisms [Astumian and Hanggi, 2002], to collective motion of micro-organismssuch as Dictyostelium discoideum [Rappel et al., 1999], and up to macroscopic lengthscales as in schools of fish, flocks of birds, or herds of cattle [Marchetti et al., 2012;Parrish and Edelstein-Keshet, 1999; Toner et al., 2005].
Due to its importance for the understanding of a variety of systems from biology andphysics as well as possible applications in engineering of new materials with interestingproperties, active soft matter has become an emerging field of research. Vibrated granularmaterials show collective motion [Aranson and Tsimring, 2006; Deseigne et al., 2010] aswell as persistent and long range – so called “giant” – number fluctuations [Narayan et al.,2007]. Similar number fluctuations [Zhang et al., 2010] and collectivity [Sokolov et al.,2007] have been observed in bacteria which can be considered self-propelled polar micro-particles. Artificial swimmers on micrometer scale have been realized by sticking mag-netic flexible filaments, made of DNA connected colloidal magnetic beads, to red bloodcells (RBCs) and driving them by external magnetic fields [Dreyfus et al., 2005]. Bio-logical membrane fluctuation is driven by non-thermal forces caused by light harvestingproteins or adenosine triphosphate (ATP) hydrolysis [Lin et al., 2006]. Motile processesin the cytoskeleton, a network of flexible, semi-flexible, and stiff polymers underneaththe cell membrane, are induced by filament polymerization and molecular motors un-der the consumption of chemical energy from ATP [Cai et al., 2006; Ridley et al., 2003;Vicente-Manzanares et al., 2009]. While the understanding of processes in active softmatter has been greatly enhanced by the development of excellent models [Julicher et al.,2007; Marchetti et al., 2012; Vicsek et al., 1995] the complexity of some of these systemsstill presents the scientific community with an exciting challenge.
Motor driven cross-linked actin networks have become a focus in investigations ofactive soft matter as they provide valuable information about the mechanisms responsiblefor mechanical properties of cells [Bendix et al., 2008; Koenderink et al., 2009]. Theoreti-cal considerations and measurements in reconstituted systems clearly show that formationof tensile forces can enhance non-linearities, such as stress stiffening, by orders of magni-tude in an ATP dependent manner [MacKintosh and Levine, 2008; Mizuno et al., 2007].Simulations and effective-medium theories indicate that motor induced contractility has
12 Introduction
a great influence on the stability of such networks and the non-linearities in response todeformations [Broedersz et al., 2011; M. Sheinman, 2012]. These findings suggest thatcells can use motor proteins to tune their mechanical properties and to adapt to the re-quirements of individual physiological tasks as well as to mechanical properties of theirenvironment.
Also, from a biological perspective the mechanisms of cellular contractions are highlyinteresting. For many physiologically relevant processes and diseases contractility playsan important role. In wound healing, contractions of epithelial cells close small injuries[Bement et al., 1993; Tamada et al., 2007]. Traction forces in fibroblasts influence steeringand directional persistence in cell migration [Beningo et al., 2006; Lo et al., 2004]. Theability to contract has been shown to correlate with metastatic aggressiveness of cancercells [Jonas et al., 2011; Mierke et al., 2008] opening perspectives for new strategies incancer diagnostics and therapy [Fritsch et al., 2010].
Numerous studies have investigated contractile forces in cells. On the molecular levelinside the cytoskeleton, random stress fluctuations caused by intra-cellular force gener-ators were observed with two-point microrheology [Lau et al., 2003]. Traction forcemicroscopy allowed the measuring of forces exerted via focal adhesion complexes todeformable gels with very good spacial resolution [Munevar et al., 2001; Wang et al.,2001a]. Contractions on the length scale of whole cells were observed by the help ofmicroplate rheology. Large deformations led to contractile forces within several tenth ofminutes [Thoumine and Ott, 1997]. When the flexible microplates were held at a constantelongation by a feedback mechanism, traction forces generated within several hundredsof seconds [Mitrossilis et al., 2009]. These forces arouse during the spreading of cells andwere accompanied by formation of actin stress fibers as a response to substrate stiffness[Mitrossilis et al., 2009].
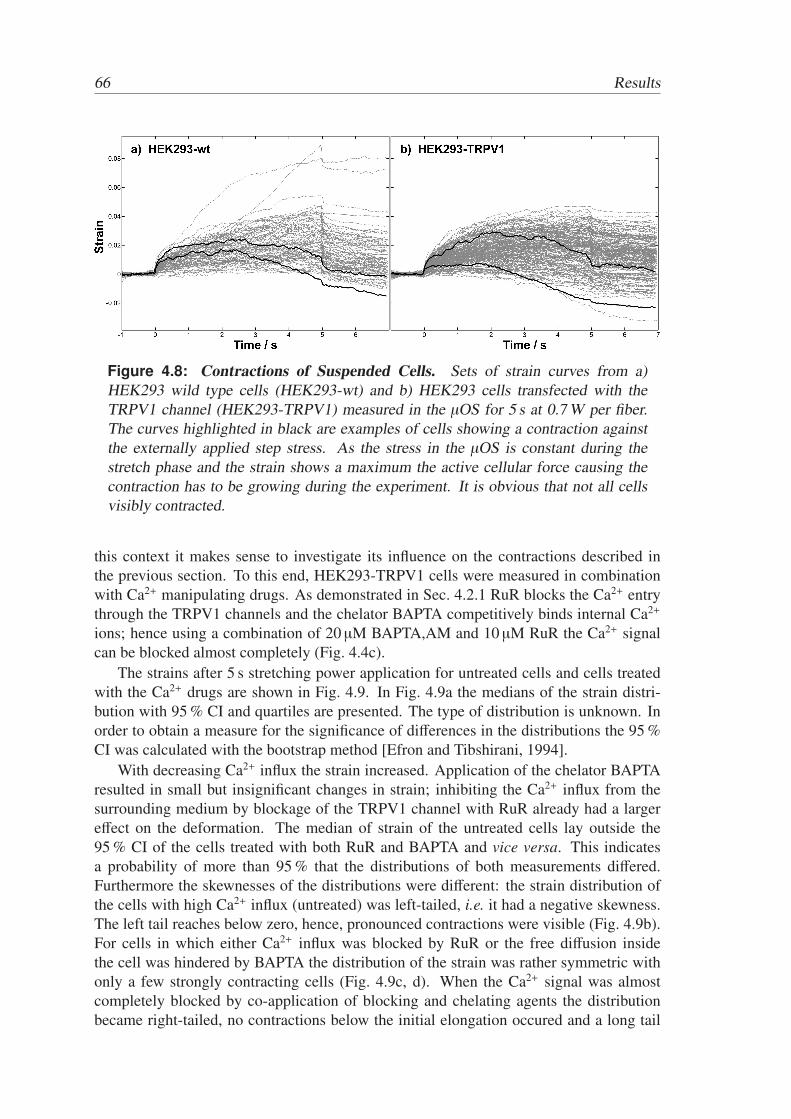
Contractile forces on the length scale of the cell, as measured by traction force mi-croscopy or microplate rheology, have, to date, been associated with adhesion dependentprocesses, such as stress fiber formations and building of focal adhesion complexes. It wasquite surprising when it was recently reported that several suspended cells, i.e. withoutdirect involvement of adhesion sites, exhibited pronounced contractions when subjectedto an externally applied outward pulling stress. Contractions of that type have been seenoccasionally for a few isolated cancer cells [Fritsch et al., 2010] and for epithelial cells[Gyger et al., 2012]. They happened within seconds and led to visible shortening of theround cells parallel and in opposite direction to the applied forces.
Aim of this thesis was to investigate the contractile behavior of single suspended cellsand to elucidate the influence of the second messenger Ca2+ on their mechanical prop-erties. To this end, an epithelial cell line was measured with the microfluidic OpticalStretcher (µOS), a two beam laser trap that enables to investigate single cells in suspen-sion. The cells are transfected with a temperature sensitive ion channel, that opens attemperatures above 40 ◦C, which are reached in the µOS due to the laser induced heatingduring the measurement. By a combination of fluorescence Ca2+ imaging in the confocallaser scanning microscope (CLSM) and the µOS it was shown that the µOS triggers amassive Ca2+ influx into the cells. This Ca2+ influx can be inhibited and manipulated withadequate drugs. Hence, these cells provide an excellent model system for the investiga-tion of the effect of the second messenger Ca2+ on cellular mechanics. The study revealedthat Ca2+ triggers part of the observed contractions.
13
To quantify the contractility of the cells, a phenomenological mathematical modelwas developed based on the general constitutive equation for linear viscoelastic materi-als [Tschoegl, 1989], which was evaluated up to first order in stress and second orderin strain [Park and Schapery, 1999]. Cellular force generation was included in the ap-proach in linear approximation. This simple model turned out to provide a powerful toolfor the investigation of the observed contractions. The view was not biased by a priori
assumptions on force generating mechanisms, nevertheless, the model permitted a quan-tification of active contractions in the cells. It furthermore displayed a superposition ofcontributions to cellular strain under external stress from passive elongation and fromactive contractions even for measurements that seem to be describable by passive vis-coelastic approaches. Ignoring these findings might lead to inaccurate material constantsand misinterpretations of rheological data. Active processes are quintessential for cellularmechanics even in the absence of direct connections to neighboring cells or substrate ad-hesions. In the light of the ongoing investigation of active soft matter as well as from thepoint of view of biomedical applications these findings provide an important contributionto a better understanding of cellular processes.
Structure of the Document
In Chap. 2 the biological and physical fundamentals, that are necessary to understand themeasurements and theoretical approaches in this thesis, are presented. Chap. 3 providesdetailed information about the applied techniques and the various materials that were usedto perform the experiments. In the “results chapter” (Chap. 4) firstly the derivation of thephenomenological model used to quantify the measured strain data is shown. Secondly,the measurements of the temperature dynamics during a measurement in the µOS areexplained, and thirdly the results obtained by a combination of Ca2+ imaging and OpticalStretching are presented. The last part of this chapter treats the main results of this work,namely, that single suspended cells could be shown to perform active contractions againstthe externally applied forces in the µOS. It will be demonstrated that this process is, atleast in part, influenced by the second messenger Ca2+. In Chap. 5, the results will bediscussed in detail and put into the context of the current state of scientific knowledgepresented earlier in Chap. 2. The thesis closes with the conclusions that can be drawn fromthe presented experiments and an outlook on interesting ideas how future investigationsmight continue with the presented work.
14 Introduction
Chapter 2
Background
2.1 Biological Background
It is widely accepted that the mechanical properties of biological cells are mainly deter-mined by the cytoskeleton, cytoskeletal cross-linkers and motor proteins [Lodish, 2000].Many of the tasks a cell has to fulfill require active processes. “Active” means that themechanisms are performed under the consumption of energy. For most active processesthis energy is provided by the cellular “fuel” ATP. Hence, cells are active soft matter farfrom thermodynamic equilibrium [Cates and MacKintosh, 2011]. Active processes, suchas exertion of forces via focal adhesions [Munevar et al., 2001; Pelham and Wang, 1999;Ridley et al., 2003], reaction to changes in mechanical properties of the environment [Loet al., 2000; Yeung et al., 2005], cell migration [Friedl and Gilmour, 2009; Ridley et al.,2003; Wei et al., 2009], and actin treadmilling in lamellipodia [Mogilner and Keren, 2009;Ridley et al., 2003] require a tight regulation of force generation in the cytoskeleton. Theunderlying mechanisms and processes are currently matter of vital investigations. Thefollowing sections are meant to give the reader the background knowledge necessary tounderstand the presented experimental results. A detailed introduction into the field canbe found in excellent textbooks by Lodish [Lodish, 2000], and Pollard et al. [Pollard andEarnshow, 2002].
2.1.1 The Cytoskeleton
The cytoskeleton consists of three main components: microtubules (MTs), actin filaments,also called microfilaments (MFs), and intermediate filaments (IFs) [Pollard and Earnshow,2002]. The stiffness of these protein filaments can be characterized by the persistencelength, i.e. the characteristic length at which motions of one end of the filament start tobe uncorrelated with that of the other end [Doi and Edwards, 1986]. In the light of thephysics of active soft matter, discussed in Sec. 2.2, the cytoskeletal filaments MTs andMFs are important for the mechanical properties of cells. The role of IFs in this contextremains elusive, nevertheless, they are included here for completeness.
16 Background
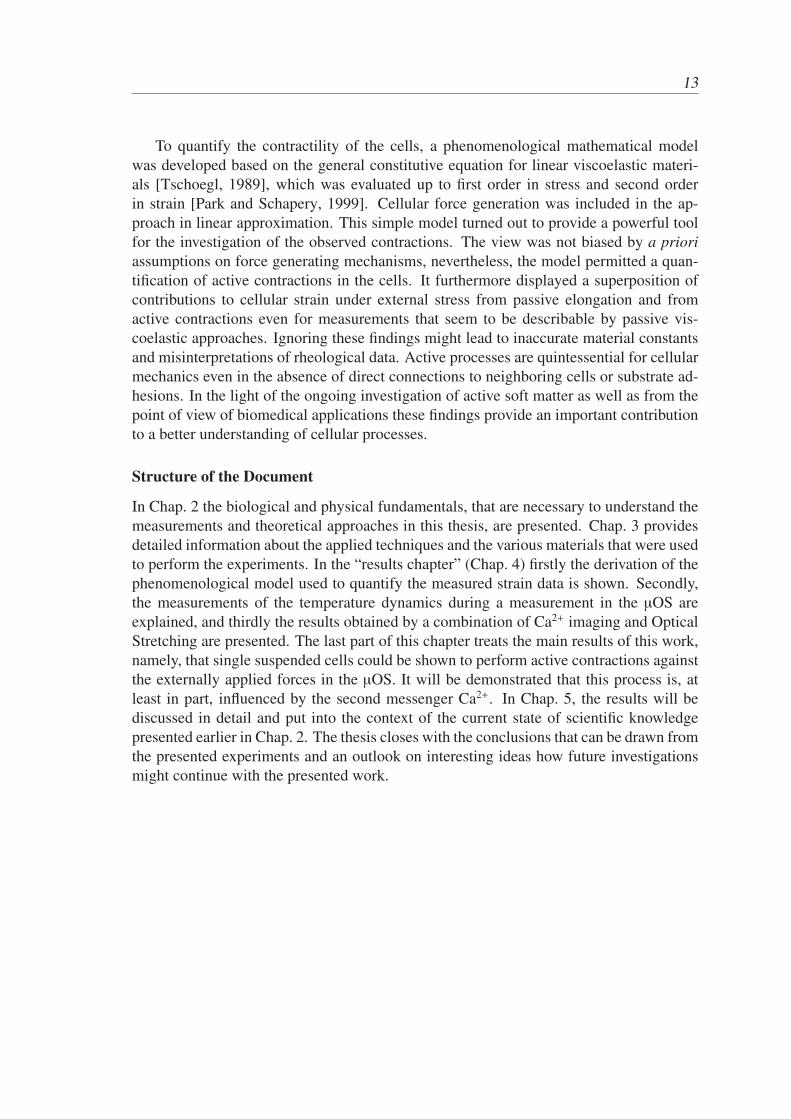
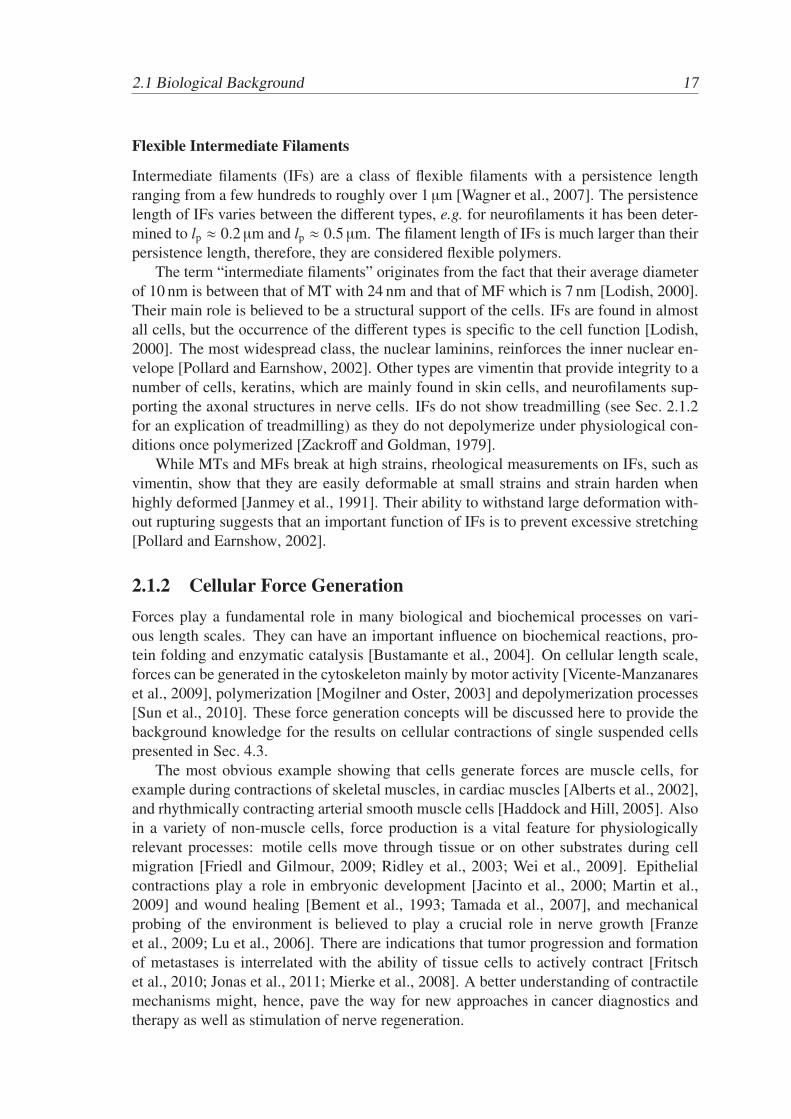
Figure 2.1: Cytoskeletal Components. A) Microtubules (MTs) visualized withGFP-tubulin (green). They span large regions of the cytoplasm and are, despite theirhigh stiffness, often bent. B) Actin microfilaments (MFs) stained with rhodaminated-phalloidin (green-yellow). They build tensile stress fibers. The blue staining marksthe cell nuclei. C) Intermediate filaments (IFs) stained with antibodies to vimentin(red). Image reproduced with permission of J Cell Sci from [Ingber, 2003].
StiffMicrotubules
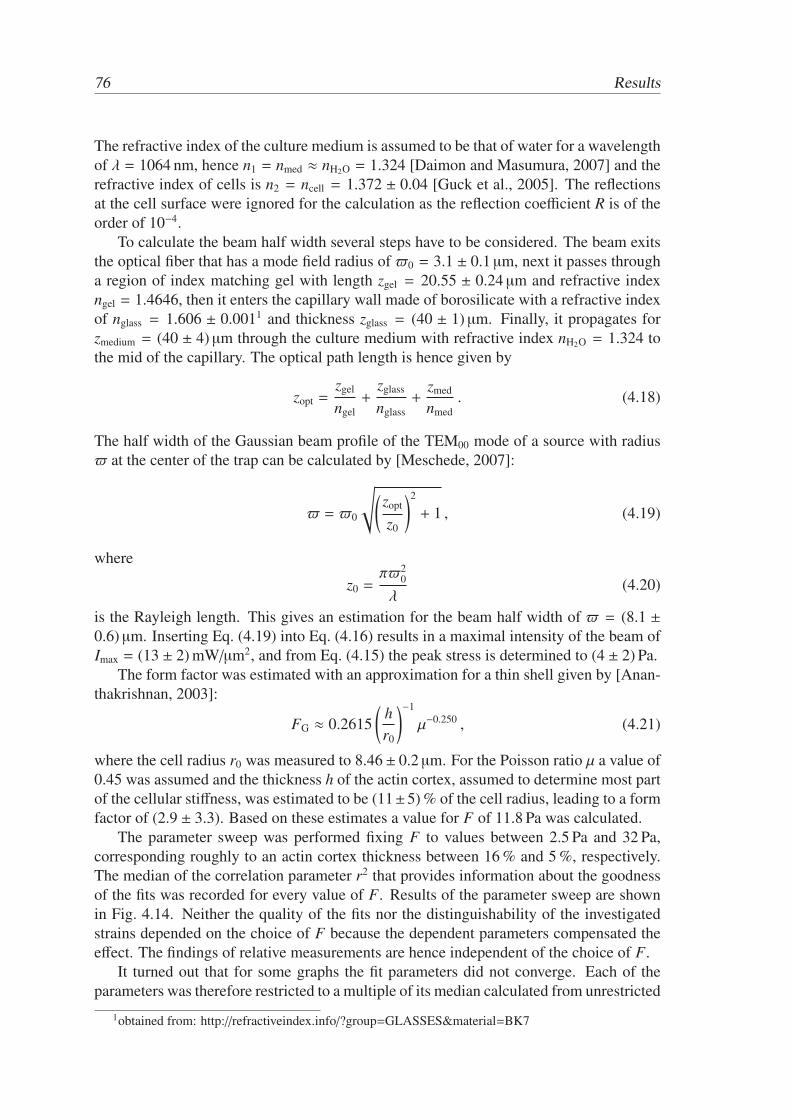
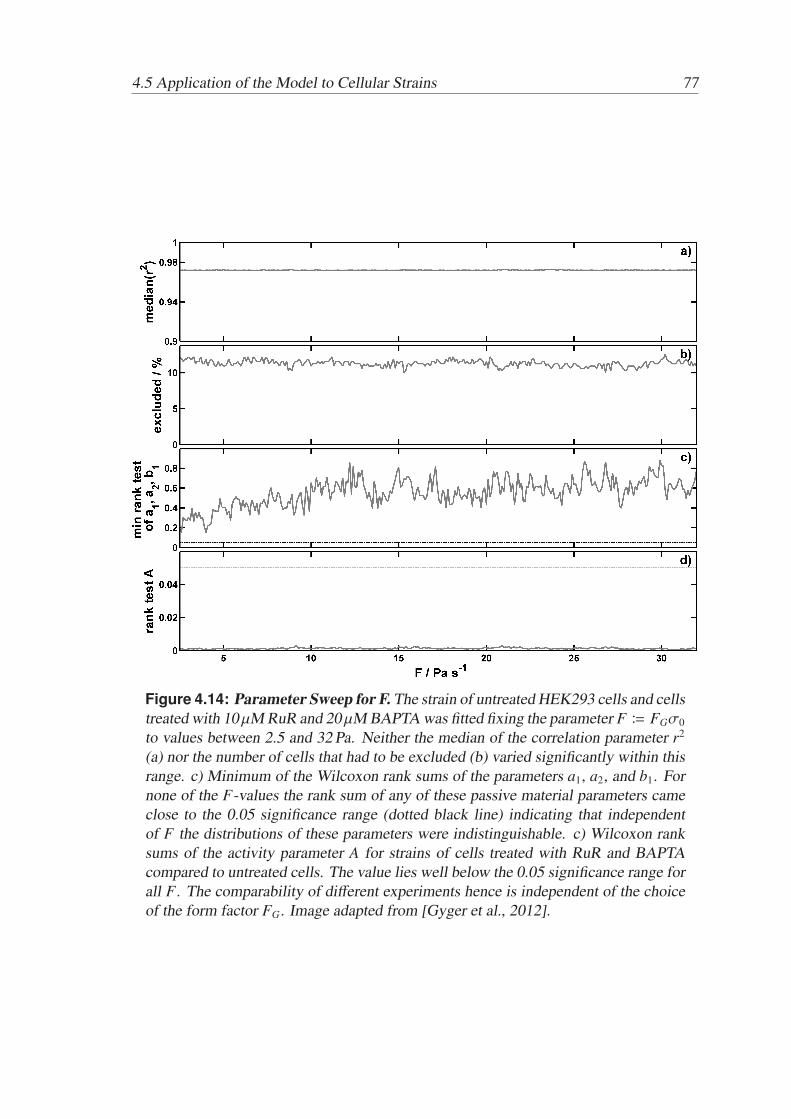
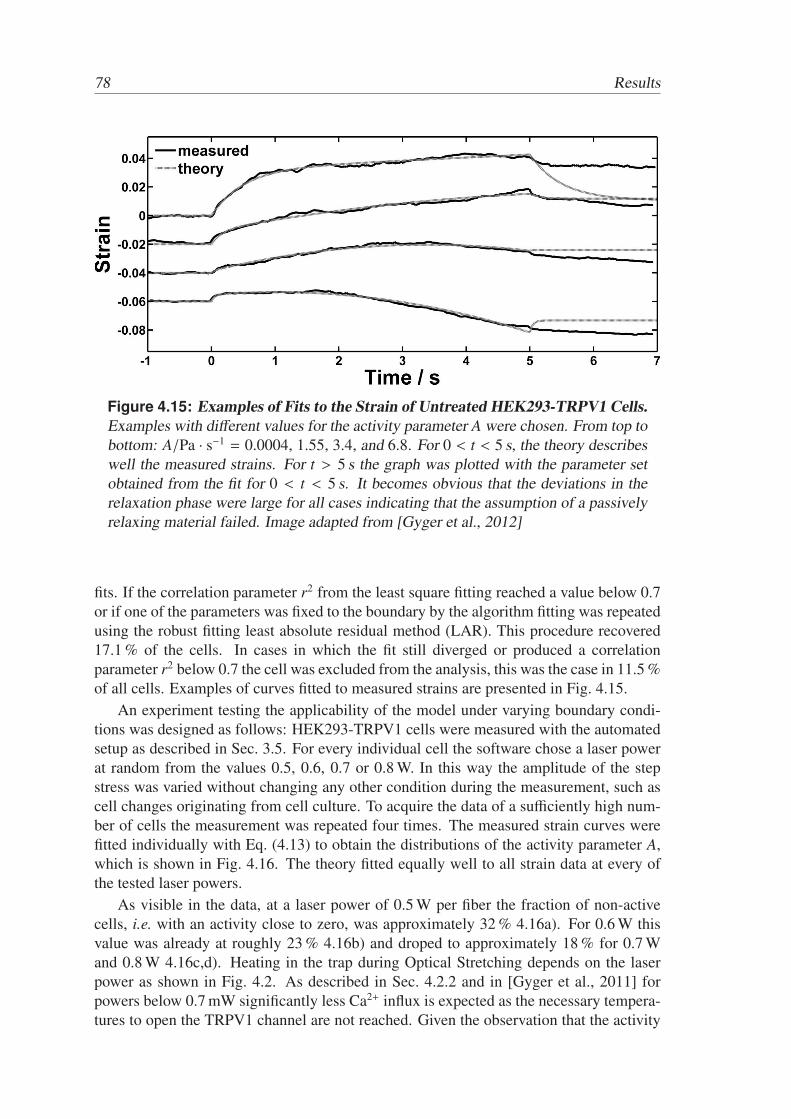
Microtubules (MTs) are organized by a star-like MT-organizing center also called centro-some [Alberts et al., 2002]. They play an important role in cell division where they builda mitotic spindle that is necessary to segregate the chromosomes.
It has been shown that the persistence length of MTs depends on the filament lengthand reaches from several hundreds to several thousands of micrometers [Taute et al., 2008,2010]. Cells typically have diameters on the order of tenth of micrometers, thus, MTs pro-vide a very stiff structure. MTs are the main candidate for forming a load bearing structureresisting contractile forces of other cytoskeletal components [Wang et al., 2001b]. Con-structions of this type are called tensegrity structures and will be discussed in Sec. 2.2.2.
MTs can be disrupted in vivo and in vitro by nanomolar concentrations of nocodazole[Vasquez et al., 1997]. Also colchicine has been reported to depolymerize MTs [Wanget al., 2001b]. In contrast, the anti-cancer drug taxol, also called paclitaxel, is used tostabilize them [Torres and Horwitz, 1998].
Semi-Flexible Actin Microfilaments
Actin is the most abundant protein in the majority of eukaryotic cells and the gens en-coding for it show an astonishing degree of sequence conservation. In the skeletal muscleisoform of chickens and humans non of the residues differs. This means that actin hasbeen conserved over an evolutionary distance of more than 300 million years [Galkinet al., 2012]. Filamentous actin has a persistence length of approximately 7 µm, which isin the range of the filament length [Alberts et al., 2002]; MFs are hence considered semi-flexible. The actin cortex underneath the cell membrane is believed to be responsible formost part of the mechanical properties of the cell [Wottawah et al., 2005a,b].
For the investigation of the functions of MFs various stabilizing and destabilizingdrugs are available: latrunculin B, cytochalasin D [Wakatsuki et al., 2001], and latrunculinA [Morton et al., 2000] destabilize MFs. Jasplakinolide stabilizes MFs in vitro, however,it can disrupt actin filaments and induce polymerization of monomeric actin when appliedin living cells [Bubb et al., 2000].
2.1 Biological Background 17
Flexible Intermediate Filaments
Intermediate filaments (IFs) are a class of flexible filaments with a persistence lengthranging from a few hundreds to roughly over 1 µm [Wagner et al., 2007]. The persistencelength of IFs varies between the different types, e.g. for neurofilaments it has been deter-mined to lp ≈ 0.2 µm and lp ≈ 0.5 µm. The filament length of IFs is much larger than theirpersistence length, therefore, they are considered flexible polymers.
The term “intermediate filaments” originates from the fact that their average diameterof 10 nm is between that of MT with 24 nm and that of MF which is 7 nm [Lodish, 2000].Their main role is believed to be a structural support of the cells. IFs are found in almostall cells, but the occurrence of the different types is specific to the cell function [Lodish,2000]. The most widespread class, the nuclear laminins, reinforces the inner nuclear en-velope [Pollard and Earnshow, 2002]. Other types are vimentin that provide integrity to anumber of cells, keratins, which are mainly found in skin cells, and neurofilaments sup-porting the axonal structures in nerve cells. IFs do not show treadmilling (see Sec. 2.1.2for an explication of treadmilling) as they do not depolymerize under physiological con-ditions once polymerized [Zackroff and Goldman, 1979].
While MTs and MFs break at high strains, rheological measurements on IFs, such asvimentin, show that they are easily deformable at small strains and strain harden whenhighly deformed [Janmey et al., 1991]. Their ability to withstand large deformation with-out rupturing suggests that an important function of IFs is to prevent excessive stretching[Pollard and Earnshow, 2002].
2.1.2 Cellular Force Generation
Forces play a fundamental role in many biological and biochemical processes on vari-ous length scales. They can have an important influence on biochemical reactions, pro-tein folding and enzymatic catalysis [Bustamante et al., 2004]. On cellular length scale,forces can be generated in the cytoskeleton mainly by motor activity [Vicente-Manzanareset al., 2009], polymerization [Mogilner and Oster, 2003] and depolymerization processes[Sun et al., 2010]. These force generation concepts will be discussed here to provide thebackground knowledge for the results on cellular contractions of single suspended cellspresented in Sec. 4.3.
The most obvious example showing that cells generate forces are muscle cells, forexample during contractions of skeletal muscles, in cardiac muscles [Alberts et al., 2002],and rhythmically contracting arterial smooth muscle cells [Haddock and Hill, 2005]. Alsoin a variety of non-muscle cells, force production is a vital feature for physiologicallyrelevant processes: motile cells move through tissue or on other substrates during cellmigration [Friedl and Gilmour, 2009; Ridley et al., 2003; Wei et al., 2009]. Epithelialcontractions play a role in embryonic development [Jacinto et al., 2000; Martin et al.,2009] and wound healing [Bement et al., 1993; Tamada et al., 2007], and mechanicalprobing of the environment is believed to play a crucial role in nerve growth [Franzeet al., 2009; Lu et al., 2006]. There are indications that tumor progression and formationof metastases is interrelated with the ability of tissue cells to actively contract [Fritschet al., 2010; Jonas et al., 2011; Mierke et al., 2008]. A better understanding of contractilemechanisms might, hence, pave the way for new approaches in cancer diagnostics andtherapy as well as stimulation of nerve regeneration.
18 Background
Brownian Motors
In physiological temperatures systems of the size of proteins are dominated by thermalnoise. To understand the working principles of cellular force generation it is instructive toconsider the concept of Brownian motors, a physical principle that explains how directedmotion and force can be generated under these conditions.
The diffusion of a particle of radius a is governed by the Stokes-Einstein relationD0 =
kBT
6π ηa , where D0 is the diffusion coefficient, kB the Boltzmann constant, T the abso-lute temperature and η the viscosity of the medium [Einstein, 1905, 1906]. For a freelymoving, self propelling particle with velocity v and radius a the time to travel its owndiameter in distance is 2a/v. If one takes, for instance, the average velocity of myosin Vmotors, which is approximately 500 nm/s [Pierobon et al., 2009], and a cargo particle ofa diameter of 100 nm, this time is 0.2 s. In 3 dimensions, the average distance a particlediffuses is given by 〈r2〉 = 6D0t [Einstein, 1905]. Hence, rav ≔
√〈r2〉 =
√6D0
av. Ap-
proximating the viscosity inside the cytoplasm by the value that has been measured withgold nanoparticles, ηcytosol ≈ 2·10−2 Pa · s [Leduc et al., 2011], and assuming a temperatureof 37 ◦C inside the cell, the particle would move roughly 500 nm in 0.2 s due to Brownianmotion. This distance is five times larger than the value resulting from a directed motion.
According to the second law of thermodynamics Brownian motion cannot lead to adirected motion on its own, however, with the help of energy transfer provided by exter-nal fluctuations or a release of chemical energy, directed motion can be generated fromrandom thermal fluctuations [Astumian, 1997].
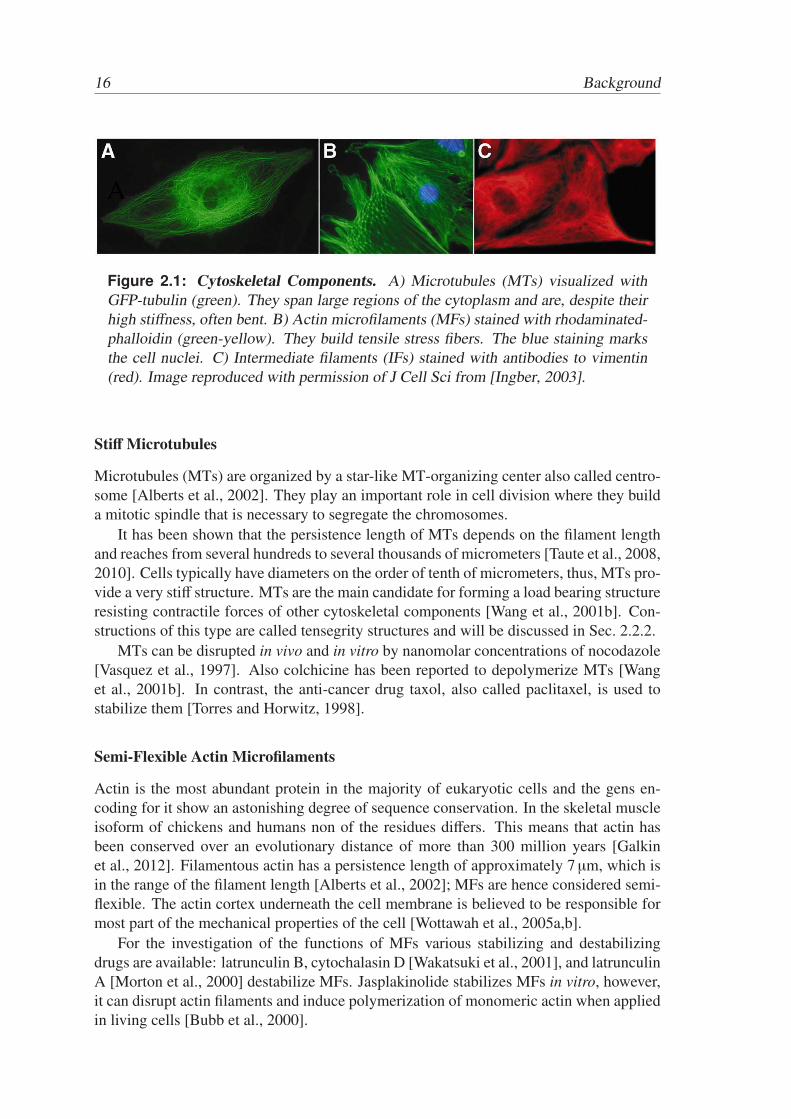
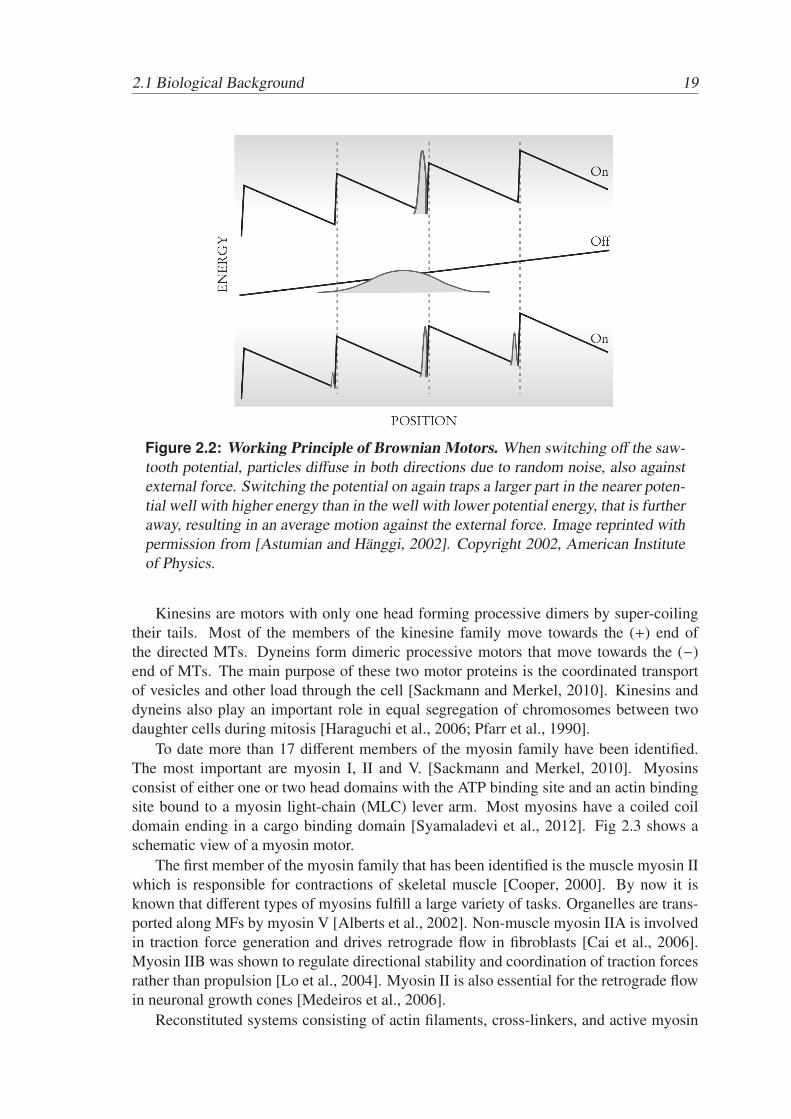
One example how a Brownian motor can be driven against an external force by switch-ing on and off a saw-tooth potential is shown in Fig. 2.2. When the potential is on, theparticles locate in the well. When the potential is off, the particles move according to theexternal force and diffuse due to thermal noise, spreading the distribution. Switching thepotential on again, more particles have moved the smaller distance to the nearer, higherwell than down the larger distance to the lower well. It is important to mention that thethermodynamic requirements are fulfilled because the switching of the potential providesenergy to the system [Astumian and Hanggi, 2002]. Other effects, such as switchingfrom hot to cold temperatures [Hanggi et al., 2005] or a release from chemical energyfor instance by ATP hydrolysis [Astumian and Bier, 1996], can produce similar directedmotion. The latter effect constitutes the basis for molecular motors and polymerizationdriven force generation that will be discussed in the next section.
Molecular Motors
In biological organisms molecular motors are proteins that convert chemical energy, e.g.
stored in ATP, into mechanical motion using the mechanisms of Browning motors. Theseproteins carry out a diverse number of different tasks such as muscle contraction, cellularmotion, transport of organelles and vesicles, generation of ion gradients, or protein foldingand unfolding [Bustamante et al., 2004].
The known cytoskeletal motors act on specific proteins of the cytoskeleton and mainlyserve to transport load or produce forces that transduce to the length scale of wholecells. MTs have two families of associated motor proteins, kinesins and dyneins whereasmyosins are the only known motors that process MFs [Sackmann and Merkel, 2010]. Todate, there are no known motors specifically processing IFs.
2.1 Biological Background 19
Figure 2.2: Working Principle of Brownian Motors. When switching off the saw-tooth potential, particles diffuse in both directions due to random noise, also againstexternal force. Switching the potential on again traps a larger part in the nearer poten-tial well with higher energy than in the well with lower potential energy, that is furtheraway, resulting in an average motion against the external force. Image reprinted withpermission from [Astumian and Hanggi, 2002]. Copyright 2002, American Instituteof Physics.
Kinesins are motors with only one head forming processive dimers by super-coilingtheir tails. Most of the members of the kinesine family move towards the (+) end ofthe directed MTs. Dyneins form dimeric processive motors that move towards the (−)end of MTs. The main purpose of these two motor proteins is the coordinated transportof vesicles and other load through the cell [Sackmann and Merkel, 2010]. Kinesins anddyneins also play an important role in equal segregation of chromosomes between twodaughter cells during mitosis [Haraguchi et al., 2006; Pfarr et al., 1990].
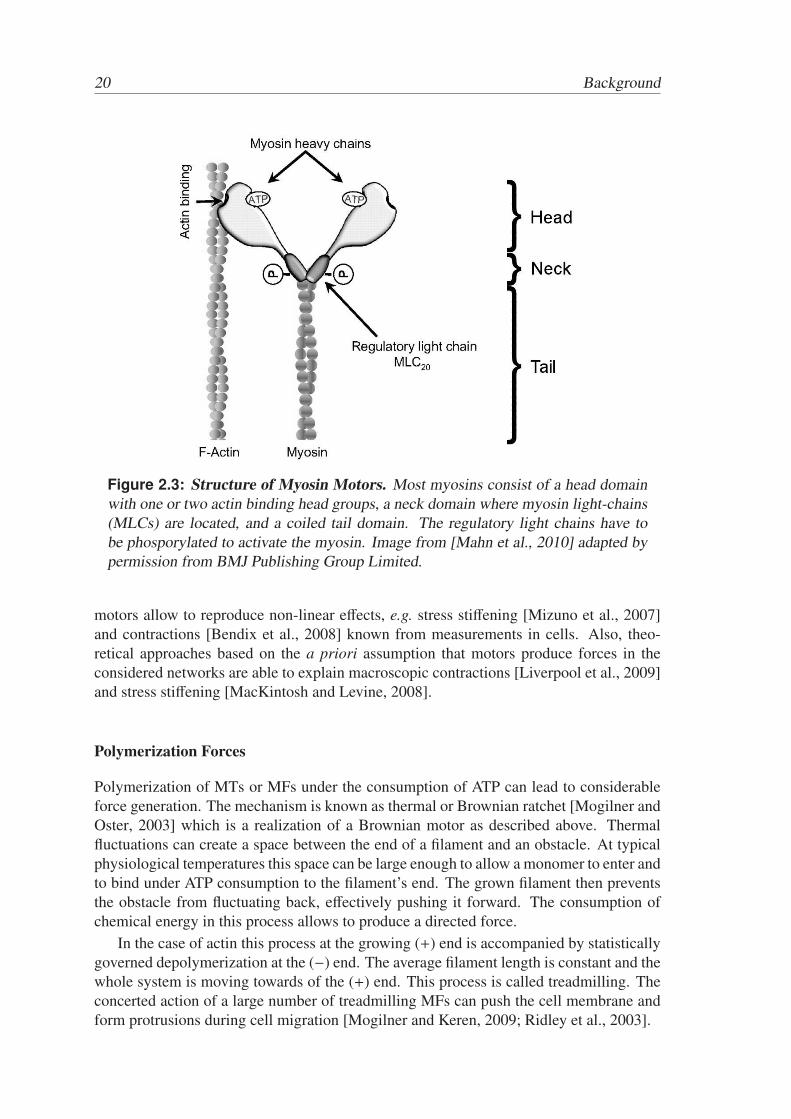
To date more than 17 different members of the myosin family have been identified.The most important are myosin I, II and V. [Sackmann and Merkel, 2010]. Myosinsconsist of either one or two head domains with the ATP binding site and an actin bindingsite bound to a myosin light-chain (MLC) lever arm. Most myosins have a coiled coildomain ending in a cargo binding domain [Syamaladevi et al., 2012]. Fig 2.3 shows aschematic view of a myosin motor.
The first member of the myosin family that has been identified is the muscle myosin IIwhich is responsible for contractions of skeletal muscle [Cooper, 2000]. By now it isknown that different types of myosins fulfill a large variety of tasks. Organelles are trans-ported along MFs by myosin V [Alberts et al., 2002]. Non-muscle myosin IIA is involvedin traction force generation and drives retrograde flow in fibroblasts [Cai et al., 2006].Myosin IIB was shown to regulate directional stability and coordination of traction forcesrather than propulsion [Lo et al., 2004]. Myosin II is also essential for the retrograde flowin neuronal growth cones [Medeiros et al., 2006].
Reconstituted systems consisting of actin filaments, cross-linkers, and active myosin
20 Background
Figure 2.3: Structure of Myosin Motors. Most myosins consist of a head domainwith one or two actin binding head groups, a neck domain where myosin light-chains(MLCs) are located, and a coiled tail domain. The regulatory light chains have tobe phosporylated to activate the myosin. Image from [Mahn et al., 2010] adapted bypermission from BMJ Publishing Group Limited.
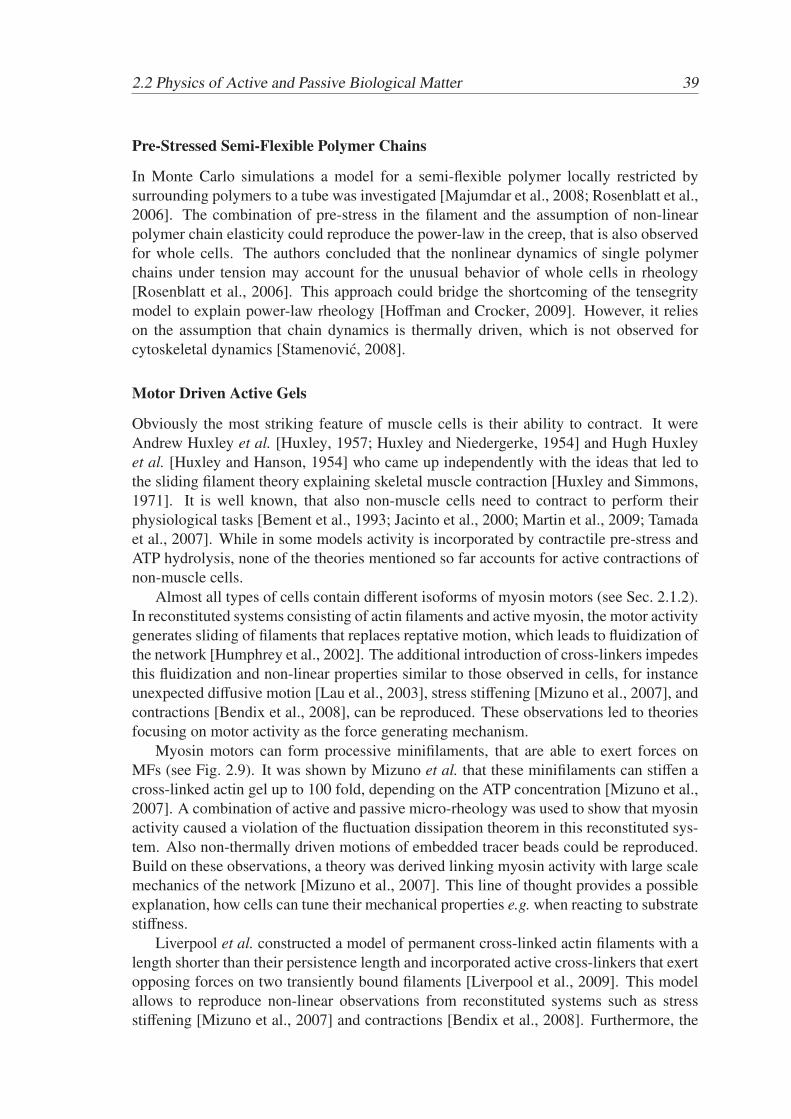
motors allow to reproduce non-linear effects, e.g. stress stiffening [Mizuno et al., 2007]and contractions [Bendix et al., 2008] known from measurements in cells. Also, theo-retical approaches based on the a priori assumption that motors produce forces in theconsidered networks are able to explain macroscopic contractions [Liverpool et al., 2009]and stress stiffening [MacKintosh and Levine, 2008].
Polymerization Forces
Polymerization of MTs or MFs under the consumption of ATP can lead to considerableforce generation. The mechanism is known as thermal or Brownian ratchet [Mogilner andOster, 2003] which is a realization of a Brownian motor as described above. Thermalfluctuations can create a space between the end of a filament and an obstacle. At typicalphysiological temperatures this space can be large enough to allow a monomer to enter andto bind under ATP consumption to the filament’s end. The grown filament then preventsthe obstacle from fluctuating back, effectively pushing it forward. The consumption ofchemical energy in this process allows to produce a directed force.
In the case of actin this process at the growing (+) end is accompanied by statisticallygoverned depolymerization at the (−) end. The average filament length is constant and thewhole system is moving towards of the (+) end. This process is called treadmilling. Theconcerted action of a large number of treadmilling MFs can push the cell membrane andform protrusions during cell migration [Mogilner and Keren, 2009; Ridley et al., 2003].
2.1 Biological Background 21
Depolymerization Forces
Depolymerization of cytoskeletal filaments can lead directly to a considerable amount offorce. This has been shown e.g. for Ca2+ induced MTs depolymerization [Grishchuk et al.,2005; Molodtsov et al., 2007].
On the other hand, depolymerization can lead to a motor independent a contraction ofa polymer network [Sun et al., 2010]. The cross-linked cytoskeletal network reaches anequilibrium density if contributions to the free energy that favor expansion and contribu-tions leading to compression are balanced. Enthalpic contributions of attractive interac-tions provide contractile forces while entropic effects lead to spreading of the material. Ifin this situation the filament density is reduced by depolymerization, the system shrinksto re-establish its equilibrium density. Provided that monomers are able to diffuse away,the system contracts [Sun et al., 2010].
Depolymerization processes can also cause contractions indirectly. In the tensegritymodel MTs provide the load bearing structures that resist the cellular pre-stress, which iscaused by myosin contractility [Ingber, 1997; Wang et al., 2001b]. Depolymerization ofMTs shifts the force balance towards the contractile acto-myosin complexes leading to ashrinkage of the whole structure.
2.1.3 Ca2+ Signaling and Imaging
In Sec. 4.3.2 results of the effect of Ca2+ on contractions of single suspended cells willbe presented. The following sections serve to provide an overview of relevant knowledgeon Ca2+ signaling. For a more detailed view on the broad field of Ca2+ signaling see forexample [Clapham, 2007].
Calcium is one of the most important second messengers in cellular signaling[Berridge et al., 2000]. It controls numerous physiologically relevant processes. Thefertilization process in most species is accompanied by a Ca2+ wave released from inter-nal stores which seems to be important in activating the egg [Whitaker, 2006]. Duringembryonic development a series of Ca2+ signaling events occurs, each at a very specialtime and location, such that each of the signals is very specific and different from theprevious [Whitaker, 2006]. These signals are essential for pattern formation and organo-genesis. During an action potential in a nerve cell the Ca2+ level is elevated rapidly,highly localized to the vicinity of a few opened voltage dependent Ca2+ channels. Thisevent triggers the release of neurotransmitters [Neher and Sakaba, 2008]. The Ca2+ ele-vation relaxes very fast after the action potential. Fish epithelial keratocytes that move infibroblast-like manner steer their motion by activation of stretch-activated Ca2+ channels(SACs) [Lee et al., 1999]. Ca2+ flickering seems to steer fibroblasts during migration byactivation of the SAC TRPM71 [Wei et al., 2009]. It has been known since the late 1940sthat Ca2+ signaling is necessary for triggering of contractions in muscle cells [Heilbrunnand Wiercinski, 1947].
22 Background
Figure 2.4: Ca2+ Signaling. A) A resting cell maintains a cytoplasmic Ca2+ con-centration of ∼100 nM creating a ∼ 20,000 fold gradient across the plasma mem-brane. Various pumps (plasma membrane Ca2+ ATPase (PMCA), smooth endo-plasmic reticular Ca2+ ATPase (SERCA)) and ion exchangers (Na+/Ca2+ exchanger(NCX), Na+/Ca2+-K+ exchanger (NCKX)) extrude Ca2+ ions from the cytosol to theextra-cellular space or into intra-cellular stores creating this enormous difference inconcentration. B) Various processes can lead to a calcium signal with concentrationsin the µM range that can last milliseconds to minutes and can act very locally, floodthe whole cytoplasm or travel in waves to neighboring cells. Small Ca2+ influxes canalso trigger Ca2+ release from internal stores, so-called Ca2+ induced Ca2+ release(CICR), amplifying the signal. Image reprinted from [Clapham, 2007] Copyright(2007), with permission from Elsevier.
Ca2+ Extrusion and Influx
A resting cell maintains a very low cytoplasmic Ca2+ concentration (∼100 nM) creatinga ∼20,000 fold concentration gradient across the plasma membrane [Clapham, 2007].This difference in concentration is achieved by the action of a number of pumps, e.g.
plasma membrane Ca2+ ATPase (PMCA) and smooth endoplasmic reticular Ca2+ ATPase(SERCA), that hydrolyze adenosine triphosphate (ATP) to remove Ca2+ ions from the cy-tosol. Additionally, ion exchangers such as Na+/Ca2+ exchanger (NCX) and Na+/Ca2+-K+
exchanger (NCKX) use the transport of Na+ and K+ ions to remove Ca2+ from the cy-tosol. The Ca2+ is either moved to the extra-cellular space or transported into internalCa2+ stores. See Fig. 2.4A for an illustration of these processes.
Various stimuli can lead to a Ca2+ influx into the cell (Fig. 2.4B). Ca2+ can act locallyin so-called flickers [Wei et al., 2009] or sparks [Haddock and Hill, 2005; Iribe et al.,2009] or propagate through a whole cell in waves [Wray, 2007]. In some cases theseCa2+ waves travel to neighboring cells via gap junctions [Sanderson and Dirksen, 1986;Sanderson et al., 1990]. Ca2+ itself can induce a stronger Ca2+ signal due to the releasefrom internal stores, amplifying the signal. This so-called CICR has been shown e.g. for
1transient receptor potential cation channel subfamily M member 7 (TRPM7)
2.1 Biological Background 23
transfected human embryonic kidney cells (HEK293) [Gromada et al., 1995].
The Ca2+ Measuring Toolbox
A large part of the current knowledge about Ca2+ could be achieved due to the develop-ment of suitable indicators and chelators for intra-cellular Ca2+ measurements. Initiatedby Tsien and co-workers in the 1980s [Minta et al., 1989; Tsien, 1980, 1981; Tsien et al.,1982] the toolbox for imaging and manipulation of Ca2+ signals has steadily grown. Thelow resting Ca2+ concentration allows the use of high affinity dyes that become fluorescentas soon as Ca2+ ions bind to it.
In the early 1980s Roger Tsien presented the acetoxymethyl ester (AM-ester) methodfor loading of Ca2+ dyes and chelators into biological cells [Tsien, 1981; Tsien et al.,1982]. This construction facilitates dye loading: the cells have to be incubated with theAM-ester of the dye, the dye diffuses freely through the membrane and gets de-esterifiedby unspecific esterases within the cell. The activated dye is a polar molecule that cannotdiffuse out of the cell anymore. By now there are many different chemical Ca2+ indicatorsavailable, each with specific properties, advantages and disadvantages. A review can befound in [Paredes et al., 2008].
The possibility to choose appropriate dyes meeting the requirements of specific exper-iments from a great variety of chemical Ca2+ indicators [Gee et al., 2000; Paredes et al.,2008] has led to a great progression in understanding of intra-cellular Ca2+ signaling. Thepossibility to genetically encode indicators specifically addressing cellular compartmentsor for performing long term measurements [Demaurex, 2005; Palmer and Tsien, 2006]allowed new approaches of research on this important second messenger.
In measurements of the kinetics of Ca2+ signals with the use of Ca2+ binding dyes,care has to be taken when choosing the experimental conditions. The dyes bind Ca2+ tran-siently which means they act as a chelator such as the non-fluorescent molecules EGTA2
and BAPTA3 on the basis of which most of the currently available dyes are developed.The Ca2+/dye complex is larger and hence diffuses slower inside the cytoplasm than a freeCa2+ ion does [Neher, 1995].
Non-fluorescent chelators, such as BAPTA and EGTA, can be used to manipulate theCa2+ signaling inside the cell [Tsien, 1980]. They bind the free intra-cellular calciumcompetitively with other binding molecules and therefore lower the concentration of thefree Ca2+ in the cytosol. If Ca2+ influx is maintained, these chelators increase the overallintra-cellular concentration of Ca2+ as the ions are hindered to diffuse to the extrusionmolecules, such as pumps and ion exchangers. As a consequence, the rate of Ca2+ ex-trusion decreases. In combination with a fluorescent dye this Ca2+ increase can be madevisible [Gyger et al., 2011].
2.1.4 Ca2+ in Cellular Contractions
In view of the ubiquitous appearance of Ca2+ in cellular signal transduction it is standsto reason to investigate its involvement in controlling contractile behavior of cells. Con-tractions of smooth muscle cells are stimulated via a global increase of the cytoplasmic
Ca2+ concentration throughout the cell [Karaki et al., 1997; Sanders, 2001]. This has beenshown, e.g. for spontaneous oscillations in the tone of blood vessels [Haddock and Hill,2005] and smooth muscle contractions in the uterus [Wray, 2007]. Also in non-musclecells contractions have been observed to be controlled by Ca2+. Rolling of detached sheetsof cultured epithelial cells depends on elevation of intra-cellular Ca2+ [Lee and Auersperg,1980] and Ca2+ induces contractions in cultured confluent monolayers of epithelial cells[Joshi et al., 2010]. Traction force microscopy of fish keratocytes revealed an 2-6 foldincrease in traction forces 4 s after a Ca2+ transient [Doyle and Lee, 2002].
These are only a few examples of many observations where Ca2+ is associated withcontractions in various cell types. In the following, some mechanisms how Ca2+ regulatescellular contractions will be presented.
Myosin Activation and Calcium
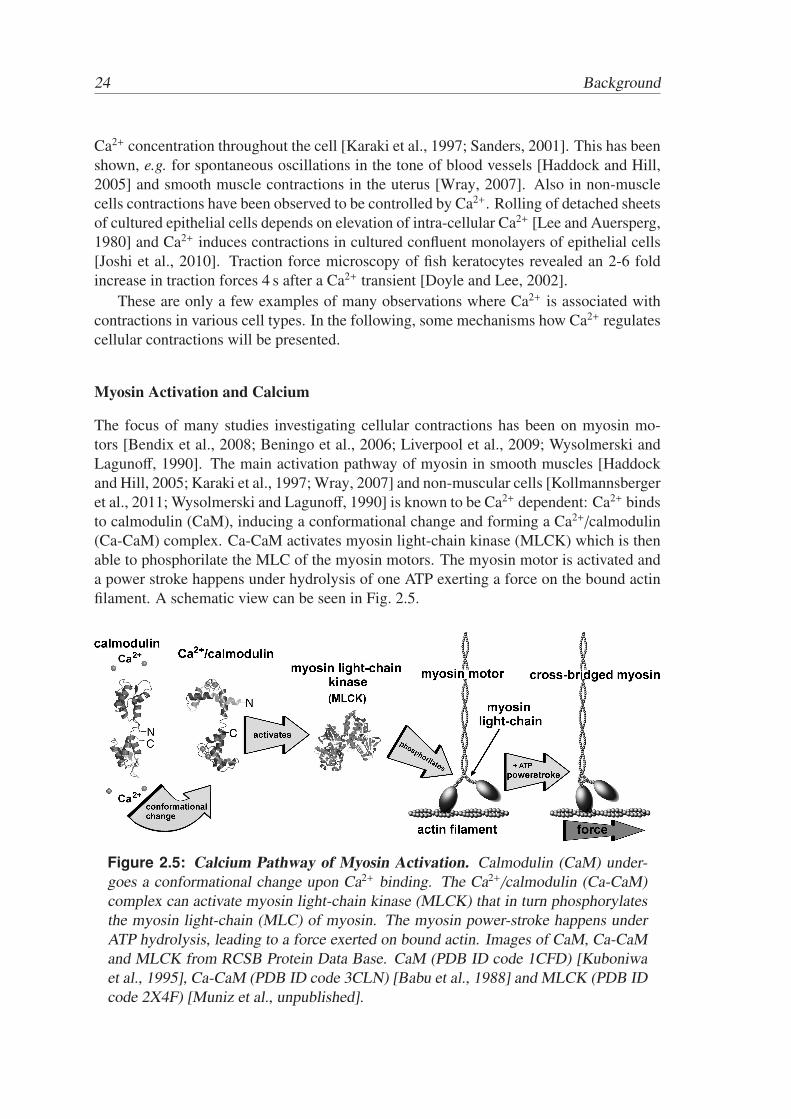
The focus of many studies investigating cellular contractions has been on myosin mo-tors [Bendix et al., 2008; Beningo et al., 2006; Liverpool et al., 2009; Wysolmerski andLagunoff, 1990]. The main activation pathway of myosin in smooth muscles [Haddockand Hill, 2005; Karaki et al., 1997; Wray, 2007] and non-muscular cells [Kollmannsbergeret al., 2011; Wysolmerski and Lagunoff, 1990] is known to be Ca2+ dependent: Ca2+ bindsto calmodulin (CaM), inducing a conformational change and forming a Ca2+/calmodulin(Ca-CaM) complex. Ca-CaM activates myosin light-chain kinase (MLCK) which is thenable to phosphorilate the MLC of the myosin motors. The myosin motor is activated anda power stroke happens under hydrolysis of one ATP exerting a force on the bound actinfilament. A schematic view can be seen in Fig. 2.5.
Figure 2.5: Calcium Pathway of Myosin Activation. Calmodulin (CaM) under-goes a conformational change upon Ca2+ binding. The Ca2+/calmodulin (Ca-CaM)complex can activate myosin light-chain kinase (MLCK) that in turn phosphorylatesthe myosin light-chain (MLC) of myosin. The myosin power-stroke happens underATP hydrolysis, leading to a force exerted on bound actin. Images of CaM, Ca-CaMand MLCK from RCSB Protein Data Base. CaM (PDB ID code 1CFD) [Kuboniwaet al., 1995], Ca-CaM (PDB ID code 3CLN) [Babu et al., 1988] and MLCK (PDB IDcode 2X4F) [Muniz et al., unpublished].
2.1 Biological Background 25
On the other hand, activated myosin light-chain phospotase (MLCP) is able to dephos-phorylate the regulatory light chain. As the activation of myosin motors depends on thisphosphorylation, the average activation of myosin in cells or cellular regions can be reg-ulated by the ratio of active MLCK and MLCP [Fukata et al., 2001; Somlyo and Somlyo,2003]. Various agonists can influence the Ca2+ sensitivity of this process [Fukata et al.,2001; Somlyo and Somlyo, 2003].
Myosin can also be activated via the Ca2+ independent rho-associated protein kinase(ROCK) pathway. Ca2+ independent deactivation of MLCP via rho activation can enhancethe myosin phosphorylation [Essler et al., 1998]. There is also evidence for direct regu-latory light chain phosphorylation by ROCK. Thus, ROCK both deactivates MLCP andactivates MLCK resulting in myosin activation. An example for this process is the stressfiber activation in the central region of adherent fibroblasts [Totsukawa et al., 2000]. Inthe Ca2+ independent rho/rho-kinase pathway the level of MLC phosphorylation is mod-ulated by inhibition of myosin phosphatase. In smooth muscle cells rho/rho-kinase alsocontributes to agonist induced Ca2+-sensitization [Fukata et al., 2001]. Traction forcesin fibroblasts are mainly regulated by the Ca2+ independent rho pathway [Beningo et al.,2006]. The Ca2+ dependent pathway via MLCK activation did not affect the traction forcegeneration in this study.
The Ca2+ dependent myosin activation pathway can be inhibited by a drug calledML-74. It blocks the MLCK and therefore interrupts the signaling cascade [Makishimaet al., 1991]. Ca2+ independent blocking specific for non-muscular myosin II can bereached by Blebbistatin which lowers the affinity of myosin to bind to actin by forming acomplex with the actin heads [Kovacs et al., 2004].
Ca2+ Influence on Polymerization and Depolymerization in the Cytoskeleton
Actin polymerization and depolymerization in cells are highly regulated by a numberof different mechanisms. Proteins of the villin superfamily, such as villin, gelsolin, andseverin, are Ca2+-regulated actin-modifying proteins [Kumar et al., 2004; Larson et al.,2005; Walsh et al., 1984]. While villin and gelsolin inhibit actin depolymerization at lowCa2+ concentrations [Larson et al., 2005; Walsh et al., 1984], villin has been shown todepolymerize actin filaments at higher Ca2+ concentrations [Kumar et al., 2004; Walshet al., 1984]. This Ca2+ induced actin depolymerization could in turn lead to contractionsof the cell as described in Sec. 2.1.2.
MTs could be shown to depolymerize when exposed to free Ca2+ [Salmon and Segall,1980]. Additionally, depolymerization of MTs induced by Ca2+ was shown to produce aconsiderable amount of force [Grishchuk et al., 2005; Molodtsov et al., 2007].
BAPTA is a highly selective Ca2+ buffer more stable under pH fluctuations in the phys-iological range than EGTA where it is derived from [Tsien, 1980]. There are indicationsthat the use of high concentrations of BAPTA-tetrakis(acetoxymethyl ester) (BAPTA,AM)(50 µM for 1h) disassembles MFs and MTs in the cytoskeleton [Saoudi et al., 2004].Whether this effect is caused by Ca2+ depletion or other side effects has, however, notbeen investigated. The effect of Ca2+ on contractions caused by depolymerization of cy-toskeletal filaments has hitherto not been in focus of investigations.
For the investigation of the influence of signaling modern genetics provides powerfultools. Proteins involved in cell signaling, such as ion channels, can be genetically trans-fected allowing to trigger controlled perturbations of these cells. In this work HEK293cells transfected with the transient receptor potential cation channel subfamily vanilloidmember 1 (TRPV1) were used in the µOS to study the influence of Ca2+ on the mechan-ics of single suspended cells. The section will outline background information on the ionchannel.
The TRPV1, previously also called vanilloid receptor 1 (VR1), has been studied in-tensively (see [Caterina, 2007; Caterina and Julius, 2001; Nilius et al., 2007] for reviews).The TRPV1 channel belongs to the family of temperature-activated transient receptor po-tential ion channels. It is slightly selective for Ca2+ over other extra-cellular cations witha permeability sequence of Ca2+ > Mg2+ > Na+ ≈ K+ ≈ Cs+ [Caterina et al., 1997].
TRPV1 is expressed mostly in nociceptive neurons (trigeminal and dorsal root sensoryganglia) predominating in a subset of neurons with small diameters [Caterina et al., 1997]and contributes to the detection of acute painful thermal and chemical stimuli [Caterinaet al., 2000; Davis et al., 2000]. Its involvement in the pathogenesis of several diseasesmakes the channel interesting as a possible target for drug treatment [Nilius et al., 2007].Examples are bladder disease [Birder, 2005], thermal hyperalgesia [Davis et al., 2000],and pain in general, e.g. tooth pain [Park et al., 2006].
The TRPV1 channels are heat sensitive having the largest open probability at temper-atures above 42 ◦C [Caterina et al., 1997]. If transfected into other cells the exact openingtemperature seems to vary slightly with the cell type. The temperature threshold for open-ing of TRPV1 channels has been estimated to be 42.6 ± 0.38 ◦C for TRPV1 transfectedChinese hamster ovary cells (CHO) and 42.0 ± 0.6 ◦C for cultured dorsal root ganglionneurons (DRG) cells [Savidge et al., 2001]. A reduction in the pH of the surroundingliquid, for instance during inflammatory responses, leads to a decrease in the openingtemperature of the channel, which can lead to an activation even at normal physiologi-cal temperatures [Tominaga et al., 1998]. At tooth pain this phenomenon is well known:while hot beverages lead to unsupportable pain reactions, cooling the aching tooth reducesthe pain immediately [Park et al., 2006].
Another well-known activator of TRPV1 is capsaicin, the pungent vanilloid compoundin hot chili peppers [Caterina et al., 1997; Tominaga et al., 1998]. This interrelationexplains why we experience spicy chili with a sensation of heat. The body also reactswith temperature reducing mechanisms, for example sweating. Subcutaneous injection of1 mg/kg capsaicin into TRPV1 expressing mice led to a reduction in body temperature of6 ◦C that needed 2 hours to recover [Caterina et al., 2000]. TRPV1 null mutant mice didnot show this reaction at all.
With continued exposure to heat or capsaicin the TRPV1 desensitizes, depending onextra-cellular Ca2+. Desensitization blocks the capsaicin response of the TRPV1 channelsin polymodal rat native nociceptive neurons of isolated skin-nerves leaving heat responseunchanged [St. Pierre et al., 2009]. In transfected HEK293 cells also the response to heatcould be shown to desensitize during stimulus application [Caterina et al., 1997]. Thedesensitization response of the channel and its involvement in pain detection makes it atarget in medical strategies, e.g. by treatment with capsaicin [Nilius et al., 2007].
2.2 Physics of Active and Passive Biological Matter 27
The water soluble dye ruthenium red (RuR) is a potent blocker of all TRPV channelfamily members [Caterina et al., 1997; St. Pierre et al., 2009; Tominaga et al., 1998].10 µM RuR blocks heat and capsaicin evoked Ca2+ influx through TRPV1 channels intransfected CHO cells and cultured DRG neurons [Savidge et al., 2001]. This concen-tration reduces the inward current through the TRPV1 channels by 90 % [Caterina et al.,1999].
2.2 Physics of Active and Passive Biological Matter
Biological cells proliferate and migrate, they exert traction forces, and show contractilebehavior in many physiologically relevant processes. All this happens under the consump-tion of energy, hence, from a physical point of view cells are active soft matter [Cates andMacKintosh, 2011]. In this chapter an overview of approaches for physical descriptionsof this complicated material will be given. To build a baseline for the understanding ofthe descriptive model derived in Sec. 4.4, the classical viscoelasticity theory will be in-troduced. This theory is intrinsically a passive description of soft matter. Thereafter thetensegrity model, which is a top-down model, that allows a more mechanistic view ofcellular mechanics, will be explained. Thirdly, phenomenological observations, such asnon-linear stress-strain behavior, will be discussed together with phenomenological ap-proaches to quantify them. Finally, a selection of bottom-up theories is presented.
2.2.1 Classical Viscoelasticity Theory
For a more detailed discussion of this topic the reader is recommended to refer to[Tschoegl, 1989]. Here, a brief overview will be given summarizing the derivations thatare necessary to understand the descriptive model including active contractions upon op-tical stretching which is presented in section 4.4.
Linear Viscoelastic Response
In general, the symmetric stress tensor σi j depends not only on the current state of thestrain tensor γi j of a viscoelastic material but also on the history of the strain function.Therefore, the stress becomes a functional S of strain. (For the stress-dependence of thestrain an equivalent formulation holds true, the focus here is on the strain-dependence ofstress. The reader may refer to [Tschoegl, 1989] for the inverse):
σi j = S[γi j
t
( τ )−∞
], (2.1)
where τ is the past or historic time; the notation indicates that τ runs from −∞ to t, whichis the present time.
The material is called linear viscoelastic if this functional fulfills the following twoconditions. First, an increase by an arbitrary factor α of the stimulus must result in a
28 Background
change of the response by the same factor, i.e.:
S[αγi j
t
( τ )−∞
]= αS
[γi j
t
( τ )−∞
]= ασi j . (2.2)
The second requirement is that the sum of the effects of an arbitrary sequence of stimulimust be the same as the effect of the sum of the stimuli:
S
[ ∞∑
n=1
γn
t
( t − τu )−∞
]=
∞∑
n=1
S[γn
t
( t − τ )−∞
], (2.3)
where t − τ is the elapsed time. To call a material linear it must, hence, fulfill a linearitycondition with respect to stress and strain and with respect to time dependence, the lattercondition can also be interpreted as time shift invariance. For most materials these con-ditions are fulfilled as long as the strain remains under the so-called linear viscoelastic
limit.Resulting from the above mentioned conditions the general equation linking time de-
pendent stress and strain is given by a linear differential equation with constant coefficientsam and bn:
∞∑
m=0
am
dnσ(t)dtn
=
∞∑
n=0
bn
dmγ(t)dtm
. (2.4)
This is one form of the general constitutive equation for a linear viscoelastic material.The equivalent integral reformulation of Eq. 2.4 was first stated by Boltzmann. It
shows that the requirement of linearity results in an principle of superposition, it is there-fore called Boltzmann superposition principle. The superposition integral reads:
σ(t) =∫ t
0Q(t − τ)γ(τ)dτ . (2.5)
This means that the stress at a time t is the linear superposition of all previously appliedstrains weighted by the function Q(t), which is called relaxance of the material, represent-ing the response of a material to a unit impulse of strain. These relatively complicatedconvolution integrals lead to simple multiplications if Laplace transformations L are ap-plied.
For a stress consisting of the sum of an infinite number of step stresses, as it is the casefor almost all physically relevant situations, one can introduce the relaxation modulus G(t)via the relaxance by:
G(t) = L−1
[L [Q(t)]
s
]=
∫ t
0Q(τ)dτ . (2.6)
This leads to a reformulation of the superposition integral:
σ(t) =∫ t
0G(t − τ)
dγ(τ)dτ
dτ (2.7)
As mentioned above the formulation for the strain γ(t) is analogous; introduction of thecreep compliance J(t) to the superposition integral for the strain yields:
γ(t) =∫ t
0J(t − τ)
dσ(τ)dτ
dτ (2.8)
2.2 Physics of Active and Passive Biological Matter 29
Phenomenological Description: Mechanical Models
The behavior of a linear viscoelastic medium under the action of stress (or equivalentlystrain) can be mimicked by a combination of springs (purely linear elastic elements) anddash-pots (purely linear dissipative elements). It has to be stated that this description doesnot give any insight into the underlying molecular or supra-molecular processes and iscompletely phenomenological. The mechanical models describing the observed behav-ior are in general not unique but can be achieved by a variety of different combinationsleading to equivalent results.
For mechanical model diagrams d’Alembert’s principle finds application. This is inanalogy to electric circuit diagrams where Kirchhoff’s voltage law is valid. The strain forparallelly combined elements is the same and hence the stresses are additive, in a serialcombination the stress acting on the elements is the same and the strain is additive.
For the simple case of a purely elastic material one obtains for the stress-strain relation:
σ = Gγ or σ(s) = G γ(s) , (2.9)
where G is the relaxation modulus introduced in Eq. 2.6. For the purely elastic case thestress is time independent. The dash refers to the Laplace transform with the (complex)variable s in the transform plane. For the purely viscous case with viscosity η one obtains:
σ = ηdγdt
or σ(s) = η sγ(s) , (2.10)
The parallel combination of a spring and a dash-pot, often referred to as a Voigt orKelvin-Voigt unit, first introduced by O. Meyer [Meyer, 1874] and reintroduced by W.Voigt [Voigt, 1892], leads to the equation:
σ(s) = (G + ηs)γ(s) . (2.11)
Retransformation gives:
σ = Gγ + ηdγdt. (2.12)
While this model is not an adequate constitutive equation for viscoelastic materials, as itcannot describe stress relaxation, it provides an important building block for more accu-rate descriptions.
The series combination of a spring and a dash-pot, also not able to describe real rheo-logical systems, but being important as building block, is referred to as the Maxwell unit.It leads to the equation:
γ(s) =(
1G+
1η s
)σ(s) . (2.13)
Multiplication by s and retransformation gives:
dγdt=
1ησ +
1G
dσdt, (2.14)
which is the equation originally proposed by Maxwell in 1867 [Maxwell, 1867]. Thismodel is able to describe the stress relaxation the Voigt unit lacks, however, strain retar-dation cannot be expressed.
30 Background
It has been shown that at least three elements are necessary for a solid-like materialand four for a liquid-like material in order to overcome the strain retardation and stressrelaxation problems of the afore mentioned units [Tschoegl, 1989].
One of the standard three-element models is the three-parameter Poynting-Thomsonmodel, where a Voigt unit is combined in series with a single spring; this is equivalent forthe right choice of parameters to a parallel combination of a Maxwell unit with a singlespring [Park and Schapery, 1999; Tschoegl, 1989]. The series combination of a Voigt unitwith a single dash-pot (or equivalently a parallel combination of a Maxwell unit with asingle dash-pot) is called three-parameter Jeffreys fluid [Park and Schapery, 1999].
Combining m Maxwell units in parallel results in the generalized Maxwell orMaxwell-Wiechert model. It has been shown that the generalized Voigt model, a se-ries combination of n Voigt units, and the generalized Maxwell model are mathematicallyequivalent for the right choice of parameters (see [Park and Schapery, 1999] and refer-ences therein).
In order to extract linear viscoelastic material properties from creep experiments, as e.g.
performed with the µOS, the measured creep compliance has to be inter-converted intoviscoelastic parameters. A rigorous conversion is shown in [Schwarzl and Struik, 1968].Park et al. [Park and Schapery, 1999] present a numerical inter-conversion method usingProny series.
Wottawah et al. [Wottawah et al., 2005a,b] used the general constitutive equation fora linear viscoelastic material (Eq. 2.4). Following the arguments by Park et al. [Park andSchapery, 1999], a sufficiently good description is given by:
a1dγ(t)
dt+ a2
d2γ(t)dt2
= σ(t) + b1dσ(t)
dt. (2.15)
The complete derivation is presented in Sec. 4.4.1 This leads to the mechanical modeldiagram called three-parameter Poynting-Thomson model, first proposed by Poynting andThomson in 1929 (see e.g. [Makris and Kampas, 2009] for a discussion), sometimes alsoreferred to as standard three-parameter Voigt model [Tschoegl, 1989].
In the µOS a step stress is applied to the cell surface, which can be described as:
σ(t) = FG σ0Θ(t)Θ(t1 − t) . (2.16)
The geometric factor FG (see Sec. 3.2.2, Eq. 3.6) accounts for the geometry of the trappedcell and σ0 is the peak stress (discussed in Sec. 3.2.1, Eq. 3.4). Inserting Eq. 2.16 intoEq. 2.15 and solving the resulting differential equation for γ(t) gives [Wottawah et al.,2005a,b]:
γ(t) = FG σ0
(b1
a1−
a2
a21
) (1 − e−(a1/a2)t
)+
FGσ
a1t , (2.17)
for 0 < t < t1, and
γ(t) = FG σ0
(b1
a1−
a2
a21
) (1 − e−(a1/a2)t1
)e−(a1/a2)(t−t1) +
FGσ
a1t , (2.18)
2.2 Physics of Active and Passive Biological Matter 31
for t > t1. Using the above mentioned Prony series approach presented in [Park andSchapery, 1999] cutting at the according order, the complex shear modulus G∗(ω) =G(ω)′ + iG′′(ω) can be extracted. The storage modulus G′(ω) can be calculated to:
G′(ω) =1
2(1 + µ)
(ω2(a1b1 − a2)
1 + ω2b21
)(2.19)
and the loss modulus G′′(ω) can be calculated to:
G′′(ω) =1
2(1 + µ)
(ωa1 + ω
3a2b1)1 + ω2b2
1
), (2.20)
where µ is the Poisson ratio and ω the angular frequency.The classical viscoelastic theory is intrinsically a linear approach assuming continuous
material properties and affine transformations. Hence, more complicated features suchas non-linearities, effects of discrete structure, and active behavior of the cell cannot becovered.
2.2.2 Cellular Tensegrity
In contrast to the classical theory of viscoelasticity the tensegrity model presented in thischapter is not based on a continuity description of the cell but assumes discrete structuresthat influence the mechanics of a cell. The concept of tensegrity will be used to discussthe possible mechanisms of cellular contractions presented in Sec. 5.3.1.
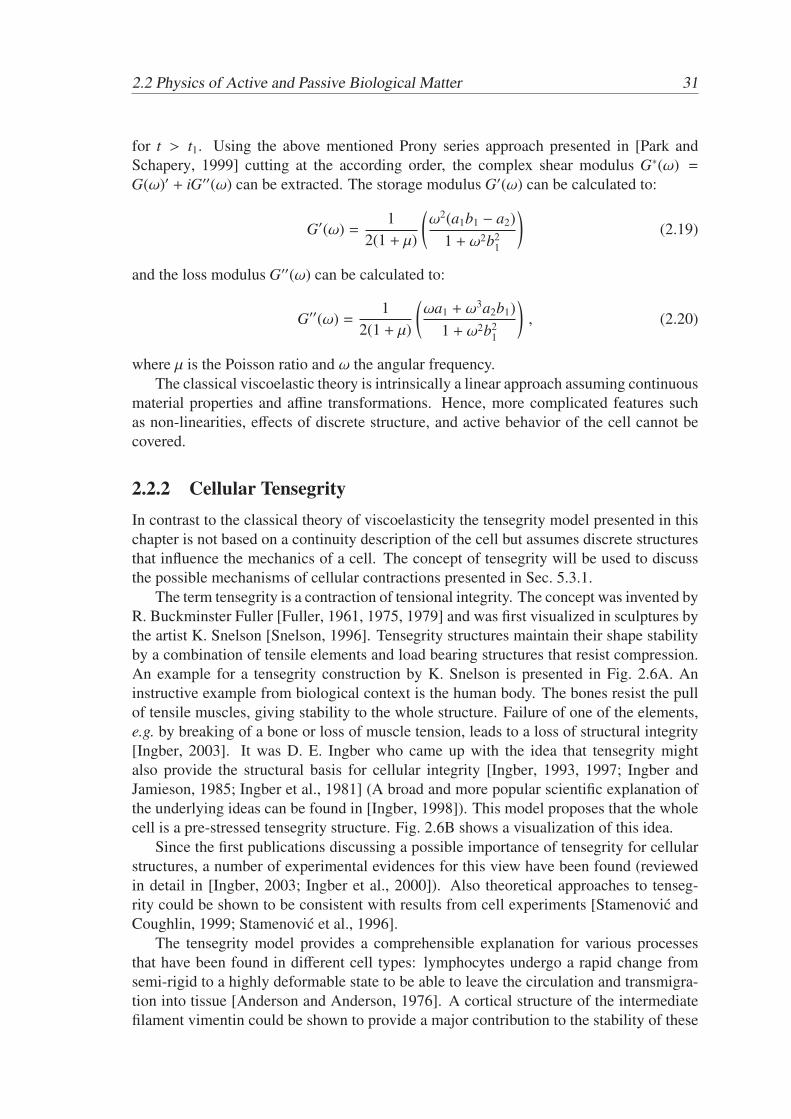
The term tensegrity is a contraction of tensional integrity. The concept was invented byR. Buckminster Fuller [Fuller, 1961, 1975, 1979] and was first visualized in sculptures bythe artist K. Snelson [Snelson, 1996]. Tensegrity structures maintain their shape stabilityby a combination of tensile elements and load bearing structures that resist compression.An example for a tensegrity construction by K. Snelson is presented in Fig. 2.6A. Aninstructive example from biological context is the human body. The bones resist the pullof tensile muscles, giving stability to the whole structure. Failure of one of the elements,e.g. by breaking of a bone or loss of muscle tension, leads to a loss of structural integrity[Ingber, 2003]. It was D. E. Ingber who came up with the idea that tensegrity mightalso provide the structural basis for cellular integrity [Ingber, 1993, 1997; Ingber andJamieson, 1985; Ingber et al., 1981] (A broad and more popular scientific explanation ofthe underlying ideas can be found in [Ingber, 1998]). This model proposes that the wholecell is a pre-stressed tensegrity structure. Fig. 2.6B shows a visualization of this idea.
Since the first publications discussing a possible importance of tensegrity for cellularstructures, a number of experimental evidences for this view have been found (reviewedin detail in [Ingber, 2003; Ingber et al., 2000]). Also theoretical approaches to tenseg-rity could be shown to be consistent with results from cell experiments [Stamenovic andCoughlin, 1999; Stamenovic et al., 1996].
The tensegrity model provides a comprehensible explanation for various processesthat have been found in different cell types: lymphocytes undergo a rapid change fromsemi-rigid to a highly deformable state to be able to leave the circulation and transmigra-tion into tissue [Anderson and Anderson, 1976]. A cortical structure of the intermediatefilament vimentin could be shown to provide a major contribution to the stability of these
32 Background
Figure 2.6: Tensegrity Structures. A) Magnification of a tensegrity structurefrom a sculpture by Snelson. A compression and a tension element are labeledto illustrate the force balance of continuous tension and local compression. B)Schematic diagram of tensegrity structures in cells. Top: Contractile force of actin fil-aments/microfilaments (MFs) and intermediate filaments (IFs) are balanced by com-pressed microtubules (MTs) and the extracellular matrix (ECM) in a region of a cel-lular tensegrity array. Bottom: When MTs are disrupted the substrate traction is in-creased. Image reproduced with permission of Journal of Cell Science from [Ingber,2003].
cells in the vessel. Correlated with changes in stiffer components of the cytoskeleton thisstructure collapses allowing the cell to deform [Brown et al., 2001]. In experiments withmicro-beads bound to the surface of cells by integrin it could be shown that stresses ap-plied to the beads propagate much faster through the cytoskeleton to the nuclear scaffoldthan any fast filament assembly could explain. This leads to the conclusion that they areindeed mechanically coupled [Maniotis et al., 1997].
D. Ingber stated in a review on the tensegrity model a framework of checkpoints thathave to be fulfilled in order to proof that the tensegrity model is applicable to the cy-toskeleton:
“First, cells must behave mechanically as discrete networks composed of different in-
terconnected cytoskeletal filaments and not as a mechanical (e.g. viscous or viscoelastic)
continuum. Second, and most critical, cytoskeletal pre-stress should be a major deter-
minant of cell deformability. And, finally, microtubules should function as compression
struts and act in a complementary manner with ECM anchors to resist cytoskeletal ten-
sional forces and, thereby, establish a tensegrity force balance at the whole cell level.”
(Reproduced with permission of Journal of Cell Science from [Ingber, 2003])N. Wang and D. Ingber used magnetic twisting cytometry (MTC) to proof the first
of these checkpoints [Wang et al., 1993]. In MTC, coated ferrimagnetic micro-beads,specifically binding to the extra-cellular matrix receptors are horizontally magnetized andconsequently vertically twisted by a homogeneous magnetic field that varies sinusodially
2.2 Physics of Active and Passive Biological Matter 33
with time [Fabry et al., 2001; Hubmayr et al., 1996; Wang et al., 1993]. Stress applied byMTC to non-adhesive receptors induced only a small resistance to mechanical distortion.However, when applied to the focal adhesion receptor β1 integrin a force-dependent stiff-ening response was observable [Wang et al., 1993]. This effect could be partially inhibitedby the application of MF, MT or IF disrupting drugs. The authors concluded that only theconcerted action of these three cytoskeletal components, not a single of them, determinesthe mechanical properties supporting the ideas of the cellular tensegrity concept [Ingber,2003; Wang et al., 1993].
Tracing fluorescently labeled mitochondria that are linked to MTs revealed that stepstresses at integrin bound beads induced displacement of mitochondria throughout thecell. Moreover, neighboring mitochondria were observed to move in different directions[Wang et al., 2001b]. These experiments visualize a distinct strain field inside the cell.Stresses seem to be transferred from the integrins via the actin MFs to MTs that span thewhole cell. In a second experiment bent MTs in cells attached to deformable polyacry-lamide gels could be shown to straighten along the direction of deformation when the gelwas stretched [Wang et al., 2001b]. This supports the hypothesis that MTs indeed providethe load bearing structure while acto-myosin is responsible for the contractile pre-stressnecessary for tensegrity. Traction force experiments while disrupting MTs with colchicinefurther confirmed the load bearing function.
Cutting fluorescently labeled stress fibers in living cells with laser nanoscissors re-sulted in a contraction of the stress fibers. This process was shown to be dependent onactive myosin in the cells [Kumar et al., 2006]. Furthermore, cutting of stress fibersin cells attached to soft ECM-protein gels induced a remarkable change in morphology.These finding support the hypothesis that the acto-myosin provides the tensile componentof the tensegrity model.
By now experimental evidence for all points in D. E. Ingber’s list have been delivered,however, tensegrity fails to explain the power-law frequency dependence observed in cells[Fabry et al., 2001; Icard-Arcizet et al., 2008]. There are also indications that rheologicalproperties of the deep cytoskeleton are independent of myosin inhibition and actin dis-ruption [Citters et al., 2006]. This poses the question whether other sources of pre-stressmight be present in these regions, or tensegrity fails to explain this behavior.
2.2.3 Power Law Rheology and the Soft Glassy Rheology Model
In this section the power-law rheology and the applicability of the soft-glassy rheology(SGR) model will be reviewed as it has important implications for the discussion of straindistribution presented in Sec. 5.3.3.
There is evidence from a large number of experiments on different cell types using avariety of measurement methods that mechanical stiffness of cells obeys a weak power-law in frequency [Desprat et al., 2005; Fabry et al., 2001; Hoffman and Crocker, 2009;Icard-Arcizet et al., 2008; Yamada et al., 2000]. Fig. 2.7 shows an overview of performedexperiments.
MTC measurements with beads specifically bound to integrin receptors on differentcell types showed that the elastic modulus increased weakly with frequency following aweak power law. Also the loss modulus at low frequencies could be shown to behavesimilarly. At higher frequencies a progressively stronger frequency dependence could be
34 Background
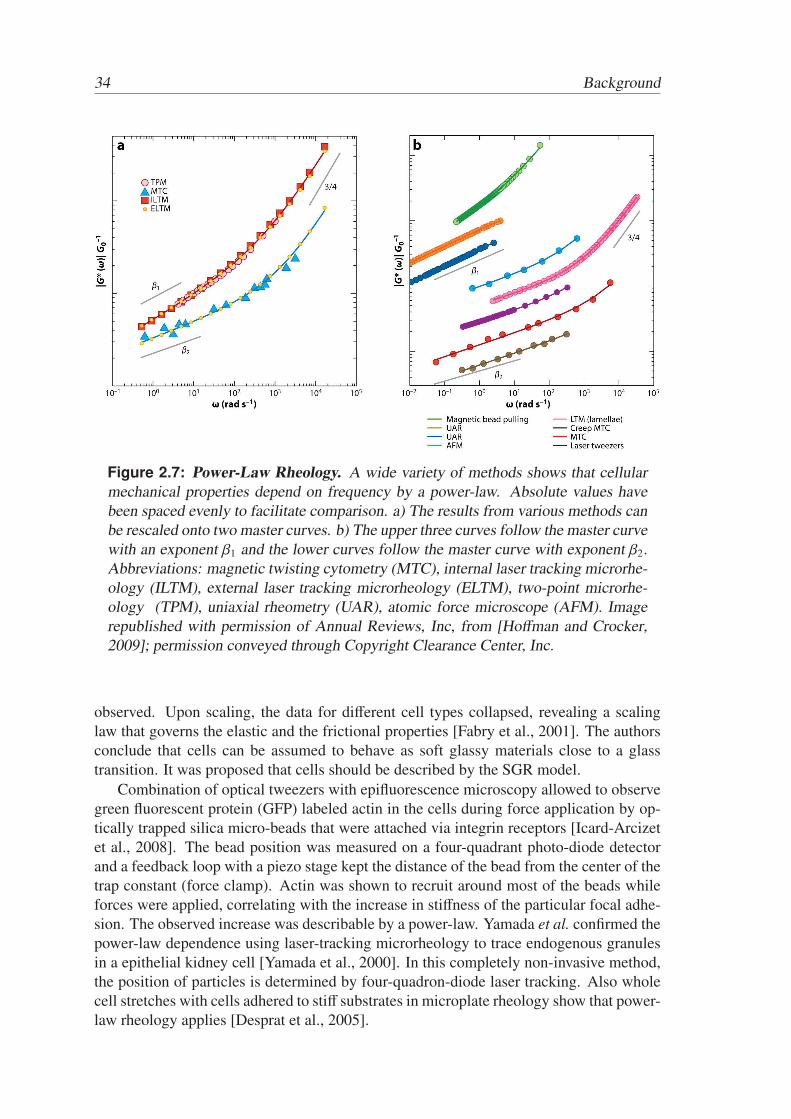
Figure 2.7: Power-Law Rheology. A wide variety of methods shows that cellularmechanical properties depend on frequency by a power-law. Absolute values havebeen spaced evenly to facilitate comparison. a) The results from various methods canbe rescaled onto two master curves. b) The upper three curves follow the master curvewith an exponent β1 and the lower curves follow the master curve with exponent β2.Abbreviations: magnetic twisting cytometry (MTC), internal laser tracking microrhe-ology (ILTM), external laser tracking microrheology (ELTM), two-point microrhe-ology (TPM), uniaxial rheometry (UAR), atomic force microscope (AFM). Imagerepublished with permission of Annual Reviews, Inc, from [Hoffman and Crocker,2009]; permission conveyed through Copyright Clearance Center, Inc.
observed. Upon scaling, the data for different cell types collapsed, revealing a scalinglaw that governs the elastic and the frictional properties [Fabry et al., 2001]. The authorsconclude that cells can be assumed to behave as soft glassy materials close to a glasstransition. It was proposed that cells should be described by the SGR model.
Combination of optical tweezers with epifluorescence microscopy allowed to observegreen fluorescent protein (GFP) labeled actin in the cells during force application by op-tically trapped silica micro-beads that were attached via integrin receptors [Icard-Arcizetet al., 2008]. The bead position was measured on a four-quadrant photo-diode detectorand a feedback loop with a piezo stage kept the distance of the bead from the center of thetrap constant (force clamp). Actin was shown to recruit around most of the beads whileforces were applied, correlating with the increase in stiffness of the particular focal adhe-sion. The observed increase was describable by a power-law. Yamada et al. confirmed thepower-law dependence using laser-tracking microrheology to trace endogenous granulesin a epithelial kidney cell [Yamada et al., 2000]. In this completely non-invasive method,the position of particles is determined by four-quadron-diode laser tracking. Also wholecell stretches with cells adhered to stiff substrates in microplate rheology show that power-law rheology applies [Desprat et al., 2005].
2.2 Physics of Active and Passive Biological Matter 35
It has been shown for airway smooth muscle cells that their linear dependence ofthe stiffness on the contractile pre-stress in the cell is interrelated with the power-lawdependence of the stiffness on the frequency [Stamenovic et al., 2004]. In a magnetictweezers study the creep responses of fibroblasts and epithelial cells were shown to followa weak power-law time dependence even for large applied forces leading to non-linearresponses of the cells. It was shown that the sum of pre-stress and the applied externalstress determines the stiffness of the cell [Kollmannsberger et al., 2011].
In 2009 Hoffman et al. compared data from a large number of different cell typesmeasured with a variety of methods [Hoffman and Crocker, 2009]. They discovered thatall the data they considered can be fitted by the sum of two power laws, whereas the firstexponent β1,2 takes values between 0.1 and 0.3 and the second exponent is 3/4. The resultscould be rescaled to two master curves with β1 = 0.24–0.29 and β2 = 0.13–017 (See alsoFig. 2.7). The authors speculated that the two curves represent the mechanical propertiesof distinct regimes in the cell.
Measurements with the µOS of suspended cells seem to be an exception to power-lawrheology [Wottawah et al., 2005a,b]. However, Maloney et al. reported an offset-power-law dependence of human mesenchymal stem cells measured in the µOS. The offset-power-law was fitted to the average of the measured strains [Maloney et al., 2010].
If power-law rheology applies, the strain of the cells is expected to follow a log-normaldistribution [Fabry et al., 2001; Hoffman et al., 2006]. In first papers with the µOS thenumber of measured cells was small. Gaussian distributions were fitted to these data setsin order to extract an average strain and the corresponding measurement uncertainties[Guck et al., 2005]. As will be shown in Sec. 4.3, distributions of the strain measuredin the µOS are in general not symmetric. Also the features of individual graphs are notfound in the behavior of every single cell. Calculation of the mean and standard errorpropagation is, thus, not an adequate tool to analyze the obtained data.
Critical comparison of theoretical predictions of SGR models with the measured be-havior in cells reveals a number of inconsistencies. Mandadapu et al. found that the dataof frequency sweeps recording storage and loss moduli at low amplitudes as well as therelaxation behavior of the cytoskeleton after large perturbations are consistent with thepredictions of the SGR model assuming a noise temperature above equilibrium [Man-dadapu et al., 2008]. Measurements of local Brownian dynamics of embedded tracerparticles violate Stokes-Einstein behavior, and hence suggest that the system is in a glassystate below the glass transition temperature. The authors, therefore, see inconsistencieswith the SGR model, unless the system is assumed to be in a non-equilibrium state. How-ever, the power-law behavior follows from the SGR model only if the time-temperatureinvariance holds, that is strictly speaking only true near equilibrium.
An extension of the observed frequency range to very low frequencies by Stamen-ovic et al. revealed two regimes with different power-laws that were cell type specificand connected by a well defined plateau regime without power-law behavior [Stamenovicet al., 2007]. This finding was confirmed by [Chowdhury et al., 2008], who proposed non-equilibrium-to-equilibrium transition of non-covalent bonds as possible origin for the tworegimes.
36 Background
2.2.4 The Glassy Worm-Like Chain Model
An approach accounting for the observed power-law behavior in cellular rheology is theglassy worm-like chain model which is an extension of the the worm-like chain model.Semi-flexible polymers show an entropic elasticity [MacKintosh et al., 1995]. The worm-like chain model combines this effect with friction of thermally fluctuating filaments ina viscous fluid [Gittes and MacKintosh, 1998]. The elastic shear modulus calculatedwith this approach is able to explain the high frequency scaling behavior of semi-flexiblepolymers, observed in filamentous actin (F-actin) solutions [Schnurr et al., 1997].
In the glassy worm-like chain model the weakly-bending rod limit of the worm-likechain model is extended to incorporate that the cytoskeletal fibers interact with surround-ing polymers. To this end, the relaxation times of all eigenmodes with a wavelength longerthan a characteristic interaction length are multiplied by a factor that exponentially growswith the number of interactions per wavelength [Kroy and Glaser, 2007; Semmrich et al.,2007]. This factor accounts for the interactions of the polymers at longer time scales incontrast to non-interacting single polymer dynamics for short times.
The introduced parameter can be understood as a characteristic height of the free en-ergy barriers determining the retardation of the relaxation. A mechanistic derivation ofthis parameter has not been achieved up to now [Kroy and Glaser, 2007], making thisapproach in part bottom-up and partially a phenomenological derivation of cellular me-chanical properties. However, the glassy worm-like chain model successfully describesthe experimentally observed logarithmic tails of the dynamic structure factor measuredin dynamic light scattering experiments on reconstituted high concentration F-actin solu-tions [Semmrich et al., 2007], as well as essential features of power-law rheology [Kroyand Glaser, 2007].
2.2.5 Non-Affine Transformations and Non-Linear Rheology
To evaluate whether the new model for the description of contracting suspended cellsderived in Sec. 4.4 is applicable to the measured strains, it is important to consider non-linear effects that are observable in cells. The discussion will be presented in Sec. 5.3.2,here essential findings of non-affinity and non-linearity observed in rheology experimentswith a variety of techniques will be reviewed.
A transformations is called affine if straight lines are preserved, i.e. points that lie ona straight line before the transformations will be connectable by a straight line after thetransformation. This does not imply conservation of distances and angles. A schematicview of a non-affine deformation can be seen in Fig. 2.8. For semi-flexible polymers, e.g.
actin networks, it has been shown that the affinity of the polymer gels depends on thefilament length and the cross-linker density: the smaller the filaments and the lower thecross-linker density, the larger the non-affinity under deformation [Head et al., 2003a,b;Liu et al., 2007]. 2D modeling of such networks predicts that under non-affine conditionsthe deformation is dominated by filament bending, while at affine deformations it is gov-erned by stretching and compressing the filaments [Head et al., 2003a,b]. Therefore, inthe affine regime non-linear extensional properties of individual filaments should lead tostrong strain stiffening [Head et al., 2003a].
In situ experiments with cross-linked MF gels reveal considerable stress stiffeningat high cross-linker concentrations and high filament densities. These non-linear effects
2.2 Physics of Active and Passive Biological Matter 37
Figure 2.8: Non-Affine Deformations. Affine and non-affine shear deformation ofa polymer gel with tracer beads. Reprinted with permission from [Basu et al., 2011].Copyright (2011) American Chemical Society.
disappear when the cross-linker concentration or the filament density is lowered [Gardelet al., 2004] coinciding with the above described transition to non-affine deformations.Actin networks, cross-linked with α-actinin could be shown to strain harden at short timescales while they soften at long time scales [Xu et al., 2000].
Living cells contain a huge number of different polymers, such as different cytoskeletalfilaments, various cross-linkers, and motor proteins. Hence, the situation is far morecomplicated as in the simple reconstituted systems. Several attempts to approach thecomplexity of living cells have been made. The addition of even small concentration ofstiff MTs to MFs gels strongly enhances stress stiffening [Lin et al., 2011]. Non-linearresponses of reconstituted actin networks have been shown to depend strongly on thestructure of cross-linking molecules [Wagner et al., 2006]. Addition of active componentssuch as molecular motors further increases the stiffening of actin gels studied in vitro
[Mizuno et al., 2007] or in 2D simulations [Broedersz and MacKintosh, 2011].In living cells active stress stiffening was shown using microplate rheology [Fernandez
et al., 2006]. To this end, single fibroblasts were held at a constant elongation and the me-chanical properties were measured recording the cellular response to oscillations with asmall amplitude and varying frequency. In a similar experiment at small deformations thestress stiffening could be reproduced, while at large deformation a linear force-length rela-tion was measured coinciding with the irreversiblility of the cellular response [Fernandezand Ott, 2008]. In vitro systems consisting of actin filaments cross-linked by filamin Athat are contracted by bipolar filaments of muscle myosin II indicate that externally ap-plied stress and internally generated pre-stress have the same effect on the non-linearstiffness of the material [Koenderink et al., 2009]. This finding was confirmed by data
38 Background
on a wide range of different cell types identifying the sum of pre-stress and externallyapplied stress as the parameter controlling differential stiffness [Kollmannsberger et al.,2011]. Systems consisting of a combination of active and passive cytoskeletal compo-nents show a wide range of possible stiffnesses, myosin motors have been shown to beable to stiffen these networks up to 100-fold in an ATP dependent manner [Mizuno et al.,2007]. These mechanisms suggest, that the cell is able to tune its mechanics according tothe physiological task that has to be fulfilled, making use of non-linearities in cytoskeletalresponses [Koenderink et al., 2009; Mizuno et al., 2007].
2.2.6 Bottom-Up Models for Cellular Mechanics
In the literature a large variety of bottom-up approaches for cellular mechanics can befound, each addressing specific effects found in cells such as non-linear properties of con-stituents or motor activity. While the glassy worm-like chain model described in Sec. 2.2.4is a hybrid of the bottom-up worm-like chain approach and a phenomenological exten-sion to account for interactions of the filaments, other approaches deduce the mechanicalproperties strictly from the assumed underlying mechanisms. Here these models will beoutlined without going into details. The interested reader is referred to more detailed re-views by Kollmannsberger et al. [Kollmannsberger and Fabry, 2011] or Hoffman et al.
[Hoffman and Crocker, 2009].
None of the following models claims to reach a complete description of the complexmechanics of the cytoskeleton, indeed, each of them has a valuable contribution to under-stand the effect of known cytoskeletal processes to the mechanical properties on cellularscale.
Dynamic Cross-Links
It is known that several MF cross-linking proteins, for instance actinin [Rief et al., 1999;Schwaiger et al., 2004] and filamin [Furuike et al., 2001], unfold at a critical pulling force.It has been shown in 2D simulations that a MF network cross-linked with filamin reachesa fragile mechanical state under strain. In this state a large fraction of the cross-linking fil-amins experiences a critical unfolding strain [DiDonna and Levine, 2006]. Incorporationof thermally driven cross-linker unbinding could be shown to be insufficient to explain thefragile state and cross-linker unfolding is required [Hoffman et al., 2007].
Cross-link unfolding results in an unusual stress relaxation spectrum that was sug-gested to give rise to non-universal power-law rheology similar to that seen in cells [Di-Donna and Levine, 2007]. The observed fragile state was also hypothesized to suit wellwith requirements for mechanosensing in cells [Hoffman et al., 2007].
In an approach by Broedersz et al. a different mechanism also relying on dynamiccross-linkers is investigated. The filaments are assumed to be stiff rods and the cross-linkers are modeled as flexible worm-like chains [Broedersz et al., 2008]. This flexiblecross-linker model also reproduces the non-linearities in cellular mechanics of the consid-ered experiments.
2.2 Physics of Active and Passive Biological Matter 39
Pre-Stressed Semi-Flexible Polymer Chains
In Monte Carlo simulations a model for a semi-flexible polymer locally restricted bysurrounding polymers to a tube was investigated [Majumdar et al., 2008; Rosenblatt et al.,2006]. The combination of pre-stress in the filament and the assumption of non-linearpolymer chain elasticity could reproduce the power-law in the creep, that is also observedfor whole cells. The authors concluded that the nonlinear dynamics of single polymerchains under tension may account for the unusual behavior of whole cells in rheology[Rosenblatt et al., 2006]. This approach could bridge the shortcoming of the tensegritymodel to explain power-law rheology [Hoffman and Crocker, 2009]. However, it relieson the assumption that chain dynamics is thermally driven, which is not observed forcytoskeletal dynamics [Stamenovic, 2008].
Motor Driven Active Gels
Obviously the most striking feature of muscle cells is their ability to contract. It wereAndrew Huxley et al. [Huxley, 1957; Huxley and Niedergerke, 1954] and Hugh Huxleyet al. [Huxley and Hanson, 1954] who came up independently with the ideas that led tothe sliding filament theory explaining skeletal muscle contraction [Huxley and Simmons,1971]. It is well known, that also non-muscle cells need to contract to perform theirphysiological tasks [Bement et al., 1993; Jacinto et al., 2000; Martin et al., 2009; Tamadaet al., 2007]. While in some models activity is incorporated by contractile pre-stress andATP hydrolysis, none of the theories mentioned so far accounts for active contractions ofnon-muscle cells.
Almost all types of cells contain different isoforms of myosin motors (see Sec. 2.1.2).In reconstituted systems consisting of actin filaments and active myosin, the motor activitygenerates sliding of filaments that replaces reptative motion, which leads to fluidization ofthe network [Humphrey et al., 2002]. The additional introduction of cross-linkers impedesthis fluidization and non-linear properties similar to those observed in cells, for instanceunexpected diffusive motion [Lau et al., 2003], stress stiffening [Mizuno et al., 2007], andcontractions [Bendix et al., 2008], can be reproduced. These observations led to theoriesfocusing on motor activity as the force generating mechanism.
Myosin motors can form processive minifilaments, that are able to exert forces onMFs (see Fig. 2.9). It was shown by Mizuno et al. that these minifilaments can stiffen across-linked actin gel up to 100 fold, depending on the ATP concentration [Mizuno et al.,2007]. A combination of active and passive micro-rheology was used to show that myosinactivity caused a violation of the fluctuation dissipation theorem in this reconstituted sys-tem. Also non-thermally driven motions of embedded tracer beads could be reproduced.Build on these observations, a theory was derived linking myosin activity with large scalemechanics of the network [Mizuno et al., 2007]. This line of thought provides a possibleexplanation, how cells can tune their mechanical properties e.g. when reacting to substratestiffness.
Liverpool et al. constructed a model of permanent cross-linked actin filaments with alength shorter than their persistence length and incorporated active cross-linkers that exertopposing forces on two transiently bound filaments [Liverpool et al., 2009]. This modelallows to reproduce non-linear observations from reconstituted systems such as stressstiffening [Mizuno et al., 2007] and contractions [Bendix et al., 2008]. Furthermore, the
40 Background
Figure 2.9: Myosin Contractility in Actin Networks. A myosin minifilament (cen-ter) consisting of a bundle of myosin motors with active head groups at both ends ofthe filament exerts a contractile stress in the actin filaments (gray lines) resulting ina contraction between cross-links (dark circles). Image from [Mizuno et al., 2007].Reprinted with permission from AAAS.
model predicts a softening of the network at zero frequency, which has not been observedin experiments up to now.
MacKintosh et al. considered a viscoelastic homogeneous and isotropic medium andincorporated uncorrelated motor activity as a pair of forces that are equal and opposite[MacKintosh and Levine, 2008]. With the aid of this approach stress-fluctuations anddiffusive-like motion measured in cells [Lau et al., 2003] can be explained by the bindingand unbinding kinetics of molecular motors. Also stiffening of cells observed in in vitro
experiments [Mizuno et al., 2007] could be mimicked. Allowing compressibility of thenetwork, the motors could be shown to induce density fluctuations in the network.
In summary, there is a variety of models on cellular mechanics available, each explain-ing particular experimental observations. All models able to reproduce contractions in thecell rely on the a priori assumption of motor activity. In this work, a descriptive modelbased on the classic viscoelastic theory is introduced. By incorporation of an active stressterm, cellular contractions can be quantified. While this phenomenological approach can-not give a direct access to the microscopic origins of contractions, it allows to classifythe influence of different contractile mechanisms in an unbiased way. The model will beintroduced in Sec. 4.4.
Chapter 3
Materials and Methods
This chapter gives a detailed explanation of the applied techniques and the materials usedin the presented experiments. At first, the setup and the working principle of the µOSare introduced followed by some comments on the theoretical background of the analy-sis of data obtained by µOS measurements. Thirdly, the experimental methods used fordetermining the temperature during the Optical Stretching are explained. Forthly, a com-bination of the µOS with CLSM, that was developed to allow Ca2+ imaging in the µOS,is presented. The temperature measurements and the fluorescent imaging are importantprerequisites for the measurement of HEK293 cells transfected with the TRPV1 channel(HEK293-TRPV1) in the µOS. The automated setup and the extraction of the strain databy optical video microscopy will be explained in the penultimate section. The last partdescribes the cell culture procedures and how the drugs manipulating the Ca2+ signal wereapplied.
3.1 Working Principle of the Optical Stretcher
Already in 1970 A. Ashkin presented a divergent laser trap of two counterpropagatinglaser beams and stated that it should in principle be able to deform soft particles [Ashkin,1970]. Constable et al. proved that it is possible to trap cells with this setup [Constableet al., 1993]. They were able to trap hard polystyrene beads and soft yeast cells. Experi-mental evidence for the deformation of the soft materials was first presented by Guck et
al. in 2000 [Guck et al., 2000, 2001, 2002] who used a similar geometry for stretching ofsingle suspended cells. This way, they were able to measure mechanical properties of sin-gle suspended cells without mechanical contact to the cell surface. The Optical Stretcheris a spreading technology. Today, this technique can be found in several groups all overthe world.
3.1.1 The Optical Stretcher – A Two Beam Laser Trap
A dielectric fluid, such as the water inside the cell, consists of randomly oriented, freelyrotatable dipoles. An electric field, for example the light of a laser beam, induces anorientation of these dipoles. For a laser with a Gaussian intensity profile this effect causesa gradient force (Fgrad) towards the highest intensity, which is able to pull a cell into thecenter of the beam similar to the forces in optical tweezers [Ashkin and Dziedzic, 1987;
42 Materials and Methods
Figure 3.1: Optically Induced Gradient and Scattering Force. The laser beamsemerging from the optical fibers in the µOS have a Gaussian shaped intensity profile.Water, the main component inside the cell, is a dielectric medium and, hence, experi-ences a force Fgrad in this electric field gradient due to polarization effects. The cellis pulled into the region of highest laser intensity. Part of the light is reflected at thecell surface, this gives rise to a scattering force Fscat.
Ashkin et al., 1986, 1987]. As cells have a higher refractive index than the surroundingmedium [Guck et al., 2005], a small fraction of light is reflected. For a single beam,this results in a scattering force (Fscat), pushing the cell away from the laser source (seeFig. 3.1).
The forces in the µOS can also be explained with the ray optics approach: due tothe higher refractive index of the cell compared to the surrounding medium the laserbeam gets refracted according to Snell’s law when entering and exiting the cell. As themomentum of the beam has to be conserved under this directional change a force actson the cell. This force, again, can be split up into one component pointing towards thehighest beam intensity (Fgrad) and one component pointing away from the beam source(Fscat) (see Fig. 3.2). For a symmetric trap of two counterpropagating divergent laserbeams, there is a point in the center where the scattering forces cancel resulting in a stabletrap region.
3.1.2 Optical Surface Forces
In the µOS cells are visibly stretched along the direction of beam propagation. The stretch-ing force originates from the difference in refractive indices. In Fig. 3.3 this effect isdemonstrated in a gedankenexperiment adapted from [Guck et al., 2001]. The momentumof a photon is given by pphoton = ni∆E · c−1, where E is the energy, ni the refractive indexof the medium and c the speed of light in vacuum. Hence, light entering a medium witha higher refractive index gains momentum. The ratio of back reflected light can be calcu-lated by the Fresnel formula [Jackson, 1975]. As the difference in refractive indices of thecell and the surrounding medium is small, the momentum transfer due to reflection pr isan order of magnitude smaller than momentum gain inside the cell. Due to conservation
3.1 Working Principle of the Optical Stretcher 43
Figure 3.2: Optically Induced Force, Ray Optics Approach. The light is refractedat the cell surface according to Snell’s law. Due to conservation of momentum thisdirectional change of the light beams results in a force (F1, F2). At the side of thehigher beam intensity the force is higher and, hence, a net force Fnet acts on the centerof mass of the cell towards the highest field intensity of the Gaussian laser beam.
of momentum a force Fsurface = ∆p/∆t, with ∆p = p1+ pr− p2, p1 being the momentum ofincoming light, and p2 that of the transmitted beam, is transferred to the surface pointingaway from the optically denser medium. In the center of a symmetric two beam trap thescattering forces cancel and the surface forces exerted by either of the beams add up to asymmetric force profile. It was shown that all forces act perpendicular to the cell surface.For a detailed discussion of these forces see chapter 3.2.1.
44 Materials and Methods
Figure 3.3: Gedankenexperiment: Momentum Transfer to the Cell Surface.
Only a small fraction of the light is reflected at the surface and the momentum isproportional to the index of refraction, which is slightly higher inside the cell than inthe surrounding medium. Hence, the momentum of the light is larger inside the cell,resulting in a force on the cell surface pointing outwards. The gedankenexperiment isadapted from [Guck et al., 2001].
3.2 Theory and Quantification of Measurements
Up to now, there are no methods available to directly measure the spatially resolved stresson the cell surface in the µOS. However, different mathematical and computational modelshave been proposed to determine the stress distribution caused by the optically inducedsurface forces. To obtain material parameters from the measured strain, a stress-strainrelation is necessary. This section is meant to give a critical overview over the publishedtheories.
3.2.1 Surface Force Calculations
Maxwell Stress Tensor
The stress distribution σ on the surface of a particle exerted by the electromagnetic field(E,H) can, under steady-state conditions, be expressed as the dot product of the unitnormal vector to the particle surface n and the time-averaged Maxwell stress tensor 〈A〉[Jackson, 1975],
σ = n · 〈A〉 , (3.1)
where:
〈A〉 =12
Re[ǫEE
∗ + µmHH∗ −
12
(ǫ |E|2 + µm|B|
2)
I
], (3.2)
I being the unit tensor, ǫ the permitivity, and µm the permeability of the medium.The cell and the surrounding medium in the µOS is assumed to be linear, isotropic,
and non-magnetic. Hence, the surface stress σ assumes the following form in sphericalcoordinates [Xu et al., 2009]:
σ = er · 〈A〉 =12
Re[ǫEr E
∗ + µmHr H∗ −
12
(ǫ |E|2 + µm|B|
2)
er
], (3.3)
3.2 Theory and Quantification of Measurements 45
where Er and Br are the radial component of the electric and magnetic field, respectively.The total stress on the surface is the sum of the stresses caused by the field inside andoutside the object. Applying the boundary conditions for electric and magnetic field atthe surface it can be shown that the components along eθ and eφ vanish. Thus, the stress ispointing in the direction of the outward normal er in every point of the surface [Xu et al.,2009]. This result can also be obtained using geometrical optics [Bareil et al., 2006; Xuet al., 2009].
Ray-Optics Approaches
In the first publications by Guck et al. a calculation based on ray-optics (RO) was pre-sented [Guck et al., 2000, 2001]. The incident laser beam was decomposed into individ-ual rays with appropriate intensity, momentum, and direction described by geometricaloptics. This approach neglects diffraction effects, which is valid under the assumptionthat the scattering objects are much larger than the used wavelength.
The direction of the transmitted ray is given by Snell’s law and reflection and trans-mission coefficients are obtained from the Fresnel formulas [Jackson, 1975] by averagingover the polarization directions, assuming the resulting error to be small. The influence ofsubsequent reflections and refractions was assumed to be small and therefore neglected.The authors stated that this theory was checked by single laser beam ’shooting experi-ments’ using the acceleration of silica and polystyrene beads, RBCs, and, as a model foreukaryotic cells, BALB/3T3 mouse fibroblasts. The stress distribution was approximatedby
σ(φ) = σ0 cos2(φ) , (3.4)
where σ0 is the peak stress and φ the angle to the beam axis. With this approach theequations of deformation could be solved analytically. For RBCs the cell elasticity couldthen be determined from the observed strain. Deviations from the theory due to the stressinduced ellipticity in the objects were neglected in this approach.
The shooting experiments rely on the equality of viscous drag force (Stokes friction)and scattering force:
Fscat = 6πηav , (3.5)
where η is the viscosity of the medium, a the radius of the particle and v the velocity ofthe particle that can be easily measured by digital image analysis. A difficulty that wasnot discussed in [Guck et al., 2000] and [Guck et al., 2001] is the fact that the viscosityη = η(T ) is a function of temperature. In later investigations it turned out that the temper-ature increases significantly during the µOS experiment [Ebert et al., 2007; Wetzel et al.,2011] due to absorption of laser light by the fluid in the optical trap. In the first pub-lications measurements were performed with λ = 785 nm, a wavelength which is muchless absorpted by water than the λ = 1064 nm used in [Ebert et al., 2007]. Neverthe-less, temperature changes during the measurements have to be taken into considerationin future investigations, especially if for convenience and availability of laser sources aλ = 1064 nm laser is used.
The RO model was extended by Ananthakrishnan et al. to be applicable to other eu-karyotic cells whose mechanical properties are predominantly influenced by the actin cor-tex [Ananthakrishnan et al., 2005, 2006] (also see Corrigendum: [Ananthakrishnan et al.,2008]). The cos2 term was replaced by cosn, an analytical expression that modeled the
46 Materials and Methods
numerically calculated stress distribution more accurately. n is even, as the stress is axi-ally symmetric, and n = 2 refers to a broad stress distribution and the maximal value ofn = 24 to a rather narrow stress distribution.
Newer calculations using the RO model [Bareil et al., 2006; Xu et al., 2009] and theapplication of ray-tracing methods [Ekpenyong et al., 2009] revealed a quite large devia-tion form the cosn approximation. If the cell is assumed to be a spherical, homogeneousobject, then RO predicts well-defined stress spikes for the stress distribution at the shad-owed site of each laser beam. Their position and intensity depends strongly on the ratiobetween cell size and beam width at the cell’s position.
Stress Calculation by Solving Maxwell-Equations
Boyde et al. [Boyde et al., 2009] presented a hybrid analytic-numerical approach for cal-culations of the stresses exerted by the Gaussian laser beam in the µOS. The regime inwhich the particle deviates from a sphere only by a few percent and is comparable in sizeor smaller than the incident wavelength was solved analytically based on first-order pertur-bation theory. For scattering particles larger than the incident wavelength deviating from asphere by up to thirty percent a hybrid analytic-numerical approach based on higher orderperturbation theory was developed. Lowest-order fields were thereby found by standardMie theory and higher-order corrections by an adapted point-matching method account-ing for tangential and perpendicular boundary conditions. The stress was then calculatedfrom the fields using the Maxwell stress tensor (see Sec. 3.2.1). The obtained stresses de-pended sensitively on the choice of parameters. It turned out that for large fiber distancesa highly oscillatory stress distribution is observed. The divergence of the beam in the µOSis not considered in the calculation and the interior of the scattering object in the µOS -usually a biological cell - is assumed to be homogeneous and rotationally symmetric.
Xu et al. [Xu et al., 2009] applied a generalized Lorenz-Mie theory (GLMT), an ex-tended Lorenz-Mie theory accounting for the Gaussian shape of the incident beam, andcompared it to the RO calculation and a Debye series solution. This comparison also re-vealed inaccurate results for the RO approach as interferences between superposing rayswhile creating the stress on the sphere surface cannot be considered. At the shadowed sideof the illuminated particle RO calculations produced sharp stress peaks, which passed tooscillatorily distributed intensities in GLMT with a far lower amplitude than predictedfrom RO. The deformation of the cell during the stretch was not taken into account in thisstudy.
All of these approaches considered the cell to be an spherical or ellipsoidal object withhomogeneous refractive index. This neglects the surface fluctuations and the fact that theinternal structure is highly inhomogeneous due to inner organelles and the nucleus, whichhas a different refractive index than the cell soma. The inhomogeneous internal structureand the fluctuations, however, might smear out the calculated oscillatory structures in thestress profile. Direct measurement and incorporation of these effects are still an importanttask to understand the real stress profile in the µOS.
3.2 Theory and Quantification of Measurements 47
3.2.2 Approximations of the Stress-Strain Relation
All of the presented models for a stress-strain relation of single suspended cells assumea linear elastic or viscoelastic behavior of the cells, mostly stating that this holds true inapproximations for small strains. In a thorough revision of the current literature on thistopic no test whether the cells really meet these assumptions could be found.
Elastic Thick Shell Model for the Actin Cortex and Geometric Factor
In order to investigate the structural role of the actin cortex and its individual contributionto the cell’s overall structural response, in [Ananthakrishnan et al., 2006] an elastic thickshell model adapted from [Lure, 1964] was proposed. It describes the radial deformationof an elastic shell of thickness r0 − r1, where r0 and r1 are the outer and inner radius.The deformation is a response to the axially symmetric radiation-induced radial stressσ on a cell in the µOS. As mentioned in Sec. 3.2.2, the numerically calculated spatialstress distribution was approximated by σ = σ0 cosn φ. This leads to an expression for therelative radial deformation of the cell w/r0:
w
r0=σ0FG(r0, r1, φ, µ)
G, (3.6)
where G is the shear modulus of the shell (actin cortex) and FG is the geometric factorof the thick shell, arising from its spherical geometry and the distribution of optical stressapplied to it. The Poisson ratio µwas set to 0.5, assuming an incompressible material. Thethick shell model was reported to be able to describe the deformation of the cells only fora localized surface stress accurately. Ananthakrishnan et al. showed that the determinedresults for the compliance depend strongly on the choice of a proper geometric factor.
Transient Network Model
The second model analyzed in [Ananthakrishnan et al., 2006] was an expansion of a per-manently or fully cross-linked, tightly entangled, isotropic actin network [Gardel et al.,2004; MacKintosh et al., 1995] by incorporating a transient character of the actin cross-links. The transiently cross-linked network model allowed to calculate the shear modulusof an actin network of given actin and cross-linker concentration. Given the cortical shearmodulus of a cell obtained from the thick shell model, the transient network model pre-dicted the cortical actin and cross-linker concentrations.
Three-Layered-Coupled-Sphere Model
In a third step, Ananthakrishnan et al. constructed a structural model for the cell by thecombination of three elastic thick shells as described in Sec. 3.2.2 [Ananthakrishnan et al.,2006]. The considered shells were the outer actin cortex, the interior assembly of poly-mers (MTs, IFs and some MFs), and – in the limit of a sphere, i.e. with inner radiusequal to zero – the nucleus. An appropriate combination of slip and no-slip boundaryconditions was obtained by fitting the theory to experimental data. It was shown thatthis three-layered model is better in explaining deformations at broad distributions of thesurface stress than results obtained from the assumption of a single actin cortex. The influ-ence of the stiffness of MTs on the interior network was investigated by a parameter study
48 Materials and Methods
varying the modulus of MTs. A change of the modulus from 100 Pa to 50,000 Pa resultedin a difference of whole cell deformations of only ∼ 0.4 %. This led to the conclusion thatthe deformation is fairly insensitive to the stiffness of the interior MT network. Newermeasurements manipulating the cells with Taxol, however, indicate that MTs might playa larger role in cellular mechanics than the calculations by Ananthakrishnan et al. suggest[Nnetu et al., in preparation].
Finite Element Simulations
Finite element simulations were performed to determine the contribution of the star-likearchitecture of the rod-like MTs [Ananthakrishnan et al., 2005, 2006]. The contribution ofintermediate filaments was estimated to be of low significance for small deformations andhence was excluded in the study. The cortex was modeled as an isotropic, homogeneouselastic thick shell, the nucleus as an elastic sphere, and the MTs as hollow elastic rodswith a radius of 12 nm and a wall thickness of 5 nm rigidly attached to both the cortex andnucleus. The study revealed that even in the case of rigid coupling of the rods to the cor-tex, it is the outer shell that mainly determines the structural response of the cell. A slightdisplacement of the cell nucleus from the center of the cell had only minor influences onthe cell stiffness.
The discrepancies of the previously described theoretical approaches and the lack ofexperimental methods to directly verify the predicted forces on a cell make clear, thatthere are still difficulties to be solved in order to reach an accurate description of theexact forces that act on a real biological cell in the µOS. For this reason, throughout thiswork the measured strain data was directly compared, abandoning the attempt to calculatecomplex shear moduli from the recorded cellular deformations. The results of the thesisare obtained from relative comparison of the measured cellular strains in the µOS undervarious conditions and specific drug manipulations. This way, model induces systematicerrors could be avoided. The following sections will provide detailed information aboutthe applied methods to obtain the experimental data.
3.3 Temperature Measurements in the µOS
The measurements of the temperature within the trap for a typical µOS experiments wereperformed following the method described in [Ebert et al., 2007]. The ratio of the fluores-cence of the temperature sensitive dye rhodamin-B (Fluka/Sigma-Aldrich, St. Louis, Mis-souri) to the temperature insensitive dye rhodamin-110 (Fluka/Sigma-Aldrich, St. Louis,Missouri) illuminated with 488 nm was recorded in the CLSM (Leica TCS SP2, Leica,Wetzlar, Germany). This was done scanning a plane of size 11.51×5.93 µm2 in the centerof the trap with 16.4 fps.
The temperature inside the empty trap was measured for the same laser profile asused for the measurements of cellular mechanical properties. First, the laser power of theµOS was switched to 0.1 W per fiber, the power used for trapping cells, until a thermalequilibrium was established. Then, 5 s at stretching power were recorded, followed by25 s of trapping power, which was enough to reach thermal equilibrium again. This laser
3.4 Combined Optical Stretching and Confocal Imaging 49
profile was repeated three times for every power. The temperature was measured forstretching powers of 0.3, 0.4, 0.5, 0.6, 0.7, 0.8, 1.0 and 1.2 W per fiber, respectively.
As described in [Gyger et al., 2011], the intensity ratio of the dyes was calibrated in acustom-build chamber for a temperature range of 22 to 40 ◦C with steps of 2 ◦C, wherebythe temperature was controlled with a water reservoir. The calibration was performed us-ing the same imaging parameters in the CLSM as for the recording of the temperature.The background offset of the fluorescence in this measurements was normalized to roomtemperature as follows: the mean intensity ratio during trapping at 0.1 W was calculatedfrom an average of 82 frames (5 s) before the start of each of the stretching power applica-tions. The intensity ratio of the maximal temperature at stretching power was determinedfrom an average of the last 41 frames (2.5 s) of the stretch phase. To obtain an absolutetemperature scale a linear increase with laser power between 0 and 0.1 W was assumed.The ambient temperature, measured to be (23.0 ± 0.2) ◦C, was used as a base line.
3.4 Combined Optical Stretching and Confocal Imaging
Imaging of Ca2+ signals in HEK293 stably transfected with the TRPV1 was performed us-ing a CLSM [Gyger et al., 2011]. The main advantage of confocal imaging in this contextis the possibility to obtain a bright-field and a fluorescence image at the same time withoutslow filter cube exchange and illumination adjustment. While the fluorescent image wasnecessary to extract the fluorescence intensity data of the trapped cells, the bright-fieldimage allowed to identify dead or strongly blebbing cells that were not adequate for anal-ysis. The bright-field images were also employed to position the cell into the trap regionand to assure that the flow was stopped during the measurements.
A µOS setup was build as described in [Lincoln et al., 2007] with slight modifications.Instead of the glass slide used by Lincoln et al. the SU-8 photoresist (MicroChem Corp.,Newton, Massachusetts) was deposited by a standard photolitographic method [Madou,2002] on a 100 µm thick cover slip sustained by a 1 mm thick aluminum plate with a 7 mmhole in the center (Fig. 3.4c). This way the distance between the lower glass boundary andthe cell was reduced allowing for the use of a 63x high NA (1.40) oil-immersion objective.The setup was constructed on a custom-made light weight aluminum stage, meeting theweight requirements of the piezo z-stage of the CLSM. This allowed computer controlledadjustment of the height of the focal plane. The setup is shown in Fig. 3.4.
Cells were moved into the trap region by controlling the hydrostatic pressure differ-ence in the capillary. To this end the relative height of two connected liquid reservoirs wasmanually adjusted. For measurements the flow was carefully stopped and the cells weretrapped at 0.1 W per fiber. The two counterpropagating beams used for this µOS setupemerged from a 1064 nm single mode CW Ytterbium fiber laser (YLD-10-1064, IPGPhotonics, Oxford, Massachusetts) equipped with a beam splitter. Cells were stretchedat stretching powers between 0.5 W and 0.8 W per fiber for 5 s followed by a relaxationphase at trapping power of 30 s. The sequence was repeated three times successively foreach cell. Fluorescent images were obtained by scanning the mid-plane of the cell with a488 nm laser. The light emitted between 500 and 530 nm was recorded with a photomulti-plier. Images of 43.36 × 25.58 µm2 were taken with a resolution of 5.90 µm per pixel at2.75 fps. As the transmitted light detectors of the used CLSM are protected by a filter at
Figure 3.4: µOS Setup for Confocal Imaging. a) Magnification of a schematiccross section along the laser fibers of the microfliudic chamber in the µOS, detailscan be found in [Lincoln et al., 2007]. b) Photo of the µOS setup mounted on thepiezo driven z-stage of the CLSM. c) Schematic cross section of the whole setup.The SU-8 structure sustaining the optical fibers was spin-coated on a 100 µm glasscover slip, supported by a stable aluminum structure. This way the distance betweenlower glass boundary and the trap position of cell in the setup described by Lincoln et
488 nm, a 543 nm laser was used to obtain transmission mode images simultaneously.The 1064 nm laser for Optical Stretching was controlled via custom-written Labview
software (National Instruments, Austin, Texas)1. Using the trigger signal from the CLSM,digitalized via a NI USB-6008 (National instruments, Austin, Texas) the Optical Stretch-ing was synchronized with the images recorded with the commercial software of theCLSM.
3.5 Automated Setup and Strain Determination
In order to reach statistically significant cell numbers for the stress-strain experiments,an automated µOS measurement procedure was used [Stange et al., in preparation]. Thecells were moved through the channel controlling the pressure with custom-made pumps.Online detection of cells in the flow allowed to identify single cells, a feedback algorithmpermitted an exact pressure control such that the cell were moved into the trap regionof the µOS. After stopping the flow, the cells were trapped at 0.1 W per fiber by two1064 nm single mode CW Ytterbium fiber lasers (YLM-5-SC, IPG Laser GmbH, Burbach,Germany). To center the cell the power of one of the lasers, controlled via custom-writtenLabview (National Instruments, Austin, Texas) [Stange et al., in preparation], was reducedautomatically until the cell arrived in the center of the trap. Thereafter, cells were stretchedat 0.7 W per fiber for 5 s followed by a relaxation phase at trapping power of 2 s. Thetemperature in the microfluidic chamber and of the cell suspension before measuring wascontrolled by pumping water from a water bath kept constantly at (23.0 ± 0.1) ◦C througha custom designed microscope stage.
Phase contrast images were recorded at 63x magnification with 30 fps using an A622fcamera (Basler, Ahrensburg, Germany) mounted on an Axiovert 40c microscope (Zeiss,Oberkochen, Germany). The cell edge was detected with sub-pixel resolution from thephase contrast images using custom-written Matlab software (The MathWorks Inc., Nat-ick, MA, USA)2. The strain, defined as the ratio of the change of length of the cell’s axisalong the laser beam and the diameter of the unstretched cell, was calculated for everyimage.
3.6 Cell Culture and Drug Application
3.6.1 HEK293 Wild Type and HEK293-TRPV1 Cells
HEK293-TRPV1 were kindly provided by David Julius, University of California, SanFrancisco (UCSF). The introduction of the temperature activated TRPV1 ion channelprovides a inherently controllable switch for the Ca2+ signal. HEK293 wild type cells(HEK293-wt), the same cell line without the heat activated channel, were used as a con-trol system.
The cells were cultured at 37 ◦C in an atmosphere containing 5 % CO2. Completegrowth medium consisted of Dulbecco’s Modified Eagle Medium (PAA Laboratories
1Labview software for the µOS with a trigger interface for the Leica CLSM software, custom-written byRoland Stange
2Software detecting the cell edge for every frame, custom-written by Tobias R. Kießling
52 Materials and Methods
GmbH, Pasching, Austria) containing 10 % Fetal Calf Serum (PAA Laboratories GmbH,Pasching, Austria), 1 % Penicillin-Streptomycin (PAA Laboratories GmbH, Pasching,Austria). To assure full transfection, the HEK293-TRPV1 cell line was cultured in 0.02 %solution of the selective antibiotic G418 Disulphate salt (50 mg G418 salt per ml, Sigma-Aldrich, St. Louis, Missouri), to which the cells were immunized by the transfectionprocess. The medium was changed every second day and cells were passaged at approxi-mately 80 % confluence.
Prior to detachment, cells were washed with phosphate buffer saline solution (PBS)(Invitrogen Corporation, Carlsbad, California) to remove traces of serum that containsTrypsin inhibitor. Cells were then detached by application of 1 ml 0.025 % Trypsin-EDTA3 (PAA Laboratories GmbH, Pasching, Austria) for 4 min. Subsequently, Trypsinwas deactivated by addition of 5 ml growth medium followed by a centrifugation for 4 minat 800 rpm.
Measurements were performed with cells suspended in a Ca2+ imaging buffer (CIB)consisting of 6 mM KCl (Roth, Karlsruhe, Germany), 134 mM NaCl, 1 mM MgCl2,2.5 mM CaCl2, 10 mM p-(+)-Glucose, 10 mM Hepes (all from Sigma-Aldrich, St. Louis,Missouri). The pH was adjusted to 7.45 with NaOH (Sigma-Aldrich, St. Louis, Mis-souri). For Ca2+-free measurements a Ca2+-free imaging buffer (CfIB) was used replacingthe CaCl2 by 10 µM EGTA (Fluka/Sigma-Aldrich, St. Louis, Missouri).
3.6.2 Drug Loading of the Cells
For the Ca2+ imaging the fluorescent Ca2+ dye Fluo-4,AM (Invitrogen Corporation, Carls-bad, California) [Gee et al., 2000] was used. The measurable Ca2+ concentration is in therange of 100 nM to 1 mM and the 488 nm laser of the CLSM lies inside the excitationrange of the dye.
Ca2+ chelators competitively bind Ca2+ ions inside the cell. The messenger Ca2+ ishindered to interact with its natural binding partners such as receptors and pumps, hence,the signal cascade is interrupted. Ca2+ dyes, such as Fluo-4, act as chelators. Additionally,the non-fluorescent chelator BAPTA,AM (PromoCell, Heidelberg, Germany) was used inthis study [Tsien, 1980].
Fluo-4 and BAPTA were loaded into the cell using the acetoxymethyl ester form, amembrane permeable molecule, that is de-esterified by intra-cellular esterases, activatingit and making it membrane impermeable. This way the drug accumulates inside the cell.
A stock solution of a concentration of 1 µg Fluo-4,AM per ml anhydrous dimethyl sul-foxide (DMSO) (Fluka/Sigma-Aldrich, St. Louis, Missouri) was prepared. For the Fluo-4measurements this stock solution was dissolved in PBS giving 1 ml solution at a concen-tration of 1 µM Fluo-4,AM. To facilitate dye loading and reduce compartmentalization1.1 µl of a Pluronic F127 solution in 20 % DMSO (PromoCell, Heidelberg, Germany)was added. In this solution the cell pellet was resuspended by gentle pipetting. Cells wereincubated at 29-30 ◦C for 15 min while gently stirred to prevent re-attachment.
For the measurements of cells loaded with BAPTA a stock solution of BAPTA,AMwas prepared in a nitrogen atmosphere to avoid decaying of the BAPTA,AM due to mois-ture. BAPTA,AM was dissolved at a concentration of 12.5 µg per ml DMSO. The cellswere resuspended in 1 ml PBS solution containing 20 µM BAPTA,AM, and 7.7 µl of the
3ethylenediaminetetraacetic acid (EDTA)
3.6 Cell Culture and Drug Application 53
Pluronic F127 solution in 20 % DMSO. Cells were incubated at 29-30 ◦C for 30 min. Forexperiments performed on cells loaded with both, BAPTA and Fluo-4, additionally 1 µMFluo-4,AM was present during this incubation step.
After incubation the AM-ester solutions were removed by centrifugation as describedabove and cells were resuspended in CIB. For Ca2+-free measurements CfIB was used. Inan other incubation step of 20-30 min at 21-23 ◦C the cells were allowed to activate theAM-esters by unspecific intra-cellular esterases.
To saturate the Ca2+ dye for control experiments elucidating the effect of temperatureon the dye itself 1 µM of the Ca2+ ionophore ionomycin (Invitrogen Corporation, Carls-bad, California) was added to a suspension of cells in CIB loaded with Fluo-4 and BAPTAbefore the start of the experiments.
The TRPV1 channel was blocked by 10 µM ruthenium red (RuR) (Sigma-Aldrich,St. Louis, Missouri). Control experiments testing for the involvement of SACs wereperformed with 10 µM GdCl3 (Sigma-Aldrich, St. Louis, Missouri). In these experimentsRuR respectively GdCl3 was present during the whole measurement.
54 Materials and Methods
Chapter 4
Results
In the following chapter the results of a combination of experiments in the µOS and aphenomenological mathematical model are presented. At first, the determination of thetemperature dynamics in the trap region during a measurement with the µOS is presented.These results provide the basis for understanding why the temperature sensitive TRPV1channel opens during µOS measurements. Fluorescence measurements of the Ca2+ influxupon Optical Stretching constitute the content of the second section in this chapter. Theresults of which are required for the investigation of the influence of Ca2+ on contractionsof single suspended cells described in Sec. 4.3. Subsequently, a phenomenological modelmathematically describing the strain data of actively contracting single suspended cells isderived. This model is, in the last part of this chapter, applied to quantify the measuredstrain data showing that an integration of active contractility in such a model is necessaryto describe the observed cellular strains.
The results presented in this chapter demonstrate that combined measurements andmodeling considering cellular activity provides a powerful tool to gain new insight intonon-muscular force generation and cellular adaptation to environmental stimuli.
4.1 Temperature Measurements in the Optical Stretcher
The Optical Stretcher is a unique tool to measure mechanical properties of single sus-pended cells without mechanical contact to a measuring device such as an AFM tip or anattached bead. The cell is trapped and manipulated by means of two divergent 1064 nmsingle mode CW laser beams. While it is known that 1064 nm is close to an absorptionminimum of water [Curcio and Petty, 1951; Kou et al., 1993], it has been shown that theheat development by the weak absorption of the 2 × 0.7 W used in the µOS is of the orderof tens of degrees [Ebert et al., 2007; Gyger et al., 2011; Wetzel et al., 2011]. Ebert et al.
measured the dynamics of heating at the beginning of the stretch experiment and assumeda linear increase with power. In this work also the cooling after the experiment and thepower dependence is investigated.
The temperature measurements are a prerequisite for the use of the TRPV1 transfectedHEK293 cells, as the power has to be adjusted such that the heat activated channel opensduring the experiments. Also for fluorescent Ca2+ imaging it is important to know thetemperature in the region in which imaging is performed, as Ca2+ binding kinetics andquantum efficiency of the dye will in general depend on temperature.
56 Results
4.1.1 Temperature Dynamics in the µOS
The temperature dynamics of the medium in the trap region of the µOS were measuredusing the method proposed by Ebert et al. [Ebert et al., 2007]. Heating during the stretchphase and, measured for the first time, cooling after switching down the laser to trappingpower were recorded. The temperature was investigated for a trapping power of 0.1 Wand stretching powers between 0.3 and 1.2 W per fiber. The range of differences betweentrapping and stretching power was thus ∆P = 0.2 W to 1.1 W (see section 3.3 for details).Fig. 4.1 shows the result of an average of three measurements for a 5 s laser pulse of 0.7 Wper fiber. During the trap phase the temperature T rises by roughly 2 ◦C, and during thestretch phase at 0.7 W per fiber by (14 ± 2) ◦C, reaching a final temperature of (39 ± 2) ◦C[Gyger et al., 2011]. Most of the temperature change happens within tens of millisecondsafter increasing the laser power. The final temperature was reached after 0.5 to 1 s. Thetemperature drop after the stretch occurs in large part also within tens of millisecondsfollowed by a slower decay reaching the starting temperature after approximately 1 s to2 s.
4.1 Temperature Measurements in the Optical Stretcher 57
Figure 4.2: Power Dependence of Tempera-
ture Increase in µOS. The maximal tempera-ture in the Optical Stretcher was recorded forlaser powers between 0.3 and 1.2 W. In thegraphs the temperature increase compared to aroom temperature of (23.0 ± 0.2) ◦C is plottedversus the difference between trapping power(0.1 W) and stretching power (black dots, errorsare standard errors). The dark gray lines are thefitted curves and the light gray lines mark the95% confidence interval. a) A simple linear fit-ting of the data as done in [Ebert et al., 2007] didnot lead to zero heating at zero power. b) Forc-ing the line to cross ∆T = 0 at ∆P = 0 resultedin an underestimation of heating at lower pow-ers and an overestimation at higher powers. d)A second order polynomial provided a good de-scription of the data when forced to run through∆T = 0 at ∆P = 0. c) When not forced throughthis point the parameters were similar and thecurve led through the origin within the expectederrors. The determined values of the parametersfor each fit are shown in the table to the right,the presented errors are the standard deviationscalculated by the least square fitting algorithm.
Fit parameters
a)
∆T = a + B1∆P
a [◦C] 0.9 ±0.2B1 [◦C/W] 10.0 ±0.3
b)
∆T = B1∆P
B1 [◦C/W] 11.3 ±0.3
c)
∆T = a + B1∆P + B2(∆P)2
a [◦C] 0.03 ±0.22B1 [◦C/W] 13.4 ±0.8B2 [◦C/W2] −2.7 ±0.6
d)
∆T = B1∆P + B2(∆P)2
B1 [◦C/W] 13.5 ±0.2B2 [◦C/W2] −2.8 ±0.3
58 Results
4.1.2 Power Dependence of Heating
To determine the power dependence of the heating, the temperature inside the trap re-gion was determined for laser powers between 0.3 W and 1.2 W. The results are shownin Fig. 4.2. Opposed to the findings by Ebert et al. [Ebert et al., 2007], the linear de-pendence on laser power could not be confirmed. As becomes visible in Fig. 4.2a simplelinear fitting fails to meet the necessary condition that heating has to be zero at zero power.Forcing the fit to this condition underestimates the temperature for lower powers and over-estimates them for higher powers (Fig. 4.2b), hence a linear approximation seems to benot adequate to fit the presented data. An additional second order term enables to fulfillthe necessary condition, as can be seen from Fig. 4.2c and d. The parameters obtainedfrom the fitting are shown in the table in Fig. 4.2.
4.2 Calcium Imaging in the Optical Stretcher
Calcium is one of the most important second messengers in the signal transduction cas-cades of biological cells. Ca2+ ions are involved in numerous physiologically relevantprocesses [Haddock and Hill, 2005; Lee et al., 1999; Neher and Sakaba, 2008; Whitaker,2006]. The combination of Optical Stretching and standard Ca2+ imaging methods opensnew perspectives for investigating the role of Ca2+ in regulating cellular mechanical be-havior.
HEK293-TRPV1 cells, a human embryonic kidney cell line transfected with the heatactivated TRPV1 channel, was loaded with the Ca2+ dye Fluo-4 and imaged with a CLSMwhile being stretched. Heating during the µOS measurement, as described in the previ-ous chapter, was shown to be enough to open the channel and triggered a pronouncedCa2+ influx through the cation channel [Gyger et al., 2011]. This result is, on one hand,an important prerequisite for measuring the Ca2+ dependent mechanical properties ofHEK293-TRPV1 cells. On the other hand it shows the versatility of the setup on itsown.
4.2.1 Simultaneous Optical Stretching and Ca2+ Imaging
HEK293-TRPV1 cells, were loaded with Fluo-4 as described in section 3.6.2 and Opti-cally Stretched for 5 s at 0.7 W per fiber. The fluorescence signal was recorded with theCLSM and averaged over a circle with constant radius lying well inside the circumferenceof the cell during each measurement. This way, artifacts due to size and shape changes ofthe cell, when subjected to optically induced stresses, were avoided. Images of dim (lowCa2+ concentration) and bright (high Ca2+ concentration) fluorescence signals can be seenin Fig. 4.3.
In Fig. 4.4 typical graphs of the fluorescence signals of cells loaded with Fluo-4(Fig. 4.4a) and cells loaded with Fluo-4 and the Ca2+ chelator BAPTA are presented(Fig. 4.4b). Fig. 4.4c shows the fluorescence of a cell loaded with Fluo-4 and BAPTAwith 10 µM RuR, a blocker of the TRPV1 channel [Savidge et al., 2001; St. Pierre et al.,2009], dissolved in the cell suspension during the measurement. In all three cases a rapiddecrease of fluorescence intensity immediately after increasing the laser power was visi-ble. For the BAPTA-free case this resulted in a momentary dip, because the intensity be-
gan to increase immediately after the beginning of high laser power application (Fig. 4.3eand Fig. 4.4a). For the experiments with cells treated with 20 µM BAPTA,AM before themeasurement, a trough extending over the whole period of high laser power applicationwas observed (Fig. 4.4b and c). When the laser was switched down to trapping power,the fluorescence intensity rose as quick as it decreased when the laser was switched tostretching power. This rapid decrease in intensity during high power application can beexplained by the temperature dependent fluorescence of Fluo-4 as will be discussed inSec. 5.1.2.
To demonstrate the effect of temperature changes on the fluorescence of Fluo-4 insidethe cytoplasm, a control experiment was designed as follows: cells were loaded withFluo-4 and BAPTA as described above. During the measurement the cells were exposedto 1 µM ionomycin, a ionophore that transports Ca2+ ions through the plasma membrane.This way the Ca2+ dye in the soma was saturated. Additional Ca2+ influx through ionchannels during the measurement could therefore not influence the fluorescence and theobserved changes in fluorescence were a pure effect of temperature. As can be seen inFig. 4.5, the fluorescence intensity of the dye decreased with increasing laser power and
4.2 Calcium Imaging in the Optical Stretcher 61
Figure 4.5: Temperature Effect on Ca2+ Dye. Cells were loaded with 1 µM Fluo-4and 20 µM BAPTA,AM. 1 µM ionomycin, a Ca2+ ionophore, was used to let Ca2+
even reflected the different laser patterns. This supports the hypothesis that the abovedescribed decrease in intensity during high power application results from an increase intemperature and not from changes in Ca2+ concentration.
In RuR-free experiments a significant increase of the fluorescence intensity becamevisible after the momentary dip described above. The increase was significantly steeperfor the BAPTA-free case (Fig. 4.4a) than for the cells treated with 20 µM BAPTA,AM(Fig. 4.4b). This indicates a moderate rise of the intra-cellular free Ca2+ level for thechelator containing case in contrast to a drastic rise in the BAPTA-free experiment. Asexpected due to reduction of the temperature another steep increase could be observedwhen the laser was switched down to trapping power. The second and third laser pulses inthe BAPTA-free experiment showed functionally the same characteristics as for the firstpulse, however, with decreasing amplitudes. For cells loaded with BAPTA consequentstretches resulted in intensity patterns with basically the same amplitude. The reasonfor this effect was most likely a desensitization of the channel as will be discussed inSec. 5.2.2.
The aim of loading the cells with 20 µM of the chelator BAPTA,AM was to test theeffect of manipulations in intra-cellular Ca2+ signal propagation on the mechanical proper-ties of the cells. 1 µM Fluo-4,AM, also acting as Ca2+ chelator, was added to visualize theCa2+ during the measurement. The fluorescence intensity in the cells loaded with BAPTAand Fluo-4 decreased after the beginning of the laser pulse. Caused by the increase intemperature a trough in the intensity extended over the whole range of the stretch phase.
62 Results
During stretching power application the fluorescence signal gently increased, indicatinga rise in the intra-cellular Ca2+ level. At the end of the stretch phase a steep increase oc-cured due to the drop in temperature. After that, the fluorescence intensity decayed whichoccured much slower than in the cells not treated with BAPTA. A typical curve is shownin Fig. 4.4b. In some BAPTA treated cells the Ca2+ level stayed almost constant or evencontinued to increase after the laser was switched down to trapping power.
Fig. 4.4c shows a typical fluorescence intensity curve of a cell in which, additionallyto the application of BAPTA and Fluo-4, the TRPV1 channel was blocked by 10 µM RuR.In these cells only the background of the fluorescence signal remained, indicating that nomeasurable amount of Ca2+ entered the cell. Again, a trough due to the heating of thelaser was observable.
To elucidate whether SACs were involved in the Ca2+ influx, the experiments wererepeated in a 10 µM GdCl3 solution. Gd3+ is a potent, unspecific SAC blocker [Yang andSachs, 1989]. No significant difference to the fluorescence of untreated cells was observedand hence an involvement of SACs could be excluded. From a theoretical point of viewthis was expected as the forces in the stretcher are perpendicular to the cell surface (seeSec. 3.2.1), hence, the parallel stress component, necessary to open SACs, is zero.
4.2.2 TRPV1 Heat Activation by Optical Stretching
The data presented in Fig. 4.4 clearly shows a Ca2+ influx into HEK293-TRPV1 cellsupon Optical Stretching, that can be inhibited by BAPTA and RuR. To ensure that heatactivated the TRPV1 channel in the µOS, control experiments were performed placing acell approximately 20 µm underneath the trap region. Increasing the power to 0.7 W perfiber did not result in a Ca2+ influx, however, at 1.0 W a strong Ca2+ wave was produced.As argued in Sec. 5.2.1, this result underlines the interpretation that the heat developmentduring the µOS measurements was responsible for TRPV1 activation.
In a control experiment the temperature of the setup was reduced. For a setup temper-ature below (20 ± 1) ◦C for most of the cells no increase in fluorescence intensity duringOptical Stretching was observable. When measured at different laser powers the prob-ability that a Ca2+ signal was visible upon Optical Stretching decreased significantly atpowers below 0.7 W. For powers higher than 0.7 W all measured cells showed a Ca2+ in-flux. Also the intensity of the signals decreased with decreasing laser power. A furtherquantitative analysis of these experiments was, however, not possible, as the influence ofdifferences in dye loading, an intrinsic difficulty of the loading method, and noise in thesystem exceeded the signal for low laser powers. Fig. 4.6 shows examples of fluorescencesignal for laser powers between 0.3 W and 1.2 W.
For measurements at 0.4 W per fiber and less (4.6a,b) hardly any Ca2+ influx wasmeasurable. At 0.5 W most of the cells showed a weak increase in fluorescence intensityupon Optical Stretching (4.6c). Starting form 0.6 W the intensity amplitudes producedby consequent laser pulse applications were strictly decreasing (4.6d-h), which was notthe case for 0.5 W. At 0.7 W and above all of the measured cells responded with a risein intra-cellular Ca2+. For 1.0 W and 1.2 W the intensity increase was very steep at thebeginning of the stretch phase followed by a decrease already during the stretch phase(4.6g,h). At the same time the effect of decreasing amplitudes became more pronounced.For 1.2 W no Ca2+ influx was detectable for the second and the third pulse.
4.2 Calcium Imaging in the Optical Stretcher 63
Figure 4.6: TRPV1 Activation in Dependence on Laser Power. Fluorescencesignals recorded in Fluo-4 labeled HEK293-TRPV1 cells with the CLSM while mea-sured in the µOS at laser powers between 0.3 W and 1.2 W. The graphs are normalizedto the highest fluorescence intensity in each image sequence. a,b) For very low pow-ers no Ca2+ influx was measurable. c) At 0.5 W first small signals were observable.The example shows one of the cells with a rather low signal. At this power some cellsalready showed a more pronounced Ca2+ influx. d-f) Between 0.6 W and 0.8 W thecharacteristics of the fluorescence intensities were similar, consequent laser pulsesresulted in decreasing intensity amplitudes. g,h) At very high laser powers the inten-sity decreased already during the stretch phase. The effect of decreasing amplitudesbecame stronger. h) For 1.2 W no second Ca2+ influx was measurable. The intensityof the fluorescence signals increased with increasing laser power. Due to the normal-ization for better comparability of the patterns, this is not evident from the images.As the absolute fluorescence depended on dye loading the brightness had to be ad-justed for every cell, therefore, the dependence of the maximal intensity could onlybe observed qualitatively. i,j) Applied laser pattern with Pmax referring to the powerdisplayed in the images, respectively.
64 Results
Figure 4.7: Examples of Fluorescence Signals Without External Ca2+ Influx.
a-c) TRPV1 channel was blocked by 10 µM RuR. d-f) HEK293-TRPV1 cells mea-sured in Ca2+-free imaging buffer (CfIB). In both cases no external Ca2+ enteredthe cell, still a pronounced Ca2+ signal was visible in roughly 2/3 of the cells.b, e) Examples of cells not showing an increase in internal Ca2+ signaling upon Op-tical Stretching. These results can be explained by release from internal Ca2+ stores.c, f) Unlike the cases in which external Ca2+ entered through the plasma membrane,the intensity of the pulses was not strictly decreasing for consequent pulses. This con-firms that desensitization of the TRPV1 channel explains the decrease in Ca2+ influxfor the second and third laser pulse. g, h) Applied laser power per fiber.
Further controls using a solution containing the TRPV1 channel blocker RuR as wellas experiments in Ca2+-free imaging buffer were performed. In both cases the Ca2+ signalswere changed significantly compared to the measurements in which an influx of externalCa2+ was allowed. Examples of fluorescence signals for RuR treated cells and cells sus-pended in CfIB are shown in Fig. 4.7. In approximately 30 % of the cells no measurableintra-cellular free Ca2+ elevation could be observed (Fig. 4.7b,e). Unexpectedly, approx-imately 70 % of the cells still showed an increase in the Ca2+ level, that originated frominternal stores. As mentioned above for cells measured at 0.5 W and above with influx ofexternal Ca2+ through the TRPV1 channel all of the consequent stretching power applica-tions resulted in decreasing amplitudes of fluorescence intensities. Roughly 40 % of thecells without influx of external Ca2+ had a similar fluorescence signature upon three con-sequent high laser applications (Fig. 4.7a,d). However, for the remainder, approximately30 % of cells without influx of external Ca2+, the amplitude of the fluorescence signalsfrom three consequent laser pulses did not decrease. Furthermore, hindering free internalCa2+ diffusion by BAPTA in cells measured in CfIB inhibited the rise in intra-cellular
4.3 Active Cellular Contractions 65
Ca2+ completely and the intensity curves looked similar to those seen when BAPTA andRuR were co-applied.
Measurements of the strain of HEK293 cells treated with different Ca2+ manipulatingdrugs upon stretching are presented in detail in Sec. 4.3. The results from the Ca2+ imag-ing measurements are an important prerequisite to be able to judge correlations of Ca2+
influx with changes in the mechanical properties of the cell.
4.3 Active Cellular Contractions
The goal of the experiments presented in this section was to investigate contractions ofsingle cells without adhesions to a substrate or a neighboring cell. In this context, thefinding that the heating by the µOS sufficed to activate the heat activated TRPV1 ionchannels (Sec. 4.1 and Sec. 4.2) opened the possibility for investigating the influence ofCa2+ on cellular mechanics and the observed contractions. In conjunction with the drugstested in the experiments presented in Sec. 4.2.1 the HEK293-TRPV1 cell line constitutesan excellent model system for this task as it provides a controllable switch for triggeredentry of extra-cellular Ca2+.
4.3.1 Single Suspended Cells Contract in the µOS
In the µOS changes in momentum of the laser light cause a stress pointing outward andnormal to the cell surface (see Sec. 3.1.2 and Sec. 3.2.1). Passive, purely viscoelasticobjects would elongate as long as an external stress is applied. A cell that exerts an activecontractile force on its surface, counteracts this externally applied stress which results ina lower strain than without contractile force. If the contractile force per unit surface areaexceeds the external stress, the cell visibly contracts and the derivative of the strain versustime becomes negative.
In this study, cells were measured in the µOS for 5 s with 0.7 W per fiber whilerecorded with optical video microscopy with 30 fps. The strain of the cells along thedirection of laser propagation was determined from every frame. In Fig. 4.8 sets of straincurves for HEK293-wt and HEK293-TRPV1 are shown. For both experiments two ex-amples of cells that visibly contract during the stretch phase are highlighted. Most of thestrain curves of cells that show a visible contraction have a maximum between t = 1 sand t = 3 s. In the µOS the stress is proportional to the laser power, which is constantduring the stretch phase (see Sec. 4.4). The extremum in the strain must therefore arisefrom a force on the cell surface that increases during the course of the experiment. In thephenomenological mathematical model derived in Sec. 4.4 this force was approximatedby a linearly increasing stress term. It is obvious from the data shown in Fig. 4.8 thatnot all cells contracted and that the strength of the contractions varied. By the aid of thephenomenological model introduced in Sec. 4.4 a quantification of this effect was reached.
4.3.2 Ca2+ Influences Cellular Contractions
As introduced in Sec. 2.1.3 and Sec. 2.1.4, Ca2+ is one of the most important secondmessengers and it has been shown to be involved in contractile processes in cells. In
66 Results
Figure 4.8: Contractions of Suspended Cells. Sets of strain curves from a)HEK293 wild type cells (HEK293-wt) and b) HEK293 cells transfected with theTRPV1 channel (HEK293-TRPV1) measured in the µOS for 5 s at 0.7 W per fiber.The curves highlighted in black are examples of cells showing a contraction againstthe externally applied step stress. As the stress in the µOS is constant during thestretch phase and the strain shows a maximum the active cellular force causing thecontraction has to be growing during the experiment. It is obvious that not all cellsvisibly contracted.
this context it makes sense to investigate its influence on the contractions described inthe previous section. To this end, HEK293-TRPV1 cells were measured in combinationwith Ca2+ manipulating drugs. As demonstrated in Sec. 4.2.1 RuR blocks the Ca2+ entrythrough the TRPV1 channels and the chelator BAPTA competitively binds internal Ca2+
ions; hence using a combination of 20 µM BAPTA,AM and 10 µM RuR the Ca2+ signalcan be blocked almost completely (Fig. 4.4c).
The strains after 5 s stretching power application for untreated cells and cells treatedwith the Ca2+ drugs are shown in Fig. 4.9. In Fig. 4.9a the medians of the strain distri-bution with 95 % CI and quartiles are presented. The type of distribution is unknown. Inorder to obtain a measure for the significance of differences in the distributions the 95 %CI was calculated with the bootstrap method [Efron and Tibshirani, 1994].
With decreasing Ca2+ influx the strain increased. Application of the chelator BAPTAresulted in small but insignificant changes in strain; inhibiting the Ca2+ influx from thesurrounding medium by blockage of the TRPV1 channel with RuR already had a largereffect on the deformation. The median of strain of the untreated cells lay outside the95 % CI of the cells treated with both RuR and BAPTA and vice versa. This indicatesa probability of more than 95 % that the distributions of both measurements differed.Furthermore the skewnesses of the distributions were different: the strain distribution ofthe cells with high Ca2+ influx (untreated) was left-tailed, i.e. it had a negative skewness.The left tail reaches below zero, hence, pronounced contractions were visible (Fig. 4.9b).For cells in which either Ca2+ influx was blocked by RuR or the free diffusion insidethe cell was hindered by BAPTA the distribution of the strain was rather symmetric withonly a few strongly contracting cells (Fig. 4.9c, d). When the Ca2+ signal was almostcompletely blocked by co-application of blocking and chelating agents the distributionbecame right-tailed, no contractions below the initial elongation occured and a long tail
4.3 Active Cellular Contractions 67
Figure 4.9: Strain Distributions of HEK293-TRPV1 Cells in the µOS. The cellswere stretched for 5 s with 0.7 W per fiber: median (black line) of each of theµOS measurements with 95 % confidence interval (CI) calculated with the bootstrapmethod (doted black line) and quartiles (light gray area). a) Overview of the medi-ans with CI and quartiles: the dark gray line indicates the median of the experimentwith untreated HEK293-TRPV1 cells. If a median is outside the 95 % CI of the otherdistribution the probability that the medians are different is larger than 95 %. (b–i)Histograms (dark gray) of the distributions of strains after 5 s stretch. The dashedblack line marks the zero strain, i.e. strains below this value indicate contractions thatdeform the cell below its original elongation. Blocking the Ca2+ influx through theTRPV1 channel with RuR and chelating the resting Ca2+ with BAPTA increased thestrain as contractions are less pronounced (b–e). Image adapted from [Gyger et al.,2012]
to large deformations became visible (Fig 4.9e). A sequence of images for a stronglycontracting and a passively extending cell can be found in Fig. 4.10.
An application of 10 µM GdCl3, a known blocker of SACs, did not have a significanteffect on the strain distribution. This excludes the involvement of SACs in Ca2+ influx(Fig. 4.11b). A second control experiment with the amount of DMSO as used for theBAPTA experiment did not produce significant changes either, proving that no artifactsoriginating from the usage of DMSO caused the observed effects (Fig. 4.11c). Whenmeasured in CfIB, i.e. without external Ca2+, a part of the contractions were suppressedsimilar to the effect in RuR treated cells. Most likely caused by a slightly differing osmo-larity due to the lack of Ca2+ ions the overall strain of the cells in this control experimentwere much lower than for cells in the usual Ca2+ imaging buffer (Fig. 4.11d).
In a control experiment BAPTA and RuR were applied to untransfected HEK293-wtcells. Treatment with 20 µM BAPTA in the absence of Ca2+ influx through the ion channeldid not have a significant influence on the strain distribution. Hence, BAPTA treatment did
68 Results
Figure 4.10: Passively Extending and Strongly Contracting HEK293-TRPV1
Cell a-c) Example of a passively extending cell. d-f) Example of strongly contractingcell. The cells are shown at at 0 s, 4 s and 8 s, respectively. The green line showsthe initial edge position and the blue line the momentary edge. The red graph is thepower of the laser.
4.3 Active Cellular Contractions 69
Figure 4.11: HEK293-TRPV1 Control Experiments. a) Untreated, b) cells sus-pended in 10 µM GdCl3 to block SACs, c) application of the same amount of DMSOas for the BAPTA,AM experiments d) cells suspended in Ca2+-free imaging buffer(CfIB). Neither GdCl3 nor DMSO had an effect on the cellular mechanical proper-ties. The strain of cells measured in CfIB was significantly lower and its distributionnarrower than for measurements in CIB. This was most likely caused by a differentosmolarity due to the lack of Ca2+ ions.Legend: median of strain (black line), CI calculated with the bootstrap method (dotedblack line), quartiles (light gray area), and histogram (dark gray). Image adapted from[Gyger et al., 2012].
not disassemble cytoskeletal filaments as reported in [Saoudi et al., 2004], which wouldlead to a drastic softening of the cells. As shown in Fig. 4.12a and 4.12c the application of10 µM RuR did also not result in a significant change in the strain distributions, confirmingthat the TRPV1 blocker did not produce any unwanted side-effects. The effect observedin HEK293-TRPV1 cells, thus, was induced by the effect of the applied drugs on the Ca2+
signaling (Fig. 4.9).
70 Results
Figure 4.12: HEK293 Wild Type Control Experiments. a) Untreated, b) treatedwith 20 µM BAPTA,AM to block internal Ca2+ signaling, and c) treated with 10 µMRuR to test whether the substance itself had an effect on cellular mechanical proper-ties. While there seemed to be a small difference in strain between the BAPTA treatedand the RuR treated cells none of the measurements showed a significant differencein the strain compared to the untreated HEK293-wt cells, confirming the assumptionthat Ca2+ influx through the TRPV1 channel during optical stretching influences thecontractions. Legend: median of strain (black line), CI calculated with the bootstrapmethod (doted black line), quartiles (light gray area), and histogram (dark gray). Im-age adapted from [Gyger et al., 2012].
4.4 The Phenomenological Mathematical Model
Cells exist in a state far from equilibrium continuously consuming energy in form of ATP.In the previous section contractions of suspended cells were investigated. For a completephenomenological description of cellular material properties the integration of active forcegeneration into the theory is necessary. This requires the identification of the leading termof active cellular contractions. In the following, the derivation of such a descriptive modelby including contractions into the constitutive stress-strain relation is presented.
To derive a model which incorporates cellular contractions, the ansatz from Wottawahet al. [Wottawah et al., 2005a,b] was extended by a term representing an active forceexerted by the cell on its surface. Solving the general constitutive equation [Tschoegl,1989], an analytic description of the strain in the µOS was obtained. The activity termwas shown to be both necessary and sufficient to describe the experimentally observedcontractions.
4.4 The Phenomenological Mathematical Model 71
4.4.1 Constitutive Equation
Below the viscoelastic limit cells stretched in the µOS behave as a linear viscoelasticmaterial. The general equation linking the time dependent stressσ(t) and strain γ(t) is thusgiven by the general constitutive equation for a linear viscoelastic material with constantcoefficients am and bn [Tschoegl, 1989] (see Sec. 2.2.1, Eq. (2.4)):
∞∑
m=0
am
dmγ(t)dtm
=
∞∑
n=0
bn
dnσ(t)dtn
. (4.1)
Following the arguments of Park et al. [Park and Schapery, 1999], a sufficiently gooddescription is given taking into account the first order term for the applied stress and upto second order for the resulting strain. The equation then reads:
a0γ(t) + a1dγ(t)
dt+ a2
d2γ(t)dt2
= b0 σ(t) + b1dσ(t)
dt. (4.2)
As there is no initial strain we have γ(t = 0) = 0; furthermore the stress is zero fort > t1. We can also assume that the material reaches a new quasi-static confirmation afteran infinite time, hence:
limt→∞γ(t) = const .
This implies:
limt→∞
dγ(t)dt= 0 and lim
t→∞
d2γ(t)dt2
= 0 .
We get for the limit t → ∞ using σ(t) = dσ(t)dt= 0 ∀ t > t1:
a0 · const. = 0 ⇒ a0 = 0 .
Choosing the constants am and bn such that b0 = 1 gives:
a1dγ(t)
dt+ a2
d2γ(t)dt2
= σ(t) + b1dσ(t)
dt. (4.3)
This leads to the mechanical model diagram called three-parameter Poynting-Thomsonmodel which was described in Sec. 2.2.1.
In the µOS cells get trapped at 0.1 W, which is enough to hold the cells if the flowin the microfluidic channel is completely stopped. The “stretching power”, i.e. between0.3 W and 1.2 W for the experiments in this work, is applied between t0 and t1. The forceacting on the surface of a cell due to the “trapping power” before and after the stretchis not enough to produce a visible deformation even if the cell is held for a long time.The stress caused by the trapping power during “trap phase”, i.e. at t < t0 and during the“relaxation phase”, i.e. at t > t1, can therefore be neglected. Thus, the stress exerted bythe laser on the cell surface is a step stress that can be described as a multiplication orsubtraction of Heaviside step functions Θ:
The geometric factor FG (see Eq. (3.6) in Sec. 3.2.2) is a constant accounting for theinfluence of the trapped cell’s geometry to its strain. σ0 is the peak stress in direction ofthe laser axis. In order to describe the active contractions of the cell against the opticallyinduced stress, we include an active force of the cell acting on its surface. The resultingstrain σcell for t0 < t < t1 can be evaluated at t0 = 0 in a Taylor expansion:
σcell =
∞∑
n=0
1n!
dnσcell(t0)dtn
· t (4.5)
As there is no initial force, the zeroth order of active cellular stress is zero. We furthermoreassume that the stress exerted by the cell is zero at σ(t) = 0, i.e. at t < 0 and at t > t1.Accounting for the terms up to first order and defining the activity parameter:
A ≔ −dσcell(t0)
dt, (4.6)
where the minus sign assures that A is positive when the cell contracts, we obtain:
σcell(t) = −A · t · Θ(t)Θ(t1 − t) . (4.7)
The total stress acting on the cell surface is thus given by:
σ(t) = σlaser(t) + σcell(t)
= (FG σ0 − A · t) · Θ(t)Θ(t1 − t)
= (FG σ0 − A · t) · [Θ(t) − Θ(t − t1)] . (4.8)
Let q > 0. Integration of Eq. (4.3) from −q to t with t > 0 leads to:
a1
∫ t
−q
dγ(t)dt
dt + a2
∫ t
−q
d2γ(t)dt2
dt =
∫ t
−q
σ(t)dt + b1
∫ t
−q
dσ(t)dt
dt
⇒ a1[γ(t) − γ(−q)
]+ a2
[dγ(t)
dt−
dγ(t = −q)dt
]=
∫ t
−q
σdt + b1[σ(t) − σ(−q)
].
Using the boundary conditions σ(−q) = 0 and γ(t) ≡ 0 ∀ t < 0, and hence dγ(t=−q)dt= 0 the
differential equation reads:
a1γ(t) + a2dγ(t)
dt=
∫ t
−q
σ(t) dt + b1σ(t) . (4.9)
Applying Eq. (4.8) and defining F ≔ FG · σ0 gives:∫ t
−q
σ(t) dt = F
∫ t
−q
Θ(t) dt − F
∫ t
−q
Θ(t − t1) dt
−A
∫ t
−q
Θ(t)t dt + A
∫ t
−q
Θ(t − t1)t dt
= FΘ(t)t − FΘ(t − t1)
−12
AΘ(t)t2 +12
AΘ(t − t1)(t2 − t12) ; (4.10)
4.4 The Phenomenological Mathematical Model 73
and hence:
a1γ(t) + a2dγ(t)
dt= FΘ(t)t − FΘ(t − t1)(t − t1)
+b1FΘ(t) + b1FΘ(t − t1)
−12
AΘ(t)t2 +12
AΘ(t − t1)(t2 − t21)
−b1AΘ(t)t + b1AΘ(t + t1) . (4.11)
This differential equation can be solved by variation of constants for phases I (t < 0),II (0 < t < t1), and III (t > t1). Solutions were obtained using Wolfram Mathematica 7.0(Wolfram Research Inc., Champaign, USA).
4.4.2 Solution
Phase I: Trap Phase, t < 0
As stated above, for t < 0 the strain is assumed to be constantly zero, because there isno external stress acting on the cell surface. The force parallel to the direction of laserpropagation is small at the trapping power of 0.1 W and can be neglected.
Phase II: Stretch Phase, 0 < t < t1
For 0 < t < t1 ⇒ Θ(t) = 1,Θ(t − t1) = 0. Thus Eq. (4.11) reduces to:
a1γII(t) + a2dγII(t)
dt= Ft + b1F −
12
At2 − Atb1
Fb1 + (F + Ab1) t +12
At2 . (4.12)
Applying the boundary condition γII(0) = 0 the solution is:
γII(t) =1
a31
[ (exp
{−
a1
a2t
}− 1
)·(Aa2
2
−Aa1a2b1 + a1a2F − a21b1F
)
+t
(Aa1a2 − Aa2
1b1 + a21F −
12
Aa21t
) ]. (4.13)
Phase III: Relaxation Phase, t > t1
For t > t1 ⇒ Θ(t) = 1,Θ(t − t1) = 0 and hence Eq. (4.11) gives:
a1γIII(t) + a2dγIII(t)
dt= Ft1 −
12
At12 .
74 Results
Figure 4.13: Modeled Stress and Strain Over Time for Different Values of the
Activity Parameter A. The parameters a1, a2, and b1 were set to the median obtainedfrom the measurements of all measured untreated HEK293-TRPV1 cells. a) Stepstress exerted by the µOS (black) and sum of stresses exerted on the cell surface(gray) as described in Eq. (4.8) for A/Pa s−1 = 1.0, 2.0, 3.0, 4.0, respectively. Forhigh A the stress on the cell surface becomes negative. b) Resulting cellular straincalculated with Eq. (4.13) and Eq. (4.14). For higher activities the strain decreases.Negative slopes of the graph indicate visible contractions. While the theory describesthe strain behavior for t < t1 well, it fails for t > t1. Image adapted from [Gyger et al.,2012]
With the continuity condition γII(t1) = γIII(t1) the equation can be solved:
γIII(t) =1
a31
[exp
{−
a1
a2t
} (Aa2
2
−Aa1a2b1 + a1a2F − a21b1F
)
− exp{−
a1
a2(t − t1)
} (Aa2
2 − Aa1a2b1
+a1a2F − a21b1F − Aa1a2t1 + Aa2
1b1t1
)
+a21Ft1 −
12
Aa21t2
1
]. (4.14)
Eq. (4.13) was fit to the strain in the stretch phase of each individual cell. Graphs of thestrain γ(t) for typical values of the fit parameters can be seen in Fig. 4.13. An increase inthe activity parameter A results in a decrease of the strain. For high values of A this causesvisible contractions, e.g. a strain with a negative slope. If the active cellular force ceasesimmediately when the external stress is switched off, a visible contraction of the cell leadsto an extension during the relaxation phase (lowest two graphs in Fig. 4.13). This turnedout to be a too strong assumption, as shown in Sec. 4.5.1. The material does not relaxpassively when the external stress ceases. However, a more accurate description of therelaxation phase would require at least one more fit parameter and knowledge about howthe forces exerted by the cell decay after the end of external stress application. Therefore,the application of the model was restricted to the measured strain for region II (0 < t < t1).The values obtained by fitting Eq. (4.13) were inserted into Eq. (4.14) to produce thegraphs shown in Fig. 4.13.
4.5 Application of the Model to Cellular Strains 75
4.5 Application of the Model to Cellular Strains
The model derived in the previous section enables a quantification of the strain datameasured with the µOS. Other than the bottom-up theoretical approaches presented inSec. 2.2.6 it is not based on specific assumptions of cellular processes but complete phe-nomenological in nature. This opens the possibility of an unbiased view on cellular me-chanics without a priori assumptions of processes causing the observed contractions. Inthis section the application of the model to strain data measured in the µOS will be pre-sented, shading further light on the observed contractions and the role of the second mes-senger Ca2+ in the underlying processes.
4.5.1 Fitting the Phenomenological Model
To investigate the influence of active processes on the measurement of mechanical prop-erties the phenomenological mathematical model introduced in Sec. 4.4 was fitted to themeasured strain during the stretch phase (0 < t < t1). Fitting was performed using thenon-linear least square fitting algorithm of Matlab, weighted with the inverse square ofthe interquartile distance, which grows with time due to the spread of the strain distribu-tion. In this way a more reliable fitting at the beginning of the stretch phase was reachedaccepting a larger deviation between fit and measurements towards the end of the stretch.The procedure is reasonable as deviations from the assumption of a linearly increasingcellular stress should have a larger effect towards the end of the stretch phase than at thebeginning.
Calculations of the geometric factor FG rely on the assumption that only the actincortex contributes to the deformation [Wottawah et al., 2005a,b]. While this hypothesiscould not be proven entirely up to now, and secondly, the determination of the thicknessof the actin cortex during stretching by fluorescence labeling gives only rough estimates,a parameter sweep on F ≔ FGσ0 was performed. As F is not independent of the fitparameters a1 and a2, it was not an option to fit with F as an additional parameter.
An estimate of F was calculated as follows: assuming simple geometric optics andneglecting the effect of multiple internal reflections the peak stress σ0 along the directionof laser propagation can be calculated by [Lincoln, 2006]
σ0 =Imax
c
(R − 2 + R2
)(n1 − n2) , (4.15)
where n1 is the refractive index of the medium in which the cells are suspended and n2
the refractive index of the cell. R is the reflection coefficient and c the speed of light. Themaximal light intensity in the center of the two-Gaussian-beam-trap is given by
Imax = 2 · Ptotal2π2
, (4.16)
where Ptotal is the power of each to the two lasers and the beam half width. The reflec-tion coefficient at the beam axis perpendicular to the cell surface is given by [Demtroder,2004]
R(Θ = 0) =(n1 − n2
n1 + n2
)2
(4.17)
76 Results
The refractive index of the culture medium is assumed to be that of water for a wavelengthof λ = 1064 nm, hence n1 = nmed ≈ nH2O = 1.324 [Daimon and Masumura, 2007] and therefractive index of cells is n2 = ncell = 1.372 ± 0.04 [Guck et al., 2005]. The reflectionsat the cell surface were ignored for the calculation as the reflection coefficient R is of theorder of 10−4.
To calculate the beam half width several steps have to be considered. The beam exitsthe optical fiber that has a mode field radius of 0 = 3.1 ± 0.1 µm, next it passes througha region of index matching gel with length zgel = 20.55 ± 0.24 µm and refractive indexngel = 1.4646, then it enters the capillary wall made of borosilicate with a refractive indexof nglass = 1.606 ± 0.0011 and thickness zglass = (40 ± 1) µm. Finally, it propagates forzmedium = (40 ± 4) µm through the culture medium with refractive index nH2O = 1.324 tothe mid of the capillary. The optical path length is hence given by
zopt =zgel
ngel+
zglass
nglass+
zmed
nmed. (4.18)
The half width of the Gaussian beam profile of the TEM00 mode of a source with radius at the center of the trap can be calculated by [Meschede, 2007]:
= 0
√(zopt
z0
)2
+ 1 , (4.19)
where
z0 =π2
0
λ(4.20)
is the Rayleigh length. This gives an estimation for the beam half width of = (8.1 ±0.6) µm. Inserting Eq. (4.19) into Eq. (4.16) results in a maximal intensity of the beam ofImax = (13 ± 2) mW/µm2, and from Eq. (4.15) the peak stress is determined to (4 ± 2) Pa.
The form factor was estimated with an approximation for a thin shell given by [Anan-thakrishnan, 2003]:
FG ≈ 0.2615(
h
r0
)−1
µ−0.250 , (4.21)
where the cell radius r0 was measured to 8.46± 0.2 µm. For the Poisson ratio µ a value of0.45 was assumed and the thickness h of the actin cortex, assumed to determine most partof the cellular stiffness, was estimated to be (11±5) % of the cell radius, leading to a formfactor of (2.9 ± 3.3). Based on these estimates a value for F of 11.8 Pa was calculated.
The parameter sweep was performed fixing F to values between 2.5 Pa and 32 Pa,corresponding roughly to an actin cortex thickness between 16 % and 5 %, respectively.The median of the correlation parameter r2 that provides information about the goodnessof the fits was recorded for every value of F. Results of the parameter sweep are shownin Fig. 4.14. Neither the quality of the fits nor the distinguishability of the investigatedstrains depended on the choice of F because the dependent parameters compensated theeffect. The findings of relative measurements are hence independent of the choice of F.
It turned out that for some graphs the fit parameters did not converge. Each of theparameters was therefore restricted to a multiple of its median calculated from unrestricted
4.5 Application of the Model to Cellular Strains 77
Figure 4.14: Parameter Sweep for F. The strain of untreated HEK293 cells and cellstreated with 10 µM RuR and 20 µM BAPTA was fitted fixing the parameter F ≔ FGσ0
to values between 2.5 and 32 Pa. Neither the median of the correlation parameter r2
(a) nor the number of cells that had to be excluded (b) varied significantly within thisrange. c) Minimum of the Wilcoxon rank sums of the parameters a1, a2, and b1. Fornone of the F-values the rank sum of any of these passive material parameters cameclose to the 0.05 significance range (dotted black line) indicating that independentof F the distributions of these parameters were indistinguishable. c) Wilcoxon ranksums of the activity parameter A for strains of cells treated with RuR and BAPTAcompared to untreated cells. The value lies well below the 0.05 significance range forall F. The comparability of different experiments hence is independent of the choiceof the form factor FG. Image adapted from [Gyger et al., 2012].
78 Results
Figure 4.15: Examples of Fits to the Strain of Untreated HEK293-TRPV1 Cells.
Examples with different values for the activity parameter A were chosen. From top tobottom: A/Pa · s−1 = 0.0004, 1.55, 3.4, and 6.8. For 0 < t < 5 s, the theory describeswell the measured strains. For t > 5 s the graph was plotted with the parameter setobtained from the fit for 0 < t < 5 s. It becomes obvious that the deviations in therelaxation phase were large for all cases indicating that the assumption of a passivelyrelaxing material failed. Image adapted from [Gyger et al., 2012]
fits. If the correlation parameter r2 from the least square fitting reached a value below 0.7or if one of the parameters was fixed to the boundary by the algorithm fitting was repeatedusing the robust fitting least absolute residual method (LAR). This procedure recovered17.1 % of the cells. In cases in which the fit still diverged or produced a correlationparameter r2 below 0.7 the cell was excluded from the analysis, this was the case in 11.5 %of all cells. Examples of curves fitted to measured strains are presented in Fig. 4.15.
An experiment testing the applicability of the model under varying boundary condi-tions was designed as follows: HEK293-TRPV1 cells were measured with the automatedsetup as described in Sec. 3.5. For every individual cell the software chose a laser powerat random from the values 0.5, 0.6, 0.7 or 0.8 W. In this way the amplitude of the stepstress was varied without changing any other condition during the measurement, such ascell changes originating from cell culture. To acquire the data of a sufficiently high num-ber of cells the measurement was repeated four times. The measured strain curves werefitted individually with Eq. (4.13) to obtain the distributions of the activity parameter A,which is shown in Fig. 4.16. The theory fitted equally well to all strain data at every ofthe tested laser powers.
As visible in the data, at a laser power of 0.5 W per fiber the fraction of non-activecells, i.e. with an activity close to zero, was approximately 32 % 4.16a). For 0.6 W thisvalue was already at roughly 23 % 4.16b) and droped to approximately 18 % for 0.7 Wand 0.8 W 4.16c,d). Heating in the trap during Optical Stretching depends on the laserpower as shown in Fig. 4.2. As described in Sec. 4.2.2 and in [Gyger et al., 2011] forpowers below 0.7 mW significantly less Ca2+ influx is expected as the necessary tempera-tures to open the TRPV1 channel are not reached. Given the observation that the activity
4.5 Application of the Model to Cellular Strains 79
Figure 4.16: Activity Parameter A at Different Laser Powers. The strain ofHEK293-TRPV1 was measured in the µOS at laser powers between 0.5 W and 0.8 W.It was fitted with Eq. (4.13) of the previously derived phenomenological model toobtain the activity parameter A. At 0.5 W, TRPV1 channels are not expected to openwhile at laser powers of 0.7 W a pronounced Ca2+ influx was observed (see Sec. 4.2.2[Gyger et al., 2011]). The fraction of non-active cells, i.e. with A ≈ 0, was approxi-mately twice as high for measurement with the lowest power as with 0.7 W and 0.8 Wcorrelating with the Ca2+ influx. These findings show that the model predicts the ex-pected behavior even under altered boundary conditions, namely, a variation of thestress. Furthermore, it confirmed the observation that Ca2+ is involved in the signalcascade leading to contractions in the cell. Image adapted from [Gyger et al., 2012].
parameter correlates with the Ca2+ influx, a rise in activity with increasing temperature isexpected. This coincides with the predictions of the model, confirming its validity underdifferent boundary conditions, namely, altering the external stress. On the other hand,taking the model for granted, the results confirmed the correlation between Ca2+ influxand a decrease in cellular strain, presumed to be caused by enhanced contractions.
4.5.2 The Activity Parameter Correlates with Contractions
The parameters a1, a2, and b1, that describe the passive behavior, and the activity param-eter A were determined by fitting of Eq. (4.13) to the measured strain for every cell. Thedistributions are presented in Fig. 4.17. As can be seen from the figure, the distributionsof the fit parameters were highly non-Gaussian and had different skenesses, hence, neitherthe Student’s t-test nor standard error calculation were applicable. In order to asses thesignificance of the differences in the distributions two independent methods, which do notrequire a knowledge of the type of distribution, were applied. First, a 95 % CI was calcu-
80 Results
Figure 4.17: Distributions of the Fit Parameters a1, a2, b1, and A. a1–d3) The pas-sive material properties did not change when Ca2+ singling was manipulated by RuRand BAPTA. a4–d4) The distributions of the activity parameter A showed significantdifferences when Ca2+ was suppressed. Image adapted from [Gyger et al., 2012].
4.5 Application of the Model to Cellular Strains 81
Figure 4.18: Histogram of the Activity Parameter A. The histogram is normalizedwith the total number of measured cells in the experiment (gray). The solid blackline indicates the median and the dotted black line the 95 % CI calculated with boot-strapping. a) Untreated, b) Ca2+ blocked with 10 µM RuR and 20 µM BAPTA. Whileall other fit parameters had indistinguishable distributions (see Fig. 4.17), differencesof the distributions can be explained by the cell’s active stress. The percentage ofnon-active cells (A ≈ 0) was higher for the case where Ca2+ was blocked (b). Imageadapted from [Gyger et al., 2012].
lated with bootstrapping [Efron and Tibshirani, 1994]. In brief, bootstrapping assumes themeasured distribution as the correct one and calculates the desired quantity by generationof a given number of artificial data sets that follow the assumed distribution. From thesegenerated data sets a CI for the desired quantity can be obtained. Secondly, a Wilcoxonrank sum test was applied [Mann and Whitney, 1947]. The test checks for the hypothesisthat one of the distributions tends to have larger values than the other. It is positive ifthe probability value p is below 0.05. In this case the probability that the distributionsdiffer is higher than 95 %. The results of these two tests do not necessarily coincide astheir assumptions and possible errors are not the same. Bootstrapping compares only themedians, the rank sum test also takes into account the shape of the distribution, hence pro-viding a better basis for the judgment of differences in the distributions. Contradictions inthe outcome of the two methods illustrate the complication in assessing the significanceof the differences in the measurement.
For the passive material parameters a1, a2, and b1 of the experiments (Fig. 4.17a1–d3)all rank sum tests were negative and the 95 % CIs overlapped, hence, for the passivemechanical properties of the measured cells no significant difference was observable. Forthe distributions of the activity parameter A (Fig. 4.17a3–d3) this was not true. The fractionof cells that had an activity close to zero was about 18 % for the untreated cells and rosewith increasing blockage of the Ca2+ signal. For the cells treated with 10 µM RuR and20 µM BAPTA the non-active fraction reached almost 30 %. Also in the cells showinga contraction a difference was observable: with decreasing Ca2+ influx the contractions
82 Results
became weaker. Both effects were represented in the shift of the median. A juxtapositionof the distributions of A for untreated cells and cells treated with both RuR and BAPTAcan be seen in Fig. 4.18. Applying the Wilcoxon rank sum test to these two distributionsa p-value of p = 0.00088 indicates a clear significance of the difference. Also, neither ofthe medians lay within the CIs of the median from the other distribution. The observeddifferences in strain can thus be explained by differences in the active behavior of the cells.A blocking of the Ca2+ signal increased the percentage of cells with A ≈ 0 and decreasedthe number of highly active cells as well as their maximal activity.
Neither the SAC blocker GdCl3 nor DMSO in the same concentration as used for20 µM BAPTA application had an effect on the activity (Fig. 4.19). For cells suspendedin Ca2+ free buffer the number of non-contractile cells is larger than 30 % (Fig. 4.19).As presented earlier the CfIB had an effect on the passive material properties, too. Mostlikely the buffer had a different osmolarity due to the lack of Ca2+ ions in the solution. Thiseffect would influence the passive material properties as the cell gets osmotically swollenand stiffens. It does, however, not explain the higher amount of non-contractile cells. Thisexperiment therefore gives further evidence that influx of Ca2+ increases the number cellsthat contract when subjected to the external strain in the µOS. As Ca2+ is depleted alsofrom internal stores this effect is expected to be stronger for cells in Ca2+ free suspensionthan under the application of the TRPV1 blocker RuR which was confirmed by the data(compare Fig. 4.17c4 and Fig. 4.19d).
In wild type cells neither the application of BAPTA nor of RuR produced any signifi-cant change in the activity (Fig. 4.20. This observation confirmed again that the influenceof RuR solely originated from channel blockage and that BAPTA did not have unwantedside effects such as cytoskeletal depolymerization.
4.5 Application of the Model to Cellular Strains 83
Figure 4.19: Activity Parameter A of HEK293-TRPV1 Control Experiments.
a) Activity parameter of untreated HEK293-TRPV1 cells. b) 10µM GdCl3 did nothave a significant effect on the distribution of A, excluding the involvement of SACsin the Ca2+ influx. c) When the concentration of DMSO, that had to be used for an ex-periment with 20 µM BAPTA was present in the cell suspension, no difference to theuntreated cells was visible, confirming that the DMSO did not produce unwanted sideeffects. d) Lack of external Ca2+ changed the distribution of the activity parameter A
similarly to the effect of blocking the TRPV1 channel with RuR (compare Fig. 4.17).Image adapted from [Gyger et al., 2012].
84 Results
Figure 4.20: Activity Parameter A of HEK293 Wild Type Control Experiments.Chelating internal Ca2+ with BAPTA had no measurable influence on the activity ofthe cells. b) When no channels were present the TRPV1 channels blocker RuR hadno significant influence on the activity. Image adapted from [Gyger et al., 2012].
Chapter 5
Discussion
In the following chapter the results of the measurements presented previously will beinterpreted and, if procurable, set into context with previous results from other studies. Atfirst the effect of laser induced heating on cellular mechanics and on the imaging of Ca2+
is presented. In the second section the TRPV1 channel opening is discussed in detail,depicting its usability for experiments in the µOS. The last section of this chapter coversthe findings obtained with HEK293-TRPV1 cells as a model system for the investigationsof the influence of Ca2+ on cellular mechanical properties in the µOS in conjunction withthe application of the phenomenological mathematical model.
5.1 Effects of Laser Induced Heating
Knowing the temperature during the measurement in the µOS is important for variousaspects of the presented measurements. At first, heat activates the TRPV1 channel. Onthe other hand, it has also important implications on the mechanics of the investigatedcells, and on the fluorescence of the dye used to visualize the Ca2+ influx. In this sectionthe influence of the laser induced heating on cellular mechanics and on the Ca2+ imagingis discussed and put into context with previous work of other authors.
5.1.1 Effect of Heating on Cellular Mechanical Properties
In the presented work the temperature dynamics during and after the stretch phase wasmeasured by the method proposed by Ebert et al. [Ebert et al., 2007]. It was shown thatthe temperature increases non-linearly with laser power. Starting at room temperature theapplication of a laser power of 0.7 W per fiber resulted in a rise in the temperature ofthe trap region by (16 ± 2) ◦C, to a final temperature of (39 ± 2) ◦C [Gyger et al., 2011].The major part of the temperature changes happened within tens of milliseconds after anincrease or decrease of the laser power.
Earlier measurements of the heat development in the medium inside the trap region ofthe µOS by Ebert et al. revealed a linear temperature increase of (13 ± 2) ◦C/W per fiberwithin milliseconds [Ebert et al., 2007]. For 2 × 0.7 W this results in a temperature riseof (18 ± 3) ◦, which is within the error of the data presented in this work. In this thesis,however, the linear dependence of the temperature on laser power proposed in [Ebert et al.,2007] was not confirmed. Furthermore, the measurements presented in this work were
86 Discussion
extended to the cooling during the relaxation phase of a typical stretcher experiment. Inthe work of Ebert et al. as well as in this thesis temperatures were measured for an emptyoptical trap. As will be discussed in Sec. 5.2, heating in the presence of a cell at 0.7 W perfiber might exceed this temperature by approximately 3 ◦C .
In early Optical Stretcher experiments a CW Ti/Sapphire laser emitting at 785 nm[Guck et al., 2000] or 780 nm [Guck et al., 2002] was used. The effect of heating in thesemeasurements was estimated to be negligible as the absorption of cells around 800 nmis minimal. The employed Ti/Sapphire laser was difficult to adjust and its coupling intoan optical fiber was unstable. Since the development of the µOS Ytterbium fiber laserswith a wavelength of 1064 nm have been used, as they are much more reliable and easier tohandle [Lincoln et al., 2007]. However, the absorption coefficient of water at a wavelengthof 1064 nm is more than 6 times higher than around 800 nm [Kou et al., 1993]. Attempts toconstruct a 800 nm µOS have not been successful so far, as no fiber lasers stably emittingwith sufficient power at this wavelength are available on the market.
Experiments on cells trapped at various powers and for different time durations re-vealed that under normal experimental conditions with laser powers under 1.0 W per fiberno significant decrease of cell viability is expected [Wetzel et al., 2011]. It is, however,obvious that temperature changes of almost 10 ◦C can have an impact on the measuredmechanical properties. In recent experiments the effect of heating and that of the stressexerted in the µOS could be decoupled. By the use of a setup with two additional lasers ata distance of several µm, that heated the trap region independently of the stress exertinglasers, it was shown that cells soften significantly at higher temperatures and that theyfollow a time-temperature superposition [Kießling et al., 2012].
In view of these results, it is important to create experimental conditions which en-sure that no artifacts due to temperature effects occur. In the experiments presented inthis thesis, utmost care was taken to produce comparable conditions for the different ex-periments. The temperature of the setup was tightly regulated during the measurements.Furthermore, the experiments were not performed on different cell lines that might havedeviating heat responses. Owing to this precautions, reliably and reproducible differencesin strain data for cells treated with various Ca2+ manipulating agents could be obtained.
5.1.2 Influence of Heating on Ca2+ Imaging
All measurements of intra-cellular Ca2+ presented in this thesis reveal an almost instanta-neous drop of the fluorescence intensity when the laser power is increased. The reason forthis change in intensity is, however, not a true change in intra-celular Ca2+ concentrationbut can be associated with a temperature dependence of the Ca2+ dye Fluo-4. Accordingto measurements of Woodruff et al. the maximum fluorescence of the Ca2+ dye Fluo-4decreases up to one third when the temperature is increased from 20 ◦C to 37 ◦C. OtherCa2+ dyes show a similar temperature response [Woodruff et al., 2002].
In this thesis it was shown that even if the Ca2+ dye was saturated inside the cell due toconstant influx of Ca2+ through the membrane induced by the ionophore ionomycin, laseractivation had an effect on the fluorescence intensity. The fluorescence intensity directlyfollowed the applied laser pattern. Together with the known temperature dependence ofthe brightness of the used dye and the results on the temperature dynamics these experi-ments prove that decreasing intensities due to heating overlay the observed Ca2+ signals.
5.2 HEK293-TRPV1 Cells in the µOS 87
A correction of the effect on Fluo-4 based on the measurements of Woodruff et al.
was, however, not possible. On the one hand this would require the knowledge of theexact dye concentration. The dye uptake depends on many factors, it varies from cellto cell and even between different compartments within the soma of one cell. A seconddifficulty posed the finding that the paper by Woodruff et al. was not entirely consistent.While the fact, that the fluorescence intensity decreases with increasing temperature couldbe shown clearly, the mathematical description was not consistent in itself and turned outto contradict the presented data from the measurements. Unfortunately the authors didnot answer a request for clarification. The circumstance that the dye intensity drops withincreasing laser power due to the heating effect had, thus, to be taken into considerationwhen interpreting the measurements of Ca2+ influx discussed in the next section.
5.2 HEK293-TRPV1 Cells in the µOS
Despite the difficulties coming along with laser induced heating in the µOS, this circum-stance offers a unique possibility: the measurement itself can trigger pronounced Ca2+
signals by activation of temperature sensitive ion channels. In this sections the effect oflaser induced heating in the µOS will be discussed, demonstrating that the TRPV1 trans-fected HEK293 cell line provides an excellent system for the investigation of Ca2+ signalsin the µOS.
5.2.1 Heating in the µOS Activates TRPV1
During measurements with the µOS pronounced Ca2+ signals in TRPV1 transfectedHEK293 cells were observed. To ensure that heat activated the ion channel and not aneffect of the laser photons, cells were placed approximately 20 µm under the trap region.The beam width was estimated to be (8.1 ± 0.6) µm, hence the cell was out of the re-gion of direct laser radiation. A power per fiber of 0.7 W did not result in a Ca2+ influx,however, at 1.0 W the intra-cellular Ca2+ level rose significantly. Ebert et al. showed thatthe equilibrium temperature in the vicinity of the trap is lower than in its center [Ebertet al., 2007]. Assuming that the temperature inside the trap at 0.7 W is just large enoughto provide enough energy for a considerable channel opening, for a cell in the vicinity ahigher power is expected to be necessary in order to produce a visible Ca2+ influx. TRPV1activation in this experiment was reached without direct radiation, it thus proves that thetemperature increase due to the laser radiation is enough to activate the temperature sen-sitive ion channels in the plasma membrane and that no direct interaction of the laserphotons with the channel is necessary.
Heating of the trap region during a measurement in the µOS was investigated for dif-ferent laser powers. According to these measurements, for 0.7 W per fiber a temperatureof (39 ± 2) ◦C is reached, if the system is at (23.0 ± 0.2) ◦C before the measurement.TRPV1 channels are known to have the largest open probability at temperatures above∼ 42 ◦C [Caterina et al., 1997; Savidge et al., 2001]. From the results presented in thisthesis, it can be estimated that a power per fiber slightly above 0.8 W would be necessaryto produce a temperature of 42 ◦C in the trap region of an empty trap. However, the heatdeveloped by 2 × 0.7 W turned out to be large enough to trigger a pronounced Ca2+ in-
88 Discussion
flux in nearly every investigated cell. Furthermore, even for 0.5 W occasional weak Ca2+
influxes were registered.There are several possible explanations for the fact that the channel opened. Firstly,
the temperature measured in the setup is the average temperature at the center of the trap,local heating in regions of a size below the recorded resolution might be slightly largerthan the average value. Secondly, the temperatures were measured with an empty trap.With a cell inside the trap the light is focused due to the differences in refractive indices.This leads to a larger light intensity in the center of the laser beam and, thus, to a higherlocal temperature. Thirdly, the cell is not completely homogeneous. Organelles and thenucleus scatter part of the light and the cytosol, densely packed with proteins, mightabsorb more than the solution that was used for the temperature measurements consistingmainly of water. It can be concluded that, despite the lower temperature in an emptytrap, the temperature at the surface of a measured cell during the application of 2 × 0.7 Wexceeds the ∼42 ◦C necessary for a channel opening at least locally.
Testing the effect of different laser powers on HEK293-TRPV1 cells loaded with thefluorescent Ca2+ dye Fluo-4 it was shown that the fluorescence intensity, which reflects theamount of Ca2+ that enters the cell, increases with increasing laser power. Furthermore,also for laser powers lower than 0.7 W Ca2+ signals were obtained. Local exceeding ofthe temperature necessary to open the TRPV1 channel can explain this observation: if thearea where T ≥ 42 ◦C is small, only a few channels are opened. With increasing laserpower the area grows, activating more channels, which can be seen in a stronger Ca2+
signal.A complementary rather than competing explanation for the same observation is given
by the following argument: the known activation temperature is a result ofa steady stateheating experiments. Under these conditions the existence of a clear threshold varyingless than 1 ◦C between cells has been proven [Savidge et al., 2001]. In these experimentsthe activation temperature was determined by heating the sample from 26 ◦C to 50 ◦Cwithin 10 s. Single channel analyses showed that the ion channel can either be in an openor closed state [Studer and McNaughton, 2010]. Thus, channel opening is a stochasticprocess and elevating the temperature increases the probability of a channel opening event.A recent study with ultrafast heating by infrared light gave a very precise picture of theopening kinetics. Already at 40 ◦C a measurable patch clamp current intensity, which is ameasure for the open probability, was observed [Yao et al., 2010]. On the other hand, it isknown that already small Ca2+ currents can induce the release of internally stored Ca2+,the so called Ca2+ induced Ca2+ release (CICR), that amplifies the signal and leads to ameasurable Ca2+ concentration. CICR have been reported in HEK293 cells [Gromadaet al., 1995]. Taken together, this gives an explanation why temperatures lower than 42 ◦Ccan already lead to a significant rise in the intra-cellular Ca2+ concentration.
Assuming that the local heat at the cell membrane opens the channel, the questionarises to what extend the activation temperature is exceeded. To elucidate this issue,a control experiment was performed in which the temperature of the whole setup wasreduced. It turned out that if the temperature of the setup was kept below (20 ± 1) ◦Cwhich is 3 ◦C less than for the previously discussed experiments, for most of the cellsno increase in fluorescence intensity during Optical Stretching was observable. Togetherwith the measured (39 ± 2) ◦C in an empty trap this result provides a limit of (42 ± 3) ◦Cto the local temperature at the cell surface during µOS measurements performed at an
5.2 HEK293-TRPV1 Cells in the µOS 89
ambient temperature of 23 ◦C. The maximum of the local temperature in ordinary µOSmeasurements with a cell in the trap, hence, might exceed the temperature measured foran empty trap by roughly 3 ◦C.
It has been shown recently that under normal experimental conditions heating in theµOS at 1.0 W and less does not significantly influence cell viability [Wetzel et al., 2011].Here, it could be shown that the heating effect in the µOS provides a unique tool to ac-tivate heat sensitive ion channels triggered by the measurement itself. For the TRPV1channel activation the laser power could not be reduced, as the open probability decreasesdrastically if the required ∼ 42 ◦C are not reached. A higher laser power, in turn, couldharm the cells due to heat shocks [Wetzel et al., 2011]. Cells, transfected with channelsthat react to lower temperatures, such as the TRPV3, which opens at temperatures ≥ 33 ◦C[Dhaka et al., 2006], might provide an access to further studies of the effect of tempera-ture on the Ca2+ signaling pathway and its influence on cellular functions. This idea wasbeyond the scope of the presented work and might provide an interesting aspect for futureinvestigations.
5.2.2 Ca2+ Release from Internal Stores and TRPV1 Desensitization
To be able to observe Ca2+ influx during the µOS experiments the cells were loaded withthe fluorescent Ca2+ dye Fluo-4 and the fluorescence during three consequent high powerapplications was recorded. For all experiments at 0.6 W per fiber and above without ad-ditional drug treatment, the Ca2+ signal amplitudes caused by the second and third laserpulse decreased systematically. At lower powers and when the intra-cellular Ca2+ waschelated by BAPTA this phenomenon was not observed. In the absence of influx of ex-ternal Ca2+ the fluorescence amplitudes decreased for part of the cells but not for all ofthem.
The fact that the measurable free Ca2+ concentration rose even if no Ca2+ enteredthe cell, because of TRPV1 blockage by RuR or absence of extra-cellular Ca2+, leadsto the conclusion that also Ca2+ from internal Ca2+ stores was released during the µOSexperiment. It is known that TRPV1 channels are expressed in the membrane of internalCa2+ stores [Turner et al., 2003], hence, the µOS might also activate these channels. Acombination of the presented findings with more elaborate biochemical techniques offersvarious possibilities for future research on processes causing internal Ca2+ releases.
Assuming that the Ca2+ release from internal stores composed part of the measuredsignal, consecutive laser pulses could lead to a store depletion, which in turn would bean explanation for the decreasing intensity amplitudes. A closer look, however, revealedthat not all of the cells exhibited internal Ca2+ release. Furthermore, some cells exhibitingrelease from internal stores showed higher Ca2+ levels during the second or third laserpulse. These observations contradict the hypothesis that internal Ca2+ release explains thedecreasing amplitudes: firstly, all cells with influx of external Ca2+ showed the decreasingfluorescence amplitudes, but not all cells exhibited the same internal store release. Sec-ondly, if this was the correct explanation, also rises in the amplitude should be observable,which is not the case for any of the experiments with more than 0.6 W per fiber.
In the presence of extra-cellular Ca2+ TRPV1 channels are observed to desensitizeupon stimulus by agonists and heat [Caterina et al., 1997; Tominaga et al., 1998]. Thisdesensitization can explain the fluorescence intensity amplitude decrease for consequent
90 Discussion
stretching power applications in the µOS. Channels that are activated during one pulsehave a lower probability to open during the second pulse. At low temperatures, i.e. atpowers of 0.5 W and below, only very few channels are activated and stochastic varianceis expected to exceed the desensitization effect. At temperatures produced by 0.6 W to0.8 W a pronounced desensitization for consequent stretches can be seen by the decreasein amplitudes of consequent laser pulses.
Starting at 1.0 W per fiber, the intensity increase was very steep at the beginning ofthe stretch phase, followed by a decrease in intensity already during the stretch phasethat looks similar to the intensity decrease, observable during the relaxation phase. Thedesensitization reaction of a large fraction of the TRPV1 channels was obviously fastenough that already during the laser pulse no further Ca2+ entered the cell and the decayof the signal due to pumping processes started. For 1.2 W no second and third Ca2+
elevation was visible indicating that almost all channels were desensitized.For some of the cells in which the internal Ca2+ was elevated due to release from
internal stores, i.e. in cells with blocked TRPV1 channels or in the experiments with-out external Ca2+, the fluorescence amplitude did not decrease for consequent stretchingpower application. In the light of the previous arguments, the reason might be a releaseof Ca2+ from internal stores via a process that is not desensitizing. The channel blockerRuR does not enter the cells and hence cannot block channels that are expressed in inter-nal membranes. Hence TRPV1 activation might still lead to internal Ca2+ release. In cellsuspended in CfIB the absence of external Ca2+ leads to a partial store depletion on thelong run, decreasing the amount of Ca2+ available for internal releases. If the amount ofCa2+ entering the soma is not enough to establish a sufficiently high Ca2+ concentrationto initiate desensitization, a second pulse will produce an equal probability of a Ca2+ flux.Furthermore, the intensities in these experiments were lower than with influx of externalCa2+. At such low numbers of activated channels the stochastic variances can be expectedto overwhelm a weak desensitization effect. A closer investigation of the impact of inter-nal store releases on cellular mechanics might be an interesting additional application ofthe presented method.
5.2.3 Effect of Applied Drugs on Ca2+ Signaling
Cells loaded with the chelator BAPTA did not show a systematic decrease in fluorescenceamplitudes of the Ca2+ dye during consequent stretching power applications. The fluores-cence signal decayed much slower than observed in BAPTA-free experiments. BAPTAand also the dye Fluo-4 act as chelators, i.e. they bind the entering Ca2+ ions, not permit-ting them to reach internal Ca2+ sensors or the pumps reducing the Ca2+ level. Hence,pumping of Ca2+ out of the cell, desensitization, and depletion of internal stores are hin-dered. This explains the slower decay of the signal and the constant amplitude for sub-sequent stretches. These experiments confirm that co-loading with BAPTA and Fluo-4hindered Ca2+ to reach its destination inside the cell. Chelating the internal Ca2+ withBAPTA affects both the Ca2+ released from internal stores, as well as the ions entering thesoma via the plasma membrane.
In chelator-free experiments a decay of the signal started after the end of the stretch.For an active pumping process the ion flux due to pumping is proportional to the amount
5.3 Influence of Ca2+ on Cellular Mechanics 91
of Ca2+ ions present in the soma. The decay is thus expected to be exponential in firstorder. The chelating capacity of the dye, however, slows down the Ca2+ extrusion. TheCa2+ ions bind transiently to the relatively large Fluo-4 molecules which diffuse muchslower through the cell than free Ca2+ would [Schmidt et al., 2003].
If additional to the chelation of the Ca2+ signal by BAPTA and Fluo-4 the TRPV1channel was blocked by RuR no rise in fluorescence intensity was observable. Only theeffect of the temperature on the background fluorescence remained. This gives evidencethat no measurable amount of Ca2+ entered the cell.
Taken together, the HEK293-TRPV1 cells, provide an excellent model system for theinvestigation of the influence of Ca2+ signals on the mechanical properties of the cells. Theheat developed by the lasers of the µOS open the TRPV1 channel and therefore triggera massive Ca2+ influx during the measurement. Application of adequate drugs, namelyRuR and BAPTA, can be used to inhibit the Ca2+ signal. The transfections of the TRPV1channels into HEK293, hence, equips the cells with a controlable switch for Ca2+ entry.
5.3 Influence of Ca2+ on Cellular Mechanics
Ca2+ is one of the most important second messengers in biological cells and is involvedin numerous physiological processes. In this section the obtained results with the modelsystem HEK293-TRPV1 will we be used to elucidate the influence of Ca2+ on cellularcontractions. The strengths and limits of the phenomenological model used to quantifythe contractility will be discussed and consequences of contractility on the distributionsof the mechanical property parameters are presented.
5.3.1 Mechanisms of Cellular Contractions
A number of cells showed pronounced contractions throughout the length of the cell whensubjected to the optically induced surface forces in the µOS. This process was shown to bein part dependent on influx of external Ca2+ through the plasma membrane of the investi-gated cells. Blocking Ca2+ influx and suppressing internal Ca2+ signal propagation had asignificant influence on the cellular strain, however, they did not inhibit the contractionsentirely. These findings indicate that contractions in the investigated cells are triggered bymore than one mechanism.
In search of the origin of the observed whole cell contractions, processes that produceforces on molecular scale have to be considered. Myosin motor induced contractions havebeen in the focus of many studies on cellular activity. Myosin was shown to be involved insteering of cell migration [Beningo et al., 2006] and endothelial retractions [Wysolmerskiand Lagunoff, 1990]. In reconstituted systems it could be shown to cause contractions atcertain cross-linker concentrations [Bendix et al., 2008] and reproduction of contractilebehavior could be reached by theoretical description of active gels consisting of filamentsand motors [Liverpool et al., 2009]. Ca2+ is known to be an important messenger in theactivation pathway of smooth muscular and non-muscular myosin. It binds to calmodulin,forming a Ca2+/calmodulin complex which activates MLCK. The activity of the myosinmotors is determined by the balance of activated MLCK and MLCP: MLCK phosphori-lates the myosin regulatory light chain, whereas MLCP dephosphorilates it [Fukata et al.,
92 Discussion
2001; Somlyo and Somlyo, 2003]. The involvement of Ca2+ dependent myosin activationin the generation of non-muscular contractions has been confirmed in experiments withbeads attached to the cytoskeleton that were manipulated by magnetic tweezers [Koll-mannsberger et al., 2011].
Several contractile processes independent on motor activity have been described in theliterature. Depolymerization of MFs can be induced by Ca2+-regulated actin-modifyingproteins, such as villin, gelsolin, and severin [Kumar et al., 2004; Larson et al., 2005;Walsh et al., 1984]. This in turn, can lead to contractions of the cell. Enthalpic contribu-tions of the attractive interactions lead to contractile forces whereas entropic contributionsto the free energy of the material favor an expansion of the material. If this force balanceis shifted by depolymerization under the condition that monomers can freely diffuse away,the material contracts to reestablish the equilibrium density [Sun et al., 2010].
Also Ca2+ regulated depolymerization of MTs generates considerable amounts offorces. Exposure of MTs to free Ca2+ has been shown to induce depolymerization[Salmon and Segall, 1980] which directly leads to force generation [Grishchuk et al.,2005; Molodtsov et al., 2007]. Moreover, according to the tensegrity model, the MTsprovide the load bearing structure that counteracts contractile pre-stress e.g. caused by theaction of molecular motors [Ingber, 1997; Wang et al., 2001b]. According to this model, adepolymerization of the load bearing MTs leads to a contraction of the whole system. Thepre-stress is believed to be induced mainly by myosin motors, hence, this model predictsmyosin independent and myosin dependent contributions to cellular contractions.
During cell spreading on stiff substrates contractile forces arise from slow formationof actin stress fibers. The forces during this process have been measured by micro-platerheology studies [Thoumine and Ott, 1997]. The forces build up in the order of hun-dreds of seconds and are dependent on the formation of adhesions on the micro-plates.It is evident, that their origin lies in a different effect than the fast, adhesion independentcontractions observed in the experiments described in this thesis.
The phenomenological mathematical model presented in this work is able to quantifythe overall force that the cell exerts on its surface. It does not give a direct access tothe microscopic mechanisms leading to cellular contractions. This, in turn, opens thepossibility for an unbiased view on force generation, without any a priori assumption onits molecular origin and thus allows to investigate the influence of different mechanismsand mechano-activation pathways. Adequate drugs can be used to manipulate specificprocesses in the cell in order to elucidate their influence. The molecular motor myosin canbe inhibited by ML-7 or blebbistatin, MFs can be disrupted or stabilized by cytochalasinsor jasplakinolide and the application of nocodazole and taxol can be used to control MTstability. In this thesis the applicability of the model was shown for the influence of Ca2+
signal inhibition on cellular stress-strain behavior and the generation of contractile forces.This shows that the method to analyze the data provides a powerful tool to evaluate theeffect of specific molecular processes on cellular contractions.
5.3.2 Applicability of the Model
To quantify the observed whole cell contractions, a phenomenological mathematicalmodel describing the cellular strain upon external stress was developed. To this end,the general constitutive equation for a linear viscoelastic material was approximated by
5.3 Influence of Ca2+ on Cellular Mechanics 93
the leading terms of its Taylor expansion and a linear term accounting for the first orderof active contractile forces exerted by the cell was incorporated. This approach allowedto develop an analytic expression for the stress-strain relation of the cell.
In the light of known non-linear responses of cells, it remains surprising, that thisapproximation – up to second order in the passive material properties and linear in theactive component – provides reliable results. When measured with microplate rheology[Fernandez and Ott, 2008; Fernandez et al., 2006] or magnetic twisting cytometry [Koll-mannsberger et al., 2011; Wang et al., 1993] cells show pronounced non-linear stress-strain relations. In reconstituted biopolymer systems stress-stiffening responses were ob-served under deformation depending on filament stiffness, filament density and concentra-tion of cross-linkers [Gardel et al., 2004; Xu et al., 2000]. The addition of active molecularmotors [Broedersz and MacKintosh, 2011; Mizuno et al., 2007] or small concentrations ofstiffMTs [Lin et al., 2011] amplified the non-linearity of the material response. However,it was shown by Wang et al. that for bead experiments the non-linear response depends onthe specific binding properties of the beads [Wang et al., 1993]. While experiments withbeads bound to receptors that are not associated with focal adhesion formation resultedin linear stress-strain responses, forces applied to beads specifically bound to β1 integrinsled to a stress-stiffening.
Despite the known non-linear responses of cells in other contexts, in the experimentspresented in this work the phenomenological mathematical model permitted to distinguishbetween active and non-active cells and enabled to quantify the activity. As the model doesnot require any assumption on the underlying mechanisms of the contractions it allows anunbiased view on their origin. The strain of the cell in the presented experiments did notexceed 6 %. In contrast to experiments with attached beads the force in the µOS is notapplied to specific focal adhesion complexes but is continuously distributed over the cellsurface such that no high local strains are expected. Hence, the material does not largelyexceed the viscoelastic limit and the assumptions underlying the model are valid.
At times slightly below t=5 s, which was the duration of the stretch phase, a devi-ation between fitted model and the measured strains became obvious. A reason mightlie in plastic effects which cannot be covered by the mathematical model. Plasticity canbe caused e.g. by the breakage of cross-links during the cause of the experiments. Theinfluence of plasticity is expected to augment with time. To account for the increasing de-viation the fits were weighted with the inverse square of the interquartile distance, whichalso grew with time as the strain distribution became broader. This assured accurate fittingat the beginning and revealed a slight deviation between the experiment and the theoreticaldescription towards the end of the experiments. Whereas for longer measurement timesthe theory will break down at some point, it provides an accurate description within themeasurement errors for the experiments presented in this thesis.
To derive the phenomenological mathematical description it was assumed that the ac-tive cellular force terminates immediately as soon as the external stress ceases. Predictingthe course of the stress-strain relation with this assumption revealed a clear quantitativeas well as qualitative deviation between model prediction and experiment. Conversely,this means that the strained cell does not relax passively but is driven by active forcesexerted by the cell. An incorporation of this process into the relaxation phase of the phe-nomenological mathematical description would either require a closer knowledge aboutthe relaxation processes or, in the case of a simple approximation, further fit parameters.
94 Discussion
While most of the measured strain curves could be fitted by the presented theory insome cases the descriptive model failed to provide reliable information. For strain datathat could not be reliably fitted by the algorithm as the fit parameters diverged, the fol-lowing two reasons could be identified. For cells with very small deformation, e.g. causedby a compensation of external and internal stress, the recorded strain was in the order ofmagnitude of the measurement uncertainty. The second reason that impeded fit parame-ter convergence was a local minimum several seconds after the beginning of the stretchphase. For these cells it can be assumed that the linear approximation of the active cellularstress does not sufficiently describe the real case. In these cells the higher order terms ofthe cellular strain leading to a decay of the stress exceeded the constantly increasing linearterm that was included in the model. This led to a positive derivative of the strain towardsthe end of the stretch phase, which cannot be covered by the model. For most of the casesin which such a deviation from the model occurred it could be accounted for by the earliermentioned weighting of the fits with the inverse square of the interquartile distance. If theeffect was very pronounced the fitting failed to accurately describe the strain curve andthe parameters diverged. If the correlation parameter r2 that describes the quality of thefit was lower than 0.7 or the parameters diverged due to one of the two reasons mentionedabove the cell was excluded from the analysis. For most of the cells, 88.5 %, the fitting al-gorithm resulted in reasonable and reproducible results and the phenomenological modelwas a sufficiently good approximation to quantify the activity.
5.3.3 Strain Distributions
The distributions of the strain in the presented experiments depended on the drug treat-ment and, hence, on the activity of the cells. While strain distributions of cells withouttreatment showed a long tail to the right, i.e. a negative skewness, with increasing Ca2+
blockage the distributions turned more and more to a positive skewness.In early works with the µOS, Gaussian distributions were fitted to the strain data dis-
tributions and a Student’s t-test, which also relies on the assumption of a Gaussian dis-tribution, was applied to assess the significance of the measured differences [Guck et al.,2005]. A number of measurements with a variety of methods have observed power-lawrheological behavior of cellular elasticity [Desprat et al., 2005; Fabry et al., 2001; Hoff-man and Crocker, 2009; Icard-Arcizet et al., 2008; Yamada et al., 2000], this implies alog-normal distribution for the strain [Fabry et al., 2001; Hoffman et al., 2006]. Thesefixed strain distributions are in strong contrast to the results of the presented thesis: here,even for one cell type the distribution was changed when the pathways controlling the ac-tivity were targeted by adequate drugs. This finding suggest that part of the origin of thedistributions’ skewnesses originates from active contributions of the cell to its stress-strainresponse.
The discussion, whether suspended cells follow the power-law rheological predictionsis still ongoing [Maloney et al., 2010; Wottawah et al., 2005a,b]. In most of the previousµOS experiments cells were measured for 2 s and visible contractions were not reported.Measurements with a stretch phase of 5 s as presented in this work, reveal contractionseven for cells without additional Ca2+ influx. The mathematical description predicts anearly onset of these contractions. For shorter experiment times this will not result in visi-ble contractions, it may, however, drastically influence the curve shape. This could close
5.3 Influence of Ca2+ on Cellular Mechanics 95
the gab between the power-law rheological predictions and the data obtained for singlesuspended cells. The introduced model reveals that passive cell strain might be superim-posed by contractile contributions. The influence of contractility, even in measurementsthat seemingly can be described with passive viscoelastic approaches, may lead to misin-terpretation and erroneous material properties if not carefully considered in the analysis.
The absence of a fixed general distribution for the measured strain data necessitates thesearch for adequate methods for statistical analysis of the data. In this work the Wilcoxonrank sum test, a non-parametric statistical hypothesis test, [Mann and Whitney, 1947] wasutilized to evaluate whether two strain distributions differ significantly. The median, in-stead of a the mean, which is very sensitive to outliers, was used as characteristic numberto compare the distributions. An uncertainty of the median was obtained calculating the95 % CI with the bootstrapping method [Efron and Tibshirani, 1994], again a statisticalmethod that does not rely on a priori knowledge of the type of data distribution. Skeweddistributions play also an important role in primary cells e.g. in the incremental devel-opment of cancer cells in the vicinity of normal tissue, in which the strain is believedto depend on the degree of metastatic transformation and in specific experiments on drugapplication. The presented set of statistical tools provides a potent method for the analysisof this kind of strain data.
96 Discussion
Chapter 6
Conclusions
Understanding the principles of active soft matter, which can be found in a wide varietyof biological systems, is a vital field of current investigations. Contractility constitutesan interesting aspect of this kind of materials and is relevant for many physiological pro-cesses such as cellular contractions in wound healing [Bement et al., 1993; Tamada et al.,2007] embryonic development [Jacinto et al., 2000; Martin et al., 2009] and cell migration[Beningo et al., 2006; Lo et al., 2004]. By examining the influence of Ca2+ on contractilityin cells this thesis contribute to a more detailed knowledge about these processes. The in-sight that cells contract without the involvement of attachments to other cells or a substrate[Gyger et al., 2012] sheds new light on mechanisms involved in cellular contractions.
HEK293 cells transfected with the TRPV1 ion channel were shown to provide an ex-cellent model system for the investigation of the influence of Ca2+ on cellular mechanics.The heating inside the trap at the used laser powers does not significantly affect cellularviabilty [Wetzel et al., 2011]. It could be shown in this work that the temperature increaseduring an µOS measurement is, nevertheless, sufficient to open the temperature sensitiveTRPV1 ion channel triggering a massive Ca2+ influx during the measurements [Gygeret al., 2011]. A combination of fluorescent Ca2+ imaging in the confocal laser scanningmicroscope with Optical Stretching experiments demonstrated that the Ca2+ influx is in-hibited by the channel blocker RuR and that signal propagation can be manipulated bythe action of the chelator BAPTA. The µOS probes the mechanical properties of the cellswhile the TRPV1 channel provides a tunable switch for Ca2+ entry [Gyger et al., 2011].Thus, results on the mechanical properties of the cells with and without Ca2+ signalingcan be compared directly.
In these experiments a number of tested cells actively contracted against the exter-nal optically induced surface forces. Contractions of this kind, without any involvementof focal adhesions or other attachments to substrates and neighboring cells, have beenobserved in this work for the first time [Gyger et al., 2012]. With the aid of the TRPV1transfected HEK293 cells it could be shown that these contractions depend in part on Ca2+
signaling pathways [Gyger et al., 2012]. A phenomenological mathematical model wasdeveloped that included the active contractions. This approach allowed to identify activecells and quantify their activity [Gyger et al., 2012].
The distributions of the cellular strain obtained by these measurements did not obeya fixed general distribution but were shown to depend on the cellular activity. To over-come the difficulties in judging the significance of measured differences two methods were
98 Conclusions
proposed: first, the parameter free Wilcoxon-rank-sum test was applied to see if the dis-tributions are significantly different. Secondly, the bootstrapping method was employedto calculate a confidence interval for the median of the distributions [Gyger et al., 2012].In recent investigations on the deformability of primary cancer cells and cancerous celllines it was shown that also their strain distributions are neither Gaussian nor log-normaldistributed but have a long tail towards the left [Wetzel et al., in preparation]. The sta-tistical methods proposed here can help to assess the significance of differences for suchfindings.
Numerous studies showed that cancer cells tend to have an increased deformabilitycompared to normal tissue cells [Cross et al., 2007; Lekka et al., 1999; Lincoln et al.,2004]. However, recent research on cancer progression indicated a relation between con-tractility and metastatic aggressiveness [Jonas et al., 2011; Mierke et al., 2008]. In sumthese findings indicate the necessity of approaches that are able to distinguish betweencellular deformability and the effect of active contractions in the cell. By incorporationof cellular contractility the presented phenomenological mathematical model provides amethod that is able to characterize the contractility of suspended cells independently oftheir deformability [Gyger et al., 2012].
To conclude, the results of this dissertation show that cellular contractions can befound in single suspended cells, i.e. without direct involvement of adhesions to substratesor neighboring cells. The introduced model reveals that passive cell strain might be su-perimposed by contractile contributions. The influence of contractility, even in measure-ments that seemingly can be described with passive viscoelastic approaches, might leadto misinterpretation and erroneous material properties if not carefully considered in theanalysis. The findings demonstrate that active processes are a quintessential part of thecell’s mechanical signature; understanding and quantifying them might pave the way forbetter mechanical phenotyping of cells in future investigations, diagnosis and therapy.
Chapter 7
Outlook
The results and methods presented in this thesis provide insight into adhesion independentcellular contractions and the influence of Ca2+ on the mechanics of single suspended cells.From the presented findings a number of experiments providing further insight into thetopic can be deduced. These ideas will be outlined in this section.
As mentioned in Sec. 2.1.2, the main candidates for cellular force generation are poly-merization, depolymerization and myosin motor activity that contracts the MFs cortex un-derneath the cell membrane. Myosin motors can be blocked by the application of ML-7,a drug that inhibits MLCK and, thus, interrupts the Ca2+ dependent motor activation cas-cade [Makishima et al., 1991]. Investigating the hypothesis that this interruption shouldhave the same effect as blocking the signal cascade at the level of the Ca2+ ions, pre-liminary results with HEK293-TRPV1 cells and 1 µM ML-7 have been obtained. Theseresults are preliminary in the sense that they still lack the revision of their reproduciblility.As expected, the ML-7 application resulted in a comparable increase in the cellular strainas Ca2+ signaling inhibition. In the case of ML-7 application the number of non-activecells increased only slightly while the contractions of cells that showed an activity be-came weaker. This led to an overall median of the strain that was comparable to whenCa2+ signaling was interrupted. However, the distributions of the activity parameter A
differed. The effects of both approaches were hence similar but not completely equiva-lent. In both cases, Ca2+ signal interruption and MLCK inhibition, contractions are notblocked completely. This indicates a second, Ca2+ independent mechanism that leads tocontractions.
Measuring the mechanical properties with the µOS in combination with the quantifi-cation by the phenomenological mathematical model is a powerful tool for mechanicalphenotyping of cells. It can be utilized to evaluate the influence of other possible mecha-nisms influencing contractions in the cell. The cytoskeletal elements can be manipulatedby adequate drugs to elucidate their role in the contractile apparatus. MFs are destabilizedby drugs, such as latrunculin A and B or cytochalasin D [Morton et al., 2000; Wakatsukiet al., 2001]. In combination with blockage of myosin motors, e.g. by ML-7, such exper-iments will allow further insight into the question whether depolymerization of actin canlead to contractile forces without the involvement of myosin motors as proposed by thegroup of C. W. Wolgemuth based on theoretical considerations [Sun et al., 2010].
Furthermore, it has been shown in vitro that MTs depolymerization can result directlyin force production [Grishchuk et al., 2005; Molodtsov et al., 2007]. Theoretical consid-
100 Outlook
erations and measurements show that MTs stabilization seems to have no major effect onthe compliance of cells when pulling with the µOS [Ananthakrishnan et al., 2005; Laut-enschlager et al., 2009]. However, MTs have an effect on the relaxation after the stretchphase when measured in the µOS. The tensegrity model proposes that MTs provide a loadbearing structure counteracting contractile tension [Ingber, 1997; Wang et al., 2001b].MTs depolymerization will, in the framework of this model, lead to a contraction of thecells. Measuring the cellular compliance with the µOS while determining the activitywith the presented model in conjunction with the MTs depolymerization by nocodazole[Vasquez et al., 1997] or stabilizing it with taxol [Torres and Horwitz, 1998] provides amethod to investigate the role of MTs in the force production inside a living cell.
In the same context the combination of µOS and fluorescence imaging in the CLSMcan be used to visualize the processes in the cytoskeleton during the µOS measurement.Restructuring of MFs and MTs can be made observable by fluorescently labeling thecytoskeletal proteins. This approach could also help to understand cytoskeletal changesduring cancer progression [Fritsch et al., 2010; Mierke et al., 2008].
In the presented study the HEK293 cells transfected with the TRPV1 ion channelwhich opens at temperatures above 40 ◦C were used. HEK293 cells with other ion chan-nels such as the TRPV3, which opens at T ≥ 33 ◦C [Dhaka et al., 2006], are available.Such a system allows measurements with other temperature characteristics and can beused for further studies of the influence on temperature on Ca2+ dependent cellular con-tractions.
In a recent Nature Outlook article on mechanical aspects of cancer it was stated thatmechanics is too fundamental in life to be not involved in cancer development [Joni-etz, 2012]. However, today’s research on the mechanical mechanisms involved in tumorgrowth and metastasis formation barely touches the understanding of the underlying con-cepts. Even though it is still a long way to go to develop therapeutic application anddiagnostic tools, fundamental research, as presented in this dissertation, might play animportant part in the fight against cancer and could therefore have a broad impact on thefuture of our society.
Acknowledgments
The presented work would not have been possible without the aid of many people. Firstof all I want to thank my supervisor Prof. Dr. Josef A. Kas for his support during the lastyears. He continued to believe in me even when the first projects were not as successful aswe expected. With his help I learned a lot about the politics behind science. Dr. MareikeZink was a great help towards the end of the PhD time by discussing scientific questionsas well as assisting in writing papers and other scientific texts. In my opinion her workhas greatly advanced the productivity of this lab.
A great thanks goes to all the former and current members of the PWM-lab. Speciallyto Bernd Kohlstrunk, who was always there when I urgently needed technical support, aswell as Elke Westphal, Dr. Undine Dietrich and Claudia Bruck, for helping to overcomeall the administrational obstacles and meanders. Thanks to Dr. Florian Ruckerl whoseideas helped to turn the “failure” of my master thesis project into a good paper and fromwhom I learned a lot about scientific writing. I am very grateful for a tremendous amountof “start-up” aid by Dr. Timo Betz, Dr. Bjorn Stuhrmann, Dr. Franziska Lautenschlager,Dr. Allen Ehrlicher, Dr. Kristian Franze, Dr. Cornel Wolf, and to Dr. David Smithand Dr. Brain Gentry for proofreading many English texts. Thanks to Roland Stangefor enormously facilitating the measurements by automating the Optical Stretcher and foralways being willing to help. Thanks to Tobias Kießling for a great piece of software,allowing a fast processing of the Stretcher data. For a lot of help in many aspects I thankDavid Nnetu, Susanne Ronicke, Anatol Fritsch, Daniel Rose, Lydia Woiterski, Dr. FlorianHuber, Dan Strehle, Thomas Fuhs, Melanie Knorr, Philipp Rauch, Timm Hohmann, andSteve Pawlizak.
Prof. Dr. Ben Fabry from the Friedrich-Alexander-University of Erlangen-Nurnberg Ithank for many critical and fruitful discussions on my projects. It was him who came upwith the idea to work with the TRPV1 transfected HEK293 cells kindly provided by Prof.David Julius from the UCSF. Katja B. Kostelnik and Prof. Dr. Annette G. Beck-Sickingerhelped with the biochemistry for the ML-7 measurements. Thanks to Dr. Jaime RuızGarcıa for a great year in Mexico and for making my first scientific experiences possible.
The third party founded scholarship of the graduate school “Build-MoNa” during myPhD time was a great possibility for an interdisciplinary exchange with PhD-Studentsand researchers from other areas. I thank the members of the Build-MoNa office forhelping with the bureaucratic part to this scholarship. Build-MoNa, together with theResearch Academy also allowed me to travel to conferences, such as the “New Horrizonsin Calcium Signaling” in Beijing, China, which would not have been possible without thisfounding.
Due to saving measures at our university it has become more and more difficult tofind access to published papers. A circumstance which is, in times of the coming to
102 Acknowledgements
light of so much fraud by public figures, not understandable to me. In many occasions Icouldn’t have solved the problem without the “MinD-University-Network” and especiallythe “wer-weiß-was Liste”, where people from universities all over Germany helped me toget access to publications in journals which seem to be not affordable by the Universityof Leipzig.
Proofreading of this thesis was done by Dr. Mareike Zink, Idis Hartmann and FabianGyger, to whom I am very grateful for this big piece of help.
My friends and family helped a lot by motivational support during my PhD time.The meetings with Christian Czecalla, although we always need half a year to find anappointment for having a beer together, increased my frustrational tolerance when projectswere not going as I wished. Thanks to Max and Elsa Semmling who do a great job as“parrain et parraine” for my son Elias.
To Nolu and Elias I owe the greatest thanks of all for enduring long days of work andall the frustration during the past years and last but not for least loving me so much duringall that time. Without your support this thesis would not have been possible.
4.1 Temperature Dynamics in the µOS . . . . . . . . . . . . . . . . . . . . . 564.2 Power Dependence of Temperature Increase in µOS . . . . . . . . . . . . 574.3 Ca2+ Imaging in Trapped Cells in the CLSM . . . . . . . . . . . . . . . . 594.4 Fluorescence Intensities of Single TRPV1 Transfected HEK293 Cells . . 604.5 Temperature Effect on Ca2+ Dye . . . . . . . . . . . . . . . . . . . . . . 614.6 TRPV1 Activation in Dependence on Laser Power . . . . . . . . . . . . . 634.7 Fluorescence Without External Ca2+ Influx . . . . . . . . . . . . . . . . 644.8 Contractions of Suspended Cells . . . . . . . . . . . . . . . . . . . . . . 664.9 Strain Distributions of HEK293-TRPV1 Cells in the µOS . . . . . . . . . 674.10 Passively Extending and Strongly Contracting HEK293-TRPV1 Cell . . . 684.11 HEK293-TRPV1 Control Experiments . . . . . . . . . . . . . . . . . . . 694.12 HEK293 Wild Type Control Experiments. . . . . . . . . . . . . . . . . . 704.13 Modeled Stress and Strain Over Time . . . . . . . . . . . . . . . . . . . 744.14 Parameter Sweep for F . . . . . . . . . . . . . . . . . . . . . . . . . . . 774.15 Examples of Fits of the Theory . . . . . . . . . . . . . . . . . . . . . . . 784.16 Activity Parameter at Different Laser Powers . . . . . . . . . . . . . . . 794.17 Distributions of the Fit Parameters . . . . . . . . . . . . . . . . . . . . . 804.18 Histogram of the Activity Parameter . . . . . . . . . . . . . . . . . . . . 814.19 Activity Parameter of HEK293-TRPV1 Control Experiments . . . . . . . 834.20 Activity Parameter of HEK293 Wild Type Control Experiments . . . . . 84
104 LIST OF FIGURES
Bibliography
B. Alberts, A. Johnson, J. Lewis, M. Raff, K. Roberts, and P. Walter. Molecular Biology
of the Cell. Garland, New York, 4th edition, 2002.
R. Ananthakrishnan. On the Structural Response of Eukaryotic Cells. PhD thesis, Uni-versity of Texas at Austin, 2003.
R. Ananthakrishnan, J. Guck, F. Wottawah, S. Schinkinger, B. Lincoln, M. Romeyke, andJ. Kas. Modelling the structural response of an eukaryotic cell in the Optical Stretcher.Curr Sci India, 88(9):1434–1440, 2005.
R. Ananthakrishnan, J. Guck, F. Wottawah, S. Schinkinger, B. Lincoln, M. Romeyke,T. Moon, and J. Kas. Quantifying the contribution of actin networks to the elasticstrength of fibroblasts. J Theor Biol, 242(2):502–516, 2006.
R. Ananthakrishnan, J. Guck, F. Wottawah, S. Schinkinger, B. Lincoln, M. Romeyke,T. Moon, and J. Kas. Corrigendum to “Quantifying the contribution of actin networksto the elastic strength of fibroblasts” [J Theor Biol, 242(2):502–516,2006]. J Theor
Biol, 255(1):162, 2008.
A. O. Anderson and N. D. Anderson. Lymphocyte emigration from high endothelialvenules in rat lymph nodes. Immunology, 31(5):731–48, 1976.
I. S. Aranson and L. S. Tsimring. Patterns and collective behavior in granular media:theoretical concepts. Rev Mod Phys, 78(2):641–692, 2006.
A. Ashkin. Acceleration and trapping of particles by radiation pressure. Phys Rev Lett,24(4):156–159, 1970.
A. Ashkin and J. Dziedzic. Optical trapping and manipulation of viruses and bacteria.Science, 235(4795):1517–1520, 1987.
A. Ashkin, J. M. Dziedzic, J. E. Bjorkholm, and S. Chu. Observation of a single-beamgradient force optical trap for dielectric particles. Opt Lett, 11(5):288–290, 1986.
A. Ashkin, J. M. Dziedzic, and T. Yamane. Optical trapping and manipulation of singlecells using infrared laser beams. Nature, 330(6150):769–771, 1987.
R. Astumian and M. Bier. Mechanochemical coupling of the motion of molecular motorsto ATP hydrolysis. Biophys J, 70(2):637–653, 1996.
106 BIBLIOGRAPHY
R. D. Astumian. Thermodynamics and kinetics of a brownian motor. Science, 276(5314):917–922, 1997.
R. D. Astumian and P. Hanggi. Brownian motors. Phys Today, 55(11):33–40, 2002.
Y. Babu, C. E. Bugg, and W. J. Cook. Structure of calmodulin refined at 2.2 Å resolution.J Mol Biol, 204(1):191–204, 1988.
P. B. Bareil, Y. Sheng, and A. Chiou. Local scattering stress distribution on surface of aspherical cell in Optical Stretcher. Opt Express, 14(25):12503–12509, 2006.
A. Basu, Q. Wen, X. Mao, T. C. Lubensky, P. A. Janmey, and A. G. Yodh. Nonaffinedisplacements in flexible polymer networks. Macromolecules, 44(6):1671–1679, 2011.
W. M. Bement, P. Forscher, and M. S. Mooseker. A novel cytoskeletal structure involvedin purse string wound closure and cell polarity maintenance. J Cell Biol, 121(3):565–578, 1993.
P. M. Bendix, G. H. Koenderink, D. Cuvelier, Z. Dogic, B. N. Koeleman, W. M. Brieher,C. M. Field, L. Mahadevan, and D. A. Weitz. A quantitative analysis of contractility inactive cytoskeletal protein networks. Biophys J, 94(8):3126–3136, 2008.
K. A. Beningo, K. Hamao, M. Dembo, Y.-L. Wang, and H. Hosoya. Traction forces offibroblasts are regulated by the rho-dependent kinase but not by the myosin light chainkinase. Arch Biochem Biophys, 456(2):224–231, 2006.
M. J. Berridge, P. Lipp, and M. D. Bootman. The versatility and universality of calciumsignalling. Nat Rev Mol Cell Biol, 1(1):11–21, 2000.
L. A. Birder. More than just a barrier: urothelium as a drug target for urinary bladderpain. Am J Physiol – Renal, 289(3):F489–F495, 2005.
L. Boyde, K. J. Chalut, and J. Guck. Interaction of Gaussian beam with near-sphericalparticle: an analytic-numerical approach for assessing scattering and stresses. J Opt
Soc Am A, 26(8):1814–1826, 2009.
C. P. Broedersz and F. C. MacKintosh. Molecular motors stiffen non-affine semiflexiblepolymer networks. Soft Matter, 7(7):3186–3191, 2011.
C. P. Broedersz, C. Storm, and F. C. MacKintosh. Nonlinear elasticity of compositenetworks of stiff biopolymers with flexible linkers. Phys Rev Lett, 101(11):118103,2008.
C. P. Broedersz, X. Mao, T. C. Lubensky, and F. C. MacKintosh. Criticality and isostatic-ity in fibre networks. Nat Phys, 7(12):983–988, 2011.
M. J. Brown, J. A. Hallam, E. Colucci-Guyon, and S. Shaw. Rigidity of circulating lym-phocytes is primarily conferred by vimentin intermediate filaments. J Immunol, 166(11):6640–6646, 2001.
BIBLIOGRAPHY 107
M. R. Bubb, I. Spector, B. B. Beyer, and K. M. Fosen. Effects of jasplakinolide on thekinetics of actin polymerization. J Biol Chem, 275(7):5163–5170, 2000.
C. Bustamante, Y. Chemla, N. Forde, and D. Izhaky. Mechanical processes in biochem-istry. Annu Rev Biochem, 73:705–748, 2004.
Y. Cai, N. Biais, G. Giannone, M. Tanase, G. Jiang, J. M. Hofman, C. H. Wiggins, P. Sil-berzan, A. Buguin, B. Ladoux, and M. P. Sheetz. Nonmuscle myosin IIA-dependentforce inhibits cell spreading and drives F-actin flow. Biophys J, 91(10):3907–3920,2006.
M. Caterina, M. Schumacher, M. Tominaga, T. Rosen, J. Levine, and D. Julius. Thecapsaicin receptor: a heat-activated ion channel in the pain pathway. Nature, 389(6653):816–824, 1997.
M. J. Caterina. Transient receptor potential ion channels as participants in thermosensa-tion and thermoregulation. Am J Physiol – Reg I, 292(1):R64–R76, 2007.
M. J. Caterina and D. Julius. The vanilloid receptor: A molecular gateway to the painpathway. Ann Rev Neurosci, 24(1):487–517, 2001.
M. J. Caterina, T. A. Rosen, M. Tominaga, A. J. Brake, and D. Julius. A capsaicin-receptorhomologue with a high threshold for noxious heat. Nature, 398(6726):436–441, 1999.
M. J. Caterina, A. Leffler, A. B. Malmberg, W. J. Martin, J. Trafton, K. R. Petersen-Zeitz,M. Koltzenburg, A. I. Basbaum, and D. Julius. Impaired nociception and pain sensationin mice lacking the capsaicin receptor. Science, 288(5464):306–313, 2000.
M. E. Cates and F. C. MacKintosh. Active soft matter. Soft Matter, 7(7):3050–3051,2011.
F. Chowdhury, S. Na, O. Collin, B. Tay, F. Li, T. Tanaka, D. E. Leckband, and N. Wang.Is cell rheology governed by nonequilibrium-to-equilibrium transition of noncovalentbonds? Biophys J, 95(12):5719–5727, 2008.
K. M. V. Citters, B. D. Hoffman, G. Massiera, and J. C. Crocker. The role of F-actin andmyosin in epithelial cell rheology. Biophys J, 91(10):3946–3956, 2006.
D. E. Clapham. Calcium signaling. Cell, 131(6):1047–1058, 2007.
A. Constable, J. Kim, J. Mervis, F. Zarinetchi, and M. Prentiss. Demonstration of a fiber-optical light-force trap. Opt Lett, 18(21):1867–1869, 1993.
G. M. Cooper. The Cell: A Molecular Approach. Sinauer Associates Inc., 2nd edition,2000.
S. E. Cross, Y.-S. Jin, J. Rao, and J. K. Gimzewski. Nanomechanical analysis of cellsfrom cancer patients. Nature Nanotech, 2(12):780 –783, 2007.
J. A. Curcio and C. C. Petty. The near infrared absorption spectrum of liquid water. J Opt
Soc Am, 41(5):302, 1951.
108 BIBLIOGRAPHY
M. Daimon and A. Masumura. Measurement of the refractive index of distilled waterfrom the near-infrared region to the ultraviolet region. Appl Opt, 46(18):3811–3820,2007.
J. B. Davis, J. Gray, M. J. Gunthorpe, J. P. Hatcher, P. T. Davey, P. Overend, M. H. Harries,J. Latcham, C. Clapham, K. Atkinson, S. A. Hughes, K. Rance, E. Grau, A. J. Harper,P. L. Pugh, D. C. Rogers, S. Bingham, A. Randall, and S. A. Sheardown. Vanilloidreceptor-1 is essential for inflammatory thermal hyperalgesia. Nature, 405(6783):183–187, 2000.
N. Demaurex. Calcium measurements in organelles with Ca2+-sensitive fluorescent pro-teins. Cell Calcium, 38(3-4):213–222, 2005.
W. Demtroder. Experimentalphysik 2, Elektrizitat und Optik, chapter 8.4. Springer, Berlin,Heidelberg, New York, 3rd edition, 2004. ISBN 3-540-20210-2.
J. Deseigne, O. Dauchot, and H. Chate. Collective motion of vibrated polar disks. Phys
Rev Lett, 105(9):098001, 2010.
N. Desprat, A. Richert, J. Simeon, and A. Asnacios. Creep function of a single living cell.Biophys J, 88(3):2224–2233, 2005.
A. Dhaka, V. Viswanath, and A. Patapoutian. TRP ion channels and temperature sensa-tion. Annu Rev Neurosci, 29:135–161, 2006.
B. A. DiDonna and A. J. Levine. Filamin cross-linked semiflexible networks: Fragilityunder strain. Phys Rev Lett, 97(6):068104, 2006.
B. A. DiDonna and A. J. Levine. Unfolding cross-linkers as rheology regulators in F-actinnetworks. Phys Rev E, 75(4):041909, 2007.
M. Doi and S. Edwards. The Theory of Polymer Dynamics, chapter 8.8, pages 316–18.Oxford University Press, Oxford, 1986. ISBN 0-19-852033-6.
A. D. Doyle and J. Lee. Simultaneous, real-time imaging of intracellular calcium andcellular traction force production. BioTechniques, 33(2):358–364, 2002.
R. Dreyfus, J. Baudry, M. L. Roper, M. Fermigier, H. A. Stone, and J. Bibette. Micro-scopic artificial swimmers. Nature, 437(7060), 2005.
S. Ebert, K. Travis, B. Lincoln, and J. Guck. Fluorescence ratio thermometry in a mi-crofluidic dual-beam laser trap. Opt Express, 15(23):15493–15499, 2007.
B. Efron and R. J. Tibshirani. An Introduction to the Bootstrap (Chapman & Hall/CRC
Monographs on Statistics & Applied Probability). Chapman and Hall/CRC, 1st edition,1994. ISBN 9780412042317.
A. Einstein. Uber die von der molekularkinetischen Theorie der Warme geforderte Be-wegung von in ruhenden Flussigkeiten suspendierten Teilchen. Ann. d. Phys., 17:549,1905.
BIBLIOGRAPHY 109
A. Einstein. Zur Theorie der Brownschen Bewegung. Ann. d. Phys., 19:371, 1906.
A. E. Ekpenyong, C. L. Posey, J. L. Chaput, A. K. Burkart, M. M. Marquardt, T. J. Smith,and M. G. Nichols. Determination of cell elasticity through hybrid ray optics andcontinuum mechanics modeling of cell deformation in the Optical Stretcher. Appl Opt,48(32):6344–6354, 2009.
M. Essler, M. Amano, H.-J. Kruse, K. Kaibuchi, P. C. Weber, and M. Aepfelbacher.Thrombin inactivates myosin light chain phosphatase via rho and its target rho kinasein human endothelial cells. J Biol Chem, 273(34):21867–21874, 1998.
B. Fabry, G. N. Maksym, J. P. Butler, M. Glogauer, D. Navajas, and J. J. Fredberg. Scalingthe microrheology of living cells. Phys Rev Lett, 87(14):148102, 2001.
P. Fernandez and A. Ott. Single cell mechanics: Stress stiffening and kinematic hardening.Phys Rev Lett, 100(23):238102, 2008.
P. Fernandez, P. A. Pullarkat, and A. Ott. A master relation defines the nonlinear vis-coelasticity of single fibroblasts. Biophys J, 90(10):3796–3805, 2006.
K. Franze, J. Gerdelmann, M. Weick, T. Betz, S. Pawlizak, M. Lakadamyali, J. Bayer,K. Rillich, M. Gogler, Y.-B. Lu, A. Reichenbach, P. Janmey, and J. Kas. Neurite branchretraction is caused by a threshold-dependent mechanical impact. Biophys J, 97(7):1883–1890, 2009.
P. Friedl and D. Gilmour. Collective cell migration in morphogenesis, regeneration andcancer. Nature Reviews Molecular Cell Biology, 10(7):445–457, 2009.
A. Fritsch, M. Hockel, T. Kießling, K. D. Nnetu, F. Wetzel, M. Zink, and J. A. Kas. Arebiomechanical changes necessary for tumour progression? Nat Phys, 6(10):730–732,2010.
Y. Fukata, K. Kaibuchi, M. Amano, and K. Kaibuchi. Rho-rho-kinase pathway in smoothmuscle contraction and cytoskeletal reorganization of non-muscle cells. Trends Phar-
macol Sci, 22(1):32–39, 2001.
R. B. Fuller. Tensegrity. Portfolio Artnews Annual, 4:112–127, 1961.
R. B. Fuller. SYNERGETICS – Explorations in the Geometry of Thinking, volume I.Macmillan Publishing Co, New York, 1975.
R. B. Fuller. SYNERGETICS – Explorations in the Geometry of Thinking, volume II.Macmillan Publishing Co, New York, 1979.
S. Furuike, T. Ito, and M. Yamazaki. Mechanical unfolding of single filamin A (ABP-280)molecules detected by atomic force microscopy. FEBS Lett, 498(1):72–75, 2001.
V. E. Galkin, A. Orlova, and E. H. Egelman. Actin filaments as tension sensors. Curr
Biol, 22:R96–R101, 2012.
110 BIBLIOGRAPHY
M. L. Gardel, J. H. Shin, F. C. MacKintosh, L. Mahadevan, P. Matsudaira, and D. A.Weitz. Elastic Behavior of Cross-Linked and Bundled Actin Networks. Science, 304(5675):1301–1305, 2004.
K. R. Gee, K. A. Brown, W.-N. U. Chen, J. Bishop-Stewart, D. Gray, and I. Johnson.Chemical and physiological characterization of fluo-4 Ca2+-indicator dyes. Cell Cal-
cium, 27(2):97–106, 2000.
F. Gittes and F. MacKintosh. Dynamic shear modulus of a semiflexible polymer network.Phys Rev E, 58(2, Part a):R1241–R1244, 1998.
E. L. Grishchuk, M. I. Molodtsov, F. I. Ataullakhanov, and J. R. McIntosh. Force produc-tion by disassembling microtubules. Nature, 438(7066):384–388, 2005.
J. Gromada, P. Rorsman, S. Dissing, and B. S. Wulff. Stimulation of cloned humanglucagon-like peptide 1 receptor expressed in HEK293 cells induces camp-dependentactivation of calcium-induced calcium release. FEBS Lett, 373(2):182–186, 1995.
J. Guck, R. Ananthakrishnan, T. J. Moon, C. C. Cunningham, and J. Kas. Optical de-formability of soft biological dielectrics. Phys Rev Lett, 84(23):5451–5454, 2000.
J. Guck, R. Ananthakrishnan, H. Mahmood, T. J. Moon, C. C. Cunningham, and J. Kas.The Optical Stretcher: a novel laser tool to micromanipulate cells. Biophys J, 81(2):767–784, 2001.
J. Guck, R. Ananthakrishnan, C. C. Cunningham, and J. Kas. Stretching biological cellswith light. J Phys-Condens Mat, 14(19):4843–4856, 2002.
J. Guck, S. Schinkinger, B. Lincoln, F. Wottawah, S. Ebert, M. Romeyke, D. Lenz, H. M.Erickson, R. Ananthakrishnan, D. Mitchell, J. Kas, S. Ulvick, and C. Bilby. Opti-cal deformability as an inherent cell marker for testing malignant transformation andmetastatic competence. Biophys J, 88(5):3689–3698, 2005.
M. Gyger, D. Rose, R. Stange, T. Kießling, M. Zink, B. Fabry, and J. A. Kas. Calciumimaging in the Optical Stretcher. Opt Express, 19(20):19212–19222, 2011,Elected for: Virtual J Biomed Opt 6(10):19212 – 19222, 2011.
M. Gyger, R. Stange, T. Kießling, A. Fritsch, K. B. Kostelnik, A. G. Beck-Sickinger,M. Zink, and J. A. Kas. Active contractions in suspended cells. submitted to Soft
Matter, Oct 25th, 2012.
R. E. Haddock and C. E. Hill. Rhythmicity in arterial smooth muscle. J Physiol, 566(3):645–656, 2005.
P. Hanggi, F. Marchesoni, and F. Nori. Brownian motors. Ann. d. Phys., 14(1-3):51–70,2005.
K. Haraguchi, T. Hayashi, T. Jimbo, T. Yamamoto, and T. Akiyama. Role of the kinesin-2family protein, KIF3, during mitosis. J Biol Chem, 281(7):4094–4099, 2006.
BIBLIOGRAPHY 111
D. A. Head, A. J. Levine, and F. C. MacKintosh. Distinct regimes of elastic response anddeformation modes of cross-linked cytoskeletal and semiflexible polymer networks.Phys Rev E, 68(6):061907, 2003a.
D. A. Head, A. J. Levine, and F. C. MacKintosh. Deformation of cross-linked semiflexiblepolymer networks. Phys Rev Lett, 91(10):108102, 2003b.
L. V. Heilbrunn and F. J. Wiercinski. The action of various cations on muscle protoplasm.J Cell Comp Physiol, 29(1):15–32, 1947.
B. D. Hoffman and J. C. Crocker. Cell mechanics: Dissecting the physical responses ofcells to force. Annu Rev Biomed Eng, 11(1):259–288, 2009.
B. D. Hoffman, G. Massiera, K. M. Van Citters, and J. C. Crocker. The consensus me-chanics of cultured mammalian cells. Proc Natl Acad Sci USA, 103(27):10259–10264,2006.
B. D. Hoffman, G. Massiera, and J. C. Crocker. Fragility and mechanosensing in a ther-malized cytoskeleton model with forced protein unfolding. Phys Rev E, 76(5):051906,2007.
R. D. Hubmayr, S. A. Shore, J. J. Fredberg, E. Planus, J. Panettieri, R. A., W. Moller,J. Heyder, and N. Wang. Pharmacological activation changes stiffness of cultured hu-man airway smooth muscle cells. Am J Physiol Cell Physiol, 271(5):C1660–1668,1996.
D. Humphrey, C. Duggan, D. Saha, D. Smith, and J. Kas. Active fluidization of polymernetworks through molecular motors. Nature, 416(6879):413–416, 2002.
A. Huxley. Muscle structure and theories of contraction. Prog Biophys Biophys Chem, 7:255–318, 1957.
A. F. Huxley and R. Niedergerke. Structural changes in muscle during contraction: Inter-ference microscopy of living muscle fibres. Nature, 173(4412):971–973, 1954.
A. F. Huxley and R. M. Simmons. Proposed mechanism of force generation in striatedmuscle. Nature, 233(5321):533– 538, 1971.
H. Huxley and J. Hanson. Changes in the cross-striations of muscle during contractionand stretch and their structural interpretation. Nature, 173(4412):973–976, 1954.
D. Icard-Arcizet, O. Cardoso, A. Richert, and S. Henon. Cell stiffening in response toexternal stress is correlated to actin recruitment. Biophys J, 94(7):2906–2913, 2008.
D. E. Ingber. Cellular tensegrity: defining new rules of biological design that govern thecytoskeleton. J Cell Sci, 104(3):613–627, 1993.
D. E. Ingber. Tensegrity: the architectural basis of cellular mechanotransduction. Annu
Rev Physiol, 59(1):575–599, 1997.
D. E. Ingber. The architecture of life. Scientific American, 278(1):48–57, 1998.
112 BIBLIOGRAPHY
D. E. Ingber. Tensegrity I. Cell structure and hierarchical systems biology. J Cell Sci, 116(7):1157–1173, 2003.
D. E. Ingber and J. D. Jamieson. Cells as tensegrity structures: architectural regulation ofhistodifferentiation by physical forces transduced over basement membrane. In L. C.Andersson, C. G. Gahmberg, and P. Ekblom, editors, Gene Expression During Normal
D. E. Ingber, J. A. Madri, and J. D. Jamieson. Role of basal lamina in neoplastic disorga-nization of tissue architecture. Proc Natl Acad Sci USA, 78(6):3901–3905, 1981.
D. E. Ingber, S. R. Heidemann, P. Lamoureux, and R. E. Buxbaum. Opposing views ontensegrity as a structural framework for understanding cell mechanics. J Appl Physiol,89(4):1663–1678, 2000.
G. Iribe, C. W. Ward, P. Camelliti, C. Bollensdorff, F. Mason, R. A. Burton, A. Garny,M. K. Morphew, A. Hoenger, W. J. Lederer, and P. Kohl. Axial stretch of rat singleventricular cardiomyocytes causes an acute and transient increase in Ca2+ spark rate.Circ Res, 104(6):787–795, 2009.
A. Jacinto, W. Wood, T. Balayo, M. Turmaine, A. Martinez-Arias, and P. Martin. Dynamicactin-based epithelial adhesion and cell matching during Drosophila dorsal closure.Curr Biol, 10(22):1420–1426, 2000.
J. Jackson. Classical Electrodynamics. John Wiley and Sons, New York, 1975.
P. A. Janmey, U. Euteneuer, P. Traub, and M. Schliwa. Viscoelastic properties of vimentincompared with other filamentous biopolymer networks. J Cell Biol, 113(1):155–160,1991.
O. Jonas, C. T. Mierke, and J. A. Kas. Invasive cancer cell lines exhibit biomechanicalproperties that are distinct from their noninvasive counterparts. Soft Matter, 7(24):11488–11495, 2011.
E. Jonietz. Mechanics: The forces of cancer. Nature, 491(7425):S56–S57, 2012.
S. D. Joshi, M. von Dassow, and L. A. Davidson. Experimental control of excitableembryonic tissues: three stimuli induce rapid epithelial contraction. Exp Cell Res, 316(1):103–114, 2010.
F. Julicher, K. Kruse, J. Prost, and J.-F. Joanny. Active behavior of the cytoskeleton. Phys
Rep, 449(1–3):3–28, 2007.
H. Karaki, H. Ozaki, M. Hori, M. Mitsui-Saito, K.-I. Amano, K.-I. Harada, S. Miyamoto,H. Nakazawa, K.-J. Won, and K. Sato. Calcium movements, distribution, and functionsin smooth muscle. Pharmacol Rev, 49(2):157–230, 1997.
T. R. Kießling, R. Stange, J. A. Kas, and A. W. Fritsch. Thermorheology of living cells –Impact of temperature variations on cell mechanics. submitted to Nat Mat, 2012.
BIBLIOGRAPHY 113
G. H. Koenderink, Z. Dogic, F. Nakamura, P. M. Bendix, F. C. MacKintosh, J. H. Hartwig,T. P. Stossel, and D. A. Weitz. An active biopolymer network controlled by molecularmotors. Proc Natl Acad Sci USA, 106(36):15192–15197, 2009.
P. Kollmannsberger and B. Fabry. Linear and nonlinear rheology of living cells. Annu
Rev Mater Res, 41(1):75–97, 2011.
P. Kollmannsberger, C. T. Mierke, and B. Fabry. Nonlinear viscoelasticity of adherentcells is controlled by cytoskeletal tension. Soft Matter, 7(7):3127–3132, 2011.
L. Kou, D. Labrie, and P. Chylek. Refractive indices of water and ice in the 0.65–2.5 µmspectral range. Appl Opt, 32:3531–3540, 1993.
M. Kovacs, J. Toth, C. Hetenyi, A. Malnasi-Csizmadia, and J. R. Sellers. Mechanism ofblebbistatin inhibition of myosin II. J Biol Chem, 279(34):35557–35563, 2004.
K. Kroy and J. Glaser. The glassy wormlike chain. New J Phys, 9(11):416, 2007.
H. Kuboniwa, N. Tjandra, S. Grzesiek, H. Ren, C. B. Klee, and A. Bax. Solution structureof calcium-free calmodulin. Nat Struct Biol, 2(9):768–776, 1995.
N. Kumar, A. Tomar, A. L. Parrill, and S. Khurana. Functional dissection and molecularcharacterization of calcium-sensitive actin-capping and actin-depolymerizing sites invillin. J Biol Chem, 279(43):45036–45046, 2004.
S. Kumar, I. Z. Maxwell, A. Heisterkamp, T. R. Polte, T. P. Lele, M. Salanga, E. Mazur,and D. E. Ingber. Viscoelastic retraction of single living stress fibers and its impact oncell shape, cytoskeletal organization, and extracellular matrix mechanics. Biophys J,90(10):3762–3773, 2006.
L. Larson, S. Arnaudeau, B. Gibson, W. Li, R. Krause, B. Hao, J. R. Bamburg, D. P. Lew,N. Demaurex, and F. Southwick. Gelsolin mediates calcium-dependent disassembly oflisteria actin tails. Proc Natl Acad Sci USA, 102(6):1921–1926, 2005.
A. W. C. Lau, B. D. Hoffman, A. Davies, J. C. Crocker, and T. C. Lubensky. Microrhe-ology, stress fluctuations, and active behavior of living cells. Phys Rev Lett, 91(19):198101, 2003.
F. Lautenschlager, S. Paschke, S. Schinkinger, A. Bruel, M. Beil, and J. Guck. The regu-latory role of cell mechanics for migration of differentiating myeloid cells. Proc Natl
Acad Sci USA, 106(37):15696–15701, 2009.
C. Leduc, J.-M. Jung, R. R. Carney, F. Stellacci, and B. Lounis. Direct investigation ofintracellular presence of gold nanoparticles via photothermal heterodyne imaging. ACS
Nano, 5(4):2587–2592, 2011.
H. C. Lee and N. Auersperg. Calcium in epithelial cell contraction. J Cell Biol, 85(2):325–336, 1980.
J. Lee, A. Ishihara, G. Oxford, B. Johnson, and K. Jacobson. Regulation of cell movementis mediated by stretch-activated calcium channels. Nature, 400(6742):382–386, 1999.
114 BIBLIOGRAPHY
M. Lekka, P. Laidler, D. Gil, J. Lekki, Z. Stachura, and A. Z. Hrynkiewicz. Elasticity ofnormal and cancerous human bladder cells studied by scanning force microscopy. Eur
Biophys J, 28(4):312, 1999.
L. C.-L. Lin, N. Gov, and F. L. H. Brown. Nonequilibrium membrane fluctuations drivenby active proteins. J Chem Phys, 124(7):074903, 2006.
Y.-C. Lin, G. H. Koenderink, F. C. MacKintosh, and D. A. Weitz. Control of non-linearelasticity in F-actin networks with microtubules. Soft Matter, 7(3):902–906, 2011.
B. Lincoln. The Microfluidic Optical Stretcher. PhD thesis, Universitat Leipzig, 2006.
B. Lincoln, M. Erickson, S. Schinkinger, F. Wottawah, D. Mitchell, S. Ulvick, C. Bilby,and J. Guck. Deformability-based flow cytometry. Cytometry Part A, 59A(2):203–209,2004.
B. Lincoln, S. Schinkinger, K. Travis, F. Wottawah, S. Ebert, F. Sauer, and J. Guck. Re-configurable microfluidic integration of a dual-beam laser trap with biomedical appli-cations. Biomed Microdev, 9(5):703–710, 2007.
J. Liu, G. H. Koenderink, K. E. Kasza, F. C. MacKintosh, and D. A. Weitz. Visualiz-ing the strain field in semiflexible polymer networks: Strain fluctuations and nonlinearrheology of F-actin gels. Phys Rev Lett, 98(19):198304, 2007.
T. B. Liverpool, M. C. Marchetti, J.-F. Joanny, and J. Prost. Mechanical response of activegels. Eur Phys Lett), 85(1):18007, 2009.
C.-M. Lo, H.-B. Wang, M. Dembo, and Y.-L. Wang. Cell movement is guided by therigidity of the substrate. Biophys J, 79(1):144–152, 2000.
C.-M. Lo, D. B. Buxton, G. C. Chua, M. Dembo, R. S. Adelstein, and Y.-L. Wang. Non-muscle myosin IIB is involved in the guidance of fibroblast migration. Mol Biol Cell,15(3):982–989, 2004.
H. Lodish. Molecular Cell Biology. W.H. Freeman and Company, New York, 2000.
Y.-B. Lu, K. Franze, G. Seifert, C. Steinhauser, F. Kirchhoff, H. Wolburg, J. Guck, P. Jan-mey, E.-Q. Wei, J. Kas, and A. Reichenbach. Viscoelastic properties of individual glialcells and neurons in the CNS. Proc Natl Acad Sci USA, 103(47):17759–17764, 2006.
A. I. Lure. Three-dimensional problems of the theory of elasticity. Interscience Publishers,New York, 1964.
F. C. M. M. Sheinman, C. P. Broedersz. Actively stressed marginal networks.arXiv:1206.4152v1, 2012.
F. C. MacKintosh and A. J. Levine. Nonequilibrium mechanics and dynamics of motor-activated gels. Phys Rev Lett, 100(1):018104, 2008.
F. C. MacKintosh, J. Kas, and P. A. Janmey. Elasticity of semiflexible biopolymer net-works. Phys Rev Lett, 75(24):4425–4428, 1995.
BIBLIOGRAPHY 115
M. Madou. Fundamentals of Microfabrication: The Science of Miniaturization. CRCPress, Boca Raton, 2002.
K. Mahn, O. O. Ojo, G. Chadwick, P. I. Aaronson, J. P. T. Ward, and T. H. Lee. Ca2+ home-ostasis and structural and functional remodelling of airway smooth muscle in asthma.Thorax, 65(6):547–552, 2010.
A. Majumdar, B. Suki, N. Rosenblatt, A. M. Alencar, and D. Stamenovic. Power-lawcreep behavior of a semiflexible chain. Phys Rev E, 78(4):041922, 2008.
M. Makishima, Y. Honma, M. Hozumi, K. Sampi, M. Hattori, and K. Motoyoshi. In-duction of differentiation of human leukemia cells by inhibitors of myosin light chainkinase. FEBS Lett, 287(1-2):175–177, 1991.
N. Makris and G. Kampas. Analyticity and causality of the three-parameter rheologicalmodels. Rheol Acta, 48(7):815–825, 2009.
J. M. Maloney, D. Nikova, F. Lautenschlager, E. Clarke, R. Langer, J. Guck, and K. J. V.Vliet. Mesenchymal stem cell mechanics from the attached to the suspended state.Biophys J, 99(8):2479–2487, 2010.
K. K. Mandadapu, S. Govindjee, and M. R. Mofrad. On the cytoskeleton and soft glassyrheology. J Biomech, 41(7):1467–1478, 2008.
A. Maniotis, C. Chen, and D. Ingber. Demonstration of mechanical connections betweenintegrins, cytoskeletal filaments, and nucleoplasm that stabilize nuclear structure. Proc
Natl Acad Sci USA, 94(3):849–854, 1997.
H. B. Mann and D. R. Whitney. On a test of whether one of two random variables isstochastically larger than the other. Ann Math Statist, 18(1):50–60, 1947.
M. C. Marchetti, J.-F. Joanny, S. Ramaswamy, T. B. Liverpool, J. Prost, M. Rao, and R. A.Simha. Soft active matter. arXiv:1207.2929v1, 2012.
A. C. Martin, M. Kaschube, and E. F. Wieschaus. Pulsed contractions of an actin-myosinnetwork drive apical constriction. Nature, 457(7228):495–499, 2009.
J. Maxwell. On the dynamical theory of gases. Philos T Roy Soc, 157(52):49–88, 1867.
N. A. Medeiros, D. T. Burnette, and P. Forscher. Myosin II functions in actin-bundleturnover in neuronal growth cones. Nat Cell Biol, 8(3):216–226, 2006.
D. Meschede. Optics, Light and Lasers: The Practical Approach to Modern Aspects of
Photonics and Laser Physics, chapter 2, pages 46–48. Wiley-VCH Verlag GmbH &Co. KGaA, 2nd edition edition, 2007. ISBN 9783527406289.
O. E. Meyer. Zur Theorie der inneren Reibung. J reine angew Math, 78:130 –135, 1874.
C. T. Mierke, D. Rosel, B. Fabry, and J. Brabek. Contractile forces in tumor cell migration.Eur J Cell Biol, 87(8-9):669–676, 2008.
116 BIBLIOGRAPHY
A. Minta, J. Kao, and R. Tsien. Fluorescent indicators for cytosolic calcium based onrhodamine and fluorescein chromophores. J Biol Chem, 264(14):8171–8178, 1989.
D. Mitrossilis, J. Fouchard, A. Guiroy, N. Desprat, N. Rodriguez, B. Fabry, and A. As-nacios. Single-cell response to stiffness exhibits muscle-like behavior. Proc Natl Acad
Sci USA, 106(43):18243–18248, 2009.
D. Mizuno, C. Tardin, C. F. Schmidt, and F. C. MacKintosh. Nonequilibrium mechanicsof active cytoskeletal networks. Science, 315(5810):370–373, 2007.
A. Mogilner and K. Keren. The shape of motile cells. Curr Biol, 19(17):R762–R771,2009.
A. Mogilner and G. Oster. Force generation by actin polymerization II: The elastic ratchetand tethered filaments. Biophys J, 84(3):1591–1605, 2003.
M. Molodtsov, E. Grishchuk, J. McIntosh, and F. Ataullakhanov. Measurement of theforce developed by disassembling microtubule during calcium-induced depolymeriza-tion. Dokl Biochem Biophys, 412(1):18–21, 2007.
W. M. Morton, K. R. Ayscough, and P. J. McLaughlin. Latrunculin alters the actin-monomer subunit interface to prevent polymerization. Nat Cell Biol, 2(6):376–378,2000.
S. Munevar, Y.-L. Wang, and M. Dembo. Traction force microscopy of migrating normaland H-ras transformed 3T3 fibroblasts. Biophys J, 80(4):1744–1757, 2001.
J. Muniz, P. Mahajan, P. Rellos, O. Fedorov, B. Shrestha, J. Wang, J. Elkins, N. Daga,R. Cocking, A. Chaikuad, T. Krojer, E. Ugochukwu, W. Yue, F. Vondelft, C. Arrow-smith, A. Edwards, J. Weigelt, C. Bountra, O. Gileadi, and S. Knapp. The crystal struc-ture of the human myosin light chain kinase Loc340156. unpublished, Data availableat http://www.rcsb.org/pdb/explore/explore.do?structureId=2X4F.
V. Narayan, S. Ramaswamy, and N. Menon. Long-lived giant number fluctuations in aswarming granular nematic. Science, 317(5834):105–108, 2007.
E. Neher. The use of fura-2 for estimating calcium buffers and calcium fluxes. Neurophar-
macology, 34(11):1423–1442, 1995.
E. Neher and T. Sakaba. Multiple roles of calcium ions in the regulation of neurotrans-mitter release. Neuron, 59(6):861–872, 2008.
B. Nilius, G. Owsianik, T. Voets, and J. A. Peters. Transient receptor potential cationchannels in disease. Physiol Rev, 87(1):165–217, 2007.
K. D. Nnetu, T. R. Kießling, R. Stange, and J. Kas. The contribution of sub-cellularnetworks to stretch is shear rate dependent. in preparation.
A. E. Palmer and R. Y. Tsien. Measuring calcium signaling using genetically targetablefluorescent indicators. Nat Protocols, 1(3):1057–1065, 2006.
BIBLIOGRAPHY 117
R. M. Paredes, J. C. Etzler, L. T. Watts, W. Zheng, and J. D. Lechleiter. Chemical calciumindicators. Methods, 46(3):143–151, 2008.
C.-K. Park, M. S. Kim, Z. Fang, H. Y. Li, S. J. Jung, S.-Y. Choi, S. J. Lee, K. Park,J. S. Kim, and S. B. Oh. Functional expression of thermo-transient receptor potentialchannels in dental primary afferent neurons. J Biol Chem, 281(25):17304–17311, 2006.
S. W. Park and R. A. Schapery. Methods of interconversion between linear viscoelasticmaterial functions. Part I–a numerical method based on Prony series. Int J Solids Struct,36(11):1653–1675, 1999.
J. K. Parrish and L. Edelstein-Keshet. Complexity, pattern, and evolutionary trade-offs inanimal aggregation. Science, 284(5411):99–101, 1999.
R. J. Pelham and Y.-L. Wang. High resolution detection of mechanical forces exerted bylocomoting fibroblasts on the substrate. Mol Biol Cell, 10(4):935–945, 1999.
C. M. Pfarr, M. Coue, P. M. Grissom, T. S. Hays, M. E. Porter, and J. R. McIntosh.Cytoplasmic dynein is localized to kinetochores during mitosis. Nature, 345(6272):263–265, 1990.
P. Pierobon, S. Achouri, S. Courty, A. R. Dunn, J. A. Spudich, M. Dahan, and G. Cappello.Velocity, processivity, and individual steps of single myosin V molecules in live cells.Biophys J, 96(10):4268–4275, 2009.
T. D. Pollard and W. C. Earnshow. Cell Biology. Elsevier Science, 1st edition, 2002.ISBN 0-7216-3997-6.
W.-J. Rappel, A. Nicol, A. Sarkissian, H. Levine, and W. F. Loomis. Self-organized vortexstate in two-dimensional Dictyostelium dynamics. Phys Rev Lett, 83(6):1247–1250,1999.
A. J. Ridley, M. A. Schwartz, K. Burridge, R. A. Firtel, M. H. Ginsberg, G. Borisy, J. T.Parsons, and A. R. Horwitz. Cell migration: Integrating signals from front to back.Science, 302(5651):1704–1709, 2003.
M. Rief, J. Pascual, M. Saraste, and H. E. Gaub. Single molecule force spectroscopy ofspectrin repeats: low unfolding forces in helix bundles. J Mol Biol, 286(2):553–561,1999.
N. Rosenblatt, A. M. Alencar, A. Majumdar, B. Suki, and D. Stamenovic. Dynamics ofprestressed semiflexible polymer chains as a model of cell rheology. Phys Rev Lett, 97(16):168101, 2006.
E. Sackmann and R. Merkel. Lehrbuch der Biophysik. Wiley-VCH Verlag, Weinheim,2010. ISBN 978-3-527-40535-0.
E. D. Salmon and R. R. Segall. Calcium-labile mitotic spindles isolated from sea urchineggs (Lytechinus variegatus). J Cell Biol, 86(2):355–365, 1980.
118 BIBLIOGRAPHY
K. M. Sanders. Invited review: Mechanisms of calcium handling in smooth muscles.J Appl Physiol, 91(3):1438–1449, 2001.
M. J. Sanderson and E. R. Dirksen. Mechanosensitivity of cultured ciliated cells from themammalian respiratory tract: implications for the regulation of mucociliary transport.Proc Natl Acad Sci USA, 83(19):7302–7306, 1986.
M. J. Sanderson, A. C. Charles, and E. R. Dirksen. Mechanical stimulation and intercel-lular communication increases intracellular Ca2+ in epithelial cells. Cell Regul, 1(8):585–596, 1990.
Y. Saoudi, B. Rousseau, J. Doussiere, S. Charrasse, C. Gauthier-Rouviere, N. Morin,C. Sautet-Laugier, E. Denarier, R. Scaıfe, C. Mioskowski, and D. Job. Calcium-independent cytoskeleton disassembly induced by BAPTA. Eur J Biochem, 271(15):3255–3264, 2004.
J. R. Savidge, S. P. Ranasinghe, and H. P. Rang. Comparison of intracellular calciumsignals evoked by heat and capsaicin in cultured rat dorsal root ganglion neurons and ina cell line expressing the rat vanilloid receptor, VR1. Neuroscience, 102(1):177–184,2001.
H. Schmidt, K. M. Stiefel, P. Racay, B. Schwaller, and J. Eilers. Mutational analysisof dendritic Ca2+ kinetics in rodent purkinje cells: role of parvalbumin and calbindinD28k. J Physiol, 551(1):13–32, 2003.
B. Schnurr, F. Gittes, F. C. MacKintosh, and C. F. Schmidt. Determining microscopicviscoelasticity in flexible and semiflexible polymer networks from thermal fluctuations.Macromolecules, 30(25):7781–7792, 1997.
I. Schwaiger, A. Kardinal, M. Schleicher, A. A. Noegel, and M. Rief. A mechanicalunfolding intermediate in an actin-crosslinking protein. Nat Struct Mol Biol, 11(1):81–85, 2004.
F. R. Schwarzl and L. C. E. Struik. Analysis of relaxation measurements. Adv Mol Relax
Pr, 1(3):201–255, 1968.
C. Semmrich, T. Storz, J. Glaser, R. Merkel, A. R. Bausch, and K. Kroy. Glass transitionand rheological redundancy in F-actin solutions. Proc Natl Acad Sci USA, 104(51):20199–20203, 2007.
K. Snelson. Snelson on the tensegrity invention. Int J Space Struct, 11:43–48, 1996.
A. Sokolov, I. S. Aranson, J. O. Kessler, and R. E. Goldstein. Concentration dependenceof the collective dynamics of swimming bacteria. Phys Rev Lett, 98(15):158102, 2007.
A. P. Somlyo and A. V. Somlyo. Ca2+ sensitivity of smooth muscle and nonmuscle myosinII: Modulated by G proteins, kinases, and myosin phosphatase. Physiol Rev, 83(4):1325–1358, 2003.
BIBLIOGRAPHY 119
M. St. Pierre, P. Reeh, and K. Zimmermann. Differential effects of TRPV channel blockon polymodal activation of rat cutaneous nociceptors in vitro. Exp Brain Res, 196(1):31–44, 2009.
D. Stamenovic. Rheological behavior of mammalian cells. Cell Mol Life Sci, 65(22):3592–3605, 2008.
D. Stamenovic and M. F. Coughlin. The role of prestress and architecture of the cy-toskeleton and deformability of cytoskeletal filaments in mechanics of adherent cells:A quantitative analysis. J Theor Biol, 201(1):63–74, 1999.
D. Stamenovic, J. Fredberg, N. Wang, J. Butler, and D. Ingber. A microstructural approachto cytoskeletal mechanics based on tensegrity. J Theor Biol, 181(2):125–136, 1996.
D. Stamenovic, B. Suki, B. Fabry, N. Wang, J. J. Fredberg, and J. E. Buy. Rheology ofairway smooth muscle cells is associated with cytoskeletal contractile stress. J Appl
Physiol, 96(5):1600–1605, 2004.
D. Stamenovic, N. Rosenblatt, M. Montoya-Zavala, B. D. Matthews, S. Hu, B. Suki,N. Wang, and D. E. Ingber. Rheological behavior of living cells is timescale-dependent.Biophys J, 93(8):L39–L41, 2007.
R. Stange, T. Kießling, A. Fritsch, and J. Kas. Automated optical stretching of suspendedcells for biomechanical characterization in a statistical way. in preparation.
M. Studer and P. A. McNaughton. Modulation of single-channel properties of TRPV1 byphosphorylation. J Physiol, 588(19):3743–3756, 2010.
S. X. Sun, S. Walcott, and C. W. Wolgemuth. Cytoskeletal cross-linking and bundling inmotor-independent contraction. Curr Biol, 20(15):R649–R654, 2010.
D. P. Syamaladevi, J. A. Spudich, and R. Sowdhamini. Structural and functional insightson the myosin superfamily. Bioinform Biol Insights, 6(3034), 2012.
M. Tamada, T. D. Perez, W. J. Nelson, and M. P. Sheetz. Two distinct modes of myosinassembly and dynamics during epithelial wound closure. J Cell Biol, 176(1):27–33,2007.
K. M. Taute, F. Pampaloni, E. Frey, and E.-L. Florin. Microtubule dynamics depart fromthe wormlike chain model. Phys Rev Lett, 100(2):028102, 2008.
K. M. Taute, F. Pampaloni, and E.-L. Florin. Chapter 30 – Extracting the mechanicalproperties of microtubules from thermal fluctuation measurements on an attached tracerparticle. In L. Wilson and J. J. Correia, editors, Microtubules, in vitro, volume 95 ofMethods in Cell Biology, pages 601–615. Academic Press, 2010.
O. Thoumine and A. Ott. Time scale dependent viscoelastic and contractile regimes infibroblasts probed by microplate manipulation. J Cell Sci, 110(17):2109–2116, 1997.
120 BIBLIOGRAPHY
M. Tominaga, M. J. Caterina, A. B. Malmberg, T. A. Rosen, H. Gilbert, K. Skinner,B. E. Raumann, A. I. Basbaum, and D. Julius. The cloned capsaicin receptor integratesmultiple pain-producing stimuli. Neuron, 21(3):531–543, 1998.
J. Toner, Y. Tu, and S. Ramaswamy. Hydrodynamics and phases of flocks. Ann Phys-New
York, 318(1):170–244, 2005.
K. Torres and S. B. Horwitz. Mechanisms of taxol-induced cell death are concentrationdependent. Cancer Res, 58(16):3620–3626, 1998.
G. Totsukawa, Y. Yamakita, S. Yamashiro, D. J. Hartshorne, Y. Sasaki, and F. Matsumura.Distinct roles of ROCK (rho-kinase) and MLCK in spatial regulation of MLC phos-phorylation for assembly of stress fibers and focal adhesions in 3T3 fibroblasts. J Cell
Biol, 150(4):797–806, 2000.
N. W. Tschoegl. The Phenomenological Theory of Linear Viscoelastic Behavior.Springer-Verlag, New York, 1989.
R. Y. Tsien. New calcium indicators and buffers with high selectivity against magnesiumand protons: design, synthesis, and properties of prototype structures. Biochemistry, 19(11):2396–2404, 1980.
R. Y. Tsien. A non-disruptive technique for loading calcium buffers and indicators intocells. Nature, 290(5806):527–528, 1981.
R. Y. Tsien, T. Pozzan, and T. J. Rink. Calcium homeostasis in intact lymphocytes: cyto-plasmic free calcium monitored with a new, intracellularly trapped fluorescent indica-tor. J Cell Biol, 94(2):325–334, 1982.
H. Turner, A. Fleig, A. Stokes, J.-P. Kinet, and R. Penner. Discrimination of intracellu-lar calcium store subcompartments using TRPV1 (transient receptor potential channel,vanilloid subfamily member 1) release channel activity. Biochem J, 371(2):341–350,2003.
R. J. Vasquez, B. Howell, A. M. Yvon, P. Wadsworth, and L. Cassimeris. Nanomolarconcentrations of nocodazole alter microtubule dynamic instability in vivo and in vitro.Mol Biol Cell, 8(6):973–85, 1997.
M. Vicente-Manzanares, X. Ma, R. S. Adelstein, and A. R. Horwitz. Non-muscle myosinII takes centre stage in cell adhesion and migration. Nat Rev Mol Cell Biol, 10(11):778–790, 2009.
T. Vicsek, A. Czirok, E. Ben-Jacob, I. Cohen, and O. Shochet. Novel type of phasetransition in a system of self-driven particles. Phys Rev Lett, 75(6):1226–1229, 1995.
W. Voigt. Uber innere Reibung fester Korper insbesondere der Metalle. Ann. d. Phys., 47(671), 1892.
B. Wagner, R. Tharmann, I. Haase, M. Fischer, and A. R. Bausch. Cytoskeletal polymernetworks: the molecular structure of cross-linkers determines macroscopic properties.Proc Natl Acad Sci USA, 103(38):13974–13978, 2006.
BIBLIOGRAPHY 121
O. I. Wagner, S. Rammensee, N. Korde, Q. Wen, J.-F. Leterrier, and P. A. Janmey. Soft-ness, strength and self-repair in intermediate filament networks. Exp Cell Res, 313(10):2228–2235, 2007.
T. Wakatsuki, B. Schwab, N. Thompson, and E. Elson. Effects of cytochalasin D andlatrunculin B on mechanical properties of cells. J Cell Sci, 114(5):1025–1036, 2001.
T. P. Walsh, A. Weber, K. Davis, E. Bonder, and M. Mooseker. Calcium dependence ofvillin-induced actin depolymerization. Biochemistry, 23(25):6099–6102, 1984.
H.-B. Wang, M. Dembo, S. K. Hanks, and Y.-l. Wang. Focal adhesion kinase is involved inmechanosensing during fibroblast migration. Proc Natl Acad Sci USA, 98(20):11295–11300, 2001a.
N. Wang, J. Butler, and D. Ingber. Mechanotransduction across the cell surface andthrough the cytoskeleton. Science, 260(5111):1124–1127, 1993.
N. Wang, K. Naruse, D. Stamenovic, J. J. Fredberg, S. M. Mijailovich, I. M. Tolic-Nørrelykke, T. Polte, R. Mannix, and D. E. Ingber. Mechanical behavior in living cellsconsistent with the tensegrity model. Proc Natl Acad Sci USA, 98(14):7765–7770,2001b.
C. Wei, X. Wang, M. Chen, K. Ouyang, L.-S. Song, and H. Cheng. Calcium flickers steercell migration. Nature, 457(7231):901–905, 2009.
F. Wetzel, S. Ronicke, K. Muller, M. Gyger, D. Rose, M. Zink, and J. Kas. Single cellviability and impact of heating by laser absorption. Eur Biophys J, 40(9):1109–1114,2011.
F. Wetzel, A. Fritsch, S. Pawlizak, T. R. Kießling, R. Stange, L.-C. Horn, K. Bendrat,M. Oktay, A. Niendorf, M. Hockel, J. Condeelis, M. Zink, and J. A. Kas. Cellular,biomechanical changes in patients with mamma and cervix carcinoma. in preparation.
M. Whitaker. Calcium at fertilization and in early development. Physiol Rev, 86(1):25–88, 2006.
M. L. Woodruff, A. P. Sampath, H. R. Matthews, N. V. Krasnoperova, J. Lem, and G. L.Fain. Measurement of cytoplasmic calcium concentration in the rods of wild-type andtransducin knock-out mice. J Physiol, 542(3):843–854, 2002.
F. Wottawah, S. Schinkinger, B. Lincoln, R. Ananthakrishnan, M. Romeyke, J. Guck, andJ. Kas. Optical rheology of biological cells. Phys Rev Lett, 94(9):098103, 2005a.
F. Wottawah, S. Schinkinger, B. Lincoln, S. Ebert, K. Muller, F. Sauer, K. Travis, andJ. Guck. Characterizing single suspended cells by optorheology. Acta Biomater, 1(3):263–271, 2005b.
S. Wray. Insights into the uterus. Exp Physiol, 92(4):621–631, 2007.
R. B. Wysolmerski and D. Lagunoff. Involvement of myosin light-chain kinase in en-dothelial cell retraction. Proc Natl Acad Sci USA, 87(1):16–20, 1990.
122 BIBLIOGRAPHY
F. Xu, J. A. Lock, G. Gouesbet, and C. Tropea. Optical stress on the surface of a particle:homogeneous sphere. Phys Rev A, 79(5):053808, 2009.
J. Xu, Y. Tseng, and D. Wirtz. Strain hardening of actin filament networks. J Biol Chem,275(46):35886–35892, 2000.
S. Yamada, D. Wirtz, and S. C. Kuo. Mechanics of living cells measured by laser trackingmicrorheology. Biophys J, 78(4):1736–1747, 2000.
X. Yang and F. Sachs. Block of stretch-activated ion channels in Xenopus oocytes bygadolinium and calcium ions. Science, 243(4894):1068–1071, 1989.
J. Yao, B. Liu, and F. Qin. Kinetic and energetic analysis of thermally activated TRPV1channels. Biophys J, 99(6):1743–1753, 2010.
T. Yeung, P. C. Georges, L. A. Flanagan, B. Marg, M. Ortiz, M. Funaki, N. Zahir,W. Ming, V. Weaver, and P. A. Janmey. Effects of substrate stiffness on cell mor-phology, cytoskeletal structure, and adhesion. Cell Motil Cytoskel, 60(1):24–34, 2005.
R. V. Zackroff and R. D. Goldman. In vitro assembly of intermediate filaments from babyhamster kidney BHK-21 cells. Proc Natl Acad Sci USA, 76(12):6226–6230, 1979.
H. P. Zhang, A. Be’er, E.-L. Florin, and H. L. Swinney. Collective motion and densityfluctuations in bacterial colonies. Proc Natl Acad Sci USA, 107(31):13626–13630,2010.
Curriculum Vitae
Name Markus Gyger
Geburtstag 29.09.1980
Geburtsort Oldenburg (Oldb)
Promotion
11/2007 - 12/2012 Mitglied der Graduiertenschule”BuildMoNa“ der
Universitat Leipzig
seit 02/2007 Promotion am Lehrstuhl fur Experimentelle Physik I ander Fakultat fur Physik und Geowissenschaften derUniversitat Leipzig
Studium
10/2006 Master of ScienceThema der Masterarbeit:
”Pair Interaction Potential and
Brownian Motion in Confined Colloidal Systems“
01/2004 - 03/2005 Auslandsjahr an der Universidad Autonoma de San LuisPotosı (Mexiko)
08/2003 Vordiplom der Physik
07/2002 - 10/2006 Stipendium der Friedrich-Ebert-Stiftung
10/2001 - 10/2006 Studium der Physik im Internationalen Studiengang
”International Physics Study Program“ der Universitat
Leipzig.
Schulbildung
06/2000 Abitur
08/1987 - 06/2000 Altes Gymnasium Oldenburg
08/1991 - 07/1993 Orientierungsstufe OS Osternburg, Oldenburg