Page 1
Activity Based Performance Management –
state-of-the-art and not time driven
Author: Feras Alsamawi
Thesis submitted for the degree of
Master of Science in Finance and International Business
Academic advisor: Matthew Haigh
Department of Business Studies
Aarhus School of Business, University of Aarhus
October 2010
Page 2
Content
ABSTRACT ........................................................................................................ 2
1 INTRODUCTION ............................................................................................. 2
2 ABC/M AND TD-ABC IN THE LITERATURE .................................................. 6
2.1 TD-ABC as a consequence of the ABC-paradox? ........................................ 6
2.2 Trends: ABC/M and the appearance of TD-ABC ........................................ 10
3 METHODOLOGY .......................................................................................... 15
4 CASE STUDY: ABC/M IMPLEMENTATION AT AN AIR FREIGHT
LOGISTICS COMPANY ................................................................................... 18
5 COMPARISON BETWEEN TD-ABC AND ABC/M ........................................ 20
5.1 Concept of ABC/M ...................................................................................... 20
5.2 The concept of TD-ABC ............................................................................. 23
5.3 Data gathering through interviews .............................................................. 26
5.4 Costing accuracy: sources of errors ........................................................... 29
5.5 Cost of excess capacity .............................................................................. 32
5.6 Time vs. multi-metric approach .................................................................. 36
5.7 Complexity of processes and activities ....................................................... 37
5.8 Data loading, processing and reporting ...................................................... 45
6 ABC/M IN THE FRAME OF PERFORMANCE MANAGEMENT ................... 53
7 CONCLUSIONS ............................................................................................ 58
REFERENCES ................................................................................................. 61
APPENDIX ....................................................................................................... 67
Page 3
Abstract 2
Abstract
In this paper we examine which costing method -Activity Based Costing
/Management (ABC/M) or Time-Driven Activity Based Costing (TD-ABC) - fits
best in the frame of Performance Management. A literature review on both
costing methods and qualitative observations from a case study, where ABC/M
was implemented in a German logistics company, provide the basis for our
research. TD-ABC comes along with a variety of alleged improvements
compared to existing ABC/M, which is assumed to struggle with conceptual
problems and low diffusion rates (ABC-paradox). We find that TD-ABC is only
appropriate for simple company models, because of its limited expressiveness
and accuracy. Our findings show shortcomings connected to the concept of TD-
ABC concerning data gathering and the myopic view on time to reflect all
business activities. Furthermore there is significant evidence that a part of the
academic world missed to capture ABC/M in its state-of-the-art; for them it still
exist in the conceived version from the mid-80‟s. ABC/M provides all features
necessary to function within the frame of Performance Management. We
develop a framework which is based on ABC/M and name this Activity Based
Performance Management (ABPM). We show how ABPM supports to align
operational and financial decisions to a company‟s strategy.
1 Introduction
This research analyses which of two costing methods is most appropriate for
Performance Management (PM), Activity Based Costing/ Management (ABC/M)
or Time-Driven Activity Based Costing (TD-ABC). The question is discussed
through a literature review and findings from a case study in the German
logistics industry.
PM is a strategic concern for management of profit or non-profit organizations.
Since the 90‟s PM has exerted considerable influence on the actions of today‟s
companies, it is
“…evolving at a considerable rate to combat new organizational realities; owing to the
fight for industrial supremacy, the concept of performance, as it is measured and
Page 4
1 Introduction 3
evaluated, is undergoing a transformation in modern business organizations” (Folan &
Browne, 2005, p.664).
Between the many different ways on how „performance‟ can be defined and
measured activity-based costing approach represents an evolution. This is due
to its view of the organization which “defines it as a network or processes or
activities” (Lebas, 1995, p.29). ABC (later ABC/M) was developed over 20 years
ago and is considered by academics and practitioners as the most “important
innovation in management accounting of the twentieth century” (Gosselin,
2007). It has been continually improved with support of Information Technology
(IT) and has proven itself as a powerful cause-based costing method.
Although Kaplan (Cooper & Kaplan 1988) is considered as one of the founding
fathers of the “original ABC” in the 1980‟s, in 2003 he started redesigning this
method which led to TD-ABC (Kaplan 2003, 2004 & 2007). He argues that
ABC/M does not capture the complexity of a company‟s operations, it is too
complex and time-intensive to implement and hence a too cost-intensive
investment. In contrast he claims that TD-ABC reveals excess capacity,
processes faster, provides high accuracy and can be well supplied from existing
IT-systems, such as ERP. Kaplan derives his assumptions on the
disadvantages of ABC/M from his experience and feedback from practitioners.
Other Academics outline reasons why ABC/M implementations have been
avoided, abandoned or not adopted, in spite of the proposed benefits, the so
called ABC-paradox (Gosselin, 2007). Demeere et al. (2009) and Wegmann
(2007) present TD-ABC as an improved activity-based costing method
compared to ABC/M. Other authors point out that TD-ABC brings conceptual
shortcomings connected to the use of time estimates (Cardinaels & Labro,
2007). Gosselin (2007, p.649) concluded that TD-ABC is the most recent
development in the field of activity-based costing methods, but “does not solve
the conceptual problems inherent to ABC”.
We compare TD-ABC and existing ABC/M on the basis of a literature review.
Additionally we reflect on qualitative observations from a case study where
ABC/M was implemented in a German logistics company.
Page 5
1 Introduction 4
In contrast to prior research, Kaplan‟s (2003, 2004 & 2007) and other TD-ABC
favouring papers are critically examined and the alleged novelties are called
into question. This is conducted by questioning whether:
1. the critics and conceptual problems Kaplan and other academics stated on
ABC/M are justified and
2. TD-ABC can be considered as an “evolved ABC/M” where those challenges
have been mastered, especially through supposedly innovative time
estimates and capacity cost rates.
We outline, using different examples that a state-of-the-art ABC/M model does
not show the problems which are perceived by Kaplan and other academics.
We also find that there are new conceptual problems introduced by TD-ABC, in
particular by focussing only on the utilization of time estimates. Our results
show that TD-ABC cannot be considered as and evolved ABC/M. Furthermore
we find that TD-ABC has very limited expressiveness on excess capacity and
vague accuracy. Therefore it should only be used for simple setups with
homogeneous activities which can be reasonably reflected through duration
drivers.
Finally a framework for PM containing a state-of-the-art ABC/M model is
developed. We outline an exemplary architecture which is applicable for most of
today‟s companies. ABC/M provides the basis to compare measured
performance with constrained objectives from PM. Hence it supports to align
financial and operational decisions to a company‟s strategy. We call this
framework Activity Based Performance Management (ABPM).
Structure of this paper
For this paper we imagine the following fictitious case: In order to receive better
insight of his company‟s cost structures, a CFO is preparing for an ABC/M
project. The model shall be integrated within the company‟s new frame of the
PM. The CFO is refreshing his knowledge on ABC/M reviewing the latest
academic papers and case studies, including our mentioned case study. For
several times he is now confronted with the term “Time-driven Activity Based
Costing” questioning himself:
Page 6
1 Introduction 5
1. what characterizes this activity-based costing method?
2. whether it is more sophisticated than ABC/M?
3. what needs to be considered for a successful implementation of the
favoured method?
On the basis of his findings, he needs to decide which costing method is more
suitable for the upcoming project.
Approaching our problem through a fictitious narrative is a method adapted from
business and accounting education. Hill and Stewart (1999) and Vitz (1999)
underline that narratives, real or fictitious are a “valuable part of higher
education” (Vitz, 1999, p.185) and, as we find, also well suited to introduce our
approach1.
This paper is structured in relation to the content of our fictitious case:
Chapter 2: ABC/M and TD-ABC in the literature
We investigate how contextual and behavioural factors are associated with
the ABC-paradox and whether TD-ABC is a result of it. TD-ABC is supposed
to have an improved concept; we ask whether it has become a trend.
Chapter 3 : Methodology
The qualitative observation methodology of the research is outlined.
Chapter 4: Case study
We present the key facts of our case study with focus on the implemented
ABC/M model.
Chapter 5: Comparison between TD-ABC and ABC/M
We compare TD-ABC and ABC/M, based on the criticism Kaplan stated
towards ABC/M. The results from our literature review and observations from
our case study are confronted with Kaplan‟s statements.
Chapter 6: ABC/M in the frame of Performance Management
ABC/M shall be integrated in the framework of PM. We describe an
exemplary case how ABC/M interacts with PM and facilitates decisions which
1 Please note that this fictitious CFO case is not in connection to the (real) case study we will
refer to
Page 7
2 ABC/M and TD-ABC in the literature 6
are aligned to a company‟s strategy. Based on this we outline the
components of our framework, which we name ABPM.
Chapter 7: Conclusions
From the perspective of our fictitious CFO we interpret the results in
reference to literature and our research questions.
2 ABC/M and TD-ABC in the literature
The ABC framework was introduced by Cooper and Kaplan (1988, p.97) as a
“tool of corporate strategy” where especially manufacturing companies could
generate a competitive advantage from insights on product costs which are
“radically different from data generated by traditional systems” (Cooper &
Kaplan, 1988, p.100). Against the background of growing overhead costs, ABC
evolved in the 1990s from a process-cost allocation method or „„costing
technique‟‟ to a „„management philosophy‟‟ (Jones & Dugdale, 2002) and
therefore was named Activity-based Management (ABM). Practitioners and
academics realized that providing financial (and non-financial) information on
activities and costs lead to new insights and management implications. Since
we do not want to contribute to the discussion on differences between ABC and
ABM, this paper uses the label ABC/M according to Foster and Swenson
(1997). ABC/M considers the existing overlap between the mentioned terms.
2.1 TD-ABC as a consequence of the ABC-paradox?
After 1995, practitioners and academics noticed difficulties connected with
implementations of ABC/M. Some organizations abandoned ABC/M projects
(Kaplan & Anderson, 2004; Innes et al., 2000; Gosselin, 1997).
Gosselin (1997) provides explanations on contextual factors that influenced the
diffusion of ABC. Surveys point to the fact that the majority of firms have not
implemented ABC/M (Kennedy & Affleck-Graves, 2001), in spite of the benefits
proposed by academics and management accountants. This phenomenon is
called „ABC-paradox‟. Gosselin (1997) approaches the ABC-paradox by
defining levels in which ABC has been implemented or adopted and associates
them to organizational determinants. His findings are that ABC diffusion and
Page 8
2 ABC/M and TD-ABC in the literature 7
levels of adoption are determined by structure, centralization, formalization and
(vertical) differentiation of an organization. The results indicate that
„prospectors‟, highly vertically differentiated and mechanistic organizations are
more likely to adopt ABC. Prospectors are characterized by high R&D
investments and their dynamism in seeking market opportunities. Highly
vertically differentiated organizations show a high depth of structure, reflected
by the number of hierarchical levels below the chief executive. Mechanistic
organizations are those who facilitate the adoption and the implementation of
administrative innovations.
Research on ABC diffusion provides results concerning other contextual factors.
Nicholson (1993) and Cobb et al. (1992) surveyed companies asking why
organizations were not planning to adopt ABC or why they had rejected ABC.
Their findings can be summarized in the following statements:
Products or services were not the types that would benefit from ABC
Information technology inadequacy and non-value-added activities
Difficulties in linking cost drivers to individual products
Amount of work involved in comparison to the benefits resulting from ABC
Difficulty of collecting quantitative information on cost drivers
Adjacent research fields, such as Accounting Behavioural Research also
contribute to explain the ABC-paradox. Argyris and Kaplan (1994) for instance,
describe situations in which individuals tend to block an ABC implementation.
The authors argue that ABC systems have the potential to reveal and generate
information which can be embarrassing or even threatening to managers. Since
(indirect) costs are allocated, the profitability structure of products and divisions
can be affected. Hence adaption and support can be related to the effect
ABC/M has on the profit of divisions.
In his most recent papers on ABC/M, Kaplan (2004 & 2007) does not directly
refer to contextual or behavioural factors that could be associated with the
implementation or adoption of ABC/M. Yet Kaplan recognizes that there is an
„ABC-paradox‟ (2007), since for him there is a contradiction between the
advantages ABC/M offers and the diffusion rate:
Page 9
2 ABC/M and TD-ABC in the literature 8
“...ABC was not universally accepted. In an annual survey of the adoption of
management tools, ABC ranked below the median, with only a 50 percent adoption
rate. For a system that gives companies insights into the cost and profitability of
products, processes, services, and customers - insights not other-wise available - the
low adoption rate seemed surprising.” (Kaplan, 2007, p.5)
But for Kaplan (2007) the „ABC-paradox‟ is caused by conceptual factors,
meaning those which are inherent to the existing ABC concept:
“Many companies, because of the time-consuming surveying and data-processing
costs of ABC systems, either abandoned ABC entirely or ceased updating their system,
which left them with out-of-date and highly inaccurate estimates of process, product,
and customer costs.” (Kaplan, 2007, p.3)
Other academics followed Kaplan in their conclusion on ABC/M. Everaert and
Bruggeman (2006) created an instructional case to support Accounting
Education on differences between ABC and TD-ABC. As “one of the first
teaching cased on TDABC” (Everaert & Bruggeman, 2006, p.153) the learning
objective was to help students understand the differences between traditional
ABC and TD-ABC. However the authors show a certain degree of
dissatisfaction with ABC, since their learning objectives include that “students
quickly find that the simple ABC model does not provide the information
required by the CEO, while the complex ABC model would be very challenging
to implement” (Everaert & Bruggeman, 2006, p.128). The table below contains
literature were comparisons between TD-ABC and ABC/M in favour of TD-ABC
have been provided. The assumptions which led the following authors to their
critical position towards ABC/M will be discussed in chapter 5 “Comparison
between TD-ABC and ABC/M”.
Page 10
2 ABC/M and TD-ABC in the literature 9
Author(s)/
(Type of literature)
Source
Judgements on ABC/M
Everaert et al. (2006)
(Instructional case for
Accounting Education)
Author‟s experience with
ABC,
Kaplan & Anderson (2004)
Students must learn
difficulties in the ABC/M
model
Everaert et al. (2008)
(Teaching and
educational note)
Author‟s experience with
ABC,
Kaplan & Anderson (2004)
High cost for
implementation and
updating
Barrett (2005)
(Academic article)
Feedback from ABC
practitioners
Inability to uncover
excess capacity
Demeere et al. (2009)
(Case study)
Kaplan & Anderson (2004
& 2007)
high cost of updating
inaccurate estimates
of process, product, and
customer costs
not easy to implement
(on the large scale)
Coners (2007)
(Formalisation of TD-
ABC)
Kaplan & Anderson (2004) TD-ABC is an advanced
ABC/M with new
instruments2
Wegmann (2007)
(Case study)
Anderson & Young (1999)
Datar & Gupta (1994)
Foster & Swenson (1997)
Malmi (1997)
Kaplan & Anderson (2007)
ABC too complex to
implement (hard to
adjust, time consuming
& expensive)
TD-ABC is a
simplification of ABC/M
Table 1. TD-ABC supporters in literature
Although most of the listed authors refer to Kaplan‟s papers as a source for
criticism on ABC/M, they do not share every point of criticism Kaplan (2003,
2005, 2007) has stated. However, there are only a few papers which go beyond
mere recognizing of TD-ABC and ABC/M. Academics who state critical ideas
2 Translated from German
Page 11
2 ABC/M and TD-ABC in the literature 10
towards TD-ABC are Cleland (2004), Gosselin (2007). Barret (2005) and
Cardinaels and Labro (2007). While Cleland compares to another approach
labelled „„contribution-based approach CBA”, Gosselin (2007) does not accept
TD-ABC as an evolved version of ABC and an answer to the ABC-paradox
stating that
“this supposedly new approach does not solve the conceptual problems inherent to
ABC such as: fixed costs considered variable, idle capacity costs, and the design and
maintenance of the ABC model” (Gosselin, 2007, p.649).
Barret‟s (2005) findings justify the existence of TD-ABC as an equal alternative
to ABC/M, but question the single-metric approach of time as the basis for every
driver rate within a model. Cardinaels and Labro (2007) claim, based on their
empirical investigations, that time estimates, which are required for the model
setups, are prone to error and not helpful for determining excess capacity.
Besides the comparison of TD-ABC and ABC/M, this paper shows that
assumptions towards existing ABC/M need to be reconsidered. The diffused
perception of today‟s ABC/M is identified as a possible reason for the ABC-
paradox and the emergence of TD-ABC. In this sense this paper extends
current research.
2.2 Trends: ABC/M and the appearance of TD-ABC
Besides the company related analysis on diffusion of ABC/M through surveys
and literature research Gosselin (2007) also conducted a trend analysis. For
this he empirically observed the academic focus on first ABC from 1988 until
2004 and then second on ABM from 1991 until 2005 by capturing the number of
published papers in the Proquest ABI/Inform Global database. For the latter and
more recent analysis, the published ABM papers, a peak in number of
published paper could be observed in the years between 1995 and 2000 as
shown in the following graphic.
Page 12
2 ABC/M and TD-ABC in the literature 11
Figure 1. Number of articles on ABM (1991-2004), source: Gosselin (2007)
This chapter is dedicated to the question of what trends can be drawn when we
observe academic papers published on ABC/M and TD-ABC based on the
method Gosselin (2007) has conducted. For our observation we have utilized
the Online Academic Databases (OAD) ISI Web of Science3 (WoS) by
Thomson Reuters and Google Scholar4 (GS). WoS is the biggest bibliographic
and citation index based on the former Institute for Scientific Information
containing around 12,000 international journals, which are exclusively scientific
(Mayr, 2009). Although Mayr indicates that results in GS are not purely
scientific, still GS covers besides free accessible sources mostly scientific
papers obtained through co operations with publishers like Blackwell, Nature
Publishing Group and Springer. Since its launch in 2004 the amount of qualified
scholarly content has increased significantly (Mikki, 2009). Mikki analysed
differences between the WoS and GS database coming to the result that,
“it will be wise to apply different services, WoS for its guaranteed proofed scientific
content and controlled citation data, and Google Scholar for its wider collection
including books and proceedings.”(Mikki, 2009, p.49)
Based on this we find that GS is sufficient to serve as an additional indicator for
our trend analysis, although its results are not purely scientific. However our aim
3 http://wokinfo.com/
4 http://scholar.google.com/
Page 13
2 ABC/M and TD-ABC in the literature 12
is not to fully map the scientific landscape, but to draw meaningful conclusions
on the presence of both costing methods in Online Academic Databases and to
derive assumptions on diffusion in the real world. Concerning the query we
have implemented in WoS, we could only observe a trend on ABC/M, but not on
TD-ABC. This is due to the fact that the string “TD-ABC” includes the string
“ABC”, which could not be technically excluded in our search request5, to
separate between TD-ABC and ABC/M. Therefore our request was containing
"activity based costing" OR6 "activity based management" from 1993 until 2009
concerning published items and citations.
Figure 2. Number of published ABC/M papers
These results essentially correspond to Gosselin‟s (2007) findings from above,
a growing number of papers in the late 90s, around five papers per year,
followed by a declining number before 2005. Please note that since our search
includes an explicit spelling of “activity based costing /management”, the
number of results is limited. This means that some papers which were possibly
related to the ABC/M topic are not covered by this search. The results of the
next query show the number of citations in the field of “activity based costing
/management”. Here two more aspects need to be considered:
5 Several attempts to incorporate a search logic separating between “TD-ABC” and “ABC” failed
6 OR means that both results are summed up
Page 14
2 ABC/M and TD-ABC in the literature 13
Cross-citations are included, the indicated growth is not necessarily
significant.
Cross-discipline citations and citations from the broader context of
costing methods are included. For example some authors from Business
Process Engineering and most TD-ABC authors reference to ABC/M
literature.
Figure 3. Number of citations within ABC/M papers
Although the explanatory power concerning the growth of citations is limited, we
can yet say that ABC/M is a subject of interest to the academic world. This
message is also covered by the results received from our GS queries:
Figure 4. GS search for ABC/M
0
50
100
150
200
2000 2002 2004 2006 2008
Nu
mb
er
of
re
sult
s
ABC/M results in Google Scholar
Page 15
2 ABC/M and TD-ABC in the literature 14
In both GS queries we have explicitly separated between TD-ABC and ABC,
using a feature of the GS search engine. The curve of ABC/M results (above)
indicates that there was a maximum of interest in 2006 with a number of 158
findings. Recall that compared to WoS, GS provides a “wider collection”, means
not only academic papers, but also books and proceedings.
TD-ABC was initiated in 2003 (Kaplan, 2003) and received a growing interest
from the academic world, as our next figure indicates.
Figure 5. GS results for TD-ABC
The number of results increases from nine in 2003 to 67 in 2009. TD-ABC
seems to be less present than ABC alone, but a significant trend can still be
recorded.
We find also interesting that, if we do not explicitly exclude “TD-ABC” from the
query “ABC” (the 1st GS query excludes “TD-ABC” findings) we receive
Kaplan‟s working paper on TD-ABC (Kaplan, 2003) ranked on the first place,
meaning even before any paper on existing ABC/M. This rank is a result of a
high number of links and visits, hence a clear indication that TD-ABC is very
present in the online world and has become a trend. Since ranks of GS are
caused by the number of links, we quote Walker‟s (2002, p.524) abstraction on
the power of such a rank: “Links have become the currency of the Web. With
this economic value they also have power, affecting accessibility and
knowledge on the Web.”
0
10
20
30
40
50
60
70
80
2003 2005 2007 2009
Nu
mb
er
of
re
sult
s
TD-ABC results from Google Scholar
Page 16
3 Methodology 15
Since our results mark TD-ABC as an important subject to the academic world,
we will analyse whether it is justified to consider it as an evolved ABC/M.
3 Methodology
Within our research, different types of sources and methods are utilized. The
literature contains theory on ABC/M and TD-ABC as well as case studies and
empirical examinations. Whenever it is suitable and possible we add the
perspective of our case study to the discussed aspects, where we analyse and
reflect on the observed data. Krefting (1991) underlines that use of different
sources can lead to trustworthiness which increases readers‟ confidence and
ensures quality of findings. Letts et al. (2007) state that multiple sources and
perspectives reduce the chance of systematic bias. Regarding this paper the
sources and perspective are structured as shown in the following table:
(Type of) Source Literature ABC/M implementation
Empirical Data X
Theories X
Observation X
Research
Methodology Literature Review Qualitative Observation
Table 2. Sources and methodology of this paper
Qualitative observation rationale
Since the case study was derived by observing an ABC/M implementation,
qualitative observation and research was found the optimal method of choice.
According to Patton (1990) observation can lead to deeper understandings
than interviews, because knowledge of occurring events is provided, and may
enable the researcher to see things that participants themselves are not aware
of, or that they are unwilling to discuss. Recorded data is important in this
context, because researchers rely most heavily on the use of notes, which are
running descriptions of settings, people and activities (Hoepfl, 1997). In
practice, qualitative research involves an ongoing reflection on data and its
positioning against different theories. This is maintained through the discussion
of Kaplan‟s findings (Kaplan 2003, 2004 & 2007) in contrast to other academic
Page 17
3 Methodology 16
papers and our case study. These perspectives contribute to further develop the
chosen research questions.
To quote examples connected to ABC/M, Ahrens and Chapman (2006, p.830)
stated that qualitative field researchers should not “recount sequences of
activities in the field and then label them „activity-based costing‟ (ABC)”. Instead
of describing what occurred in the field, the research should outline the way in
which “particular actors interpreted and went about practicing ABC from the
description itself” (Ahrens and Chapman, 2006, p.830).
Jones and Dugdale (2002) and Briers and Chua (2001) formulated key
questions for the processual analysis of ABC. Instead of the repeatedly
discussed „do people use ABC?‟ and „why do they keep using ABC?‟ they have
stated qualitative questions going a step further:
„what do people have to do to be recognised as using ABC? ‟ and
„what else besides the organisational practices of ABC contributes to their
shaping?‟. (Briers and Chua, 2001)
The focus here lies on how ABC was assembled regarding the practical, social,
organisational, and technical dimensions.
In our case study, a project at a German logistics company, where ABC/M was
implemented under the supervision of the Controlling department will serve as
an illustrative example. The observations are obtained throughout the whole
implementation process from interactions between the consultancy and the
project manager for the ABC/M implementation at the logistics company. The
interactions have been recorded as email correspondences and documents
representing answers to specific questions which rose during the
implementation period.
Dialogues or quotations are not illustrated based on a strict agreement on data
access. Direct data access is available to examiners on request. However we
provide qualitative input from the case study as well as reflections on
interactions and observations.
Page 18
3 Methodology 17
When we talk about “ABC/M model”, we mean primarily the model design and
logic and in second place the support by software. Our underlying assumption is
that modern ABC/M software solutions can provide very similar results, once
they are optimally utilized. Hence it is the model‟s design which determines the
quality of an implementation.
The project was under constant evaluation from the logistics company and
respectively the Controlling department. Therefore, the leading qualitative
concern during the project revolved around the question:
Does the implemented ABC/M model deliver the desired results?
There are other issues of central importance during an ABC/M implementation:
the model has to be configurable and suit within the social and managerial
environment.
Since there are many software vendors, consultancies and academics claiming
that their ABC/M method (solution) is state-of-the-art, we need to point out
differences in the perceived features of today‟s ABC/M and in this respect
where the discussed models actually differ. In his papers, Kaplan (2003, 2004 &
2007) claims advantages in favour of TD-ABC, which he believes to be an
evolved, and problem free activity based costing method. So based on Jones,
Dugdale, Briers and Chua we centre on the questions:
1st Does our ABC/M model show the conceptual problems Kaplan and other
academics are pointing at?
2nd Does TD-ABC display the claimed conceptual advantages?
3rd How does the implemented ABC/M model perform in comparison to TD-ABC
and its alleged new features?
The discussion of the observed data focuses on aspects which have been
recognized by the academic world as conceptual problems of ABC/M, instead of
illustrating the whole implementation process. We then compare features of
existing ABC/M to the alleged novelties of TD-ABC. In the end all necessary
aspects managers need to consider in order to make a decision in favour of TD-
Page 19
4 Case study: ABC/M implementation at an air freight logistics company
18
ABC or ABC/M are marked out. For that we slip back into our fictitious CFO and
present our most important finding from his perspective. Academics may use
this paper to classify TD-ABC with its advantages and shortcomings and to
further investigate why it is perceived as an evolved ABC/M by some authors.
4 Case study: ABC/M implementation at an air freight logistics
company
Case set up
The logistics company offers products and services revolving around air freight.
The main products are air freight, special services connected to air freights and
storage space provisioning. The dimensions for which products are charged are
€ per kg or € for a service.
Figure 6. Product types offered by the logistics company
One major challenge during the implementation was to implement the
assignment logic of the cost consumption according to the complexity of
activities and the product portfolio. Products and service can be combined or
rely on each other. For instance, air-freight products as well as logistic-related
special services could require storage space. One product was billed per kg
freight, the other one based on each provided service. An additional challenge
was to conflate data required to supply our ABC/M model from different
underlying systems: a billing system, a transaction-oriented system (ERP) and a
warehouse system.
To provide some project key data:
350 products
Page 20
4 Case study: ABC/M implementation at an air freight logistics company
19
Around 600 employees
131 different relevant process steps considered for activities
32,000 individual flight events
Each flight event was described using 81 attributes
420,000 considered special service occurrences
54 different drivers to allocate costs
1,030 different cost positions
184,000 assignments
80 database queries to process information
24 different source tables
Underlying ABC/M methodology
Although our case study takes place in the German area, the implemented
ABC/M model is not a modified German version of ABC/M, such as
“Prozesskostenrechnung” (process cost calculation). It is not the purpose of this
paper to investigate which regional alterations of ABC/M exist. Our ABC/M
model is derived from the Anglo-American original ABC (Cooper & Kaplan,
1988).
Purpose of ABC/M
Overall aim of the project was to increase transparency of cost-consumption. In
the following we present the resulting features of the implemented ABC/M
model:
Capacity utilization and planning
Internal cost allocation
Customer profitability
Product posting and pricing
The controlling process: rolling with shorter cycles
Reporting: standard reports and Online Analytical Processing (OLAP).
The variety of capabilities underlines multi-purpose character of the
implemented model.
Page 21
5 Comparison between TD-ABC and ABC/M 20
Calculation was performed with support of software solutions. Data from
transaction-oriented systems, from different warehouse-, accounting- and
billing-systems was extracted to databases, then transformed and finally loaded
(ETL) into the ABM software. The ABM software in use was SAS Activity-Based
Management.
Project setup
The project was divided into the following tasks
1. Activity and process mapping
2. Data integration and loading
3. Model calculation: ABM model and driver logic
4. Analysis & reporting
5. IT concept / installation
The project setup and management is not subject of discussion. Within this
paper we focus on conceptual aspects and features of the implemented ABC/M
model.
5 Comparison between TD-ABC and ABC/M
This section is structured as follows. We present the concept of ABC/M and
outline why ABC/M is considered as an innovation compared to traditional
costing methods (chapter 5.1). Then the idea of TD-ABC is briefly introduced
(chapter 5.2). We comprehensively discuss the different aspects of TD-ABC in
comparison to ABC/M in the subsequent chapters and provide the results of the
conducted research (chapter 5.3- 5.8).
5.1 Concept of ABC/M
The concept of ABC/M is to assign costs to products, to customers and to
services through a two step allocation procedure. Its focus lies on the allocation
of cost over activities, such as training employees, supporting processes and
organizational transactions, which are not visible through traditional accounting
(Gosselin, 2007). Typical steps for an ABC/M model setup are explained in the
following.
Page 22
5 Comparison between TD-ABC and ABC/M 21
Determining the resources
First costs of a company‟s resources are determined. It is important to capture
and understand all operational and financial resources, such as equipment,
technology, facilities, operating supplies, electrical power, labour and other
items used in the performance of an activity (Vazakidis et al., 2009). During this
step the applicable resource drivers are developed as the mechanism to convey
resource costs to the activity. Basis for assigning resource expenses may be
number of FTE, a percentage, a size of an area, time (minutes that people or
equipment spend performing activities), or a combination of two or more driver-
types (Barrett, 2005).
To give an example: the total costs for resources are 70.000€. There are two
activites S1=“receive and forward package” and S2=”lookup package data”,
which require 40% and 60% of the resource capacity. S1 is performed 50.000
times, while S2 was executed 60.000 times.
Activity % Activity costs Driver Quantity Driver rate
S1 40 28.000€. 50.000 0,56/S1
S2 60 42.000€ 60.000 0,7/S2
Total 100 70.000
Table 3. Exemplary resource driver rate calculation
Capturing processes and activities
A process is defined as a collection of related activities. Within an activity
performed work is captured. It is important to identify all relevant activities,
where resources are converted into some type of output. The activity driver can
be viewed as the mechanism to assign activity costs to cost objects or other
activities.
Cost objects
The variety of outputs and services where costs accumulate, are cost objects,
such as the products and services, sales channels, customers or combinations
of these. These objects benefit from incurring work activities. (Cockins, 2001).
Page 23
5 Comparison between TD-ABC and ABC/M 22
Drivers
Drivers reflect the cost consumption in ABC/M and therefore play a key role in
the model design. There are two major types of drivers: transaction drivers and
duration drivers. Examples for duration drivers are material handling time, set
up hours, machine hours and direct labour hours. Transaction drivers capture
the transactions that have been performed, for example number of setups.
Figure 7. ABC/M model
As displayed in Figure 7, ABC/M assigns costs using three major blocks: the
resources, activities and cost objects. In practice resources are structured in
cost types per cost centres and can hence be obtained from existing accounting
systems. The same applies to cost objects; ABC/M takes cost objects which are
deposited in an accounting system (Proctor, 2009).
What makes ABC/M more sophisticated than traditional costing method is its
view on cost as a “function of changes in level of activity” (Labro, 2006). ABC/M
introduces a hierarchy in which fixed costs become variable costs, such as
Page 24
5 Comparison between TD-ABC and ABC/M 23
facility, product-sustaining, batch, and unit level cost. In contrast, traditional
costing methods estimate cost as a linear function of volume. Costs are only
viewed as variable when they exist on the unit level; other costs are wrongly
assumed as fixed. Labro (2006) outlines an example where she states that
product advertising cost, an instance of product-sustaining cost, is typically
considered as fixed together with other advertising cost. However, cost for
product-specific advertising do not longer occur, once the particular product is
stopped from being sold and should hence be incurred as variable. The
following table presents the confrontation between traditional view on expenses
and the cost hierarchy of ABC/M:
ABC/M Traditional costing
Facility level costs Fixed costs
Product-sustaining costs
Batch level costs
Unit level costs Variable costs
Table 4. Cost hierarchies in ABC versus traditional costing, source: Labro (2006)
Granof et al. (2000) outlines that the main advantage of ABC/M in contrast to
traditional costing methods lies in the decision support function. Since costs are
aligned according to cost drivers, they provide:
more accurate information on the structure of cost consumption
prioritization of cost-management efforts.
For Swenson (1997), the use of ABC for both decision-making and performance
measurement is typical of the „best practices firms‟ studied.
5.2 The concept of TD-ABC
In contrast to ABC/M, TD-ABC skips the activity-definition stage and hence the
allocation of costs to multiple performed activities (Kaplan, 2007): A TD-ABC
model can be essentially set up by estimating two parameters:
1. the unit cost of supplying capacity and
2. the required time to perform a transaction or activity
Page 25
5 Comparison between TD-ABC and ABC/M 24
The estimated time reflects the idea that resources performing different
activities vary in complexity. Cost drivers are translated into time equivalents.
The TD-ABC setup starts by estimating the cost of supplying capacity. It is
important to measure the practical capacity, defined as a percentage or amount
of time of the theoretical capacity of 100%. In order to receive the practical
capacity, working time-outs and occurrences unrelated to actual work
performance are deducted, such as time for breaks, arrival and departure, and
communication, machine downtime. The unit costs are then calculated by
dividing the cost of supplying capacity by the practical capacity. The output
dimension is therefore given as cost per time:
TD-ABC is based on the strong hypothesis that the entire cost generation is
based on the time consumption (Wegmann, 2007). Instead of transaction
drivers which are mainly used in existing ABC, TD-ABC is based on duration
drivers. Figure 9 from Evareart (2008) graphically illustrates the allocation
methodology of TD-ABC.
Page 26
5 Comparison between TD-ABC and ABC/M 25
Figure 8. TD-ABC, source: Everaert et al. (2008)
Everaert et al. (2008) also summarized the differences between the setup of an
ABC/M and TD-ABC model.
Panel A: ABC
Step 1 Identify the different overhead actvities
Step 2 Assign the overhead costs to the different activities using a
resource driver
Step 3 Identifiy the activity driver for each activity
Step 4 Determine the activity driver rate by dividing the total activity
cost by the practical volume of the activity driver
Page 27
5 Comparison between TD-ABC and ABC/M 26
Step 5 Multiply the activity driver rate by the activity driver consumption
to trace costs to orders, products or customers
Panel B: TD-ABC
Step 1 Identify the variuos resource groups (departments)
Step 2 Estimate the total cost of each resource group
Step 3 Estimate the practical capacity of each resource group (e.g.
available working hours, excluding vacation, meeting and
training hours)
Step 4 Calculate the unit cost of each resource group by dividing the
total cost of each resource grouo by the practical capacity
Step 5 Determine the time estimation for each event, based upon the
time equation for the activity and the characteristics of the event
Step 6 Multiply the unit cost of each resource group by the time
estimate for the event
Figure 9. ABC vs TD-ABC, source: Everaert et al. (2008)
In the following chapters we discuss the differences between TD-ABC and
ABC/M in detail. For that we not only take the model setup into account, but
also the various characteristics of TD-ABC which are predominantly caused by
the fact that it is based on time consumption.
5.3 Data gathering through interviews
Kaplan criticizes the data gathering of an ABC/M implementation in order to
receive information on activities and driver rates. For him the process of
interviewing and surveying employees carries along several problems, among
them high consumption of time and high cost.
According to Kaplan (2003, 2004 & 2007) the time estimates required to
calculate the driver rates for TD-ABC can be obtained by direct observation or
by surveying managers. Hence, in case of a model setup or changing operating
conditions, personnel do not need to be (re-)interviewed. Managers could
undertake the model setup and updating by simply estimating the time units
required for each (new) activity. Since this way of unit time estimation should
Page 28
5 Comparison between TD-ABC and ABC/M 27
consume less time, it is supposed to reduce the cost of implementation and
updating, compared to ABC/M.
Time consuming interviews vs. direct observation
Case studies on the implementation of TD-ABC indicate that practitioners have
mainly followed Kaplan‟s instructions on how to conduct the unit time
estimation. For instance, Demeree et al. (2009) implemented TD-ABC at an
outpatient clinic. They have gathered data through direct observations and
interviews with department heads and outpatient clinic managers. To register
different time consumptions for relevant activities a stopwatch was utilized. This
process was repeated 3 months later to ensure that consistent results were
obtained. This data gathering method was recorded as a success.
For their instructional case Everaert et al. (2008) stated interviews which were
derived from real ABC implementations. As a consequence students were
supposed to recognize that data collection for existing ABC is “very time-
consuming” (Everaert et al., 2008).
Within our case study, workshops and interviews were conducted where
managers and employees were introduced to the new costing system and
interviewed concerning their tasks and activities. It is important to note, that
although ABC/M was implemented, that approach was not obligatory. During
the first consultations with the ABC/M project leaders, they were confronted with
an option to decide on how to gather information. Two combinable
alternatives were presented together with their advantages and disadvantages:
workshops with all employees and interviews with cost centre managers. The
following illustration shows which aspects managers were taking into
consideration when they had to balance between the methods:
Page 29
5 Comparison between TD-ABC and ABC/M 28
Figure 10. Alternatives on how to gather information
In our case, we practiced a top-down/bottom-up approach:
Each employee invested 3 hours of his/her time to participate in those
workshops.
Managers were interviewed
As a result employees were involved in the setup process and actively
supporting the implementation of our model. Managers provided an overview on
major activities within their departments. However, the decision in favour of
workshops was taken not only based on a trade-off between time investments
and motivation of employees, but also because of a general reason: ABC/M
provides insights on activities. Receiving information firsthand means also a
better understanding of processes and activities. Decisions changing the
effectiveness of a company can be introduced easier. In literature there are
other examples where managers have accepted efforts of workshops and
interviews, even if the only benefit was a review on processes and workflows
(Carolfi, 1996 & Ittner et al., 2002).
For the most recent update of the ABC/M-model in early 2010, it was sufficient
to only interview managers. But this was not conducted according to Kaplan‟s
method, since circumstances were different:
concerning changes of activities, managers could conduct interviews and
observe changes by themselves, since they were familiar with our approach.
Page 30
5 Comparison between TD-ABC and ABC/M 29
updates were not only related to changing processes and activities but
mainly due to changes in the product portfolio (we refer to chapter 5.8 Data
loading processing and reporting).
In literature another data gathering approach for the ABC/M model setup is
mentioned: “Rapid Prototyping” (RP). RP is especially applicable for large scale
implementations (Cockins, 2001). An enterprise-wide ABC/M model can be
subdivided in to several children ABC/M models. To setup such a model there
are two possible ways, starting from
departmental-ABC/M models consolidated to the enterprise-wide system or
high-level ABC/M is selectively adjusted into lower levels of detail
The aim is to accelerate the model setup and the organization‟s learning about
ABC/M. Intensive training and interviewing at the initial phase is not required.
Cockins (2001) describes an instance, where only a sample of cross- functional
employees had collectively constructed a “tiny” high level ABC/M model which
then served as base for the entire enterprise. Another advantage of this
approach is that mistakes are detected quickly and up-front, when they can be
easier corrected as in a big model. This aspect leads us to our next topic: errors
in costing systems.
5.4 Costing accuracy: sources of errors
Besides direct observation, there is another reason why Kaplan favours the TD-
ABC approach instead of interviews, such as conducted in ABC/M. He
considers managers the more reliable source concerning accuracy of
information on time consumption and activities (Kaplan, 2003).The accuracy of
the cost driver rates derived from individuals, is called into question, since
employees introduce errors. This is due to their “subjective estimate of their
past and future” (Kaplan, 2003, p.3). For Kaplan, managers generate more
accurate information and fewer errors within a TD-ABC setup. He criticises the
accuracy cost drivers of existing ABC/M, since they are derived from
employees. His claim is that employees are tempted to bias time allocations,
anticipating how they might be used (Kaplan, 2003). Kaplan does not justify why
Page 31
5 Comparison between TD-ABC and ABC/M 30
employees behave in such a way but managers do not. Especially since
managers are also affected by results on the performance of their department
and hence can be tempted to bias estimates. Kaplan himself stated once that
managers can be embarrassed or even threatened by systems which have the
potential to reveal and generate information (Argyris & Kaplan, 1994). We found
another author who reflected on his experience on PM implementations when
he realized that
“...organizations were not economically rational, integrated entities, but composed of
individuals with their own priorities and motivations, which were themselves influenced
by the rewards and penalties expressed by senior managers.” (Otley, 2003, p.311-
312).
We note that there is no difference on which hierarchical level potential bias
takes place, since everyone might be tempted to influence the outcome of a
model, which reveals his or her performance. Hence managers cannot be
considered a more reliable source per se.
Concerning TD-ABC‟s accuracy, Kaplan concludes that inaccuracies in unit
time estimates are eventually revealed either in unexpected surpluses or
shortages of committed resources. On the other hand, he does not explain why
within ABC/M inaccuracies cannot be discovered in a similar way. Cockins
(2001) points towards a fundamental aspect of ABC/M, stating that each cost
can be traced by “its unique quantity or proportion of its driver” (Cockins, 2001,
p.16). The resource expenses are eventually reaggregated into the final cost
objects, this leads to revelation of errors. Therefore activity drivers in ABC/M do
not only segment cost flows but also “govern accuracies” (Cockins 2001). Since
in every module of ABC/M costs and their sums are visible, there is no
difference in revealing errors compared to TD-ABC. But what about the source
of errors Kaplan mentioned? Are time estimates and the way they are
generated more accurate in TD-ABC?
In order to discuss what impact errors have on accuracy we need to first define
what types of errors may occur in a costing system. Cardinaels and Labro
(2007) have analysed the potential sources of errors that can be made when
Page 32
5 Comparison between TD-ABC and ABC/M 31
designing a costing system. The categories of substantial errors are:
aggregation, specification and measurement errors. In the following illustration
an overview of these error types is provided as well as the stages of an ABC/M
model (see also Figure 11) where they can occur.
Figure 11. Potential errors, source: Cardinaels & Labro (2007)
Since TD-ABC heavily relies on time estimates as key cost drivers, our focus is
on measurement errors. There are two ways measurement errors can occur.
First, while assigning cost to cost pools, for example when manual labour is
wrongly assigned to secretarial cost pool. The second and more important case
for our discussion appears when “specific units of resource consumed by
individual products are wrongly measured” (Cardinaels & Labro, 2007, p.21).
In TD-ABC, estimation on how employees divide their time over various
activities, is required. Because the allocation of (indirect) cost is based on these
estimations, measurement error would have an important impact on the
accuracy. Recall that Kaplan suggests managers should provide reasonable
estimates for the time spend on various activities, or they should be obtained
through surveys. Cardinaels and Labro (2007) find that even if employees have
no incentives to bias the time estimates for a TD-ABC model, “significant errors
Page 33
5 Comparison between TD-ABC and ABC/M 32
are made in these estimates” (Cardinaels & Labro, 2007, p.23). The authors
argue that cognitive capabilities of people are too limited to specify accurate
information on time spans they spend on performing their activities. In
consequence serious measurement errors on estimates are conceived. The
authors add that this “problematic issue” can also be observed on existing
ABC/M if it makes extensive use of duration drivers. There is hence no
difference in which method is utilized, ABC/M or TD-ABC: the greater the role of
estimated duration drivers is, the more is the model prone to inaccuracy. Recall
that in contrast to TD-ABC, within ABC/M the driver type is not limited to be
based on time estimates. Since time can reflect cost consumption through
activities, ABC/M can, but does not need to take duration estimates into
consideration. For such setups the authors highlight the importance of early
notification of participants. Once a person is informed in advance that he or she
needs to provide time estimates on the range of activities, errors on time
allocations of activities are reduced (Cardinaels & Labro, 2007).
5.5 Cost of excess capacity
In addition to the supposedly improved „data gathering‟ and „higher accuracy‟
TD-ABC is favoured by Kaplan and his academic followers because it is
supposed to reveal excess capacity. In existing ABC/M proportions for the time
spent for different activities are stated in relative measures and add up to 100%.
There is no focus on revealing excess capacity. Therefore Kaplan assumes that
in ABC/M “resources are working at full capacity” (Kaplan 2003, p.4). On the
other hand, in order to determine the capacity cost rate, TD-ABC deducts idle
time from full capacity which leads to the practical capacity (see also “The
concept of TD-ABC”). Managers are supposed to quantify excess capacity
through estimation. Kaplan also provides support on how to approach this
estimation: “as a rule of thumb, you could simply assume that practical full
capacity is 80% to 85% of theoretical full capacity.” (Kaplan, 2004, p.3).
This approach was perceived as revolutionary by academics who implemented
TD-ABC like Demeree (2000), Coners (2007) Everaert & Bruggeman et al.
(2006 & 2008) and Wegmann (2007). However, estimating idle capacity is not a
trivial concern. First, the mentioned TD-ABC‟s “rule of thumb” needs to be
Page 34
5 Comparison between TD-ABC and ABC/M 33
called into question (Barrett, 2005), since there is no empirical evidence, which
would support its application. Second and more important, besides examples,
how idle capacity can occur, “time for breaks, arrival and departure,
communication and training”, (Kaplan, 2004, p.3) there is no rationale provided
on how to determine idle capacity. Also the assumption that managers will
reveal their capacity utilization must be doubted. For managers excess capacity
also means that employees have much idle time and their department is
ineffective (Barrett, 2005). So the unanswered questions remain:
Who is willing to admit that a part of their (department‟s) working time is spent
idle, managers or employees? How to otherwise measure excess capacity? TD-
ABC aims to overcome the problem that no employee is willing to admit that he
or she is not working at full productivity. Absolute estimations of time units,
rather than percentages are viewed as the key for insights on capacity
utilization. Labro and Cardinaels (2007, p.23) question this method and provide
empirical evidence that people tend to “over-estimate dramatically the time they
work, on average 37%”. At this point, we must raise serious concerns on the
accuracy of TD-ABC, since the claimed accuracy does not stand against the
listed empirical result. The estimation approach is prone to error. Hence TD-
ABC is not able to reveal excess capacity.
Furthermore the assumption that ABC/M is incapable of considering or
managing excess capacity, a view Kaplan shares with other TD-ABC
practitioners, must be set right. Within ABC/M idle capacity can be managed
through the assignment logic. Capacity utilizations can be classified into
different time-status modes; the simplest way is to distinguish between
productive time and idle time. Based on this, subsequent cost reassignments of
each time-status mode to specific recipients can be traced. The structure of
activity drivers and the driver rate determination are not changed. The following
illustration by Cockins (2001) provides an example on how activities can be split
into different time-status modes, respectively “idle”, “nonproductive” and
“productive”
Page 35
5 Comparison between TD-ABC and ABC/M 34
Figure 12. assigning capacity using time-status modes, source: Cockins (2001)
State-of-the-art ABC/M supports many ways to allocate idle capacity, based on
Cockins (2001) approach depicted in Figure 9. After the quantity of unused
capacity is measured or obtained, the costs of excess capacity can be assigned
equally, costs are divided by the number of existing assignment and then
allocated.
proportionally, according to the relative proportion of outbound allocations
to other cost objects, when for instance idle time for “testing” should be
reassigned to R&D costs.
or not assigned, in order to receive for example product costs at full capacity
utilization capacity costs are not allocated.
We can imagine an example: a chicken manufacturer has total warehouse
space of 2000 square meters, where 1543 square meters are in use7. The idle
capacity is therefore 22.85%. The offered chicken products are Breast, Leg,
Wings, Fried Chicken, Frozen Chicken and Fresh Chicken. Our manufacturer
knows that the measured idle space is due to empty refrigerators which are
required for the Frozen Chicken product. We assume that the number of
7 Measuring idle capacity of a warehouse is far more comprehensible than determining idle time
of a warehouseman
Page 36
5 Comparison between TD-ABC and ABC/M 35
refrigerators cannot be adjusted according to the customers‟ (seasonal)
demand; they hence have to be kept in stock. Managers decide to allocate the
full costs of idle capacity to the particular product, the Frozen Chicken. If the idle
capacity cannot be traced to one particular product, or if managers decide to
spread these costs among all products, a proportional or equal allocation
method might be chosen. The following illustration shows how a proportional
allocation for our example can look like:
Figure 13. Idle capacity cost allocation, software: MyABCM
Summarizing our findings, we state that TD-ABC makes an attempt to reveal
and incorporate excess capacity, but struggles with accuracy concerning its
time unit estimations (Cardinaels & Labro 2007). ABC/M on the other hand
provides a full set of options on how to deal with idle capacity (Cockins, 2001)
which has been revealed before. For each objective set by the management the
business environment there is a choice between different allocation methods. In
the end, users have to decide how to allocate cost of excess capacity. If the
decision is not to distinguish used from unused capacity, we must assume that
managers accept some level of excess capacity or are reasonably vigilant in not
tolerating idle resources. However both, TD-ABC and ABC/M, can consider, but
cannot reveal, excess capacity.
Page 37
5 Comparison between TD-ABC and ABC/M 36
5.6 Time vs. multi-metric approach
Measuring idle and maximum capacity in order to provide capacity utilization
remains a difficult task (Popesko, 2009). In the best case measuring idle
capacity is obvious, as shown in our warehouse example. But in other cases
capacity is not plainly tangible, for example when we consider IT-infrastructure
utilization (Carter & Crovella, 2004), capacity provisioning is difficult to measure
but necessary. In such contexts, it stands to reason to make use of various
capacity measures – not only time estimates. The restriction of TD-ABC to
reflect business activities only through time estimates generally needs to be
called into question. In fact, the myopic focus on time can lead to exclusion of
other cost factors.
Consider our warehouse example from above: In order to improve the process
of “freezing chicken” and be able to cut costs, process engineers would be
limited on the homogenous cost factor time. But besides time, costs for space
and electricity are possible key cost drivers to accelerate cost cutting decisions.
For a bank loan officer it would be more intuitive to estimate the number of
credit reference checks as a transaction driver than time8. For instance, 40€ per
credit check could be related easier than a duration of 17.2 minutes for the
same.
Within the field of Activity-Based Costing and Environmental Management
(ABCEM) “environmental metrics and well established principles from
economics and cost accounting” are utilized to determine monetary cost, energy
and waste (Bras & Jan Emblemsvåg, 2001, p1.). Here, for example, cost drivers
for fuel consumption are reflected through the amount of consumed litres.
Barrett (2005, p.7) commented on TD-ABC‟s limitation on duration drivers:
“In any organization, some functions -- such as marketing, legal, research, and areas of
IT -include activities that are far from homogeneous and repetitive. Trying to force a
time-driven methodology onto activities in which cycle times vary wildly is
inappropriate; for those activities, an alternative methodology should be used.”
8 Against the background of the financial crisis it might be reasonable to also incorporate the
costs of credit risk within such an approach
Page 38
5 Comparison between TD-ABC and ABC/M 37
Within our case study, heterogeneous processes of an airfreight-logistics
company were reflected through a broad range of metrics (multi-metric
approach). The following table provides a list of metrics which have denote the
cost-consumption for the ABC/M model.
Cost driver unit Type
KG Invoiced weight
Hours FTE
Quantity Stored Freight
Quantity Shipped pieces
Table 5. Cost driver types in the ABC/M case study
However ABC/M does not exclude time estimates for driver rate determinations,
but can include all imaginable and reasonable metrics as a basis for cost
consumption.
5.7 Complexity of processes and activities
“The time-driven approach usually operates with fewer equations than the number of
activities used in any existing traditional ABC system, while permitting more variety and
complexity in orders, products, and customers, and, therefore, delivering more
accuracy“ (Kaplan, 2003, p.9).
We note that for Kaplan complexity cannot be modelled efficiently within
existing ABC/M. TD-ABC provides a novelty which is supposed to handle these
cases better. Kaplan introduces Time Equations to capture activities with
different degrees of complexity. Depending on the company‟s product and
activity structure determining activity drivers can be very complex. To illustrate
this problem, he outlines example activities, where chemicals can be prepared
differently before they are shipped:
Case 1: normal treatment, packaging requires 0.5 minutes
Case 2: normal treatment + special packaging (requires additional 6.5
minutes)
Case 3: normal treatment + shipment by air (requires additional 0.2
minutes to place chemicals in a plastic bag)
Case 4: normal treatment + special packaging + shipment by air
Page 39
5 Comparison between TD-ABC and ABC/M 38
To cover all these cases without actually increasing the number of activities or
drivers (and hence increase the model‟s complexity) Kaplan introduces the
following Time Equation:
Packaging Time = 0.5 + 6.5 (if special handling required) + 0.2 (if shipping by
air)
What makes Time Equations innovative is that different degrees of cost
complexity, caused for instance by optional features of product or service, are
captured through activity duration drivers. Within these drivers Kaplan has
incorporated a distinction of cases. For him this innovation is the only way to
avoid the introduction of a “separate activity for every possible combination”
(Kaplan, 2003, p.9) of activity characteristics. Concerning existing ABC/M,
Kaplan (2003) stated that for heterogenic transactions, or complex activities, the
number of activities and drivers needs to be expanded. For each activity a
driver is defined and resources are assigned according to the consumption.
Everaert et al. (2008) investigated whether ABC/M can model this kind of
complexity. They state an example where a wholesaler failed to model variable
characteristics using ABC/M. Their findings are that within an ABC/M model
complex logistic operations cannot be modelled
heterogeneity of activities with different subtasks are ignored, or
separate activities for each subtasks have to be created.
Demeree et al. (2009) follow this assessment on the capabilities of today‟s
ABC/M. They conclude that ABC/M only supports a single driver rate for each
activity which leads to an inflation of the number of activities in ABC and creates
difficulties in estimating the practical capacity for each sub-activity.
Trying to solve the challenge of cost based evaluation and differentiation of
complexity grades, there is also another approach. For ABC, Heina (1999)
recommended to specially create cost objects for each combination of a
complex product features and to introduce weighting-factors where different
degrees of complexity are incorporated. A weighting-factor greater than 100%
reflects a greater handling-complexity for a specific process variation. The
Page 40
5 Comparison between TD-ABC and ABC/M 39
process costs are then obtained by multiplying the basic process costs with the
weighting-factor. The aim is to provide process cost variations with different cost
characteristics on alternative process variations. Heina basically argues that the
number of cost objects should be increased.
We find that weighting-factors are only capable of incorporating and displaying
different degrees of process complexity, but do not reduce complexity within a
model. This approach can be seen as counterpart for the creation of additional
activities as mentioned above.
We have presented two ways in which academics made an attempt to deal with
complex activities within ABC/M. To set up an example for each of the
presented approaches, we assume that a company has activities 1, 2 and 3,
which can be combined to receive the product “white” or the variations “blue”,
“red” and “green”. Imagine that we are talking about a car manufacturer
producing one car that can be full-equipped “white” or combinations of
equipments “blue”, “red” and “green”. For example, activity 1 manufactures
environmentally-friendly features, like switching to biofuel-enabled components.
Activity 3 leads to a lightweight car. If we combine 1 and 3 we receive a car in
the “green” version, light and (therefore also) with low pollution. The following
table explains the possible activity variations and the resulting product variation:
Activity variation Product variation Product cost
1+2+3 white 6
1 and 2 but not 3
blue 1+2 = 3
2 and 3 but not 1 red 2+3 = 5
1 and 3 but not 2 green 1+1+3 = 5
Table 6. Exemplary activity and product variations
To keep this example simple the activity number also represents the activity
cost. Costs are defined according to the complexity of the product feature and
not further considered within our example. Relevant for this illustration is the
amount of complex information which can be added to the model.
Page 41
5 Comparison between TD-ABC and ABC/M 40
Figure 14. Complexity in connection with activity or product variations
The figure shows the cost-complexity structure according to the academics
above. The alternatives are placed on the left and the right side of the figure.
According to what the authors above perceived to be possible for existing
ABC/M, within a model we can either
keep the number of activity variations and introduce cost objects
new cost object for each possible product (cost) variation, or
keep the number of cost objects and create variations of activities
capture our costs within new activities
Since both approaches add information to the model, respectively activities 1,2
and 3 or cost objects blue, green and red, both ways increase the overall
complexity. The point is that information is added independent from the actual
cost consumption. In both TD-ABC and ABC/M processes are segmented to
achieve cost-related estimations for different cost objects and product types. In
the literature, formalizing specific processes according to product type or group
is called “variation-modelling9” or “variability” (according to Varia et. al, 2007).
9 Translated from German, Gaitanides, M. (2007), Prozessorganisation, 2. Aufl., München 2007.
Page 42
5 Comparison between TD-ABC and ABC/M 41
However, complexity is either shifted from the activity side to the cost object
side or vice versa. In contrast, TD-ABC avoids this type of complexity by
introducing functions which keep the information needed only where the
resource (time) is consumed. Kaplan‟s Time Equations are recognized by the
mentioned academics as a “breakthrough” (Everaert et. al, 2008), since for
them ABC/M-models could not provide any comparable complexity reducing
solutions.
As a matter of fact and in contrast to what authors have stated above, today‟s
ABC/M models provide complexity reducing functions for drivers: the
calculated drivers, which include driver formulas. Driver formulas or similar
- case distinguishing - drivers are part of any state-of-the-art ABC/M model and
software.
We found papers from 2002 documenting ABC/M implementations with
calculated drivers using “Oros 99” ABC software (Kamath, 2002). The following
table shows an excerpt of today‟s software vendors which support models with
calculated drivers:
Vendor Software
SAS10 SAS-ABM
SAP11 SAP-BO
MyABCM12 MyABCM
Table 7. ABC/M software with calculated drivers
The formulas allow implying not only distinction of cases, but also a whole set of
Boolean logic and mathematical terms. For example, consider the set up of
Kaplan‟s shipping example from above. Recall, the possible combinations are
normal treatment + optional (shipment by air AND/ OR special packaging)
Let us extend the possible treatments by a forth case with another constraint:
10
www.sas.com 11
www.sap.com 12
www.myabcm.ch
Page 43
5 Comparison between TD-ABC and ABC/M 42
IF shipment by air AND special packaging
THEN
normal treatment + shipment by air + special packaging * 1,2
When shipment by air is chosen, the special packaging requires 20% more
time, because the customs duty requires reclosable packages for potential
checks.
Driver formulas allow us to consider constrains in advance without increasing
the model‟s complexity. As a logical expression we could write for this case:
In an ABC/M model, which reflects the treatment of logistic Companies,
relations, constrains and combinable service and product features can be more
complex than in these examples. We can imagine situations where costs do not
behave linear and have to be reflected through polynomial function of higher
degree. Or in situations where asset cost (resource cost) are step fixed,
meaning that the costs “jump” when the output quantity increases and reaches
a certain level. For example, a mail sorting machine which can sort mails up to
a number of 10,000 a day. Once 10,001 mails need to be processed, an
additional machine is required to be set up. These challenges are very likely to
occur within the field of Regulatory Accounting, where costs of capacity
provisioning are determined, for instance in Telecommunication Infrastructure
(ITU, 2009). Here, internet data cables have to be upgraded when the data
traffic exceeds the capacity of the provided bandwidth. Regulatory Authorities
demand such ABC/M based cost calculations from telecommunication providers
when setting prices for sharing infrastructure with competitors.
We can conclude that intelligent design of the calculation logic and driver
formulas which reflects behaviour of costs is required to avoid increasing
complexity within a model. In this sense the capabilities of Time Equations are
similar to the Driver Formulas, up to the point that Time Equations are limited to
Page 44
5 Comparison between TD-ABC and ABC/M 43
the input dimension time (we refer to chapter 5.6 Time vs. multi-metric
approach). Concerning TD-ABC Kaplan13 (2007, p.1) stated:
“Time equations handle complexity by simply adding terms with Boolean logic that test
for the presence of a particular feature that adds or subtracts time to overall processing
time, a simple and elegant technique.”
An example from our case study, on how this “elegant technique” was
implemented in existing ABC/M:
Name DriverType Formula
FlightEvent Calculated if("Vertyp"=2,0,if(("Vertyp"=1) AND
("GTyp"=3),0,if(("Vertyp"=1) AND ("GTyp"=5),0, "FE")))
Table 8. Calculated driver example from the case study
This example shows how even a high degree of complexity can be handled. For
instance, the combined Boolean terms ensure that if Vertyp equals 2 the output
is 0. If Vertyp is not equal to 2, another Boolean term is utilized, checking
whether Vertyp equals 1 and at the same time GTyp equals 1 and so on.
Overall four combined case distinctions are incorporated within this term.
The elements entered in the formula above (Vertyp, GTyp, etc.) are attributes.
They are directly connected to the related activity or cost object account.
Issues connected to reduced complexity
Reduced complexity can also mean that information is lost. We illustrate this
issue by using an example connected to attributes of a cost account.
During the implementation process the question, whether the model could
actually handle complexity was not raised. For all participants it was obvious
that calculated drivers which reflect logistic operations can be utilized within the
driver formulas. Therefore the focus lay on how to utilize driver formulas, means
to design and apply a logic for processes and activities.
Rather than “can we reduce model complexity?”, another related discussion
could be observed: “how to deal with reduced complexity?”. We will illustrate
13
“Adding Time to Activity-BasedCosting”, interview with Kaplan on TD-ABC, 11th
April 2007
Page 45
5 Comparison between TD-ABC and ABC/M 44
this problem with an example: visibility of attribute values for reporting
purposes.
The company had two major process groups, cargo related activities (cr-
activities) and special services (ss-activities). They are either assigned to a cost
object for flight events or for special services. The underlying billing- and
transaction-systems capture the invoices (revenues) and transported weights,
both attributes in the model. In demand products can require cr- or ss-activities
or both. The model was designed in a way that attributes (and their values) are
only attached to destination accounts, if
1st there is an assignment to the destination account and
2nd the source account has a driver, where the attribute is included and utilized.
In our case we had a driver “Security” which was only utilized for export-flights
and correlated to the transported weights. The underlying idea was that export
flights require more security preparations in relation to their weight (see also
example from above). Within the model, the transported weights for cost objects
are not equal to the input value of overall transported weight. Only cost objects
related to export products have the amount of transported weight attached as
attributes. As a consequence, transported weights are not fully traceable
anymore, for instance if we want to ensure that the sum of transported weights
is equal to the input value.
Page 46
5 Comparison between TD-ABC and ABC/M 45
Figure 15. Visibility of attributes within ABC/M
This problem depicts a discussion on how attribute values should be reported,
after complexity was reduced. A question which is more connected to general
decisions on reporting: managers (Controlling department) have to define their
way of treating attributes. The ABC/M calculation logic filters activity variations
and their attribute costs according to the actual cost allocation. But these values
(costs) can yet be designed to be comprehensively traceable, so that at any
point within the model the sum of attribute values remains constant. Managers
have therefore to decide whether
Attributes should be fully visible; the sum always adds up to 100%.
Sum of attribute values are visible according to the consumption through
the utilized drivers, which may be less than 100%.
We can conclude that reports generated for Controlling and PM need to be
commented, since the model‟s allocation logic and implemented functions are
not visible within standard reports. Therefore reducing complexity is always
connected to question on how to report reduced complexity.
5.8 Data loading, processing and reporting
As we have seen TD-ABC cannot commit to the promises which have been
stated by TD-ABC favouring authors so far. Still there are alleged novelties
which could make a difference in the decision between ABC/M and TD-ABC. In
Page 47
5 Comparison between TD-ABC and ABC/M 46
this chapter, we question how both systems can be integrated into the
operational and technical environment of companies. Which costing-method is
more advanced in this respect?
In today‟s business environments, processing enormous amounts of (digital)
data substantially relies on the use of IT. Therefore it is not surprising that
Accounting Research is incorporating this topic and Kaplan (2003, 2004 &
2007) claims a problem-free integration into existing systems for TD-ABC. In
this context, what makes the difference between ABC/M and TD-ABC in his
view can be summarized as follows:
TD-ABC requires less storage space than ABC/M. (Kaplan, 2003 &
2004)
Generic spreadsheet tools such as MS Excel and even ABC software
packages are exceeded by existing ABC/M. TD-ABC on the other hand
delivers “fast processing times and real-time reporting” (Kaplan, 2004,
p.2)
TD-ABC can be fed from transactional system, such as Enterprise
Resource Planning (ERP) and Customer-Relationship-Management
(CRM) (Kaplan, 2004 & 2007)
Storage space requirements
Kaplan describes ABC/M-cases where “the demands on the computer model
used to store and process the data escalate dramatically” (Kaplan, 2003, p.3).
ABC/M is supposed to have high storage costs; since for example a company
with 150 activities and 600,000 cost objects (products and customers) required
2.16 billion database items to save data of 24 months (Kaplan 2003).
We find that stating the number of stored database items does not provide
information on the costs associated with the storage. There are many factors
which need to be considered, at least hard drive storage costs and average size
of a single database record, but also IT- provisioning and maintenance costs. In
Page 48
5 Comparison between TD-ABC and ABC/M 47
2010, for instance, cost for hard disks to save the stated amount of data would
be around 1500$14.
However, we need to generally question whether ABC/M really has the claimed
requirements for storage and whether there is a difference to TD-ABC in this
respect. First, we refer to the foregoing chapter 5.7 “Complexity of processes
and activities”. The inefficient implementations for ABC/M mentioned here lead
to increasing complexity and a high demand for storage and processing
capacity. If, for instance, the number of cost objects is derived from every
possible combination of product features, as Kaplan assumed to be necessary
for ABC/M (Kaplan, 2004), the required storage space will always exceed what
needs to be stored for TD-ABC. Also if we can only consider one activity-cost
driver for each activity, as claimed to be the case for ABC/M (Everaert et al.
2008), the same problem occurs: unnecessary information is added to the
model which increases the required amount of data. When users do not
recognize that within existing ABC/M a single (calculated) driver can reflect the
cost consumption of multiple activities, the increased amount of data leads
inevitable to more required storage space. Once calculated drivers are utilized
within ABC/M; therefore, data amounts should not exceed what is required for a
TD-ABC model. We refer to a quotation from Barret (2005, p.6), who concluded
his findings on the data requirements of ABC/M and TD-ABC:
“Therefore, to be accurate, time-driven ABC requires as much data collection as does
traditional ABC”
Concerning our case study, we did not find that storage space was a significant
cost issue. Besides the utilization of calculated drivers, we incorporated
sophisticated methods on multi-dimensional databases to avoid redundancy in
the imports to the ABC/M model (see also Golfarelli et al., 2003). As a result we
could supply the model with low amounts of data. The following table shows the
size of the data sets:
Storage space Type of data
14
Not the Total Cost of Ownership, calculation and assumptions are provided in the Appendix
Page 49
5 Comparison between TD-ABC and ABC/M 48
80 Megabytes Input Data, Microsoft compatible database (compressed)
2 Megabytes ABC/M model – compressed and exported to XML file
Table 9. Storage space requirements for ABC/M from case study
Software and performance
Kaplan (2003 & 2004) also mentioned lack of performance which arose during
ABC/M implementations. He states examples where processing for an ABC/M
model took days. We could also assume here that this is due to huge amounts
of unnecessarily created data as stated above. However we find that there are
other possible reasons which have led to a misperception on the performance
of today‟s ABC/M models. Besides data amount, Kaplan‟s (2004, p.2)
description of ABC/M implementations refers to problems where the
implemented solutions and underlying systems were not capable to process the
job:
“Such expansion has caused ABC systems to exceed the capacity of generic
spreadsheet tools, such as Microsoft Excel, and even many ABC software packages.”
Even if we assume a state-of-the-art ABC/M model where “expansion” did not
take place (through the use of calculated drivers for instance), we must question
the extensive use of generic spread tools. Indeed surveys indicate that those
who have implemented ABC/M are mostly using spreadsheet software like MS
Excel, rather than especially designed ABC/M software which is supposedly too
costly to customize (Gosselin, 2007). Recent and more general surveys show
that up to 86.2% of German, Swiss and Austrian companies use Spreadsheet
tools to evaluate and plan their businesses (Seufert, 2008). The benefits of
Spreadsheet tools, such as MS Excel are obvious; they are quickly applicable,
since most users are capable of using them. Furthermore they create little or no
costs, because they are mostly available within existing IT-systems. They also
provide a high degree of flexibility (Rasmussen & Eichorn, 2000). But flexibility
and the attempt to save costs can come at a trade-off as we show in the
following. KPMG Consulting (1999) empirically analyzed the quality of
Spreadsheet applications their customers had in use:
95% of the applications included substantial errors.
Page 50
5 Comparison between TD-ABC and ABC/M 49
95% of the applications were poorly designed
92% of the applications made significant mistakes in tax calculations
75% of the applications included substantial errors in accounting
78% of the departments did not have any formal Quality Management
Rasmussen and Eichhorn (2000) summarized their findings and
recommendations on the areas of application for spreadsheet tools as follows:
Should be uses for/ within Should not be used for/ within
Small companies
Highly individual applications
Short period necessity
Process control
Performance intensive
applications
Complex environments
Consolidation
Organizational change
Accounting
Table 10. Use cases for spreadsheet software, source: Rasmussen and Eichhorn (2000)
We record, a use case where ABC/M (or TD-ABC) is based on generic
spreadsheet software is prone to error and characterised by low performance.
Therefore, it is not surprising that in some ABC/M cases in literature
spreadsheet software did not deliver satisfactory results, since this is an
overstrained solution when a certain amount of data is involved. Therefore,
avoiding specially designed ABC/M software because it is too costly or “too
costly to customize” as Gosselin (2007) outlined, may come at other - hidden -
costs.
“For large data sets that exceed the limits of spreadsheet software, such as index
contents or user log data records, which may consist of millions of observations,
database management system software provides a better alternative” (Wolfram, 2003,
p.3).
Page 51
5 Comparison between TD-ABC and ABC/M 50
Most existing ABC/M software solutions are based on the use or preservation of
databases in one way or another15.
Within our case study, the processing time, starting from extracted data of
transactional systems (ETL) to the view on the results of the calculated ABC/M
model, was around 10 minutes. State-of-the-art databases and especially
designed ABC/M software were in use. Spreadsheet tools were only used in
two cases:
When there was no interface providing a direct data import from
transactional systems
When reports needed to be customized and presented, after calculation
have been performed in the ABC/M model.
Integration into the company’s system environment
Besides amount of data and the processing performance there is another
unique feature claimed in connection with TD-ABC: the ability to receive data
from in existing Entity Resource Planning (ERP) systems. Kaplan (2004) states
that data collection for TD-ABC is simple and not cost intensive, since it can be
based on data from a company‟s ERP system where “data on order, packaging,
distribution method, and other characteristics” (Kaplan, 2004, p.6) is already
stored. Why this applies only to TD-ABC and not to ABC/M is not provided. As a
matter of fact, however, ABC/M can rely on the same type and amount of data
as TD-ABC; there is just no limitation on the driver-metrics. Literature provides
many cases where ABC/M was implemented using data from ERP systems.
Simply integrating a costing-model like ABC/M or TD-ABC into such an
environment may not be the optimal choice. Within the research field of
Management Accounting and Integrated Information Systems (IIS) the
relationship of ERP and ABC/M has been described and analysed. ERP
systems emerged in the 1990s, as they integrated different informational and
transactional system within companies and thus provided better support for
management accounting (Davenport, 1998). But besides ERP, as a transaction-
15
ABC/M software examples with specifications: http://www.infogoal.com/links.php?n=19
Page 52
5 Comparison between TD-ABC and ABC/M 51
oriented information system, other analysis-oriented information systems, such
as Hyperion for the Balanced Scorecard (BSC), have become present in the
range of information systems that support management accounting (Granlund
and Malmi, 2002). Granlund and Malmi (2002) and Malmi (2001) also reported
that management accounting techniques, such as ABC/M, are mostly not
implemented within ERP systems but maintained outside using spreadsheet
tools or specialised software. They argue that specialised software for ABC is
considered more user-friendly and flexible regarding analysis and reporting.
Also ERP systems are considered too complex to additionally incorporate
ABC/M. Chou and Tripuramallu (2005) find that ERP systems are limited in the
capability to integrate other systems. Other authors like Boot et al. (2000) and
Fahy and Lynch (1999) argue that both systems should not be integrated, since
management accounting tasks should remain decomposed. Especially the
transactional part that ERP systems most easily support and the analysis part
which supports strategic decision making should not be put together. Fahy and
Lynch (1999) wrote
“…while ERP systems improve the supply of transaction data for strategic
management accounting activities, they typically cause significant damage to existing
decision support capability of the firm” (Fahy & Lynch, 1999, p. 1).
We note that integration within or strong dependence from transactional
systems such as ERP in order to supply an ABC/M model, can shift focus away
from the analytical purpose of such a costing system.
But even if we consider a more sophisticated environment, such as Business
Intelligence (BI), receiving required data to process meaningful analysis in
ABC/M is not self-fulfilling. BI systems are automated and proactive
environments (McKnight, 2004) which “typically offer the ability to analyze
quantitative data and produce information that monitors business performance”
(Oleskow et al., 2007). They are able to provide ad hoc, forecasting, and
exceptional reports, as well as Online Analytical Processing (OLAP) pulling the
data from existing ERP systems. In contrast to ERP, BI facilitates the decision
support function, since it is originally designed to perform various analyses and
Page 53
5 Comparison between TD-ABC and ABC/M 52
deliver superior reporting. Recent surveys indicate that ABC/M is evolving as a
part of BI systems since both can be implemented simultaneously and jointly
(Oleskow et al., 2007).
Concerning our case study, the ABC/M model was supplied from different
heterogeneous systems which had no integration or interfaces with ABC/M. ETL
was required to load data from these systems. On the basis of standardised
data exports from existing transactional systems we implemented ETL steps.
Within the ETL steps the following features were provided:
Automated running to transform export data from transactional systems
into import tables for the ABC/M model
Log-files which confirmed that the transformation process was
successful, or that failures occurred at a certain step
Plausibility checks on the completeness and the consistency of the
received data exports
Since no integration within ERP or a BI system was desired by the Controlling
Department this solution gave a high perception on automation and integration
within the existing company environment. Changes in the product portfolio
which e.g. affected the structure of cost objects in the ABC/M model were also
caught and considered by the implemented queries. On the other hand the ETL
steps could be accessed and customized individually without interference with
operational systems. This is required when managers decide to undertake
changes concerning processes and activities. Accessing our user interface did
not require any programming knowledge, such as SQL, so that users could
execute the program once and then switch to the ABC/M model were the data
then might be loaded. Thus the focus lay on the work with the ABC/M model
where the analytical work was performed. In the end our approach was highly
accepted by the management, since we utilized data from existing systems
within a standardised and usability friendly environment.
Page 54
6 ABC/M in the frame of Performance Management 53
6 ABC/M in the frame of Performance Management
So far we have focussed on the capabilities of existing ABC/M in contrast to TD-
ABC. The idea behind both costing methods, ABC/M and TD-ABC, is to function
as enablers for decision making, for instance they can
highlight opportunities for cost reduction.
provide insights on product costs and customer profitability.
help to optimize business processes, logistics operations and the
utilization of capacity.
However as we have highlighted in the foregoing chapters, TD-ABC‟s
capabilities are too limited to provide the informational basis for decision
making. This is mainly due to its myopic focus on duration drivers, which may
lead to some insights on cost structure, but leaves out relevant information in
order to measure performance. We conclude that cost can be reflected within
time, but performance requires a broader – multi-metric - view on an
organization's processes.
The evolution of ABC/M shows that it has emerged from a product cost
calculation method (Kaplan, 1988) to an approach aimed to “manage cost at the
root” (Lebas, 1999, p.501) through the business-process and activity
perspective. To complement the multi-purpose character of ABC/M with a
further aspect, its outcomes shall be aligned to the corporate strategy. For that it
needs to function within the broader frame of PM. PM gives feedback about
“whether the strategic and operational plans are succeeding” (Kangw, 2006,
p.21), as for instance the Balanced Scorecard (Kaplan, 1992) does. In order to
apply PM based on ABC/M, managers need to decide why they want to
measure and what they want to measure, since there is no objective definition
on the performance of a company. It suffices to derive performance as the
future value retained from the definition of performance chosen by managers.
Managers have to deploy components of casual models that lead to “the timely
attainment of stated objectives within constraints specific to the firm and to the
situation time” (Lebas, 1995, p.29).
Page 55
6 ABC/M in the frame of Performance Management 54
From this definition of PM we extract that results delivered from an ABC/M
model are obtained according to stated objectives and need to be managed
actively within the firm‟s specific constraints. We point out what PM in
connection with ABC/M means by using an example: Consider the chicken
manufacturer example from above. As a result of the economic crisis, the top-
management has taken the strategic decision that cost for salaries should not
increase within the next five years. In order to not lose market share this
constraint should be handled more flexible within the marketing department.
They have therefore set thresholds for the marketing salaries:
Up to 70,000€ - “green zone”, this amount was spent in the past year.
Management should aim to not exceed this level.
Between 70,000€ and 100,000€ - “yellow zone”, only if the marketing
department needs to perform additional campaigns in order to keep the market
share these expenses are justified.
Above 100,000€ - “red zone”, this level of expenditure should not be reached,
since company-wide cost saving efforts would be contradicted and insolvency
becomes more likely. Even the biggest competitor cannot rely on a higher
budget for marketing salaries.
To better illustrate this example we present a view on the ABC/M software
MyABCM, where these constraints have been incorporated based on an
ABC/M-model.
Page 56
6 ABC/M in the frame of Performance Management 55
Figure 16. Dashboard view on a performance measure
This dashboard view has the advantage of giving the management an
immediate feedback on the actual cost expenditure in relation to the constraint.
In this example we record that marketing salaries are within the yellow zone,
with an amount of almost 77,000€ at the end of the year. This means that the
number needs to be justified according to the stated thresholds and constrains
from above. Managing “cost at the root” as Lebas (1999) has stated, should
therefore also be part of the ABC/M-PM concept which we are outlining here.
Managers need to be able to trace costs to the different activities and cost
objects in which they flew in. We turn back to our example and take a look on
the “Traceability View”, a feature provided by the software to trace stages of
cost allocations:
Page 57
6 ABC/M in the frame of Performance Management 56
Figure 17. Traceability view: consumption of costs
Here we can see where the manpower costs for Marketing have been
consumed. At this point, managers need to decide which accounts are of
interest to be traced back to a certain cost object and distribution area. The path
displayed here is “Institutional Marketing” for “Frozen Chicken” in different
regions. Reasonable paths of interest can be determined, for instance, by the
level of competition in a market for a certain product. If there is high competition
for Frozen Chicken, e.g. in Argentina, managers will probably consider the
consumed costs as justified and focus on other paths. This example shows how
an integrated approach of ABC/M and PM can be set up. We record that PM
benefits from increased insights on the root of costs through ABC/M. The
combination of both enables to align financial decisions and operations to the
strategy.
To conclude our findings on the framework of “Activity Based Performance
Management16” (ABPM) we outline the major building blocks in the following. At
the bottom lies the data basis, represented be by a transaction-oriented
(analytical) system, such as ERP (BI). This block mainly delivers data input for
16
We use ABPM for PM based on ABC/M
Page 58
6 ABC/M in the frame of Performance Management 57
resources and cost objects of an ABC/M model. The model performs the cost
allocation according to the defaults from PM and the implemented logic.
Furthermore, ABC/M represents the core of the framework, since the
information which drives the whole setup is generated here. In the layer above
we find the PM component which is aligned according to the strategy. Strategy
is considered as predefined; it is determined by various internal and external
factors, such as markets, competitors, suppliers and so on (we refer to Porter,
1980 & 1985). However, within PM it is the managers who decide what is
worthwhile to measure and for which reason (Lebas, 1995) and thus set the
frame in which ABC/M needs to perform. Furthermore, PM defines objectives
and ties them to constraints, which can be reflected through parameters. A
comparison of ABC/M measures and PM constraints outlines the starting points
for paths in which costs can be traced.
Figure 18. Activity Based Performance Management Framework
Once the cost-consuming roots are identified, action plans according to
strategic guidelines can be formulated and executed.
We finish this chapter by quoting a very precise characterisation of PM which
we find suits best the ABPM-framework we developed here:
Page 59
7 Conclusions 58
“PM integrates operational and financial information into a single decision-
support and planning framework” (Cockins, 2006, p.160).
7 Conclusions
We slip back into the role of our fictitious CFO from the Introduction of this
paper. He has to select the most appropriate activity- based costing method and
tie his choice into the frame of PM. At the beginning he notices the ABC-
paradox: in spite of its proven benefits, ABC/M has low diffusion rates. The
ABC-paradox is associated with contextual and behavioural factors, but
especially with problems in the concept of ABC/M. Concerning the contextual
and behavioural factors he knows he now has to ensure first that organizational
culture is accepting a new system which reveals performance. Through
employee motivation and senior management support he plans to prevent a
perceived threat and to respond to resistance. However he has to compare and
decide first: ABC/M or TD-ABC, which allegedly does not show any conceptual
problems.
After he conducts his research the most conspicuous finding in reference to the
literature is that at least a part of the academic world does not recognize
ABC/M in its state-of-the-art. For them it still exists in its conceived version
from the mid-80‟s (Cooper and Kaplan, 1988) and has not made any
improvements since that time. In contrast to what they perceive as ABC/M,
today‟s ABC/M does provide the following features:
Whether data on activities and driver rates are obtained first-hand through
employee-workshops, or manager interviews, they are combinable
alternatives. However, conducting interviews with employees is not less
accurate or more biased than interviewing managers, since there is no
empirical indication for such a statement.
Complex activities, product portfolios and cost functions are reflected within
the sophisticated driver-logics of an ABC/M model. Case distinctions
within calculated drivers reflect the cost-consumption of complex setups
without increasing the model‟s complexity.
Page 60
7 Conclusions 59
Cost consumption of heterogeneous processes is best depicted through
multi-metric drivers. For this case using a variety of driver rates is not only
self-evident but leads also to high accuracy.
Costs of excess capacity are incorporated when managers decide to put a
focus on this issue. They also decide how to allocate these costs in order or
to optimize capacity utilization and planning.
Spreadsheet tools should only be in charge for supporting tasks, since they
are prone to error; the ABC/M model shall be calculated using special
ABC/M software.
Data from existing transactional systems, such as ERP or analytical systems
like BI can be loaded into an ABC/M model. The process of extraction,
transformation and loading (ETL) of such data is not trivial, but can give a
perception of an integrated or automated solution. ABC/M does not
have to be merged with underlying ERP systems.
As a matter of fact, both TD-ABC and ABC/M cannot reveal excess capacity.
Also size and processing time of those models do not significantly differ.
Our CFO also finds that the use of TD-ABC is connected to shortcomings
caused by the myopic view on time to reflect business activities. There is
empirical indication that the extensive use of duration drivers, as they are
derived from time estimations in TD-ABC, leads to inaccuracy of a model.
However, our CFO finds case studies in literature where TD-ABC as well as the
ABC/M model benefited from data supplied by ERP or BI systems.
His choice is ABC/M, since TD-ABC is only appropriate for setups where simple
company models are to be implemented. Concerning TD-ABC, the resulting
models are characterised by:
the sufficient reflection of only homogeneous process and activities, due to
the limitation on duration drivers.
limited expressiveness, cost information which is only based on time cannot
serve to optimize processes based on other metrics.
low accuracy, due to error-prone time estimations.
Page 61
7 Conclusions 60
At the end of his research, the CFO reflects on his results. He asks himself
whether the ascertained misperception of today‟s ABC/M is another possible
factor contributing to the ABC-paradox, among the various factors which are
already known.
Eventually our CFO prepares for the next C-Level meeting where he has to
defend his favoured costing method. He presents ABC/M as an integrated
component of the new framework of PM. He outlines how interactions within this
framework take place through an exemplary use case. At the end, his
presentation reinforces how ABC/M supports to align financial and operational
decisions to his company‟s strategy.
As an outlook for future research, we would see the need to empirically connect
perceived features of ABC/M to the ABC-paradox. First, all features which exist
within state-of-the-art ABC/M need to be stated. The results of this paper can be
used as a basis to extract the standard features an ABC/M-model should
provide these days. Then surveys which match the perception of ABC/M at
firms to its existing features should be conducted. Questions whether
implementations have been abandoned or avoided because of a misperception
should be stated to complement such an empirical investigation. We can think
about how such a questionnaire might look like. Questions such as the following
should be included:
Do you think that ABC/M can model all the (complex) products, services
and customers which are related to your business?
Do you associate managing (excess) capacity with ABC/M?
Have you avoided/abandoned ABC/M implementations, because you
missed one or more of the stated features?
The results should portray an empirical picture showing, to what extent the
misperception of ABC/M contributed to the ABC-paradox.
Page 62
References 61
References
Ahrens & Chapman (2006). Doing Qualitative Field Research in Management
Accounting: Positioning Data to Contribute to Theory (2005). Available at
SSRN: http://ssrn.com/abstract=816985 (accessed 25 June 2010)
Argyris, C./Kaplan, R. S. (1994): Implementing new knowledge: the case of
activity-based costing, in: Accounting Horizons, Volume 8, 3/1994, S. 83-105.
Armitage, H. M. & Nicholson, N. (1993). Activity-based costing: a survey of
Canadian practice. Hamilton, OH: The Society of Management Accountants
of Canada. Management Accounting. Issues Paper No. 3, The Society of
Management Accountants of Canada, Hamilton, Ontario (1993)
Barrett, R. (2005). Time-Driven Costing: The bottom line on the new ABC.
Business Performance Management Magazine, p.35-39.Available at:
http://bpmmag.net/mag/timedriven_costing_bottom_line_0305 (accessed 20
July 2010).
Bras, Bert and Emblemsvåg, Jan (2001). Activity-Based Cost and
Environmental Management: A Different Approach to the ISO 14000
Compliance. ISBN: 978-0-7923-7247-9.
Cagwin, D. & Bouwman, M. J. (2002). The association between activity-based
costing and improvement in financial performance. Management Accounting
Research, 13, 1–39.
Cagwin, D. & Barker, K.J. (2006). Activity-based costing, total quality
management and business process reengineering: their separate and
concurrent association with improvement in financial performance. Academy
of Accounting and Financial Studies Journal / Jan, 2006 issue.
Cardinaels, E. and Labro, E. (2005). Measurement Error in Costing Systems:
Time Estimates as Cost Drivers. Working paper, London School of
Economics.
Cardinaels, E. and Labro, E. (2007). Management control: errors in costing
systems. Management Control Association 2007, nummer. 7.
Page 63
References 62
Carolfi (1996) I. ABM can improve quality and control costs. Cost and
Management;(May):12–6.
Chou D.C., Tripuramallu H.B. (2005), BI and ERP integration, Information
Management & Computer Security, vol.13, no.5, 2005, pp. 340-349.
Cleland, K. (2004). As easy as CBA?. Financial Management, 82(September),
28–32.
Cobb, J., Innes, J. & Mitchell, F. (1992). Activity-based costing: problems in
practice. London, UK: Chartered Institute of Management Accountants.
Cokins, Gary (2001). ACTIVITY-BASED COST MANAGEMENT -An Executive‟s
Guide. John Wiley & Sons. ISBN 047144328X.
Cockins, Gary. (2006) in “Case Studies in Performance Management: A Guide
from the Experts”, p.4, ISBN: 978-0-471-77659-8.
Cooper, Robin and Kaplan, Robert S. (1988). Measure Costs Right: Make the
Right Decisions (Use activity-based costing to guide corporate strategy.)
Davenport TH (1998). Putting the enterprise into the enterprise system. Harvard
Bus Rev 1998;76(4):121–31.
Demeere, Nathalie et al. (2009).Time-driven activity-based costing in an
outpatient clinic environment: Development, relevance and managerial
impact. Health Policy 92 (2009) p.296–304.
Everaert, Patricia et al. (2006). Cost modeling in logistics using time-driven
ABC- Experiences from a wholesaler. International Journal of Physical
Distribution & Logistics Management Vol. 38 No. 3, 2008, pp. 172-191.
Everaert, Patricia et al. (2008). Sanac Inc.: From ABC to time-driven ABC
(TDABC) – An instructional case. Journal of Accounting Education 26 p.118–
154.
Folan, Paul & Browne, Jim (2005). A review of performance measurement:
Towards performance management. Computers in Industry 56, p.663–680.
Page 64
References 63
Foster, G. & Swenson, D. (1997). Measuring the success of activity-based
costing management and its determinants. Journal of Management
Accounting Research, 9, 109–141.
Golfarelli, Matteo et al. (2003).Materialization of fragmented views in
multidimensionaldatabases. Data & Knowledge Engineering 49 (2004)
p.325–351.
Gosselin, Maurics (2007). A Review of Activity-Based Costing: Technique,
Implementation, and Consequences. Handbook of Management Accounting
Research p.641-671.
Granlund M, Malmi T. Moderate impact of ERPS on management accounting: a
lag or permanent outcome? Manage Account Res 2002;13(3):299–321.
Granof, Michael H. et al. (2000). Using Activity-Based Costing to Manage More
Effectively. Department of Accounting, College of Business Administration,
University of Texas at Austin, January 2000.
Heina, J. (1999), Variantenmanagement – Kosten-Nutzen-Bewertung zur
Optimierung der Variantenvielfalt, Wiesbaden 1999.
Hill, Alexander and Stewart, Ian (1999). Character Education in Business
Schools: Pedagogical Strategies. Teaching Business Ethics, 1999, Volume 3,
Number 2, Pages 179-193.
Hoepfl, Marie C (2007). Choosing Qualitative Research: A Primer for
Technology Education Researchers, Journal of Technology Education, Vol. 9
No. 1, Fall 1997.
ITU- International Telecommunication Union (2009). REGULATORY
ACCOUNTING GUIDE, Telecommunication Development Bureau, March
2009. Available at: http://www.itu.int/ITU-D/finance/Studies/
Regulatory_accounting_guide-final1.1.pdf (accessed 15 September 2010).
Page 65
References 64
Ittner C, Lanen W, Larcker D (2002). The association between activity-based
costing and manufacturing performance. Journal of Accounting Research
40:711–26.
Jones, T. C., & Dugdale, D. (2002). The ABC bandwagon and the juggernaut of
modernity. Accounting, Organizations and Society 27(1–2), 121–163.
Joreskog, K. G. and Sorbom, D., 1993. LISREL 8: Structural Equation Modeling
with the SIMPLIS Command Language, Chicago, IL, Scientific Software.
Kamath, M., Dalal, N., Kolarik, W., Lau, A., Sivaraman, E., Chaugule, A.,
Choudhury, S., Gupta, A., and Channahalli, R., (2002). “An Integrated
Framework For Process And Performance Modeling Of Next-Generation
Enterprise Systems: Design And Development Issues” Proc. of the University
Synergy Program (USP) Conf. Available at
http://citeseerx.ist.psu.edu/viewdoc/summary?doi=10.1.1.115.8033
(accessed 1 October 2010).
Kangw, Thomas M. (2006). “LUBEOIL: SHAPING BUSINESSTODAY AND IN
THE FUTURE” in Case Studies in Performance Management: A Guide from
the Experts. ISBN: 978-0-471-77659-8.
Kaplan, Robert and Norton, David (1992), “The Balanced Scorecard –
Measures That Drive Performance”. Harvard Business Review, Jan-Feb
1992.
Kaplan, Robert S. and Anderson, Steven R. (2003). Time Driven Activity Based
Costing, a Working Paper. Harvard Business Press.
Kaplan, Robert S. and Anderson, Steven R. (2004 & 2007). Time-Driven
Activity-Based Costing. Harvard Business Press.
Kennedy, T. and J. Affleck-Graves, 2001. The Impact of Activity-Based Costing
on Firm Performance. Journal of Management Accounting Research, Vol. 13:
19-45.
Page 66
References 65
KPMG Consulting Supporting the decision maker – A guide to the Value of
Business Modelling, London 1999.
Krefting, L. (1991). Rigor in qualitative research: The assessment of
trustworthiness. American Journal of Occupational Therapy, 45, 214-222.
Labro, Eva (2006). Analytics of costing system design in “Contemporary Issues
in Management Accounting”. Oxford University Press. Print ISBN
9780199283361.
Lackes, R. (1991), Die Kostenträgerrechnung unter Berücksichtigung der
Variantenvielfalt und der Forderung nach konstruktionsbegleitender
Kalkulation, in: Zeitschrift für Betriebswirtschaft, 61. Jg., 1991, H. 1, S. 87-
108.
Lebas, Michel (1995). Performance measurement and performance
management. Int. J. Production Economics 41, p.23-35.
Lebas, Michel (1999). Which ABC? Accounting Based on Causality Rather
Than Activity-Based Costing. European Management Journal Vol. 17, No. 5,
pp. 501-511, 1999.
Letts et al. (2007). Guidelines for Critical Review Form – Qualitative Studies.
Available at http://www.srs-srcmaster.ca/Portals/20/pdf/ebp/qualguidelines
_version2.0.pdf (accessed 10 July 2010).
Mayr, Philipp (2009). Google Scholar als akademische Suchmaschine.
Mitteilungen der Vereinigung Österreichischer Bibliothekarinnen &
Bibliothekare (VÖB) 62 (2009) Nr.2.
McKnight W. (2004), Rafting into the Business intelligence future part 1.
DMReview Magazine (Oct. 2004), pp.68-71.
Otley , D. (2003). Management control and performance management: whence
and whither? The British Accounting Review 35 (2003) 309–326.
Patton, M. Q. (1990). Qualitative Evaluation and Research Methods (2nd
edition). Newbury Park, CA: Sage Publications, Inc.
Page 67
References 66
Popesko, Boris (2009). How to calculate the costs of idle capacity in the
manufacturing industry. Global Business and Management Research: An
International Journal, ISSN:1947-5667.
Proctor, R. (2009). Managerial accounting for business decisions (3rd ed.).
London: Financial Times/Prentice Hall. ISBN:0273717553.
Rasmussen, N., Eichorn, C. J.(2000). Budgeting, New York 2000.
Seufert, Prof. Dr. Andreas et al. (2008). Unternehmensplanung und Wertbeitrag
von IT – eine zentrale Gestaltungsaufgabe für das Controlling. Controller-
Leitfaden – Dezember 2008.
Swenson, D., 1997. Best practices in activity-based management, Journal of
Cost Management, November/December, 6–14.
Vazakidis, Athanasios & Karagiannis, Ioannis (2009). Activity-based
management and traditional costing in tourist enterprises (a hotel
implementation model). Springer Verlag.
Vitz, P. (1990). The Use of Stories in Moral Development, American
Psychologist 45(6), 709–720.
Walker, Jill (2002). Links and power: the political economy of linking on the
Web. Conference on Hypertext and Hypermedia archive. College Park,
Maryland, USA. Pages: 72 – 73.
Wegmann, Grégory (2007), Developments Around the Activity-Based Costing
Method: A State-of-the Art Literature Review. Available at
http://ssrn.com/abstract=1012664 (accessed July 2010).
Wolfram, Dietmar (2003). Applications of SQL for Informetric Data Processing.
University of Wisconsin-Milwaukee, Milwaukee, WI, U.S.A. Available at
http://www.cais-acsi.ca/proceedings/2005/wolfram_2005.pdf (accessed 9
September 2010).
Page 68
Appendix 67
Appendix
LIST OF FIGURES
FIGURE 1. NUMBER OF ARTICLES ON ABM (1991-2004) ....................................... 11
FIGURE 2. NUMBER OF PUBLISHED ABC/M PAPERS ........................................... 12
FIGURE 3. NUMBER OF CITATIONS WITHIN ABC/M PAPERS ............................... 13
FIGURE 4. GS SEARCH FOR ABC/M ........................................................................ 13
FIGURE 5. GS RESULTS FOR TD-ABC .................................................................... 14
FIGURE 6. PRODUCT TYPES OFFERED BY THE LOGISTICS COMPANY ............. 18
FIGURE 7. ABC/M MODEL ........................................................................................ 22
FIGURE 8. TD-ABC .................................................................................................... 25
FIGURE 9. ABC VS TD-ABC ...................................................................................... 26
FIGURE 10. ALTERNATIVES ON HOW TO GATHER INFORMATION...................... 28
FIGURE 11. POTENTIAL ERRORS ........................................................................... 31
FIGURE 12. ASSIGNING CAPACITY USING TIME-STATUS MODES ...................... 34
FIGURE 13. IDLE CAPACITY COST ALLOCATION, SOFTWARE: MYABCM ........... 35
FIGURE 14. COMPLEXITY IN CONNECTION WITH ACTIVITY OR PRODUCT
VARIATIONS ...................................................................................................... 40
FIGURE 15. VISIBILITY OF ATTRIBUTES WITHIN ABC/M ....................................... 45
FIGURE 16. DASHBOARD VIEW ON A PERFORMANCE MEASURE ...................... 55
FIGURE 17. TRACEABILITY VIEW: CONSUMPTION OF COSTS ............................. 56
FIGURE 18. ACTIVITY BASED PERFORMANCE MANAGEMENT FRAMEWORK ... 57
Page 69
Appendix 68
LIST OF TABLES
TABLE 1. TD-ABC SUPPORTERS IN LITERATURE ................................................... 9
TABLE 2. SOURCES AND METHODOLOGY OF THIS PAPER ................................. 15
TABLE 3. EXEMPLARY RESOURCE DRIVER RATE CALCULATION ...................... 21
TABLE 4. COST HIERARCHIES IN ABC VERSUS TRADITIONAL COSTING ........... 23
TABLE 5. COST DRIVER TYPES IN THE ABC/M CASE STUDY .............................. 37
TABLE 6. EXEMPLARY ACTIVITY AND PRODUCT VARIATIONS ............................ 39
TABLE 7. ABC/M SOFTWARE WITH CALCULATED DRIVERS ................................ 41
TABLE 8. CALCULATED DRIVER EXAMPLE FROM THE CASE STUDY ................. 43
TABLE 9. STORAGE SPACE REQUIREMENTS FOR ABC/M FROM CASE STUDY 48
TABLE 10. USE CASES FOR SPREADSHEET SOFTWARE .................................... 49
Storage cost, an exemplary calculation
If we roughly estimate the space required for the mentioned 2.16 billion
database entries (using a few assumptions), we receive an amount of hard disk
space up to 286Gigabyte. Since data needs to be saved redundantly, we
assume 900Gigabyte of required space. In the year 2000 (Kaplan wrote his
paper in 2003) a one-time investment for an appropriate hard disk, which can
carry 900Gigabyte costs would be around 18,000$. This number needs to be
put in relation to the company size with 600,000 cost object and customers.
Storage costs estimation based on Kaplan‟s (2003) database example with 2,16
billion items, source: http://searchsqlserver.techtarget.com/tip/Determining-
SQL-Server-database-storage-requirements
300Gigabyte hard disk cost around 500$ in 2010, source
http://h18000.www1.hp.com/products/quickspecs/11531_div/11531_div.HTML.


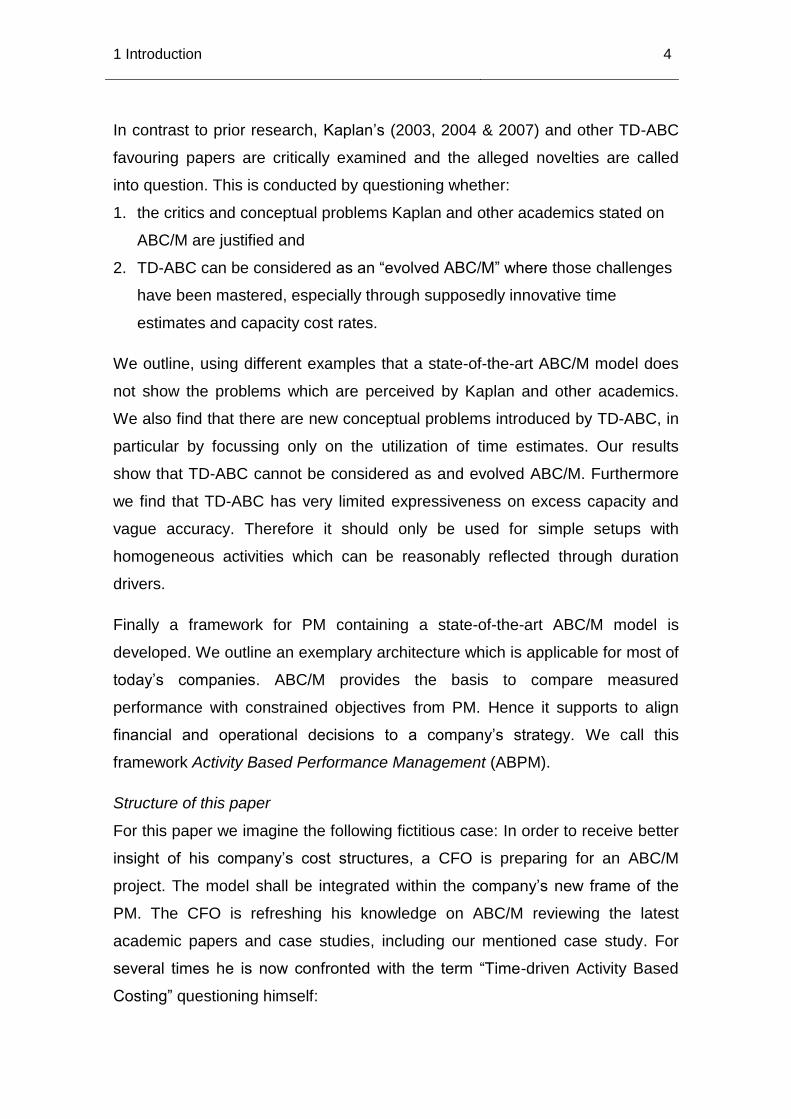

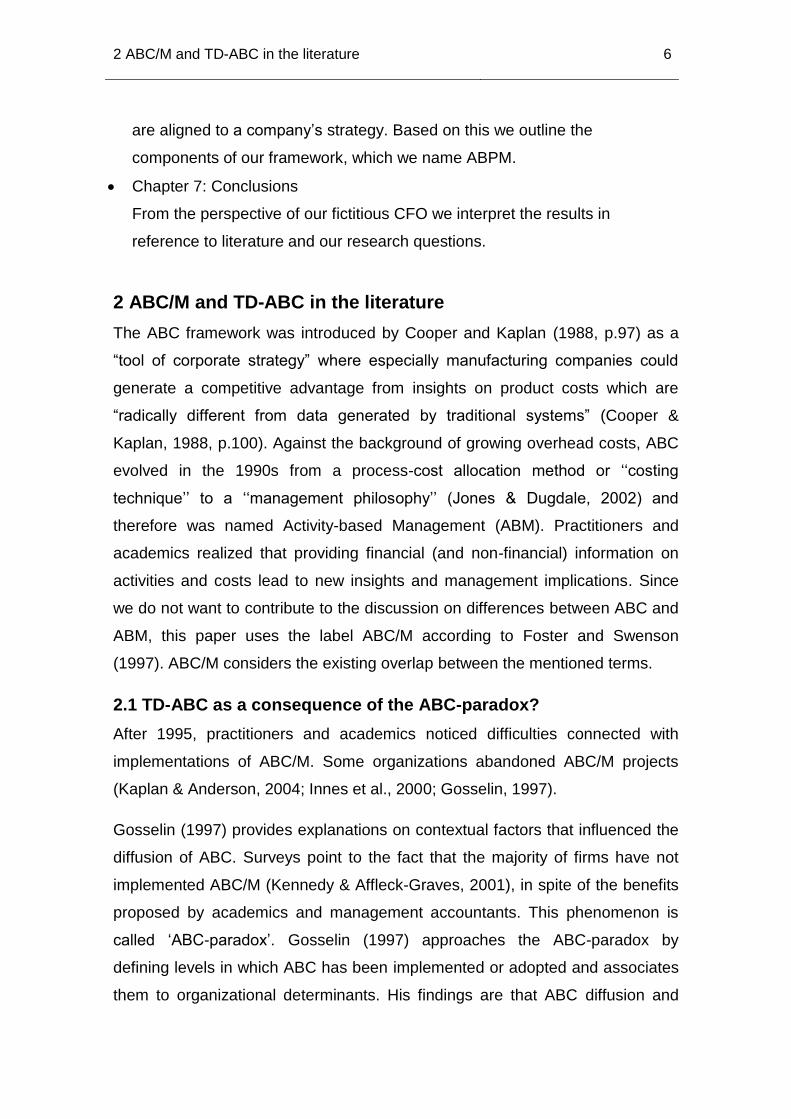


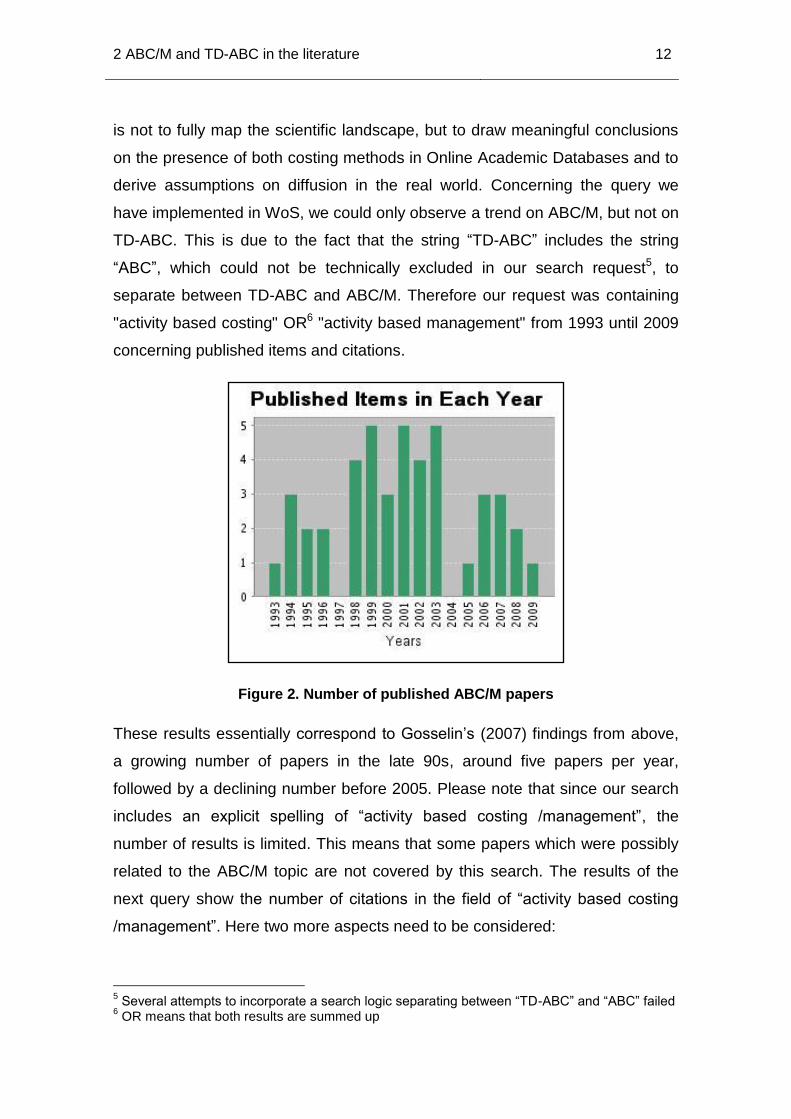


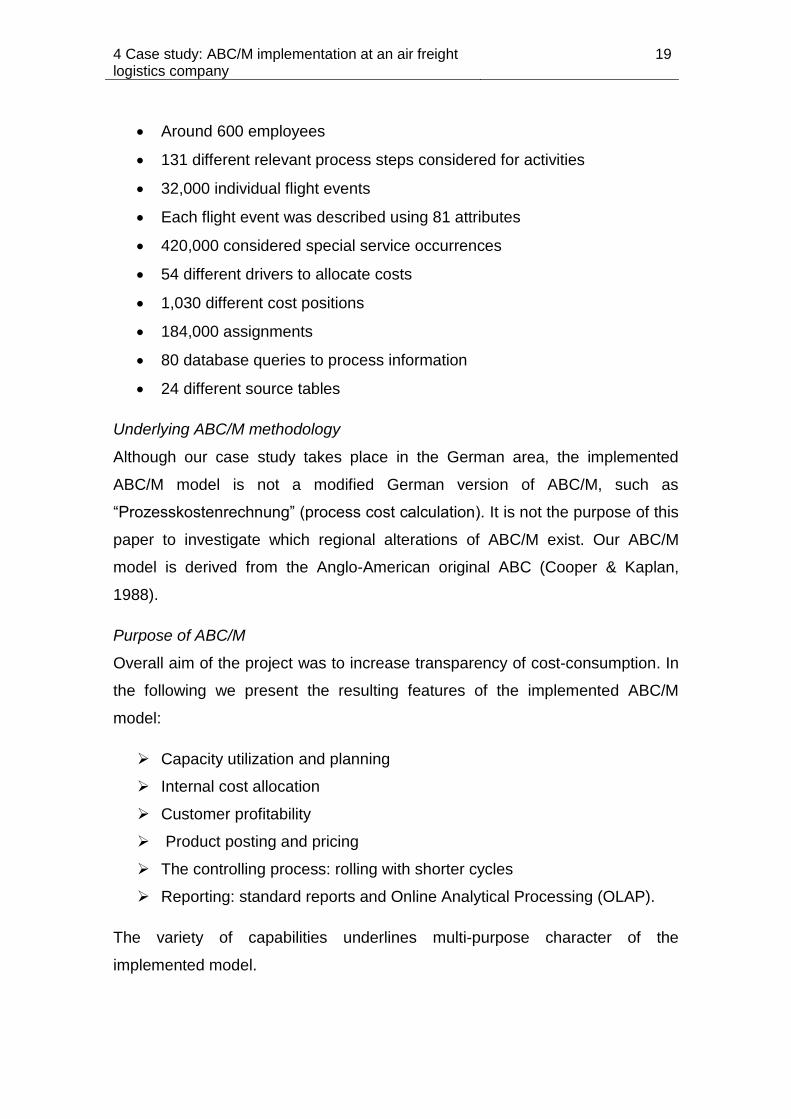


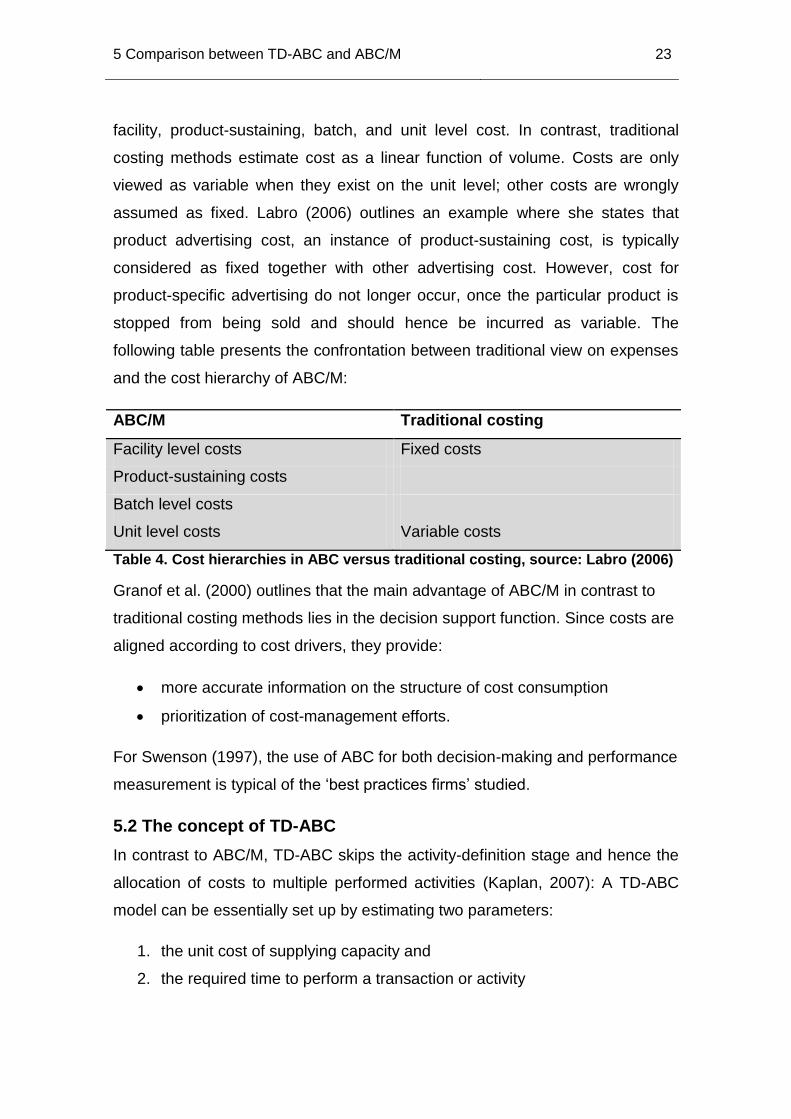


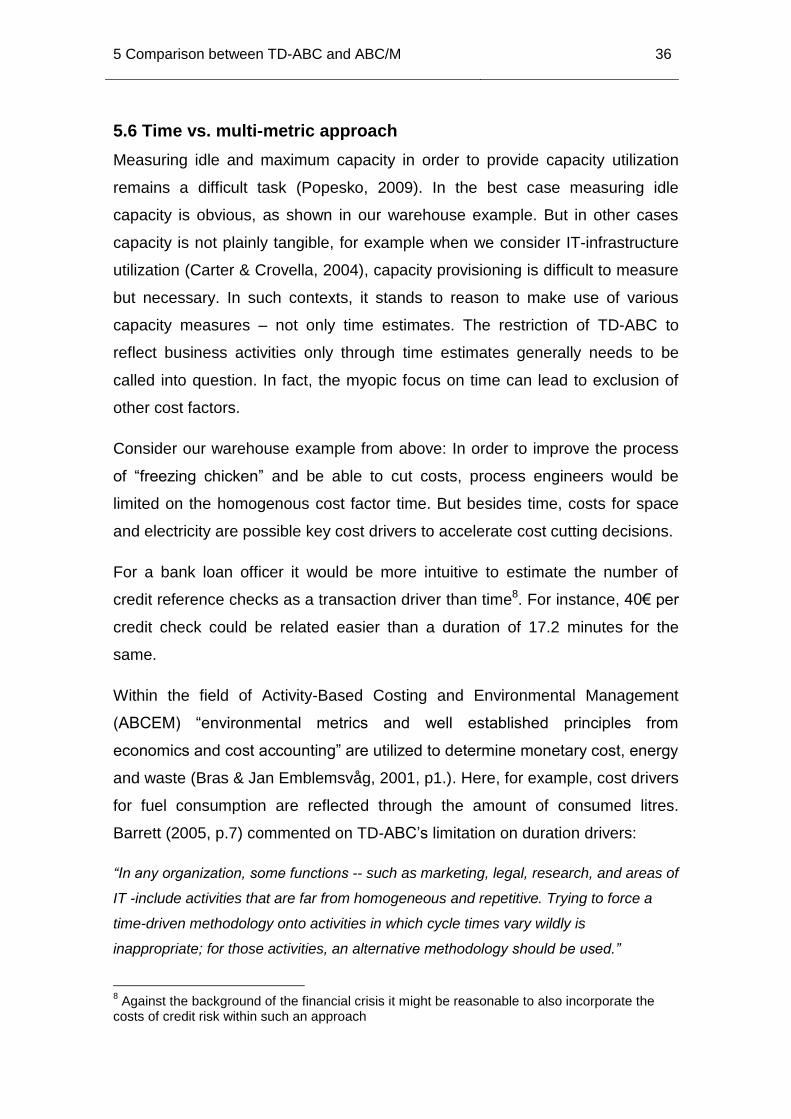


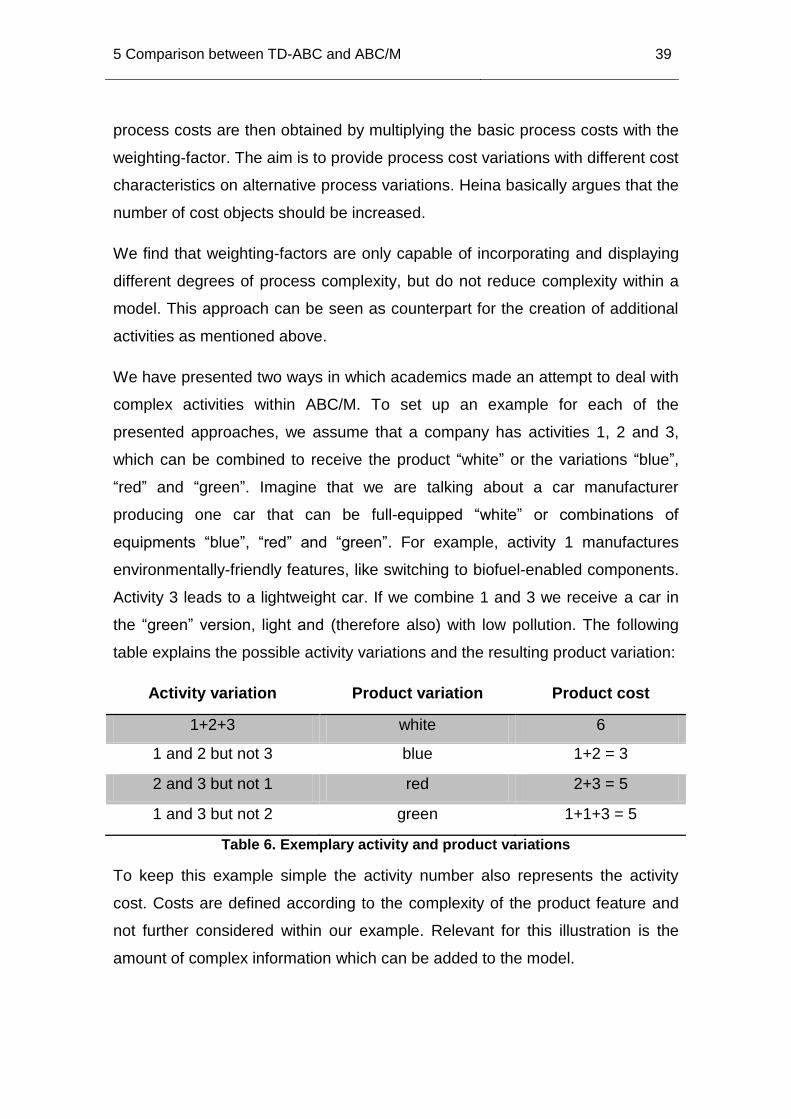

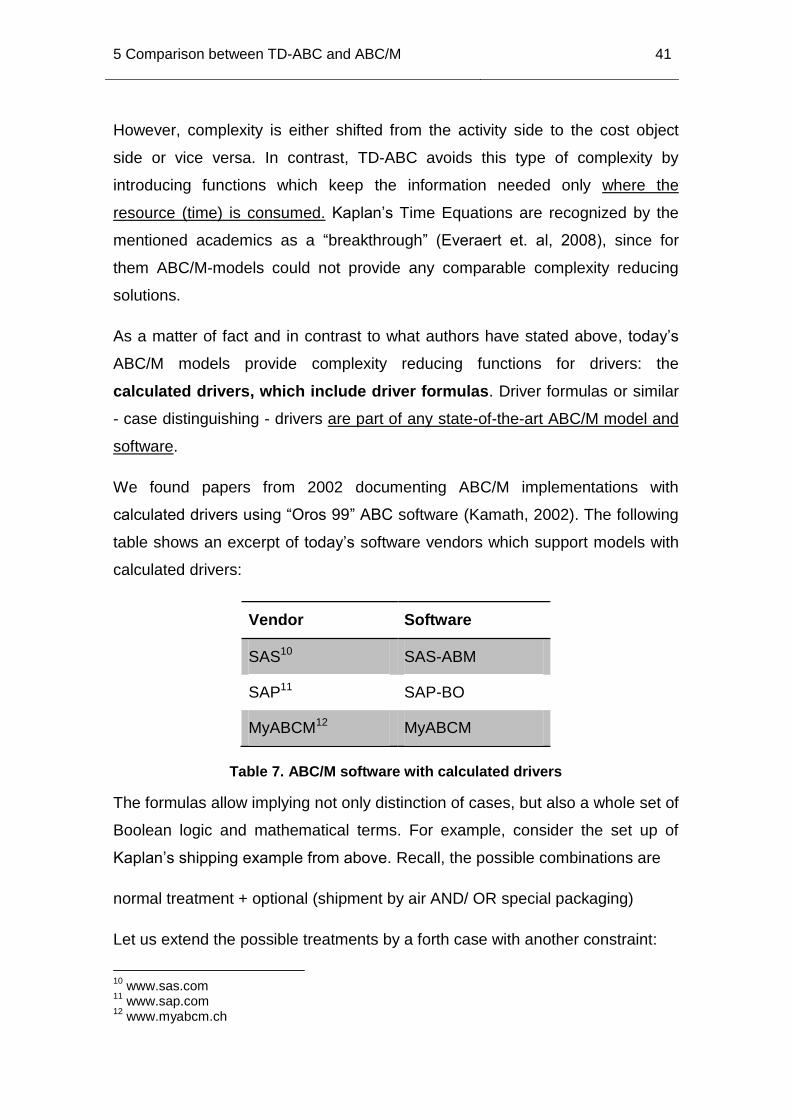


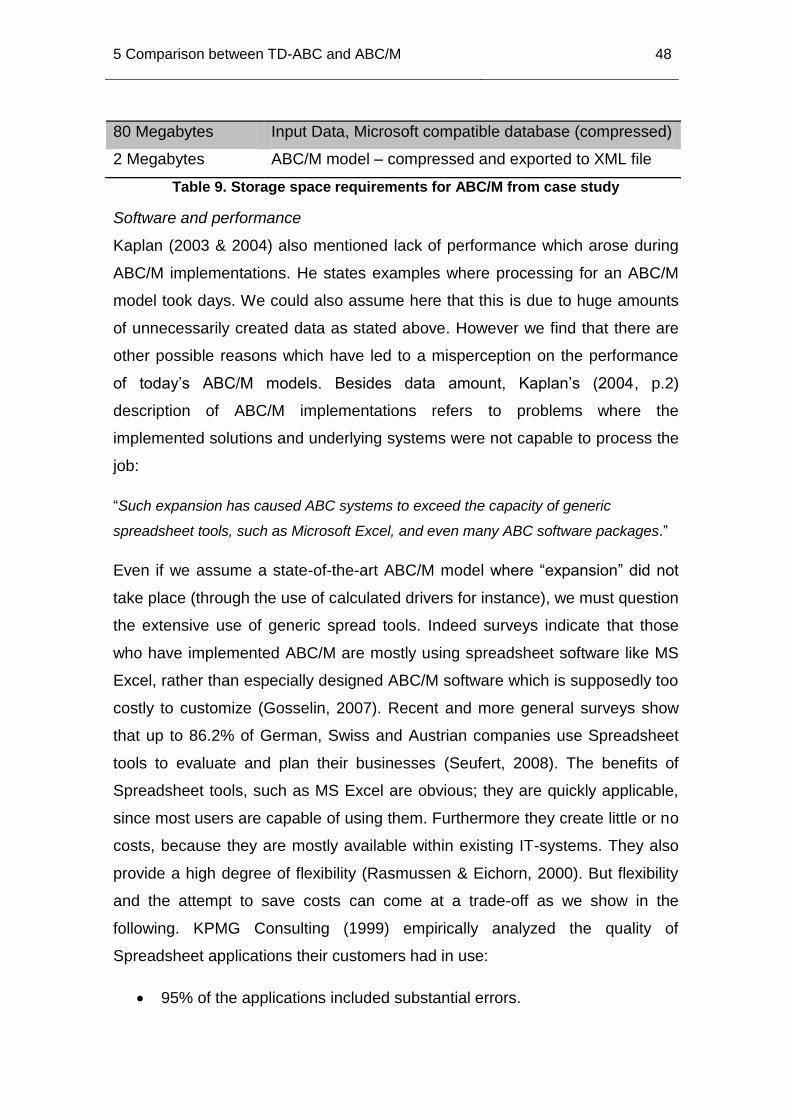


![[TITLE WITH CAPITAL LETTERS]pure.au.dk/portal/files/79630819/AW_Bacteria_and_protozoa_in_soil... · Protozoa ›Protista: unicellular eukaryotic organisms: protozoa, unicellular algae,](https://static.documents.pub/doc/80x56/606ca0b8d91e76743244800e/title-with-capital-letterspureaudkportalfiles79630819awbacteriaandprotozoainsoil.jpg)


